evoke deliver inspire collaborate sustain q1 2019 … · q1 2019. earnings presentation ....
TRANSCRIPT

EVOKEDELIVERINSPIRECOLLABORATESUSTAINEVOLVEDESIGNENHANCELEADINNOVATEPERFORMENVISIONACHIEVECREATETRANSFORMGROW
Q1 2019Earnings Presentation

Cautionary StatementThis presentation contains non-IFRS measures and forward-looking statements, including a discussion of our business targets, expectations, and outlook.
We caution readers not to place undue reliance on our forward-looking statements since a number of factors could cause actual future results to differ materially from the targets and expectations expressed.
For a discussion of risk factors and non-IFRS measures, see our Q1 2019 MD&A which is available on SEDAR, EDGAR, and stantec.com.

3
Gord JohnstonQ1 2019 Highlights
Theresa JangFinancial PerformanceRevised 2019 Annual Targets
Gord JohnstonOperational Highlights2019 Outlook
Agenda

4
ORGANIC NET REVENUE GROWTH
Q1 2019 OverviewGlobal
Business
8.1%
Wood & Grieve Engineering600 peopleAustralia
1
STRATEGIC ACQUIS ITION
Canadian Business
0.4%
United States Business
2.4%

5
Financial Performance

6
Adoption of IFRS 16
(millions of Canadian dollars)
Q1 19 as reported
Q1 19 excluding IFRS 16
Increase (decrease)
Impact on income statement items Administrative and marketing expenses 357.1 392.6 (35.5)
Depreciation of lease assets 27.4 - 27.4
Net interest expense 17.2 9.1 8.1
Net income 44.9 44.9 -
Impact on non - IFRS financial measures (1)
EBITDA 132.2 96.7 35.5
Adjusted EBITDA 127.1 91.6 35.5
(1) Non-IFRS measures are discussed in the Definitions section of our 2018 Annual Report and Q1 19 Management’s Discussion & Analysis.

7
Q1 19 Results
(millions of Canadian dollars, except per share amounts) Q1 2019 Q1 2018Gross revenue 1,151.5 1,021.3
Net revenue 904.1 808.8
EBITDA from continuing operations (1) 132.2 86.9
- Excluding IFRS 16 (1) 96.7 86.9
Net income from continuing operations 44.9 36.6
Net income 44.9 36.8
Basic and diluted earnings per share (EPS) from continuing operations 0.40 0.32
Dividends declared per common share 0.1450 0.1375
Continuing operations Adjusted EBITDA (1) 127.1 89.5
- Excluding IFRS 16 (1) 91.6 89.5
Adjusted net income (1) 50.3 47.9
Adjusted EPS – basic and diluted (1) 0.45 0.42 (1) EBITDA, adjusted EBITDA, adjusted net income, adjusted basic and diluted EPS, and measures excluding IFRS 16 are non-IFRS measures (discussed in the Definitions section of our 2018 Annual Report and the Q1 2019 Management’s Discussion & Analysis).
8
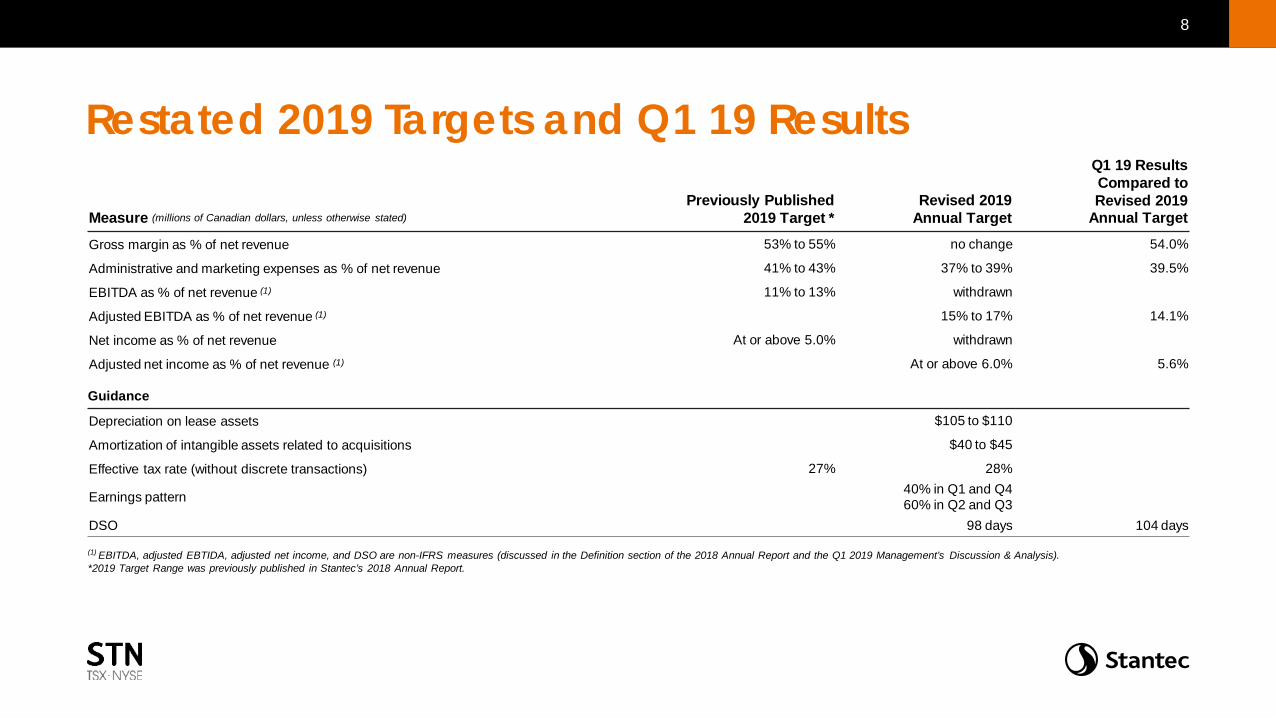
Restated 2019 Targets and Q1 19 Results
(1) EBITDA, adjusted EBTIDA, adjusted net income, and DSO are non-IFRS measures (discussed in the Definition section of the 2018 Annual Report and the Q1 2019 Management’s Discussion & Analysis).*2019 Target Range was previously published in Stantec’s 2018 Annual Report.
Measure (millions of Canadian dollars, unless otherwise stated)Previously Published
2019 Target *Revised 2019
Annual Target
Q1 19 Results Compared to Revised 2019
Annual TargetGross margin as % of net revenue 53% to 55% no change 54.0%
Administrative and marketing expenses as % of net revenue 41% to 43% 37% to 39% 39.5%
EBITDA as % of net revenue (1) 11% to 13% withdrawn
Adjusted EBITDA as % of net revenue (1) 15% to 17% 14.1%
Net income as % of net revenue At or above 5.0% withdrawn
Adjusted net income as % of net revenue (1) At or above 6.0% 5.6%
Guidance
Depreciation on lease assets $105 to $110
Amortization of intangible assets related to acquisitions $40 to $45
Effective tax rate (without discrete transactions) 27% 28%
Earnings pattern 40% in Q1 and Q460% in Q2 and Q3
DSO 98 days 104 days

9
Liquidity and Capital Resources
(millions of Canadian dollars)
Cash Flow Q1 19 Q1 19 Q1 18
Inflow (Outflow) as reported
excluding IFRS 16
Operating (88.5) (114.1) (73.0)
Investing (104.2) (99.4) (44.5)
Financing 68.2 89.0 129.5
Net effect (124.5) (124.5) 12.0 0
50
100
150
200
250
300
350
400
450
500
Sources Uses Sources Uses
Sources and Uses of Cash
Cash Credit facility Operations AcquisitionsCapital assets Dividends Share repurchases Other
Q1 19
Q1 19 TTM

10
Liquidity and Capital Resources
Net debt to Adjusted EBITDA (TTM) As reported excluding IFRS 16
Internal guideline 1.0x to 2.0x 1.5x to 2.5x
Q1 19 2.0x (1) 2.67x
(1) Net debt/adjusted EBITDA was calculated using a proforma IFRS 16 adjustment for Q2 18 to Q4 18 adjusted EBITDA, calculated as 3.8% of net revenue from the respective quarter.
Leverage at upper end of range due to:• March 1 WGE acquisition• Opportunistic share repurchases• Only one month of WGE EBITDA contribution
Expected to decrease over the course of the year

11
Operational Highlights
American Academy of Pediatrics HeadquartersItasca, Illinois

12
Canada
Q1 19
Net revenue growth
4.6%
Organic net revenue growth
0.4%
Trans-Canada Highway/Bowfort Road InterchangeCalgary, Alberta
Active in public transit across the country
Won significant master service agreement in Environmental Services
Hiring in Energy & Resources and Environmental Services
millions (C$)
$230$240$250$260$270$280$290$300$310$320
Q1 18 Q1 19
Gross Revenue
Net Revenue

13
$0$100$200$300$400$500$600$700
Q1 18 Q1 19
Gross Revenue
Net Revenue
Solid backlog in Water, Transportation, Bridges
Organic growth in Buildings
Won significant Power projects
Crescent Dunes Solar Energy Facility – Phase I ESATonopah, Nevada
millions (C$)
United States
Q1 19
Net revenue growth
8.6%
Organic net revenue growth
2.4%

14
Canada HouseLondon, England
Global
Organic growth in all business operating units
Growth in Australia and New Zealand Water
Continuing market improvements in Latin American Mining
millions (C$)
$0
$50
$100
$150
$200
$250
Q1 18 Q1 19
Gross Revenue
Net Revenue
Q1 19
Net revenue growth
41.0%
Organic net revenue growth
8.1%

15
$4.4 billion gross revenue backlog
Recent project wins • Conceptual design and project management services for phase 3 of the
Narragansett Bay Commission’s Combined Sewer Overflow Control Facilities program in Rhode Island.
• Reappointed to the Homes England Multidisciplinary Framework to support the delivery of affordable housing to meet government targets.
• Technical consulting and cost services for Toronto’s $1.7-billion Rail Deck Park, which will transfer 21 acres of unused air space above the rail corridor into one of the largest structure-topped parks in the world.
• Architectural and engineering services for the design and construction of a new K-12 public school in Loudoun County, Virginia.
• Program manager for approximately 25 community enhancement and signal synchronization projects as part of the City of Baton Rouge’s MovEBR Infrastructure Enhancement and Traffic Mitigation Plan.
United States Canada Global

16
Acquisition Strategy

17
Canada United States GlobalSlowing economic growth because of volatile oil prices and rising interest rates
Slowdown in housing due to higher interest rates and tighter mortgage restrictions
Expand our global footprint and benefit from healthy GDP growth
Less volatility in commodity prices that impact our Mining and Environmental Services
Expect Brexit to create uncertainty in the United Kingdom and Europe
Overall Solid consumer spending and business investment
Interest rates to remain flat
Continued strong employment
Uncertainty due to the ongoing trade dispute between the United States and China
Organic gross revenue growth in the low- to mid-single digits
Long-term target of 15% net revenue CAGR
Strong backlog and client relationships
2019 Outlook

18
Colorado Rockies ExperienceDenver, Colorado

19
Aquatron Genome AtlanticHalifax, Nova Scotia
20
Sustainability ReportNow available on Stantec.com

21
Investor DayEdmonton, ABJune 12, 2019

22
AppendixGross Revenue by Reportable Segment
(In millions of Canadian dollars, except percentages)
Quarter Ended Mar
31, 2019
Quarter Ended Mar
31, 2018Total
ChangeChange Due to
Acquisitions
ChangeDue to
ForeignExchange
Change Dueto Organic
Growth
% of Organic
GrowthCanada 307.9 302.8 5.1 12.5 n/a (7.4) (2.4%)United States 636.3 569.6 66.7 5.4 29.0 32.3 5.7%Global 207.3 148.9 58.4 41.9 (2.7) 19.2 12.9%Total 1,151.5 1,021.3 130.2 59.8 26.3 44.1 Percentage growth 12.7% 5.9% 2.5% 4.3%n/a = not applicable
Net Revenue by Reportable Segment
(In millions of Canadian dollars, except percentages)
Quarter Ended Mar
31, 2019
Quarter Ended Mar 31,
2018Total
ChangeChange Due to
Acquisitions
ChangeDue to
ForeignExchange
Change Dueto Organic
Growth
% of Organic
GrowthCanada 270.9 258.9 12.0 10.9 n/a 1.1 0.4%United States 477.4 439.4 38.0 4.9 22.5 10.6 2.4%Global 155.8 110.5 45.3 37.6 (1.2) 8.9 8.1%Total 904.1 808.8 95.3 53.4 21.3 20.6 Percentage growth 11.8% 6.6% 2.7% 2.5%n/a = not applicable
Gross Revenue by Business Operating Unit
(In millions of Canadian dollars, except percentages)
Quarter Ended Mar 31,
2019
Quarter Ended Mar 31,
2018Total
ChangeChange Due to
Acquisitions
ChangeDue to
ForeignExchange
Change Dueto Organic
Growth(Retraction)
% of Organic
Growth(Retraction)
Buildings 261.0 235.8 25.2 13.1 7.5 4.6 2.0%Energy & Resources 152.5 132.9 19.6 12.6 1.5 5.5 4.1%Environmental Services 171.8 156.6 15.2 9.3 3.3 2.6 1.7%Infrastructure 324.0 271.4 52.6 23.0 9.4 20.2 7.4%Water 242.2 224.6 17.6 1.8 4.6 11.2 5.0%Total 1,151.5 1,021.3 130.2 59.8 26.3 44.1 Percentage growth 12.7% 5.9% 2.5% 4.3%n/a = not applicable
Net Revenue by Business Operating Unit
(In millions of Canadian dollars, except percentages)
Quarter Ended Mar 31,
2019
Quarter Ended Mar 31,
2018Total
ChangeChange Due to
Acquisitions
ChangeDue to
ForeignExchange
Change Dueto Organic
Growth
% of Organic
GrowthBuildings 203.9 183.9 20.0 11.7 5.7 2.6 1.4%Energy & Resources 131.7 116.9 14.8 11.2 1.7 1.9 1.6%Environmental Services 129.7 110.5 19.2 7.7 2.8 8.7 7.9%Infrastructure 254.5 217.4 37.1 21.2 7.2 8.7 4.0%Water 184.3 180.1 4.2 1.6 3.9 (1.3) (0.7%)Total 904.1 808.8 95.3 53.4 21.3 20.6 Percentage growth 11.8% 6.6% 2.7% 2.5%n/a = not applicable

23
AppendixConsolidated Statement of Cash Flows Indirect Method (Unaudited)
(In millions of Canadian dollars)Q1 19
$CASH FLOWS FROM (USED IN) OPERATING ACTIVITIES FROM CONTINUING OPERATIONSNet income for the year from continuing operations 44.9Add (deduct) items not affecting cash:
Depreciation of property and equipment 13.7Depreciation of lease assets 27.4Amortization of intangible assets 15.4Deferred income taxes 17.8Loss on sale of property and equipment 0.2Unrealized gain on equity securities (5.1)Share-based compensation 4.3Provision for self-insured liabilities and claims 7.0Other non-cash items 2.8
128.4Trade and other receivables 21.3Unbilled receivables (63.7)Contract assets (2.0)Prepaid expenses (7.5)Income taxes recoverable (10.4)Trade and other payables (148.9)Deferred revenue (5.7)
(216.9)Cash flows used in operating activities from continuing operations (88.5)

24
Appendix Reconciliation of Non-IFRS Financial MeasuresQuarter Ended
March 31 As reported
(In millions of Canadian dollars, except per share amounts) 2019 2018Net income from continuing operations 44.9 36.6 Add back:Income taxes 13.6 13.6 Net interest expense 17.2 5.3 Depreciation and amortization 56.5 31.4 EBITDA from continuing operations 132.2 86.9 Add back (deduct) pre-tax:Unrealized (gain) loss on investments held for self-insured liabilities (5.1) 2.6 Adjusted EBITDA from continuing operations 127.1 89.5
Quarter EndedMarch 31
(In millions of Canadian dollars, except per share amounts) 2019 2018Net income from continuing operations 44.9 36.6 Add back (deduct) after tax:Amortization of intangible assets related to acquisitions(1) 7.0 9.4 Unrealized (gain) loss on investments held for self-insured liabilities(2) (3.7) 1.9 Transition tax(3) 2.1 -Adjusted net income from continuing operations 50.3 47.9 Weighted average number of shares outstanding - basic 111,805,946 114,064,729 Weighted average number of shares outstanding - diluted 111,805,946 114,306,834 Adjusted earnings per share from continuing operationsAdjusted earnings per share - basic 0.45 0.42 Adjusted earnings per share - diluted 0.45 0.42 See the Definitions section of Stantec's 2018 Annual Report and Q1 19 Management's Discussion and Analysis for a discussion of non-IFRS measures used. Construction Services operations are presented as discontinued operations. This table has been updated to include only continuing operation results.(1) The add back of intangible amortization relates only to the amortization from intangible assets acquired through acquisitions and excludes the amortization of software purchased by Stantec. For the quarter ended March 31, 2019, this amount is net of tax of $2.7 (2018 - $3.5).(2) For the quarter ended March 31, 2019, this amount is net of tax of $1.4 (2018 - $0.7 recovery).(3) Refer to Income Taxes section of the Q1 19 Management's Discussion and Analysis for further details.

25
AppendixImpact on Statement of Financial Position at January 1, 2019
(In millions of Canadian dollars)IFRS 16
$
Before IFRS 16
$
Increase (decrease)
$Current assetsTrade and other receivables 828.1 878.1 (50.0)Prepaid expenses 43.9 56.8 (12.9)Other assets 24.3 23.2 1.1 Non-current assetsLease assets 561.8 - 561.8 Intangible assets 242.0 247.7 (5.7)Other assets 178.2 175.5 2.7 Total increase in assets 497.0 Current liabilities Trade and other payables 566.9 567.2 (0.3)Lease liabilities 44.8 - 44.8 Provisions 41.7 42.4 (0.7)Other liabilities 5.0 23.2 (18.2)Non-current liabilitiesLease liabilities 600.2 - 600.2 Provisions 86.6 78.2 8.4 Deferred tax liabilities 45.6 54.3 (8.7)Other liabilities 45.9 140.4 (94.5)Shareholders' equityRetained earnings 817.2 851.2 (34.0)Total increase in liabilities and equity 497.0
Impact on Statement of Cash Flows –Continuing Operations Quarter ended March 31
(In millions of Canadian dollars)
2019 as reported
$
2019 before IFRS
16$
Increase (decrease)
$Cash flows used in operating activities (88.5) (114.1) 25.6 Cash paid to suppliers (515.0) (548.7) 33.7 Interest paid (17.9) (9.8) (8.1)Cash flows from investing activities (104.2) (99.4) (4.8)Proceeds from leasehold inducements - 4.8 (4.8)Cash flows from financing activities 68.2 89.0 (20.8)Payments of lease obligations (25.6) - (25.6)Proceeds from leasehold inducements 4.8 - 4.8