expanding, low-cost, zimbabwean gold producer december 2015
TRANSCRIPT
www.caledoniamining.com
Expanding, Low-Cost, Zimbabwean Gold Producer
December 2015
Disclaimer
This presentation does not constitute, or form part of, any offer to sell or issue or any solicitation of any offer to purchase or subscribe for, any shares in Caledonia Mining Corporation (“Caledonia”), nor shall it (or any part of it) or the fact of its distribution, form the basis of, or be relied on in connection with, or act as an inducement to enter into any contract or agreement thereto.
Certain forward-looking statements may be contained in the presentation which include, without limitation, expectations regarding metal prices, estimates of production, operating expenditure, capital expenditure and projections regarding the completion of capital projects as well as the financial position of the Company. Although Caledonia believes that the expectations reflected in such forward-looking statements are reasonable, no assurance can be given that such expectations will prove to be accurate. Accordingly, results could differ from those projected as a result of, among other factors, changes in economic and market conditions, changes in the regulatory environment and other business and operational risks.
Accordingly, neither Caledonia, nor any of its directors, officers, employees, advisers, associated persons or subsidiary undertakings shall be liable for any direct, indirect or consequential loss or damage suffered by any person as a result of relying upon this presentation or any future communications in connection with this presentation and any such liabilities are expressly disclaimed.
2

Caledonia Mining
Overview
• 49% owned - fully indigenised
• 2014 production 41,771oz
• Low-cost: 2014 cash-cost $652/oz; AISC $969/oz
• $70m, internally-funded investment 2015-2021 to increase production to 80k oz
Blanket Gold Mine,
Zimbabwe
• 1.5 cents Canadian per share per quarter
• 7.7% yield at share price of 78 Canadian centsDividend Paying
Caledonia Group• Robust cash position: C$22.4m at September 30, 2015
• Low PE Ratio; High dividend yield
Low-cost and growing production underpins increasing profit and cash generation 3

Valuation Parameters
High Yield; Low PE Ratio
• Low rating is due largely to negative perceptions about Zimbabwe
• Blanket is fully indigenised and has significant, fully-funded growth plans
• Investor concerns about Zimbabwe are over-done!
4
Sources: Company Information; S&P Capital IQ

Blanket Mine
Competitive Operational Performance
• Caledonia compares well to other African gold
producers in terms of costs
• As Caledonia implements its growth strategy,
Caledonia’s operational and financial performance
should improve significantly
– 2016 target AISC: below US$900/oz
– 2018 target AISC: below US$750/oz
5

Zimbabwe
Investor Concerns
• Political continuity: ZANU-PF in power since 1980
• New government is pragmatic and pro-business
• No civil disorder; established, functional government administration
• 51% of all businesses must be owned by Zimbabweans
• Caledonia implemented indigenisation in 2012
• IZ shareholders include community (10%) and workers (10%)
• Hyper-inflation up to 2009 destroyed the economy
• Zim dollar abolished in 2009: functional currency is US$
• Mild deflation
• Manageable exchange controls: no interruptions to remittances (dividends,
management fee and South Africa procurement margin)
Political Stability
Indigenisation
Inflation
Exchange Controls
Infrastructure
• Adequate, reliable power (ytd outage at Blanket: 111 hours)
• Functioning roads, airports – efficient supply from Johannesburg
• Effective “soft” infrastructure: education, labour, administration
6

Capital Structure, Financials
7
Capital Structure
Shares in issue (m) 52.1
Options (m) 2.7
Cash (30 Sept 2015) C$22.4m
Overdraft (30 Sept 2015) C$2.8m
Net Assets (30 Sept 2015) C$67.4m
Summary Profit and Loss (C$’m except per share data)
Year
2014
H1
2015
Revenues 59.1 31.0
EBITDA 16.2 6.4
Profit after Tax 6.6 2.6
EPS - basic 9.3 3.4
EPS - adjusted 12.1 5.2
Shareholders %
Management 0.9
Allan Gray (South African Institution) 13.5
USA (mainly retail) 42.4
Canada (mainly retail) 32.2
Other 11.0
Listing and Trading
Share price C$0.78
Market capitalisation (C$’m) C$40.6m
52 week low/high (C$) 0.6-1.17

Resources
8
Mineral Resources at August 2014 (at $1,250 gold)
Tonnes
(000’s)
Grade (g/t) Gold
(k.oz)
Measured & Indicated
Resources
4,051 3.82 498
Inferred Resources 3,345 5.11 -
Total Reserves and
Resources
7,397 -
• Only material above pay-grade is added to inventory
– historically a high resource to reserve conversion has been achieved
• Deep level exploration from underground drilling and exploration
– Slower but more accurate drilling
– Monthly drilling rate has doubled in 2015 due to increased focus on exploration and resource development
• May 2015: resource upgrade 491,000 tonnes moved from inferred to Indicated Resource
– Increased gold in indicated resource by 20%
1. Tonnes are in situ
2. All figures are in metric tonnes
3. Mineral Resources include Mineral Reserves
4. Mineral Resources are stated at cut-off grade
of 1.96g/t
5. No geological losses were applied to the
tonnage
6. Tonnage and grade have been rounded and
this may result in minor adding discrepancies
7. The tonnages are stated at a relative density
of 2.86t/m3
8. Conversion from kg to oz: 1:32.15076
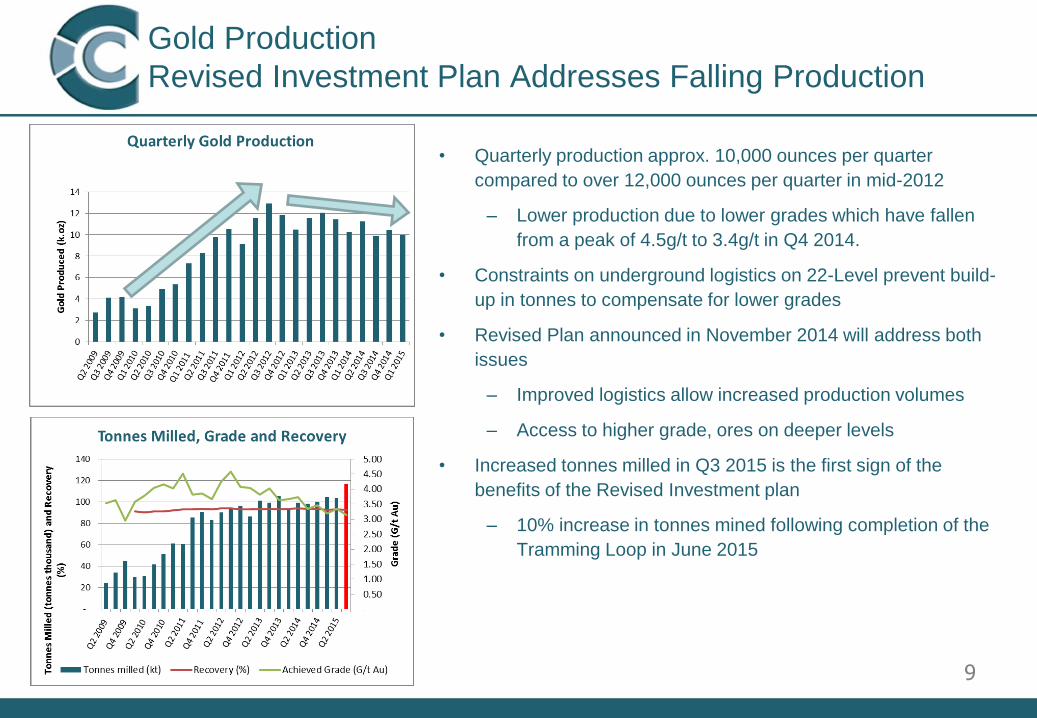
Gold Production
Revised Investment Plan Addresses Falling Production
• Quarterly production approx. 10,000 ounces per quarter
compared to over 12,000 ounces per quarter in mid-2012
– Lower production due to lower grades which have fallen
from a peak of 4.5g/t to 3.4g/t in Q4 2014.
• Constraints on underground logistics on 22-Level prevent build-
up in tonnes to compensate for lower grades
• Revised Plan announced in November 2014 will address both
issues
– Improved logistics allow increased production volumes
– Access to higher grade, ores on deeper levels
• Increased tonnes milled in Q3 2015 is the first sign of the
benefits of the Revised Investment plan
– 10% increase in tonnes mined following completion of the
Tramming Loop in June 2015
9

The Revised Investment Plan
Improved Logistics; Accelerate Access to Deeper Resources
10
• A new Tramming Loop on 22 Level (750m below surface) increases
tramming capacity (ore and waste) from 400tpd to 1,000tpd
• Modest cost ($0.8m approx) completed ahead of schedule in June 2015
• Completed loop allows 10% increase in mine production in Q3 2015
Increase Underground
Material Handling
• Capital cost $23m
• Commence Aug 2015; complete and equipped in June 2018
• 6m diameter; 4-compartment; 3,000tpd; men, material, equipment
• Access horizontal development: 2 directions on 2 levels sub-750m
• Improves efficiency and de-risks current single-shaft status
New Central Shaft
Surface to 1,080m
Continue No. 6 Winze
630m to 870m
• Rapid access to Blanket zone below 750m
• Production starts Q1 2016; ramp-up to 500tpd by mid-2017
• Resume sinking from 870m after completion of Central Shaft
Major impact on production, costs and flexibility
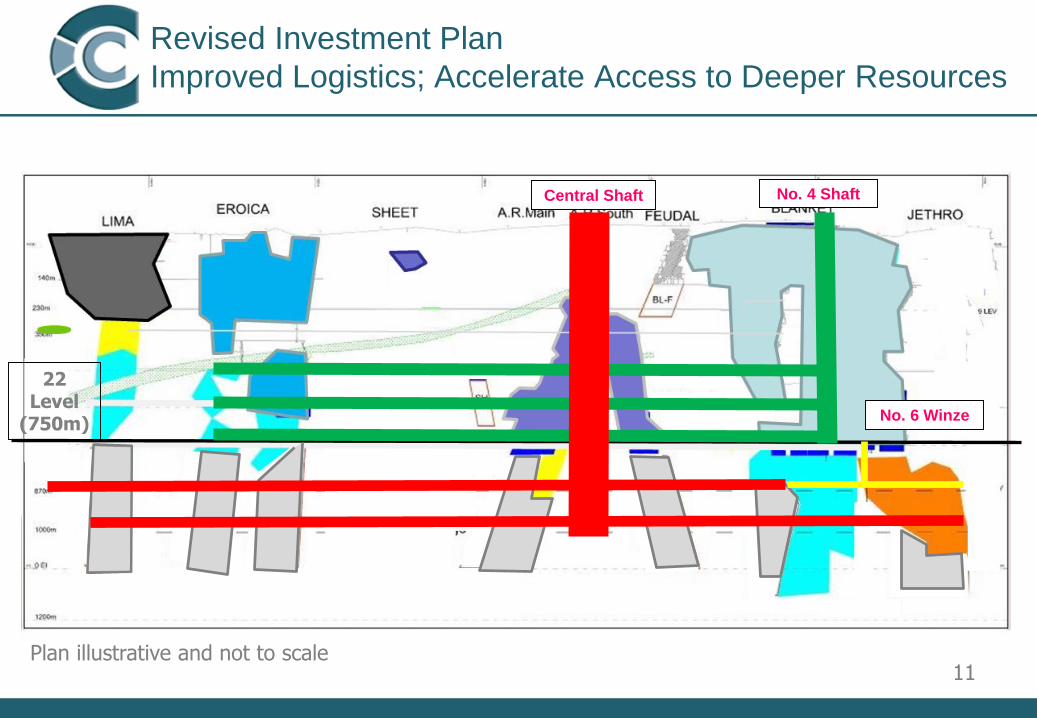
22 Level
(750m)
No. 4 Shaft
No. 6 Winze
Central Shaft
Revised Investment Plan
Improved Logistics; Accelerate Access to Deeper Resources
11Plan illustrative and not to scale

Revised Investment Plan
Projected Production
12
• Projected production in terms of the revised Life of Mine Plan is set out below
• Revised Life of Mine Plan has been independently reviewed and confirmed by Minxcon, Johannesburg.
• Projections exclude any production from the satellite exploration properties

Revised Investment Plan
Capital Expenditure and Funding
13
• US$65m of capital investment 2015 to 2021
• Local debt funding increased from $2.5m to
$5m
• Blanket dividends suspended: cash redeployed
into investment
• At $1,200/oz all capex funded by internal cash
generation
• At the current lower gold price, Blanket requires
additional funding of $5m, in addition to its local
borrowing facilities
• Caledonia will provide funding support from its
treasury
– Cash at Sept 30, 2015 - C$22.4m
• Caledonia intends to maintain its own dividend
–Caledonia’s cash will reduce in 2015, stabilise in 2016 and start to grow from 2017

• Implementation parameters (e.g. daily sinking rate) based on achieved rates
at other Blanket projects
• Allowance built in for slippage
• Highly experienced management team with experience of similar projects
• 97% of the capex is generated by cash flows from mining existing higher-
confidence resources
• Caledonia retains the financial capacity to provide support if required
• Use of highly-skilled, in-house labour instead of contractors reduces costs and
increases control
• Availability of high-quality, low-cost, refurbished equipment from South Africa
• Favourable rock dynamics: no need for shaft lining
Not a “Stretch” plan
Fully Funded
Low-cost, high return
Mature environment
• Access to existing on-site experience and skills
• Management with long-standing experience of the geology and operating
environment
• Established and highly efficient supply network
14
Revised Investment Plan
Low-Risk Growth

Revised Investment Plan
Increasing Production and Falling Costs Boost Profit
15
• Strong growth in profit and cash flows
─ increasing production, falling average costs of production, reduced G&A
• Robust value proposition: opportunity for rapid share price appreciation:
– Increasing profit
– Increasing cash flows due to higher profit and cash flows from repayment of facilitation loans
– Potential for rapid re-rating of Zimbabwe
Caledonia - Forecast Profit and Cash Flow 2015-2017
2014 2015 2016 2017 CAGR
Act. F'cast F'cast F'cast %
Production (k.oz) 41.7 42.0 49.5 64.0 15%
Gold price (US$) 1,245 1,164 1,224 1,368
PBT (C$'m) 13.2 8.4 17.9 44.3 50%
EPS (Canadian cents)* 12.1 13.3 24.9 54.2 65%
Operating Cash flow (C$'m) 13.7 12.3 21.5 46.1 50%
* normalised
Source: Edison Research, August, 2015

Dividend Policy
Committed to Shareholder Returns
• November 2013 Caledonia announced a new
dividend policy:
– 2014 dividend of 6 Canadian cents
– payable quarterly @1.5 cents/quarter
• Total 2015 dividend cost: C$3.1m
– 8x covered by cash resources
• Caledonia’s Board remains committed to the
maintaining the dividend
Increased cash generation from 2017 onwards creates the opportunity for higher
dividends and/or new, high return investments 16

Milestones to unlocking value proposition
17
Completion of tramming loop: mid-2015
Completion of vertical Central shaft early 2018
Commence production from Central Shaft: mid-2018
Production commences at No 6 Winze: Q1 2016
Concentrating on focused optimal extraction and lower costs

Contacts
18
Caledonia Mining
Website: www.caledoniamining.com
Share Codes: TSX - CAL; OTCQX – CALVF;
AIM - CMCL
Mark Learmonth
Tel: +27 11 447 2499
Email: [email protected]
PR (UK): BlytheWeigh
Tim Blythe, Camilla Horsfell
AIM Broker/Nomad: WH Ireland
Research: Edison Investment Research
www.edisoninvestmentresearch.co.uk/research
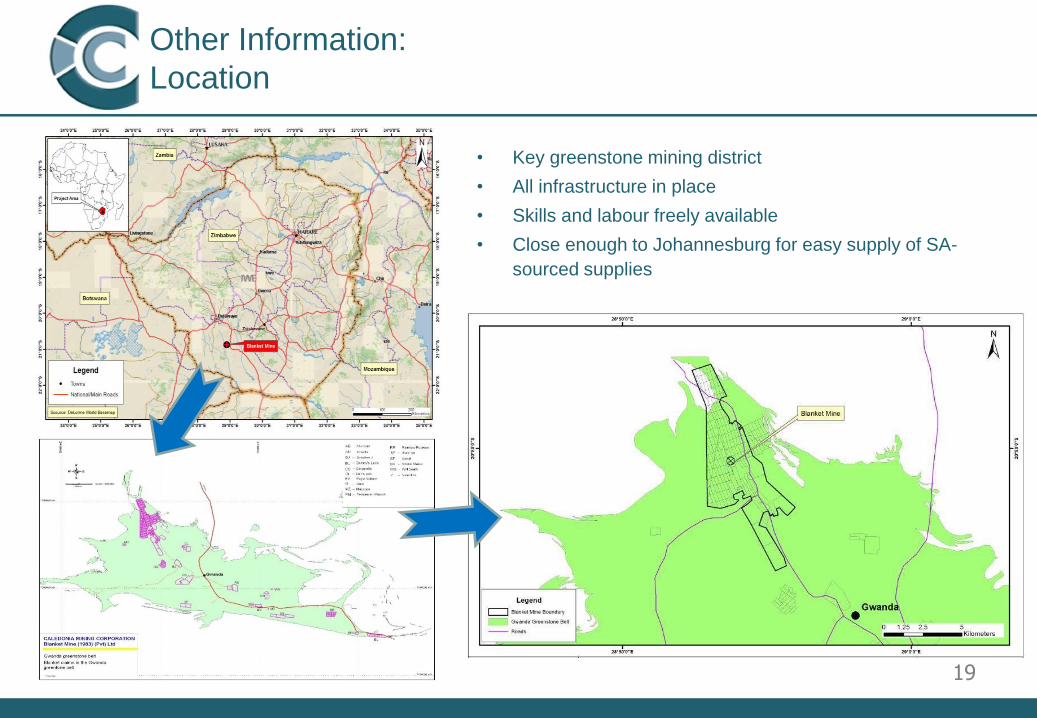
Other Information:
Location
19
• Key greenstone mining district
• All infrastructure in place
• Skills and labour freely available
• Close enough to Johannesburg for easy supply of SA-
sourced supplies
Blanket Gold Mine, Zimbabwe
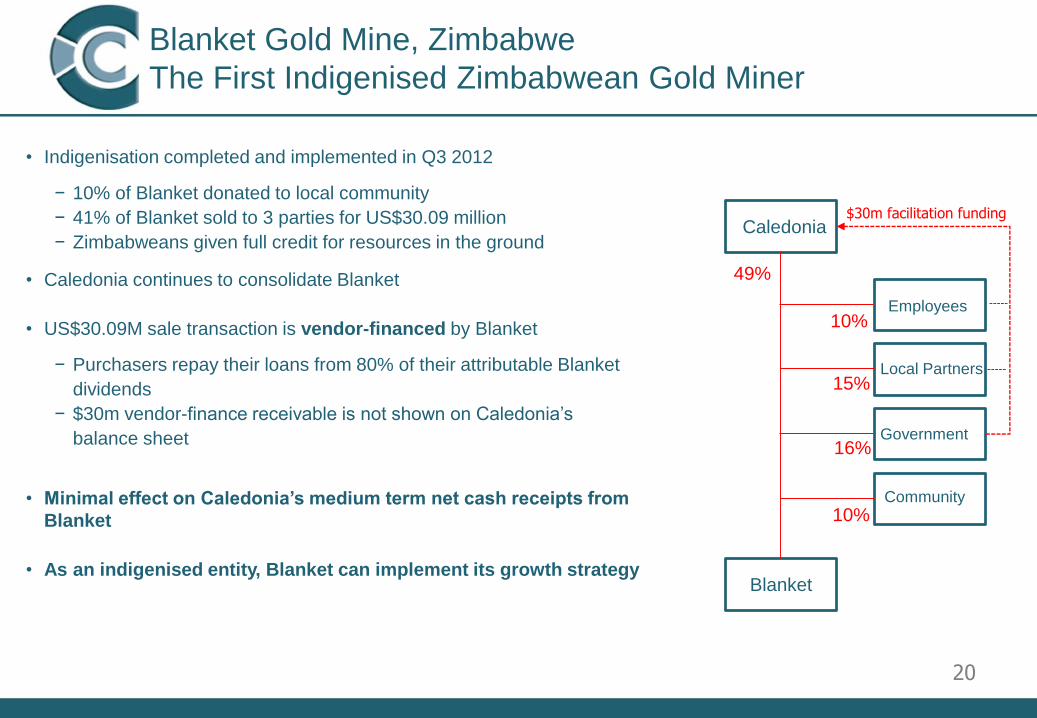
The First Indigenised Zimbabwean Gold Miner
20
• Indigenisation completed and implemented in Q3 2012
− 10% of Blanket donated to local community
− 41% of Blanket sold to 3 parties for US$30.09 million
− Zimbabweans given full credit for resources in the ground
• Caledonia continues to consolidate Blanket
• US$30.09M sale transaction is vendor-financed by Blanket
− Purchasers repay their loans from 80% of their attributable Blanket
dividends
− $30m vendor-finance receivable is not shown on Caledonia’s
balance sheet
• Minimal effect on Caledonia’s medium term net cash receipts from
Blanket
• As an indigenised entity, Blanket can implement its growth strategy
Caledonia
Blanket
Employees
Local Partners
Government
Community
49%
10%
15%
16%
10%
$30m facilitation funding

Other Information
Directors and Management
• Management based South Africa, except Mr
Mangezi who lives at Blanket Mine
• Strong in-country support in Zimbabwe from
Blanket’s Indigenous Shareholders, including Mr.
Nick Ncube, Blanket’s chairman
21
Management
Chief Executive Steve Curtis
Chief Finance Officer Mark Learmonth
Chief Operating Officer Dana Roets
VP Exploration Dr Trevor Pearton
Blanket Mine Manager Caxton Mangezi
Directors
Chairman Leigh Wilson (USA)
CEO Steve Curtis (S Africa)
CFO Mark Learmonth (S Africa
Independent Director Johan Holtzhausen (S Africa)
Independent Director Jim Johnstone (Canada)
Non Executive Director Richard Patricio (Canada)
Independent Director John Kelly (USA)
• Independent directors bring additional technical, legal,
financial and commercial expertise
• Re-structure of Caledonia’s management and board
improves transparency and effectiveness