facscanto ii standard operation protocol basic operationmed.hku.hk/corefac/downloads/facscantoii...
TRANSCRIPT
Faculty Core Facility, Li Ka Shing Faculty of Medicine
BD FACSCanto II Operation Manual
1
FACSCanto II Standard Operation Protocol
Basic Operation
1. Make sure the following steps are done before running your samples.
a. Waste tank is empty and refill the bottom layer of waste tank with bleach.
b. There is enough amount of sheath fluid to perform machine start up and
sample acquisition.
2. Launching the BD FACSDiva Software
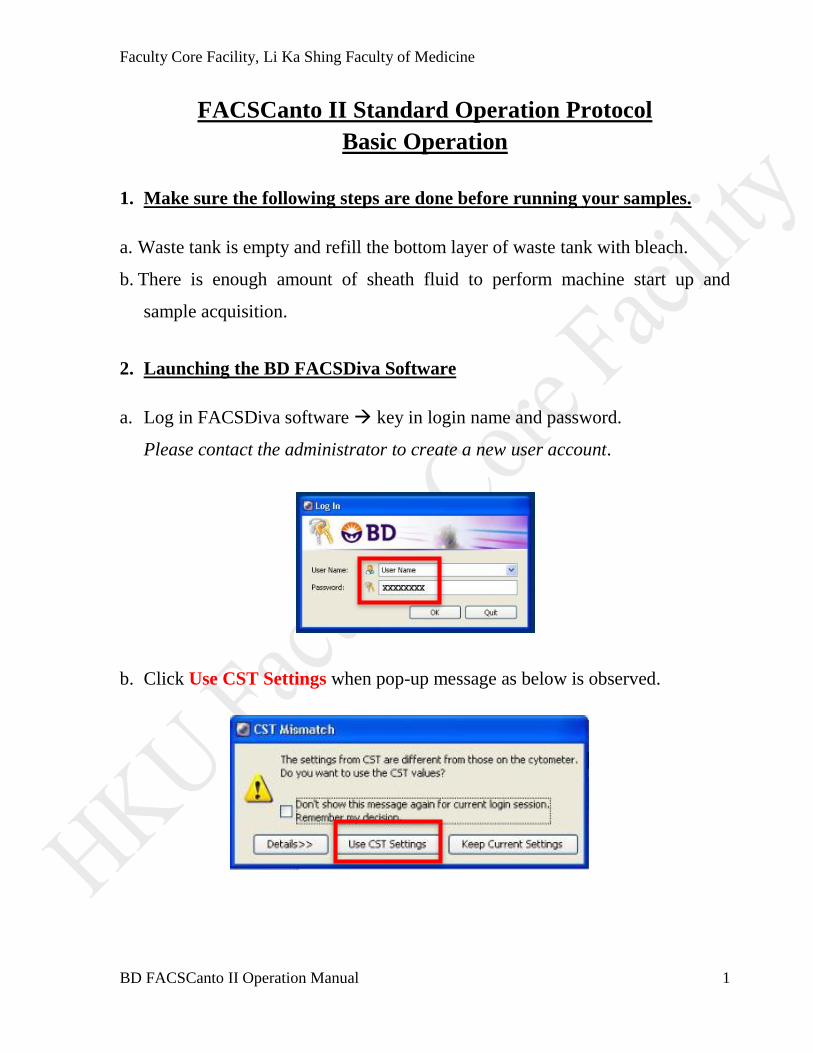
a. Log in FACSDiva software key in login name and password.
Please contact the administrator to create a new user account.
b. Click Use CST Settings when pop-up message as below is observed.
Faculty Core Facility, Li Ka Shing Faculty of Medicine
BD FACSCanto II Operation Manual
2
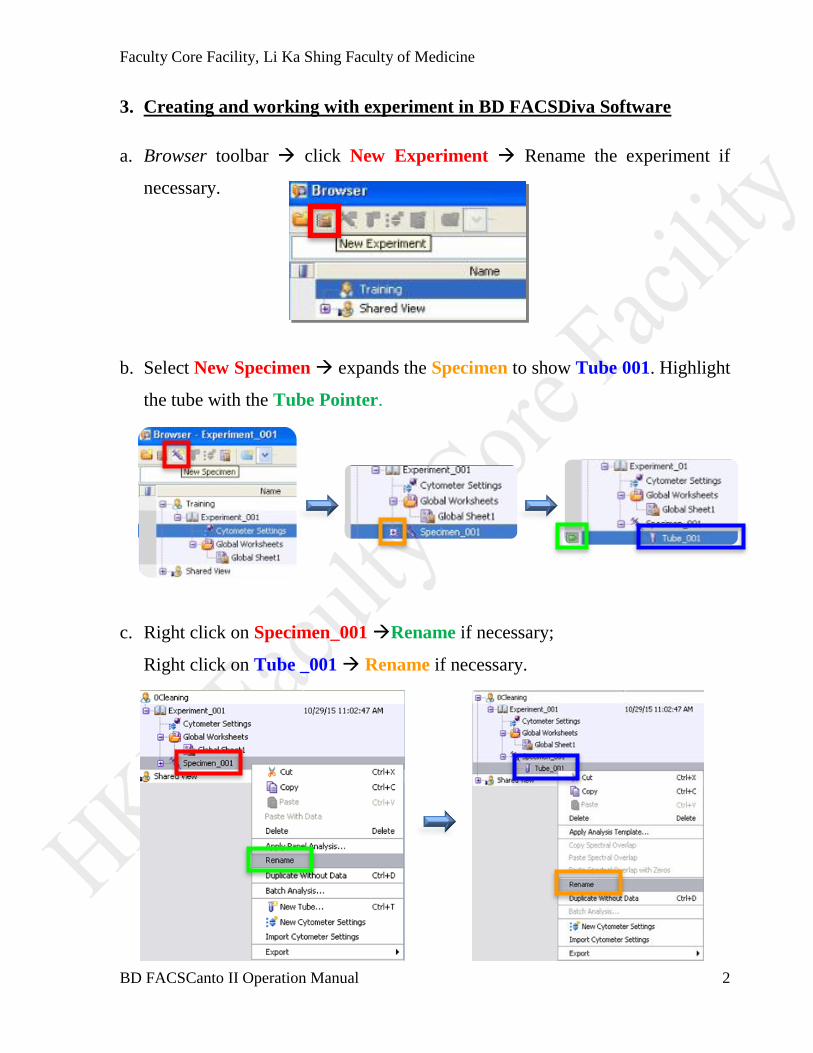
3. Creating and working with experiment in BD FACSDiva Software
a. Browser toolbar click New Experiment Rename the experiment if
necessary.
b. Select New Specimen expands the Specimen to show Tube 001. Highlight
the tube with the Tube Pointer.
c. Right click on Specimen_001 Rename if necessary;
Right click on Tube _001 Rename if necessary.
Faculty Core Facility, Li Ka Shing Faculty of Medicine
BD FACSCanto II Operation Manual
3
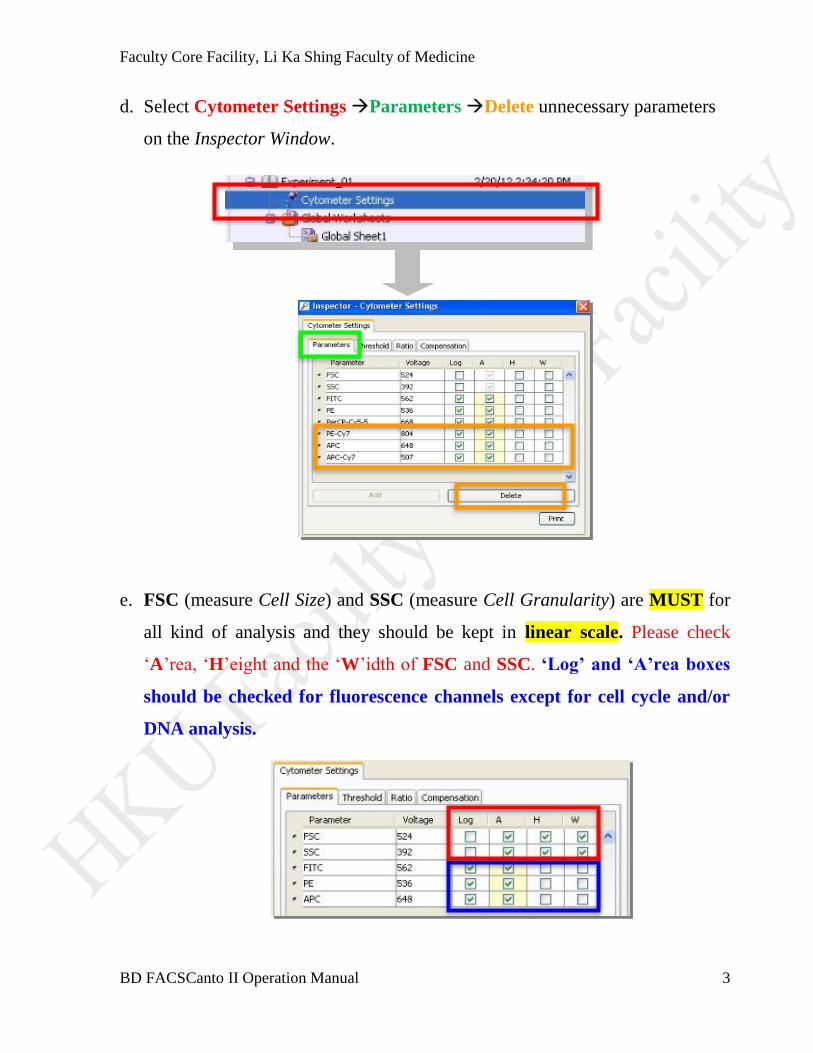
d. Select Cytometer Settings Parameters Delete unnecessary parameters
on the Inspector Window.
e. FSC (measure Cell Size) and SSC (measure Cell Granularity) are MUST for
all kind of analysis and they should be kept in linear scale. Please check
‘A’rea, ‘H’eight and the ‘W’idth of FSC and SSC. ‘Log’ and ‘A’rea boxes
should be checked for fluorescence channels except for cell cycle and/or
DNA analysis.
Faculty Core Facility, Li Ka Shing Faculty of Medicine
BD FACSCanto II Operation Manual
4
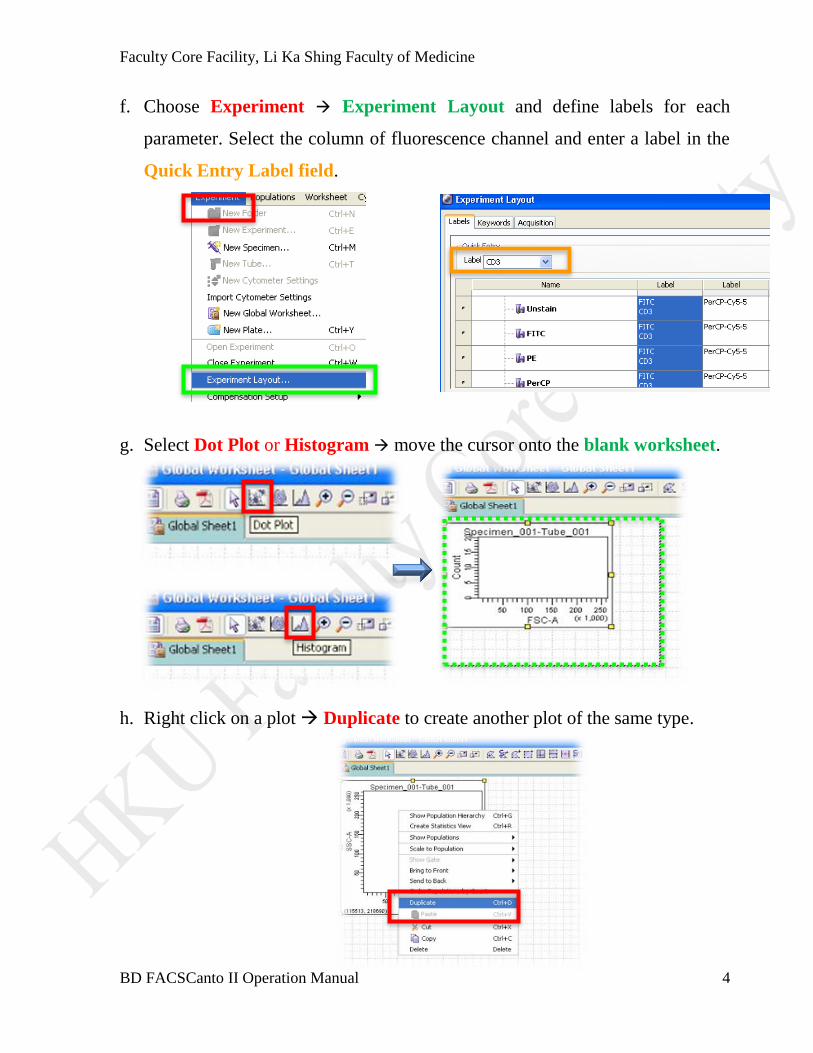
f. Choose Experiment Experiment Layout and define labels for each
parameter. Select the column of fluorescence channel and enter a label in the
Quick Entry Label field.
g. Select Dot Plot or Histogram move the cursor onto the blank worksheet.
h. Right click on a plot Duplicate to create another plot of the same type.
Faculty Core Facility, Li Ka Shing Faculty of Medicine
BD FACSCanto II Operation Manual
5
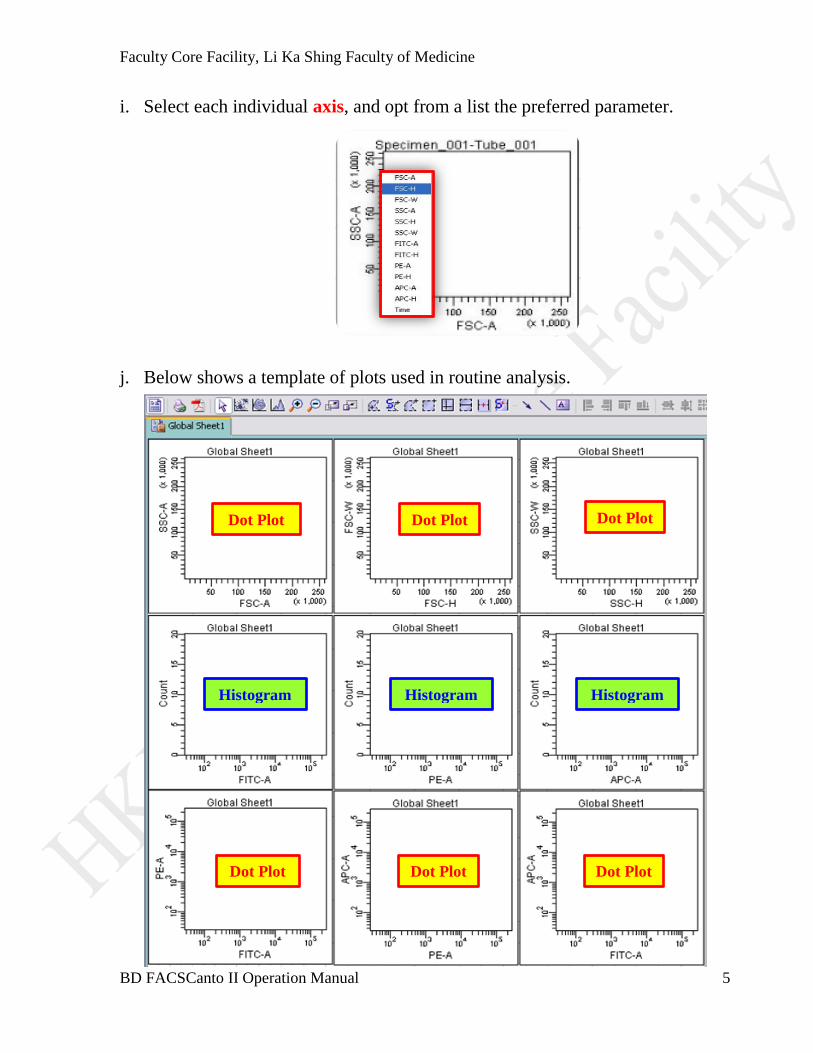
i. Select each individual axis, and opt from a list the preferred parameter.
j. Below shows a template of plots used in routine analysis.
Dot Plot Dot Plot Dot Plot
Dot Plot Dot Plot Dot Plot
Histogram Histogram Histogram
Faculty Core Facility, Li Ka Shing Faculty of Medicine
BD FACSCanto II Operation Manual
6
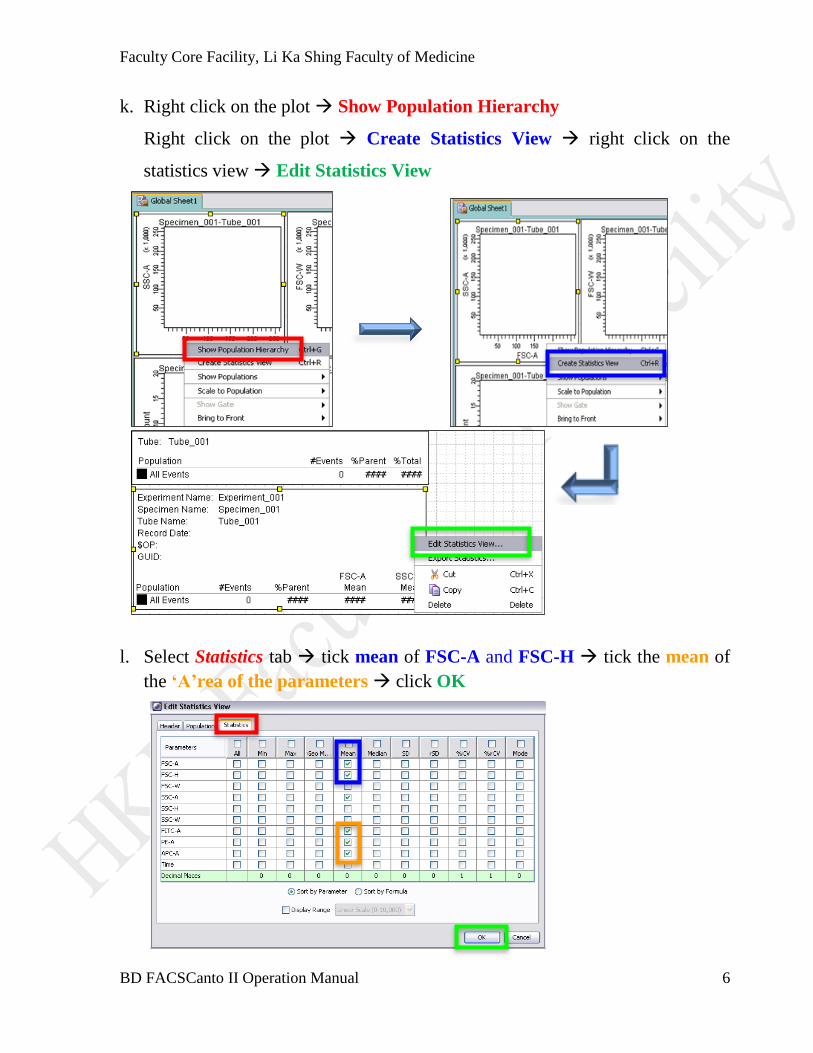
k. Right click on the plot Show Population Hierarchy
Right click on the plot Create Statistics View right click on the
statistics view Edit Statistics View
l. Select Statistics tab tick mean of FSC-A and FSC-H tick the mean of
the ‘A’rea of the parameters click OK
Faculty Core Facility, Li Ka Shing Faculty of Medicine
BD FACSCanto II Operation Manual
7
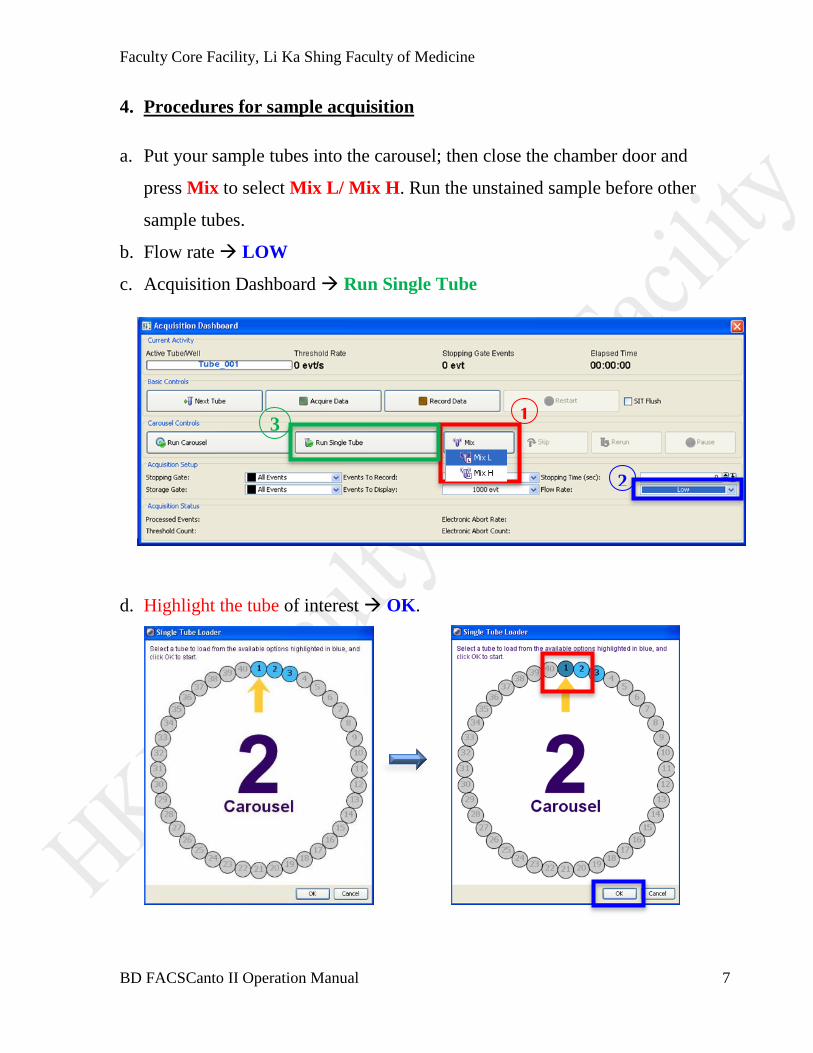
4. Procedures for sample acquisition
a. Put your sample tubes into the carousel; then close the chamber door and
press Mix to select Mix L/ Mix H. Run the unstained sample before other
sample tubes.
b. Flow rate LOW
c. Acquisition Dashboard Run Single Tube
d. Highlight the tube of interest OK.
1
2
3
Faculty Core Facility, Li Ka Shing Faculty of Medicine
BD FACSCanto II Operation Manual
8
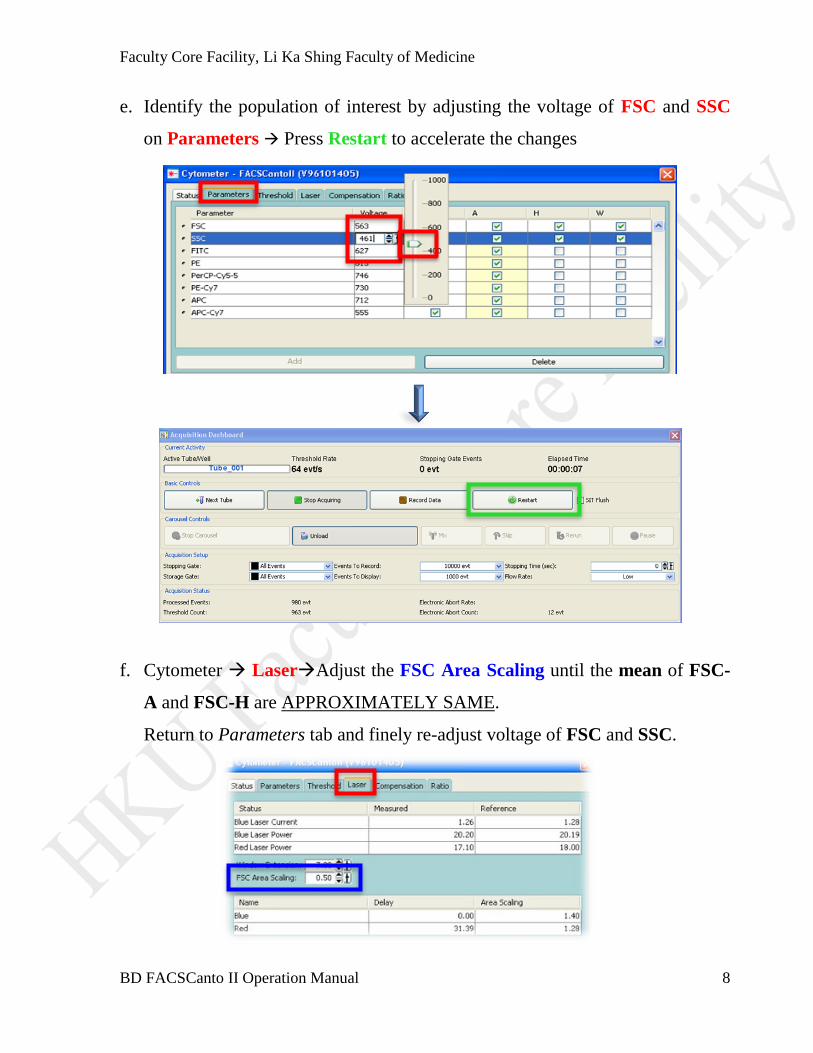
e. Identify the population of interest by adjusting the voltage of FSC and SSC
on Parameters Press Restart to accelerate the changes
f. Cytometer LaserAdjust the FSC Area Scaling until the mean of FSC-
A and FSC-H are APPROXIMATELY SAME.
Return to Parameters tab and finely re-adjust voltage of FSC and SSC.
Faculty Core Facility, Li Ka Shing Faculty of Medicine
BD FACSCanto II Operation Manual
9
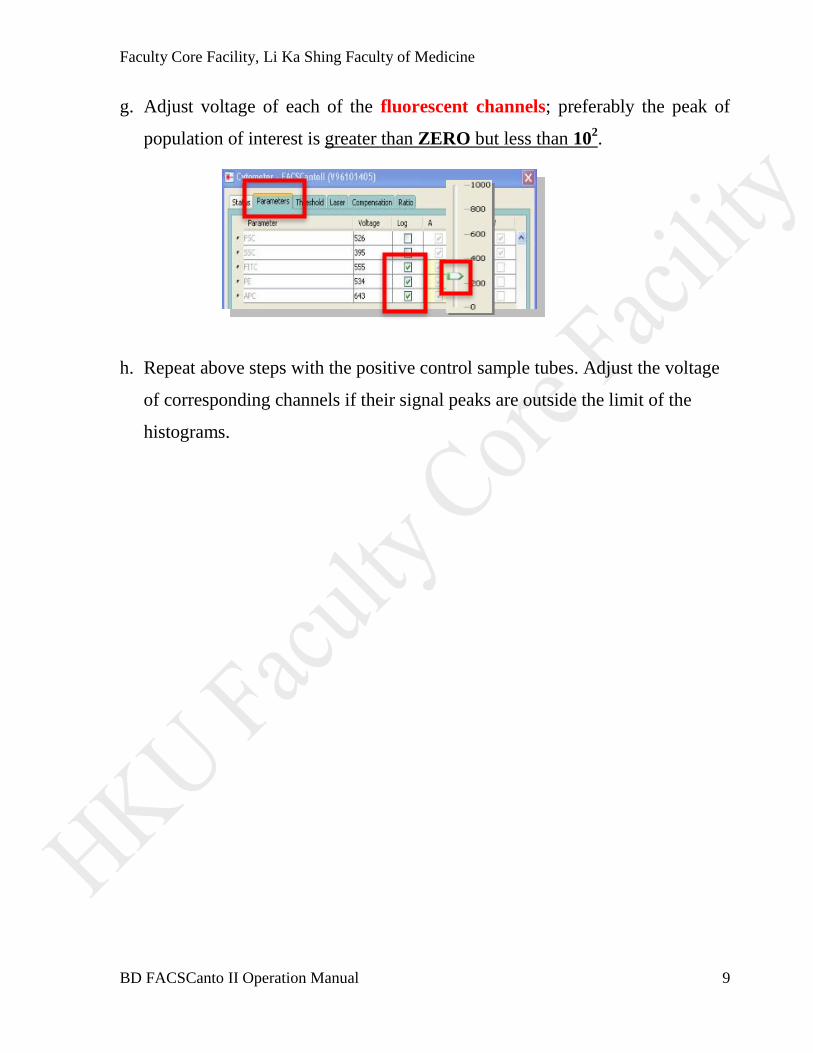
g. Adjust voltage of each of the fluorescent channels; preferably the peak of
population of interest is greater than ZERO but less than 102.
h. Repeat above steps with the positive control sample tubes. Adjust the voltage
of corresponding channels if their signal peaks are outside the limit of the
histograms.
Faculty Core Facility, Li Ka Shing Faculty of Medicine
BD FACSCanto II Operation Manual
10
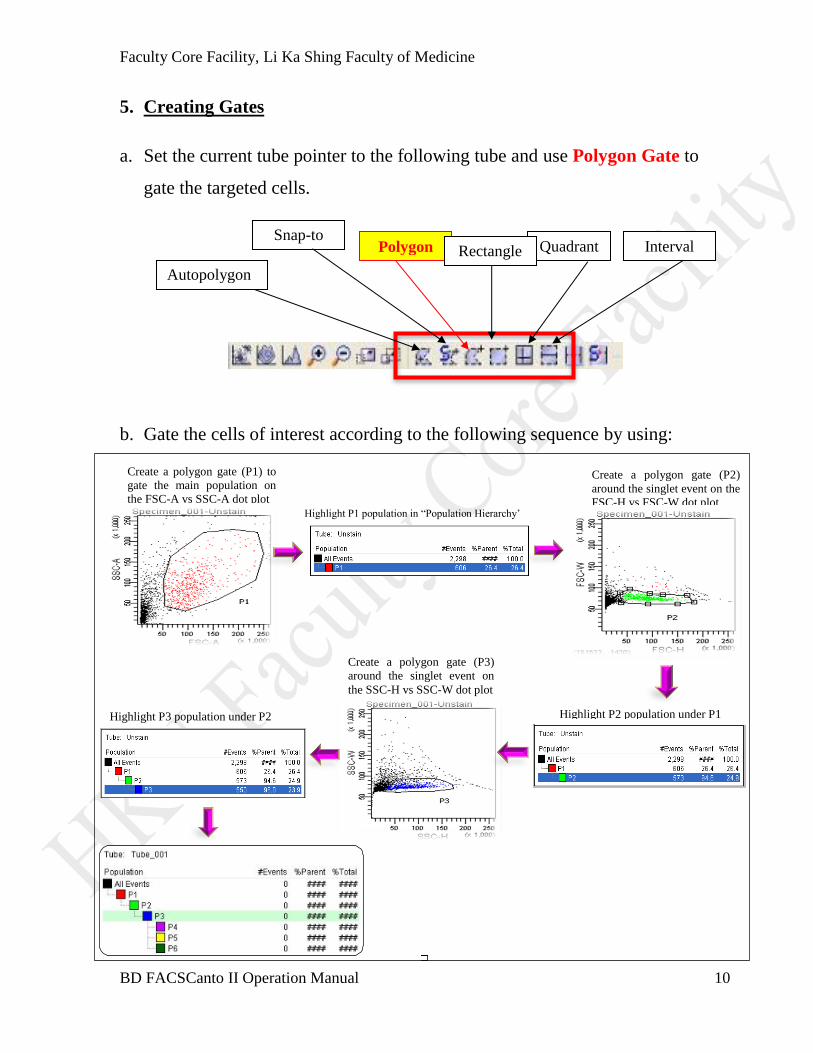
5. Creating Gates
a. Set the current tube pointer to the following tube and use Polygon Gate to
gate the targeted cells.
b. Gate the cells of interest according to the following sequence by using:
Autopolygon
Polygon Quadrant Interval Snap-to
Rectangle
Highlight P3 population under P2
Create a polygon gate (P1) to
gate the main population on
the FSC-A vs SSC-A dot plot
Highlight P1 population in “Population Hierarchy’
Create a polygon gate (P2)
around the singlet event on the
FSC-H vs FSC-W dot plot
Highlight P2 population under P1
Create a polygon gate (P3)
around the singlet event on
the SSC-H vs SSC-W dot plot

Faculty Core Facility, Li Ka Shing Faculty of Medicine
BD FACSCanto II Operation Manual
11
c. To define fluorescence positive signal, interval gate (P4, P5,…) beyond
negative peak of fluorescent channels in histogram plot of unstained samples
can be created. For over multiple fluorescence channels, quadrant gate could
be created to define single/double positive signals (Q1; Q2; Q3; Q4….).
* Note that P1 is the children of All Events and the parent of P2 population; P2
population is the children of P1 population and the parent of P3 population and
the grandparent of P4, P5, and P6 populations. Thus, on the hierarchy table, users
should highlight the P1 population when a gate for P2 population is drawn, the
P2 population when a gate for P3 population is drawn, and the P3 population
when gates for P4, P5, and P6 populations are drawn.
Faculty Core Facility, Li Ka Shing Faculty of Medicine
BD FACSCanto II Operation Manual
12
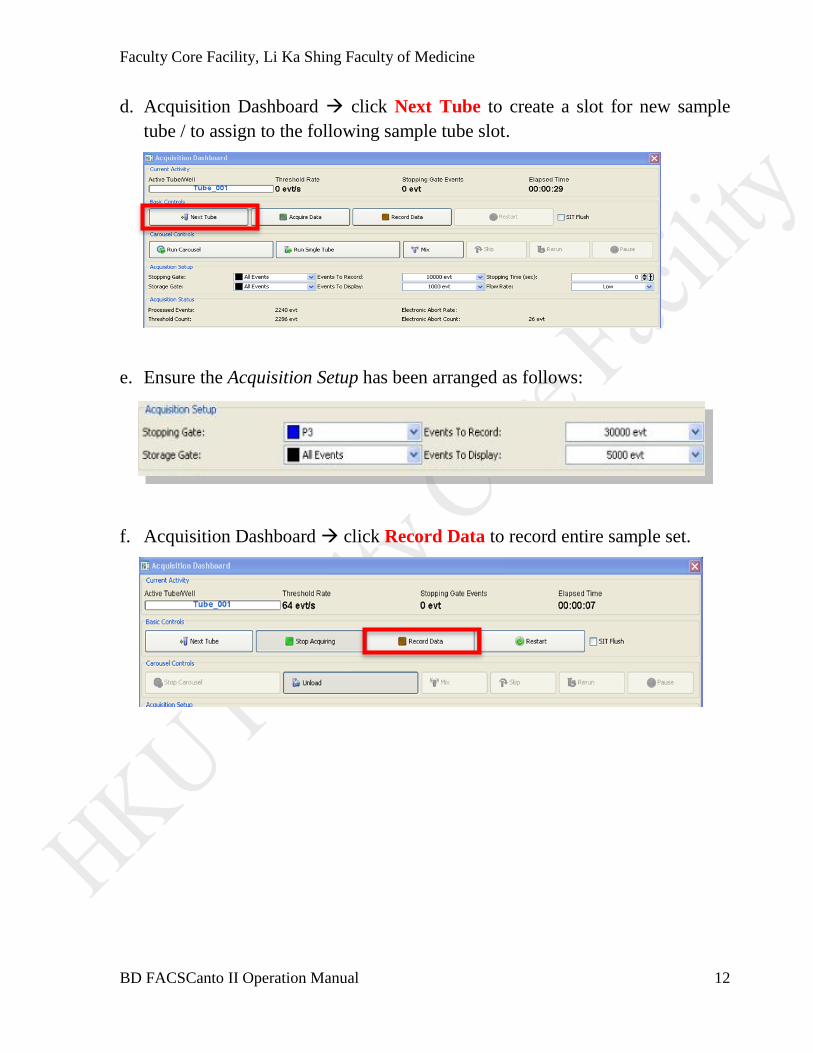
d. Acquisition Dashboard click Next Tube to create a slot for new sample
tube / to assign to the following sample tube slot.
e. Ensure the Acquisition Setup has been arranged as follows:
f. Acquisition Dashboard click Record Data to record entire sample set.
Faculty Core Facility, Li Ka Shing Faculty of Medicine
BD FACSCanto II Operation Manual
13
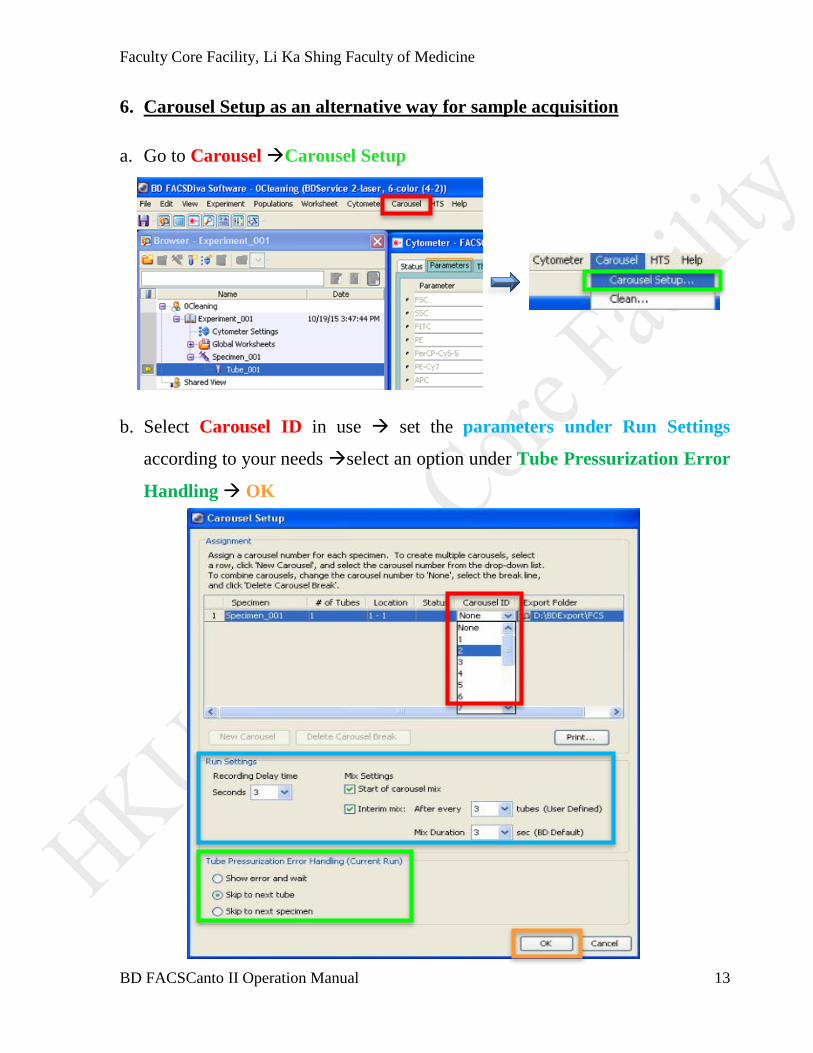
6. Carousel Setup as an alternative way for sample acquisition
a. Go to Carousel Carousel Setup
b. Select Carousel ID in use set the parameters under Run Settings
according to your needs select an option under Tube Pressurization Error
Handling OK
Faculty Core Facility, Li Ka Shing Faculty of Medicine
BD FACSCanto II Operation Manual
14
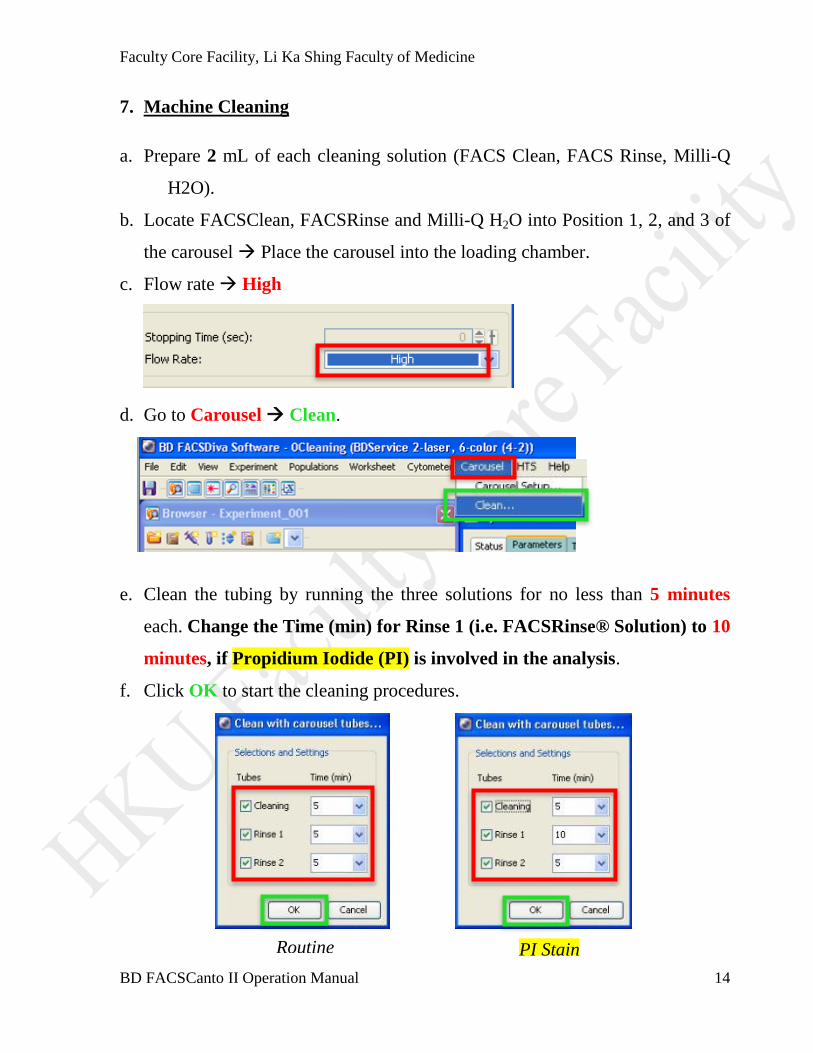
7. Machine Cleaning
a. Prepare 2 mL of each cleaning solution (FACS Clean, FACS Rinse, Milli-Q
H2O).
b. Locate FACSClean, FACSRinse and Milli-Q H2O into Position 1, 2, and 3 of
the carousel Place the carousel into the loading chamber.
c. Flow rate High
d. Go to Carousel Clean.
e. Clean the tubing by running the three solutions for no less than 5 minutes
each. Change the Time (min) for Rinse 1 (i.e. FACSRinse® Solution) to 10
minutes, if Propidium Iodide (PI) is involved in the analysis.
f. Click OK to start the cleaning procedures.
Routine PI Stain
Faculty Core Facility, Li Ka Shing Faculty of Medicine
BD FACSCanto II Operation Manual
15
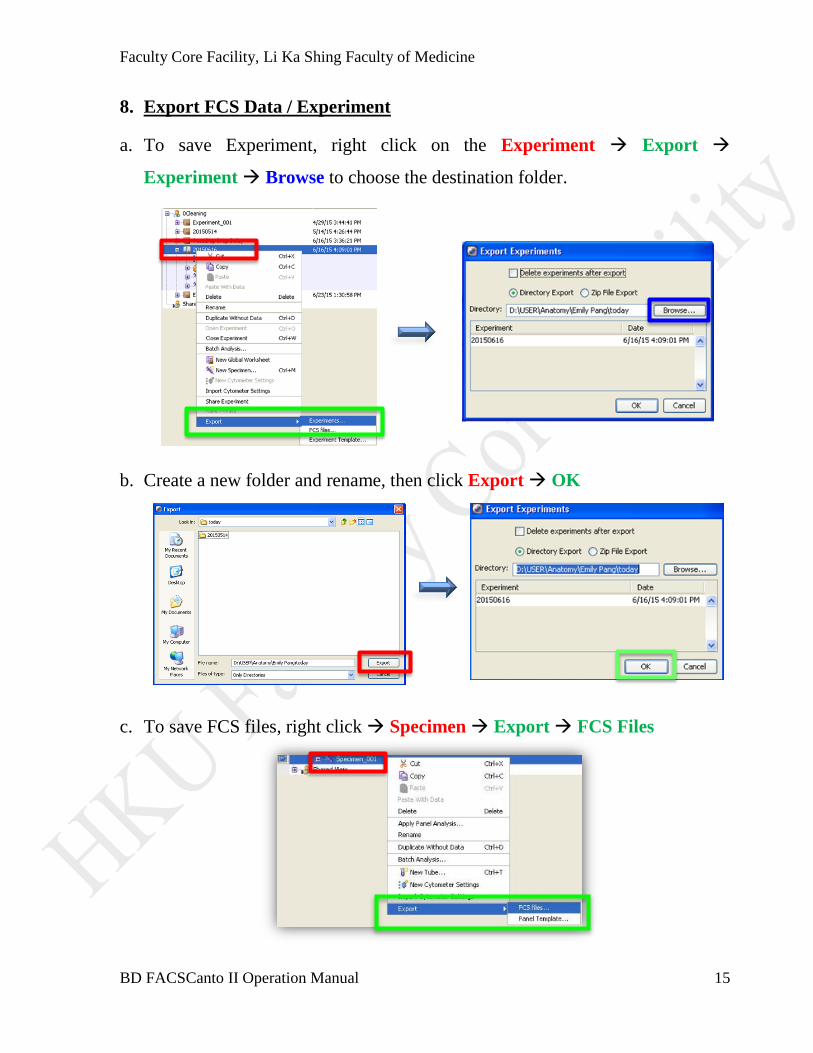
8. Export FCS Data / Experiment
a. To save Experiment, right click on the Experiment Export
Experiment Browse to choose the destination folder.
b. Create a new folder and rename, then click Export OK
c. To save FCS files, right click Specimen Export FCS Files
Faculty Core Facility, Li Ka Shing Faculty of Medicine
BD FACSCanto II Operation Manual
16
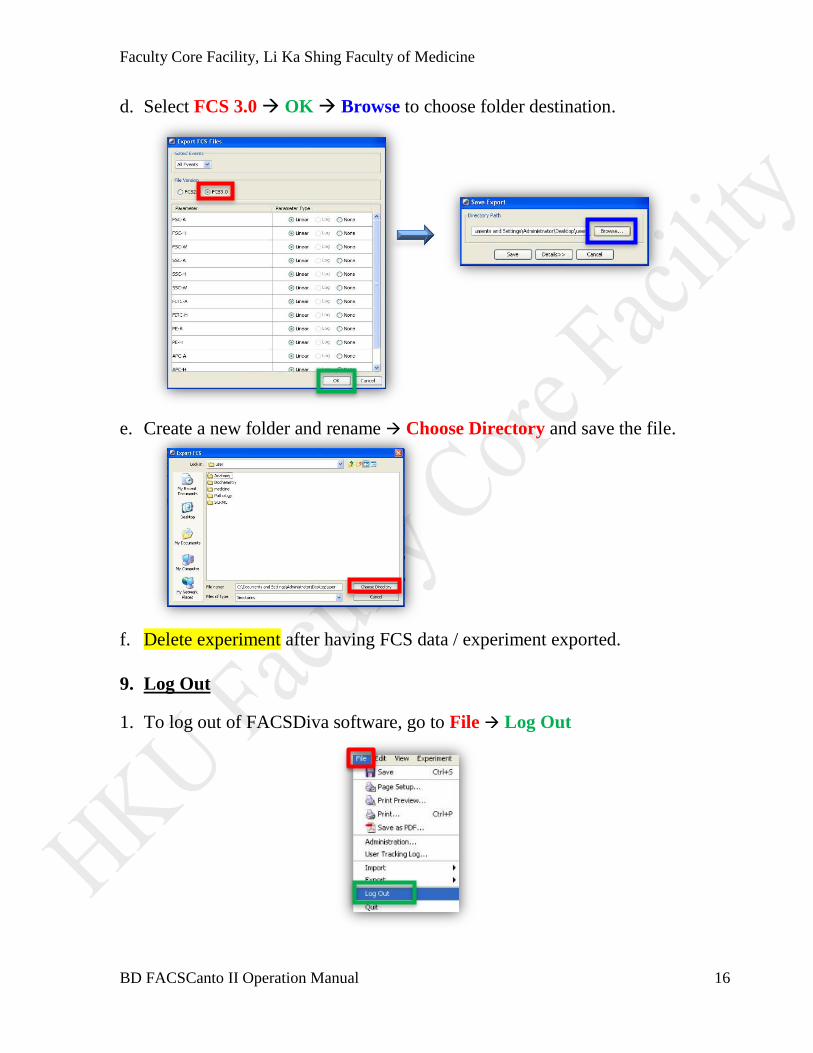
d. Select FCS 3.0 OK Browse to choose folder destination.
e. Create a new folder and rename Choose Directory and save the file.
f. Delete experiment after having FCS data / experiment exported.
9. Log Out
1. To log out of FACSDiva software, go to File Log Out