fact sheet sacrificial anodes, merchant · pdf filesacrificial anodes, merchant shipping and...
TRANSCRIPT

i Anodes, Shipping & Fisheries
Emission estimates for diffuse sources Netherlands Emission Inventory
Sacrificial anodes,
merchant shipping and
fisheries
Version dated June 2008
NETHERLANDS NATIONAL WATER BOARD - WATER UNIT in cooperation with DELTARES and TNO

ii Anodes, Shipping & Fisheries
Table of Contents
. . . . . . . . . . . . . . . . . . . . . . . . . . . . . . . . . . . . . . . . . . . . . . . . . . . . . . . . . . . . . . . . . . . . . . . . . . . . . . . . . . . . . . . .
1 Introduction and scope 1–1
2 Description of emission source 2–1 2.1 Causes 2–1 2.1.1 Passive protection by means of sacrificial anodes 2–1 2.1.2 Active protection by means of impressed current 2–3 2.1.3 Ballast tanks 2–4 2.2 Measures 2–5
3 Explanation of calculation method 3–1 3.1 Exterior of vessel 3–1 3.2 Wet surface area 3–2 3.2.1 Calculation of surface areas based on volume 3–4 3.2.2 Correction for incomplete draught 3–5 3.3 Corrosion rate 3–6 3.3.1 Emissions at sail 3–8 3.4 Interior of vessel 3–9
4 Activity Rates 4–1 4.1 Assessment using statistical data 4–1 4.2 Interior of vessel 4–3 4.3 Time series, 1990-present 4–4 4.4 Time series, present-2027 4–4 4.5 Annual data setting 4–6
5 Description of emission pathways to water 5–8
6 Emission factors 6–1 6.1 Emission factors 6–1 6.2 Application percentages 6–2 6.3 Time series, 1990-present 6–2 6.4 Annual data setting 6–2
7 Emissions calculated 7–1 7.1 Emission figures 2004 7–1 7.2 Emissions 1990-2006 7–1 7.3 Emissions forecast, 2009-2027 7–3
8 Comments and changes in regard to previous version 8–5 8.1 Difference in figures due to mathematical errors 8–5
9 Accuracy and indicated subjects for improvement 9–1 9.1 Most significant areas for improvement 9–1
10 Spatial allocation 10–1 10.1 Seagoing vessels and fishing vessels on NCP 10–1 10.2 Seagoing vessels in Dutch territory 10–3 10.3 Fishing vessels in ports 10–4

iii Anodes, Shipping & Fisheries
11 References 11–1
1–1 Anodes, Shipping & Fisheries
1 Introduction and scope
. . . . . . . . . . . . . . . . . . . . . . . . . . . . . . . . . . . . . . . . . . . . . . . . . . . . . . . . . . . . . . . . . . . . . . . . . . . . . . .
The source of the emissions is the anode material placed on the exterior
and interior (in the ballast tanks) of seagoing merchant vessels and
fishing vessels for the purpose of cathodic protection of metal surfaces.
In the National Emission Inventory, this emission is assigned to the
governmental target sector “Transport”. The emissions in question are
zinc, aluminium and cadmium. Cadmium is present as a contaminant in
the zinc, and is released when zinc anodes decay.
This report is based on a previous quantification of emissions of anodes
in shipping and fisheries for the Dutch Continental Shelf (NCP) and in
ports conducted for the Traffic and Transport Advisory Service (AVV)
under the EMS (Emission Inventory and Monitoring for the Shipping
Sector). The quantification in this report can be considered to be an
update of two EMS protocols:
- EMS protocol for Emissions by Shipping and Fisheries: Anodes
on ships on the NCP (Kuiper, 2003a)
- EMS protocol for Emissions by Shipping and Fisheries: Anodes
on ships in ports (Kuiper, 2003b)
Here, the quantification of emissions for NCP and ports is integrated
into a single report. The method of quantification of the two types of
emissions is different, however, and consequently this distinction will be
referenced frequently throughout this report.

1–2 Anodes, Shipping & Fisheries
This quantification implements a number of recommendations for
improvement of emissions assessment from the protocols listed above,
and also incorporates a few new insights. The most significant changes
in reference to the protocols are:
- Calculation of the Wet Surface Area (WSA) is improved, with a
WSA computed for each individual ship in Dutch waters, taking
partial loading of the ship into account;
- A traffic and transport database based on the Lloyds traffic file
has been created for the NCP, which, in combination of the
WSA per ship, was used to compute the total average WSA
present in Dutch waters;
- Emissions from floating tank cooling1 appear to play a much
smaller role than described in the protocols. Floating tank
cooling is a cooling system used primarily in inland waterway
shipping and possibly a few smaller seagoing vessels. Larger
seagoing vessels have pipe or plate cooling systems.
Consequently, emissions from floating tank cooling are not
reported separately in this report;
- Along with historical development in emissions, this report
provides a forecast of emissions up to the year 2027;
- The emissions are spatially allocated by body of water identified
in the Water Framework Directive. This data is provided as a
separate database.
1 Cooling system for ship engines involving a steel tank welded to the hull, in contact with the
water, and containing a bundle of thin, corrosion-proof pipes. In some versions, the tank is an
inverted box on the bottom of the ship with an opening in the bottom. The tank contains a
heat exchanger consisting of a package of many thin tubes that come into contact with the
outside water on all sides.

2–1 Anodes, Shipping & Fisheries
2 Description of emission source
. . . . . . . . . . . . . . . . . . . . . . . . . . . . . . . . . . . . . . . . . . . . . . . . . . . . . . . . . . . . . . . . . . . . . . . . . . . . . . .
2.1 Causes
Ships are coated to prevent corrosion. This protective layer, however, is
not sufficient to fully protect the ship from corrosion. For this reason, as
well as to protect the uncoated sections of a ship (screw, damage, etc.)
and ensure that the ship remains protected as the coating deteriorates,
cathodic protection is used.
If two metals are electrically
connected in an electrolyte
(such as seawater), the
electrons of a base metal
will flow to another, more
noble metal. This is due to
the difference in electrical
potential. The more noble
metal is referred to as the
"cathode" and the other as
the "anode." As the anode
supplies electrons to the cathode, it gradually dissolves into ions, with
the result that the cathode becomes negatively polarised and thus
protected against corrosion. See figure 1. Cathodic protection can be
classified as passive or active. This is explained in more detail in the
following subsections.
2.1.1 Passive protection by means of sacrificial anodes
Passive cathodic protection of a ship involves the use of "sacrificial
anodes". As already indicated, these sacrificial anodes must be of a
metal that is less noble (more base) than the metal to be protected. The
two metals used as anodes in shipbuilding are zinc and aluminium.
Table 1 shows the various metals in order of nobility. The effectiveness
of the anode material in seawater is determined by the composition of
the alloy.
Because the anodes dissolve in the seawater, the blocks must be
replaced at regular intervals. On average, the blocks are replaced every
two to two-and-a-half years, when approximately 15% of the original
weight remains. For fishing vessels, the ratios are different. A fishing
vessel goes into dry-dock every year, and so the blocks are replaced
every year, when some 30% of the original weight remains.
. . . . . . . . . . . . . . . . . . . . . . . . . . . . . . . figure 1 Functioning anode

2–2 Anodes, Shipping & Fisheries
Zinc anode
The most commonly material used for cathodic protection of seagoing
vessels is zinc. The electrical capacity (also indicated by the symbol ε, see chapter 4.1) of a zinc anode in seawater is 780 Ah/kg (Ampere per
hour per kg of zinc anode). This is a function of the amount of valence
electrons that can be moved from the zinc to the less noble metal per
hour. If the amount of valence electrons the metal to be protected
gives off under the influence of seawater is known, the rate at which
the zinc anode dissolves can be calculated.
The zinc anodes installed in ships are generally designed for a lifetime
of between 1 and 3 years.
Aluminium anode
Aluminium is being used as an anode material more and more
frequently. The electrical capacity of an aluminium anode in seawater is
2,600 Ah/kg. Aluminium anodes perform better than the zinc anodes
(2,600 valence electrons per hour per kilogram versus 780 for zinc),
and as such require fewer to achieve the same effect. Although
aluminium is a more expensive material than zinc, the end cost of
aluminium anodes is less because they require 3.33 times less material.
Another significant environmental advantage is that the aluminium
alloys used do not contain cadmium, unlike the zinc alloys used (and
prescribed by standardization; see chapter 3.2).
. . . . . . . . . . . . . . . . . . . . . . . . . . . . . . .
table 1
Metals in order of nobility
Nobility of various metals
Metal Symbol
Potassium K
Sodium Na
Calcium Ca
Magnesium Mg
Aluminium Al
Zinc Zn
Iron Fe
Chromium Cr
Nickel Ni
Tin Sn
Lead Pb
Copper Cu
Mercury Hg
Silver Ag
Platinum Pt
Gold Au
Nobility of various metals

2–3 Anodes, Shipping & Fisheries
2.1.2 Active protection by means of impressed current
In addition to passive protection, active cathodic protection is an
increasingly common method of protection. The impressed current (IC)
system moves potentials to protect the metal.
An IC system uses a transformer, an adjustable rectifier as a power
source and inert, or "non-consumable", anodes. The adjustable rectifier
can be set so that the connected anode(s) provide exactly the
protective current to provide the desired protection potential. See
figure 2.
Theoretically, an IC system could be used to protect the entire exterior
of a vessel, but in practice this system is often used in combination with
passive anodes. The parts of the vessel fitted with passive anodes are
the bow thruster tunnel, the screw and the rudder. These parts require
a higher level of protection because they use unfinished metal (screw),
the coating on these parts has a higher breakdown factor, and the
speed of the water that passes along these parts is higher than at other
parts of the hull. IC systems are not used in ballast tanks, because the
generation of hydrogen gas (H2) constitutes a risk of explosion,
certainly in combination with the electrical system.
Because IC systems do not release metal ions into the water, this is the
most environmentally friendly cathodic protection method. The system
also allows online measurement of the state of the coating, and reduces
organism growth, thereby contributing to reduced fuel use.
. . . . . . . . . . . . . . . . . . . . . . . . . . . . . . .
. . . . . . . . . . . . . . . . . . . . . . . . . . . . . . .
figure 2
Operation and placement of
impressed current system

2–4 Anodes, Shipping & Fisheries
2.1.3 Ballast tanks
Protection of the ballast tank of a vessel is more complex than the
protection of the hull, for a number of reasons:
• While the ballast tank may be a tank solely used for ballast water,
in many cases the cargo area is also used as a ballast tank, and this
causes the anodes to become soiled and no longer function
properly
• The ballast tank is not always in ballast
• The ballast tank is difficult to reach and consequently difficult to
check;
• The form and structure of a ballast tank (many crossbeams, holes,
etc.) require more anode material to keep the less accessible
locations (the places not easily reached by cathodic protection)
protected
Ballast tanks are
constructed primarily of
aluminium, presumably
due to the longer lifetime
of aluminium at the same
weight. As indicated
above, the anodes in the
ballast tank are difficult to
replace. See figure 3 for
the placement of anodes
in the ballast tanks.
For ships with explosive
cargo (oil, gas, etc.),
ballast tanks are subject
to special requirements
governing the placement
and type of anode
material used:
• Aluminium may not
be used in ballast
tanks for ships
transporting flammable cargo. Anodes coming loose and falling can
cause sparks;
• Likewise, IC systems cannot be used due to the risk of
fire/explosion due to the formation of hydrogen gas (H2) in
combination with the electrical system.
Consequently, in certain cases zinc is used for the anodes mounted
higher in the ballast tank (combining zinc and aluminium anodes is
permitted).
. . . . . . . . . . . . . . . . . . . . . . . . . . . . . . .
figure 3
Placement of sacrificial anodes in
ballast tanks
2–5 Anodes, Shipping & Fisheries
The average lifetime of anodes in ballast tanks is calculated at 4-6
years.
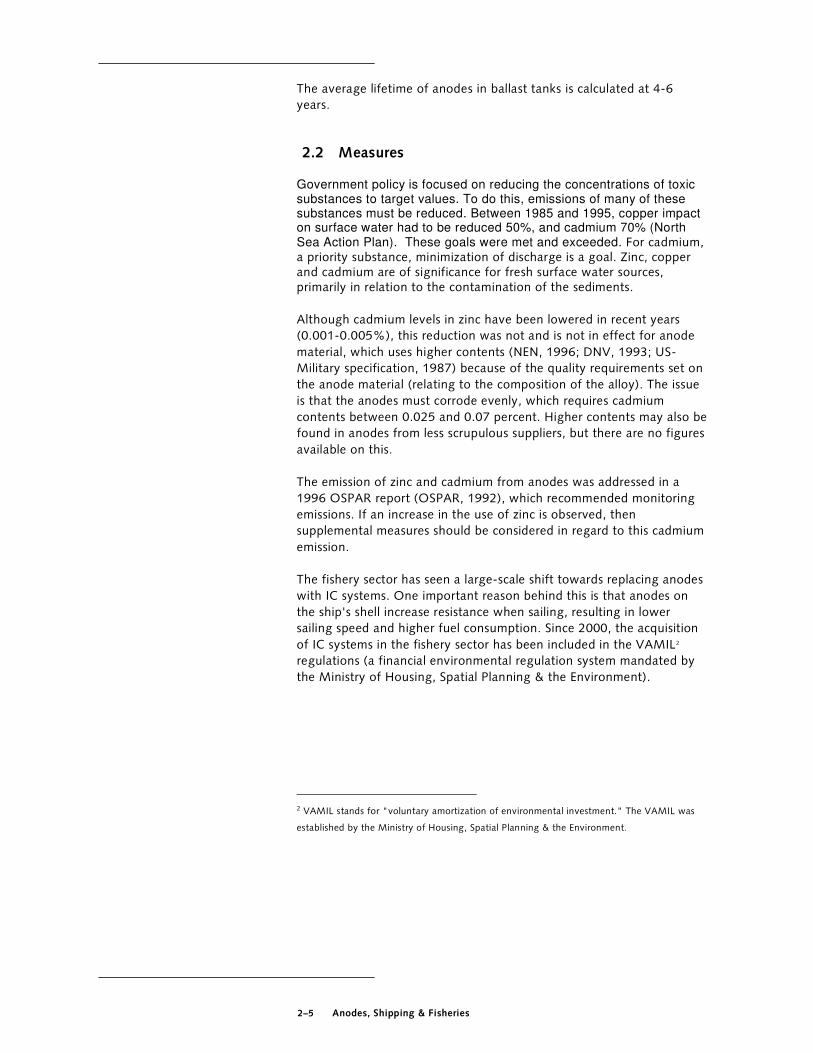
2.2 Measures
Government policy is focused on reducing the concentrations of toxic substances to target values. To do this, emissions of many of these substances must be reduced. Between 1985 and 1995, copper impact on surface water had to be reduced 50%, and cadmium 70% (North Sea Action Plan). These goals were met and exceeded. For cadmium, a priority substance, minimization of discharge is a goal. Zinc, copper and cadmium are of significance for fresh surface water sources, primarily in relation to the contamination of the sediments.
Although cadmium levels in zinc have been lowered in recent years
(0.001-0.005%), this reduction was not and is not in effect for anode
material, which uses higher contents (NEN, 1996; DNV, 1993; US-
Military specification, 1987) because of the quality requirements set on
the anode material (relating to the composition of the alloy). The issue
is that the anodes must corrode evenly, which requires cadmium
contents between 0.025 and 0.07 percent. Higher contents may also be
found in anodes from less scrupulous suppliers, but there are no figures
available on this.
The emission of zinc and cadmium from anodes was addressed in a
1996 OSPAR report (OSPAR, 1992), which recommended monitoring
emissions. If an increase in the use of zinc is observed, then
supplemental measures should be considered in regard to this cadmium
emission.
The fishery sector has seen a large-scale shift towards replacing anodes
with IC systems. One important reason behind this is that anodes on
the ship's shell increase resistance when sailing, resulting in lower
sailing speed and higher fuel consumption. Since 2000, the acquisition
of IC systems in the fishery sector has been included in the VAMIL2
regulations (a financial environmental regulation system mandated by
the Ministry of Housing, Spatial Planning & the Environment).
2 VAMIL stands for "voluntary amortization of environmental investment." The VAMIL was
established by the Ministry of Housing, Spatial Planning & the Environment.

3–1 Anodes, Shipping & Fisheries
3 Explanation of calculation method
. . . . . . . . . . . . . . . . . . . . . . . . . . . . . . . . . . . . . . . . . . . . . . . . . . . . . . . . . . . . . . . . . . . . . . . . . . . . . . .
The calculation system used is addressed in general terms in the
"method" section. Chapters 5, 6 and 7 cover the activity rates, the
emission factors and the emissions.
3.1 Exterior of vessel
This chapter addresses the method of calculation used to arrive at the
emission assessment. Emissions are ultimately calculated as the product
of an activity rate and an emission factor.
emission = activity rate * emission factor
The emission is expressed in tonnes per year.
The activity rate is the wet surface area (WSA) (in m2) on average
present in Dutch waters at any given time. The total ship area is the
product of the total number of ships found in the NCP and the wet
surface of a seagoing vessel, taking type and tonnage into account. The
traffic and transport database of the risk model SAMSON (Glansdorp,
Van der Tak, 1993) was used to calculate the number of ships sailing
on the NCP and the calculation of the underwater ship area. The basic
data for this database were derived from Lloyds for the year 2000. For
other years, a comparison with figures from Statistics Netherlands of
ship calls at Dutch ports was used.
In the calculations, the activity rate for different years was estimated
taking into account the trend in wet surface area and application rates
of the various technologies of cathodic protection.-{}-
ARx,c = ARy x APPx,c x TRENDxy
Where:
ARx,c = activity rate of technology (t) in year (x)
ARy = total of activity rates in base year (y)
APPx,c = application fraction of technology (t) in year (x)
TRENDxy = trend factor of AR in year x in relation to base
year (y)
The emission factor is the leaching rate of aluminium and zinc,
expressed here in µg cm-2 day-1. These leaching rates used in the
calculations are taken from the report Uitloging anodemateriaal van zeeschepen, produced by BECO for RIZA, the Netherlands Centre for
Water Management (Willems, 2003; see chapter 4.4).

3–2 Anodes, Shipping & Fisheries
3.2 Wet surface area
If the dimensions of the ship are known, the wet ship area can be
calculated by any of several different methods:
• The Denny-Mumford equation (Man-Diesel, 2002; Kuiper,
2003a,b) was derived by Mumford at the end of the 19th
century using tests of ship models in Denny's experimental
(1750 m3) water tank in Scotland. In Denny-Mumford, the wet
ship area is calculated from the length, depth and a block
coefficient (the ratio of the actual volume of the hull and the
product of length x width x depth)
• The Komsi comparison (Koivisto, 2003; OECD, 2005) based on
measurements of ships in Finland
• The Holtrop-Mennen equation (Holtrop, 1977) is the most
recent method for determining the wet ship area. This formula
is based on the same type of measurements as Denny-
Mumford, factoring in additional insights from hydrological
theory. The Holtrop-Mennen coefficients are obtained through
regression analysis of MARIN model tests
• The ratio from Van Hattum et al. (2002) is more of a first order
approach to the wet ship area, based on a simplified ship
model.
In this study, the methods are compared for the group of Bulk Carriers
in the Lloyds register. The results of the comparison are shown in the
figure below. The volume of all ship's enclosed spaces is expressed in
GT (gross tonnage) to the power of two-thirds.
Bulkers: GT^2/3 vs. oppervlak
0
5000
10000
15000
20000
25000
30000
35000
0 500 1000 1500 2000 2500 3000 3500
grootte^2/3 (GT)
op
perv
lak (
m2)
Denny Mumford
Van Hattum
Komsi
Holtrop-Mennen
Average surface % of Holtrop
Mennen
Denny-Mumford 9072 98%
Van Hattum 7735 84%
Komsi 9250 100%
Holtrop-Mennen 9223 100%
. . . . . . . . . . . . . . . . . . . . . . . . . . . . . . . Figure 4 Comparison of the results of different methods of establishing wet ship area for the group bulk carriers
. . . . . . . . . . . . . . . . . . . . . . . . . . . . . . . Table 2 Comparison of the results of different methods of establishing wet ship area

3–3 Anodes, Shipping & Fisheries
For bulk carriers, the results using Denny-Mumford, Holtrop-Mennen
and Komsi are very similar. The Van Hattum model produces different
results. Because Holtrop-Mennen seems to be the most theoretically
sound, the most recent and in keeping with Komsi and Denny-
Mumford, this model is recommended.
calculates the wet ship area as follows:
WSA = L(2D+W) x sqrt(CM) x (0.530+0.632CB-0.360(CM-0.5)-
0.00135L/D)
Where:
WSAmax : wet ship area at design draught
D : design draught of the ship
L : length of the ship measured between midship perpendiculars
W : width of ship at widest point
CM : surface area coefficient of the largest rib: the transverse
section measured at the widest rib of the ship divided by the
surface area defined by W x D at the largest rib
CB : the block coefficient of the ship: volume of the ship divided by
the block defined by L x W x D
Values for CM and CB for the various vessel types are shown in table 3
(Man-Diesel, 2002).
Vessel type CB CM
Barge 0,9 0,98
Bulk carrier 0,85 0,98
Tanker 0,85 0,98
General cargo 0,75 0,95
Container ship 0,7 0,95
Ferry 0,7 0,95
. . . . . . . . . . . . . . . . . . . . . . . . . . . . . . .
Equation 1 The Holtrop-Mennen
compariso
. . . . . . . . . . . . . . . . . . . . . . . . . . . . . . . Table 3 Coefficients for use in Holtrop-Mennen equation

3–4 Anodes, Shipping & Fisheries
3.2.1 Calculation of surface areas based on volume
The current standard of ship measurement is gross tonnage (GT3).
A ship twice as long is generally also approximately twice as wide and
twice as deep. The relationship between volume and vessel length is
therefore a third exponent. The relationship between surfaces and
length is a second exponent. Taken together, all this suggests a
relationship between surface and vessel volume to the power of two-
thirds:
WSAmax ~ Volume2/3
Where WSAmax is the wet surface area at design draught.
Upon further elaboration, this is also shown to apply for most vessel
types across a very wide range of vessel sizes. The wet surface can
therefore be expressed as a function of ship size in GT:
WSAmax = C GT2/3
The value of the constant C differs from vessel type to vessel type.
Table 2 presents an overview of the results.
3 Ship size is often expressed in gross tonnage (GT). This gross tonnage is calculated as K * V,
where V is the gross volume of the ship and K a correction, calculated as 0.2 + 0.0210logV .
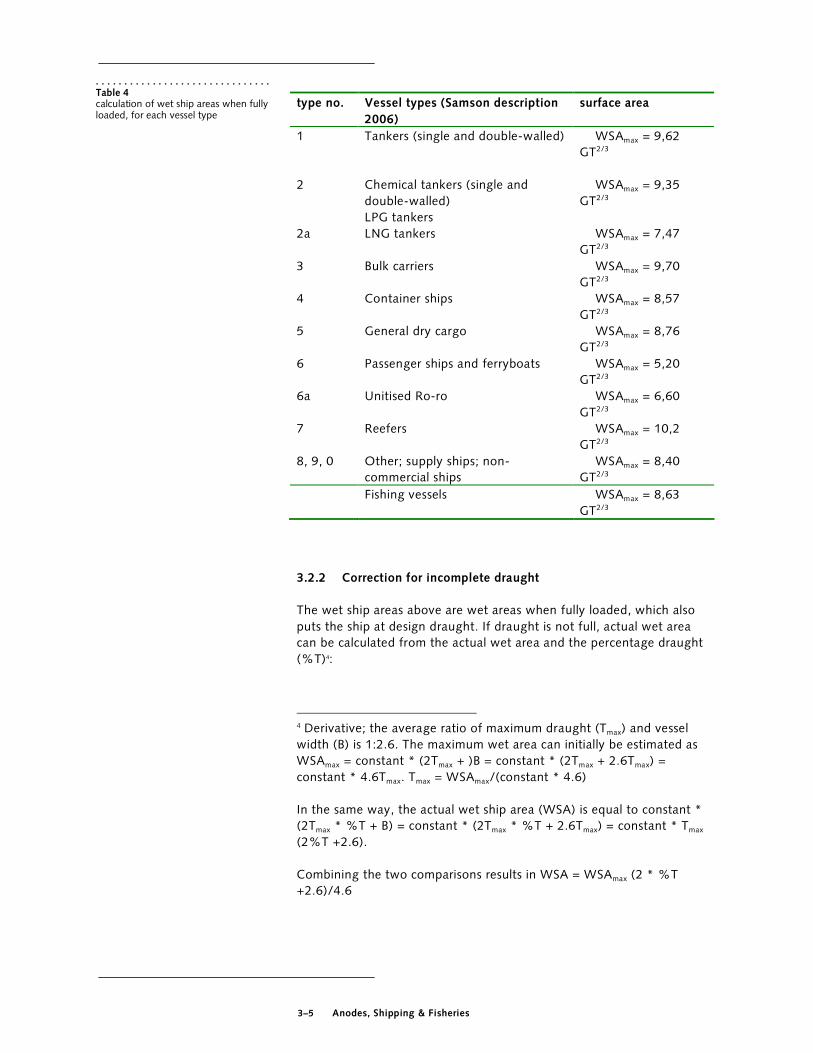
3–5 Anodes, Shipping & Fisheries
type no. Vessel types (Samson description
2006)
surface area
1 Tankers (single and double-walled) WSAmax = 9,62
GT2/3
2 Chemical tankers (single and
double-walled)
LPG tankers
WSAmax = 9,35
GT2/3
2a LNG tankers WSAmax = 7,47
GT2/3
3 Bulk carriers WSAmax = 9,70
GT2/3
4 Container ships WSAmax = 8,57
GT2/3
5 General dry cargo WSAmax = 8,76
GT2/3
6 Passenger ships and ferryboats WSAmax = 5,20
GT2/3
6a Unitised Ro-ro WSAmax = 6,60
GT2/3
7 Reefers WSAmax = 10,2
GT2/3
8, 9, 0 Other; supply ships; non-
commercial ships
WSAmax = 8,40
GT2/3
Fishing vessels WSAmax = 8,63
GT2/3
3.2.2 Correction for incomplete draught
The wet ship areas above are wet areas when fully loaded, which also
puts the ship at design draught. If draught is not full, actual wet area
can be calculated from the actual wet area and the percentage draught
(%T)4:
4 Derivative; the average ratio of maximum draught (Tmax) and vessel
width (B) is 1:2.6. The maximum wet area can initially be estimated as
WSAmax = constant * (2Tmax + )B = constant * (2Tmax + 2.6Tmax) =
constant * 4.6Tmax. Tmax = WSAmax/(constant * 4.6)
In the same way, the actual wet ship area (WSA) is equal to constant *
(2Tmax * %T + B) = constant * (2Tmax * %T + 2.6Tmax) = constant * Tmax
(2%T +2.6).
Combining the two comparisons results in WSA = WSAmax (2 * %T
+2.6)/4.6
. . . . . . . . . . . . . . . . . . . . . . . . . . . . . . . Table 4 calculation of wet ship areas when fully loaded, for each vessel type

3–6 Anodes, Shipping & Fisheries
WSA = WSAmax (2 * %T +2,6)/4,6
Estimates of relative draught for the various ship types upon arrival and
departure are obtained from MARIN (Van der Tak, 2006).
3.3 Corrosion rate
The draft of the "anode plan" or cathodic protection plan (CB plan) for
the ship takes into account factors such as susceptibility to corrosion of
the type of vessel and the individual parts of the ship. The areas around
the screw and on the rudder, for example, have more anodes placed on
them than on the rest of the ship (see figure 5).
The draft assumes recommended electrical current density per m2 (ic) to
prevent corrosion (Norsok, 1997; DNV, 1993; British Standard, 1991).
The number of anodes to be installed is derived from these current
densities. For untreated steel in North Sea water, electrical current
density must be approximately 85 mA/m2 to prevent corrosion. This
figure applies at a temperature between 5oC and 20oC (fluctuation in
North Sea between 1990 and 1999, with average of 11.8oC) and a
draught between 0 and 30 metres.
The amount of anode material that dissolves in water over a given
period of time (such as one year) can be calculated from the voltage
density and the electrical capacity of the anode material, using
Dwight's equation. This equation is:
. . . . . . . . . . . . . . . . . . . . . . . . . . . . . . .
Equation 2
Correction for incomplete draught
. . . . . . . . . . . . . . . . . . . . . . . . . . . . . . . . . . .
Figure 5 Anodes on the rudder and around the screw

3–7 Anodes, Shipping & Fisheries
( )( )ma
u
tiAm
c
=∗
∗∗∗
ε1000/
Where:
Parameter Unit Description
M Kg Amount of anode material that corrodes in time t
A m2 Wet surface
ic mA/m2 Required electrical current density
t Hours Time spent in water, in hours
−{}−ε Ah/kg Electrical capacity of anode in seawater
u Factor Utilization factor; for emission calculations, u=1
am Factor
Fraction that anode material (zinc or aluminium) used
represents in relation to total use of anodes (total of zinc and
aluminium anodes)
The electrical capacity of a zinc anode in seawater is 780 Ah/kg
(Ampere-hours per kg of zinc anode) and 2,600 Ah/kg for aluminium
anodes. The utilization factor is used to introduce an extra margin for
the use of anodes. Assuming a given lifetime of two years, a utilization
factor of 0.9 results in a theoretical overcapacity of approximately
10%. For emission calculations, the utilization factor is 1. The factor am
indicates the fraction of zinc or aluminium in relation to the total anode
use in shipping or fisheries.
Table 5 shows the required current densities per component and per
type of vessel (Willems et al., 2003).
Required current density (mAmp/m2)
Hull Screw Rudder Turbine bow thruster
Bulk Carrier 12 700 150 120 700
VLCC (Very Large Crude oil
Carrier) 12 700 150 120 700
Coaster 12 700 250 120 700
Ro/Ro Ferries 12 700 150 120 700
Fishing 18 1000 250 120 700
Supply Vessel 18 1000 250 120 700
Work vessel 40 1400 250 120 700
Ice class vessel 20 1400 250 120 700
Container 12 1400 250 120 700
Reefer 12 700 150 120 700
Destroyer 12 700 150 120 700
Naval vessel 12 700 150 120 700
The table above can be used to calculate the leaching of anode
material. Because the surface area and number of screws, rudders,
turbines and bow thrusters is not known for each vessel type, table 6 is
provided to be used for estimates (Willems et al., 2002). This table
shows the required current density for the hull including what is
necessary to protect the screws, rudders, turbines and bow thrusters.
. . . . . . . . . . . . . . . . . . . . . . . . . . . . . . . . . . .
Equation 2 Dwight's equation for the calculation of the number of anodes required on a ship
. . . . . . . . . . . . . . . . . . . . . . . . . . . . . . . Table 5 Required electrical current density by component of and by type of ship
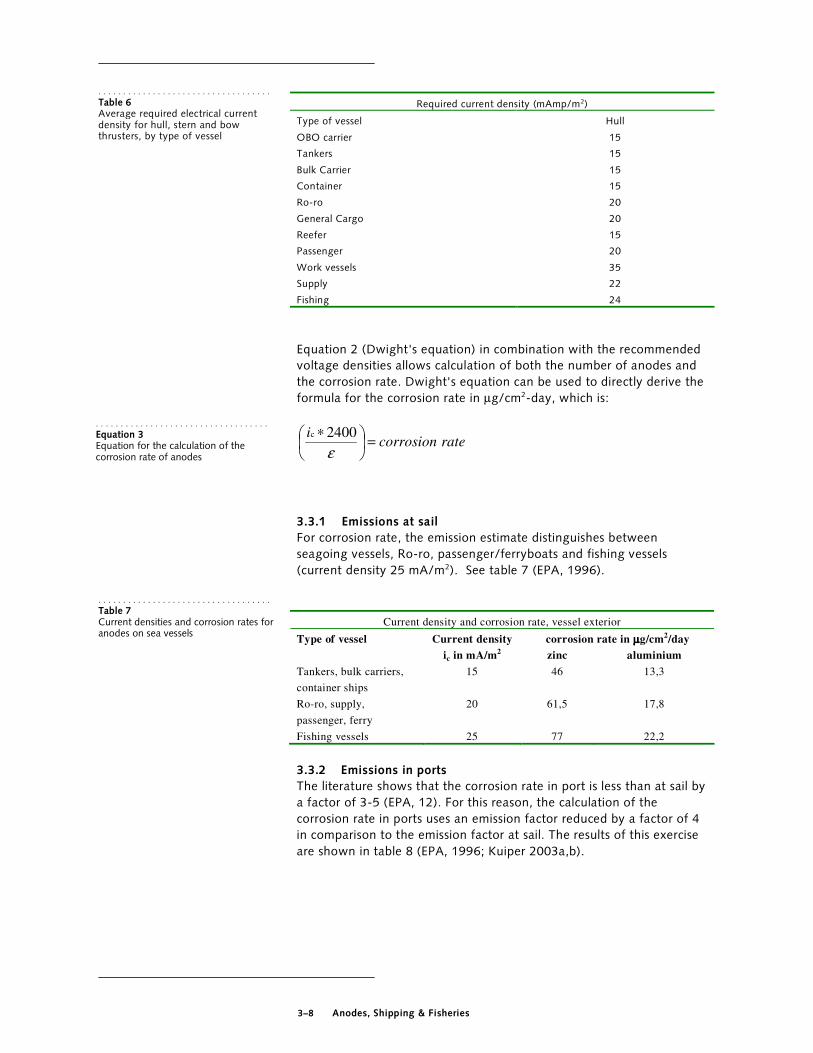
3–8 Anodes, Shipping & Fisheries
Required current density (mAmp/m2)
Type of vessel Hull
OBO carrier 15
Tankers 15
Bulk Carrier 15
Container 15
Ro-ro 20
General Cargo 20
Reefer 15
Passenger 20
Work vessels 35
Supply 22
Fishing 24
Equation 2 (Dwight's equation) in combination with the recommended
voltage densities allows calculation of both the number of anodes and
the corrosion rate. Dwight's equation can be used to directly derive the
formula for the corrosion rate in µg/cm2-day, which is:
ratecorrosioni
=
∗ε2400c
3.3.1 Emissions at sail
For corrosion rate, the emission estimate distinguishes between
seagoing vessels, Ro-ro, passenger/ferryboats and fishing vessels
(current density 25 mA/m2). See table 7 (EPA, 1996).
Current density and corrosion rate, vessel exterior
corrosion rate in µµµµg/cm2/day Type of vessel Current density
ic in mA/m2 zinc aluminium
Tankers, bulk carriers,
container ships
15 46 13,3
Ro-ro, supply,
passenger, ferry
20 61,5 17,8
Fishing vessels 25 77 22,2
3.3.2 Emissions in ports
The literature shows that the corrosion rate in port is less than at sail by
a factor of 3-5 (EPA, 12). For this reason, the calculation of the
corrosion rate in ports uses an emission factor reduced by a factor of 4
in comparison to the emission factor at sail. The results of this exercise
are shown in table 8 (EPA, 1996; Kuiper 2003a,b).
. . . . . . . . . . . . . . . . . . . . . . . . . . . . . . . . . . .
Table 6 Average required electrical current density for hull, stern and bow thrusters, by type of vessel
. . . . . . . . . . . . . . . . . . . . . . . . . . . . . . . . . . .
Equation 3 Equation for the calculation of the corrosion rate of anodes
. . . . . . . . . . . . . . . . . . . . . . . . . . . . . . . . . . .
Table 7 Current densities and corrosion rates for anodes on sea vessels
3–9 Anodes, Shipping & Fisheries
corrosion rate in
µµµµg/cm2/day
Type of vessel Current density
ic in mA/m2
zinc aluminium
Seagoing vessels 3,8 11,5 3,3
Fishing vessels 6,3 19,3 5,6
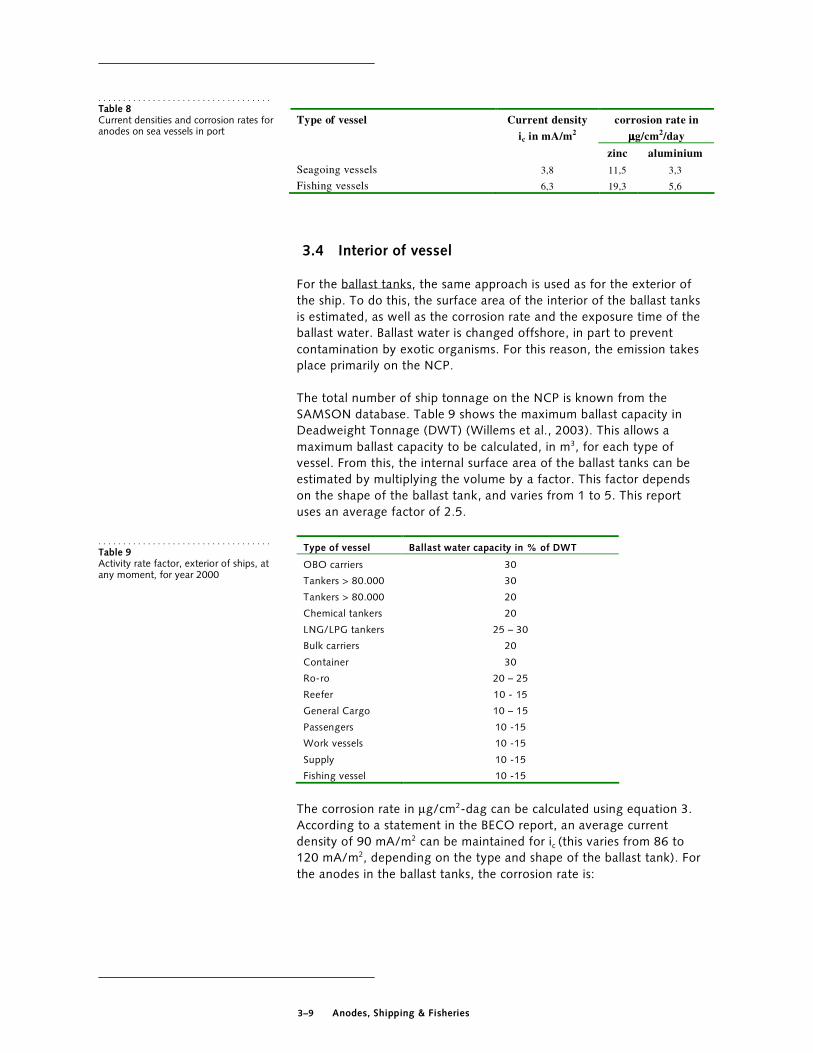
3.4 Interior of vessel
For the ballast tanks, the same approach is used as for the exterior of
the ship. To do this, the surface area of the interior of the ballast tanks
is estimated, as well as the corrosion rate and the exposure time of the
ballast water. Ballast water is changed offshore, in part to prevent
contamination by exotic organisms. For this reason, the emission takes
place primarily on the NCP.
The total number of ship tonnage on the NCP is known from the
SAMSON database. Table 9 shows the maximum ballast capacity in
Deadweight Tonnage (DWT) (Willems et al., 2003). This allows a
maximum ballast capacity to be calculated, in m3, for each type of
vessel. From this, the internal surface area of the ballast tanks can be
estimated by multiplying the volume by a factor. This factor depends
on the shape of the ballast tank, and varies from 1 to 5. This report
uses an average factor of 2.5.
Type of vessel Ballast water capacity in % of DWT
OBO carriers 30
Tankers > 80.000 30
Tankers > 80.000 20
Chemical tankers 20
LNG/LPG tankers 25 – 30
Bulk carriers 20
Container 30
Ro-ro 20 – 25
Reefer 10 - 15
General Cargo 10 – 15
Passengers 10 -15
Work vessels 10 -15
Supply 10 -15
Fishing vessel 10 -15
The corrosion rate in µg/cm2-dag can be calculated using equation 3.
According to a statement in the BECO report, an average current
density of 90 mA/m2 can be maintained for ic (this varies from 86 to
120 mA/m2, depending on the type and shape of the ballast tank). For
the anodes in the ballast tanks, the corrosion rate is:
. . . . . . . . . . . . . . . . . . . . . . . . . . . . . . . . . . .
Table 8 Current densities and corrosion rates for anodes on sea vessels in port
. . . . . . . . . . . . . . . . . . . . . . . . . . . . . . . . . . .
Table 9 Activity rate factor, exterior of ships, at any moment, for year 2000

3–10 Anodes, Shipping & Fisheries
Corrosion rate in
µµµµg/cm2/day
Current
density ic in
mA/m2 zinc aluminium
All vessels 90 276 79,8
For the fraction of the time that ballast water is in the ballast tank,
BECO estimates a factor of 0.35. An estimate of the discharge on the
NCP is made as follows. In practice, not all ships will change ballast water
on the NCP. It is assumed that of all ships on the NCP, a maximum of
50% sail to ports in the Netherlands, while the other half sailed from
Dutch ports. A few will not call in the Netherlands at all. Consequently, it is
assumed that a maximum of 50% of the ships change their ballast water
on the NCP (these being the ships that sailed to Dutch ports in ballast to
pick up cargo).
. . . . . . . . . . . . . . . . . . . . . . . . . . . . . . . . . . .
Table 10 Corrosion rate of anodes in ballast tanks
4–1 Anodes, Shipping & Fisheries
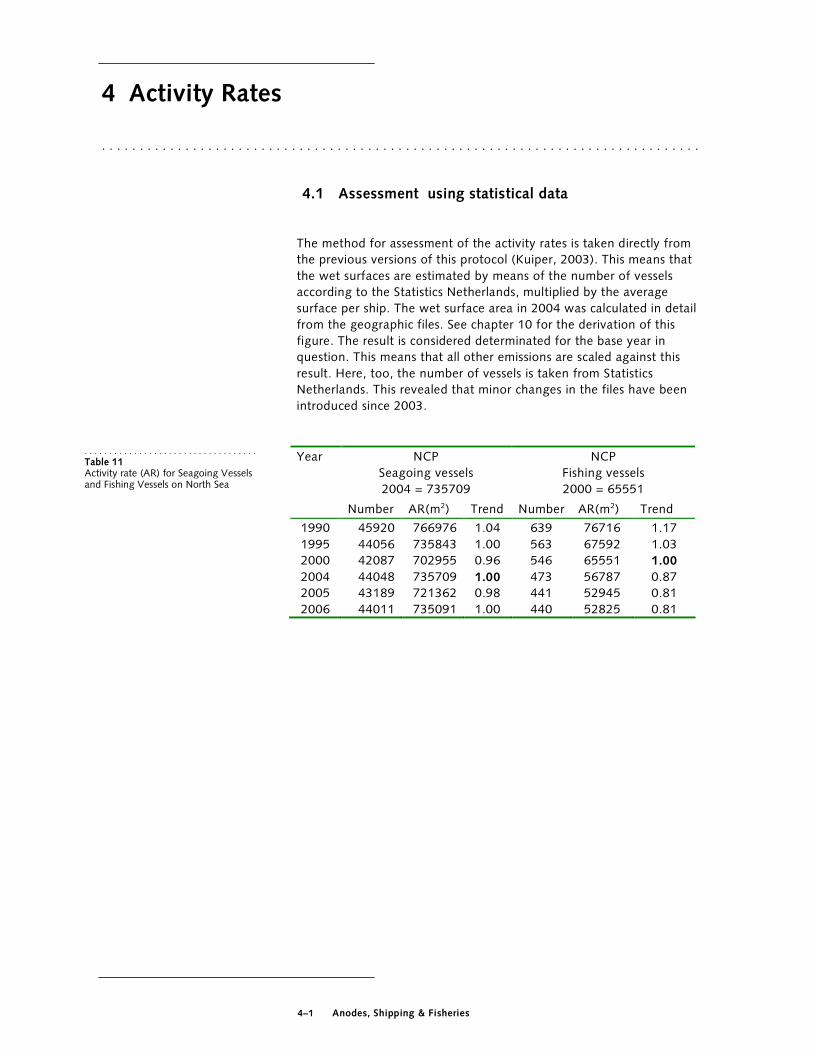
4 Activity Rates
. . . . . . . . . . . . . . . . . . . . . . . . . . . . . . . . . . . . . . . . . . . . . . . . . . . . . . . . . . . . . . . . . . . . . . . . . . . . . . .
4.1 Assessment using statistical data
The method for assessment of the activity rates is taken directly from
the previous versions of this protocol (Kuiper, 2003). This means that
the wet surfaces are estimated by means of the number of vessels
according to the Statistics Netherlands, multiplied by the average
surface per ship. The wet surface area in 2004 was calculated in detail
from the geographic files. See chapter 10 for the derivation of this
figure. The result is considered determinated for the base year in
question. This means that all other emissions are scaled against this
result. Here, too, the number of vessels is taken from Statistics
Netherlands. This revealed that minor changes in the files have been
introduced since 2003.
NCP
Seagoing vessels
2004 = 735709
NCP
Fishing vessels
2000 = 65551
Year
Number AR(m2) Trend Number AR(m2) Trend
1990 45920 766976 1.04 639 76716 1.17
1995 44056 735843 1.00 563 67592 1.03
2000 42087 702955 0.96 546 65551 1.00
2004 44048 735709 1.00 473 56787 0.87
2005 43189 721362 0.98 441 52945 0.81
2006 44011 735091 1.00 440 52825 0.81
. . . . . . . . . . . . . . . . . . . . . . . . . . . . . . . . . . .
Table 11 Activity rate (AR) for Seagoing Vessels and Fishing Vessels on North Sea

4–2 Anodes, Shipping & Fisheries
NCP
Seagoing vessels
2004 = 735709
NCP
Fishing vessels
2000 = 65551
Year
Number AR(m2) Trend Number AR(m2) Trend
1990 45920 157792 632284 1,04 639 173677 1,35
1995 44056 151387 606618 1,00 563 153021 1,19
2000 42087 144621 579506 0,96 546 148400 1,15
2004 44048 151360 606508 1,00 473 128559 1,00
2005 43189 148408 594680 0,98 441 119862 0,93
2006 44011 151232 605998 0,99 440 119590 0,93
The figures above are compiled from the totals of the figures for Dutch
seaports. This total is higher than the annual total figure published by
Statistics Netherlands, because a ship may call at multiple ports. The
figures above include all calls. The data goes back to the year 1996. For
years prior to 1996 Statistics Netherlands does not publish online
statistics, so these figures are estimates. The following ports are included: Amsterdam, Delfzijl en Eemshaven,
Dordrecht, Harlingen, IJmuiden, Klundert, Moerdijk, Rotterdam,
Scheveningen, Terneuzen, Vlaardingen, Vlissingen, Zevenbergen and
Zaanstad.
. . . . . . . . . . . . . . . . . . . . . . . . . . . . . . . . . . .
Table 12 Activity rate (AR) for Seagoing Vessels and Fishing Vessels on North Sea

4–3 Anodes, Shipping & Fisheries
4.2 Interior of vessel
The activity rate factor for the ballast tanks is the internal surface area
of the tanks in the ships present on the NCP on average permanently.
The calculation of this surface area assumes that 50% of ships are
transporting ballast water, and change this ballast water on the NCP.
The calculation of the wet surface of ballast tanks is directly related to
the wet surface of the ships.
Vessel type AR
(m2)
Factor
%
WSA ballast
(m2)
Anchored vessel 150421 10 15042
Bulker 79728 20 15946
Chemical 67290 20 13458
Container 107886 25 26971
General Dry Cargo 131388 10 13139
Gas tanker
(LPG/LNG) 14763 25 3691
Miscellaneous 7191 10 719
Ore/Bulk/Oil 5574 25 1394
Oil 73725 25 18431
Pass./Ferry 13153 10 1315
Roll-on/Roll-off (ro-
ro) 70749 20 14150
Tug/supply 3416 10 342
Floating workstation 10423 10 1042
Fishery 56787 18 10222
Total
. . . . . . . . . . . . . . . . . . . . . . . . . . . . . . . . . . .
Table 13 Activity rate for seagoing vessels and fishing vessels from ballast tanks in 2004

4–4 Anodes, Shipping & Fisheries
4.3 Time series, 1990-present
The table below shows the time series for the activity rates for the
internal surface area of the ballast tanks.
Year Trend Seagoing
vessels
AR(m2)
Trend Fishing vessels
AR(m2)
1990 1,04 128874 1,35 11963
1995 1,00 123643 1,19 10540
2000 0,96 118117 1,15 10222
2004 1,00 123620 1,00 8855
2005 0,98 121210 0,93 8256
2006 0,99 123516 0,93 8237
The 2004 figures for the above table were determined using the spatial
allocation database. The other figures were determined based on the
trends in number of seagoing vessels and fishing vessels.
4.4 Time series, present-2027
The trend in the activity rate (wet ship area) is dependent on two
factors: - trends in ship activities - trends in ship size
Ship activities A forecast for trends in ship movements can be based on CPB
scenarios. The scenario document Welvaart en leefomgeving (CPB et
al., 2006) outlines a trend in the quantity of goods stored in the ports.
The trend in ship movement (in tonne-km) is assumed to be directly
related to this stored quantity of goods.
The Global Economy scenario is selected, which entails the assumption
that during the period from 2002 to 2040, shipping activities will more
than double (2% growth per year).
In the same period, the fisheries sector is expected to shrink 50% (2%
per year until 2040).
Trend in vessel size Trends in vessel size are important for tracking the development of
emissions from anodes. Growth in average vessel size means a decrease
in total wet surface (at equal total tonnage), because larger ships have
relatively less surface area than smaller ships. The development of
vessel size per vessel type is based on trends in average vessel size over
the past 20 years. Looking at these trends reveals that for a number of
vessel types, there has been no growth in this period, while others have
grown by 20-30%.
- Vessel types that have seen no significant growth are: Tankers
for chemicals and oil products, bulk carriers, reefers and
. . . . . . . . . . . . . . . . . . . . . . . . . . . . . . . . . . .
Table 14 Activity rates for ballast tanks for the years 1990-2006
4–5 Anodes, Shipping & Fisheries
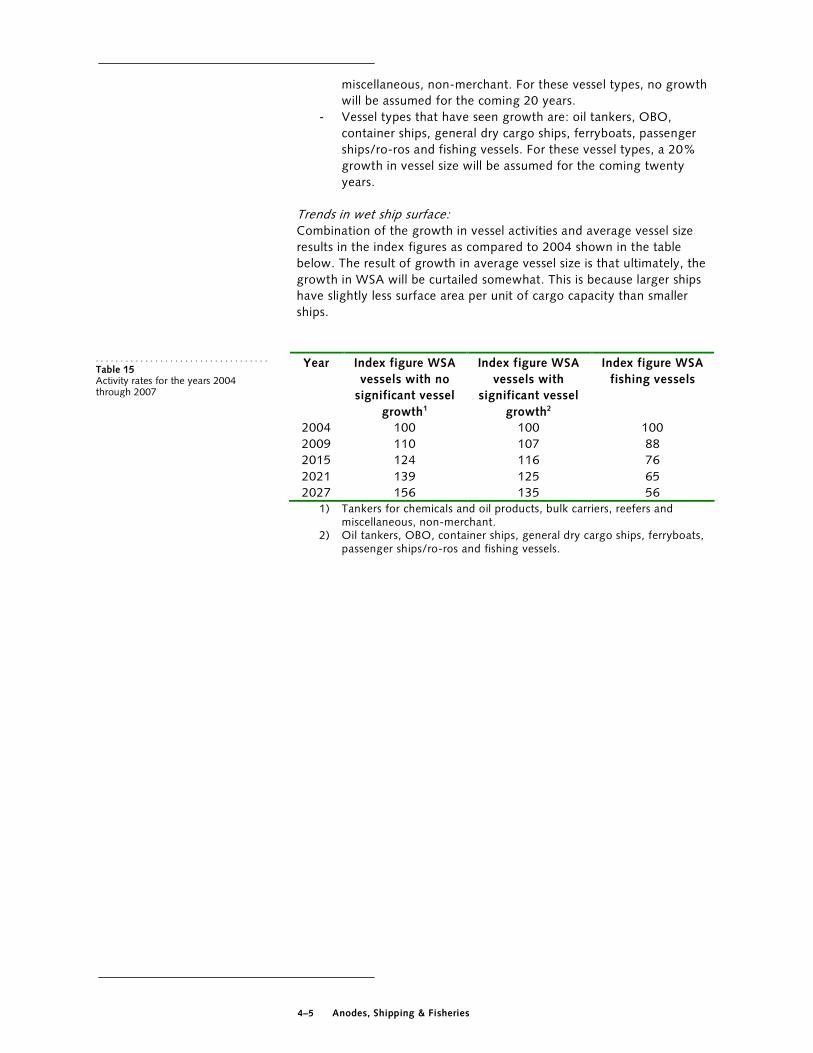
miscellaneous, non-merchant. For these vessel types, no growth
will be assumed for the coming 20 years.
- Vessel types that have seen growth are: oil tankers, OBO,
container ships, general dry cargo ships, ferryboats, passenger
ships/ro-ros and fishing vessels. For these vessel types, a 20%
growth in vessel size will be assumed for the coming twenty
years.
Trends in wet ship surface: Combination of the growth in vessel activities and average vessel size
results in the index figures as compared to 2004 shown in the table
below. The result of growth in average vessel size is that ultimately, the
growth in WSA will be curtailed somewhat. This is because larger ships
have slightly less surface area per unit of cargo capacity than smaller
ships.
Year Index figure WSA
vessels with no
significant vessel
growth1
Index figure WSA
vessels with
significant vessel
growth2
Index figure WSA
fishing vessels
2004 100 100 100
2009 110 107 88
2015 124 116 76
2021 139 125 65
2027 156 135 56 1) Tankers for chemicals and oil products, bulk carriers, reefers and
miscellaneous, non-merchant. 2) Oil tankers, OBO, container ships, general dry cargo ships, ferryboats,
passenger ships/ro-ros and fishing vessels.
. . . . . . . . . . . . . . . . . . . . . . . . . . . . . . . . . . .
Table 15 Activity rates for the years 2004 through 2007

4–6 Anodes, Shipping & Fisheries
4.5 Annual data setting
Source for annual updating of data
The assumed data on the number of calling ships and the size of the
fishery fleet are updated annually against actual figures from Statistics
Netherlands.
The emissions calculated can be easily updated based on recent annual
figures of the number of calls of seagoing and fishing vessels. These
figures are published annually by Statistics Netherlands.
Description of data supply pathway
The data can be obtained from Statistics Netherlands in two ways. The
first is with the assistance of Statistics Netherlands help desk, which is
available to take questions on any published figures by phone and e-
mail. The second method is to use Statistics Netherlands's StatLine
database, which can be accessed via the internet. The data required are
found under the main group Bedrijfsleven ("Industry") by selecting the sub-groups Verkeer, vervoer en communicatie ("Traffic, transport and communication" and then Personen- en goererenvervoer ("Passenger and goods transport"). Under this group, select zeevaart ("sea transport") and then zeevaart, kwartaalcijfers ("sea transport, quarterly figures"). To obtain the correct figures, under the Periodes ("Periods") tab select the annual totals from 1996 through 2006, and under the
Belangrijkste Nederlandse havens ("Biggest Dutch ports") tab, select all
afzonderlijke zeehavens ("individual seaports"). Do not select
Nederland totaal (All Netherlands) under the "Biggest Dutch ports" tab
(this would exclude duplicate records).
For the fishery fleet, select the main group Bedrijfsleven ("Industry") and then the group Landbouw en visserij ("Agriculture and fisheries").
Then select Visserij ("Fisheries"). Under this group, select Zee- en kustvisserij ("Sea and coastal fisheries"). To obtain the correct figures, under the tab Onderwerpen ("Subjects"), select Vloot ("Fleet") and then Aantal schepen ("Number of ships"). All types must be selected.
Under the Periodes ("Periods") tab, select the desired years. Use of this database and the help desk is free. StatLine does not include
any figures for sea transport and traffic from before 1996. Older figures
may be requested from the information desk.

4–7 Anodes, Shipping & Fisheries
Sources for updating of spatial distribution data
If the spatial allocation must be updated, two data sources are required:
1. For the Dutch shipping lanes and ports, the database for
calculation of air emissions must be used.
2. To update spatial distribution data on the NCP, the MARIN
traffic and transport database must be used.
Both of these functions will most likely require specialist assistance.
For the calculation of the underwater surface area on the NCP, the
traffic and transport database from the risk model SAMSON is the
source for periodic updating against actual figures.
Calculation of the wet surface area of the ships relies on the data from
the SAMSON traffic and transport database. The basic data for the
traffic and transport database over the year 2004 were derived from
Lloyds. In view of their high cost, these basic data will only be
purchased periodically. Updating of the Lloyds database does not result
in major changes in wet ship area. MARIN converts the Lloyds data into
a traffic and transport database. In the future, this database will be
based on AIS data (whether or not this data will still have to be
acquired from Lloyds is uncertain). The traffic and transport database is
available from MARIN or the Traffic and Transport Advisory Service
AVV (E. Bolt). Up to now, the Lloyds database has been used to create
a new traffic and transport database approximately once in four years.

5–8 Anodes, Shipping & Fisheries
5 Description of emission pathways to water
. . . . . . . . . . . . . . . . . . . . . . . . . . . . . . . . . . . . . . . . . . . . . . . . . . . . . . . . . . . . . . . . . . . . . . . . . . . . . . .
The anodes emissions source has the spatial character of a diffuse
source. As a whole, the emission source can be essentially considered a
line source along the seaways on the NCP, with the strength
proportional to the annual wet ship area travelling those pathways
annually. The fisheries sector is an additional diffuse source. Depending
on size, the ports can be considered a point source (small ports) or an
area source (large ports).

6–1 Anodes, Shipping & Fisheries
6 Emission factors
. . . . . . . . . . . . . . . . . . . . . . . . . . . . . . . . . . . . . . . . . . . . . . . . . . . . . . . . . . . . . . . . . . . . . . . . . . . . . . .
6.1 Emission factors
For the ship’s shell and ballast tanks, the emission factor is compiled
from the corrosion rate of the anode material and the factors exposure
time and level of application of the anode material in question (zinc or
aluminium).
The emission factors for the various components are shown in table 16.
corrosion rate in
µg/cm2/day
Exposure
Days/year
Application factor Emission factor
kg/m2-year
Type of
vessel
zinc aluminium zinc aluminium zinc aluminium
Exterior of vessel
Tankers,
bulk
carriers,
container
ships
46 13,3 365 0.7 0.125 0,1175
0,0607
Ro-ro,
supply,
passenger,
ferry
61,5 17,8 365 0,7 0,125 0,1571 0,0812
Fishing
vessels
77 22,2 365 0,2 0,1 0,1967 0,1013
Ballast tanks
All vessels 276 79,8 128 0,1 0,3 0,0353 0,0306
corrosion rate in
µg/cm2/day
Exposure
Days/year
application factor Emission factor
g/m2/year
Type of
vessel
zinc aluminium zinc aluminium zinc aluminium
Seagoing
vessels
11,5 3,3 (~1,5)* 0,7 0,125 0,12 0,0062
Fishing
vessels
19,3 5,6 (~160)* 0,2 0,1 6,16 0,88
*) See chapter 10
. . . . . . . . . . . . . . . . . . . . . . . . . . . . . . . . . . .
Table 16 Emission factors for anodes on the exterior and interior of the vessel
Table 17 Emission factors for anodes on sea vessels in port

6–2 Anodes, Shipping & Fisheries
6.2 Application percentages
In practice, zinc and aluminium anodes are used. Additionally, IC
systems are used, and these systems cause no emissions. Percentages
used on the exterior of seagoing vessels are as follows (Willems et al.,
2003):
• 70.0% zinc anodes
• 12.5% aluminium anodes
• 17.5% ICCP systems
The proportion of cathodic protection systems in use by fishing vessels
is different than that of other seagoing vessels. IC systems are used in
70% of cases. For fishing vessels, the percentages are (Willems et al.,
2003):
• 20% zinc anodes
• 10% aluminium anodes
• 70% ICCP systems
Not all ships use anodes in their ballast tanks. 40% of ballast tanks are
equipped with anodes, while the other 60% use only coating
protection. Of the ballast tanks equipped with anodes, some are coated
and some are not. No information is available on percentages. The
percentages of anode materials in ballast tanks are (Willems et al.,
2003):
• 60% no anodes
• 30% aluminium anodes
• 10% zinc anodes
6.3 Time series, 1990-present
Ascertaining trends in application percentages will require further
research, mainly in the degree of use of materials. Such research could
be carried out by means of a survey among ships. This would require
considerable effort. So far, figures for the years from 1990 to the
present have been based on an assumption of the emission factors in
tables 16 and 17.
6.4 Annual data setting
There are no other estimates for the emission of zinc originating from
the corrosion of anode material on vessels for the NCP. In the coming
years, attention can be devoted to the trend in the application of the
type of cathodic protection (zinc, aluminium, IC systems) as well as
methods of handling ballast water.

7–1 Anodes, Shipping & Fisheries
7 Emissions calculated
. . . . . . . . . . . . . . . . . . . . . . . . . . . . . . . . . . . . . . . . . . . . . . . . . . . . . . . . . . . . . . . . . . . . . . . . . . . . . . .
7.1 Emission figures 2004
Emissions for 2004 for the ships of the spatial distribution database are
as follows:
Process description Zinc Cadmium Aluminium
Anodes on exterior of seagoing vessels sailing on NCP 90625 45 4680
Anodes on ballast tanks of seagoing vessels sailing on NCP 4367 2 3788
Anodes on exterior of seagoing vessels sailing from/to/in ports 18269 9 943
Anodes on exterior of seagoing vessels in port 17831 9 910
Subtotal, seagoing vessels 131093 66 10321
Anodes on exterior of fishing vessels sailing on NCP 3193 2 460
Anodes on ballast tanks of fishing vessels sailing on NCP 361 0,2 313
Anodes on exterior of fishing vessels in port 1811 1 263
Subtotal, fishing vessels 5204 3 897
7.2 Emissions 1990-2006
Tables 19, 20 and 21 show emissions by the anodes on the exterior and
interior of the vessel for the years 1990 through 2006.
Process description 1990 1995 2000 2005 2006
Anodes on exterior of seagoing vessels
sailing on NCP 94477 90642 86591 88858 90549
Anodes on ballast tanks of seagoing
vessels sailing on NCP 4553 4368 4173 4282 4364
Anodes on exterior of seagoing vessels
sailing from/to/in ports 19045 18272 17456 17913 18253
Anodes on exterior of seagoing vessels
in port 18589 17835 17037 17484 17816
Subtotal, seagoing vessels 136664 131117 125257 128536 130983
Anodes on exterior of fishing vessels
sailing on NCP 4313 3800 3685 2977 1685
. . . . . . . . . . . . . . . . . . . . . . . . . . . . .
Table 18 Emission by anodes on the exterior and interior of the vessel in 2004 (kg/year)
. . . . . . . . . . . . . . . . . . . . . . . . . . . . .
Table 19 Emission of zinc by anodes on the exterior and interior of the vessel since 1990 (kg/year)
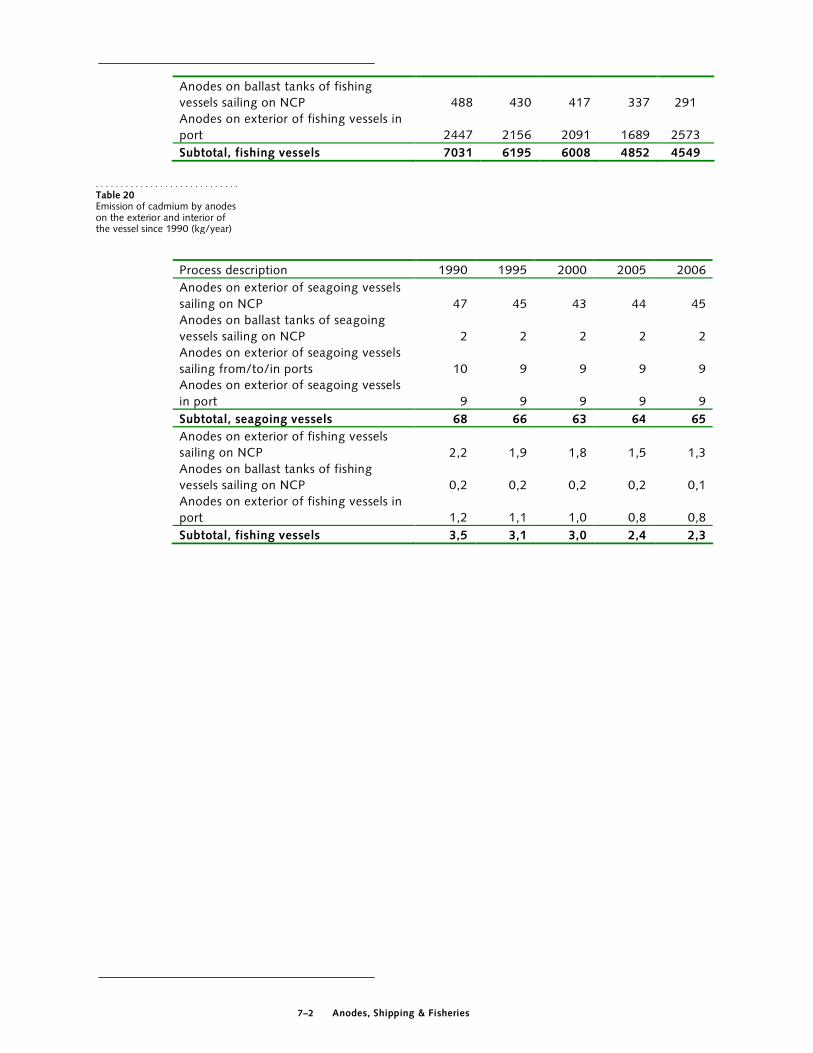
7–2 Anodes, Shipping & Fisheries
Anodes on ballast tanks of fishing
vessels sailing on NCP 488 430 417 337 291
Anodes on exterior of fishing vessels in
port 2447 2156 2091 1689 2573
Subtotal, fishing vessels 7031 6195 6008 4852 4549
Process description 1990 1995 2000 2005 2006
Anodes on exterior of seagoing vessels
sailing on NCP 47 45 43 44 45
Anodes on ballast tanks of seagoing
vessels sailing on NCP 2 2 2 2 2
Anodes on exterior of seagoing vessels
sailing from/to/in ports 10 9 9 9 9
Anodes on exterior of seagoing vessels
in port 9 9 9 9 9
Subtotal, seagoing vessels 68 66 63 64 65
Anodes on exterior of fishing vessels
sailing on NCP 2,2 1,9 1,8 1,5 1,3
Anodes on ballast tanks of fishing
vessels sailing on NCP 0,2 0,2 0,2 0,2 0,1
Anodes on exterior of fishing vessels in
port 1,2 1,1 1,0 0,8 0,8
Subtotal, fishing vessels 3,5 3,1 3,0 2,4 2,3
. . . . . . . . . . . . . . . . . . . . . . . . . . . . .
Table 20 Emission of cadmium by anodes on the exterior and interior of the vessel since 1990 (kg/year)
7–3 Anodes, Shipping & Fisheries
Process description 1990 1995 2000 2005 2006
Anodes on exterior of seagoing vessels
sailing on NCP 4879 4681 4471 4589 4676
Anodes on ballast tanks of seagoing
vessels sailing on NCP 3949 3789 3619 3714 3785
Anodes on exterior of seagoing vessels
sailing from/to/in ports 983 943 901 925 943
Anodes on exterior of seagoing vessels
in port 948 910 869 892 909
Subtotal, seagoing vessels 10760 10323 9862 10120 10312
Anodes on exterior of fishing vessels
sailing on NCP 622 548 531 429 370
Anodes on ballast tanks of fishing
vessels sailing on NCP 423 373 362 292 252
Anodes on exterior of fishing vessels in
port 355 313 303 245 244
Subtotal, fishing vessels 1212 1068 1035 836 868
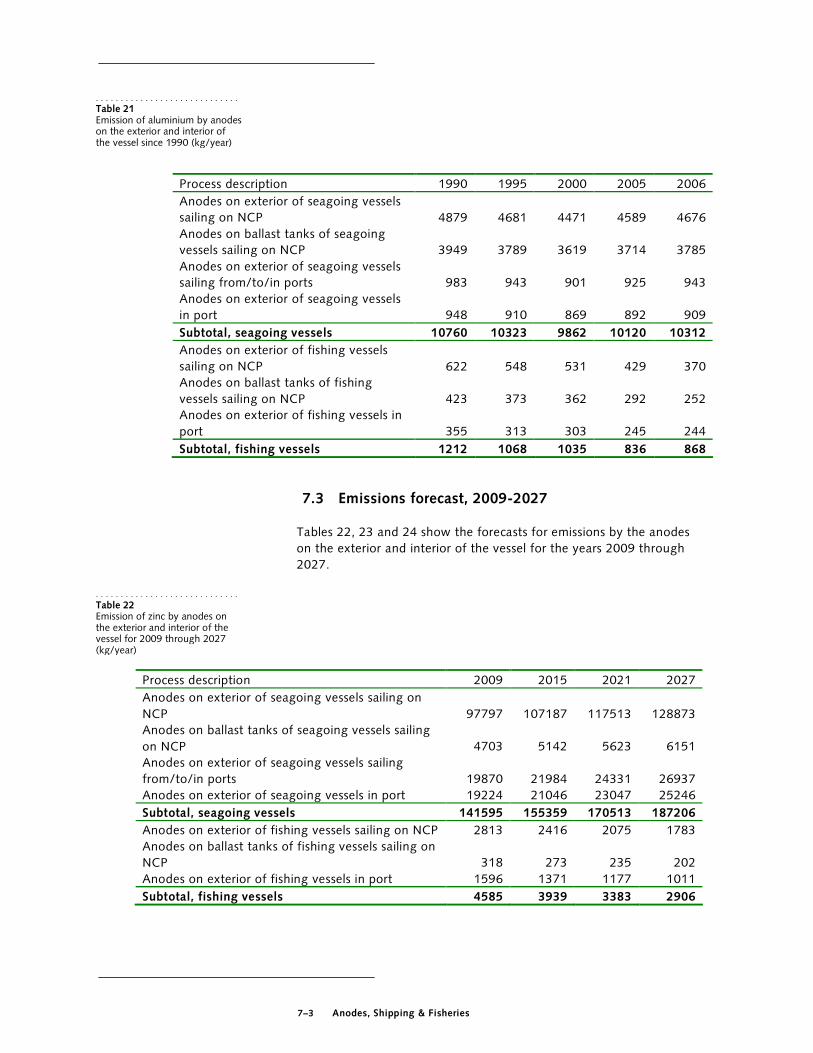
7.3 Emissions forecast, 2009-2027
Tables 22, 23 and 24 show the forecasts for emissions by the anodes
on the exterior and interior of the vessel for the years 2009 through
2027.
Process description 2009 2015 2021 2027
Anodes on exterior of seagoing vessels sailing on
NCP 97797 107187 117513 128873
Anodes on ballast tanks of seagoing vessels sailing
on NCP 4703 5142 5623 6151
Anodes on exterior of seagoing vessels sailing
from/to/in ports 19870 21984 24331 26937
Anodes on exterior of seagoing vessels in port 19224 21046 23047 25246
Subtotal, seagoing vessels 141595 155359 170513 187206
Anodes on exterior of fishing vessels sailing on NCP 2813 2416 2075 1783
Anodes on ballast tanks of fishing vessels sailing on
NCP 318 273 235 202
Anodes on exterior of fishing vessels in port 1596 1371 1177 1011
Subtotal, fishing vessels 4585 3939 3383 2906
. . . . . . . . . . . . . . . . . . . . . . . . . . . . .
Table 21 Emission of aluminium by anodes on the exterior and interior of the vessel since 1990 (kg/year)
. . . . . . . . . . . . . . . . . . . . . . . . . . . . .
Table 22 Emission of zinc by anodes on the exterior and interior of the vessel for 2009 through 2027 (kg/year)

7–4 Anodes, Shipping & Fisheries
Process description 2009 2015 2021 2027
Anodes on exterior of seagoing vessels sailing on
NCP 49 54 59 64
Anodes on ballast tanks of seagoing vessels sailing
on NCP 2 3 3 3
Anodes on exterior of seagoing vessels sailing
from/to/in ports 10 11 12 13
Anodes on exterior of seagoing vessels in port 10 11 12 13
Subtotal, seagoing vessels 71 78 85 94
Anodes on exterior of fishing vessels sailing on NCP 1,4 1,2 1,0 0,9
Anodes on ballast tanks of fishing vessels sailing on
NCP 0,2 0,1 0,1 0,1
Anodes on exterior of fishing vessels in port 0,8 0,7 0,6 0,5
Subtotal, fishing vessels 2,3 2,0 1,7 1,5
Process description 2009 2015 2021 2027
Anodes on exterior of seagoing vessels sailing on
NCP 5050 5535 6068 6655
Anodes on ballast tanks of seagoing vessels sailing
on NCP 4080 4460 4877 5335
Anodes on exterior of seagoing vessels sailing
from/to/in ports 1026 1135 1256 1391
Anodes on exterior of seagoing vessels in port 981 1074 1176 1288
Subtotal, seagoing vessels 11137 12204 13378 14669
Anodes on exterior of fishing vessels sailing on NCP 405 348 299 257
Anodes on ballast tanks of fishing vessels sailing on
NCP 276 237 204 175
Anodes on exterior of fishing vessels in port 232 199 171 147
Subtotal, fishing vessels 790 679 583 501
. . . . . . . . . . . . . . . . . . . . . . . . . . . . .
Table 23 E mission of cadmium by anodes on the exterior and interior of the vessel for 2009 through 2027 (kg/year)
. . . .
. . . . . . . . . . . . . . . . . . . . . . . . .
Table 24 E mission of aluminium by anodes on the exterior and interior of the vessel for 2009 through 2027 (kg/year)

8–5 Anodes, Shipping & Fisheries
8 Comments and changes in regard
to previous version
The methodology for determining the emissions is the same as the
previous version of the fact sheets (Kuiper, 2003a and 2003b). A few
mathematical errors in the calculation of the emissions from the ballast
tanks and fishing vessels were corrected. Additionally, the emissions
from ships sailing from/to/in Dutch ports were added, applying the
same emission factors as applied on the NCP. The emissions from
floating tank cooling were removed, because the floating tank cooling
system is not in general use.
No changes in the methodology were made for the 2008 emission
round.
8.1 Difference in figures due to mathematical errors
The tables below show the differences in figures for the years 1999 and
2000. Principally, the differences can be traced back to mathematical
errors in the derivation and/or application of the emission factors
presented in the previous version. This version uses the same corrosion
rates as the previous version.
This addresses the mathematical errors referred to in section 7.4.
Process description 1990
old
1990
new
2000
old
2000
new
Anodes on exterior of seagoing vessels sailing on
NCP 100,8 94,5 95,3 86,6
Anodes on ballast tanks of seagoing vessels sailing
on NCP 17,0 4,6 16,1 4,2
Anodes on exterior of seagoing vessels sailing
from/to/in ports - 19,0 - 17,5
Anodes on exterior of seagoing vessels in port 24,6 18,6 23,2 17,0
Subtotal, seagoing vessels 142,4 136,7 134,6 125,3
Anodes on exterior of fishing vessels sailing on NCP 4,5 4,3 3,7 3,9
Anodes on ballast tanks of fishing vessels sailing on
NCP 2,5 0,5 2,3 0,4
Anodes on exterior of fishing vessels in port 17,4 2,4 14,4 2,1
Subtotal, fishing vessels 24,4 7,2 20,4 6,4
. . . . . . . . . . . . . . . . . . . . . . . . . . . . .
Table 19 Emission of zinc by anodes on the exterior and interior of the vessel since 1990 (tonnes/year)

8–6 Anodes, Shipping & Fisheries
Process description 1990
old
1990
new
2000
old
2000
new
Anodes on exterior of seagoing vessels sailing on
NCP 50 47 48 43
Anodes on ballast tanks of seagoing vessels
sailing on NCP 8 2 8 2
Anodes on exterior of seagoing vessels sailing
from/to/in ports - 10 - 9
Anodes on exterior of seagoing vessels in port 12 9 12 9
Subtotal, seagoing vessels 70 68 68 63
Anodes on exterior of fishing vessels sailing on
NCP 2,6 2,2 2 1,8
Anodes on ballast tanks of fishing vessels sailing
on NCP 1,2 0,2 1,1 0,2
Anodes on exterior of fishing vessels in port 9 1,2 7 1,1
Subtotal, fishing vessels 12,8 4,1 10,1 3,5
. . . . . . . . . . . . . . . . . . . . . . . . . . . . ..
Table 20 Emission of cadmium by anodes on the exterior and interior of the vessel since 1990 (kg/year)

8–7 Anodes, Shipping & Fisheries
Process description 1990
old
1990
new
2000
old
2000
new
Anodes on exterior of seagoing vessels sailing on
NCP 5,4 4,9 5,2 4,7
Anodes on ballast tanks of seagoing vessels sailing
on NCP 14,8 3,9 14,2 3,8
Anodes on exterior of seagoing vessels from/to/in
ports - 0,9 - 0,9
Anodes on exterior of seagoing vessels in port 1,3 0,9 1,3 0,9
Subtotal, seagoing vessels 21,5 10,6 20,7 10,3
Anodes on exterior of fishing vessels sailing on NCP 0,7 0,6 0,6 0,5
Anodes on ballast tanks of fishing vessels sailing on
NCP 2,1 0,4 2,0 0,4
Anodes on exterior of fishing vessels in port 1,6 0,4 1,4 0,3
Subtotal, fishing vessels 4,4 1,4 4 1,2
There are also known studies for other areas. These studies usually
assume the estimated amount of anodes on a ship, the estimated
lifetime of the anodes and the amount of anode material still present at
the end of the lifetime (or at time of replacement). Comparison with an
American study (EPA, 1996) by this method reveals results very much
similar results compared to the emission findings of this report. Based
on the previous version of this protocol, an estimate was made of
emissions on the entire North Sea (Walraven, 2006) using the number
of seagoing vessels calling in other countries. For the year 2000, the
emissions of zinc in the entire North Sea were estimated at just under
1,800 tonnes. In view of the intensity of shipping traffic on the NCP
and the ratio of the areas of the entire NCP and the entire North Sea,
this estimate on the part of Walraven appears to be too high. This
apparent overestimate is most likely due to the very high total number
of seagoing vessels calling at Danish and English seaports. The size of
vessels and time spent in port were not accounted for in that study.
. . . . . . . . . . . . . . . . . . . . . . . . . . . . .
Table 21 Emission of aluminium by anodes on the exterior and interior of the vessel since 1990 (kg/year)

9–1 Anodes, Shipping & Fisheries
9 Accuracy and indicated subjects for improvement
. . . . . . . . . . . . . . . . . . . . . . . . . . . . . . . . . . . . . . . . . . . . . . . . . . . . . . . . . . . . . . . . . . . . . . . . . . . . . . .
The above can be expressed in the classification system used in the
Emissieregistratie publication series (Van Harmelen, A.K., 2001). This
method is based on the CORINAIR (CORe emission INventories AIR)
methodology.
CORINAIR uses the following quality classifications:
A: a value based on a large number of measurements from representative
sources
B: a value based on a number of measurements from some of the sources
that are representative of the sector
C: a value based on a limited number of measurements, together with
estimates based on technical knowledge of the process
D: a value based on a small number of measurements, together with
estimates based on assumptions
E: a value based on a technical calculation on the basis of a number of
assumptions
The number of seagoing and fishing vessels on the NCP is carefully
tracked, which means a classification of A for that component of the
activity rate. The wet surface of the ships on the NCP is derived from
model-based estimates. In total, this results in a classification of B for the
activity rate.
The emission factors are based on recommendations drafted based on
technical knowledge and experience from practice. This means that we can
classify the emission factors in category C.
As far as the distribution of emissions among individual compartments and
emission pathways to water is concerned, it is clear that all the emissions
directly enter the surface water, so category A applies here. Spatial
allocation is further explained in chapter 10. Because this is fairly detailed,
it can be classified as category B.
Element of emission calculation Classification Activity rates B Emission factors C (E for ballast water) Distribution among compartments A Emission pathway to water A Spatial allocation B

9–1 Anodes, Shipping & Fisheries
The number of ships on the NCP in this study is established for the year
2004. So as to also be able to present figures for the years 1990
through 2006, this figure was compared to the Statistics Netherlands
annual figures for the total number of seagoing vessels calling at Dutch
ports. Both the figures of the Statistics Netherlands and Lloyds were
considered reliable, but a linear relationship between the number of
ships on the NCP and the number of ships calling at Dutch ports is not
assured.
There are no good data available on trends in the application of the
various alternatives for cathodic protection (choice of zinc, aluminium
or IC). The precise degree to which ballast water is changed on the
NCP is not known.
Information on the number of vessels on the NCP and their underwater
surface area is only known for the year 2004, and this data comes from
the Lloyds database. So as to still be able to present figures for the
years 1990 through 2006, a constant average surface (that for the year
2004) per ship was assumed.
Both the figures of the Statistics Netherlands and Lloyds were
considered reliable, but whether the data on the ships on the NCP can
be directly projected onto the ships in port is uncertain.
9.1 Most significant areas for improvement
Simply based on the above, the most significant areas for improvement
can be identified as follows (in order of importance):
- In a subsequent year, a study can be set up to establish trends in the
use of the various different types of cathodic protection over time;
- An attempt can be made to obtain a better picture of the exchange
of ballast water on the NCP and the use of zinc and aluminium
anodes.

10–1 Anodes, Shipping & Fisheries
10 Spatial allocation
. . . . . . . . . . . . . . . . . . . . . . . . . . . . . . . . . . . . . . . . . . . . . . . . . . . . . . . . . . . . . . . . . . . . . . . . . . . . . . .
10.1 Seagoing vessels and fishing vessels on NCP
The emissions per 5x5 km map square are determined using the wet
surface area (WSA) calculated per vessel type by MARIN using the
Lloyds traffic and transport database for the year 2004.
The traffic types this includes are:
- Route-specific shipping transport
- Ships at anchor
- Fishing vessels
- Work ships
For every ship sailing on the Dutch Continental Shelf (NCP), the
maximum wet surface area is calculated using the vessel dimensions
known from the Lloyds ship register. Where possible, this calculation
was based on the Mennen-Holtrop equation (equation 1); where this
was not possible due to the lack of data, calculation was based on the
derived method for determining WSA based on ship size in GT
(equation 2). The actual wet ship area was obtained after correction for
actual cargo using equation 3. MARIN then applied this data to the
traffic and transport database after first averaging across the SAMSON
vessel types and SAMSON vessel size classes. Next, a determination of
the location of each kilometre square (in which water body defined in
the Water Framework Directive the square is situated) was made. The
emissions were then calculated for each Water Framework Directive
water body.

10–2 Anodes, Shipping & Fisheries
Figures 7 through 11 below show the wet ship area of the four types of
shipping traffic in spatial terms.
. . . . . . . . . . . . . . . . . . . . . . . . . . . . . . . Figure 7 Distribution of the total wet underwater surface area of ships on the Dutch Continental Shelf (NCP).
. . . . . . . . . . . . . . . . . . . . . . . . . . . . . . .
. Figure 9 Distribution of the wet underwater surface area of ships at anchor on the Dutch Continental Shelf (NCP).
. . . . . . . . . . . . . . . . . . . . . . . . . . . . . . . Figure 8 Distribution of the wet underwater surface area of route-specific ships on the Dutch Continental Shelf (NCP).
. . . . . . . . . . . . . . . . . . . . . Figure 11 Distribution of the total wet underwater surface area of work ships on the Dutch Continental Shelf (NCP).
. . . . . . . . . . . . . . . . . . . . Figure 10 Distribution of the total wet underwater surface area of fishing vessels on the Dutch Continental Shelf (NCP).

10–3 Anodes, Shipping & Fisheries
10.2 Seagoing vessels in Dutch territory
Spatial allocation of the shipping emissions calculated was performed
based on the data on seagoing vessels calling at the major seaports.
In this calculation, a distinction is made by vessel type and the phase
the ship is in: sailing in, manoeuvring and in port. All basic data are
drawn from the EMS models for the calculation of air emissions. The
activity rates from the air module are expressed for these phases in GT-
km for sailing in, GT-hours for manoeuvring and GT for in port. These
quantities are assigned per port and per phase to shipping lane
segments from the database “Nationaal Wegenbestand” (NWB, a
publication of the Traffic and Transport Advisory Service, an agency of
the Ministry of Public Works & Water Management). The activities are
assigned to each port in proportion to the length of the shipping lane
segments traversed.
For each phase that the vessels sail in Dutch territory, a different
formula is used for the calculation of the average wet ship area (WSA)
present.
The formula for conversion of ships in port is:
GT * WSA/GT * Time in port / 8760
The GT of ships in port is derived from the file supplied by AVV for the
calculation of air emissions.
The formula for conversion of ships at sail is:
GT-km / Speed * WSA/GT / 8760
The GT-km of sailing ships is calculated using the model with which the
air emissions of sailing ships are calculated.
The formula for conversion of manoeuvring ships is:
GT-hours * WSA/GT / 8760
The GT-hours of manoeuvring ships is calculated using the model with
which the air emissions of manoeuvring ships are calculated.
Table 22 shows the factors used for conversion from GT to WSA.
Vessel type WSA/GT
(m2/GT)
Time in
port
(hours)
Speed
(km/hour)
Oil Tankers (Crude) 0,23 28 17,3
Other Tankers (Juice,
Chemical)
0,43 24
19,2
Bulk carriers 0,24 52 20
Container Ships 0,25 21 20,2
Conv. General Cargo 0,54 25 20,2
Ferries/Ro-ro 0,18 24 23,1
Reefers 0,51 31 24,8
Other Ships 0,5 46 26,3
. . . . . . . . . . . . . . . . . . . . . . . . . . . . . . . Table 22 Conversion factors for ships in port, manoeuvring and at sail, by wet surface

10–4 Anodes, Shipping & Fisheries
The red lines5 on the map below (figure 12) indicate which line
segments from the NWB are linked to the emissions from seagoing
vessels in port. GIS was used to determine what portion of a given
shipping lane segment falls within a given Water Framework Directive
water body. These segments were used to assign the emission to a
Water Framework Directive water body.
10.3 Fishing vessels in ports
The underwater surface area of fishing vessels in fishing ports is
determined using the LEI's VIRIS system, which records all fishing vessel
movements at sea. VIRIS does not record the number of days in port
directly. The number of days in port is 365.25 days (number of days in
the year) minus the number of sailing days. A ship may call at multiple
ports in the course of a year. The number of days in a specified port is
computed by multiplying the ratio of total number of journeys per year
to number of journeys from the port in question by the number of days
in port as calculated above. The number of days in a port is multiplied
by 24 to obtain the number of hours in that port.
The number of hours in a port is multiplied by 1.0*GT of ship to obtain
the underwater surface area. The underwater surface area is then
aggregated per port and divided by 8760 (hours per year).
5 The protruding line segments at Scheveningen and Goeree-
Overflakkee were left out of the database.
. . . . . . . . . . . . . . . . . . . . . . . . . . . . . . . Figure 12 : Seagoing vessels en route to ports and in Dutch ports and Emden

10–5 Anodes, Shipping & Fisheries
Table 23 shows the underwater surface area per fishery port in 2005,
and figure 13 shows the locations of the ports. The Water Framework
Directive area of each port is known. Not all ports are located in Water
Framework Directive areas that are classified as saline.
Port WSA6
Oostburg - Breskens 952
Schouwen Duiveland 51
Delfzijl 1770
Harlingen 19569
Den Helder 9199
Hemelumer-Oldeferd (municipality of Nyefurd) 20
IJmuiden 52300
Katwijk 3
Ulrum - Lauwersoog 5559
Terneuzen 19
Scheveningen - Den Haag 14577
Goedereede - Stellendam 6369
Stavoren (municipality of Nyefurd) 98
Terschelling 158
Texel 4320
Urk 253
Vlissingen 10309
Wonseradeel 116
Wieringen 2522
Yerseke 385
Zierikzee 10
128559
6 Corrected for calls of foreign fishing vessels (approx. 30 percent)
. . . . . . . . . . . . . . . . . . . . . . . . . . . . . . . Table 23 Average wet surface of fishing vessels present in fishing ports in 2005, (m2)

10–6 Anodes, Shipping & Fisheries
. . . . . . . . . . . . . . . . . . . . . . . . . . . . . . . Figure 13: Location of Fishing Ports

11–1 Anodes, Shipping & Fisheries
11 References
. . . . . . . . . . . . . . . . . . . . . . . . . . . . . . . . . . . . . . . . . . . . . . . . . . . . . . . . . . . . . . . . . . . . . . . . . . . . . . .
British Standard, (1991) BS 7361 Cathodic Protection, Part.1 Code of practice for land and marine applications
Centraal Bureau voor de Statistiek. (2003) Elektronische database Statline. Internetapplicatie.
CPB, MNP, RPB (2006), Welvaart en leefomgeving, een scenariodocument voor Nederland in 2040, Centraal Planbureau,
Milieu- en Natuurplanbureau en Ruimtelijk Planbureau, ISBN-13: 978-
90-6960-149-6
Det Norske Veritas (1993) DNV RP B401 Recommended Practice Cathodic Protection Design
Environmental Protection Agency. (1996) Nature of discharge report “Cathodic Protection
Glansdorp, C.C., Tak, C. van der. (1993) Modellering van de functie
"scheepvaart"in het MANS-project. MARAN&MSCN.
Harmelen, A.K. van et al. November 2001. Emissiemonitor, jaarcijfers 1999 en ramingen 2000 voor emissies en afval. Rapportage reeks milieumonitor nr. 2.
Hattum, B. van, Baart, A.C., Boon, J.G. (2002) Computer model to generate predicted environmental concentrations (PECs) for antifouling in the marine environment, 2nd edition accompanying the release of Mam-Pec version 1.4. rapportnr. E-02-04 / Z3117. IVM, Amsterdam WL, Delft.
Holtrop J., A (1977) Statistical Analysis of Performance Test Results. International Shipbuilding Progress, 1977, Vol 24, No. 270.
Kuiper, P.J.C. (2003a) EMS-protocol Emissies door Zeevaart en Visserij, Anodes op schepenop het NCP. RIZA-werkdocument nr. 2003.153X.
Kuiper P.J.C. (2003b), EMS-protocol Emissies door Zeevaart en Visserij, Anodes op schepen in havens. RIZA-werkdocument nr. 2003.153X.
Koivisto, S. (2003), Proposal for Finnish exposure scenarios for
antifouling products, Finnish Environment Institute, 2003
Man-Diesel (2002) Basic principles of ship propulsion, Man-Diesel
document P-254-04-04; http://www.manbw.com/article_003859.html

11–2 Anodes, Shipping & Fisheries
Nederlands Normalisatie-instituut (1996). NEN-EN 12496
“Opofferingsanodes voor kathodische bescherming in zeewater”,
Norsok. (1997) Norsok Standard M-503 Cathodic protection
OECD (2005) Emission scenario document on antifouling products, OECD Environmental Health and Safety Publications Series on Emission
Scenario Documents No. 13, Environment Directorate Organisation for
Economic Co-operation and Development, Paris, France
OSPAR (1992). Zinc inputs to the environment from sacrificial anodes used offshore and inland.
Roovaart, J.C. van den. (2002) Uitloging zeeschepen in havens. RIZA-
werkdocument nr. 2001.088X, volgnr. 3.
Tak, K van der (2006), personal communication, MARIN, Wageningen.
U.S. Military Specification (1987). MIL-A-18001J “Anodes, Corrosion
Preventive, Zinc; Slab, Disc and Rod Shaped”
Walraven, N., Assessing the input of various sources (riverine, direct
discharge, atmospheric and sea shipping) of Cu, Zn, Cd, TBT and
biocides to the Greater North Sea, Annex 1 of INPUT 06/4/1-
E(L),OSPAR (January,31-February,2, 2006)
Willems, M. et al. (2003) Uitloging van anodemateriaal van zeeschepen. BECO Groep BV, Rotterdam.
Willemsen P.R., Ferrari, G.M. (1992) Emissies van organotin naar Nederlandse oppervlaktewateren. TNO-rapport, rapportnr. C 92.1003.
Wulffraat, K.J. et al (1993). De belasting van de Noordzee met verontreinigende stoffen 1980 – 1990. Rapport DGW 93-037.