facundo alvaredo to cite this version
TRANSCRIPT

HAL Id: halshs-00586795https://halshs.archives-ouvertes.fr/halshs-00586795
Preprint submitted on 18 Apr 2011
HAL is a multi-disciplinary open accessarchive for the deposit and dissemination of sci-entific research documents, whether they are pub-lished or not. The documents may come fromteaching and research institutions in France orabroad, or from public or private research centers.
L’archive ouverte pluridisciplinaire HAL, estdestinée au dépôt et à la diffusion de documentsscientifiques de niveau recherche, publiés ou non,émanant des établissements d’enseignement et derecherche français ou étrangers, des laboratoirespublics ou privés.
Top incomes and earnings in Portugal 1936-2004Facundo Alvaredo
To cite this version:
Facundo Alvaredo. Top incomes and earnings in Portugal 1936-2004. 2008. �halshs-00586795�

WORKING PAPER N° 2008 - 17
Top incomes and earnings in Portugal 1936-2004
Facundo Alvaredo
JEL Codes: D3, H2, N3, O1 Keywords: top incomes, top wages, concentration,
Portugal
PARIS-JOURDAN SCIENCES ECONOMIQUES
LABORATOIRE D’ECONOMIE APPLIQUÉE - INRA
48, BD JOURDAN – E.N.S. – 75014 PARIS TÉL. : 33(0) 1 43 13 63 00 – FAX : 33 (0) 1 43 13 63 10
www.pse.ens.fr
CENTRE NATIONAL DE LA RECHERCHE SCIENTIFIQUE – ÉCOLE DES HAUTES ÉTUDES EN SCIENCES SOCIALES ÉCOLE NATIONALE DES PONTS ET CHAUSSÉES – ÉCOLE NORMALE SUPÉRIEURE

Top Incomes and Earnings in Portugal 1936-2004
Facundo Alvaredo Paris School of Economics and CREST
[email protected] This version: March 2008
Abstract This paper analyzes income and earnings concentration in Portugal from a long-run perspective using personal income and wage tax statistics. Our results suggest that income concentration was much higher during the 1930s and early 1940s than it is today. Top income shares estimated from reported incomes deteriorated during the Second World War, even if Portugal did not take active participation in the conflict. However, the magnitude of the drop was less important than in other European countries. The level of concentration between 1950 and 1970 remained relatively high compared to countries such as Spain, France, UK or the United States. The decrease in income concentration, started very moderately at the end of the 1960s and which accelerated after the revolution of 1974, began to be reversed during the first half of the 1980s. During the last fifteen years top income shares have increased steadily. The rise in wage concentration contributed to this process in a significant way. The evidence since 1989 suggests that the level of marginal tax rate at the top has not been the primary determinant of the level of top reported incomes. Marginal rates have stayed constant in a context of growing top shares. JEL classification: D3, H2, N3, O1 I thank Jose Albuquerque, Tony Atkinson, Catia Batista, Santiago Budría, Ana Rute Cardoso, Manoel João, Pedro Lains, Alfredo Pereira, Thomas Piketty, Carlos Farinha Rodrigues and Emmanuel Saez. Special acknowledgments go to António Manuel Sá Santos and the staff of the Centro de Estudos Fiscais at the Direcçao-Geral dos Impostos and the Instituto Nacional de Estatística (Lisbon).

1
1. Introduction
This paper analyzes the evolution of income and wage concentration in
Portugal between 1936 and 2004 using tax statistics and administrative records on
individual earnings. This research is strictly linked to the studies recently gathered
in Atkinson and Piketty, 2007, where series for shares of income accruing to
upper income groups have been constructed for the United States, Ireland, the
United Kingdom, Canada, New Zealand, Australia, Finland, France, Germany, the
Netherlands, Sweden and Switzerland. Research has also been done on the
experiences of Argentina, Spain, India, Japan, Sweden, Finland, Norway, China
and Indonesia.1 The case of Portugal is interesting on several grounds.
First, Portugal has undergone important changes in the political arena since
the beginning of the XXth century. After the decline and final collapse of the
constitutional monarchy, the First Republic was established in 1910. The
parliamentary regime was turbulent and unstable, with eight presidents, thirty-
eight prime ministers and a brief monarchy restoration over a seventeen-year
period.2 Participation in the First World War on the Entente side, large
government deficits, rapid monetary expansion and high inflation dominated the
scenario. The First Republic was ended in 1926 by a military coup, which installed
an authoritarian republic followed by seven years of institutional change. There
was no apocalyptic civil war as in Spain and the ultimate leader of the new regime
was not a general, but a university professor, António Salazar. The Second
Republic evolved to a right-wing dictatorship under the form of a single party
1 Aarberge and Atkinson, 2008, Atkinson, 2005, Atkinson and Leigh, 2007a,b, Banerjee and Piketty, 2005, Dell, 2007, Dell et al., 2007, Kopczuk and Saez, 2004, Leigh and van der Eng, 2007, Moriguchi and Saez, 2007, Nolan, 2007, Piketty, 2001, 2003, Piketty and Qian, 2006, Piketty and Saez, 2003, Piketty et al, 2006, Saez and Veall, 2005, Salverda and Atkinson, 2007, Riihelä et al, 2005, Roine and Waldenström, 2006. 2 For an account of the history of Portugal until the late 1960s, see Payne, 1972. See also Robinson, 1979 and Gallaher, 1983.

2
corporative regime.3 Due to the absence of the clear polarization of the Spanish
society, the authoritarian system developed in a framework of institutional
continuity. In 1928 Salazar was appointed ministry of finance, and in 1933 he
became prime minister, remaining in power until 1968. From the early 1930s to
the end of the 1950s, Portugal followed a policy of relative isolationism under a
corporatist socio-economic system (extensive state regulation and private
ownership of means of production). In the late 1950s, the regime shifted towards
a moderately outward looking policy, which inaugurated a period of rapid growth
until the beginning of the 1970s. Unlike Spain, Portugal was accepted into the
Marshall plan in 1947 and the NATO in 1949. In 1974 a left-wing military coup
put an end to the dictatorship. The revolutionary government granted
independence to the Portuguese colonies in Africa and Asia, set out on a course
of land expropriation and sweeping nationalization (banks, basic industries,
utilities, insurance companies, newspapers) and followed a policy of freezing
prices and rising wages.4 The process has been described as a successful challenge
to capitalist property.5 In 1975 the country held its first free multi-party elections
since 1926. By the beginning of the 1980s most of the reforms of the
revolutionary period started to be reversed, one of the motivating factors being
Portugal joining the European Communities, which happened in 1986. The
country adopted the Euro in 2002. The study of top incomes in Portugal provides
3 “[…] one of the greatest fallacies of the nineteenth century was that the English parliamentarism and English democracy were adaptable to every European country […]”, Salazar, 1939. 4 Between 1974 and 1975 more than 1,300 industrial companies were nationalized; for a detailed account of nationalizations in the industrial sector see Martins and Chaves Rosa, 1979. In less than six months 1.2 million hectares were expropriated in the southern and central provinces south of the Tagus river, that is, 13% of the country’s surface and 25% of total farm land. The occupation of large estates had begun even before a governmental decision gave it legal status through Decree-Law 203C/1975 and Decree-Law 207/1975 (see Barreto, 1983, 1987 and 1988). Two thousand houses were seized in the two weeks following the fall of the dictatorship, and only in February 1975 2,500 apartments were occupied in Lisbon alone (see Downs, 1983). A decollectivization process started modestly by the end of the 1970s and culminated with the reformed agrarian law enacted in 1988 (Law 109/1988 of 9/26/1988) and with the final setting of monetary compensations for original proprietors (Law 199/1988 of 5/31/1988). By the mid 1990s only one tenth of the expropriated estates was still in possession of collective farms. 5 See Bermeo, 1997.

3
new insights on the relationships between the political regimes and the evolution
of income concentration.
Second, from the economic point of view, Portugal underwent dramatic
changes over the last hundred years. During the first half of the XXth. century,
the country was an agricultural-based economy in which wine accounted for one
third of total agrarian output.6 In 1950s, GDP per capita was 15% lower than that
of Spain, 60% lower than that of France and 70% lower than in the United
Kingdom.7 Between the 1950s and the beginning of the 1970s the government
shifted towards mild liberalization policies and imposed a strategy aimed at
economic development and structural change; economic growth resumed at a
quicker pace. However, the growth rates of per capita income should be read with
caution in the light of important emigration flows between 1950 and the early
1980s.8 In the 1970s growth came to a halt, affected by the revolution of 1974, the
nationalization spree and the less favorable international conditions. Since the mid
1980s, the privatization of major financial and industrial conglomerates and the
fiscal and monetary policies followed to join the European Union started a period
of considerable modernization and growth. Today, Portugal’s GDP per capita is
about 30-35% lower than the GDP per capita of the largest western European
economies such as France, Germany or the United Kingdom, and about 20%
lower than the GDP per capita in Spain.9 As in the case of Spain, it is important to
analyze income concentration during the growth and stagnation years in order to
re-assess the link between economic development and income distribution.
Third, Portugal (as well as Spain) provides new evidence on the
relationship between economic integration and income concentration. As
6 Lains, 2003a,b argue that, despite its backwardness, the Portuguese economy had a good performance during the first half of the XXth century if compared to the previous fifty years. The economy expanded slowly under favorable external conditions before 1913, and expanded more rapidly when international economic conditions were less favorable after the First World War. Nevertheless, improvements were poor by Western European standards. See also Lains, 2003c. 7 Comparative data from Maddison, 2001, 2003. 8 The debate around the dynamic or stagnating features of the Estado Novo economic policy can be seen in Baklanoff, 1992, Hudson, 1989, ILO 1979 and Wheeler, 1990. 9 For an account of the economic evolution of Portugal during the XXth. century, see also Lains, 1995, Lopes 1994, 1996, Nunes et al., 1989 and Valério, 2001.

4
mentioned above, the country joined the European Union in 1986, after seven
years of gradual reforms for the dismantling of barriers to trade, capital and labor
mobility.
Finally, there are no studies on the evolution of inequality in Portugal from
a long-run historical perspective. Therefore, this study can be seen as the first
serious attempt at compiling systematic time series of income concentration using
primarily individual tax statistics, which have been completely ignored by previous
studies.10
A number of researchers have analyzed the evolution of income, earnings
and expenditure inequality during the last thirty years in Portugal based on two
types of sources: survey data and administrative records on wages and salaries. In
the following paragraphs we summarize the main findings, which point to a
reduction of income inequality and a sharp increase in earnings concentration
since the beginning of the 1980s.
Using micro-data from the 1980/1981 and 1990/1991 households’
surveys, Rodrigues, 1993, 1994, 1996 and Gouveia and Tavares, 1995 detect an
unambiguous decline in income inequality during the 1980s.11 In particular,
Rodrigues 1994 finds that wages and capital income would have raised inequality,
but their effects were nonetheless offset by the evolution of self-employees’
income and pensions. On the contrary, Gouveia and Tavares, 1995 argue that the
reduction in inequality during the 1980s could have been the result of the trade-
earnings argument acting in reverse in Portugal: increased trade with Europe
could have reinforced the country’s specialization in low-skilled activities and
therefore increased wages of unskilled workers. Nevertheless, the returns to
education augmented substantially during the years after joining the European
10 The first two households’ budget surveys were conducted in 1967/1968 and 1973/1974. As it is usually the case, the primary purpose of the surveys was to collect expenditure information required as input to the construction of the consumer price index. As a result, the 1967/1968 survey did not contain income information. The 1973/1974 survey did inquire about incomes. Descriptive results from these two first surveys can be found in Castinheira and Ribeiro, 1977, Rodrigues, 1988 and Silva, 1971, 1982. However, the micro-data for these first two surveys have not survived. Since the 1980/1981 survey, information has been collected on household income, household composition and other socioeconomic characteristics. 11 This conclusion relies on the comparison of both surveys, implying that it is not possible to rigorously establish the evolution of income inequality in the intermediate years.

5
Union, as shown in Hartog, Pereira and Vieria, 2001, providing no clear evidence
of a decline in the skill premium.12
Research has also been done on the basis of the European Community
Household Panel (ECHP). Rodrigues, 1999 compares the 1994/1995 households’
survey with the 1995 ECHP. Budría, 2007 analyzes in detail the ECHP between
1994 and 2001 and documents a reduction in earnings and income inequality as
well as a rise in the concentration of capital income during that period.
Several researchers have focused on earnings inequality. Based on the
employees’ administrative records that we also use as a data source in this paper,
Cardoso, 1998a analyzes the period 1983-1992 and finds that rising inequality
characterized the evolution of labor returns over the whole period, the upper part
of the earnings distribution playing a major role in shaping both the level and the
trend of inequality. One feature stands out: a stretched top, where dispersion
increased remarkably. The same tendency has been described in OECD, 1993 and
Ministéro do Emprego, 1992, which reports a 10 percent rise in the Gini index for
earnings from 1982 to 1989.13 Machado and Mata, 2001 and Hartog, Pereira and
Vieria, 2001 suggest that a substantial part of this increase must be attributed to
the returns to education, especially since joining the European Union.14
As we have already emphasized in Alvaredo and Saez, 2007, our series
measure only top income (or wage) concentration and hence are silent about
changes in the lower and middle part of the distribution. Therefore, our series can
very well follow different patterns when compared to global inequality measures
such as Gini coefficients or macro-based estimates. Additionally, it is worth
12 Batista, 2002 finds that the skill premium in Portugal has indeed fallen since the mid 1990s. 13 Other studies on income and earnings inequality in Portugal over the last decades include Albuquerque and Gouveia, 1994, Budría, 2008, Budría and Nunes, 2005, Budría and Pereira, 2007, 2008, Cantó et al, 2002, Cardoso, 1994, 1998b, 1999, 2006, Carneiro, 2007, Castanheira and Carvalho, 1997, Costa, 1994, Ferreira, 1992, Gouveia and Rodrigues, 2002, Hartog et al., 1999, Jimeno et al., 2000, Martins and Pereira, 2004, Rodrigues, 1996, 2005, 2008, Rodrigues et al., 2000, Santos, 1983, Teekens, 1990, Vieira, 1999, Viera, Couto and Tiago, 2006. Cardoso and Cunha, 2005 estimate aggregate wealth owned by Portuguese households between 1980 and 2004; however the authors do not deal with the distribution of wealth. Bover et al., 1998 study the Portuguese and the Spanish labor markets from a comparative perspective. 14 Murray and Steedman, 1998 analyze the evolution of workers’ skills in France, Germany, the Netherlands, Portugal, Sweden and the United Kingdom from a comparative perspective and show that the greatest change in the qualification of the young has taken place in Portugal.

6
remembering that the rich are usually missing from surveys either for sampling
reasons or because they refuse to cooperate with the time-consuming task of
completing or answering to a long form. This explains the fact that the dynamics
of top income shares estimated from tax statistics may not resemble those
deriving from survey data. In particular, high-income earners in our study are
much richer than those described in Budría, 2007, whose results are based on the
ECHP.15
Our results show that income concentration was much higher during the
1930s and 1940s than it is today. Top income shares stayed relatively stable
between the end of the Second World War and the end of the 1960s, followed by
a large drop that began to be reversed at the beginning of the 1980s. Over the last
fifteen years top income shares have increased significantly, and the rise in wage
concentration contributed to the process in an important way.
The paper is organized as follows. Section 5.2 describes our data sources
and outlines our estimation methods. In section 5.3 we present and analyze the
evolution of top income between 1936 and 2003. Section 5.4 focuses on earnings
concentration. Finally, section 5.5 offers a brief conclusion. The details on our
data and methods together with the complete set of results are presented in the
appendix.
2. Data and Methodological Issues
We study top income shares and wage concentration based on personal
income tax statistics, information from schedular taxes on wages and salaries, and
micro-data from administrative records on earnings.
2.1. Income
15 According to the results presented in Budría, 2007, an income of (in 2000 Euros) 62,760 was required in 2001 to belong to the top 1%, which had an average income of 75,879. Our estimations of top fractiles income levels show that the same group had an average income of 121,948, while an income of 62,760 only qualified as top 5-1%; see Table C. Budría’s unit of analysis is the household; ours is the tax unit defined in section 5.2.1.

7
Our estimates of top income shares are based on personal income tax
return statistics compiled by the Portuguese bureau of statistics and the tax agency
from 1936 to 1982 and between 1989 and 2003. Before 1976, because of high
exemption levels, only a small fraction of individuals had to file a tax return;
consequently we must restrict our analysis to the top 0.1% of the income
distribution. From 1976 on, we can analyze the top 10%. Complete details on the
methodology and data sources are provided in the appendix.
Our top groups are defined relative to the total number of tax units had
everyone been required to file a tax return. The unit to which the tax data relate is
the married couple, or single adult, or single minor with income in his or her own
right. Our reference total for tax units takes this fact into account. Consequently
the total number of tax units is defined as the number of all adult males and
females (aged 20 and over) less the number of married females. For example, in
2003, there are 8,201,000 adults in the Portuguese population, 5,581,000 tax units
and 3,979,000 tax files. The top 1% represents the top 55,810 tax filers. The
information is available for census years; intermediate years have been linearly
interpolated.
We define income as gross income before all deductions and including all
income items reported on personal tax returns: salaries and pensions, self-
employment and unincorporated business net income, dividends, interest, other
investment income and other smaller income items. Only a fraction of realized
capital gains is included in the tax base since 1989, and it is easy to satisfy the
conditions for capital gains to go untaxed. In particular, gains from public debt
bonds are exempted, as well as gains from stocks if kept for more than one year.
Capital gains from real estate are also untaxed if the proceeds are used to purchase
real estate property again. No information is available about the distribution of
reported capital gains. They are presumably very small. Our income definition is
before personal income taxes and personal payroll taxes but after employers’
payroll taxes and corporate income taxes. A detailed description of the evolution
of the income tax in Portugal between 1936 and 2003 concerning exemption

8
thresholds, family allowances, tax deductions and marginal tax rates is provided in
Table J and Table K in the appendix.
Our main data consists of tables displaying the number of tax returns and
the amounts reported (gross income, taxable income, tax paid) for a large number
of income brackets. As the top tail of the income distribution is very well
approximated by Pareto distributions, we use simple parametric interpolation
methods to estimate the thresholds and average income levels for each fractile.
The same method has been applied in Alvaredo and Saez, 2007 and in most of the
studies gathered in Atkinson and Piketty, 2007. Details of the estimation
technique and the adjustments made to the raw series are provided in the
appendix, respectively. We then estimate shares of income by dividing the income
amounts accruing to each fractile by our series of personal income, defined ideally
as total personal income reported on income tax returns had everybody been
required to file a tax return.16 The total income denominator, described in the
appendix, is mainly based on National Accounts statistics; the fact that only a
small fraction of tax units file a tax return (especially until 1988) implies that the
income denominator cannot be approximated by using income tax statistics
only.17
Table 1 gives thresholds and average incomes for a selection of fractiles in
Portugal in 2003. The average income is estimated primarily from National
Accounts and hence is independent of tax statistics and hence not biased
downwards because of tax evasion or avoidance.
2.2. Wages
The estimates of top wage income shares are based on two types of
sources: tax statistics, on the one side (the schedular tax on wages (until 1982) and
16 This methodology is based on the classical study of Kuznets, 1953 as well as on the studies presented in Atkinson and Piketty, 2007. 17 The methodology using tax returns to compute the level of top incomes, and using national accounts to compute the total income denominator is standard in historical studies of income inequality. However, it differs from Feenberg and Poterba, 1993, who use total income reported on tax returns as their denominator and the total adult population as the number of tax units.

9
the withholdings at the source on wage income for the modern income tax since
1989) and micro-data on administrative records on the other (Quadros de Pessoal,
1985-2004).
The tabulations from the schedular tax have essentially the same structure
as the one described above for the income tax. They have been compiled by the
Portuguese bureau of statistics between 1936 and 1982 and display the number of
tax returns (individually based) and the tax collection for a large number of
brackets. However, several changes in the tax code, modifications in the coverage
of the tax and the way the statistics are presented imply that we can only provide
homogeneous estimates for 1964-1982. On the other side, the tabulations based
on withholdings on wages for the income tax cover the period 1989-2000. We
also assume a Pareto distribution to estimate top shares. In this case, the top
groups are defined relative to the total number of workers while the shares of top
wages are defined relative to the total wage bill from national accounts, net of
employer social security contributions.
We provide estimates of shares of top wages based on micro-data from
administrative records (Quadros de Pessoal), which are available between 1985 and
2004 (1990 and 2001 missing). Every year, employers are required by law to
provide information about the firm and their employees. Civil service and
domestic work are excluded. State-owned companies are included. Agriculture
workers are included, although in practice the level of coverage is very low. Top
groups are defined in terms of the total number of workers present in the records
and the top shares are defined relative to the aggregate wages and salaries in the
database. More details are provided in the appendix. Table H describes the size of
the database for several groups of workers. More details about data sources and
structure are provided in the appendix.
3. Top Income Shares
Figure 1 displays the average personal income per adult and the average
income per tax unit along with the consumer price index for the period 1936 to
2003. As Portugal stayed neutral during the Second World War, the impact of the

10
conflict in terms of per capita GDP was relatively small; after the end of the war
and up to 1950 growth was positive but low. The gap to the European core began
to be partially abridged, though part of the recovery was due more to the negative
effects of the war in the rest of the countries rather than to the improvements in
Portugal. Rapid growth started in the 1950s and lasted until the beginning of the
1970s.18 The slowing down of economic growth that followed is generally
attributed to the aftermath of the revolution that ended the dictatorship in 1974
and to the oil shock. The country experienced a severe economic crisis in the first
half of the 1980s but growth resumed again after Portugal’s accession to the
European Union in 1986, starting a period in which GDP per capita grew faster
than the EU average; however, since 1999 the economy started to slow down and
in early 2002 entered a recession.
Figure 2 displays the top 0.01% and the top 0.1% income shares between
1936 and 2003. The break between 1982 and 1988 reflects the unavailability of tax
data during the five years before the change from the old to the new income tax.
A number of important conclusions become apparent from this figure. First, the
highest income concentration occurred in the 1930s and early 1940s. The top
0.1% share was above 4.5% (twice as high as in the recent period) and the top
0.01% share was around 2% (three times as high as in recent years). This strongly
suggests that income concentration in Portugal in the 1930s was substantially
higher than it is today. This pattern, also found in the case of Spain and in many
of the studies gathered in Atkinson and Piketty, 2007 should not be unexpected as
Portugal displayed a low average income and a high concentration of wealth.19
Second, the old income tax statistics display a large decrease in top shares
in the first half of the 1940s. Indeed, the top 0.1% share went down from 5.2% in
1940 to 3.1% in 1946. This coincides with the Second World War and with a
sharp increase in the statutory top marginal rates, which moved from 8.5% in
18 For an analysis of the period and a decomposition of growth by sector of activity, see Lains, 2003a. 19 Harsgor, 1976 argues that under the old regime, Portugal’s private sector was dominated by 40 great families. The industrial dynasties were allied by marriage with the large traditional landowning families of the nobility. The top ten families owned all the important commercial banks.

11
1945 to 30% in 1946. However, the income-weighted marginal rates augmented
only from 5% to around 9%. If the drop in the top 0.1% income share was solely
due to an increase in the tax evasion/avoidance following the increase in the
(income-weighted) marginal tax rate, then the elasticity of high incomes with
respect to one minus the marginal tax rate would have been exaggeratedly high.
Third, top income shares recovered partially after the end of the war, this
improvement being concentrated in the top 0.1-0.01%. The share of the top 0.1%
in 1950 was above the levels of 1945. However, such a recovery was almost non-
existent for the top 0.01%: after 1946 top 0.01% shares never attained the values
displayed before. Tax statistics providing the composition of reported top
incomes show that taxpayers in 1946 (representing the top 0.3%) obtained about
37% of their income from returns on real estate and farm income, 7% from
returns on financial assets, 26% from non-farm business income and about 30%
from employment income (see Table I in the appendix). This suggests that a
significant portion of the very rich in Portugal were actually passive landowners
deriving income from rents and farm business. Such facts are not astonishing in
the light of the agricultural-based nature of the Portuguese economy by the
middle of the twentieth century, and stand in contrast with Spain, where top
income earners at that time were much more likely to be owners of financial assets
and non-farm businesses, as discussed Alvaredo and Saez, 2007.
Fourth, income concentration remained around 1.0-1.1% for the top
0.01% and around 3.5% for the top 0.1% from 1946 to 1960, suggesting that the
high income growth started at the beginning of the 1950s did not produce
important changes until the beginning of the following decade. Top 0.01% shares
in 1962-1973 were again stable but lower than the levels observed in 1946-1961.20
We conclude that the mild liberalization policies adopted by the government
during the third quarter of the XXth century, and which are usually associated to 20 In 1965 a survey of 306 heads (chief executives, presidents) of manufacturing and service enterprises in Portugal’s six most industrialized districts (Aveiro, Braga, Lisbon, Oporto, Santarem and Setúbal) was conducted. The survey included questions pertaining to the socioeconomic origins, career patterns, self-image and opinions of the industrial élite. With the rapid advance of the industry and the growth of cities, new channels of upward mobility seemed to have opened. Makler’s (1969) study reveals that the typical businessman was drawn from middle-class background. See also Makler, 1974, 1976.

12
the increase in growth rates, did not impact on the concentration of income to a
great extent. By 1963 the composition of top incomes had not changed in a
significant way compared to 1946 either. This reflects the slow changes in the
economic structure of the country. The published statistics show that the
participation of capital income lost some ground in favor of employment and
business income (see Table I).21
Finally, a drastic jump downwards in top shares happened since 1974,
although it seems from the evolution of the top 0.1% that the decreasing trend
started by the end of the 1960s. This coincides with the final period of the
dictatorship and should be attributed to the loss of the African colonies and to the
leftward movement of the revolutionary government after 1974, when a process
of nationalizations broke up the concentration of economic power in the hands of
the financial-industrial groups. As discussed in previous sections, banks and
insurance companies were nationalized, basic industries became the property of
the state and officials began to call for a major program of large-scale land
expropriation. Individuals who had compromised with the old regime were
ejected from their posts in universities and government agencies. As described in
Bermeo, 1987, faced with the real possibility of expropriation or loss of
employment, large groups of the Portuguese upper classes simply left the country.
Consequently, the transition from dictatorship to democracy was associated with a
significant drop in top shares.
Top incomes in the last three decades
The number of tax files augmented considerably since the mid 1970s;
therefore we can analyze the top 10% of the distribution between 1976 and 2003.
Figure 3 displays top income shares for three groups within the top decile:
the bottom half of the top decile (top 10-5%), the next 4% (top 5-1%) and the top
percentile. Three elements are worth noticing. Firstly, the decrease in income
21 It should be noted that the changes in the composition of income are affected by the group considered: as composition statistics are only available in aggregate, they describe the top 0.3% of tax units in 1946 and the top 1.2% of tax units in 1963.

13
concentration, started very moderately at the beginning of the 1970s and which
accelerated in 1974, reversed at the beginning of the 1980s. Second, although we
cannot rigorously establish what happened between 1983 and 1988, the level of
income concentration measured with the new income tax statistics in 1989 was
higher than in 1982. Indeed, top shares in the early 1990s are similar to the levels
of 1976-1977. This contrasts with the results, obtained from survey data, which
point to a relative stable income distribution during the 1980s. Finally, the increase
in top shares is higher the higher the fractile considered.
Figure 4 investigates the concentration pattern further by splitting the top
1% into three groups: the top 1-0.5%, the top 0.5-0.1% and the top 0.1%. Again,
the higher the fractile, the higher the increase in the share from 1989 to 2003: the
top 1-0.5% increases 25% from 2.5% to 3.2% while the top 0.1% increases 50%
from 1.5% to 2.3%. This pattern was also found in the case of Spain. We have
already shown in Alvaredo and Saez, 2007 that the increase in income
concentration that took place in Spain since 1981 has been a phenomenon
concentrated within the top 1% of the distribution and in particular within the top
0.1%; the top 10-5% share declined. However, in Portugal, all groups within the
top decile display important increases.
The break in the series between 1982 and 1989 hide the effects of
important changes in the tax structure. Between those years, the top statutory
marginal rates came down from 70% (80% for single individuals) to 40%. In 1988
the schedular tax on wages (with a marginal rate of 22% on the highest salaries)
was removed. Figure 5 displays such a drop. The income weighted marginal rate
for the top 0.1% group dropped from around 62% in 1979 to 40% in 1989. The
experience since 1989, when constant top marginal rates coexist with an increasing
trend in top shares, suggest that the level of marginal tax rates at the top is not the
primary determinant of the level of top reported incomes.
International Comparison
14
How does Portugal stand in relationship with other countries? Figure 6 and
Figure 7 display the top 0.1% and top 0.01% income shares, respectively, in
Portugal in comparison with a number of countries: Spain (Alvaredo and Saez,
2007), France (Piketty 2001 and Landais, 2007), the United States (Piketty and
Saez, 2003), Switzerland (Dell, Piketty and Saez, 2007) and the United Kingdom
(Atkinson, 2005). In the late 1930s, Portugal starts with a level of income
concentration that is higher than Spain and similar to France and the United
States. Nevertheless, income concentration in France and the United States falls
more sharply than in Portugal during the Second World War. As a consequence,
the level of concentration in Portugal between 1950 and 1975 remains high
relative to the other the countries plot in the figures. Quite interestingly, between
1945 and the beginning of the 1960s the level of concentration in Portugal is
comparable to that of Switzerland. Between 1960 and the first half of the 1970s,
top income shares in Switzerland are higher, but the distance to Portugal narrows
if we take into account the emigration flows analyzed in the next section. The
large drop in top shares in the mid 1970s is noticeable not only in terms of the
evolution of concentration in Portugal, but also from a comparative perspective.
Nevertheless, it is clear from these figures that not all the drop should be
attributed to the political turmoil or the economic policies of the revolutionary
period: top shares in the UK and Switzerland also experienced important
reductions in 1970-1975, even when the change in Portugal was definitely more
radical. Finally, as in the case of Spain, the increase in income concentration in the
last years is small compared to the upsurge observed in the United States and
other Anglo-Saxon countries; Portugal’s experience is closer to those of
continental Europe countries.
Emigration Flows and Sensitivity of the Results
Emigration has been one the main features of the Portuguese socio-
economic situation in Portugal during the XXth. century. It has provided a safety
valve for open and disguised unemployment. According to official estimates, 1.8
million individuals left the country between 1950 and 1975, which is a significant

15
number for a population that grew only from 8.5 million to 9.3 million between
those dates.22 We would like to assess the effects of such large-scale migrations on
our top shares estimates. For instance, one of the results presented in the previous
section -that the top 0.01% share has been fairly stable between 1946 and 1961
and also stable between 1962 and 1970 at a slightly lower level- could be driven by
the dynamics of migrations flows. Other things equal, adding up all emigrants
each year to our population control provides an upper bound for top shares.23 Such
a change increases our estimates in 1970 by 19% for the top 0.01% and by 21%
for the top 0.1% (meaning that the share of the top 0.01% became 0.94% in place
of 0.79%). The results are presented in Figure 8, where we plot the top 0.01%
income share between 1946 and 1978 together with the counterfactual estimates.
4. Wage Concentration
Unfortunately, tax statistics do not allow for a dynamic analysis of income
composition at the top as we did for Spain in Alvaredo and Saez, 2007 because
the Portuguese tax tabulations do not provide information on the composition of
top incomes. Notwithstanding this shortcoming, we can get more direct evidence
on changes in inequality from wage income distribution statistics available on an
annual homogeneous basis. It is important to keep in mind that those series
capture only wage income concentration and hence are silent about changes in
business and capital income concentration.
As we did for overall personal income, Figure 9 displays top wage income
shares between 1964 and 2000 for three groups within the top decile: the bottom
half of the top decile (top 10-5%), the next 4% (top 5-1%) and the top percentile,
while Figure 10 splits the top percentile in three groups: the top 1-0.5%, the top
22 Valério, 2001. 23 Adding up all emigrants to the population control amounts to assuming that all of them can be considered as tax units, that they are alive throughout the period and that they would have had little income if stayed in Portugal. Therefore we need to go further down in the distribution to locate the top x%. Statistics show that migrants were mostly young males, as described in Conim, 1976. Assuming the same growth rate of tax units since 1950 for Portugal as in Spain or France gives very similar results.

16
0.5-0.1% and the top 0.1%. The information suggests that wage income
concentration (top 1% and above) fell significantly during the last years of the
authoritarian regime and the transition. Unlike the case of total income, the sharp
decrease in top wages between 1970 and 1976 is clearly a phenomenon
concentrated in the top 1% and especially in the top fractiles within the top 1%.
Interestingly, despite important movements over the period, the level of
concentration within the 1% by the end of the 1990s is comparable to the level of
1970 and slightly lower than the levels in 1964-1969. This suggests that the
increase in overall income concentration over the last years has also been in
Portugal extremely influenced by the evolution of top wages.
Figure 11 and Figure 12 describes the same shares but their results come
form the micro-data on administrative records over 1985-2004. Two periods seem
to be clearly identifiable: (i) until 1993-1994 the increase in earnings concentration
is mostly condensed in the top 5-0.1%; the top 0.1% is stable or even decline
between 1985 and 1986; (ii) since 1994-1995, the increase in concentration is
mainly happening in the top 0.1%, which augments considerably from 1.4% in
1994 to 2.4 in 2004, that is, around 70%.24
These conclusions do not depend on the subset of workers included in the
administrative records. Figure 13 compares the top 1-0.5%, the top 0.5-0.1% and
the top 0.1% wage income shares from Quadros de Pessoal (already presented in
Figure 12) with the series computed from income tax statistics (in which all
workers filing a return are included, without distinction of sector of activity). Both
set of series follow the same pattern, and the income tax statistics display even
larger increases. Figure 14 compares shares within shares according to both
sources.
Together with the estimates in Table F, the presented evidence suggest that
the patterns are not only coincident with the findings of Cardoso, 1998 for the
period 1983-1992 but also that they have been reinforced between 1992 and 2004:
a relatively compressed bottom and a stretched top can be highlighted as the main
characteristics of the Portuguese earnings distribution. The high degree of
24 No significant differences are recorded for female and male workers at the top.

17
inequality prevailing in the country’s labor market is essentially due to the fact that
high wages are very high relative to the rest of the distribution, and the gap has
kept growing. Figure 15 plots the P90 and P10 fractile wage levels as a percentage
of the median wage from 1985 to 2004 as another way of looking at the widening
gap.
5 Conclusion
This paper has attempted to analyze income and earnings concentration in
Portugal from a long-run perspective using the best available statistical evidence.
Our results suggest that income concentration was much higher during the 1930s
and early 1940s (at levels comparable to other countries such as France, Spain or
the United States) than it is today. Top income shares estimated from reported
incomes deteriorated during the Second World War, even if Portugal did not take
active participation in the conflict. However, the magnitude of the drop was less
important than in other European countries. The level of concentration between
1950 and 1970 remained relatively high compared to countries such as Spain,
France, UK or the United States. The decrease in income concentration, started
very moderately by the end of the 1960s and which accelerated after the
revolution of 1974, began to be reversed at the beginning of the 1980s. During the
last fifteen years the shares above the top 10% have augmented steadily. The
increase has been higher, the higher the fractile considered
The evidence since 1989 suggests that the level of marginal tax rate at the
top has not been the primary determinant of the level of top reported incomes.
Marginal rates have stayed constant in a context of growing top shares.
The dynamics of top incomes have been partially driven by the behavior of
top wages. Between 1985 and 1994 the increase in earnings concentration has
been mostly condensed in the top 5-0.1%. Since then, the increase in
concentration is happening mainly in the top 0.1%

18
APPENDIX A. The Taxes on Income, Wages and Salaries in Portugal
A.1. The ‘old’ income tax In Portugal, income taxation was enforced for the first time in 1641 as a 10% flat rate on rents, capital incomes and business incomes (décima militar); in its origins it was a source to finance the restoration wars. During the XIX century, the system evolved towards the traditional scheme of independent schedular taxes: Contribução Predial, Contribução Industrial, Décima de Juros. With modifications, the schedule taxes survived until 1988.
Table J and Table K summarize the main features of the evolution of the personal income tax in Portugal between 1922 and 2003. The first personal income tax (Imposto Pessoal do Rendimento) was enforced in 1922 (Law 1368/1922). It was defined as a tax levied on top incomes in addition to the traditional schedule taxes (at the time: Contrïbuçao Industrial on wages, business income and self-employment income, Contrïbuçao Predial on rents, Imposto sobre a Aplicação de Capitais on capital income); no provisions were made regarding capital gains. It was a truly independent personal overall income tax. However, several difficulties on its applicability, a high noncompliance rate and the turbulent macroeconomic environment of the First Republic forced its rapid substitution.
In 1928, the government replaced the Imposto Pessoal do Rendimento with a new income tax, the Imposto Complementar (Law 15290/1928 and Decree 16731/1929) affecting the taxable income defined for the schedule taxes (at the time: Contrïbuçao Industrial for business income, Imposto Profissional for wages and self-employment income, Contrïbuçao Predial for rents, Imposto sobre a Aplicação de Capitais for capital income). The Imposto Complementar, with two major reforms in 1946 and 1963, remained in existence until 1988.
Between 1950 and 1963 those individuals accumulating two or more civil servant positions, jobs in the private sector or independent professions were subject also to a supplementary tax (Adicionamento, Decree-Law 37771 of 2/28/1950). However, this tax affected a very small number of individuals: in 1951, for instance, only 537 individuals paid the Adicionamento, out of 25,362 who filed for the Imposto Complementar. A.2. The ‘modern’ income tax The modern personal income tax (Imposto sobre o Rendimento das Pessoas Singulares IRS) was established in 1989 (Decree-Law 442A/1988), when the Imposto Complementar and all the schedule taxes were abolished. Taxable income covers (i) wages and salaries (Categoria A), (ii) self-employment income (Categoria B), (iii) business income (Categoria C), (iv) farm income (Categoria D), (v) capital income (Categoria E), (vi) urban and rural real estate rents (Categoria F), (vii) capital gains

19
(Categoria G), (viii) pensions (Categoria H) and (ix) other smaller income items (Categoria I). Concerning the Categoria G, capital gains from public debt bonds are untaxed, as well as gains from stocks if kept for more than one year. Capital gains from real estate are also untaxed if the proceeds are used to purchase new real estate.
Between 1989 and 2003 the top marginal tax rate was stable at 40%, while the bottom rate declined from 16% in 1989-1990, to 15% in 1991-1998, 14% in 1999-2000 and finally 12% in 2001-2003. Contrary to the worldwide trend of reducing the number of brackets of the statutory tax scale, Portugal moved first from a 5-bracket to a 4-bracket scale between 1990 and 1991, but then went back to 5 brackets in 1999 and to a 6-bracket scale in 2002. Taxation is based on the family unit. To take the taxpayer’s family status into account, the use of an income-splitting system to ascertain taxable income is applied. In particular, income of married couples is divided by two in order to determine the marginal tax rate to be applied according to the statutory tax scales shown in TABLE J. For a comprehensive description of the modern income tax in Portugal, see Direcçao-Geral dos Impostos, 1998a, 1998b, 2005. A.3. Schedule Tax on Wages In 1929 the government created the Imposto Profissional, a schedular tax on wages and salaries (including agriculture) and self-employed liberal professionals; civil servants were excluded (Decree 16731 of 4/14/1929 and Decree 19,359 of 2/19/1931).25 Initially there was a progressive tax scale with marginal tax rates from 2% to 8% affecting wage income, while self-employees were taxed with lump sums (variable across professions). Several reforms modified the scope of the tax, the exemption thresholds and the tax scales (Decree 19359 of 2/16/1931, Law 1952 of 3/10/1937, Decree-Law 33735 of 6/26/1944, Decree-Law 34353 of 12/30/1944). A detailed description of the Imposto Profissional during the first half of the XXth. century can be found in Mouteira Guerreiro, 1947. After the fiscal reform of 1962-1964 (Decree-Laws 44305 of 4/27/1962, 45400 of 11/30/1963, 45676 of 4/24/1964, 45977 of 10/19/1964), statutory top marginal tax rates were successively increased to 15% in 1964-1972, 20% in 1973-1975 and 22% in 1976-1988. The number of tax brackets also rose considerably. The tax was abolished in 1988 with the introduction of the modern income tax in 1989. B. References on Data Sources for Portugal
B.1. Income Tax Statistics Available statistical information about the Imposto Pessoal do Rendimento appears in República Portuguesa, Ministério das Finanças, Direcção Geral de Estatística, Ia. Repartiçao, Estatística das Contribuïções e Impostos, Liquidaçaõ e Cobrança nas gerências de 1922-1923 a 1924-1925 and República Portuguesa, Ministério das
25 Before 1929, a fraction of wage earners was already taxed under the Contribuïçao Industrial.

20
Finanças, Direcção Geral de Estatística, Ia. Repartiçao, Liquidaçaõ e Cobrança na Gerência de 1925-1926. However, these publications only display total tax collections with no data about the distribution of income or tax paid by brackets; consequently this information, if interesting from the historical point of view, has not been used for our estimations of top income shares.
Statistical information has been published regularly since 1936 with increasing degree of detail. 1936-1945: The published tables show the distribution of the number of taxpayers by ranges of tax collection together with the totals for gross income and tax paid. Instituto Nacional de Estatística, Anuário Estatístico das Contribuïções e Impostos 1936, 1937, 1938, 1939, 1940, 1941, 1942, 1943, 1944, 1945. 1946-1963: The published tabulations display the number of taxpayers and the gross assessed income organized by ranges of total before tax income, the number of taxpayers and the taxable income by ranges of taxable income, and, finally, the number of taxpayers and tax paid by ranges of tax paid. Instituto Nacional de Estatística, Anuário Estatístico das Contribuïções e Impostos, 1946, 1947, 1948, 1949, 1950, 1951, 1952, 1953, 1954, 1955, 1956, 1957, 1958, 1959, 1960, 1961, 1962, 1963. 1963-1982: The published statistics are organized by range of taxable income (gross income net of deductions), and they provide the distribution of the number of taxpayers and the taxable income by brackets. The data also provide information on total deductions. Instituto Nacional de Estatística, Anuário Estatístico das Contribuïções e Impostos, 1964, 1965, 1966 and Portugal, Instituto Nacional de Estatística, Estatísticas das Contribuições e Impostos, Continente e Ilhas Adjacentes, 1967, 1968, 1969, 1970, 1971, 1972, 1973, 1974, 1975, 1976, 1977, 1978, 1979, 1980, 1981, 1982. 1983-1988: Unfortunately, during the transition period from the Imposto Complementar to the new Imposto sobre o Rendimento das Pessoas Singolares, no usable tabulations by income or tax brackets are available. Only aggregated information about total assessed income, total taxable income and total tax collection appears in Instituto Nacional de Estatística, Estatísticas das Contribuições e Impostos, Continente e Ilhas Adjacentes, 1983-1988. Consequently our series have a gap in those years. 1989-2003: Finally, the fiscal reform of 1988 and the increasing managerial capabilities of the tax agency implied an improvement in the amount and quality of available information on individuals’ income. Since then, the published statistics, by brackets of gross income, display taxable income, gross income, tax paid and a thorough detail of deductions. No information is provided about the composition of income. Individual are classified in two groups: those having income from wages and pension only, on the one side, and those having income also from other sources. Portugal, Instituto Nacional de Estatística, Estatísticas das Receitas Fiscais, 1989-1992, 1993-1995, 1996, 1997, 1998, 1999, 2000.
21
Tabulations for 2001, 2002 and 2003 were provided by the tax agency of Portugal, based on internal reports. B.2. Statistics on Wages and Salaries The information on earnings is obtained from the tabulations of the schedular tax on wages and salaries, the Imposto Profissional (1936-1982), the income tax (1989-2000) and the micro-data from Quadros de Pessoal (1985-1989 (1990 missing), 1991-2000 (2001 missing) and 2002-2004).
The tabulations from the Imposto Profissional are organized by intervals of tax collections, and they display the number of taxed workers and the total tax paid by brackets. The published information covers 1936-1982; however we can only offer homogeneous estimates for the period 1964-1982. We used the tax code to recover the brackets of earnings from the brackets of tax paid, and the earnings by brackets from the tax collections by brackets. Instituto Nacional de Estatística, Anuário Estatístico das Contribuïções e Impostos, 1936, 1937, 1938, 1939, 1940, 1941, 1942, 1943, 1944, 1945; Instituto Nacional de Estatística, Anuário Estatístico das Contribuïções e Impostos, 1946, 1947, 1948, 1949, 1950, 1951, 1952, 1953, 1954, 1955, 1956, 1957, 1958, 1959, 1960, 1961, 1962, 1963Instituto Nacional de Estatística, Anuário Estatístico das Contribuïções e Impostos, 1964, 1965, 1966. Portugal, Instituto Nacional de Estatística, Estatísticas das Contribuições e Impostos, Continente e Ilhas Adjacentes, 1967, 1968, 1969, 1970, 1971, 1972, 1973, 1974, 1975, 1976, 1977, 1978, 1979, 1980, 1981, 1982, 1983-1988.
For the period 1989-2000, the information on earnings comes from the tabulations of the income tax. The published statistics, based on withholdings at source and organized by ranges of gross earnings, display the number of workers and the gross wages. The information corresponds to the individual and not to the family as in the income tax statistics. Portugal, Instituto Nacional de Estatística, Estatísticas das Receitas Fiscais, 1989-1992, 1993-1995, 1996, 1997, 1998, 1999, 2000. B.3. Administrative Records on Wages: Quadros de Pessoal Every year, employers are required by law to provide information about the firm (location, economic activity, employment, sales, legal setting) and their employees (individual basic wages, overtime, bonuses, gender, level of education, skills, duration of work (full-time/part-time), date of latest promotion, tenure). The information corresponds to March for years 1985-1993, and October for years 1994-2004. Civil service and domestic work are excluded. State-owned companies are included. Agriculture workers are included, although in practice the level of coverage is very low. For manufacturing, a thorough evaluation of the coverage of Quadros de Pessoal can be made, since a census of manufacturing is available. As argued in Cardoso, 1998, comparison of the two sets reveals that the Quadros de Pessoal covers more workers than the census itself, despite the fact that the census includes very small productive units that are not a part of the population covered by the Quadros de Pessoal (mainly firms with no wage earners). The Direcçao-Geral

22
de Estudos, Estatística e Planeamento (DGEEP) publishes regularly a report with the main results, Estatísticas em Síntese (available on line). The data were first collected in 1982 but micro-data starts in 1985. All results based on Quadros de Pessoal were computed from the micro-data for 1985-1989 (1990 missing), 1991-2000 (2001 missing) and 2002-2004. Table H describes the size of the database and classifies individuals according the following categories: employers, family employees without salaries, employees, cooperative workers and unknown/not classified individuals. C. Income and Earnings Denominators
C.1. Total Income Denominator The National Accounts income series between 1953 and 1995 was obtained from Banco de Portugal, Séries Longas para a Economia Portuguesa. Pós II Guerra Mundial. Vol I and Vol II. For the years following 1996, the information comes from Instituto Nacional de Estatística (2003) Contas Nacionais Base 1995 and Instituto Nacional de Estatística (2006) Contas Nacionais Anuais Definitivas Base 2000. For 1936-1952 the previously described series were extended backwards using the information from Batista, Martins, Pinheiro and Reis, 1997.
For the period 1989-2003, total income is defined as wages and salaries from National Accounts net of effective social security contributions, plus 50% of social transfers, plus 66% of unincorporated business income plus all non-business, non labor income reported on tax returns. This methodology generates an income denominator that fluctuates around 60% of Portuguese GDP, which is slightly lower than the ratio found for Spain (see Alvaredo and Saez, 2007) and similar to that used for France (see Piketty, 2001). For the period 1936-1983, we use as denominator 60% of the Portuguese GDP from the sources listed above.
The total denominator series expressed in 2000 Euros is reported in Table A, Column 5. The average income per adult is reported in Column 6 while the average income per tax unit is displayed in Column 7. Column 8 shows the CPI index (base 100 in year 2000). C.2. Total Wage Denominator Total wages are defined as wages and salaries from national accounts net of effective social contributions paid by employers. As in the income denominator case, the information between 1953 and 1995 has been taken from Banco de Portugal, Séries Longas para a Economia Portuguesa. Pós II Guerra Mundial. Vol I and Vol II (series Remunerações do Trabalho no Território, Ordenados e Salários and Contribuções Sociais Efectivas dos Empregadores). For the years following 1996, the information comes from Portugal, Instituto Nacional de Estatística (2003) Contas Nacionais Anuais Definitivas Base 1995 and Portugal, Instituto Nacional de Estatística (2005) Contas Nacionais Anuais Definitivas Base

23
2000. For 1936-1952 we assume that the growth rate of total wages equals the nominal GDP growth rate. C.3. Prices The price index is based on the following sources: (a) for the period 1936-1945: Instituto Nacional de Estatística, Anuário Estatístico, 1936, 1937, 1938, 1939, 1940, 1941, 1942, 1943, 1944, 1945, Indices de Preços de Retalho, base 1914=100; (b) for the period 1946-1951, Instituto Nacional de Estatística (1985) Portugal 50 anos 1935-1985; (c) for the years following 1951, Consumer Price Index from Instituto Nacional de Estatística, Anuário Estatístico, 1952-1975 and Instituto Nacional de Estatística, Divisão de Estatísticas da Distribuçao e Serviçios, Indicadores da Actividade Económica: Indices de Precios do Consumidor, several years. C.4. Total Number of Individuals and Tax Units As we mentioned before, joint filing for married couples has always been mandatory in Portugal. Thus, the unit to which the income tax data relate is the married couple, or single adult, or single minor with income in his or her own right. Our reference total for tax units takes this fact into account. Consequently the total number of tax units is defined as the total number of adult males and females (aged 20 years old and over) less the number of married females. Information is obtained from the national census: Recenseamento Geral da População e da Habitação, 1930, 1940, 1950, 1960, 1970, 1981, 1991, 2001. Intermediate years have been linearly interpolated. The information is also available in Instituto Nacional de Estatística, Anuário Estatístico de Portugal, several years, and Instituto Nacional de Estatística (1985), Portugal 50 anos, 1935-1985 and Valério, 2001. C.5. Total Number of Employees The number of employees comes from (a) Banco de Portugal, Séries Longas para a Economia Portuguesa. Pós II Guerra Mundial. Vol I and Vol II (1953-1995), (b) Portugal, Instituto Nacional de Estatística (2003) Contas Nacionais Anuais Definitivas Base 1995 and Portugal, Instituto Nacional de Estatística (2005) Contas Nacionais Anuais Definitivas Base 2000 (1996-2004); (c) the national census of 1930, 1940 and 1950. Missing years have been linearly interpolated. The number of civil servants was obtained from (a) the national census of 1930, 1940 and 1950 (1936-1952); (b) Banco de Portugal, Séries Longas para a Economia Portuguesa. Pós II Guerra Mundial Vol I and Vol II (1953-1967) and (c) International Labor Organization Database (2000-2002). C.6. Data on Emigration Flows

24
The number of emigrants from Portugal was obtained from Valério (2001) Estatísticas Históricas Portuguesas, Lisboa: Instituto Nacional de Estatística, which builds on the following sources: Baganha, M. (1990). Portuguese Emigration to the United States 1820-1930, New York: Garland Publishing Inc. Baganha, M. (1991). Uma Imagem Desfocada – A Emigração Portuguesa e as Fontes sobre a Emigração, Análise Social, 26(112-113). Baganha, M. (1993). Principais Características e Tendências da Emigração Portuguesa, in APS, Estructuras Sociais e Desenvolvimento, Lisboa: Fragmentos. Baganha, M. (1994). As Correntes Emigratórias Portuguesas no Século XX e o seu Impacto na Economia Nacional, Análise Social, 29(128). Pereira, M. (1993). Liberdade e Contenção na Emigração Portuguesa 1850-1930, in M. Silva, Emigração/Imigração, Lisboa: Fragmentos. D. Estimating Top Shares
D.1. Basic Pareto Interpolation The general interpolation technique is based on the well known empirical regularity that the top tail of the income distribution is very closely approximated by a Pareto distribution. A Pareto distribution has a cumulative distribution function of the form F(y)=1-(k/y)a where k and a are constants, and a is the Pareto parameter of the distribution. Such a distribution has the key property that the average income above a given threshold y is always exactly proportional to y. The coefficient of proportionality is equal to b=a/(a-1).
The first step consists then in estimating the income thresholds corresponding to each of the percentiles P90, P95, P99, …, P99.99, that define our top income groups. For each percentile p, we look first for the published income bracket [s,t] containing the percentile p. We estimate then the parameters a and k of the Pareto distribution by solving the two equations: k=s p(1/a) and k=t q(1/a) where p is the fraction of tax returns above s and q the fraction of tax returns above t.26 Note that the Pareto parameters k and a may vary from bracket to bracket. Once the density distribution on [s,t] is estimated, it is straightforward to estimate the income threshold, say yp, corresponding to percentile p.
For the top bracket this method cannot be applied and we therefore assume that the top bracket is Pareto distributed with parameters a and k equal to those of the bracket just below the top estimated by the method described previously. The second step consists of estimating the amounts of income reported above income threshold yp. We estimate the amount reported between income yp and t (the upper bound of the published bracket [s,t] containing yp) using the
26 This is the standard method of Pareto interpolation used by Kuznets (1953) and Feenberg and Poterba (1993).

25
estimated Pareto density with parameters a and k. We then add to that amount the amounts in all the published brackets above t.
Once the total amount above yp is obtained, we obtain directly the mean income above percentile p by dividing the amount by the number of individuals above percentile p. Finally, the share of income accruing to individuals above percentile p is obtained by dividing the total amount above yp by our income denominator series. Average incomes and income shares for intermediate fractiles (P90-95, P95-99, etc.) are obtained by subtraction.
Results are presented in Table B (top income shares between 1936 and 2003), Table C (top fractiles income levels between 1989 and 2003), Table E.1 (top wage income shares between 1964 and 2000) and Table E.2 (fractiles of earnings between 1964 and 2000). D.2. Adjustments to Raw Pareto Interpolations 1936-1945: The statistics are organized by ranges of tax paid. We estimate the ranges of income and the total income in those ranges by applying the statutory tax scale and the taxable thresholds given in Table J and in Table K. Total assessed income is reported in aggregate in the statistics. Consequently we can check that our estimation of assessed income by brackets is accurate. 1964-1982: The statistics are organized by range of taxable income and they provide information on taxable income. Total income equals taxable income plus family deductions (which were introduced in 1964) plus other deductions. The evolution of family deductions is described in Table K. We add back those deductions to our income estimates in order to estimate shares based on income before those deductions. As family deductions are reported only in aggregate, we impute the family deductions to each bracket by assuming that on average each tax filer is entitled to the same amount of deductions. The information on non-family based deduction is also reported in aggregate. We imputed these deductions proportionally to the reported taxable income according to the general rules of the tax code. D.3 Estimating Top Shares from Administrative Records on Earnings We also computed shares of top wages using micro-data from Quadros de Pessoal between 1985 and 2004 (1990 and 2001 missing). The number of individual observations ranges from 1,898,675 in 1985 to 2,912,304 in 2004. However, not all of them refer to workers. Individuals are classified as employers, family employees with no salary, employees and cooperative workers. In our estimations we only consider individuals with non zero wages in the last two groups. Shares of top wages are presented in Table F, where we also provide estimations for the left part of the distribution. Original amounts corresponds to the monthly level. Table G show income levels of selected fractiles, where we annualize the amounts by up-scaling monthly earnings by a factor of 14 (employees generally receive 14 months’ pay for 11 months’ work; the extra three months’ pay is for a Christmas bonus, a vacation subsidy and a period of annual leave).

26
D.4. Estimating Marginal Tax Rates Average marginal tax rates (income weighted) used in Figure 5 have been computed as follows. We consider each of the income thresholds P99, P999, etc. estimated from the interpolation methods described in this Appendix. We subtract from the raw income the average level of deductions and average level of allowances (for example, for the income threshold P99, we identify the bracket in the tax tabulations to which this level of income belongs and subtract the average deductions and allowances in that bracket). This gives the net taxable income. Tax liability is obtained by applying the tax schedules in Table J (from which the marginal tax rate for any taxable income can be obtained) to the taxable income. We estimate the income-weighted marginal tax rate for the top 0.1% as: [Share P99.9-99.99 x MTR 99.95 + Share 99.99-100 x (MTR 99.99+MTR99.999)/2]/ [Share P99.9-99.99+Share P99.99-100] where Share P99.9-99.99 denotes the income share of group P99.9-99.99 and MTR 99.95 denotes the income-weighted marginal tax rate at percentile 99.995.

27
References
Aarberge, R. and A. B. Atkinson (2008). ‘Top incomes in Norway’, mimeo.
Albuquerque, R. and M. Gouveia (1994). ‘Distribução dos Salarios em Portugal 1980 e 1990’, Relatório Anual, Banco de Portugal.
Alvaredo, F. (2007). ‘The Rich in Argentina over the Twentieth Century’, Paris School of Economics Working Paper 2007-02.
Alvaredo, F. and E. Saez (2007). ‘Income and Wealth Concentration in Spain in a Historical and Fiscal Perspective’, Cepr Discussion Paper 5836.
Atkinson, A. (2005). ‘Top Incomes in the United Kingdom over the Twentieth Century’, Journal of the Real Statistical Society, Series A, 168(2): 325-343.
Atkinson, A. and A. Leigh (2007a). ‘The Distribution of Top Incomes in Australia’, in A.B. Atkinson, A. B. and T. Piketty, op. cit.
Atkinson, A. and A. Leigh (2007b). ‘The Distribution of Top Incomes in New Zealand’, in A.B. Atkinson, A. B. and T. Piketty, op. cit.
Atkinson, A. B. and T. Piketty (2007). Top Incomes over the Twentieth Century: A Contrast Between European and English Speaking Countries, Oxford: Oxford University Press.
Atkinson, A. B., L. Rainwater and T. Smeeding (1994). ‘Income Distribution in European Countries’, Luxembourg Income Study Working Paper n. 121.
Baganha, M. (1990). Portuguese Emigration to the United States 1820-1930, New York: Garland Publishing Inc.
Baganha, M. (1991). ‘Uma Imagem Desfocada – A Emigração Portuguesa e as Fontes sobre a Emigração’, Análise Social, 26(112-113).
Baganha, M. (1993). ‘Principais Características e Tendências da Emigração Portuguesa’, in APS (ed.), Estructuras Sociais e Desenvolvimento, Lisboa: Fragmentos.
Baganha, M. (1994). ‘As Correntes Emigratórias Portuguesas no Século XX e o seu Impacto na Economia Nacional’, Análise Social, 29(128).
Baklanoff, E. (1992). ‘The Political Economy of Portugal’s Later Estado Novo: A Critique of the Stagnation Thesis’, Luso-Brazilian Review, 29(1): 1-17.
Banerjee, A. and T. Piketty (2005). Top Indian Incomes 1922-2000, The World Bank Economic Review, 19(1): 1-20.
Barreto, A. (1983). Memórias da Reforma Agrária, Lisboa: Publicações Europa-América.
Barreto, A. (1987). Anatomia de uma Revoluçao, Lisboa: Publicações Europa-América.
Barreto, A. (1988). ‘Reforma Agraria y Revolución en Portugal, 1974-76’, Revista de Estudios Políticos (Nueva Epoca), 60-61, Abril-Septiembre, pp. 413-429.

28
Batista, C. (2002). ‘Skill Premium in Portugal: Some Evidence on the Capital-Skill Complementarity Hypothesis’, mimeo.
Batista, C. (2005). ‘Will the East Follow Portugal?’ mimeo.
Batista, D., C. Martins, M. Pinheiro and J. Reis (1997). ‘New Estimates for Portugal’s GDP 1910-1958’, História Económica, 7, Banco de Portugal.
Bermeo, N. (1997). ‘Myths of Moderation: Confrontation and Conflict during Democratic Transitions’, Comparative Politics, 29(3): 305-322.
Bover, O., P. García-Perea and P. Portugal (1998). ‘A Comparative Study of the Portuguese and Spanish Labor Markets’, Bank of Spain Working Paper 9807.
Budría, S and P. Pereira (2008). ‘Education and Wage Dispersion: New Evidence for Europe’, forthcoming in P. Dolton, R. Asplund and E. Barth (eds.) Education and Inequality Across Europe, Edward Elgar.
Budría, S. (2007). ‘Economic Inequality in Portugal: A Picture in the Beginnings of the 21st. Century’, Munich Personal RePEc Archive Working Paper n. 1784.
Budría, S. and C. Nunes (2005). ‘Education and Wage Inequality in Portugal’, in R. Asplund and E. Barth (eds.) Education and Wage Inequality in Europe: A Literature Review. ETLA, Series B209, Helsinki.
Budría, S. and P. Pereira (2007). ‘The Wage Effects of Training in Portugal: Differences across Skill Groups, Genders, Sectors, and Training Types’, Applied Economics, 39(6): 787-807.
Cantó, O., A. Cardoso and J. Jimeno (2002). ‘Earnings Inequaliy in Portugal and Spain: Contrasts and Similarities’, in D. Cohen, T. Piketty and G. Saint-Paul (eds.) The Economics of Rising Inequalities, Oxford: Oxford University Press, pp. 55-73.
Cardoso, A. (1994). ‘Regional Wage Inequality in Portugal’, Estudos de Economia, 14(4): 429-450.
Cardoso, A. (1998a). ‘Earnings Inequality in Portugal: High and Rising?’ Review of Income and Wealth, 44(3): 325-343.
Cardoso, A. (1998b). ‘Workers or Employers: Who is Shaping Wage Inequality?’ Oxford Bulletin of Economics and Statistics, 59: 523-547.
Cardoso, A. (1999). ‘Firms’ Wage Policies and the Rise in Labor Market Inequality: The Case of Portugal’, Industrial and Labor Relations Review, 53: 87-102.
Cardoso, A. (2006). ‘Wage Mobility: Do Institutions Make a Difference? A Replication Study Comparing Portugal and the UK’, Labour Economics, 13(3): 387-404.
Cardoso. F. and V. Cunha (2005). ‘Household Wealth in Portugal: 1980-2004’, Banco de Portugal Working Paper 4.
Carneiro, P. (2008). ‘Equality of Opportunity and Educational Achievement in Portugal’, Portuguese Economic Journal, forthcoming.
Castanheira, M. and M. Carvalho (1997). ‘Desigualdade na Distribução do Rendimento e Disparidades Regionais’, Prospectiva e Planeamento, 3-4: 267-278.
29
Castanheira, M. and M. Ribeiro (1977). ‘A Repartição Pessoal do Rendimento em Portugal’, Análise Social, (13).
Conim, C. (1976). ‘Algumas Considerações sobre a Situação Demográfica Portuguesa de 1960 a 1975’, in Instituto Nacional de Estatística, Revista do Centro de Estudos Demográficos, 22: 171-239.
Costa A. (1994). ‘The Measurement of Poverty in Portugal’, Journal of the European Social Policy, 4(2): 95-115.
Dell, F. (2007). ‘Top Incomes in Germany Throughout the Twentieth Century: 1898-1998’, in A.B. Atkinson, A. B. and T. Piketty, op. cit.
Dell, F., Piketty, T. and Saez, E. (2007). ‘Income and Wealth Concentration in Switzerland over the Twentieth Century’, in A.B. Atkinson and T. Piketty, 2007, op. cit.
Direcçao-Geral dos Impostos (1998a). Sistema Fiscal Português, Centro de Estudos Fiscais, Editora Rei dos Livros.
Direcçao-Geral dos Impostos (1998b). ‘Relatório da Comissão para o Desenvolvimento da Reforma Fiscal’, Chapter 13.
Direcçao-Geral dos Impostos (2005). ‘Simplificação do Sistema Fiscal Português. Relatório do Grupo de Trabalho criado por Despacho do Ministro de Estado e das Finanças’, Cadernos Ciência e Técnica Fiscal, n. 201.
Downs, C. (1983). ‘Residents’ Commissions and Urban Struggles in Revolutionary Portugal’, in L. Graham and D. Wheeler (eds.) In Search of Modern Portugal. The Revolution and its Consequences, Madison: The University of Wisconsin Press, pp. 151-179.
Feenberg, D. and J. Poterba (1993). ‘Income Inequality and the Incomes of Very High Income Taxpayers: Evidence from Tax Returns’, in J. Poterba (ed.) Tax Policy and the Economy, vol. 7, Cambridge: MIT Press.
Ferreira, L. (1992). ‘Pobreza em Portugal. Variação e Decomposição de Medidas de Pobreza a Partir dos Orçamentos Familiares de 1980-1981 e 1989-1990’, Estudos de Economia, 12(4): 377-393.
Gallaher, T. (1983). Portugal: A Twentieth-Century Interpretation, Manchester: Manchester University Press.
Gouveia, M. and C. Rodrigues (2002). ‘The Impact of Guaranteed Minimum Income Program in Portugal’, Public Finance and Management, 2(2).
Gouveia, M. and J. Tavares (1995). ‘The Distribution of Household Income and Expenditure in Portugal: 1980 and 1990’, Review of Income and Wealth, 41: 1-17.
Harsgor, M. (1976). ‘Portugal in Revolution’, The Washington Papers, 3, n. 33, Beverly Hills, CA: Sage Publications.
Hartog, J., P. Pereira and J. Vieira (1999). ‘Inter-Industry Wage Dispersion in Portugal: High but Falling’, IZA Discussion Paper n. 53.

30
Hartog, J., P. Pereira and J. Vieira (2001). ‘Changing Returns to Education in Portugal during the 1980s and the early 1990s: OLS and Quantile Regression Estimators’, Applied Economics, 33: 1021-1037.
Hudson, M. (1989). ‘Portugal to 1993: Investing in a European Future’, London: The Economist Intelligence Unit, Special Report 1157.
Instituto Nacional de Estatística (1985). Portugal 50 anos, 1935-1985, Lisboa.
International Labor Organization ILO (1979). ‘Employment and Basic Needs in Portugal’, Annex I: ‘The Economic and Social Development of Portugal to 1975’.
Jimeno, J., O. Cantó, A. Rute, M. Izquierdo and C. Rodrigues (2000). ‘Integration and Inequality: Lessons from the Accessions of Portugal and Spain to the EU’, FEDEA.
Kopczuk, W. and E. Saez (2004). ‘Top Wealth Shares in the United States, 1916-2000: Evidence from Estate Tax Returns’, National Tax Journal, 57(2): 445-487.
Lains, P. (2003a) ‘Catching Up to the European Core: Portuguese Economic Growth, 1910-1990’. Explorations in Economic History, 40(4): 396-386.
Lains, P. (2003b). ‘Portugal’s Growth Paradox 1870-1950’, Working Paper n. 135, Faculdade de Economia, Universidade do Porto.
Lains, P. (2003c). ‘New Wine in Old Bottles: Output and Productivity Trends in Portuguese Agriculture 1850-1950’, European Review of Economic History, 7(1): 1-30.
Landais, C. (2007). ‘Les Hauts Revenus en France (1998-2006): Une Explosion des Inegalités?’, Paris School of Economics Working Paper, June.
Leigh, A. and P. van der Eng (2007). ‘Top Incomes in Indonesia, 1920-2004’, Discussion Papers from Centre for Economic Policy Research, n. 549, Research School of Social Sciences, Australian National University.
Lopes, L. (1994). ‘Manufacturing Productivity in Portugal in a Comparative Perspective’. Notas Económicas, 4: 55-76.
Lopes, L. (1996). A Economia Portuguesa desde 1960. Lisboa: Gradiva.
Machado, J. and J. Mata (2001). ‘Earnings Functions in Portugal 1982-1994: Evidence from Quantile Regressions’, Empirical Economics, 26: 115-134.
Maddison, A. (2001). The World Economy. A Millennial Perspective. Paris: OECD.
Maddison, A. (2003). The World Economy. Historical Statistics. Paris: OECD.
Makler, H. (1969). A "Elite" Industrial Portuguesa. Lisbon: Instituto Gulbenkian de Ciencia.
Makler, H. (1974). ‘Education Levels of the Portuguese Industrial Elite’, International Studies of Management and Organization, 4 (1-2).
Makler, H. (1976). ‘The Portuguese Industrial Elite and Its Corporative Relations: A Study of Compartmentalization in an Authoritarian Regime,’ Economic Development and Cultural Change, 24(3): 495-526.

31
Martins, M. and J. Chaves Rosa (1979). O Grupo Estado: Anàlise e Listagem Completa das Sociedades de Sector Publico Empresarial. Lisbon: Edições Journal Expresso.
Martins, P. and P. Pereira (2004). ‘Does Education Reduce Wage Inequality? Quantile Regressions Evidence from Sixteen European Countries’, Labour Economics, 11(3): 355-371.
Ministério do Emprego e da Segurança Social, Departamento de Estudos e Planeamento (1992). Relatório de Cojuntura anual de 1989, Relatórios e Análises, 44.
Moriguchi, C. and E. Saez (2007). The Evolution of Income Concentration in Japan, 1886-2005: Evidence from Income Tax Statistics, forthcoming Review of Economics and Statistics.
Mouteira Guerreiro, A. (1947). Imposto Profissional, Biblioteca Fiscal Atlântida, Coimbra: Livraria Editora Lda.
Murray, A. and H. Steedman (1998). ‘Growing Skills in Europe: The Changing Skills Profiles of France, Germany, the Netherlands, Portugal, Sweden and the UK’, CEP Discussion Paper n. 399, London School of Economics.
Nolan, B. (2007). Long-Term Trends in Top Income Shares in Ireland, in A.B. Atkinson and T. Piketty, 2007, op. cit.
Nunes, A., E. Mata and N. Valério (1989). ‘Portuguese Economic Growth 1833-1985’, Journal of European Economic History, 18: 291-300.
OECD (Organization for Economic Co-operation and Development (1992). ‘Earnings Inequality: Changes in the 1980s’, in Employment Outlook, July, pp. 157-184.
Payne, S. (1972). A History of Spain and Portugal, Vol. 2, Madison: The University of Wisconsin Press.
Pereira, M. (1993). ‘Liberdade e Contenção na Emigração Portuguesa 1850-1930’, in M. Silva (ed.), Emigração/Imigração, Lisboa: Fragmentos.
Piketty, T. (2001). Les Hauts Revenus en France au 20eme Siècle – Inegalités et Redistributions, 1901-1998, Paris: Editions Grasset.
Piketty, T. and N. Qian (2006). ‘Income Inequality and Progressive Income Taxation in China and India’, 1986-2015, Cepr Discussion Papers 5703.
Piketty, T., and E. Saez (2003), ‘Income Inequality in the United States, 1913-1998’, Quarterly Journal of Economics, 118(1): 1-39.
Piketty, T; G. Postel-Vinay and J. Rosenthal (2006). ‘Wealth Concentration in a Developing Economy: Paris and France, 1807-1994’, American Economic Review, 96(1): 236-256.
Riihelä, M., R. Sullström and M. Tuomala (2005). ‘Trends in Top Income Shares in Finland, VATT Discussion Paper 371, Government Institute for Economic Reseach, Helsinki.
Robinson, R. (1979). Contemporary Portugal, London: George Allen & Unwin.

32
Rodrigues, C. (1988). ‘Estudo Comparativo da Desigualdade das Famílias Portuguesas 1973/74-1980/81’, CISEP Working Paper, Instituto Superior de Economia e Gestão, Lisboa.
Rodrigues, C. (1993). ‘The Measurement and Decomposition of Inequality in Portugal 1980/1981-1989/1990’, Microsimulation Unit Discussion Paper MU9302, Department of Applied Economics, Cambridge University.
Rodrigues, C. (1994). ‘Repartição do Rendimento e Disigualade: Portugal nos Anos 80’, Estudos de Economia, 14(4), pp. 399-427.
Rodrigues, C. (1996). ‘Medição e Decomposição da Desigualdade em Portugal 1980-1990’, Revista de Estatística, 1(3).
Rodrigues, C. (1999). ‘Income Distribution and Poverty in Portugal 1994/1995, A Comparison between the European Community Household Panel and the Household Budget Survey’, Working Paper CISEP, ISEG/Universidade Técnica de Lisboa, June. Portuguese version: ‘Repartição do Rendimento e Pobreza em Portugal 1994/1995-Uma Comparação entre o Painel dos Agregados Familiares e o Inquérito aos Orçamentos Familiares’, Revista de Estatística, 5(1): 117-142.
Rodrigues, C. (2005). Distribução do Rendimento, Desigualdade e Pobreza: Portugal son anos 90, PhD Thesis, Universidade Técnica de Lisboa.
Rodrigues, C. (2008). Distribuição do Rendimento, Desigualdade e Pobreza: Portugal nos anos 90, Coimbra: Editora Almedina.
Rodrigues, C. and J. Albuquerque (2000). ‘Pobreza e Exclusão Social: Percursos e Perspectivas da Investigação em Portugal’, in Actas do Seminário Pobreza e Exclusão Social: Percursos e Perspectivas da Investigação em Portugal, CESIS, Lisboa.
Roine, J. and D. Waldenström (2006). ‘The Evolution of Top Incomes in an Egalitarian Society: Sweden 1903-2004’, SSE/EFI Working Paper Series in Economics and Finance n. 625.
Saez, E. and M. Veall, M. (2005). ‘The Evolution of Top Incomes in Northern America: Lessons from Canadian Evidence’, American Economic Review, 95(3): 831-849. Longer version in A.B. Atkinson and T. Piketty, 2007, op. cit.
Salazar, A. (1939). Doctrine and Action: Internal and Foreign Policy of the New Portugal 1928-1939, London: Faber & Faber Ltd.
Salverda, W. and A. B. Atkinson (2007). ‘Top Incomes in the Netherlands over the Twentieth Century’, in A.B. Atkinson and T. Piketty, 2007, op. cit.
Santos, J. (1983). ‘A Distribuçao Lognormal: Sua Aplicação a dados Portugueses de Distribução do Rendimento’, Estudos de Economia, 3(2): 201-218.
Silva, M. (1971). ‘O Nivel das Receitas das Famílias Portuguesas’, Monografias, Brotéria, Porto.
Silva, M. (1982). ‘Crescimento Económico e Pobreza em Portugal (1950-1970)’, Análise Social, 18(72/73/74).

33
Teekens, R. (1990). ‘Inequality and Poverty. Portugal Compared with Greece, Ireland and Spain’, Estudos de Economia, 10(2): 111-142.
Valério, N. (2001). Estatísticas Históricas Portuguesas, Lisboa: Instituto Nacional de Estatística.
Vieira, J. (1999). The Evolution of Wage Structure in Portugal 1982-1992, PhD. Thesis, Tinbergen Institute, Amsterdam.
Vieira, J., J. Couto and M. Tiago (2006). ‘Inter-Regional Wage Dispersion in Portugal, Regional and Sectoral Economic Studies’, Euro-American Association of Economic Development, 6(1).
Wheeler, D. (1990). ‘Review of Portugal to 1993’, Portuguese Studies Newsletter, 22: 44-45.

Percentile threshold Income threshold Income Groups
Number of Tax Units
Average income in each group
(1) (2) (3) (4) (5)
Full number of Tax Units 5,581,000 14,267 €
Top 10% 27,610 € Top 10-5% 279,050 33,448 €Top 5% 41,216 € Top 5-1% 223,240 55,522 €Top 1% 82,236 € Top 1-0.5% 27,905 91,123 €Top .5% 105,183 € Top 0.5-0.1% 22,324 130,907 €Top .1% 183,696 € Top 0.1-0.01% 5,023 251,407 €Top .01% 493,454 € Top 0.01% 558 741,410 €
Notes: Computations based on income tax return statistics and National Accounts.
Income defined as annual gross income reported on tax returns,
before individual income taxes but net of all social contributions (employer and employee).
Amounts are expressed in 2004 Euros.
Column (2) reports the income thresholds corresponding to each of the percentiles in column (1). For example,
an annual income of at least 27,610 Euros is required to belong to the top 10% tax units, etc.
Thresholds and Average Incomes in Top Income Groups in 2003TABLE 1.

FIGURE 1.Average Real Income and Consumer Price Index in Portugal, 1936-2003
Source: Table A.Figure reports the average real income per adult (aged 20 and above) and per tax unit, expressed in real2004 Euros.CPI index is equal to 100 in 2004.
FIGURE 2The Top 0.01% and 0.1% Income Shares in Portugal, 1936-2003
Source: Table B, column Top 0.01% and column Top 0.1%.
1,000 €
3,000 €
5,000 €
7,000 €
9,000 €
11,000 €
13,000 €
15,000 €
1936
1941
1946
1951
1956
1961
1966
1971
1976
1981
1986
1991
1996
2001
Rea
l Inc
ome
(200
4 Eu
ros)
0
1
10
100
Con
sum
er P
rice
Inde
x (b
ase
100
in 2
004)
Average Real Income per Tax UnitAverage Real Income per AdultCPI
0.0%
1.0%
2.0%
3.0%
4.0%
5.0%
6.0%
1936
1941
1946
1951
1956
1961
1966
1971
1976
1981
1986
1991
1996
2001
Inco
me
Shar
e
Top 0.01% Top 0.1%

FIGURE 3The Top 10-5%, Top 5-1%, and Top 1% Income Share in Portugal, 1976-2003
Source: Table B, columns top 10-5%, top 5-1%, and top 1%.
FIGURE 4The Top 1-0.5%, Top 0.5-0.1%, and Top 0.1% Income Share in Portugal, 1976-2003
Source: Table B, columns top 1-0.5%, top 0.5-0.1%, and top 0.1%.
2%
4%
6%
8%
10%
12%
14%
16%
18%
1976
1977
1978
1979
1980
1981
1982
1983
1984
1985
1986
1987
1988
1989
1990
1991
1992
1993
1994
1995
1996
1997
1998
1999
2000
2001
2002
2003
Inco
me
Shar
e
Top 10-5% Top 5-1% Top 1%
0.5%
1.0%
1.5%
2.0%
2.5%
3.0%
3.5%
4.0%
4.5%
1976
1977
1978
1979
1980
1981
1982
1983
1984
1985
1986
1987
1988
1989
1990
1991
1992
1993
1994
1995
1996
1997
1998
1999
2000
2001
2002
2003
Inco
me
Shar
e
Top 1-0.5% Top 0.5-0.1% Top 0.1%

FIGURE 5The top 0.1% Income Share in Portugal and Marginal Tax Rate, 1976-2003.
Source: Top 0.1% income share from Table B (column top 0.1%).Marginal tax rate: Own computations. Details in Appendix.
FIGURE 6Top 0.1% share in Portugal, UK, Italy, France, Switzerland, United States and Spain
Sources: US: Piketty and Saez (2003); France: Piketty (2001) and Landais (2007);Spain: Alvaredo and Saez (2007); UK: Atkinson (2005);Switzerland: Dell, Piketty and Saez (2007); Portugal: Table B.
0.0%
0.5%
1.0%
1.5%
2.0%
2.5%
3.0%
1976
1977
1978
1979
1980
1981
1982
1983
1984
1985
1986
1987
1988
1989
1990
1991
1992
1993
1994
1995
1996
1997
1998
1999
2000
2001
2002
2003
Top
0.1%
Inco
me
Shar
e
0%
10%
20%
30%
40%
50%
60%
70%
Mar
gina
l Tax
Rat
e
Top 0.1% Marginal Tax Rate
0.0%
1.0%
2.0%
3.0%
4.0%
5.0%
6.0%
7.0%
8.0%
9.0%
1930
1935
1940
1945
1950
1955
1960
1965
1970
1975
1980
1985
1990
1995
2000
Inco
me
Shar
e
Portugal Top 0.1% France Top 0.1%
UK Top 0.1% US Top 0.1%
Spain Top 0.1% Switzerland Top 0.1%

FIGURE 7Top 0.01% share in Portugal, Italy, France, Switzerland and Spain
Sources: France: Piketty (2001) and Landais (2007);Spain: Alvaredo and Saez (2007);Switzerland: Dell, Piketty and Saez (2007); Portugal: Table B.
FIGURE 8The Top 0.01% Income Share in Portugal and counterfactual effects of emigration
0.0%
0.5%
1.0%
1.5%
2.0%
2.5%
1930
1933
1936
1939
1942
1945
1948
1951
1954
1957
1960
1963
1966
1969
1972
1975
1978
1981
1984
1987
1990
1993
1996
1999
2002
Inco
me
Shar
e
Portugal Top 0.01%
France Top 0.01%
Spain Top 0.01%
Switzerland Top 0.01%
0.0%
0.5%
1.0%
1.5%
2.0%
1946
1948
1950
1952
1954
1956
1958
1960
1962
1964
1966
1968
1970
1972
1974
1976
1978
Inco
me
Shar
e
Top 0.01%
Top 0.01% - counterfactual on emigration
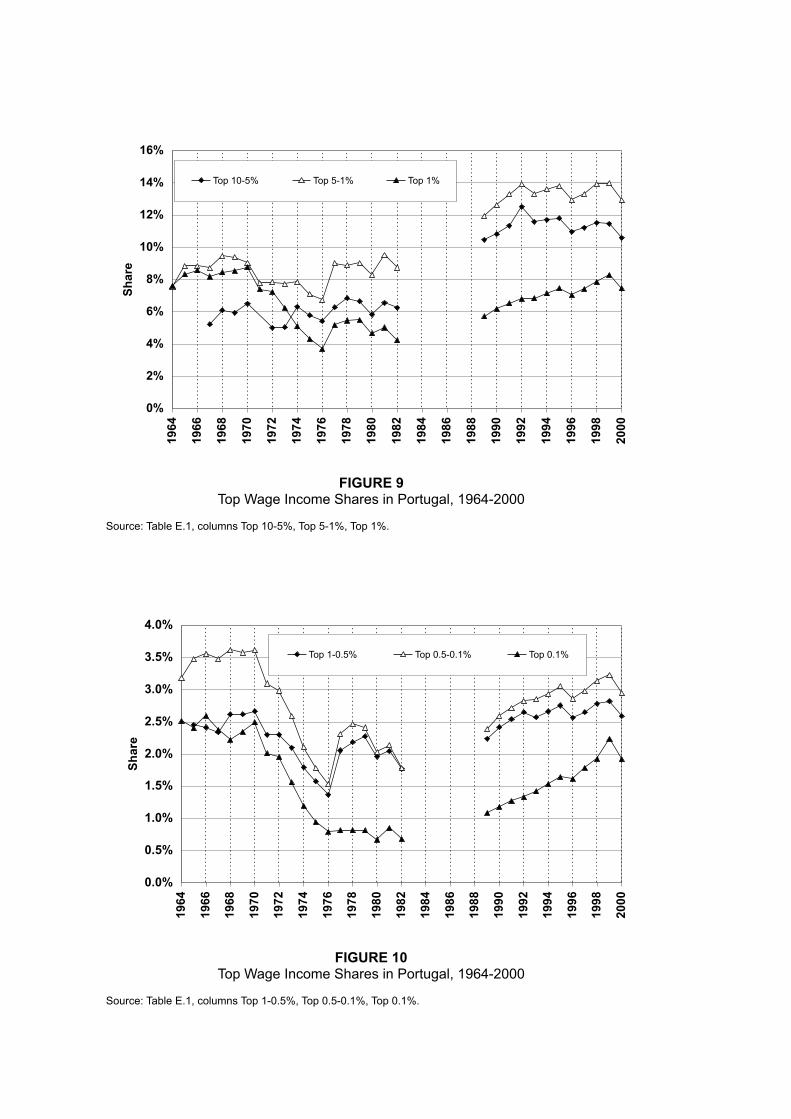
FIGURE 9Top Wage Income Shares in Portugal, 1964-2000
Source: Table E.1, columns Top 10-5%, Top 5-1%, Top 1%.
FIGURE 10Top Wage Income Shares in Portugal, 1964-2000
Source: Table E.1, columns Top 1-0.5%, Top 0.5-0.1%, Top 0.1%.
0%
2%
4%
6%
8%
10%
12%
14%
16%19
64
1966
1968
1970
1972
1974
1976
1978
1980
1982
1984
1986
1988
1990
1992
1994
1996
1998
2000
Shar
e
Top 10-5% Top 5-1% Top 1%
0.0%
0.5%
1.0%
1.5%
2.0%
2.5%
3.0%
3.5%
4.0%
1964
1966
1968
1970
1972
1974
1976
1978
1980
1982
1984
1986
1988
1990
1992
1994
1996
1998
2000
Shar
e
Top 1-0.5% Top 0.5-0.1% Top 0.1%

FIGURE 11
Source: Table F, columns top 10-5%, top 5-1%, and top 1%.
FIGURE 12
Source: Table F, columns Top 1-0.5%, Top 0.5-0.1%, and Top 0.1%.
The Top 10-5%, Top 5-1%, and Top 1% Earnings Shares in Portugal, 1985-2004 from Administrative Records (Quadros de Pessoal)
The Top 1-0.5%, Top 0.5-0.1%, and Top 0.1% Earnings Shares in Portugal, 1985-2004from Administrative Records (Quadros de Pessoal)
4%
6%
8%
10%
12%
14%
1985
1986
1987
1988
1989
1990
1991
1992
1993
1994
1995
1996
1997
1998
1999
2000
2001
2002
2003
2004
Shar
e
Top 10-5% Top 5-1% Top 1%
0.5%
1.0%
1.5%
2.0%
2.5%
3.0%
3.5%
1985
1986
1987
1988
1989
1990
1991
1992
1993
1994
1995
1996
1997
1998
1999
2000
2001
2002
2003
2004
Shar
e
Top 1-0.5% Top 0.5-0.1% Top 0.1%

FIGURE 13
Comparison between Administrative Records (Quadros de Pessoal) and Income Tax Statistics
Source: Table E.1 and Table F, columns top 1-0.5%, top 0.5-0.1%, and top 0.1%.Notes: QP denotes results based on Quadros de Pessoal; IT denotes results based on income tax statistics
FIGURE 14Shares within Shares
Comparison between Administrative Records (Quadros de Pessoal) and Income Tax Statistics
Source: Table E and Table F.Notes: QP denotes results based on Quadros de Pessoal; IT denotes results based on income tax statistics
The Top 1-0.5%, Top 0.5-0.1%, and Top 0.1% Earnings Shares in Portugal, 1985-2004
0.5%
1.0%
1.5%
2.0%
2.5%
3.0%
3.5%
1985
1986
1987
1988
1989
1990
1991
1992
1993
1994
1995
1996
1997
1998
1999
2000
2001
2002
2003
2004
Shar
e
Top 1-0.5% (QP) Top 0.5-0.1% (QP) Top 0.01% (QP)
Top 1-0.5% (IT) Top 0.5-0.1% (IT) Top 0.1% (IT)
10%
15%
20%
25%
30%
35%
1985
1986
1987
1988
1989
1990
1991
1992
1993
1994
1995
1996
1997
1998
1999
2000
2001
2002
2003
2004
Shar
e of
Top
x%
with
in T
op 1
0x%
Top 1% within Top 10% (QP)
Top 0.1% within Top 1% (QP)
Top 1% within Top 10% (IT)
Top 0.1% within Top 1% (IT)

FIGURE 15P10 and P90 income levels as percentage of median income in Portugal
Source: Table G.
180%
200%
220%
240%
260%
280%
300%
1985
1986
1987
1988
1989
1990
1991
1992
1993
1994
1995
1996
1997
1998
1999
2000
2001
2002
2003
2004
P90
as p
erce
ntag
e of
med
ian
wag
e
30%
40%
50%
60%
70%
80%
90%
100%
P10
as p
erce
ntag
e of
med
ian
wag
e
P90 P10

Inflation Taxes(1) (2) (3) (4) (5) (6) (7) (8) (9)
Adults Tax Units Number of (3)/(2) Total income Average income Average income CPI Top Marginaltax returns (%) (millions) per adult per tax unit (2000 base) Tax Rate
('000s) ('000s) ('000s) (2000 Euros) (2000 Euros) (2000 Euros) (%)1936 4,298 3,025 43 1.44 7,834 1,823 2,590 0.71 8.51937 4,357 3,062 45 1.47 8,048 1,847 2,629 0.74 8.51938 4,418 3,099 48 1.53 8,869 2,008 2,862 0.71 8.51939 4,479 3,136 50 1.60 9,396 2,098 2,996 0.67 8.51940 4,541 3,174 54 1.72 8,701 1,916 2,741 0.70 8.51941 4,604 3,213 58 1.81 8,292 1,801 2,581 0.79 8.51942 4,668 3,252 62 1.91 7,891 1,691 2,427 0.97 8.51943 4,732 3,291 67 2.05 8,686 1,835 2,639 1.09 8.51944 4,798 3,331 74 2.21 9,784 2,039 2,937 1.12 8.51945 4,865 3,372 97 2.88 9,538 1,961 2,829 1.22 8.51946 4,932 3,412 11 0.34 10,420 2,113 3,054 1.24 301947 5,000 3,454 14 0.42 10,710 2,142 3,101 1.26 301948 5,070 3,496 16 0.45 10,963 2,163 3,136 1.29 301949 5,140 3,538 18 0.52 11,158 2,171 3,154 1.31 301950 5,211 3,581 22 0.62 11,666 2,239 3,258 1.34 301951 5,254 3,600 25 0.70 12,407 2,362 3,446 1.34 301952 5,296 3,619 25 0.68 12,497 2,360 3,453 1.33 301953 5,339 3,638 27 0.75 13,165 2,466 3,618 1.34 301954 5,383 3,658 28 0.76 14,058 2,612 3,843 1.33 301955 5,426 3,677 29 0.79 14,720 2,713 4,003 1.33 301956 5,470 3,697 35 0.94 15,249 2,788 4,125 1.37 301957 5,515 3,716 38 1.01 15,959 2,894 4,294 1.39 301958 5,560 3,736 40 1.08 16,751 3,013 4,484 1.41 301959 5,605 3,756 35 0.93 17,597 3,140 4,686 1.43 301960 5,650 3,776 34 0.90 18,264 3,232 4,837 1.46 301961 5,633 3,747 34 0.92 18,525 3,289 4,944 1.50 301962 5,616 3,718 37 0.99 20,258 3,607 5,448 1.54 301963 5,599 3,690 44 1.19 20,392 3,642 5,526 1.58 451964 5,582 3,662 29 0.80 21,567 3,864 5,889 1.62 451965 5,565 3,634 44 1.22 24,446 4,393 6,726 1.66 451966 5,548 3,607 45 1.25 24,837 4,477 6,886 1.74 451967 5,531 3,579 53 1.48 26,368 4,767 7,367 1.84 451968 5,514 3,552 58 1.63 26,884 4,876 7,568 1.95 451969 5,497 3,525 64 1.81 26,506 4,822 7,519 2.13 551970 5,480 3,498 75 2.13 28,117 5,130 8,037 2.26 551971 5,565 3,543 87 2.47 29,067 5,223 8,204 2.53 551972 5,650 3,588 106 2.97 30,968 5,481 8,631 2.80 551973 5,737 3,634 125 3.45 32,428 5,652 8,924 3.16 801974 5,825 3,680 149 4.04 30,686 5,268 8,338 3.96 801975 5,915 3,727 128 3.43 30,825 5,211 8,270 4.56 801976 6,006 3,775 684 18.13 31,401 5,228 8,319 5.36 801977 6,098 3,823 559 14.62 31,530 5,170 8,248 6.86 801978 6,192 3,872 548 14.15 32,123 5,188 8,297 8.32 801979 6,287 3,921 702 17.90 32,887 5,231 8,388 10.34 801980 6,384 3,971 837 21.07 35,040 5,489 8,824 12.61 70(married) 80 (single)1981 6,482 4,022 1,112 27.65 35,095 5,414 8,727 15.13 70(married) 80 (single)1982 6,548 4,078 1,333 32.68 34,677 5,296 8,503 18.51 70(married) 80 (single)1983 6,614 4,135 1,389 33.58 35,297 5,337 8,535 23.24 70(married) 80 (single)1984 6,681 4,194 1,385 33.03 33,521 5,017 7,993 30.04 701985 6,749 4,252 1,189 27.95 34,483 5,109 8,109 35.85 50(married) 60 (single)1986 6,817 4,312 1,259 29.20 37,739 5,536 8,752 40.04 50(married) 60 (single)1987 6,886 4,373 1,436 32.84 40,645 5,902 9,295 43.80 50(married) 60 (single)1988 6,956 4,434 542 12.22 44,237 6,359 9,976 48.04 50(married) 60 (single)1989 7,027 4,497 2,104 46.79 42,013 5,979 9,343 54.12 401990 7,098 4,560 2,606 57.15 44,495 6,269 9,758 60.95 401991 7,170 4,624 2,642 57.14 47,219 6,586 10,212 68.33 401992 7,251 4,697 2,781 59.21 49,309 6,801 10,498 74.78 401993 7,332 4,771 2,734 57.31 47,677 6,502 9,993 79.87 401994 7,415 4,847 2,897 59.78 48,750 6,575 10,059 84.13 401995 7,498 4,923 2,882 58.54 49,370 6,584 10,028 87.63 401996 7,583 5,001 3,046 60.90 53,469 7,051 10,692 90.31 401997 7,668 5,080 3,215 63.29 56,349 7,348 11,092 92.44 401998 7,754 5,160 3,312 64.18 59,542 7,678 11,538 95.03 401999 7,842 5,242 3,425 65.35 63,042 8,039 12,027 97.22 402000 7,930 5,325 3,662 68.78 65,862 8,305 12,369 100.00 402001 8,019 5,409 3,869 71.53 68,351 8,523 12,637 104.35 402002 8,110 5,494 3,969 72.24 70,502 8,693 12,832 108.10 402003 8,201 5,581 3,979 71.29 69,688 8,497 12,486 111.63 40
Total IncomeTax Units
TABLE A. Reference Totals for Population, Income and Inflation, 1936-2003
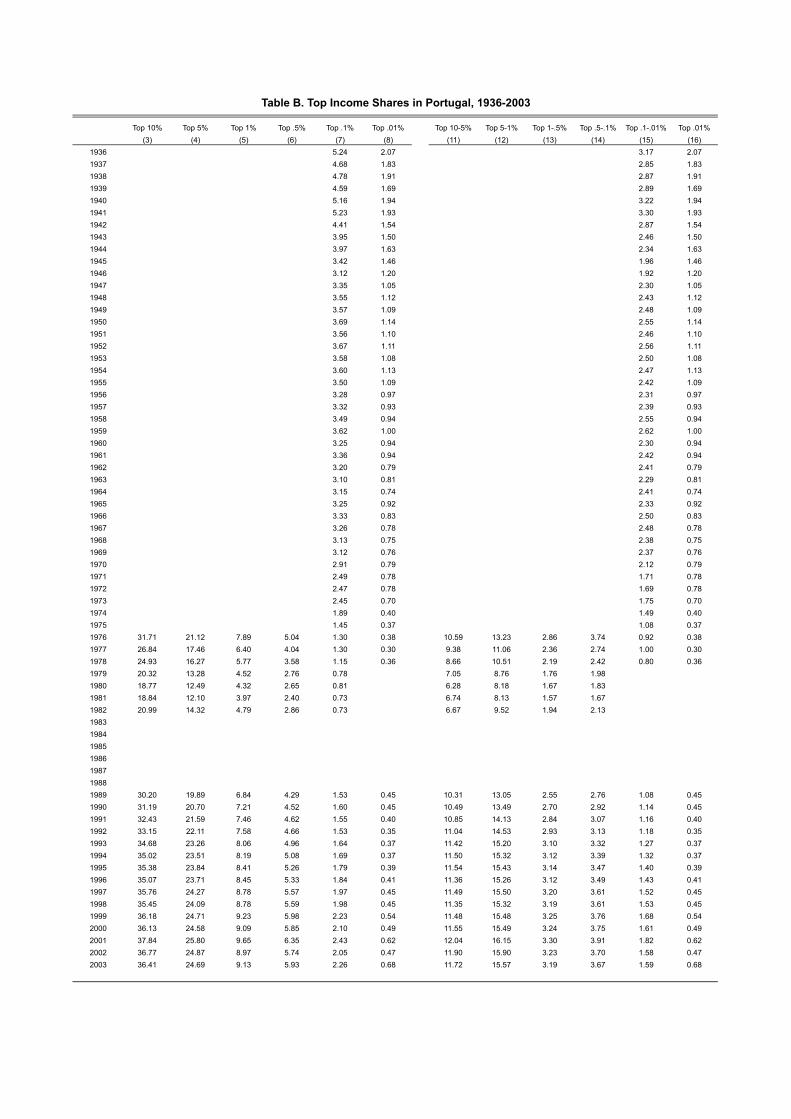
Top 10% Top 5% Top 1% Top .5% Top .1% Top .01% Top 10-5% Top 5-1% Top 1-.5% Top .5-.1% Top .1-.01% Top .01%(3) (4) (5) (6) (7) (8) (11) (12) (13) (14) (15) (16)
1936 5.24 2.07 3.17 2.071937 4.68 1.83 2.85 1.831938 4.78 1.91 2.87 1.911939 4.59 1.69 2.89 1.691940 5.16 1.94 3.22 1.941941 5.23 1.93 3.30 1.931942 4.41 1.54 2.87 1.541943 3.95 1.50 2.46 1.501944 3.97 1.63 2.34 1.631945 3.42 1.46 1.96 1.461946 3.12 1.20 1.92 1.201947 3.35 1.05 2.30 1.051948 3.55 1.12 2.43 1.121949 3.57 1.09 2.48 1.091950 3.69 1.14 2.55 1.141951 3.56 1.10 2.46 1.101952 3.67 1.11 2.56 1.111953 3.58 1.08 2.50 1.081954 3.60 1.13 2.47 1.131955 3.50 1.09 2.42 1.091956 3.28 0.97 2.31 0.971957 3.32 0.93 2.39 0.931958 3.49 0.94 2.55 0.941959 3.62 1.00 2.62 1.001960 3.25 0.94 2.30 0.941961 3.36 0.94 2.42 0.941962 3.20 0.79 2.41 0.791963 3.10 0.81 2.29 0.811964 3.15 0.74 2.41 0.741965 3.25 0.92 2.33 0.921966 3.33 0.83 2.50 0.831967 3.26 0.78 2.48 0.781968 3.13 0.75 2.38 0.751969 3.12 0.76 2.37 0.761970 2.91 0.79 2.12 0.791971 2.49 0.78 1.71 0.781972 2.47 0.78 1.69 0.781973 2.45 0.70 1.75 0.701974 1.89 0.40 1.49 0.401975 1.45 0.37 1.08 0.371976 31.71 21.12 7.89 5.04 1.30 0.38 10.59 13.23 2.86 3.74 0.92 0.381977 26.84 17.46 6.40 4.04 1.30 0.30 9.38 11.06 2.36 2.74 1.00 0.301978 24.93 16.27 5.77 3.58 1.15 0.36 8.66 10.51 2.19 2.42 0.80 0.361979 20.32 13.28 4.52 2.76 0.78 7.05 8.76 1.76 1.981980 18.77 12.49 4.32 2.65 0.81 6.28 8.18 1.67 1.831981 18.84 12.10 3.97 2.40 0.73 6.74 8.13 1.57 1.671982 20.99 14.32 4.79 2.86 0.73 6.67 9.52 1.94 2.131983198419851986198719881989 30.20 19.89 6.84 4.29 1.53 0.45 10.31 13.05 2.55 2.76 1.08 0.451990 31.19 20.70 7.21 4.52 1.60 0.45 10.49 13.49 2.70 2.92 1.14 0.451991 32.43 21.59 7.46 4.62 1.55 0.40 10.85 14.13 2.84 3.07 1.16 0.401992 33.15 22.11 7.58 4.66 1.53 0.35 11.04 14.53 2.93 3.13 1.18 0.351993 34.68 23.26 8.06 4.96 1.64 0.37 11.42 15.20 3.10 3.32 1.27 0.371994 35.02 23.51 8.19 5.08 1.69 0.37 11.50 15.32 3.12 3.39 1.32 0.371995 35.38 23.84 8.41 5.26 1.79 0.39 11.54 15.43 3.14 3.47 1.40 0.391996 35.07 23.71 8.45 5.33 1.84 0.41 11.36 15.26 3.12 3.49 1.43 0.411997 35.76 24.27 8.78 5.57 1.97 0.45 11.49 15.50 3.20 3.61 1.52 0.451998 35.45 24.09 8.78 5.59 1.98 0.45 11.35 15.32 3.19 3.61 1.53 0.451999 36.18 24.71 9.23 5.98 2.23 0.54 11.48 15.48 3.25 3.76 1.68 0.542000 36.13 24.58 9.09 5.85 2.10 0.49 11.55 15.49 3.24 3.75 1.61 0.492001 37.84 25.80 9.65 6.35 2.43 0.62 12.04 16.15 3.30 3.91 1.82 0.622002 36.77 24.87 8.97 5.74 2.05 0.47 11.90 15.90 3.23 3.70 1.58 0.472003 36.41 24.69 9.13 5.93 2.26 0.68 11.72 15.57 3.19 3.67 1.59 0.68
Table B. Top Income Shares in Portugal, 1936-2003

P90-
100
P95-
100
P99-
100
P99.
5-10
0P9
9.9-
100
P99.
99-1
00P9
0-95
P95-
99P9
9-99
.5P9
9.5-
99.9
P99.
9-99
.99
P90
P95
P99
P99.
5P9
9.9
P99.
99
(1)
(2)
(3)
(4)
(5)
(6)
(7)
(8)
(9)
(10)
(11)
(12)
(13)
(14)
(15)
(16)
(17)
1989
28,2
18
37,1
66
63,9
31
80
,131
142,
850
41
6,62
1
19,2
69
30,4
75
47,7
32
64,4
51
11
2,43
1
16,2
06
23,3
00
43,3
13
53,6
38
86,3
80
19
5,62
2
1990
30,4
37
40,3
94
70,3
92
88
,147
155,
751
44
3,20
3
20,4
80
32,8
95
52,6
36
71,2
46
12
3,81
2
17,2
04
24,8
88
47,5
45
59,2
82
95,3
81
22
6,10
7
1991
33,1
18
44,0
88
76,1
50
94
,361
158,
523
40
3,92
9
22,1
49
36,0
72
57,9
39
78,3
21
13
1,25
6
18,4
85
27,1
40
52,3
74
65,3
34
102,
902
23
1,96
6
1992
34,8
05
46,4
29
79,6
15
97
,769
160,
303
36
2,03
2
23,1
82
38,1
33
61,4
60
82,1
36
13
7,88
9
19,2
84
28,5
04
55,3
58
68,8
06
108,
269
23
1,62
3
1993
34,6
55
46,4
82
80,4
91
99
,126
163,
983
36
6,54
8
22,8
28
37,9
79
61,8
57
82,9
11
14
1,47
5
18,8
68
28,2
39
55,5
73
68,9
69
109,
703
23
7,69
3
1994
35,2
19
47,2
97
82,4
18
10
2,11
9
170,
167
37
4,09
3
23,1
40
38,5
17
62,7
18
85,1
07
14
7,50
9
19,1
33
28,5
79
56,3
32
70,2
50
113,
034
24
6,02
1
1995
35,4
81
47,8
15
84,3
10
10
5,56
3
179,
501
39
5,07
3
23,1
47
38,6
91
63,0
58
87,0
78
15
5,54
8
19,1
56
28,5
51
56,9
44
71,3
60
118,
002
25
9,71
7
1996
37,4
97
50,7
00
90,3
33
11
3,86
7
196,
702
44
0,21
9
24,2
94
40,7
92
66,7
98
93,1
59
16
9,64
5
20,0
51
30,1
42
59,9
57
76,1
29
127,
884
28
6,20
4
1997
39,6
62
53,8
45
97,3
58
12
3,65
1
217,
950
49
5,01
5
25,4
80
42,9
67
71,0
65
100,
077
18
7,16
5
20,9
86
31,6
45
63,3
56
81,3
08
140,
303
31
8,66
0
1998
40,9
02
55,6
03
101,
274
12
8,94
3
228,
283
51
9,03
8
26,2
00
44,1
85
73,6
05
104,
108
19
5,97
7
21,5
45
32,5
67
65,3
38
83,9
94
146,
849
33
3,88
4
1999
43,5
14
59,4
29
111,
044
14
3,93
6
267,
531
65
0,72
3
27,6
00
46,5
26
78,1
52
113,
037
22
4,95
4
22,6
80
34,3
09
69,2
65
89,3
74
164,
258
39
9,53
0
2000
44,6
83
60,8
01
112,
388
14
4,58
3
259,
671
60
0,21
1
28,5
65
47,9
04
80,1
92
115,
811
22
1,83
3
23,5
56
35,4
79
71,4
77
92,0
75
165,
181
38
1,80
5
2001
47,8
10
65,1
97
121,
948
16
0,37
3
307,
588
78
0,93
9
30,4
24
51,0
09
83,5
22
123,
570
25
4,99
3
25,0
04
37,4
59
74,7
43
95,5
22
183,
123
46
4,93
3
2002
47,1
89
63,8
34
115,
092
14
7,41
6
263,
001
60
2,07
1
30,5
45
51,0
19
82,7
68
118,
520
22
5,32
7
25,0
88
37,4
93
74,3
02
94,3
92
168,
402
38
5,51
2
2003
45,4
68
61,6
62
113,
940
14
8,12
9
282,
366
84
3,38
5
29,2
73
48,5
93
79,7
51
114,
569
22
0,03
1
24,1
64
36,0
72
71,9
73
92,0
56
160,
770
43
1,87
0
Sou
rce:
Com
puta
tions
bas
ed o
n ta
x st
atis
tics.
Not
es: P
99 d
enot
es th
e in
com
e th
resh
old
requ
ired
to b
elon
g to
the
top
1% o
f tax
uni
ts; P
99-1
00 is
the
aver
age
inco
me
of th
e to
p 1%
;P
99-9
9.5
deno
tes
the
aver
age
inco
me
in th
e bo
ttom
hal
f of t
he to
p pe
rcen
tile.
Tabl
e C
. Top
frac
tiles
inco
me
leve
ls in
Por
tuga
l, 19
89-2
003
(frac
tiles
def
ined
by
tota
l inc
ome;
inco
mes
exp
ress
ed in
Eur
os 2
000)

(1) (2) (3) (4) (5) (6) (7) (8)Employees Employees Employees Employees Average Wage CPI
Wage Tax Files (2)/(1) Quadros PessoalIncome Tax Files (5)/(1) per worker (2000 base)('000s) ('000s) (%) ('000s) ('000) (%) (2000 Euros)
1936 2,254 39 1.75 2,435 0.711937 2,284 40 1.74 2,472 0.741938 2,314 50 2.17 2,692 0.711939 2,346 48 2.06 2,818 0.671940 2,370 55 2.33 2,585 0.701941 2,383 58 2.43 2,451 0.791942 2,398 65 2.70 2,320 0.971943 2,412 66 2.74 2,541 1.091944 2,448 81 3.32 2,823 1.121945 2,475 95 3.84 2,725 1.221946 2,500 87 3.50 2,950 1.241947 2,523 83 3.29 3,007 1.261948 2,537 82 3.25 3,063 1.291949 2,554 90 3.52 3,099 1.311950 2,600 98 3.78 3,187 1.341951 2,678 98 3.67 3,290 1.341952 2,696 91 3.36 3,294 1.331953 2,713 92 3.40 3,450 1.341954 2,697 96 3.57 3,767 1.331955 2,724 98 3.59 3,868 1.331956 2,771 98 3.53 3,882 1.371957 2,804 104 3.70 3,898 1.391958 2,835 109 3.86 3,827 1.411959 2,852 117 4.10 4,077 1.431960 2,874 127 4.40 4,235 1.461961 2,864 139 4.86 4,491 1.501962 2,865 159 5.55 4,624 1.541963 2,879 4,877 1.581964 2,915 181 6.19 5,123 1.621965 2,990 244 8.17 5,462 1.661966 3,064 291 9.50 5,602 1.741967 3,081 350 11.36 6,037 1.841968 3,096 423 13.68 6,147 1.951969 3,146 433 13.75 6,148 2.131970 3,186 459 14.42 6,547 2.261971 3,229 297 9.20 6,527 2.531972 3,291 359 10.91 6,711 2.801973 3,337 483 14.48 6,878 3.161974 3,327 575 17.28 7,191 3.961975 3,254 643 19.75 8,209 4.561976 3,173 856 26.97 8,213 5.361977 3,217 1,154 35.86 7,225 6.861978 3,319 1,134 34.18 6,701 8.321979 3,400 1,306 38.43 6,154 10.341980 3,487 1,460 41.88 6,158 12.611981 3,489 1,695 48.60 6,226 15.131982 3,500 1,843 52.66 6,073 18.511983 3,429 5,715 23.241984 3,478 4,796 30.041985 3,469 1,647 4,768 35.851986 3,446 1,658 5,043 40.041987 3,531 1,691 5,290 43.801988 3,620 1,738 5,583 48.041989 3,751 1,895 2,289 61.03 7,282 54.121990 3,790 2,816 74.29 7,628 60.951991 3,825 1,937 2,863 74.84 8,036 68.331992 3,844 1,963 2,993 77.87 8,382 74.781993 3,770 1,926 3,017 80.05 8,330 79.871994 3,734 1,926 3,045 81.53 8,342 84.131995 3,830 1,944 3,099 80.91 8,273 87.631996 3,964 1,941 3,222 81.28 9,139 90.311997 4,047 2,085 3,397 83.96 9,381 92.441998 4,359 2,135 3,569 81.86 9,136 95.031999 4,419 2,249 3,700 83.72 9,584 97.222000 4,519 2,338 3,871 85.66 10,732 100.002001 4,601 10,691 104.352002 4,624 2,456 10,784 108.102003 4,606 2,521 10,401 111.632004 4,611 2,595 10,266 114.26
Source: See Appendix to Chapter 5.
TABLE D. Reference Totals for Workers, Portugal, 1936-2004

Top 10% Top 5% Top 1% Top .5% Top .1% Top .01% Top 10-5% Top 5-1% Top 1-.5% Top .5-.1% Top .1-.01% Top .01%(1) (2) (3) (4) (5) (6) (7) (8) (9) (10) (11) (12)
1964 15.20 7.63 5.69 2.51 0.69 7.57 1.94 3.18 1.83 0.691965 17.19 8.34 5.88 2.40 0.62 8.85 2.46 3.48 1.78 0.621966 17.43 8.57 6.15 2.60 0.72 8.87 2.41 3.55 1.88 0.721967 22.15 16.93 8.20 5.86 2.38 0.63 5.22 8.74 2.34 3.48 1.75 0.631968 24.06 17.95 8.46 5.85 2.23 0.55 6.11 9.49 2.62 3.62 1.67 0.551969 23.87 17.94 8.55 5.93 2.35 0.62 5.93 9.39 2.62 3.58 1.73 0.621970 24.36 17.83 8.78 6.11 2.50 0.69 6.52 9.06 2.67 3.61 1.80 0.691971 15.22 7.41 5.11 2.01 0.53 7.81 2.30 3.10 1.48 0.531972 20.11 15.09 7.25 4.95 1.96 0.52 5.02 7.84 2.30 2.99 1.44 0.521973 19.05 14.00 6.25 4.15 1.56 0.38 5.06 7.74 2.10 2.59 1.18 0.381974 19.28 12.96 5.10 3.31 1.20 0.28 6.32 7.86 1.80 2.11 0.92 0.281975 17.18 11.40 4.31 2.73 0.95 0.21 5.78 7.10 1.58 1.78 0.74 0.211976 15.88 10.46 3.70 2.33 0.80 0.17 5.42 6.76 1.37 1.53 0.63 0.171977 20.49 14.21 5.20 3.14 0.82 6.27 9.02 2.06 2.321978 21.21 14.36 5.47 3.29 0.82 6.85 8.89 2.18 2.471979 21.21 14.56 5.50 3.23 0.82 6.64 9.06 2.28 2.411980 18.80 12.96 4.67 2.71 0.67 5.83 8.30 1.96 2.031981 21.12 14.56 5.04 2.99 0.85 6.56 9.52 2.05 2.141982 19.26 13.00 4.24 2.47 0.68 6.26 8.76 1.77 1.791983198419851986198719881989 28.15 17.66 5.72 3.48 1.09 0.23 10.48 11.95 2.24 2.39 0.86 0.231990 29.67 18.83 6.20 3.78 1.18 0.24 10.84 12.63 2.42 2.60 0.94 0.241991 31.16 19.82 6.54 4.00 1.28 0.28 11.34 13.28 2.54 2.72 1.00 0.281992 33.27 20.74 6.81 4.16 1.33 0.28 12.52 13.93 2.65 2.83 1.05 0.281993 31.76 20.17 6.85 4.27 1.42 0.31 11.59 13.32 2.57 2.85 1.12 0.311994 32.44 20.74 7.14 4.48 1.54 0.36 11.70 13.60 2.66 2.94 1.18 0.361995 33.07 21.27 7.46 4.70 1.65 0.38 11.80 13.82 2.76 3.05 1.27 0.381996 30.98 20.01 7.05 4.48 1.62 0.41 10.97 12.96 2.57 2.87 1.21 0.411997 31.97 20.75 7.43 4.77 1.79 0.46 11.22 13.32 2.65 2.99 1.33 0.461998 33.32 21.79 7.86 5.07 1.93 0.52 11.53 13.93 2.78 3.14 1.42 0.521999 33.74 22.28 8.29 5.47 2.24 0.66 11.46 13.99 2.82 3.23 1.58 0.662000 31.00 20.41 7.47 4.88 1.92 0.53 10.59 12.94 2.59 2.96 1.40 0.53
Notes: Wage information taken from tabulations of the Imposto Profissional 1964-1982, and from tabulations of the Imposto sobre Rendimiento
das Pessoas Singulares 1989-2000.
The results for 1964-1982 excludes Public Administration employees.
Table E.1. Top Earnings Shares in Portugal, 1964-2000, from Wage Tax information

P90
P95
P99
P99
.5P
99.9
P99
.99
P90
-100
P95
-100
P99
-100
P99
.5-1
00P
99.9
-100
P99
.99-
100
P90
-95
P95
-99
P99
-99.
5P
99.5
-99.
9P
99.9
-99.
99(2
)(3
)(4
)(5
)(6
)(7
)(8
)(9
)(1
0)(1
1)(1
2)(1
3)(1
4)(1
5)(1
6)(1
7)(1
8)19
8913
,315
17,5
7629
,826
36,3
9656
,614
107,
418
20,4
9225
,721
41,6
2850
,628
79,2
8616
3,73
415
,264
21,7
4432
,627
43,4
6469
,903
1990
14,4
5019
,010
33,5
4641
,556
64,2
4211
7,77
922
,632
28,7
3247
,285
57,6
5090
,342
184,
983
16,5
3224
,094
36,9
2149
,477
79,8
2619
9115
,852
21,2
7337
,003
45,6
0670
,841
143,
344
25,0
4131
,857
52,5
3864
,236
102,
436
222,
806
18,2
2626
,687
40,8
4054
,686
89,0
6119
9216
,755
22,4
4639
,059
48,5
2577
,504
158,
186
27,8
8034
,767
57,1
0469
,783
111,
640
238,
053
20,9
9229
,183
44,4
2659
,318
97,5
9419
9317
,120
22,6
1039
,936
49,7
7880
,505
169,
754
26,4
4833
,595
57,0
2571
,173
118,
483
255,
444
19,3
0127
,737
42,8
7759
,346
103,
265
1994
17,0
1322
,457
40,0
9950
,429
82,6
5118
8,89
027
,060
34,6
0259
,573
74,7
0912
8,39
829
8,10
519
,518
28,3
6044
,436
61,2
8710
9,54
119
9517
,238
22,9
7441
,086
51,8
2386
,504
200,
529
27,3
6435
,200
61,7
0377
,773
136,
257
315,
864
19,5
2728
,574
45,6
3463
,152
116,
301
1996
17,5
9323
,586
42,4
3553
,680
90,5
9422
2,86
928
,317
36,5
7564
,440
81,9
7814
8,02
237
6,84
920
,059
29,6
0946
,903
65,4
6712
2,59
619
9718
,197
24,5
8744
,305
56,3
9499
,200
254,
711
29,9
8538
,919
69,6
6589
,546
167,
682
434,
463
21,0
5031
,233
49,7
8370
,012
138,
040
1998
18,0
7624
,748
45,1
8557
,701
101,
651
269,
971
30,4
4139
,819
71,7
7392
,705
176,
319
470,
897
21,0
6231
,830
50,8
4271
,801
143,
589
1999
18,8
5125
,928
48,0
8661
,562
113,
719
336,
400
32,4
0842
,797
79,6
2210
5,02
021
4,97
963
5,94
522
,018
33,5
9154
,224
77,5
3016
8,20
520
0019
,515
27,0
4549
,394
63,0
8911
5,99
631
7,73
733
,273
43,8
0980
,158
104,
670
206,
261
564,
993
22,7
3734
,722
55,6
4679
,272
166,
402
Sou
rce:
with
hold
ings
at t
he s
ourc
e, in
com
e ta
x.
Tabl
e E.
2. F
ract
iles
of E
arni
ngs
in P
ortu
gal f
rom
tax
stat
istic
s, 1
989-
2000
(am
ount
s in
200
0 Eu
ros)

Top
10%
Top
5%To
p 1%
Top
.5%
Top
.1%
Top
.01%
Top
10-5
%To
p 5-
1%To
p 1-
.5%
Top
.5-.1
%To
p .1
-.01%
Top
.01%
(1)
(2)
(3)
(4)
(5)
(6)
(7)
(8)
(9)
(10)
(11)
(12)
1985
27.3
217
.64
6.46
4.31
1.50
0.25
9.68
11.1
82.
152.
811.
250.
2519
8626
.32
16.5
05.
413.
351.
110.
229.
8211
.09
2.06
2.25
0.89
0.22
1987
26.5
816
.69
5.46
3.37
1.09
0.20
9.88
11.2
42.
092.
280.
890.
2019
8827
.15
17.1
75.
663.
491.
120.
209.
9811
.50
2.17
2.37
0.92
0.20
1989
27.7
217
.61
5.86
3.61
1.13
0.19
10.1
111
.75
2.25
2.48
0.94
0.19
1990
1991
29.5
619
.18
6.59
4.00
1.16
0.19
10.3
812
.59
2.59
2.84
0.97
0.19
1992
30.7
020
.03
6.81
4.13
1.21
0.23
10.6
613
.22
2.68
2.91
0.98
0.23
1993
30.9
020
.35
6.99
4.20
1.20
0.22
10.5
413
.37
2.79
2.99
0.98
0.22
1994
31.0
120
.57
7.28
4.50
1.42
0.35
10.4
413
.29
2.78
3.08
1.07
0.35
1995
30.2
219
.78
6.99
4.39
1.47
0.30
10.4
312
.79
2.60
2.92
1.17
0.30
1996
30.6
520
.17
7.21
4.55
1.56
0.31
10.4
812
.95
2.66
2.99
1.24
0.31
1997
30.4
019
.90
7.04
4.44
1.53
0.31
10.4
912
.86
2.60
2.91
1.21
0.31
1998
30.2
819
.82
7.04
4.48
1.61
0.37
10.4
712
.77
2.57
2.87
1.23
0.37
1999
30.4
819
.95
7.12
4.56
1.67
0.44
10.5
312
.83
2.56
2.89
1.23
0.44
2000
30.7
020
.11
7.38
4.86
2.00
0.77
10.5
912
.73
2.52
2.86
1.23
0.77
2001
2002
31.4
220
.87
7.97
5.39
2.45
1.06
10.5
612
.90
2.58
2.94
1.39
1.06
2003
31.8
221
.14
8.02
5.36
2.24
0.78
10.6
813
.12
2.66
3.12
1.46
0.78
2004
31.9
521
.26
8.15
5.48
2.36
0.90
10.6
913
.12
2.66
3.12
1.46
0.90
Sou
rce:
Mic
ro-d
ata
from
Qua
dros
de
Pes
soal
Tabl
e F.
Top
Ear
ning
s Sh
ares
in P
ortu
gal f
rom
Adm
inis
trat
ive
Rec
ords
, 198
5-20
04

Top
90%
Top
80%
Top
70%
Top
60%
Top
50%
Top
40%
Top
30%
Top
20%
Top
10%
Top
100-
90%To
p 90
-80%
Top
80-7
0%To
p 70
-60%
Top
60-5
0%To
p 50
-40%
Top
40-3
0%To
p 30
-20%
Top
20-1
0%To
p 10
%(1
)(2
)(3
)(4
)(5
)(6
)(8
)(9
)(1
0)(1
1)(1
2)(1
3)(1
4)(1
5)(1
6)(1
7)(1
8)(1
9)(2
0)19
8597
.08
91.9
486
.04
79.4
371
.98
63.5
753
.90
42.2
127
.32
2.92
5.14
5.90
6.61
7.45
8.41
9.67
11.6
914
.90
27.3
219
8696
.98
91.7
285
.70
79.0
371
.54
63.1
153
.39
41.5
326
.32
3.02
5.26
6.02
6.67
7.48
8.44
9.72
11.8
615
.21
26.3
219
8796
.94
91.7
185
.73
79.1
071
.69
63.3
353
.69
41.8
426
.58
3.06
5.23
5.98
6.62
7.42
8.36
9.64
11.8
515
.26
26.5
819
8896
.84
91.7
085
.83
79.3
171
.98
63.7
254
.16
42.4
127
.15
3.16
5.14
5.88
6.52
7.33
8.26
9.56
11.7
515
.26
27.1
519
8996
.80
91.7
385
.95
79.5
472
.31
64.1
054
.55
42.8
727
.72
3.20
5.07
5.78
6.41
7.23
8.21
9.55
11.6
815
.16
27.7
219
9019
9196
.80
91.9
086
.43
80.3
073
.39
65.4
956
.19
44.6
929
.56
3.20
4.90
5.48
6.13
6.91
7.90
9.30
11.5
115
.12
29.5
619
9296
.84
92.1
586
.85
80.8
774
.14
66.3
857
.24
45.8
630
.70
3.16
4.69
5.30
5.98
6.73
7.76
9.14
11.3
815
.16
30.7
019
9396
.86
92.2
787
.01
81.0
774
.33
66.6
057
.42
46.0
330
.90
3.14
4.59
5.26
5.94
6.74
7.74
9.17
11.3
915
.14
30.9
019
9496
.84
92.2
686
.99
81.0
674
.33
66.6
257
.53
46.1
731
.01
3.16
4.58
5.27
5.93
6.73
7.70
9.10
11.3
615
.16
31.0
119
9596
.68
92.0
186
.64
80.6
473
.84
66.0
856
.93
45.5
030
.22
3.32
4.67
5.37
6.00
6.80
7.76
9.15
11.4
315
.28
30.2
219
9696
.65
92.0
386
.67
80.7
273
.97
66.2
857
.21
45.8
830
.65
3.35
4.63
5.35
5.96
6.74
7.69
9.07
11.3
315
.23
30.6
519
9796
.74
92.0
786
.70
80.7
073
.94
66.2
257
.11
45.7
230
.40
3.26
4.66
5.37
6.00
6.76
7.71
9.11
11.3
915
.32
30.4
019
9896
.59
91.8
986
.53
80.5
573
.80
66.1
056
.98
45.5
530
.28
3.41
4.69
5.36
5.98
6.76
7.70
9.12
11.4
215
.27
30.2
819
9996
.51
91.8
186
.45
80.4
873
.73
66.0
556
.98
45.6
830
.48
3.49
4.69
5.36
5.97
6.74
7.69
9.07
11.2
915
.20
30.4
820
0096
.67
91.9
886
.67
80.7
374
.02
66.3
457
.27
46.0
130
.70
3.33
4.69
5.31
5.94
6.71
7.68
9.07
11.2
615
.31
30.7
020
0120
0296
.86
92.2
887
.02
81.1
474
.50
66.8
757
.84
46.6
231
.42
3.14
4.59
5.26
5.88
6.64
7.63
9.03
11.2
215
.19
31.4
220
0397
.06
92.5
187
.28
81.4
274
.80
67.2
058
.22
47.0
531
.82
2.94
4.54
5.24
5.85
6.62
7.60
8.98
11.1
715
.23
31.8
220
0497
.08
92.5
587
.36
81.5
474
.94
67.3
358
.34
47.1
731
.95
2.92
4.53
5.19
5.82
6.60
7.61
8.99
11.1
715
.22
31.9
5
Sou
rce:
Mic
ro-d
ata
from
Qua
dros
de
Pes
soal
Tabl
e F
(con
tinue
d).
Earn
ings
Sha
res
in P
ortu
gal f
rom
Adm
inis
trat
ive
Rec
ords
, 198
5-20
04

Med
ian
Wag
eP
90P
95P
99P
99.5
P99
.9P
99.9
9P
90-1
00P
95-1
00P
99-1
00P
99.5
-100
P99
.9-1
00P
99.9
9-10
0P
90-9
5P
95-9
9P
99-9
9.5
P99
.5-9
9.9
P99
.9-9
9.99
(1)
(2)
(3)
(4)
(5)
(6)
(7)
(8)
(9)
(10)
(11)
(12)
(13)
(14)
(15)
(16)
(17)
(18)
1985
5,27
011
,520
14,8
4825
,840
32,9
0577
,602
139,
947
18,2
3123
,545
43,1
3557
,557
99,9
7916
7,92
912
,903
18,6
2628
,682
46,8
9392
,361
1986
5,52
512
,293
15,7
1126
,176
32,0
9453
,280
114,
861
18,3
7023
,029
37,7
5546
,819
77,2
8515
3,50
413
,723
19,3
7128
,725
39,2
5168
,926
1987
5,78
212
,996
16,6
9628
,045
34,6
0556
,365
117,
564
19,5
6724
,580
40,1
7649
,581
80,2
5714
9,99
914
,544
20,6
6630
,749
41,8
8672
,460
1988
5,81
513
,310
17,2
7129
,550
36,5
3859
,969
120,
770
20,3
4225
,730
42,4
4852
,309
84,1
6414
9,63
114
,968
21,5
6932
,617
44,3
7977
,035
1989
5,80
713
,419
17,5
9430
,687
38,3
9362
,789
114,
280
20,8
3026
,472
44,0
3454
,255
84,6
4914
2,10
715
,193
22,0
9133
,830
46,6
7978
,309
1990
1991
6,13
215
,120
20,4
3938
,835
49,0
7576
,592
125,
089
24,7
6032
,137
55,2
1066
,928
97,1
0415
7,85
917
,385
26,3
6143
,450
59,3
7190
,361
1992
6,44
316
,248
22,7
8443
,141
54,0
4883
,722
135,
644
27,3
5135
,699
60,6
7473
,520
108,
119
208,
990
19,0
0529
,461
47,8
3964
,876
96,9
1919
936,
558
16,4
6323
,018
45,4
2357
,596
85,2
9413
4,47
528
,119
37,0
5063
,588
76,3
7210
9,35
020
4,69
319
,180
30,4
0150
,779
68,0
9598
,745
1994
6,66
516
,803
23,1
8746
,329
59,1
3092
,968
160,
553
28,8
7338
,311
67,8
1983
,800
131,
842
324,
289
19,5
1531
,059
52,0
5172
,074
110,
935
1995
6,75
116
,923
22,9
0443
,288
55,3
1293
,008
197,
171
28,1
1936
,819
65,0
4381
,768
136,
974
278,
012
19,4
1329
,752
48,3
0167
,944
121,
207
1996
6,93
517
,528
23,9
1245
,969
58,7
6598
,805
221,
095
29,5
3138
,863
69,5
2487
,649
150,
001
303,
507
20,1
1931
,082
51,1
5271
,773
132,
553
1997
6,96
717
,721
23,8
9845
,301
57,2
5996
,765
222,
332
29,4
0038
,503
68,1
1785
,923
147,
784
303,
720
20,2
9031
,089
50,2
9270
,434
130,
443
1998
7,17
218
,233
24,6
2046
,047
58,3
6298
,064
253,
269
30,2
3339
,570
70,3
2189
,382
160,
442
374,
221
20,9
5831
,975
51,3
9971
,833
137,
099
1999
7,21
118
,515
25,1
4146
,611
58,6
4110
1,37
724
9,63
430
,828
40,3
5772
,010
92,2
9516
9,41
744
8,28
921
,340
32,4
8451
,802
73,1
2613
8,75
720
007,
395
19,1
6225
,725
46,9
9359
,357
104,
748
273,
804
31,8
5141
,725
76,5
8010
0,95
120
7,93
079
7,51
221
,963
32,9
8952
,337
74,1
0514
1,85
620
0120
027,
561
19,5
5526
,653
49,4
4262
,788
111,
316
421,
715
33,5
6344
,571
85,1
1311
5,20
526
1,91
01,
136,
177
22,5
0934
,365
54,9
1278
,374
164,
602
2003
7,50
719
,686
26,8
2750
,605
64,9
1312
0,88
333
5,53
233
,828
44,9
4685
,268
113,
912
238,
289
832,
132
22,6
5834
,785
56,5
0582
,614
172,
174
2004
7,50
619
,717
26,9
6850
,682
65,3
2312
0,81
336
3,12
234
,121
45,4
1086
,999
117,
124
252,
187
964,
532
22,8
3335
,015
56,8
7683
,361
173,
169
Sou
rce:
Mic
ro-d
ata
from
Qua
dros
de
Pes
soal
Not
e: O
rigin
al in
form
atio
n co
rres
pond
s to
mon
thly
ear
ning
s. A
mou
nts
have
bee
n an
nual
ized
by
cons
ider
ing
14 m
onth
ly p
ays
per y
ear.
Tabl
e G
. Fra
ctile
s of
Ear
ning
s in
Por
tuga
l fro
m A
dmin
istr
ativ
e R
ecor
ds, 1
985-
2004
(am
ount
s in
200
0 Eu
ros)

Med
ian
Wag
eP
10P
20P
30P
40P
50P
60P
70P
80P
90P
10-1
00P
20-1
00P
30-1
00P
40-1
00P
50-1
00P
60-1
00P
70-1
00P
80-1
00P
90-1
00P
10-2
0P
20-3
0P
30-4
0P
40-5
0P
50-6
0P
60-7
0P
70-8
0P
80-9
0(1
)(2
)(3
)(4
)(5
)(6
)(7
)(8
)(9
)(1
0)(1
1)(1
2)(1
3)(1
4)(1
5)(1
6)(1
7)(1
8)(1
9)(2
0)(2
1)(2
2)(2
3)(2
4)(2
5)(2
6)(2
7)19
855,
270
2,89
73,
740
4,13
94,
674
5,27
05,
955
7,03
98,
673
11,5
207,
199
7,67
18,
204
8,83
69,
608
10,6
0711
,991
14,0
8718
,231
3,42
83,
931
4,40
74,
970
5,60
56,
447
7,79
19,
932
1986
5,52
53,
079
3,92
54,
378
4,93
65,
525
6,27
97,
413
9,22
512
,293
7,51
98,
000
8,54
39,
191
9,98
511
,010
12,4
1914
,491
18,3
703,
675
4,20
34,
660
5,22
95,
895
6,78
78,
286
10,6
2519
875,
782
3,29
74,
097
4,65
55,
153
5,78
26,
540
7,80
39,
777
12,9
967,
931
8,44
09,
017
9,70
710
,556
11,6
5713
,177
15,4
0219
,567
3,85
04,
403
4,87
45,
456
6,14
97,
089
8,72
211
,230
1988
5,81
53,
382
4,09
94,
652
5,15
75,
815
6,58
77,
850
9,90
713
,310
8,06
48,
590
9,18
99,
905
10,7
8911
,938
13,5
3015
,890
20,3
423,
855
4,40
74,
890
5,49
76,
194
7,17
08,
815
11,4
4819
895,
807
3,42
54,
052
4,54
95,
149
5,80
76,
574
7,83
19,
814
13,4
198,
083
8,61
79,
227
9,96
210
,868
12,0
4213
,665
16,1
0920
,830
3,81
44,
345
4,82
15,
436
6,17
17,
176
8,77
911
,394
1990
1991
6,13
23,
781
4,32
34,
856
5,41
66,
132
7,14
78,
585
10,8
3315
,120
9,00
89,
621
10,3
4011
,209
12,2
9413
,712
15,6
8718
,712
24,7
604,
101
4,58
65,
130
5,78
56,
614
7,78
79,
634
12,6
6119
926,
443
3,80
74,
437
5,01
55,
603
6,44
37,
470
9,01
111
,464
16,2
489,
587
10,2
6311
,054
12,0
1113
,212
14,7
8816
,999
20,4
2827
,351
4,17
74,
725
5,33
05,
993
6,91
58,
147
10,1
4213
,508
1993
6,55
83,
891
4,45
95,
106
5,73
36,
558
7,60
79,
181
11,7
5616
,463
9,79
710
,498
11,3
1312
,298
13,5
3215
,153
17,4
2320
,947
28,1
194,
176
4,78
75,
401
6,13
27,
037
8,34
610
,363
13,7
6919
946,
665
4,09
24,
581
5,21
35,
839
6,66
57,
725
9,34
712
,063
16,8
0310
,021
10,7
3911
,573
12,5
8113
,843
15,5
1117
,857
21,4
9628
,873
4,28
04,
926
5,54
66,
295
7,20
08,
506
10,6
2414
,175
1995
6,75
14,
144
4,71
05,
267
5,92
86,
751
7,78
79,
403
12,1
1016
,923
9,99
810
,703
11,5
1812
,506
13,7
4315
,373
17,6
5921
,169
28,1
194,
344
4,99
65,
585
6,32
17,
219
8,51
510
,632
14,2
1419
966,
935
4,22
24,
844
5,41
36,
101
6,93
57,
968
9,65
912
,441
17,5
2810
,351
11,0
8411
,932
12,9
6314
,256
15,9
6718
,375
22,1
0229
,531
4,44
25,
138
5,71
76,
472
7,38
48,
707
10,8
7814
,615
1997
6,96
74,
283
4,91
05,
478
6,13
06,
967
8,02
79,
728
12,5
8617
,721
10,3
9911
,133
11,9
8013
,010
14,3
0316
,014
18,4
1422
,111
29,4
004,
508
5,19
75,
799
6,54
07,
459
8,80
811
,017
14,8
1719
987,
172
4,32
85,
072
5,64
86,
335
7,17
28,
302
10,0
6812
,967
18,2
3310
,716
11,4
6712
,341
13,4
0314
,734
16,4
9718
,961
22,7
3930
,233
4,70
05,
368
5,98
56,
767
7,70
79,
131
11,4
3715
,288
1999
7,21
14,
403
5,12
35,
721
6,41
97,
211
8,39
710
,085
13,0
0118
,515
10,8
5011
,607
12,4
9013
,565
14,9
1416
,700
19,2
0823
,102
30,8
284,
755
5,43
06,
050
6,83
17,
785
9,18
811
,439
15,3
9920
007,
395
4,45
55,
237
5,81
76,
549
7,39
58,
572
10,3
6713
,317
19,1
6211
,145
11,9
3012
,846
13,9
5915
,358
17,2
0719
,807
23,8
6731
,851
4,85
85,
509
6,15
86,
960
7,95
99,
399
11,6
7815
,872
2001
2002
7,56
14,
507
5,31
05,
930
6,65
37,
561
8,81
110
,618
13,6
4519
,555
11,4
9612
,320
13,2
7714
,444
15,9
1417
,856
20,5
9324
,895
33,5
634,
887
5,60
46,
263
7,07
88,
130
9,62
611
,964
16,1
9420
037,
507
4,47
25,
255
5,88
46,
591
7,50
78,
758
10,5
0913
,547
19,6
8611
,467
12,2
9513
,256
14,4
2815
,905
17,8
6220
,631
25,0
0933
,828
4,82
15,
554
6,20
97,
025
8,06
19,
530
11,8
4916
,152
2004
7,50
64,
480
5,23
25,
854
6,61
77,
506
8,78
610
,544
13,5
7819
,717
11,5
2012
,354
13,3
2614
,512
16,0
0417
,974
20,7
6525
,184
34,1
214,
833
5,54
66,
217
7,04
78,
126
9,60
111
,927
16,2
48
Sou
rce:
Mic
ro-d
ata
from
Qua
dros
de
Pes
soal
Not
e: O
rigin
al in
form
atio
n co
rres
pond
s to
mon
thly
ear
ning
s. A
mou
nts
have
bee
n an
nual
ized
by
cons
ider
ing
14 m
onth
ly p
ays
per y
ear.
Tabl
e G
(con
tinue
d). F
ract
iles
of E
arni
ngs
in P
ortu
gal f
rom
Adm
inis
trat
ive
Rec
ords
, 198
5-20
04(a
mou
nts
in 2
000
Euro
s)

Tota
lm
ale
fem
ale
mal
efe
mal
em
ale
fem
ale
with
wag
e>0
with
wag
e=0
with
wag
e>0
with
wag
e=0
with
wag
e>0
with
wag
e=0
with
wag
e>0
with
wag
e=0
1985
1,89
8,67
582
,663
19,0
2797
61,
356
1,10
4,84
579
,250
528,
009
64,4
939,
490
2,98
32,
580
1,23
61,
254
513
1986
1,89
7,78
583
,892
19,8
1786
01,
290
1,09
4,06
077
,133
550,
834
52,2
628,
188
3,36
62,
327
1,16
61,
750
840
1987
1,93
6,80
185
,253
21,1
4166
21,
097
1,10
5,82
178
,564
573,
813
55,4
636,
806
2,57
52,
438
1,09
91,
262
807
1988
1,99
6,80
293
,432
24,1
3668
61,
047
1,12
1,15
180
,378
606,
739
55,6
656,
882
2,14
22,
012
888
1,02
861
619
892,
169,
830
101,
460
27,6
5172
41,
145
1,19
8,46
683
,661
680,
583
57,9
406,
217
1,61
52,
365
647
4,59
72,
759
1990
1991
2,23
3,23
790
,878
27,0
5863
787
31,
195,
350
103,
478
727,
548
71,6
252,
620
1,07
81,
077
299
6,67
64,
040
1992
2,26
8,15
195
,443
29,4
0662
167
91,
198,
749
103,
558
751,
613
74,2
011,
826
513
867
266
6,01
84,
391
1993
2,21
5,48
110
3,50
032
,352
624
719
1,17
1,87
688
,442
742,
880
63,6
051,
878
225
673
158
5,11
93,
430
1994
2,20
2,60
911
7,61
838
,950
596
961
1,14
5,88
164
,264
770,
379
53,8
231,
775
263
882
164
4,35
32,
700
1995
2,23
2,54
812
2,86
441
,819
426
701
1,15
2,82
164
,979
787,
793
56,9
121,
937
578
799
259
373
287
1996
2,23
3,71
312
4,21
942
,207
361
544
1,14
7,36
465
,979
790,
255
58,9
961,
470
357
527
244
718
472
1997
2,35
0,78
213
1,15
347
,232
411
494
1,21
3,27
943
,980
869,
752
41,9
821,
179
9463
561
271
259
1998
2,43
0,69
112
9,39
547
,812
468
624
1,23
5,90
958
,428
897,
502
58,5
0578
510
537
774
396
311
1999
2,56
8,45
613
7,24
051
,352
505
865
1,29
0,83
763
,948
955,
045
65,8
441,
077
6355
335
742
350
2000
2,68
8,95
715
9,71
659
,846
605
1,20
41,
330,
450
63,4
651,
004,
942
65,9
051,
182
6446
663
587
462
2001
2002
2,82
0,77
218
1,61
369
,180
615
961
1,40
9,74
455
,294
1,04
3,32
256
,606
1,10
087
433
261,
048
743
2003
2,85
5,59
916
5,55
365
,505
584
857
1,42
9,44
349
,693
1,08
6,49
652
,420
1,16
581
640
271,
817
1,31
820
042,
912,
304
155,
817
63,5
0781
11,
090
1,47
1,35
045
,106
1,11
9,36
150
,829
909
6942
568
1,76
71,
195
Sou
rce:
Mic
ro-d
ata
from
Qua
dros
de
Pes
soal
.
empl
oyer
s
Tabl
e H
. Sam
ple
Size
of A
dmin
istr
ativ
e R
ecor
ds o
n Ea
rnin
gs (Q
uadr
os d
e Pe
ssoa
l)
not c
lass
ified
/unk
now
nfa
mily
em
ploy
ees
with
no
sala
ryem
ploy
ees
coop
erat
ive
wor
kers
mal
efe
mal
em
ale
fem
ale

Year
Returns on real estate and farm income
Returns on capital
Business income
(excluding farm)
Employment income
1946 Top 0.3 % 37.30 7.17 25.61 29.921947 Top 0.4 % 34.16 6.92 29.77 29.141948 Top 0.5 % 32.25 7.33 31.20 29.221949 Top 0.5 % 33.01 7.53 30.84 28.621950 Top 0.6 % 34.75 7.04 28.23 29.981951 Top 0.7 % 35.02 7.09 28.00 29.901952 Top 0.7 % 34.65 7.19 27.26 30.891953 Top 0.8 % 35.52 6.77 26.82 30.901954 Top 0.8 % 36.75 6.67 26.01 30.571955 Top 0.8 % 36.58 6.40 25.88 31.141956 Top 0.9 % 37.16 6.10 26.11 30.631957 Top 1.0 % 34.32 5.26 26.38 34.051958 Top 1.1 % 37.39 4.87 25.07 32.671959 Top 0.9 % 38.41 4.86 24.55 32.171960 Top 0.9 % 39.32 4.61 22.69 33.391961 Top 0.9 % 39.97 4.75 22.28 33.001962 Top 1.0 % 39.65 4.45 22.56 33.331963 Top 1.2 % 38.47 4.38 22.90 34.25
Source: official income tax statistics. The composition statistics are only available in aggregate. As a result, the size of the corresponding top group varies across those years.
Top income group fractile
Table I. Composition of Top Incomes under Old Income Tax 1946-1963
Composition

Rate Rate(%) (%)
5,000 0.50 7,000 15,000 2.005,000 10,000 1.00 15,000 30,000 2.50
10,000 15,000 1.50 30,000 45,000 3.0015,000 20,000 2.00 45,000 60,000 3.5020,000 25,000 2.50 60,000 75,000 4.0025,000 30,000 3.25 75,000 90,000 4.5030,000 35,000 4.00 90,000 105,000 5.0035,000 40,000 4.75 105,000 120,000 5.5040,000 45,000 5.50 120,000 135,000 6.0045,000 50,000 6.25 135,000 150,000 6.5050,000 55,000 7.00 150,000 165,000 7.00
165,000 180,000 7.50180,000 200,000 8.00200,000 8.50
Range of Taxable Income(escudos)
Range of Taxable Income
Table J. Tax Scale. Portugal: 1922-1932
Imposto Complementar
(escudos)
1922-1926 1927-1932
beyond 55,000 escudos, rate increases1% per each additional 5,000 escudosup to a maximum marginal rate of 30%
Imposto Pessoal do Rendimento

Rate Rate Rate Rate(%) (%) (%) (%)
10,000 11,000 0.18 61,000 62,000 2.14 112,000 113,000 3.46 163,000 164,000 4.3611,000 12,000 0.33 62,000 63,000 2.49 113,000 114,000 3.48 164,000 165,000 4.3812,000 13,000 0.46 63,000 64,000 2.52 114,000 115,000 3.50 165,000 166,000 4.4013,000 14,000 0.57 64,000 65,000 2.54 115,000 116,000 3.52 166,000 167,000 4.4214,000 15,000 0.67 65,000 66,000 2.56 116,000 117,000 3.53 167,000 168,000 4.4315,000 16,000 0.78 66,000 67,000 2.58 117,000 118,000 3.55 168,000 169,000 4.4516,000 17,000 0.88 67,000 68,000 2.60 118,000 119,000 3.57 169,000 170,000 4.4717,000 18,000 0.97 68,000 69,000 2.62 119,000 120,000 3.58 170,000 171,000 4.4918,000 19,000 1.05 69,000 70,000 2.64 120,000 121,000 3.60 171,000 172,000 4.5119,000 20,000 1.12 70,000 71,000 2.66 121,000 122,000 3.62 172,000 173,000 4.5220,000 21,000 1.19 71,000 72,000 2.68 122,000 123,000 3.64 173,000 174,000 4.5421,000 22,000 1.25 72,000 73,000 2.70 123,000 124,000 3.66 174,000 175,000 4.5622,000 23,000 1.30 73,000 74,000 2.72 124,000 125,000 3.68 175,000 176,000 4.5723,000 24,000 1.35 74,000 75,000 2.73 125,000 126,000 3.70 176,000 177,000 4.5924,000 25,000 1.40 75,000 76,000 2.76 126,000 127,000 3.72 177,000 178,000 4.6125,000 26,000 1.44 76,000 77,000 2.78 127,000 128,000 3.73 178,000 179,000 4.6226,000 27,000 1.48 77,000 78,000 2.80 128,000 129,000 3.75 179,000 180,000 4.6427,000 28,000 1.52 78,000 79,000 2.82 129,000 130,000 3.77 180,000 181,000 4.6628,000 29,000 1.55 79,000 80,000 2.84 130,000 131,000 3.79 181,000 182,000 4.6829,000 30,000 1.58 80,000 81,000 2.86 131,000 132,000 3.80 182,000 183,000 4.6930,000 31,000 1.63 81,000 82,000 2.88 132,000 133,000 3.82 183,000 184,000 4.7131,000 32,000 1.67 82,000 83,000 2.90 133,000 134,000 3.84 184,000 185,000 4.7332,000 33,000 1.71 83,000 84,000 2.92 134,000 135,000 3.85 185,000 186,000 4.7533,000 34,000 1.75 84,000 85,000 2.94 135,000 136,000 3.87 186,000 187,000 4.7634,000 35,000 1.79 85,000 86,000 2.96 136,000 137,000 3.89 187,000 188,000 4.7835,000 36,000 1.82 86,000 87,000 2.98 137,000 138,000 3.91 188,000 189,000 4.8036,000 37,000 1.85 87,000 88,000 2.99 138,000 139,000 3.93 189,000 190,000 4.8237,000 38,000 1.88 88,000 89,000 3.01 139,000 140,000 3.95 190,000 191,000 4.8338,000 39,000 1.91 89,000 90,000 3.03 140,000 141,000 3.96 191,000 192,000 4.8539,000 40,000 1.94 90,000 91,000 3.05 141,000 142,000 3.98 192,000 193,000 4.8640,000 41,000 1.96 91,000 92,000 3.07 142,000 143,000 4.00 193,000 194,000 4.8841,000 42,000 1.99 92,000 93,000 3.09 143,000 144,000 4.02 194,000 195,000 4.9042,000 43,000 2.01 93,000 94,000 3.11 144,000 145,000 4.03 195,000 196,000 4.9143,000 44,000 2.03 94,000 95,000 3.13 145,000 146,000 4.05 196,000 197,000 4.9344,000 45,000 2.06 95,000 96,000 3.15 146,000 147,000 4.07 197,000 198,000 4.9445,000 46,000 2.09 96,000 97,000 3.17 147,000 148,000 4.08 198,000 199,000 4.9646,000 47,000 2.12 97,000 98,000 3.19 148,000 149,000 4.10 199,000 200,000 4.9747,000 48,000 2.15 98,000 99,000 3.21 149,000 150,000 4.1248,000 49,000 2.17 99,000 100,000 3.22 150,000 151,000 4.14 For income above 200,000 escudos49,000 50,000 2.20 100,000 101,000 3.24 151,000 152,000 4.15 the tax rate = 8.5-705/(income/1,000)50,000 51,000 2.23 101,000 102,000 3.26 152,000 153,000 4.1751,000 52,000 2.25 102,000 103,000 3.28 153,000 154,000 4.1952,000 53,000 2.27 103,000 104,000 3.29 154,000 155,000 4.2153,000 54,000 2.30 104,000 105,000 3.31 155,000 156,000 4.2354,000 55,000 2.32 105,000 106,000 3.33 156,000 157,000 4.2455,000 56,000 2.34 106,000 107,000 3.35 157,000 158,000 4.2656,000 57,000 2.36 107,000 108,000 3.37 158,000 159,000 4.2857,000 58,000 2.38 108,000 109,000 3.39 159,000 160,000 4.3058,000 59,000 2.40 109,000 110,000 3.41 160,000 161,000 4.3159,000 60,000 2.42 110,000 111,000 3.43 161,000 162,000 4.3360,000 61,000 2.44 111,000 112,000 3.45 162,000 163,000 4.35
Range of Taxable Income
Table J (continued). Tax Scale Imposto Complementar 1933-1945
Range of Taxable Income(escudos)
Range of Taxable Income(escudos)(escudos)
Range of Taxable Income(escudos)

Rat
eR
ate
Rat
eR
ate
Rat
e(%
)(%
)(%
)(%
)(%
)
50,0
00
10
0,00
0
3.
050
,000
3.0
50,0
00
3.
050
,000
3.
050
,000
4.
010
0,00
0
15
0,00
0
4.
050
,000
100,
000
4.0
50,0
00
10
0,00
0
4.
050
,000
10
0,00
0
4.5
50,0
00
100,
000
6.
015
0,00
0
20
0,00
0
5.
010
0,00
0
15
0,00
0
5.
010
0,00
0
15
0,00
0
5.
010
0,00
0
150,
000
6.
010
0,00
0
200,
000
8.
020
0,00
0
25
0,00
0
6.
015
0,00
0
20
0,00
0
6.
015
0,00
0
20
0,00
0
6.
015
0,00
0
200,
000
8.
020
0,00
0
300,
000
14
.025
0,00
0
30
0,00
0
7.
020
0,00
0
25
0,00
0
7.
020
0,00
0
25
0,00
0
7.
020
0,00
0
250,
000
10
.030
0,00
0
400,
000
20
.030
0,00
0
35
0,00
0
8.
025
0,00
0
30
0,00
0
8.
025
0,00
0
30
0,00
0
8.
525
0,00
0
300,
000
12
.040
0,00
0
500,
000
26
.035
0,00
0
40
0,00
0
9.
030
0,00
0
35
0,00
0
9.
030
0,00
0
35
0,00
0
10
.030
0,00
0
350,
000
14
.050
0,00
0
600,
000
34
.040
0,00
0
45
0,00
0
10
.035
0,00
0
40
0,00
0
10
.035
0,00
0
40
0,00
0
11
.535
0,00
0
400,
000
17
.060
0,00
0
700,
000
42
.045
0,00
0
50
0,00
0
11
.040
0,00
0
45
0,00
0
11
.040
0,00
0
45
0,00
0
13
.040
0,00
0
450,
000
20
.070
0,00
0
800,
000
50
.050
0,00
0
55
0,00
0
12
.045
0,00
0
50
0,00
0
12
.045
0,00
0
50
0,00
0
14
.545
0,00
0
500,
000
23
.080
0,00
0
900,
000
60
.055
0,00
0
60
0,00
0
13
.050
0,00
0
55
0,00
0
13
.050
0,00
0
55
0,00
0
16
.050
0,00
0
550,
000
26
.090
0,00
0
1,00
0,00
0
70
.060
0,00
0
65
0,00
0
14
.055
0,00
0
60
0,00
0
14
.055
0,00
0
60
0,00
0
17
.555
0,00
0
600,
000
29
.01,
000,
000
80.0
650,
000
700,
000
15.0
600,
000
650,
000
15.0
600,
000
650,
000
19.0
600,
000
65
0,00
0
32.0
700,
000
750,
000
16.0
650,
000
700,
000
16.0
650,
000
700,
000
21.0
650,
000
70
0,00
0
35.0
750,
000
800,
000
17.0
700,
000
750,
000
17.0
700,
000
750,
000
23.0
700,
000
75
0,00
0
38.0
800,
000
850,
000
18.0
750,
000
800,
000
18.0
750,
000
800,
000
25.0
750,
000
80
0,00
0
41.0
850,
000
900,
000
19.0
800,
000
850,
000
19.0
800,
000
850,
000
27.0
800,
000
85
0,00
0
44.0
900,
000
950,
000
20.0
850,
000
900,
000
20.0
850,
000
900,
000
29.0
850,
000
90
0,00
0
48.0
950,
000
1,00
0,00
0
21.0
900,
000
950,
000
21.0
900,
000
950,
000
31.0
900,
000
95
0,00
0
52.0
1,00
0,00
0
1,05
0,00
0
22.0
950,
000
1,00
0,00
0
22.0
950,
000
1,00
0,00
0
33.0
950,
000
1,
000,
000
56.0
1,05
0,00
0
1,10
0,00
0
23.0
1,00
0,00
0
1,05
0,00
0
23.0
1,00
0,00
0
1,05
0,00
0
35.0
1,00
0,00
0
1,
050,
000
60.0
1,10
0,00
0
1,15
0,00
0
24.0
1,05
0,00
0
1,10
0,00
0
24.0
1,05
0,00
0
1,10
0,00
0
37.0
1,05
0,00
0
1,
100,
000
64.0
1,15
0,00
0
1,20
0,00
0
25.0
1,10
0,00
0
1,15
0,00
0
25.0
1,10
0,00
0
1,15
0,00
0
39.0
1,10
0,00
0
1,
150,
000
68.0
1,20
0,00
0
1,25
0,00
0
26.0
1,15
0,00
0
1,20
0,00
0
26.0
1,15
0,00
0
1,20
0,00
0
41.0
1,15
0,00
0
1,
200,
000
72.0
1,25
0,00
0
1,30
0,00
0
27.0
1,20
0,00
0
1,30
0,00
0
27.0
1,20
0,00
0
1,25
0,00
0
43.0
1,20
0,00
0
1,
250,
000
76.0
1,30
0,00
0
1,35
0,00
0
28.0
1,30
0,00
0
1,40
0,00
0
28.0
1,25
0,00
0
1,30
0,00
0
45.0
1,25
0,00
0
80
.01,
350,
000
1,
400,
000
29
.01,
400,
000
1,
500,
000
29
.01,
300,
000
1,
350,
000
47
.01,
400,
000
30
.01,
500,
000
1,
600,
000
30
.01,
350,
000
1,
400,
000
49
.01,
600,
000
1,
700,
000
31
.01,
400,
000
1,
450,
000
51
.01,
700,
000
1,
800,
000
32
.01,
450,
000
1,
500,
000
53
.01,
800,
000
1,
900,
000
33
.01,
500,
000
55
.01,
900,
000
2,
000,
000
34
.02,
000,
000
2,
100,
000
35
.02,
100,
000
2,
200,
000
36
.02,
200,
000
2,
300,
000
37
.02,
300,
000
2,
400,
000
38
.02,
400,
000
2,
500,
000
39
.02,
500,
000
2,
600,
000
40
.02,
600,
000
2,
700,
000
41
.02,
700,
000
2,
800,
000
42
.02,
800,
000
2,
900,
000
43
.02,
900,
000
3,
000,
000
44
.03,
000,
000
45
.0
1973
-197
4
Ran
ge o
f Tax
able
Inco
me
(esc
udos
)
1975
-197
8
Ran
ge o
f Tax
able
Inco
me
(esc
udos
)
1969
-197
2
Ran
ge o
f Tax
able
Inco
me
(esc
udos
)
Tabl
e J
(con
tinue
d). T
ax S
cale
Impo
sto
Com
plem
enta
r 194
6-19
78
(esc
udos
)(e
scud
os)
1946
-196
319
64-1
988
Ran
ge o
f Tax
able
Inco
me
Ran
ge o
f Tax
able
Inco
me

Rat
es m
arrie
dR
ates
sin
gle
(%)
(%)
100,
000
150,
000
180,
000
4.0
4.8
100,
000
200,
000
150,
000
300,
000
180,
000
360,
000
6.0
7.2
200,
000
350,
000
300,
000
500,
000
360,
000
600,
000
8.0
9.6
350,
000
500,
000
500,
000
700,
000
600,
000
840,
000
14.0
16.8
500,
000
650,
000
700,
000
900,
000
840,
000
1,08
0,00
0
20.0
24.0
650,
000
800,
000
900,
000
1,10
0,00
0
1,08
0,00
0
1,32
0,00
0
26.0
31.2
800,
000
950,
000
1,10
0,00
0
1,30
0,00
0
1,32
0,00
0
1,56
0,00
0
34.0
40.8
950,
000
1,10
0,00
0
1,30
0,00
0
1,50
0,00
0
1,56
0,00
0
1,80
0,00
0
42.0
50.4
1,10
0,00
0
1,25
0,00
0
1,50
0,00
0
1,70
0,00
0
1,80
0,00
0
2,04
0,00
0
50.0
60.0
1,25
0,00
0
1,40
0,00
0
1,70
0,00
0
1,90
0,00
0
2,04
0,00
0
2,28
0,00
0
60.0
72.0
1,40
0,00
0
1,90
0,00
0
2,28
0,00
0
70.0
80.0
1982
Tabl
e J
(con
tinue
d). T
ax S
cale
Impo
sto
Com
plem
enta
r 197
9-19
82
Ran
ge o
f Tax
able
Inco
me
(esc
udos
)R
ange
of T
axab
le In
com
e(e
scud
os)
Ran
ge o
f Tax
able
Inco
me
(esc
udos
)
1979
-198
019
81

for m
arrie
d co
uple
s
Rat
esR
ates
Rat
es(%
)(%
)(%
)
220,
000
4.0
280,
000
4.0
320,
000
350,
000
375,
000
4.0
220,
000
440,
000
6.0
280,
000
550,
000
6.0
320,
000
630,
000
350,
000
690,
000
375,
000
740,
000
6.0
440,
000
720,
000
8.0
550,
000
900,
000
8.0
630,
000
1,04
0,00
0
690,
000
1,14
0,00
0
740,
000
1,22
0,00
0
8.0
720,
000
1,08
0,00
0
14.0
900,
000
1,35
0,00
0
14.0
1,04
0,00
0
1,55
0,00
0
1,14
0,00
0
1,70
0,00
0
1,22
0,00
0
1,82
0,00
0
12.0
1,08
0,00
0
1,30
0,00
0
20.0
1,35
0,00
0
1,65
0,00
0
20.0
1,55
0,00
0
1,90
0,00
0
1,70
0,00
0
2,07
0,00
0
1,82
0,00
0
2,21
5,00
0
18.0
1,30
0,00
0
1,90
0,00
0
26.0
1,65
0,00
0
2,35
0,00
0
26.0
1,90
0,00
0
2,70
0,00
0
2,07
0,00
0
2,95
0,00
0
2,21
5,00
0
3,16
0,00
0
24.0
1,90
0,00
0
2,50
0,00
0
34.0
2,35
0,00
0
3,10
0,00
0
34.0
2,70
0,00
0
3,53
0,00
0
2,95
0,00
0
3,85
0,00
0
3,16
0,00
0
4,12
0,00
0
30.0
2,50
0,00
0
3,10
0,00
0
42.0
3,10
0,00
0
3,90
0,00
0
42.0
3,53
0,00
0
4,45
0,00
0
3,85
0,00
0
4,85
0,00
0
4,12
0,00
0
5,19
0,00
0
36.0
3,10
0,00
0
3,70
0,00
0
50.0
3,90
0,00
0
4,60
0,00
0
50.0
4,45
0,00
0
5,25
0,00
0
4,85
0,00
0
5,72
0,00
0
5,19
0,00
0
6,12
0,00
0
42.0
3,70
0,00
0
4,30
0,00
0
60.0
4,60
0,00
0
5,30
0,00
0
60.0
5,25
0,00
0
6,05
0,00
0
5,72
0,00
0
6,59
0,00
0
6,12
0,00
0
7,05
0,00
0
48.0
4,30
0,00
0
-
70
.05,
300,
000
-
70.0
6,05
0,00
0
-
6,
590,
000
-
7,05
0,00
0
50.0
for s
ingl
e in
divi
dual
s
Rat
esR
ates
Rat
es(%
)(%
)(%
)
180,
000
4.8
230,
000
4.8
270,
000
295,
000
315,
000
4.8
180,
000
360,
000
7.2
230,
000
450,
000
7.2
270,
000
520,
000
295,
000
570,
000
315,
000
610,
000
7.2
360,
000
600,
000
9.6
450,
000
750,
000
9.6
520,
000
870,
000
570,
000
950,
000
610,
000
1,01
5,00
0
9.6
600,
000
840,
000
14.4
750,
000
1,05
0,00
0
14.4
870,
000
1,21
0,00
0
950,
000
1,32
0,00
0
1,01
5,00
0
1,41
5,00
0
14.4
840,
000
1,08
0,00
0
21.6
1,05
0,00
0
1,35
0,00
0
21.6
1,21
0,00
0
1,56
0,00
0
1,32
0,00
0
1,70
0,00
0
1,41
5,00
0
1,82
0,00
0
21.6
1,08
0,00
0
1,58
0,00
0
31.2
1,35
0,00
0
1,95
0,00
0
31.2
1,56
0,00
0
2,24
0,00
0
1,70
0,00
0
2,44
0,00
0
1,82
0,00
0
2,61
0,00
0
28.8
1,58
0,00
0
2,08
0,00
0
40.8
1,95
0,00
0
2,60
0,00
0
40.8
2,24
0,00
0
2,96
0,00
0
2,44
0,00
0
3,23
0,00
0
2,61
0,00
0
3,46
5,00
0
36.0
2,08
0,00
0
2,58
0,00
0
50.4
2,60
0,00
0
3,20
0,00
0
50.4
2,96
0,00
0
3,65
0,00
0
3,23
0,00
0
3,98
0,00
0
3,46
5,00
0
4,26
0,00
0
43.2
2,58
0,00
0
3,08
0,00
0
60.0
3,20
0,00
0
3,85
0,00
0
60.0
3,65
0,00
0
4,40
0,00
0
3,98
0,00
0
4,80
0,00
0
4,26
0,00
0
5,13
5,00
0
50.4
3,08
0,00
0
3,58
0,00
0
72.0
3,85
0,00
0
4,45
0,00
0
64.8
4,40
0,00
0
5,00
0,00
0
4,80
0,00
0
5,45
0,00
0
5,13
5,00
0
5,83
0,00
0
57.6
3,58
0,00
0
80.0
4,45
0,00
0
70.0
5,00
0,00
0
5,45
0,00
0
5,83
0,00
0
60.0
1985
1986
-198
7
Tabl
e J
(con
tinue
d). T
ax S
cale
Impo
sto
Com
plem
enta
r 198
3-19
88
1983
1984
Ran
ge o
f Tax
able
Inco
me
Ran
ge o
f Tax
able
Inco
me
Ran
ge o
f Tax
able
Inco
me
(esc
udos
)(e
scud
os)
(esc
udos
)R
ange
of T
axab
le In
com
e(e
scud
os)
1988
Ran
ge o
f Tax
able
Inco
me
(esc
udos
)
Ran
ge o
f Tax
able
Inco
me
(esc
udos
)(e
scud
os)
(esc
udos
)(e
scud
os)
(esc
udos
)R
ange
of T
axab
le In
com
eR
ange
of T
axab
le In
com
eR
ange
of T
axab
le In
com
eR
ange
of T
axab
le In
com
e

Rates(%)
0 450,000 0 540,000 16.0450,000 850,000 540,000 1,020,000 20.0850,000 1,250,000 1,020,000 1,500,000 27.5
1,250,000 3,000,000 1,500,000 3,600,000 35.03,000,000 3,600,000 40.0
Rates(%)
0 750,000 0 810,000 0 880,000 0 930,000 15.0750,000 1,750,000 810,000 1,890,000 880,000 2,010,000 930,000 2,170,000 25.0
1,750,000 4,500,000 1,890,000 4,860,000 2,010,000 5,160,000 2,170,000 5,570,000 35.04,500,000 4,860,000 5,160,000 5,570,000 40.0
Rates(%)
0 970,000 0 1,010,000 0 1,050,000 0 5,387.02 15.0970,000 2,260,000 1,010,000 2,350,000 1,050,000 2,435,000 5,387.02 12,469.95 25.0
2,260,000 5,790,000 2,350,000 6,000,000 2,435,000 6,150,000 12,469.95 31,324.51 35.05,790,000 6,000,000 6,150,000 31,324.51 40.0
Rates(%)
0 3,491.59 0 3,641.22 14.03,491.59 5,511.72 3,641.22 5,371.19 15.05,511.72 13,716.64 5,371.19 14,165.86 25.0
13,716.64 31,948.01 14,165.86 32,825.89 35.031,948.01 32,825.89 40.0
Rates(%)
0 3,990.38 0 4,100.12 0 4,182.12 12.03,990.38 6,035.45 4,100.12 6,201.42 4,182.12 6,325.45 14.06,035.45 14,963.94 6,201.42 15,375.45 6,325.45 15,682.96 24.0
14,963.94 34,417.05 15,375.45 35,363.52 15,682.96 36,070.79 34.034,417.05 49,879.79 35,363.52 51,251.48 36,070.79 52,276.51 38.049,879.79 51,251.48 52,276.51 40.0
(euros) (euros) (euros)
20022001
Range of Taxable Income
2003
Range of Taxable Income Range of Taxable Income
Range of Taxable Income(euros)
Range of Taxable Income(euros)
1989
Range of Taxable Income(escudos)
1990
Range of Taxable Income(escudos)
1998
Table J (continued). Tax Scale Imposto sobre a Renda das Pessoas Fisicas 1989-2003
Range of Taxable Income(escudos) (escudos) (escudos) (euros)
1995 1996 1997
Range of Taxable Income(escudos)
1991 1992 1994
(escudos) (escudos) (escudos)
1999 2000
1993
Range of Taxable Income Range of Taxable Income Range of Taxable Income
Range of Taxable Income Range of Taxable Income Range of Taxable Income

Tax
Den
omin
atio
nPe
riod
Exem
pted
inco
me
(esc
udos
unt
il 20
01, e
uros
si
nce
2002
)M
ain
Ded
uctio
ns fr
om G
ross
Inco
me
(esc
udos
unt
il 20
01,
euro
s si
nce
2002
)M
ain
dedu
ctio
ns fr
om ta
x (e
scud
os u
ntil
2001
, eur
os s
ince
200
2)Jo
int F
iling
Impo
sto
1922
-192
63,
600
30%
on
wag
e in
com
eno
nem
anda
tory
Pes
soal
Lei 1
368/
1922
spou
se: 1
,200
dode
pend
ent c
hild
(up
to 4
): 60
0R
endi
mie
nto
depe
nden
t chi
ld (a
bove
4):
1,00
0ot
her d
epen
dent
s: 5
00
Impo
sto
1927
-192
87,
000
none
none
man
dato
ryC
ompl
emen
tar
Dec
reto
15.
290/
1928
1929
-193
210
,000
none
none
man
dato
ryD
ecre
to 1
6.73
1/19
29
1933
-194
510
,500
none
none
man
dato
ryD
ecre
to-L
ei 2
2.54
1/19
33
1946
-196
350
,000
Civ
il S
ervi
ce in
com
e, p
ensi
ons.
allo
wan
ces
for s
pous
e an
d de
pend
ents
man
dato
ryD
ecre
to 3
5.59
5/19
46
1964
-197
260
,000
20%
on
wag
e in
com
e up
to 2
0,00
0no
nem
anda
tory
Dec
reto
-Lei
45.
399
spou
se: 2
0,00
030
/11/
1963
depe
nden
t <8
yo: 2
,500
Dec
reto
-Lei
49.
483/
1969
depe
nden
t age
d 8-
11 y
o: 5
,000
depe
nden
t age
d 12
-16
yo: 7
,500
depe
nden
t age
d 16
-21
yo: 1
0,00
0no
n-re
side
nts:
40,
000
1973
-197
860
,000
20%
on
wag
e in
com
e up
to 2
5,00
0no
nem
anda
tory
Dec
reto
-lei 3
75/1
974
spou
se: 2
0,00
0D
ecre
to-le
i 667
/197
6de
pend
ent <
7 yo
: 4,0
00de
pend
ent a
ged
8-11
yo:
8,0
00de
pend
ent a
ged
12-1
6 yo
: 12,
000
depe
nden
t age
d 16
-21
yo: 1
6,00
0no
n-re
side
nts:
40,
000
1979
-198
080
,000
20%
on
wag
e in
com
e up
to 3
0,00
0no
nem
anda
tory
Dec
reto
-lei 1
83F/
1980
spou
se: 4
0,00
0de
pend
ent <
11 y
o: 1
0,00
0de
pend
ent a
ged
11-2
1 yo
: 20,
000
non-
resi
dent
s: 4
0,00
0
1981
80,0
0030
% o
n w
age
inco
me
up to
50,
000
none
Dec
reto
-lei 1
96/1
982
spou
se: 4
0,00
0de
pend
ent <
11 y
o: 1
0,00
0m
anda
tory
depe
nden
t age
d 11
-18
yo: 2
0,00
0de
pend
ent a
ged
19-2
4 yo
in u
nder
grad
uate
stu
dies
: 20,
000
non-
resi
dent
s: 4
0,00
0
1982
120,
000
30%
on
wag
e in
com
e up
to 5
0,00
0no
nem
anda
tory
Dec
reto
-lei 1
19j/1
983
spou
se: 4
0,00
0de
pend
ent <
11 y
o: 2
0,00
0de
pend
ent a
ged
11-1
8 yo
: 30,
000
depe
nden
t age
d 19
-24
yo in
und
ergr
adua
te s
tudi
es: 3
0,00
0no
n-re
side
nts:
40,
000
Tabl
e K
. Inc
ome
Tax
in P
ortu
gal 1
922-
2003

Tax
Den
omin
atio
nPe
riod
Exem
pted
inco
me
(esc
udos
unt
il 20
01, e
uros
si
nce
2002
)M
ain
Ded
uctio
ns fr
om G
ross
Inco
me
(esc
udos
unt
il 20
01,
euro
s si
nce
2002
)M
ain
dedu
ctio
ns fr
om ta
x (e
scud
os u
ntil
2001
, eur
os s
ince
200
2)Jo
int F
iling
Tabl
e K
. Inc
ome
Tax
in P
ortu
gal 1
922-
2003
1983
120,
000
30%
on
wag
e in
com
e up
to 5
0,00
0no
nem
anda
tory
Dec
reto
-lei 1
92/1
984
spou
se: 1
20,0
00de
pend
ent <
11 y
o: 2
5,00
0de
pend
ent a
ged
11-1
8 yo
: 40,
000
depe
nden
t age
d 19
-24
yo in
und
ergr
adua
te s
tudi
es: 4
0,00
0no
n-re
side
nts:
40,
000
1984
150,
000
30%
on
wag
e in
com
e up
to 6
5,00
0no
nem
anda
tory
Dec
reto
-lei 1
15d/
1985
spou
se: 1
50,0
00de
pend
ent <
11 y
o: 3
0,00
0de
pend
ent a
ged
11-1
8 yo
: 50,
000
depe
nden
t age
d 19
-24
yo in
und
ergr
adua
te s
tudi
es: 5
0,00
0no
n-re
side
nts:
40,
000
1985
180,
000
30%
on
wag
e in
com
e up
to 1
05,0
00no
neD
ecre
to-le
i 112
/198
6sp
ouse
: 180
,000
man
dato
ryde
pend
ent <
11 y
o: 4
0,00
0de
pend
ent a
ged
11-1
8 yo
: 60,
000
depe
nden
t age
d 19
-24
yo in
und
ergr
adua
te s
tudi
es: 6
0,00
0de
pend
ent a
ged
19-2
4 yo
une
mpl
oyed
: 60,
000
non-
resi
dent
s: 4
0,00
0
1986
-198
729
5,00
030
% o
n w
age
inco
me
up to
155
,000
none
man
dato
ryD
ecre
to 1
35/1
987
spou
se: 2
05,0
00de
pend
ent <
11 y
o: 6
0,00
0de
pend
ent a
ged
11-1
8 yo
: 70,
000
depe
nden
t age
d 19
-24
yo in
und
ergr
adua
te s
tudi
es: 7
0,00
0de
pend
ent a
ged
19-2
4 yo
une
mpl
oyed
: 70,
000
non-
resi
dent
s: 7
0,00
0
1988
1,00
0,00
030
% o
n w
age
inco
me
up to
155
,000
none
man
dato
ryD
ecre
to-le
i 66/
1989
spou
se: 2
00,0
00de
pend
ent <
11 y
o: 6
0,00
0de
pend
ent a
ged
11-1
8 yo
: 70,
000
depe
nden
t age
d 19
-24
yo in
und
ergr
adua
te s
tudi
es: 7
0,00
0de
pend
ent a
ged
19-2
4 yo
une
mpl
oyed
: 70,
000
non-
resi
dent
s: 7
0,00
0
Impo
sto
1989
afte
r-ta
x w
age
inco
me
65%
on
wag
e in
com
e up
to 2
50,0
00si
ngle
: 20,
000
man
dato
ryso
bre
aD
ecre
to-L
ei 4
42A
/198
8ca
nnot
be
belo
w th
e na
tiona
l min
imum
wag
em
ortg
age
inte
rest
s to
pur
chas
e m
ain
resi
denc
em
arrie
d: 1
5,00
0 x2
split
ting
Ren
das
das
educ
atio
n ex
pens
es, l
ife a
nd o
ther
insu
ranc
esde
pend
ant:
10,0
00P
esso
aspe
nsio
n up
to 1
000,
000
Físi
cas
1990
afte
r-ta
x w
age
inco
me
65%
on
wag
e in
com
e up
to 3
00,0
00si
ngle
: 23,
000
cann
ot b
e be
low
the
natio
nal m
inim
um w
age
mor
tgag
e in
tere
sts
to p
urch
ase
mai
n re
side
nce
mar
ried:
17,
000
x2m
anda
tory
educ
atio
n ex
pens
es, l
ife a
nd o
ther
insu
ranc
esde
peda
nt: 1
2,00
0sp
littin
gpe
nsio
n up
to 1
,250
,000
1991
afte
r-ta
x w
age
inco
me
65%
on
wag
e in
com
e up
to 3
40,0
00si
ngle
: 25,
500
cann
ot b
e be
low
the
natio
nal m
inim
um w
age
mor
tgag
e in
tere
sts
to p
urch
ase
mai
n re
side
nce
mar
ried:
19,
000
x2m
anda
tory
educ
atio
n ex
pens
es, l
ife a
nd o
ther
insu
ranc
esde
pend
ant:
14,0
00sp
littin
gpe
nsio
n up
to 1
,400
,000
1992
afte
r-ta
x w
age
inco
me
65%
on
wag
e in
com
e up
to 3
78,0
00si
ngle
: 27,
500
cann
ot b
e be
low
the
natio
nal m
inim
um w
age
mor
tgag
e in
tere
sts
to p
urch
ase
mai
n re
side
nce
mar
ried:
20,
500
x2m
anda
tory

Tax
Den
omin
atio
nPe
riod
Exem
pted
inco
me
(esc
udos
unt
il 20
01, e
uros
si
nce
2002
)M
ain
Ded
uctio
ns fr
om G
ross
Inco
me
(esc
udos
unt
il 20
01,
euro
s si
nce
2002
)M
ain
dedu
ctio
ns fr
om ta
x (e
scud
os u
ntil
2001
, eur
os s
ince
200
2)Jo
int F
iling
Tabl
e K
. Inc
ome
Tax
in P
ortu
gal 1
922-
2003
educ
atio
n ex
pens
es, l
ife a
nd o
ther
insu
ranc
esde
pend
ant:
15,1
00sp
littin
gpe
nsio
n up
to 1
,512
,000
1993
afte
r-ta
x w
age
inco
me
65%
on
wag
e in
com
e up
to 4
00,0
00si
ngle
: 29,
000
cann
ot b
e be
low
the
natio
nal m
inim
um w
age
mor
tgag
e in
tere
sts
to p
urch
ase
mai
n re
side
nce
mar
ried:
22,
000
x2m
anda
tory
educ
atio
n ex
pens
es, l
ife a
nd o
ther
insu
ranc
esde
pend
ant:
16,0
00sp
littin
gpe
nsio
n up
to 1
,600
,000
1994
afte
r-ta
x w
age
inco
me
65%
on
wag
e in
com
e up
to 4
16,0
00si
ngle
: 31,
000
cann
ot b
e be
low
the
natio
nal m
inim
um w
age
mor
tgag
e in
tere
sts
to p
urch
ase
mai
n re
side
nce
mar
ried:
22,
800
x2m
anda
tory
educ
atio
n ex
pens
es, l
ife a
nd o
ther
insu
ranc
esde
pend
ant:
16,5
00sp
littin
gpe
nsio
n up
to 1
,200
,000
1995
afte
r-ta
x w
age
inco
me
65%
on
wag
e in
com
e up
to 4
40,0
00si
ngle
: 32,
000
cann
ot b
e be
low
the
natio
nal m
inim
um w
age
mor
tgag
e in
tere
sts
to p
urch
ase
mai
n re
side
nce
mar
ried:
24,
000
x2m
anda
tory
educ
atio
n ex
pens
es, l
ife a
nd o
ther
insu
ranc
esde
pend
ant:
17,5
00sp
littin
gpe
nsio
n up
to 1
,272
,000
1996
afte
r-ta
x w
age
inco
me
high
est o
f (a)
70%
on
wag
e in
com
e up
465
,000
or
sing
le: 3
3,00
0ca
nnot
be
belo
w th
e na
tiona
l min
imum
wag
e(b
) 71%
of t
he h
ighe
st m
inim
um w
age
mar
ried:
25,
000
x2m
ortg
age
inte
rest
s to
pur
chas
e m
ain
resi
denc
ede
pend
ant:
18,5
00m
anda
tory
educ
atio
n ex
pens
es, l
ife a
nd o
ther
insu
ranc
essp
littin
gpe
nsio
n up
to 1
,350
,000
1997
afte
r-ta
x w
age
inco
me
high
est o
f (a)
70%
on
wag
e in
com
e up
484
,000
or
sing
le: 3
4,50
0ca
nnot
be
belo
w 1
20%
of t
he h
ighe
st n
atio
nal
(b) 7
1% o
f the
hig
hest
min
imum
wag
em
arrie
d: 2
6,30
0 x2
min
imum
wag
em
ortg
age
inte
rest
s to
pur
chas
e m
ain
resi
denc
ede
pend
ant:
19,0
00 (1
st.),
19,
210
(2nd
.), 1
9,43
0 (3
rd.),
19,
550
(+4t
h.)
man
dato
ryed
ucat
ion
expe
nses
, life
and
oth
er in
sura
nces
split
ting
pens
ion
up to
1,3
85,0
00
1998
afte
r-ta
x w
age
inco
me
high
est o
f (a)
70%
on
wag
e in
com
e up
498
,000
or
sing
le: 3
5,20
0ca
nnot
be
belo
w 1
20%
of t
he h
ighe
st n
atio
nal
(b) 7
1% o
f the
hig
hest
min
imum
wag
em
arrie
d: 2
6,80
0 x2
min
imum
wag
em
ortg
age
inte
rest
s to
pur
chas
e m
ain
resi
denc
ede
pend
ant:
19,4
00 (1
st.),
19,
620
(2nd
.), 1
9,84
0 (3
rd.),
19,
860
(+4t
h.)
man
dato
ryed
ucat
ion
expe
nses
, life
and
oth
er in
sura
nces
split
ting
pens
ion
up to
1,4
15,0
00
1999
afte
r-ta
x w
age
inco
me
high
est o
f (a)
70%
on
wag
e in
com
e up
to 5
22,0
00 o
rsi
ngle
: 36,
000
cann
ot b
e be
low
120
% o
f the
hig
hest
nat
iona
l(b
) 72%
of t
he h
ighe
st m
inim
um w
age
mar
ried:
27,
400
x2m
inim
um w
age
mor
tgag
e in
tere
sts
to p
urch
ase
mai
n re
side
nce
depe
ndan
t: 19
,800
(1st
.), 2
0,02
5 (2
nd.),
20,
250
(3rd
.), 2
0,37
5 (+
4th.
)m
anda
tory
educ
atio
n ex
pens
es, l
ife a
nd o
ther
insu
ranc
essp
littin
gpe
nsio
n up
to 1
,445
,000
2000
afte
r-ta
x w
age
inco
me
high
est o
f (a)
70%
on
wag
e in
com
e up
to 5
35,0
00 o
rsi
ngle
: 36,
720
cann
ot b
e be
low
120
% o
f the
hig
hest
nat
iona
l(b
) 72%
of t
he h
ighe
st m
inim
um w
age
mar
ried:
27,
950
x2m
inim
um w
age
mor
tgag
e in
tere
sts
to p
urch
ase
mai
n re
side
nce
depe
ndan
t: 20
,200
(1st
.), 2
0,43
0 (2
nd.),
21,
070
(3rd
.), 2
1,47
(+4t
h.)
man
dato
ryed
ucat
ion
expe
nses
, life
and
oth
er in
sura
nces
split
ting
pens
ion
up to
1,4
82,0
00
2001
afte
r-ta
x w
age
inco
me
high
est o
f (a)
70%
on
wag
e in
com
e up
to 5
50,0
00 o
rsi
ngle
: 40,
200
man
dato
ryca
nnot
be
belo
w 1
20%
of t
he h
ighe
st n
atio
nal
(b) 7
2% o
f the
hig
hest
min
imum
wag
em
arrie
d: 3
3,50
0 x2
split
ting
min
imum
wag
em
ortg
age
inte
rest
s to
pur
chas
e m
ain
resi
denc
ede
pend
ant:
26,8
00 e
ach
educ
atio
n ex
pens
es, l
ife a
nd o
ther
insu
ranc
espe
nsio
n up
to 1
,523
,000
2002
afte
r-ta
x w
age
inco
me
72%
of t
he h
ighe
st m
inim
um w
age
sing
le: 6
0% o
f mon
thly
min
imum
wag
em
anda
tory
cann
ot b
e be
low
120
% o
f the
hig
hest
nat
iona
lm
ortg
age
inte
rest
s to
pur
chas
e m
ain
resi
denc
em
arrie
d: 5
0% o
f mon
thly
min
imum
wag
e x2
split
ting
min
imum
wag
eed
ucat
ion
expe
nses
, life
and
oth
er in
sura
nces
depe
ndan
t: 40
% o
f mon
thy
min
imum
wag
e ea
ch

Tax
Den
omin
atio
nPe
riod
Exem
pted
inco
me
(esc
udos
unt
il 20
01, e
uros
si
nce
2002
)M
ain
Ded
uctio
ns fr
om G
ross
Inco
me
(esc
udos
unt
il 20
01,
euro
s si
nce
2002
)M
ain
dedu
ctio
ns fr
om ta
x (e
scud
os u
ntil
2001
, eur
os s
ince
200
2)Jo
int F
iling
Tabl
e K
. Inc
ome
Tax
in P
ortu
gal 1
922-
2003
pens
ion
up to
7,8
05.6
0
2003
afte
r-ta
x w
age
inco
me
72%
of t
he h
ighe
st m
inim
um w
age
sing
le: 6
0% o
f mon
thly
min
imum
wag
em
anda
tory
cann
ot b
e be
low
120
% o
f the
hig
hest
nat
iona
lm
ortg
age
inte
rest
s to
pur
chas
e m
ain
resi
denc
em
arrie
d: 5
0% o
f mon
thly
min
imum
wag
e x2
split
ting
min
imum
wag
eed
ucat
ion
expe
nses
, life
and
oth
er in
sura
nces
depe
ndan
t: 40
% o
f mon
thy
min
imum
wag
e ea
chpe
nsio
n up
to 7
,961
.71