fargo-moorhead metropolitan council of governments packets... · date: july 5, 2012 the 416th...
TRANSCRIPT
TO: Members of the Transportation Technical Committee and Interested Persons FROM: Wade E. Kline, Executive Director SUBJECT: Thursday, July 12, 2012 TTC Meeting Agenda DATE: July 5, 2012 The 416th Meeting of the Fargo-Moorhead Metropolitan Council of Governments Transportation Technical Committee will be held on Thursday, July 12, 2012 at 10:00 a.m. in the Metro COG Office Conference Room, Fargo, North Dakota. If you have questions, please call Wade Kline at 232-3242 (Ext. 32).
AGENDA 1. Call to Order and Introductions 2. Consider June 14, 2012 TTC Meeting Minutes (Attachment 1) 3. Consider Household Origin-Destination Survey) – Joe Nigg (Attachment 2) 4. Consider First Half Progress and Financial Report – Wade Kline (Attachment 3) 5. Consider Resolution Regarding University Drive Corridor Study – Wade Kline (Attachment 4) 6. Consider RFP for 12th Avenue North Cooperative Project Concept Report – Peggy Harter (Attachment
5) 7. Consider TH 10 / TH 75 / Center Avenue Amendment – Peggy Harter (Attachment 6) 8. Consider Scope of Work for Moorhead River Corridor Study – Katie White (Attachment 7) 9. GIS Committee Membership Update – Joe Nigg (Attachment 8) 10. Metropolitan Food Systems Scope of Work – Katie White (Attachment 9) 11. Moorhead Alternative Urban Areawide Review (AUAR) Contract Addendum – Joe Nigg (Attachment
10) 12. Other Business and Citizen Comments 13. Adjourn
NOTE: Full agenda packet is available on the Metro COG Web Site: http://www.fmmetrocog.org and go to Committees
Fargo-Moorhead Metropolitan Council of Governments Email: [email protected] http://www.fmmetrocog.org
701.232.3242 • FAX 701.232.5043 • Case Plaza Suite 232 • One 2nd Street North • Fargo, North Dakota 58102-4807
A PLANNING ORGANIZATION SERVING FARGO, WEST FARGO, CASS COUNTY, NORTH DAKOTA AND MOORHEAD, DILWORTH, CLAY COUNTY, MINNESOTA
Metro COG is committed to ensuring all individuals regardless of race, color, sex, age, national origin, disability/handicap, sexual orientation, or income status have access to Metro COG’s programs and services. Meeting facilities will be accessible to mobility impaired individuals. Metro COG will make a good faith effort to accommodate requests for translation services for meeting proceedings and related materials. Please contact Joan Geyer, Metro COG Executive Secretary at 701.232.3242 at least two days in advance of the meeting if any special accommodations are required for any member of the public to be able to participate in the meeting.
415th Meeting of the FM Metro COG Transportation Technical Committee – page 1 Thursday, June 14, 2012
415th Meeting of the FM Metro COG Transportation Technical Committee
Thursday, June 14, 2012 ‐ 10:00 a.m. Metro COG Conference Room
Members Present:
Peggy Harter, (for Wade Kline, FM Metro COG) Jonathan Atkins (for Jeremy Gorden, Fargo Engineer for Transportation) Michael Johnson, NDDOT, Local Government, Bismarck Tim Solberg (for Jason Benson, Cass County Engineer) Bob Stein (for Julie Bommelman, Fargo Transit Director) Jim Gilmour, Fargo City Planning Director Nathan Gannon (for David Overbo, Clay County Engineer) Larry Weil, West Fargo City Planner Tom Trowbridge (for Bob Zimmerman, Moorhead City Engineer) Kristie Leshovsky, Moorhead City Planner Chad Zander (for Barry Johnson, West Fargo Public Works Director) Jane Butzer (for Bridget Miller, MnDOT, District IV, Detroit Lakes ) Wade Frank, Associate Member, City of Horace
Members Absent: Tim Magnusson, Clay County Planner Stan Thurlow, Dilworth City Planner Lori VanBeek, Moorhead Transit Manager
Others Present: Peggy Harter, Metro COG Katie White, FM Metro COG Mikel Kunza, FM Metro COG Joe Nigg, FM Metro COG Jake Coryell, FM Metro COG Intern Joan Geyer, FM Metro COG
1. CALL TO ORDER AND INTRODUCTIONS
The meeting was called to order at 10:00 a.m. by Ms. Harter. She noted a quorum was present, and introductions were made.
2. APPROVE April 12, 2012 TTC MEETING MINUTES (Attachment 1)
Ms. Harter asked if there were any corrections or additions to the April 12, 2012 TTC meeting minutes?
MOTION, passed Mr. Weil moved, seconded by Mr. Trowbridge to approve the April 12, 2012 TTC minutes. Motion carried unanimously.
3. Consider Minnesota Element of Draft 2013‐2016 Transportation Improvement Program (TIP)
Attachment 1
415th Meeting of the FM Metro COG Transportation Technical Committee – page 2 Thursday, June 14, 2012
(Attachment 2)
a) Open Public Meeting on the Draft 2013‐2016 Minnesota Element of the Transportation Improvement Program (TIP)
MOTION, passed Mr. Weil moved, seconded by Mr. Trowbridge to open the Public Meeting on the Draft 2013‐2016 Minnesota Element of the TIP. Motion carried unanimously.
Ms. Harter said Attachment 2a included the draft project list for the 2013‐2016 Minnesota Element of the Transportation Improvement Program (TIP). She explained a Public Meeting was being held as part of the TTC Meeting with the intent to consider the 2013‐2016 TIP Project Listing for the Minnesota Portion of the Metropolitan Area. She said the public was notified of the proposed 2013‐2016 TIP Project Listings for the Minnesota portion of the Metropolitan Area as per the adopted Public Participation Plan (PPP). Ms. Harter said public comments would be accepted by Metro COG until 12:00 noon June 19, 2012. She said the full 2013‐2016 TIP document, along with the Project Listings for the ND portion of the Metropolitan Area was anticipated to be available in draft format for public comment by August 2012. She noted pending TTC recommendation, the Project Listings for the Minnesota portion of the Metropolitan Area would be forwarded to the Metro COG Policy Board for consideration on June 21, 2012. Ms. Harter reviewed the project lists and gathered TTC member input.
b) Review Written Comments Received
No written comments were received, and no public comments were received at this meeting.
c) Close Public Meeting on the Draft 2013‐2016 Minnesota Element of the TIP. Ms. Harter closed the public meeting and asked for TTC action.
MOTION, passed
Mr. Trowbridge moved, seconded by Mr. Gannon to recommend Policy Board approval (on June 12, 2012) of the 2013‐2016 Transportation Improvement Program (TIP) Project Listings for the Minnesota portion of the Metropolitan Area as shown, reviewed and revised by TTC members in Attachment 2a of the June 2012 TTC packet. Motion carried unanimously.
4. Consider Final Draft of 2012 Transportation Surveillance & Monitoring Report (Metropolitan Profile) (copies of the draft report were mailed to TTC members in advance of TTC packet)
Mr. Nigg noted advance copies of the Profile were mailed to TTC members prior to TTC mailing in order to give them ample time to review. He reviewed the draft Metropolitan Profile and asked TTC members to get any changes to him by the end of the week.
MOTION, passed
Mr. Weil moved, seconded by Mr. Trowbridge to recommend Policy Board approval of the 2012 Metropolitan Profile (with any identified revisions or modifications) to the Policy Board for consideration at their June 21, 2011 Meeting. Motion carried unanimously.
415th Meeting of the FM Metro COG Transportation Technical Committee – page 3 Thursday, June 14, 2012
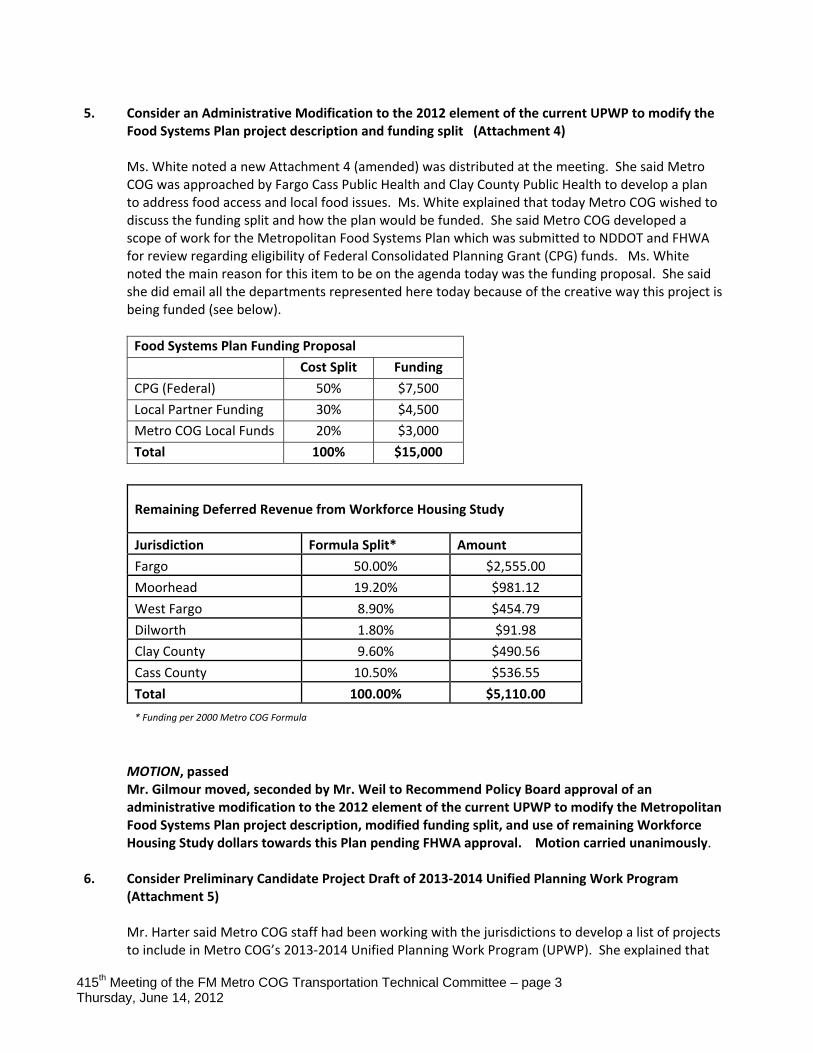
5. Consider an Administrative Modification to the 2012 element of the current UPWP to modify the
Food Systems Plan project description and funding split (Attachment 4)
Ms. White noted a new Attachment 4 (amended) was distributed at the meeting. She said Metro COG was approached by Fargo Cass Public Health and Clay County Public Health to develop a plan to address food access and local food issues. Ms. White explained that today Metro COG wished to discuss the funding split and how the plan would be funded. She said Metro COG developed a scope of work for the Metropolitan Food Systems Plan which was submitted to NDDOT and FHWA for review regarding eligibility of Federal Consolidated Planning Grant (CPG) funds. Ms. White noted the main reason for this item to be on the agenda today was the funding proposal. She said she did email all the departments represented here today because of the creative way this project is being funded (see below).
Food Systems Plan Funding Proposal
Cost Split Funding
CPG (Federal) 50% $7,500
Local Partner Funding 30% $4,500
Metro COG Local Funds 20% $3,000
Total 100% $15,000
Remaining Deferred Revenue from Workforce Housing Study
Jurisdiction Formula Split* Amount
Fargo 50.00% $2,555.00
Moorhead 19.20% $981.12
West Fargo 8.90% $454.79
Dilworth 1.80% $91.98
Clay County 9.60% $490.56
Cass County 10.50% $536.55
Total 100.00% $5,110.00
* Funding per 2000 Metro COG Formula
MOTION, passed
Mr. Gilmour moved, seconded by Mr. Weil to Recommend Policy Board approval of an administrative modification to the 2012 element of the current UPWP to modify the Metropolitan Food Systems Plan project description, modified funding split, and use of remaining Workforce Housing Study dollars towards this Plan pending FHWA approval. Motion carried unanimously.
6. Consider Preliminary Candidate Project Draft of 2013‐2014 Unified Planning Work Program (Attachment 5)
Mr. Harter said Metro COG staff had been working with the jurisdictions to develop a list of projects to include in Metro COG’s 2013‐2014 Unified Planning Work Program (UPWP). She explained that
415th Meeting of the FM Metro COG Transportation Technical Committee – page 4 Thursday, June 14, 2012
all these projects were listed on Attachment 5a included in TTC packets. She explained there was an outreach to the Metro COG interested persons in completing this list also. Ms. Harter reviewed the projects listed on Attachment 5a, noting any TTC revisions, i.e., Remove “2012 Carryover” from Fargo/West Fargo 522nd Avenue South Corridor Study / Remove the project Cass County Township Model Zoning Ordinance / and change Dilworth Zoning Ordinance Update to Dilworth Subdivision Ordinance Update. Ms. Harter said once the projects were approved by Policy Board, one of the things that would need to be added would be the total funding source amounts and how they would be split up between local and federal dollars. Ms. Harter explained that Attachment 5c was a list of things that were discussed, but did not make the cut for the project list. Ms. Harter said TTC would likely see a final draft of the 2013‐2014 UPWP in August including the dollar amounts.
MOTION, passed Mr. Solberg moved, seconded by Mr. Trowbridge to recommend Policy Board approval of the 40% Draft 2013‐2014 UPWP with the revisions from the June 14, 2012 TTC Meeting. Motion carried unanimously.
7. Consider Final Approval of Veterans Boulevard / 9th Street Corridor Study (Attachment 6) Ms. Harter said the Fargo‐Moorhead Metropolitan Council of Governments (Metro COG) had been
working cooperatively with the Cities of West Fargo and Fargo on a corridor study of 9th Street East and Veterans Boulevard from 40th Avenue South to CR 20. She said Metro COG entered into a contract with Moore Engineering and their sub consultant Benesch Engineering, Inc. in February 2011 to assist with completion of the corridor study. Ms. Harter said the 9th Street East / Veterans Boulevard Corridor Study was completed in April 2012 and was presented to the West Fargo and Fargo Commissions for study approval in May 2012 and the full draft study document was available for review on Metro COG’s website at http://www.fmmetrocog.org/. Ms. Harter said the original scope of work for the study included a review of existing and forecast year conditions and issues along the 9th Street East corridor from Interstate 94 to CR 20. She explained that mid‐way through the study, the south limits were extended to 40th Avenue South and the City of Fargo became a project partner in the study. Ms. Harter said some of the major issues identified during the corridor study included the following:
Major new development south of I‐94 including but not limited to a new West Fargo High School near 40th Avenue South, the Preserve Development (which includes plan for a private and public elementary school), Costco, and new Sanford Hospital. The projected completion dates for the proposed development accelerates the needs for transportation improvements along the study corridor.
Existing and future traffic congestion at the 9th Street East and 13th Avenue East intersection. The congestion backs through the closest intersections both north (Prairie Parkway) and south (14th Avenue East)of the intersection causing additional access issues
415th Meeting of the FM Metro COG Transportation Technical Committee – page 5 Thursday, June 14, 2012
onto 9th Street East.
High crash intersections identified at 9th Street East with 14th Avenue East, 13th Avenue East, Prairie Parkway, Main Avenue and 12th Avenue North.
Future capacity expansion needs along 9th Street East between 13th Avenue East and Main Avenue. This includes a location of very limited existing right‐of‐way between 4th Avenue East and Main Avenue.
Consideration of 2012 NDDOT project to reconstruct Main Avenue including the intersection of 9th Street East.
A high number of accesses along the study corridor, some closely spaced which increase safety concerns.
The need to extend the shared use path along 9th Street East between 1st Avenue and Main Avenue. The additional need for a shared use path facility between Main Avenue and 12th Avenue North as identified as a major gap in the 2011 Bicycle and Pedestrian Plan for the Trans Metropolitan Bikeway system.
Ms. Harter said the study alternatives and implementation plan (Attachment 6a) were developed to mitigate the issues that were identified during the corridor study. She said projects along the corridor were split into short‐range (0 to 5 years), mid‐range (5 to 10 years), and long‐range (10+ years) projects. She noted the projects were placed into the implementation range based on the projected years of development and traffic volume increases along the study corridor. Furthermore, she said, the implementation plan included a planning level cost estimate for each project with anticipated local cost shares and potential funding grants in which the local agencies may apply. Ms. Harter said in keeping with the approved procedures governing the adoption of plans/programs developed through Metro COG, a support resolution was required from the Metro COG Policy Board. She said this Resolution was included as Attachment 6b in TTC packets. She said pending TTC recommendation; this resolution would be forwarded to the Metro COG Policy Board for approval and signature on June 21, 2012.
MOTION, passed Mr. Solberg moved, seconded by Mr. Atkins to recommend Policy Board approval and signature of the 9th Street East / Veterans Boulevard Corridor Study (40th Avenue South to CR 20) Resolution of Approval as shown in Attachment 6b of the June 2012 TTC packet. Motion carried unanimously.
8. Consider Recommendation to Policy Board on Technical Memorandum #1 and #2 regarding
Metropolitan Demographic Forecast Study (Attachment 7)
Mr. Nigg said In February (2012) Metro COG’s Policy Board finalized a contract with Ulteig Engineering and McKibben Demographic Research to complete an update to the 2006 Metropolitan Demographic Forecast Study. He said this study was completed every 5 years and the primary objective of the study was to establish demographic forecasts (i.e. population, households and jobs) for the Metropolitan Area and various sub‐geographies to the year 2040. Mr. Nigg said this data was a critical element to Metro COG’s planning program and specifically important in respect to efforts to maintain and update the regional travel demand model. He explained that Metro COG was pursuing this demographic update to address the following needs:

415th Meeting of the FM Metro COG Transportation Technical Committee – page 6 Thursday, June 14, 2012
1. Reevaluate demographic projections which consider recent 2010 Census numbers for the FM MSA;
2. Development of the 2010 travel demand model (base year) and subsequent development of forecast year models for 2020 and 2040;
3. Update of the current 2009 LRTP which will initiate late in 2012. 4.
Mr. Nigg said the study process was set up in such a way that the TTC and Policy Board were to be involved at two critical decision points. He said at the first decision point, the consultant team and project steering committee would be asking for concurrence on a preferred forecasting methodology as well as key forecasting assumptions. Subsequently, he said, the second decision point would accommodate a review of study outputs (i.e. forecasts) under a “most likely” and “high growth” scenario. Mr. Nigg said the consulting team had completed draft versions of the first two technical memorandums (first decision point) which were hereby submitted for TTC consideration (see attached). He said Technical Memorandum No. 1 reviewed and analyzed the accuracy of the 2006 projections and assumptions while Technical Memorandum No. 2 outlined recommended forecast methodology and critical assumptions. Mr. Nigg said the study steering committee had met three (3) times thus far to review relevant aspects and offer insight and direction regarding development of the technical memoranda.
MOTION, passed
Mr. Stein moved, seconded by Mr. Gilmour to recommend approval of both technical memorandums for use in development of Metropolitan demographic forecasts and forward the recommendation to the Policy Board for consideration at their June 21, 2012 meeting. Motion carried unanimously.
9. Other Business and Citizen Comments / Mn/DOT and NDDOT Project Updates / Reports 10. ADJOURNMENT The 415th TTC Meeting was adjourned at 11:15 a.m. on Thursday, June 14, 2012. Respectfully Submitted, Joan M. Geyer Executive Secretary
TO: Transportation Technical Committee (TTC) FROM: Joe Nigg – Principal Planner DATE: June 28, 2012 RE: Household Origin-Destination Mobility Study, Final Report
Background. In November of 2010 Metro COG’s Policy Board approved issuance of an RFP to complete a household origin/destination (or travel behavioral) study for the Fargo-Moorhead Metropolitan Area. In February (2011) Metro COG finalized a contract with the consulting team of SRF Consulting Group Inc, ACCORA Research and ArceZmud Research LLC to complete this project. The current travel demand model utilizes average national level data to calibrate trip generation, trip length distribution and trip attraction and it was recognized that localized data would significantly improve the accuracy of the model. The survey was originally envisioned to be deployed in the Spring of 2011, however, due to major flooding survey deployment was re-scheduled for September of 2011 (survey went ‘live’ September 12th). Additionally, in January of 2012, after survey collection was completed, the consultant team determined that additional surveys were needed for certain metropolitan neighborhoods/sub-areas which caused further delay in completing the project. Although this project experienced significant delay, Metro COG remains on-schedule for completion of a calibrated 2010 network by the end of 2012; which also coordinates with completion of the 2010-2040 Demographic Forecast Study. A draft version of the Study is included as an attachment for TTC review and consideration. Interesting Study Details. Metro COG’s travel forecast model has performed reasonably well in replicating ground truths over the years; however, it was determined through a peer review (completed in 2003) that additional data would further enhance the model’s performance relative to local travel characteristics. This survey utilized data from 834 metropolitan households which accounted for 1,860 total travel diaries (110 households / 240 diaries completed online).
Trip Generation. Trip generation rates within the 2005 base model are based on national data pursuant to National Cooperative Highway Research Program (NCHRP) Report 365 and the ITE Trip Generation Manual, 5th Edition. The number of trips produced in the modeled area is based on the number of dwelling units, categorized by single family (3 units or less) or multi-family (4 or more units). As noted in the report, vehicle trip rates [per day] were significantly less for both SF and MF as compared to figures utilized in the 2005 base model.
Trip Length Distribution. The 2005 base model utilized data from the 2000 Census ‘Transportation Planning Package (CTPP)to calibrate trip lengths for modeled vehicle trips. Census defined trip lengths ranged from 8.1 minutes to 14.1 minutes, dependent on trip purpose. Data from the 2011 HH OD Study suggests trip lengths that are considerably longer; ranging from 11.8 minutes to 18.1 minutes, again dependent on trip purpose. Other. The report provides interesting data and statistics which offer insights into trip generation and trip length distribution by geography/screenline and survey data relative to households sizes, vehicle availability, travel by specific mode and a number of trip generation cross-tabs for various demographic variables. Metro COG has additionally incorporated a memorandum within the study appendix which identifies the intended strategy for use of stratified trip generation rates within the next model iteration (ie. 2010 base network).
Questions. If you have any questions, comments or concerns prior to the TTC meeting please feel free to contact either me at 701.232.3242 x28 or by email at [email protected]. Recommended Action. It is requested that the TTC recommend approval of the Household Origin/Destination Mobility Study and forward the recommendation to the Policy Board for consideration at their July 19th, 2012 meeting.
Dwelling Unit Category 2005 HH OD Study
(2011)
Single Family 9.55 5.57
Multi-Family 6.47 3.33
Attachment 2
Fargo-Moorhead Origin-Destination Study
Household Interview Survey
Methodology and Results
Prepared for Fargo-Moorhead
Metropolitan Council of Governments
July 2012
SRF Consulting Group, Inc Accora Research, Inc. ArceZmud Research, LLC
Fargo-Moorhead Origin-Destination Study - 1 - Household Interview Survey Methodology and Results
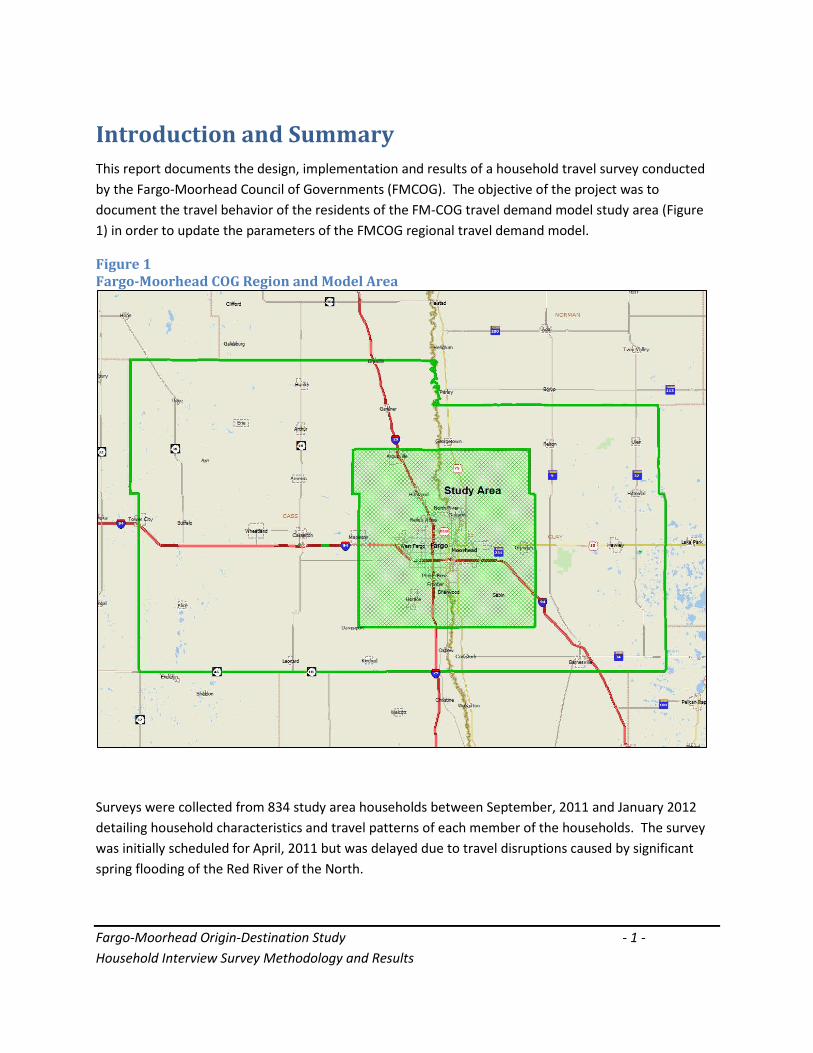
Introduction and Summary This report documents the design, implementation and results of a household travel survey conducted by the Fargo-Moorhead Council of Governments (FMCOG). The objective of the project was to document the travel behavior of the residents of the FM-COG travel demand model study area (Figure 1) in order to update the parameters of the FMCOG regional travel demand model.
Figure 1 Fargo-Moorhead COG Region and Model Area
Surveys were collected from 834 study area households between September, 2011 and January 2012 detailing household characteristics and travel patterns of each member of the households. The survey was initially scheduled for April, 2011 but was delayed due to travel disruptions caused by significant spring flooding of the Red River of the North.
Fargo-Moorhead Origin-Destination Study - 2 - Household Interview Survey Methodology and Results
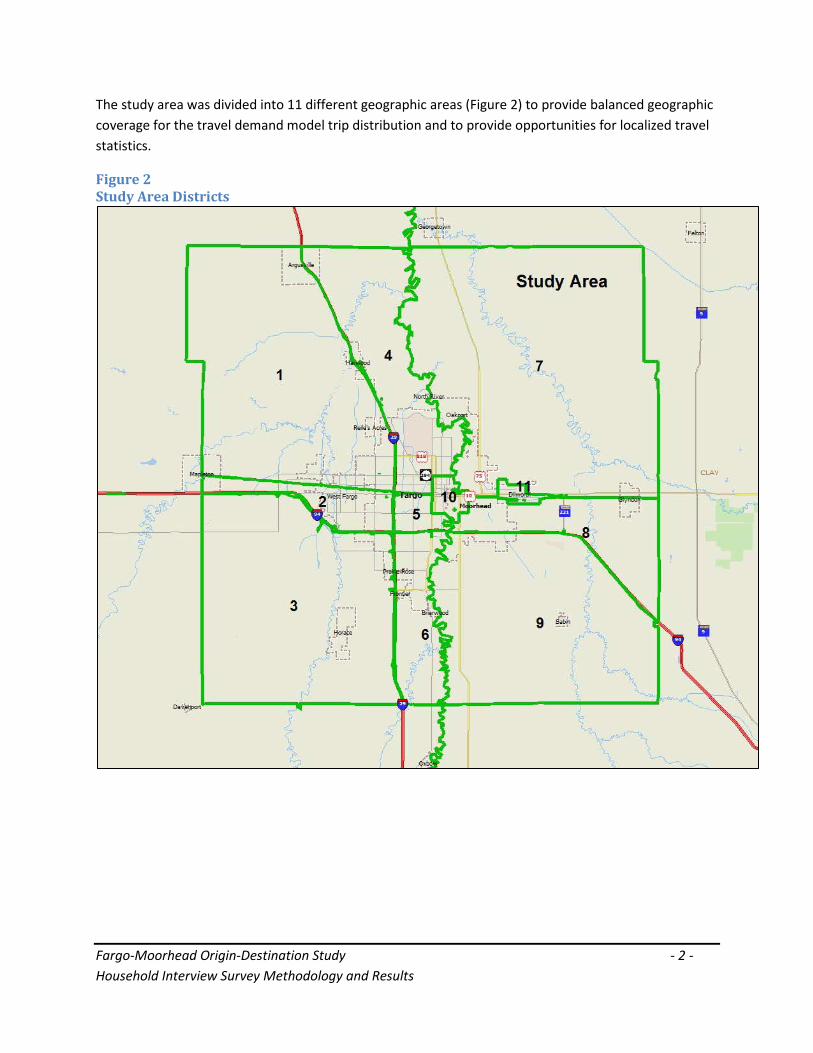
The study area was divided into 11 different geographic areas (Figure 2) to provide balanced geographic coverage for the travel demand model trip distribution and to provide opportunities for localized travel statistics.
Figure 2 Study Area Districts
Fargo-Moorhead Origin-Destination Study - 3 - Household Interview Survey Methodology and Results
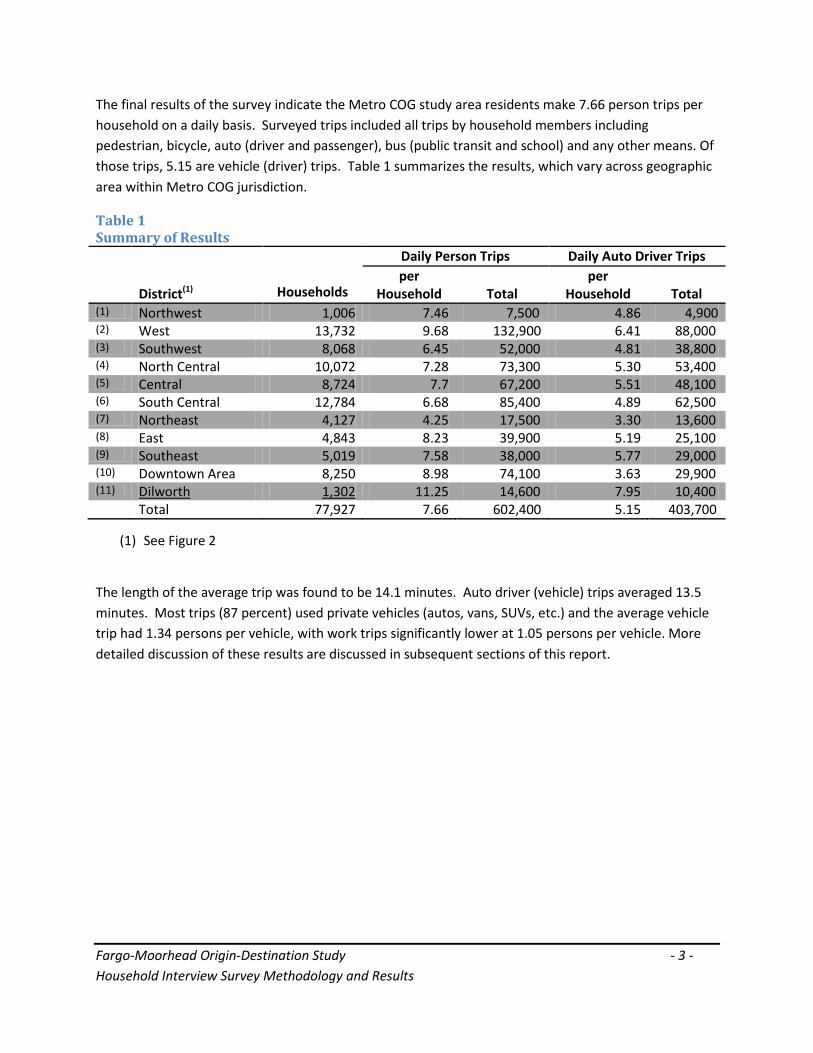
The final results of the survey indicate the Metro COG study area residents make 7.66 person trips per household on a daily basis. Surveyed trips included all trips by household members including pedestrian, bicycle, auto (driver and passenger), bus (public transit and school) and any other means. Of those trips, 5.15 are vehicle (driver) trips. Table 1 summarizes the results, which vary across geographic area within Metro COG jurisdiction.
Table 1 Summary of Results
District(1)
Households
Daily Person Trips Daily Auto Driver Trips per
Household
Total per
Household
Total (1) Northwest 1,006 7.46 7,500 4.86 4,900 (2) West 13,732 9.68 132,900 6.41 88,000 (3) Southwest 8,068 6.45 52,000 4.81 38,800 (4) North Central 10,072 7.28 73,300 5.30 53,400 (5) Central 8,724 7.7 67,200 5.51 48,100 (6) South Central 12,784 6.68 85,400 4.89 62,500 (7) Northeast 4,127 4.25 17,500 3.30 13,600 (8) East 4,843 8.23 39,900 5.19 25,100 (9) Southeast 5,019 7.58 38,000 5.77 29,000 (10) Downtown Area 8,250 8.98 74,100 3.63 29,900 (11) Dilworth 1,302 11.25 14,600 7.95 10,400 Total 77,927 7.66 602,400 5.15 403,700
(1) See Figure 2
The length of the average trip was found to be 14.1 minutes. Auto driver (vehicle) trips averaged 13.5 minutes. Most trips (87 percent) used private vehicles (autos, vans, SUVs, etc.) and the average vehicle trip had 1.34 persons per vehicle, with work trips significantly lower at 1.05 persons per vehicle. More detailed discussion of these results are discussed in subsequent sections of this report.
Fargo-Moorhead Origin-Destination Study - 4 - Household Interview Survey Methodology and Results
Survey Design The goal of the survey was to collect from 875 households across a specific stratification of the FMCOG area. Once final tabulation of the data was completed, 834 households were used in the final data set, a 95.3% achievement of the survey goal. While the targeted number of surveys was not met due to time and resource constraints, and unexpectedly high non-response rates, the overall statistical quality goals of the project were still achieved.
Survey methods were carried out consistent with industry guidelines as documented in NCHRP Report 571, Standardized Procedures for Personal Travel Surveys (2008). These methods include:
• Design of the survey sample • Development of the materials for the survey • Implementation of the survey • Data processing • Statistical Weighting • Data Analysis
Sample Design The target household universe for the survey consists of at the Metro COG travel demand model area – a subset of Clay County, Minnesota and Cass County, North Dakota (see Figure 1). Based on preliminary allocation of 2010 U.S. Census data, the study area consists of approximately 188,500 persons and 77,900 households.
The sample design phase includes selecting the population group and subgroups to be surveyed, identifying the number of desired samples from each subgroup, and selecting the methods to be used for data collection. For this survey, FMCOG used eleven districts to subdivide the model study area for the purposes of data analysis and travel demand model calibration. The target sample size was selected based on a desired statistical standard for sample error (10%) and proportionality with the overall study area household distribution.
District-level sampling stratification provides the necessary geographic distribution. To achieve the desired mix of socioeconomic characteristics of the surveyed population, the sampling plan stratification splits the study area into quintiles by proportion of owner-occupied households. Demographic representativeness was targeted by the use of housing tenure – the owner or renter-occupied status of households (housing tenure). Measures of housing tenure were available at the Census Block Group level from the American Community Survey 2005-2009 dataset released by the U.S. Census Bureau in December, 2010. Housing tenure serves as a useful proxy for residential mobility, student status, socio-economic level, age, presence of children, and other demographic characteristics of the metro area that the survey sample should mirror. This sampling also provides the desired mix of housing types (single- and multi-family) currently used as model parameters by Metro COG.
Fargo-Moorhead Origin-Destination Study - 5 - Household Interview Survey Methodology and Results
The American Community Survey is the Census Bureau’s replacement for the decennial census long form; it provides a sample of all households in a Block Group. Current ACS data is from the 2005-2009 time periods. Factored ACS data represents an estimate of current households. In March, 2011 the U.S. Census Bureau released 100 percent block-level population and household data. This data was used to re-weight the block group data to obtain a more accurate estimate of the household control totals for each district.
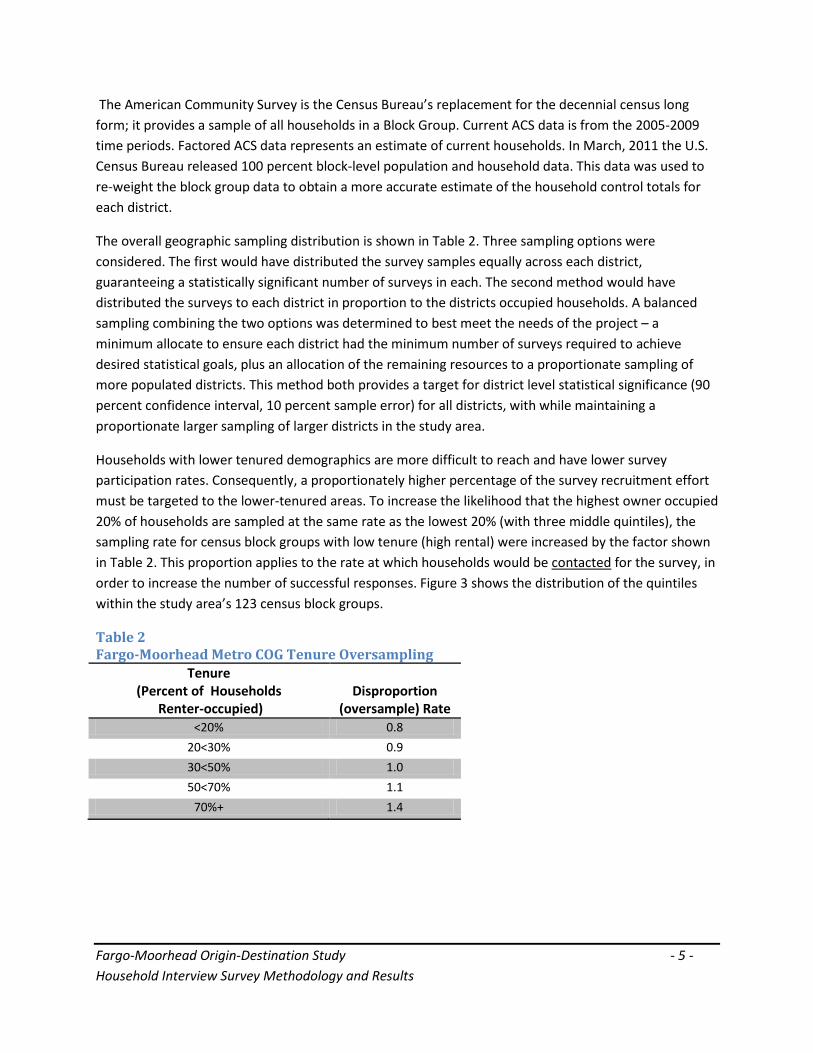
The overall geographic sampling distribution is shown in Table 2. Three sampling options were considered. The first would have distributed the survey samples equally across each district, guaranteeing a statistically significant number of surveys in each. The second method would have distributed the surveys to each district in proportion to the districts occupied households. A balanced sampling combining the two options was determined to best meet the needs of the project – a minimum allocate to ensure each district had the minimum number of surveys required to achieve desired statistical goals, plus an allocation of the remaining resources to a proportionate sampling of more populated districts. This method both provides a target for district level statistical significance (90 percent confidence interval, 10 percent sample error) for all districts, with while maintaining a proportionate larger sampling of larger districts in the study area.
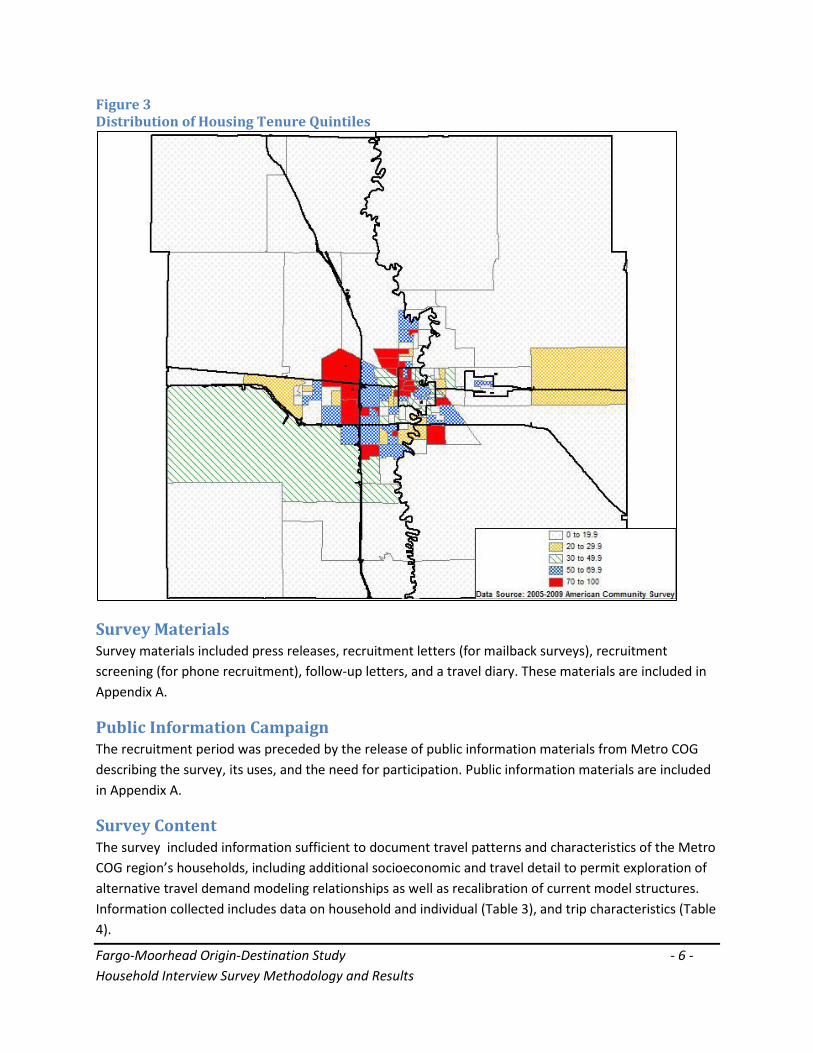
Households with lower tenured demographics are more difficult to reach and have lower survey participation rates. Consequently, a proportionately higher percentage of the survey recruitment effort must be targeted to the lower-tenured areas. To increase the likelihood that the highest owner occupied 20% of households are sampled at the same rate as the lowest 20% (with three middle quintiles), the sampling rate for census block groups with low tenure (high rental) were increased by the factor shown in Table 2. This proportion applies to the rate at which households would be contacted for the survey, in order to increase the number of successful responses. Figure 3 shows the distribution of the quintiles within the study area’s 123 census block groups.
Table 2 Fargo-Moorhead Metro COG Tenure Oversampling
Tenure (Percent of Households
Renter-occupied)
Disproportion
(oversample) Rate <20% 0.8
20<30% 0.9 30<50% 1.0 50<70% 1.1
70%+ 1.4
Fargo-Moorhead Origin-Destination Study - 6 - Household Interview Survey Methodology and Results
Figure 3 Distribution of Housing Tenure Quintiles
Survey Materials Survey materials included press releases, recruitment letters (for mailback surveys), recruitment screening (for phone recruitment), follow-up letters, and a travel diary. These materials are included in Appendix A.
Public Information Campaign The recruitment period was preceded by the release of public information materials from Metro COG describing the survey, its uses, and the need for participation. Public information materials are included in Appendix A.
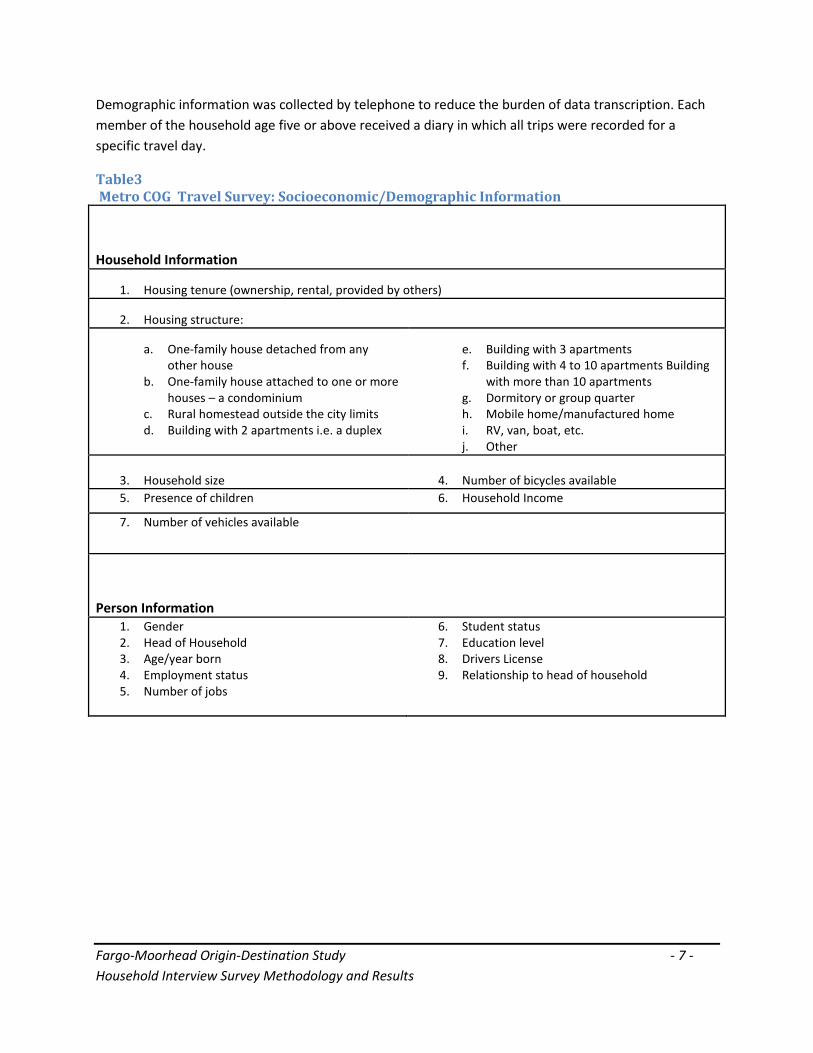
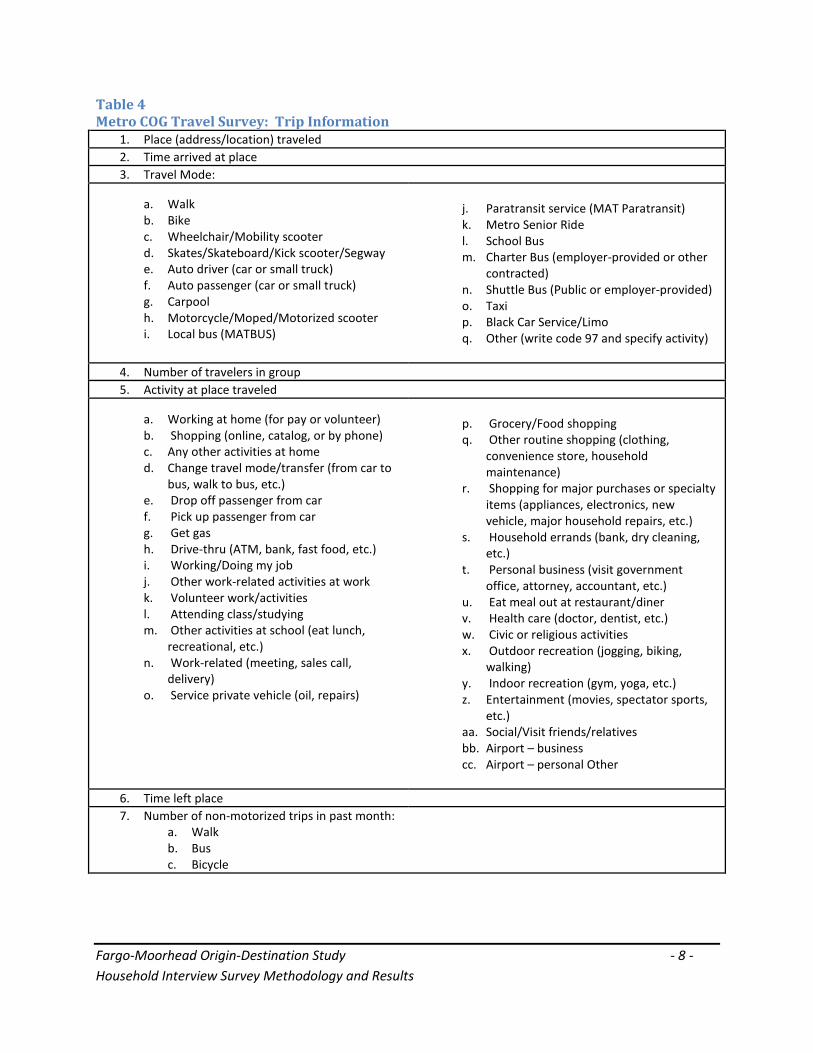
Survey Content The survey included information sufficient to document travel patterns and characteristics of the Metro COG region’s households, including additional socioeconomic and travel detail to permit exploration of alternative travel demand modeling relationships as well as recalibration of current model structures. Information collected includes data on household and individual (Table 3), and trip characteristics (Table 4).
Fargo-Moorhead Origin-Destination Study - 7 - Household Interview Survey Methodology and Results
Demographic information was collected by telephone to reduce the burden of data transcription. Each member of the household age five or above received a diary in which all trips were recorded for a specific travel day.
Table3 Metro COG Travel Survey: Socioeconomic/Demographic Information
Household Information
1. Housing tenure (ownership, rental, provided by others)
2. Housing structure:
a. One-family house detached from any other house
b. One-family house attached to one or more houses – a condominium
c. Rural homestead outside the city limits d. Building with 2 apartments i.e. a duplex
e. Building with 3 apartments f. Building with 4 to 10 apartments Building
with more than 10 apartments g. Dormitory or group quarter h. Mobile home/manufactured home i. RV, van, boat, etc. j. Other
3. Household size
4. Number of bicycles available
5. Presence of children 6. Household Income
7. Number of vehicles available
Person Information 1. Gender 2. Head of Household 3. Age/year born 4. Employment status 5. Number of jobs
6. Student status 7. Education level 8. Drivers License 9. Relationship to head of household
Fargo-Moorhead Origin-Destination Study - 8 - Household Interview Survey Methodology and Results
Table 4 Metro COG Travel Survey: Trip Information
1. Place (address/location) traveled 2. Time arrived at place 3. Travel Mode:
a. Walk b. Bike c. Wheelchair/Mobility scooter d. Skates/Skateboard/Kick scooter/Segway e. Auto driver (car or small truck) f. Auto passenger (car or small truck) g. Carpool h. Motorcycle/Moped/Motorized scooter i. Local bus (MATBUS)
j. Paratransit service (MAT Paratransit) k. Metro Senior Ride l. School Bus m. Charter Bus (employer-provided or other
contracted) n. Shuttle Bus (Public or employer-provided) o. Taxi p. Black Car Service/Limo q. Other (write code 97 and specify activity)
4. Number of travelers in group 5. Activity at place traveled
a. Working at home (for pay or volunteer) b. Shopping (online, catalog, or by phone) c. Any other activities at home d. Change travel mode/transfer (from car to
bus, walk to bus, etc.) e. Drop off passenger from car f. Pick up passenger from car g. Get gas h. Drive-thru (ATM, bank, fast food, etc.) i. Working/Doing my job j. Other work-related activities at work k. Volunteer work/activities l. Attending class/studying m. Other activities at school (eat lunch,
recreational, etc.) n. Work-related (meeting, sales call,
delivery) o. Service private vehicle (oil, repairs)
p. Grocery/Food shopping q. Other routine shopping (clothing,
convenience store, household maintenance)
r. Shopping for major purchases or specialty items (appliances, electronics, new vehicle, major household repairs, etc.)
s. Household errands (bank, dry cleaning, etc.)
t. Personal business (visit government office, attorney, accountant, etc.)
u. Eat meal out at restaurant/diner v. Health care (doctor, dentist, etc.) w. Civic or religious activities x. Outdoor recreation (jogging, biking,
walking) y. Indoor recreation (gym, yoga, etc.) z. Entertainment (movies, spectator sports,
etc.) aa. Social/Visit friends/relatives bb. Airport – business cc. Airport – personal Other
6. Time left place 7. Number of non-motorized trips in past month:
a. Walk b. Bus c. Bicycle
Fargo-Moorhead Origin-Destination Study - 9 - Household Interview Survey Methodology and Results
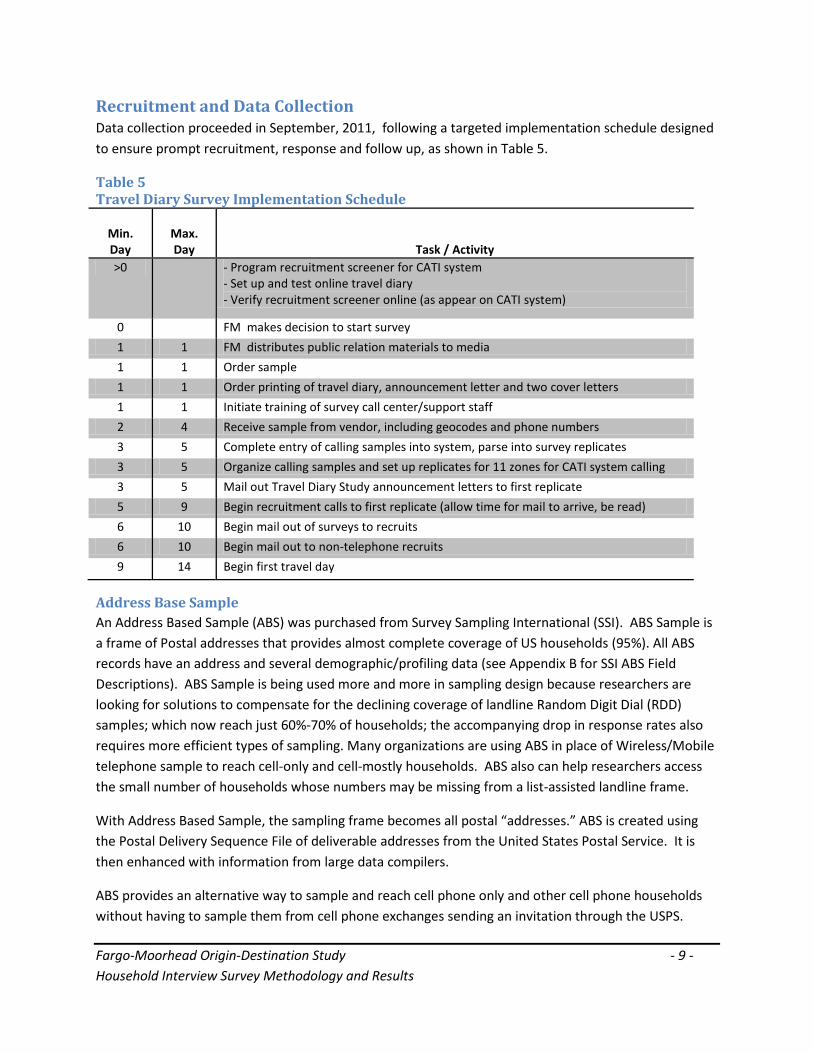
Recruitment and Data Collection Data collection proceeded in September, 2011, following a targeted implementation schedule designed to ensure prompt recruitment, response and follow up, as shown in Table 5.
Table 5 Travel Diary Survey Implementation Schedule
Min. Day
Max. Day
Task / Activity
>0 - Program recruitment screener for CATI system - Set up and test online travel diary - Verify recruitment screener online (as appear on CATI system)
0 FM makes decision to start survey 1 1 FM distributes public relation materials to media 1 1 Order sample 1 1 Order printing of travel diary, announcement letter and two cover letters 1 1 Initiate training of survey call center/support staff 2 4 Receive sample from vendor, including geocodes and phone numbers 3 5 Complete entry of calling samples into system, parse into survey replicates 3 5 Organize calling samples and set up replicates for 11 zones for CATI system calling 3 5 Mail out Travel Diary Study announcement letters to first replicate 5 9 Begin recruitment calls to first replicate (allow time for mail to arrive, be read) 6 10 Begin mail out of surveys to recruits 6 10 Begin mail out to non-telephone recruits 9 14 Begin first travel day
Address Base Sample An Address Based Sample (ABS) was purchased from Survey Sampling International (SSI). ABS Sample is a frame of Postal addresses that provides almost complete coverage of US households (95%). All ABS records have an address and several demographic/profiling data (see Appendix B for SSI ABS Field Descriptions). ABS Sample is being used more and more in sampling design because researchers are looking for solutions to compensate for the declining coverage of landline Random Digit Dial (RDD) samples; which now reach just 60%-70% of households; the accompanying drop in response rates also requires more efficient types of sampling. Many organizations are using ABS in place of Wireless/Mobile telephone sample to reach cell-only and cell-mostly households. ABS also can help researchers access the small number of households whose numbers may be missing from a list-assisted landline frame.
With Address Based Sample, the sampling frame becomes all postal “addresses.” ABS is created using the Postal Delivery Sequence File of deliverable addresses from the United States Postal Service. It is then enhanced with information from large data compilers.
ABS provides an alternative way to sample and reach cell phone only and other cell phone households without having to sample them from cell phone exchanges sending an invitation through the USPS.
Fargo-Moorhead Origin-Destination Study - 10 - Household Interview Survey Methodology and Results
Another important benefit of using an ABS sample is the auxiliary information that can be matched to an address, facilitating more complex sample designs; providing information for enhanced contacting and recruiting approaches. The last name of the “head of the household” is also provided which helps to personalize a contact. An ABS record does not include a telephone number; it must be matched from another source.
The ABS frame represents an estimated 95% of households in the designated area. It has lower coverage in rural areas due to the number of simplified addresses not on the USPS list. On average 85% of ABS records will have a name. In addition, on average, 45%-65% of ABS sample records can be matched to a telephone number. Telephone match rates, however, will be lower when PO Box and/or vacant addresses are included (see ABS Selection Options in Appendix).
The sample record used for calling includes occupant name (when available), address and telephone number plus geo-referencing information of latitude and longitude. The sample specifications specified the quantity of records by Census Block Group. An estimated 7,150 records were purchased initially. Of these, 43.9% could be matched to phone numbers.
Due to lower than expected cooperation rates and response rates, a second sample of 24,206 records was purchased. Of these, 45.9% matched to a phone number and these were added to the original telephone phone file.
After the first phase of recruiting, response rates in selected blocks were lower than required for analysis at a high level of confidence. Additional sample was purchased (5,414 records) only for these selected Blocks. Only records with phone numbers were purchased for this sample.
SSI matched records to a phone number. Accora segmented the file into two separate files, one with phone numbers and one without phone numbers. Recruitment was treated differently depending on whether the record matched to a phone number or not.
Sample Records with Matched Telephone Numbers If a sample record had a telephone number, it was used to recruit respondents by telephone:
• Phone recruitment was conducted during the late afternoon and evening hours to recruit participants. When contacted, the respondent was asked a series of questions to create a profile and then asked to participate in the study. Asking the screener questions upfront enabled tracking representativeness of the sample (see Screener in Appendix).
• A minimum of 4 or 5 call-backs were attempted on a working phone number; attempts were made until completion, refusal, or persistent No Answer.
• Diary packets were mailed on a daily basis – packets were mailed to all households recruited the day before. A diary was sent to each qualified household member.
• Participants were scheduled to record their trips one week after the Diary mail-out date.
Fargo-Moorhead Origin-Destination Study - 11 - Household Interview Survey Methodology and Results
Sample Records with No Matched Telephone Number If a sample record was not matched to a telephone number, it was used to recruit respondents by mail:
• A random sample of records with no phone number was selected and mailed an announcement letter inviting them to participate in the Travel Study. The letter was signed by the Executive Director of Metro COG and emphasized its importance to the local area.
• The letter also included an 800 number to Accora Research, email addresses for Accora and Metro COG; and website addresses for Accora and Metro COG.
After one month of data collection and returns of recruited households, an analysis was conducted to determine geographic and socio-demographic distribution based on the returned diaries. Because of lower than anticipated cooperation rates and response rates, it was decided to include an incentive for people who agree to participate in the study and returned their diaries. The incentive was offered during the telephone recruit, printed on the cover letter, blind recruitment letter and the diary. The incentive was:
“All participants in this Travel Study who record their trips and return their completed diary will be eligible to win a drawing for one of five new Apple® - iPod touch® 8GB* MP3 Player (4th Generation - Latest Model)”
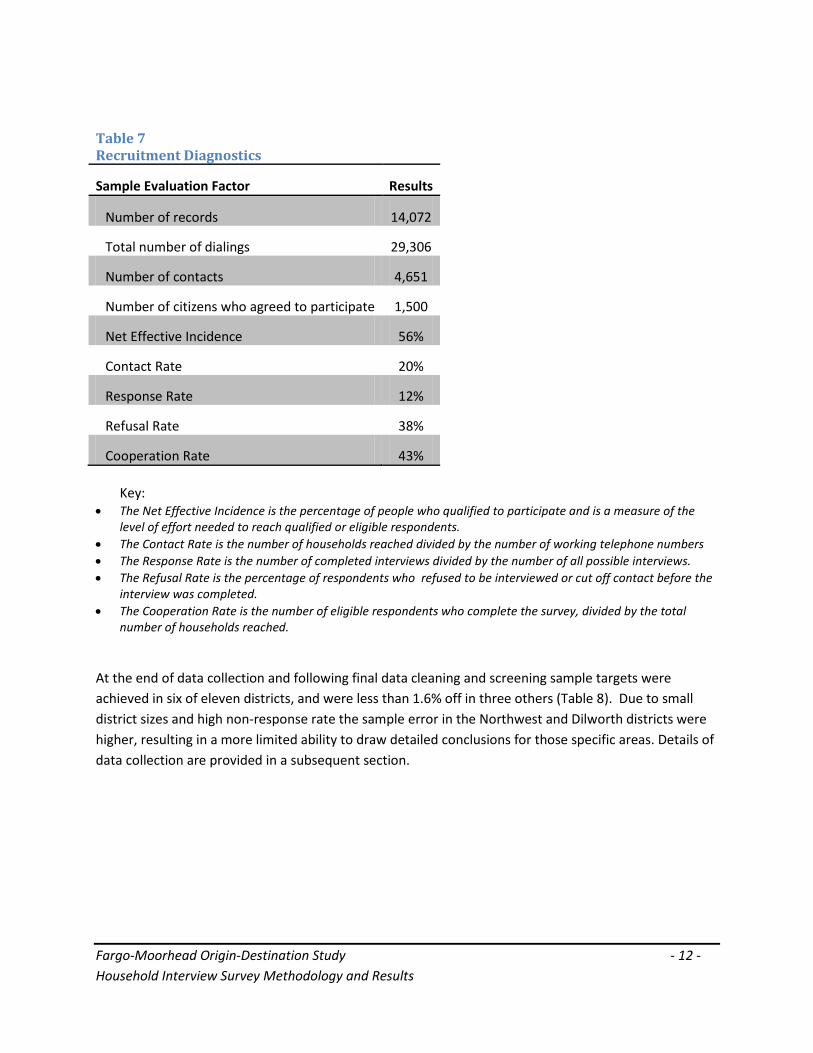
Telephone recruiting of participants was conducted from Accora's call center partner, Information Alliance, based in Logan, Utah. The call results are shown in Table 6 and 7, below. These factors are typically used to determine the amount of effort required to recruit participants; quality of the sample; and therefore, the quality of the information collected. These results are slightly above the average for a typical telephone survey, especially considering the topic and follow-up action required by the participant.
Table 6 Recruitment Totals Measure Count Households recruited 1704 Recruited by CATI 1693 Recruited by Invite Letter 5 Recruited by postcard 6 Reminder postcards sent 995 Non-deliverable postcards 71 Number of diaries mailed 3942 Number of households returned diaries 875 (51% of recruited
households) Number of diaries returned 1860 Number of households completed diaries online
110
Number of diaries completed online 240
Fargo-Moorhead Origin-Destination Study - 12 - Household Interview Survey Methodology and Results
Table 7 Recruitment Diagnostics
Sample Evaluation Factor Results
Number of records 14,072
Total number of dialings 29,306
Number of contacts 4,651
Number of citizens who agreed to participate 1,500
Net Effective Incidence 56%
Contact Rate 20%
Response Rate 12%
Refusal Rate 38%
Cooperation Rate 43%
Key: • The Net Effective Incidence is the percentage of people who qualified to participate and is a measure of the
level of effort needed to reach qualified or eligible respondents. • The Contact Rate is the number of households reached divided by the number of working telephone numbers • The Response Rate is the number of completed interviews divided by the number of all possible interviews. • The Refusal Rate is the percentage of respondents who refused to be interviewed or cut off contact before the
interview was completed. • The Cooperation Rate is the number of eligible respondents who complete the survey, divided by the total
number of households reached.
At the end of data collection and following final data cleaning and screening sample targets were achieved in six of eleven districts, and were less than 1.6% off in three others (Table 8). Due to small district sizes and high non-response rate the sample error in the Northwest and Dilworth districts were higher, resulting in a more limited ability to draw detailed conclusions for those specific areas. Details of data collection are provided in a subsequent section.
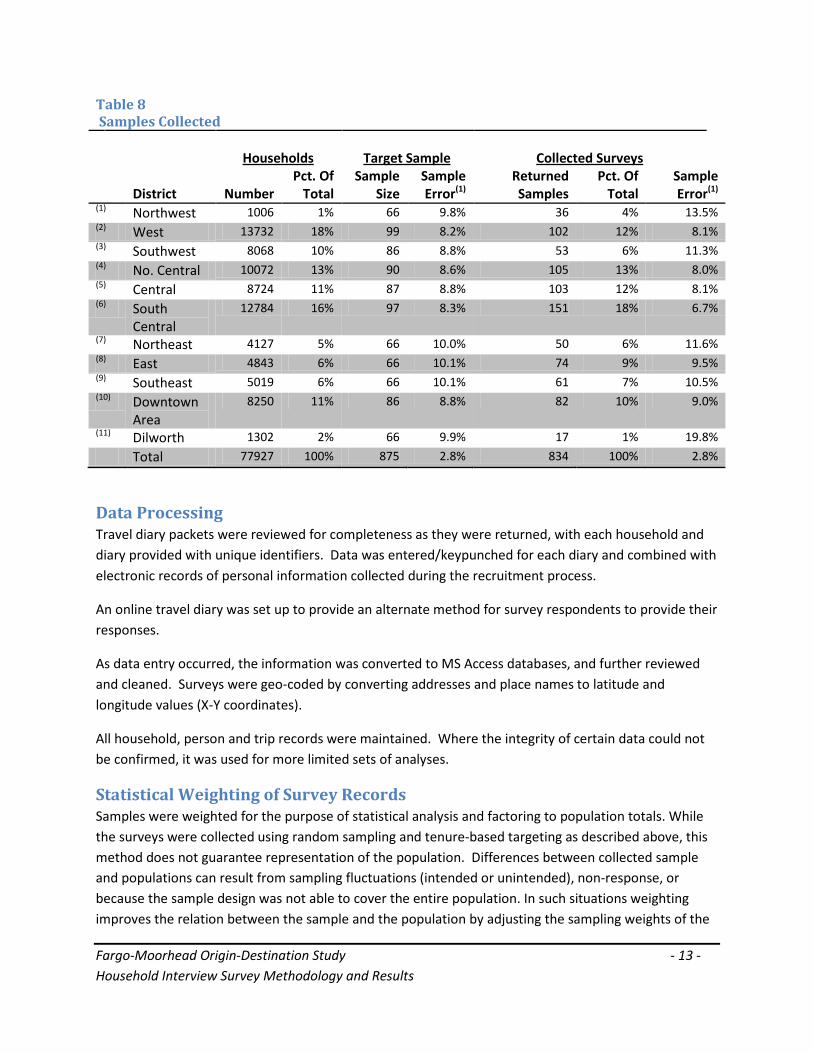
Fargo-Moorhead Origin-Destination Study - 13 - Household Interview Survey Methodology and Results
Table 8 Samples Collected
Households
Target Sample
Collected Surveys
District
Number Pct. Of
Total Sample
Size Sample Error(1)
Returned Samples
Pct. Of Total
Sample Error(1)
(1) Northwest 1006 1% 66 9.8% 36 4% 13.5% (2) West 13732 18% 99 8.2% 102 12% 8.1% (3) Southwest 8068 10% 86 8.8% 53 6% 11.3% (4) No. Central 10072 13% 90 8.6% 105 13% 8.0% (5) Central 8724 11% 87 8.8% 103 12% 8.1% (6) South
Central 12784 16% 97 8.3% 151 18% 6.7%
(7) Northeast 4127 5% 66 10.0% 50 6% 11.6% (8) East 4843 6% 66 10.1% 74 9% 9.5% (9) Southeast 5019 6% 66 10.1% 61 7% 10.5% (10) Downtown
Area 8250 11% 86 8.8% 82 10% 9.0%
(11) Dilworth 1302 2% 66 9.9% 17 1% 19.8% Total 77927 100% 875 2.8% 834 100% 2.8%
Data Processing Travel diary packets were reviewed for completeness as they were returned, with each household and diary provided with unique identifiers. Data was entered/keypunched for each diary and combined with electronic records of personal information collected during the recruitment process.
An online travel diary was set up to provide an alternate method for survey respondents to provide their responses.
As data entry occurred, the information was converted to MS Access databases, and further reviewed and cleaned. Surveys were geo-coded by converting addresses and place names to latitude and longitude values (X-Y coordinates).
All household, person and trip records were maintained. Where the integrity of certain data could not be confirmed, it was used for more limited sets of analyses.
Statistical Weighting of Survey Records Samples were weighted for the purpose of statistical analysis and factoring to population totals. While the surveys were collected using random sampling and tenure-based targeting as described above, this method does not guarantee representation of the population. Differences between collected sample and populations can result from sampling fluctuations (intended or unintended), non-response, or because the sample design was not able to cover the entire population. In such situations weighting improves the relation between the sample and the population by adjusting the sampling weights of the
Fargo-Moorhead Origin-Destination Study - 14 - Household Interview Survey Methodology and Results
cases in the sample so that the marginal totals of the adjusted weights on specified characteristics conform more closely to the corresponding totals for the population.
A multi-tiered approach to weighting the survey was conducted:
• Age of Householder by Household Size • Household Income • Household Vehicle Availability • Household Size by Geographic Location (district) • Age • Persons by Household Size
The weighting process, known as “raking”, involves iterative passes to adjust the weighting of various control values or cross-tabulations using other data sources such as the U.S. Census. The first weighting addressed a condition where small households with retired occupants appeared to be more likely to respond to the survey than small households with working occupants. All weightings were done using the best available information from the American Community Survey (2005-2009 or 2006-2010), depending on the weighting) and the 2010 U.S. Census. Stratifications and study area boundaries were followed as closely as possible, but certain U.S. Census data is only available at a regional level at this time. The U.S. Census information was only available at aggregated age and household size categories. The last weighting is consistent with the desired use of the information in the FMCOG regional travel demand model (geographic district and household size).
Fargo-Moorhead Origin-Destination Study - 15 - Household Interview Survey Methodology and Results
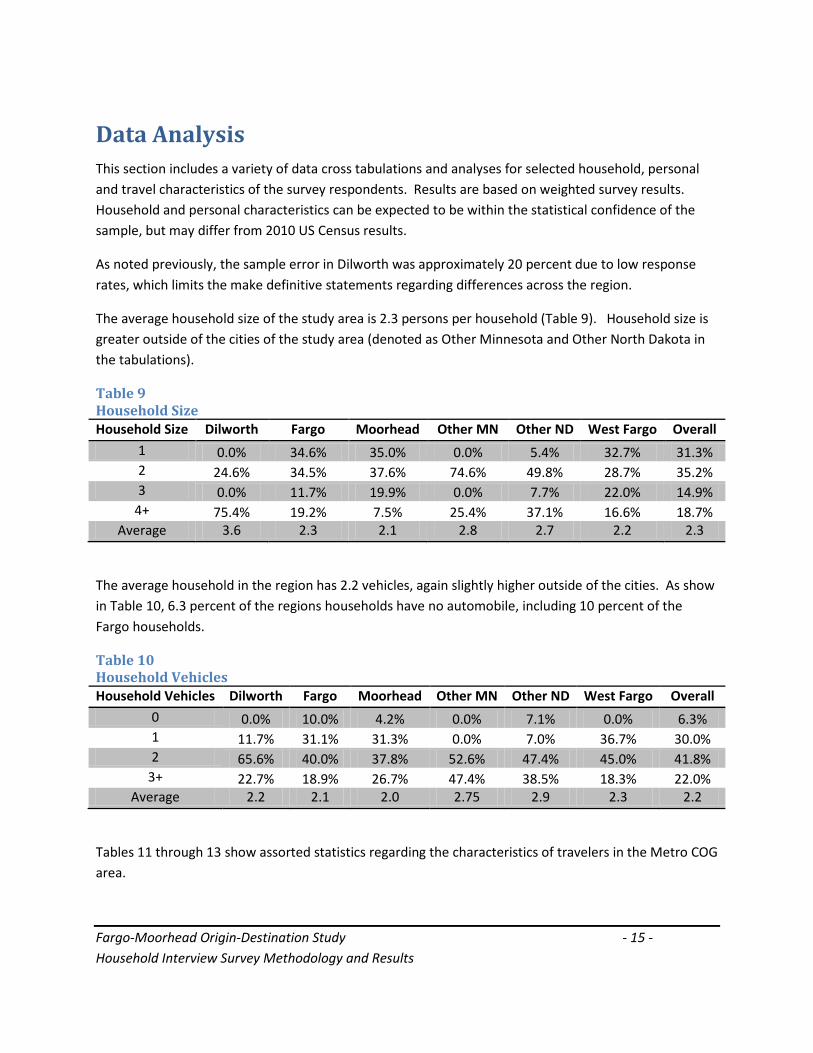
Data Analysis This section includes a variety of data cross tabulations and analyses for selected household, personal and travel characteristics of the survey respondents. Results are based on weighted survey results. Household and personal characteristics can be expected to be within the statistical confidence of the sample, but may differ from 2010 US Census results.
As noted previously, the sample error in Dilworth was approximately 20 percent due to low response rates, which limits the make definitive statements regarding differences across the region.
The average household size of the study area is 2.3 persons per household (Table 9). Household size is greater outside of the cities of the study area (denoted as Other Minnesota and Other North Dakota in the tabulations).
Table 9 Household Size Household Size Dilworth Fargo Moorhead Other MN Other ND West Fargo Overall
1 0.0% 34.6% 35.0% 0.0% 5.4% 32.7% 31.3% 2 24.6% 34.5% 37.6% 74.6% 49.8% 28.7% 35.2% 3 0.0% 11.7% 19.9% 0.0% 7.7% 22.0% 14.9%
4+ 75.4% 19.2% 7.5% 25.4% 37.1% 16.6% 18.7% Average 3.6 2.3 2.1 2.8 2.7 2.2 2.3
The average household in the region has 2.2 vehicles, again slightly higher outside of the cities. As show in Table 10, 6.3 percent of the regions households have no automobile, including 10 percent of the Fargo households.
Table 10 Household Vehicles Household Vehicles Dilworth Fargo Moorhead Other MN Other ND West Fargo Overall
0 0.0% 10.0% 4.2% 0.0% 7.1% 0.0% 6.3% 1 11.7% 31.1% 31.3% 0.0% 7.0% 36.7% 30.0% 2 65.6% 40.0% 37.8% 52.6% 47.4% 45.0% 41.8%
3+ 22.7% 18.9% 26.7% 47.4% 38.5% 18.3% 22.0% Average 2.2 2.1 2.0 2.75 2.9 2.3 2.2
Tables 11 through 13 show assorted statistics regarding the characteristics of travelers in the Metro COG area.
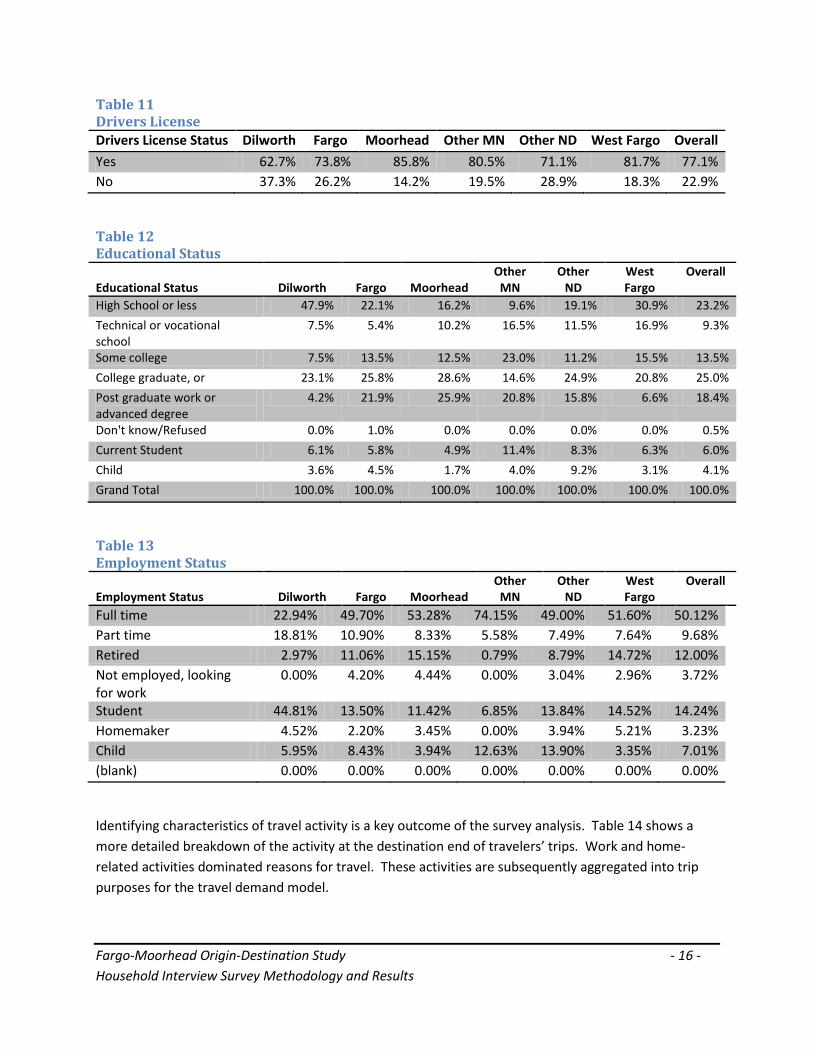
Fargo-Moorhead Origin-Destination Study - 16 - Household Interview Survey Methodology and Results
Table 11 Drivers License Drivers License Status Dilworth Fargo Moorhead Other MN Other ND West Fargo Overall Yes 62.7% 73.8% 85.8% 80.5% 71.1% 81.7% 77.1% No 37.3% 26.2% 14.2% 19.5% 28.9% 18.3% 22.9%
Table 12 Educational Status Educational Status
Dilworth
Fargo
Moorhead
Other MN
Other ND
West Fargo
Overall
High School or less 47.9% 22.1% 16.2% 9.6% 19.1% 30.9% 23.2% Technical or vocational school
7.5% 5.4% 10.2% 16.5% 11.5% 16.9% 9.3%
Some college 7.5% 13.5% 12.5% 23.0% 11.2% 15.5% 13.5% College graduate, or 23.1% 25.8% 28.6% 14.6% 24.9% 20.8% 25.0% Post graduate work or advanced degree
4.2% 21.9% 25.9% 20.8% 15.8% 6.6% 18.4%
Don't know/Refused 0.0% 1.0% 0.0% 0.0% 0.0% 0.0% 0.5% Current Student 6.1% 5.8% 4.9% 11.4% 8.3% 6.3% 6.0% Child 3.6% 4.5% 1.7% 4.0% 9.2% 3.1% 4.1% Grand Total 100.0% 100.0% 100.0% 100.0% 100.0% 100.0% 100.0%
Table 13 Employment Status Employment Status
Dilworth
Fargo
Moorhead
Other MN
Other ND
West Fargo
Overall
Full time 22.94% 49.70% 53.28% 74.15% 49.00% 51.60% 50.12% Part time 18.81% 10.90% 8.33% 5.58% 7.49% 7.64% 9.68% Retired 2.97% 11.06% 15.15% 0.79% 8.79% 14.72% 12.00% Not employed, looking for work
0.00% 4.20% 4.44% 0.00% 3.04% 2.96% 3.72%
Student 44.81% 13.50% 11.42% 6.85% 13.84% 14.52% 14.24% Homemaker 4.52% 2.20% 3.45% 0.00% 3.94% 5.21% 3.23% Child 5.95% 8.43% 3.94% 12.63% 13.90% 3.35% 7.01% (blank) 0.00% 0.00% 0.00% 0.00% 0.00% 0.00% 0.00%
Identifying characteristics of travel activity is a key outcome of the survey analysis. Table 14 shows a more detailed breakdown of the activity at the destination end of travelers’ trips. Work and home-related activities dominated reasons for travel. These activities are subsequently aggregated into trip purposes for the travel demand model.
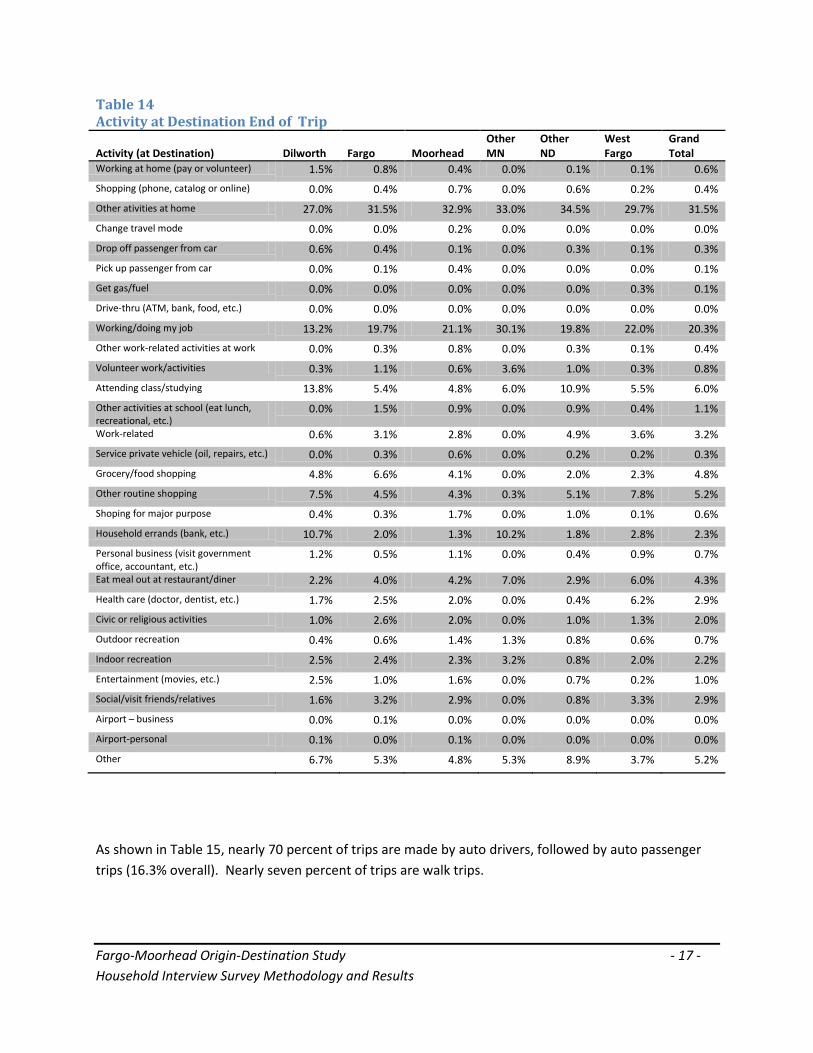
Fargo-Moorhead Origin-Destination Study - 17 - Household Interview Survey Methodology and Results
Table 14 Activity at Destination End of Trip Activity (at Destination)
Dilworth
Fargo
Moorhead
Other MN
Other ND
West Fargo
Grand Total
Working at home (pay or volunteer) 1.5% 0.8% 0.4% 0.0% 0.1% 0.1% 0.6% Shopping (phone, catalog or online) 0.0% 0.4% 0.7% 0.0% 0.6% 0.2% 0.4% Other ativities at home 27.0% 31.5% 32.9% 33.0% 34.5% 29.7% 31.5% Change travel mode 0.0% 0.0% 0.2% 0.0% 0.0% 0.0% 0.0% Drop off passenger from car 0.6% 0.4% 0.1% 0.0% 0.3% 0.1% 0.3% Pick up passenger from car 0.0% 0.1% 0.4% 0.0% 0.0% 0.0% 0.1% Get gas/fuel 0.0% 0.0% 0.0% 0.0% 0.0% 0.3% 0.1% Drive-thru (ATM, bank, food, etc.) 0.0% 0.0% 0.0% 0.0% 0.0% 0.0% 0.0% Working/doing my job 13.2% 19.7% 21.1% 30.1% 19.8% 22.0% 20.3% Other work-related activities at work 0.0% 0.3% 0.8% 0.0% 0.3% 0.1% 0.4% Volunteer work/activities 0.3% 1.1% 0.6% 3.6% 1.0% 0.3% 0.8% Attending class/studying 13.8% 5.4% 4.8% 6.0% 10.9% 5.5% 6.0% Other activities at school (eat lunch, recreational, etc.)
0.0% 1.5% 0.9% 0.0% 0.9% 0.4% 1.1%
Work-related 0.6% 3.1% 2.8% 0.0% 4.9% 3.6% 3.2% Service private vehicle (oil, repairs, etc.) 0.0% 0.3% 0.6% 0.0% 0.2% 0.2% 0.3% Grocery/food shopping 4.8% 6.6% 4.1% 0.0% 2.0% 2.3% 4.8% Other routine shopping 7.5% 4.5% 4.3% 0.3% 5.1% 7.8% 5.2% Shoping for major purpose 0.4% 0.3% 1.7% 0.0% 1.0% 0.1% 0.6% Household errands (bank, etc.) 10.7% 2.0% 1.3% 10.2% 1.8% 2.8% 2.3% Personal business (visit government office, accountant, etc.)
1.2% 0.5% 1.1% 0.0% 0.4% 0.9% 0.7%
Eat meal out at restaurant/diner 2.2% 4.0% 4.2% 7.0% 2.9% 6.0% 4.3% Health care (doctor, dentist, etc.) 1.7% 2.5% 2.0% 0.0% 0.4% 6.2% 2.9% Civic or religious activities 1.0% 2.6% 2.0% 0.0% 1.0% 1.3% 2.0% Outdoor recreation 0.4% 0.6% 1.4% 1.3% 0.8% 0.6% 0.7% Indoor recreation 2.5% 2.4% 2.3% 3.2% 0.8% 2.0% 2.2% Entertainment (movies, etc.) 2.5% 1.0% 1.6% 0.0% 0.7% 0.2% 1.0% Social/visit friends/relatives 1.6% 3.2% 2.9% 0.0% 0.8% 3.3% 2.9% Airport – business 0.0% 0.1% 0.0% 0.0% 0.0% 0.0% 0.0% Airport-personal 0.1% 0.0% 0.1% 0.0% 0.0% 0.0% 0.0% Other 6.7% 5.3% 4.8% 5.3% 8.9% 3.7% 5.2%
As shown in Table 15, nearly 70 percent of trips are made by auto drivers, followed by auto passenger trips (16.3% overall). Nearly seven percent of trips are walk trips.
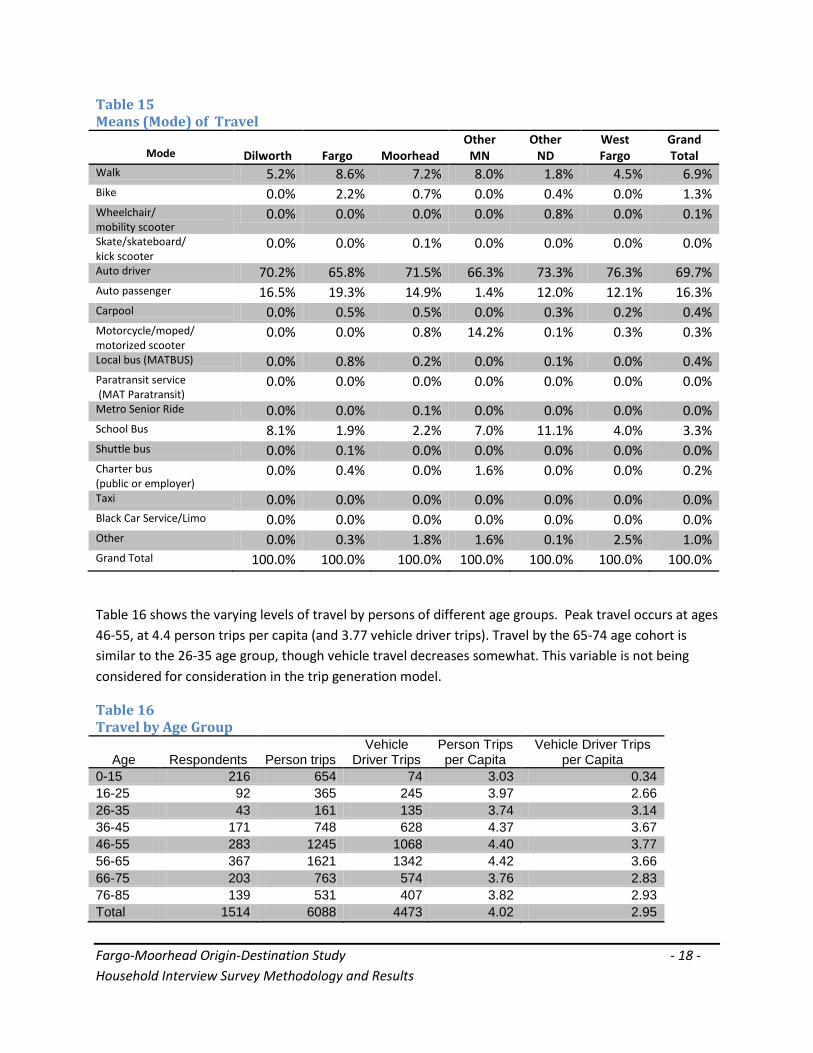
Fargo-Moorhead Origin-Destination Study - 18 - Household Interview Survey Methodology and Results
Table 15 Means (Mode) of Travel
Mode
Dilworth
Fargo
Moorhead
Other MN
Other ND
West Fargo
Grand Total
Walk 5.2% 8.6% 7.2% 8.0% 1.8% 4.5% 6.9% Bike 0.0% 2.2% 0.7% 0.0% 0.4% 0.0% 1.3% Wheelchair/ mobility scooter
0.0% 0.0% 0.0% 0.0% 0.8% 0.0% 0.1%
Skate/skateboard/ kick scooter
0.0% 0.0% 0.1% 0.0% 0.0% 0.0% 0.0%
Auto driver 70.2% 65.8% 71.5% 66.3% 73.3% 76.3% 69.7% Auto passenger 16.5% 19.3% 14.9% 1.4% 12.0% 12.1% 16.3% Carpool 0.0% 0.5% 0.5% 0.0% 0.3% 0.2% 0.4% Motorcycle/moped/ motorized scooter
0.0% 0.0% 0.8% 14.2% 0.1% 0.3% 0.3%
Local bus (MATBUS) 0.0% 0.8% 0.2% 0.0% 0.1% 0.0% 0.4% Paratransit service (MAT Paratransit)
0.0% 0.0% 0.0% 0.0% 0.0% 0.0% 0.0%
Metro Senior Ride 0.0% 0.0% 0.1% 0.0% 0.0% 0.0% 0.0% School Bus 8.1% 1.9% 2.2% 7.0% 11.1% 4.0% 3.3% Shuttle bus 0.0% 0.1% 0.0% 0.0% 0.0% 0.0% 0.0% Charter bus (public or employer)
0.0% 0.4% 0.0% 1.6% 0.0% 0.0% 0.2%
Taxi 0.0% 0.0% 0.0% 0.0% 0.0% 0.0% 0.0% Black Car Service/Limo 0.0% 0.0% 0.0% 0.0% 0.0% 0.0% 0.0% Other 0.0% 0.3% 1.8% 1.6% 0.1% 2.5% 1.0% Grand Total 100.0% 100.0% 100.0% 100.0% 100.0% 100.0% 100.0%
Table 16 shows the varying levels of travel by persons of different age groups. Peak travel occurs at ages 46-55, at 4.4 person trips per capita (and 3.77 vehicle driver trips). Travel by the 65-74 age cohort is similar to the 26-35 age group, though vehicle travel decreases somewhat. This variable is not being considered for consideration in the trip generation model.
Table 16 Travel by Age Group
Age
Respondents
Person trips
Vehicle Driver Trips
Person Trips per Capita
Vehicle Driver Trips per Capita
0-15 216 654 74 3.03 0.34 16-25 92 365 245 3.97 2.66 26-35 43 161 135 3.74 3.14 36-45 171 748 628 4.37 3.67 46-55 283 1245 1068 4.40 3.77 56-65 367 1621 1342 4.42 3.66 66-75 203 763 574 3.76 2.83 76-85 139 531 407 3.82 2.93 Total 1514 6088 4473 4.02 2.95
Fargo-Moorhead Origin-Destination Study - 19 - Household Interview Survey Methodology and Results
Trip Generation Analysis This section includes potential trip rates to be used in the update of the Fargo-Moorhead Metro COG travel demand model. Trip generation is a key step in the travel demand modeling process. Travel is classified into various trip purposes. Survey data were disaggregated into these purposes and then reviewed for statistical significance in conjunction with various trip generation estimators.
Two types of trip generation models were considered:
Person Trip Generation – travel by individuals, regardless of mode (method) of travel: walk, bike, driver, passenger, transit, etc.
Vehicle Trip Generation – Travel as auto driver only
Most advanced practice a general travel demand models use person trip generation.
The following purposes were considered. Standard practice is to be “produced” by the home end of the trip, and “attracted” to the non-home end. Several were dropped from consideration based on poor statistical fit (generally due to a small number of observed data points):
• Home Based Work (HBW) • Home Based Shopping (HB-Shop) • Home Based Other (HBO)(Home based trips that are not shopping or school-related) • Home Based School (HB-School)(Grades K-12) • Non Home Based (Trips that neither begin nor end at the home location) • Internal-External (Metro COG residents traveling to/from destinations beyond the model
boundaries) Other trip purposes investigated included Home Based University and separate purpose for school trips in grades K-8 and grades 9-12. In each case, the trip purpose was not pursued because of insufficient data samples.
Numerous independent variables were considered for potential use in the trip generation model, including: tenure (owner/renter), building type (single/multi-family), household size, income, vehicle ownership/availability and workers per household. Factors considered in selecting the preferred trip rate variable(s) are:
• Behavioral applicability of data – regardless of statistical significance, the selected measures should be grounded in travel behavior to avoid the model being based on coincidental relationships.
• Forecast-ability of data -- any variable will need to be projected to a future value. Some can more easily be extrapolated or held constant; others may require a secondary model or explicit estimate.
• Statistical Relationships -- valid strength or the relationships among the variables considered.
A cross-classification trip generation should include two measures that are not directly related to each other, but are related to trip-making; correlation measures this relationship. Table 17 identifies the
Fargo-Moorhead Origin-Destination Study - 20 - Household Interview Survey Methodology and Results
correlation among the several variables and trip rates to highlight where variables are similar and/or may be good estimators. A correlation at or near 1.0 or -1.0 shows a strong relationship, while correlations of 0.0 show no relationship between variables. Household size shows the strongest correlation, followed by workers, vehicles and income per household. Household size stratified by a “wealth/affluence” variable is a commonly used trip generation cross-classification.
Table 17 Correlation Matrix of Potential Trip Generation Estimators
Tenu
re
Build
ing
Type
(T
otal
)
Build
ing
Type
(2
-cla
ss)
Inco
me
Vehi
cles
Wor
kers
HH S
ize
Pers
on
Trip
s
Vehi
cle
Trip
s
Tenure 1.000 Building Type (Total)
0.858 1.000
Building Type (2-class)
0.788 0.941 1.000
Income 0.448 0.446 0.421 1.000 Vehicles 0.451 0.414 0.314 0.383 1.000 Workers 0.109 0.168 0.187 0.473 0.440 1.000 HH Size 0.242 0.331 0.287 0.418 0.471 0.504 1.000 Person Trips 0.237 0.310 0.285 0.356 0.383 0.424 0.627 1.000 Vehicle Trips 0.245 0.279 0.212 0.349 0.441 0.359 0.439 0.801 1.000
The trip rates for each purpose were developed using the SYSTAT statistical package, with relationship strength estimated using Student’s t-test. The test compares the mean (average) trip rate for each purpose and classification cell to determine whether it is statistically significant (not a value of 0, or not a difference of 0 when comparing two cells). The t-statistic is a measure of strength and fit; lower t-statistics show weak statistical relationships. The p-value is the probability that the estimated trip rate value could be 0.0 (a value of 0.05 corresponds to a 5 percent chance of the mean being 0.0, or that there is a 95 percent chance it is not and therefore is considered significant. . The t-statistic depends of the number of samples in the survey and how much they vary.
Several trip generation experiments were performed. Three cross-classification trip rate options are provided for testing in the FM COG model. The remaining experiments are included in Appendix C for information purposes. Three cross-classifications included in the analysis:
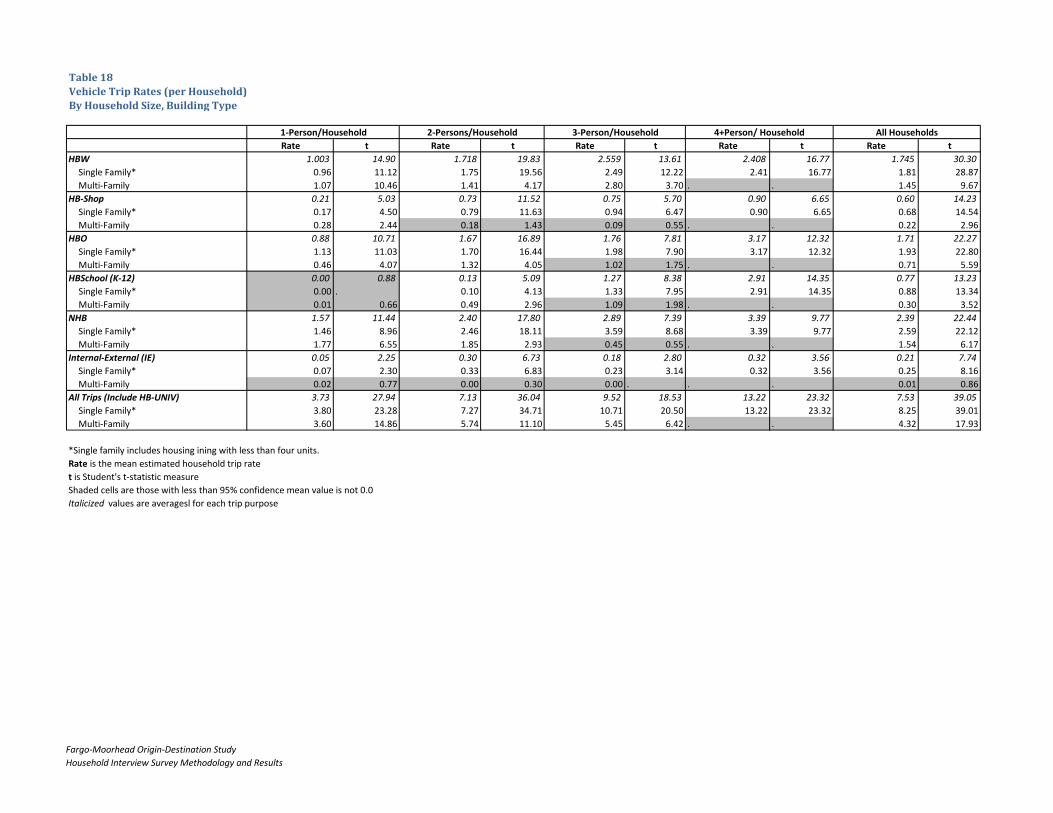
1. Household Size by Building Type (Tables 18 and 19). This cross-classification shows generally strong and logical statistical relationships across the various cells, with the exception of the three-person four-plus-person multifamily units. For this analysis consistency was maintained with current FM COG modeling data files by including two-unit and three-unit buildings as single family households. It should be noted that the single-classification trip generation rates for single-family detached units are much higher than all other building types (see Appendix C); consequently, clustering all three-unit and smaller classifications into the single-family may dilute the strength of that category as well as yield lower trip rates for single family units. Implementation of this option will require some
Fargo-Moorhead Origin-Destination Study - 21 - Household Interview Survey Methodology and Results
aggregation and smoothing of trip generation cells (within the confidence interval) to provide logical results and synthesize trip rates in cells with no observations..
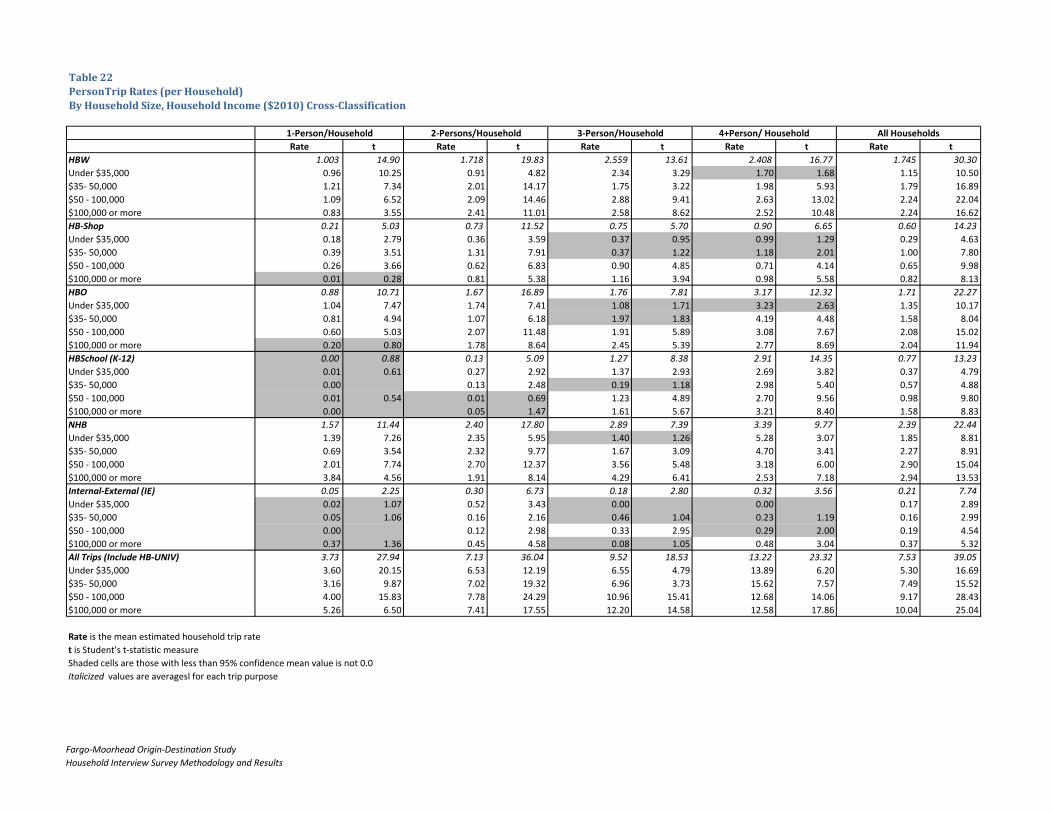
2. Household Size by Income (Tables 20 and 21). This cross classification shows significant statistical relationships among individual cells and is a behaviorally intuitive and commonly used in travel demand models. While many of the individual classifications show logical progression across classification, the reduced number of observations in each cell increases the variance and thus the potential for counter-intuitive results. Implementation of this option would require some aggregation and smoothing of trip generation cells (within the confidence interval) to provide logical results.
3. Household size by Vehicle Availability (Tables 22 and 23). While similar to household size by income as a stratification of a “wealth” variable, this classification shows fewer significant trip rates among the cells. Although many of the individual classifications show logical progression across classification, the reduced number of observations in each cell increases the variance and thus the potential for counter-intuitive results. Implementation of this option would require some aggregation and smoothing of trip generation cells (within the confidence interval) to provide logical results.
A variety of other relationships were tested as single classification trip generation parameters. Often, these classifications demonstrated a statistically significant result, though generally this can be considered a function of a smaller number of trip generation “cells” with a higher number of sample records in each. The classifications reviewed, with results included as Appendix C, are:
• Tenure (own or rent housing), as a measure, it is highly correlated with building type (rental units tending to be multi-family units), which is more readily measured and forecast.
• Housing Type (Total) has a more disaggregate categories of housing types for trip generation.
However, many of the non-single-family have few cases represented in the sample and therefore weak statistical relationships.
• Housing Type (Single- v. multi-family) generally has a strong and logical statistical relationship.
However, it is observed in that the disaggregated trip generation tables that the trip rates for single-family detached units are much higher than all other units. Consequently, clustering all three-unit and smaller classifications into the single-family may dilute the quality of that category (and provide lower trip rates).
• Household income shows a reasonable and consistent pattern for trip generation and reasonable
statistical relationships. • Household vehicle ownership shows a reasonable and consistent pattern for trip generation and
reasonable statistical relationships, particularly for vehicle trip generation. • Workers per household shows a reasonable and consistent pattern for trip generation and
reasonable statistical relationships. However, it can be difficult to estimate and forecast, particularly in new land developments.

Fargo-Moorhead Origin-Destination Study - 22 - Household Interview Survey Methodology and Results
• Household size shows the strongest and most logical statistical relationships overall, particularly for a more disaggregated (four-classification) variable. Consequently, it is logical to consider it in combination with indicators of wealth (autos or income) for trip generation. As with most other variables, i t can be difficult to forecast, particularly in new land developments.
Fargo-Moorhead Origin-Destination Study Household Interview Survey Methodology and Results
Table 18Vehicle Trip Rates (per Household)By Household Size, Building Type
Rate t Rate t Rate t Rate t Rate tHBW 1.003 14.90 1.718 19.83 2.559 13.61 2.408 16.77 1.745 30.30
Single Family* 0.96 11.12 1.75 19.56 2.49 12.22 2.41 16.77 1.81 28.87Multi-Family 1.07 10.46 1.41 4.17 2.80 3.70 . . 1.45 9.67
HB-Shop 0.21 5.03 0.73 11.52 0.75 5.70 0.90 6.65 0.60 14.23Single Family* 0.17 4.50 0.79 11.63 0.94 6.47 0.90 6.65 0.68 14.54Multi-Family 0.28 2.44 0.18 1.43 0.09 0.55 . . 0.22 2.96
HBO 0.88 10.71 1.67 16.89 1.76 7.81 3.17 12.32 1.71 22.27Single Family* 1.13 11.03 1.70 16.44 1.98 7.90 3.17 12.32 1.93 22.80Multi-Family 0.46 4.07 1.32 4.05 1.02 1.75 . . 0.71 5.59
HBSchool (K-12) 0.00 0.88 0.13 5.09 1.27 8.38 2.91 14.35 0.77 13.23Single Family* 0.00 . 0.10 4.13 1.33 7.95 2.91 14.35 0.88 13.34Multi-Family 0.01 0.66 0.49 2.96 1.09 1.98 . . 0.30 3.52
NHB 1.57 11.44 2.40 17.80 2.89 7.39 3.39 9.77 2.39 22.44Single Family* 1.46 8.96 2.46 18.11 3.59 8.68 3.39 9.77 2.59 22.12Multi-Family 1.77 6.55 1.85 2.93 0.45 0.55 . . 1.54 6.17
Internal-External (IE) 0.05 2.25 0.30 6.73 0.18 2.80 0.32 3.56 0.21 7.74Single Family* 0.07 2.30 0.33 6.83 0.23 3.14 0.32 3.56 0.25 8.16Multi-Family 0.02 0.77 0.00 0.30 0.00 . . . 0.01 0.86
All Trips (Include HB-UNIV) 3.73 27.94 7.13 36.04 9.52 18.53 13.22 23.32 7.53 39.05Single Family* 3.80 23.28 7.27 34.71 10.71 20.50 13.22 23.32 8.25 39.01Multi-Family 3.60 14.86 5.74 11.10 5.45 6.42 . . 4.32 17.93
*Single family includes housing ining with less than four units.Rate is the mean estimated household trip rate t is Student's t-statistic measure
All Households
Shaded cells are those with less than 95% confidence mean value is not 0.0Italicized values are averagesl for each trip purpose
1-Person/Household 2-Persons/Household 3-Person/Household 4+Person/ Household

Fargo-Moorhead Origin-Destination Study Household Interview Survey Methodology and Results
Table 19Vehicle Trip Rates (per Household)By Household Size, Building Type
Rate t Rate t Rate t Rate t Rate tHBW 0.91 13.32 1.42 16.34 2.33 12.37 2.24 15.54 1.55 26.97
Single Family* 0.93 10.77 1.43 15.81 2.19 10.84 2.24 15.54 1.60 25.67Multi-Family 0.89 7.76 1.35 4.13 2.80 3.70 . . 1.32 8.47
HBShop 0.19 4.85 0.41 9.12 0.71 5.70 0.71 6.99 0.44 13.30Single Family 0.15 4.29 0.44 9.10 0.89 6.47 0.71 6.99 0.49 13.40Multi-Family 0.27 2.42 0.18 1.43 0.09 0.55 . . 0.22 2.95
HBO 0.58 8.15 1.06 14.25 1.05 6.34 2.01 11.56 1.08 19.63Single Family* 0.71 7.97 1.11 14.17 1.32 7.34 2.01 11.56 1.24 20.51Multi-Family 0.35 3.24 0.56 2.61 0.10 0.52 . . 0.34 3.87
HBSchool (K-12) 0.00 0.80 0.00 0.76 0.47 4.49 0.42 4.92 0.15 6.85Single Family 0.00 . 0.00 0.77 0.58 4.91 0.42 4.92 0.18 7.09Multi-Family 0.01 0.61 0.00 . 0.10 0.55 . . 0.03 1.27
NHB 1.43 11.06 1.55 13.61 2.03 6.07 2.34 8.06 1.73 19.21Single Family* 1.32 9.17 1.57 13.38 2.54 6.93 2.34 8.06 1.82 18.41Multi-Family 1.61 5.66 1.39 2.97 0.27 0.55 . . 1.32 6.01
Internal-External (IE) 0.05 2.25 0.18 5.90 0.16 2.55 0.21 2.84 0.14 6.74Single Family 0.07 2.30 0.19 5.96 0.20 2.86 0.21 2.84 0.17 7.07Multi-Family 0.02 0.77 0.00 0.30 0.00 . . . 0.01 0.86
All Trips (Include HB-UNIV) 3.18 21.51 4.73 24.19 6.84 14.12 8.00 19.23 5.16 34.98Single Family* 3.19 18.60 4.81 22.94 7.86 15.52 8.00 19.23 5.56 33.97Multi-Family 3.14 10.31 3.97 9.37 3.36 4.60 . . 3.33 14.93
*Single family includes housing ining with less than four units.Rate is the mean estimated household trip rate t is Student's t-statistic measure
1-Person/Household 2-Persons/Household 3-Person/Household 4+Person/ Household All Households
Shaded cells are those with less than 95% confidence mean value is not 0.0Italicized values are averagesl for each trip purpose

Fargo-Moorhead Origin-Destination Study Household Interview Survey Methodology and Results
Table 20Person Trip Rates (per Household)By Household Size, Vehicle Availability Cross-Classification
Average of Mean Average of t Average of Mean Average of t Average of Mean Average of t Average of Mean Average of t Average of Mean Average of tHBW 1.003 14.90 1.718 19.83 2.559 13.61 2.408 16.77 1.745 30.30No Vehicles Available 0.58 1.16 1.30 1.93 1.08 2.391 vehicle Available 1.13 13.57 1.21 5.38 3.99 10.14 1.71 3.97 1.36 14.332 Vehicles Available 0.88 7.47 1.85 15.35 1.85 6.83 2.38 11.52 1.86 21.033+ Vehicles Available 0.41 1.78 2.02 12.24 2.88 11.00 2.54 11.99 2.25 18.73HB-Shop 0.21 5.03 0.73 11.52 0.75 5.70 0.90 6.65 0.60 14.23No Vehicles Available 0.00 . 2.29 2.54 1.58 2.111 vehicle Available 0.25 4.68 0.43 4.01 0.00 . 0.00 . 0.26 5.742 Vehicles Available 0.09 1.39 0.45 7.15 1.00 4.08 0.67 4.70 0.55 9.773+ Vehicles Available 0.26 1.46 0.74 5.23 0.72 4.55 1.38 5.36 0.89 8.51HBO 0.88 10.71 1.67 16.89 1.76 7.81 3.17 12.32 1.71 22.27No Vehicles Available 1.43 2.88 0.59 0.98 0.85 1.991 vehicle Available 0.81 7.56 1.78 5.90 0.40 0.73 3.18 7.77 1.02 9.322 Vehicles Available 0.83 6.21 1.97 14.69 2.04 5.27 3.08 8.01 2.12 16.943+ Vehicles Available 1.26 5.39 1.43 8.23 1.93 6.51 3.30 9.12 2.13 13.69HBSchool (K-12) 0.00 0.88 0.13 5.09 1.27 8.38 2.91 14.35 0.77 13.23No Vehicles Available 0.00 . 0.00 . 0.00 .1 vehicle Available 0.01 0.89 0.81 5.46 2.07 7.28 3.29 3.73 0.39 5.642 Vehicles Available 0.00 . 0.02 1.38 0.91 3.91 3.14 10.22 0.96 9.563+ Vehicles Available 0.00 . 0.00 . 1.40 6.21 2.50 9.51 1.16 9.67NHB 1.57 11.44 2.40 17.80 2.89 7.39 3.39 9.77 2.39 22.44No Vehicles Available 0.58 1.16 1.65 4.90 1.32 3.801 vehicle Available 1.69 9.90 2.09 4.66 0.38 0.52 0.64 2.32 1.64 10.272 Vehicles Available 1.63 5.74 2.49 13.88 2.19 6.01 3.80 7.06 2.66 16.233+ Vehicles Available 1.12 2.32 2.87 10.55 4.61 6.85 3.10 7.23 3.24 13.30Internal-External (IE) 0.05 2.25 0.30 6.73 0.18 2.80 0.32 3.56 0.21 7.74No Vehicles Available 0.00 . 0.00 . 0.00 .1 vehicle Available 0.03 1.41 0.10 1.25 0.18 0.62 0.36 0.82 0.06 2.222 Vehicles Available 0.19 2.09 0.43 6.50 0.15 1.70 0.19 2.20 0.29 6.823+ Vehicles Available 0.00 . 0.26 3.28 0.22 2.13 0.52 2.87 0.30 4.51All Trips (Include HB-UNIV) 3.73 27.94 7.13 36.04 9.52 18.53 13.22 23.32 7.53 39.05No Vehicles Available 2.58 5.21 5.83 4.87 4.82 4.641 vehicle Available 3.92 25.02 6.75 13.30 7.01 5.60 9.19 11.40 4.79 24.402 Vehicles Available 3.64 11.28 7.43 26.96 8.14 11.11 13.33 15.67 8.56 28.423+ Vehicles Available 3.06 6.13 7.45 18.38 12.04 17.02 13.57 17.58 10.15 25.17
Rate is the mean estimated household trip rate t is Student's t-statistic measure
Italicized values are averagesl for each trip purpose
All Households
Shaded cells are those with less than 95% confidence mean value is not 0.0
1-Person/Household 2-Persons/Household 3-Person/Household 4+Person/ Household

Fargo-Moorhead Origin-Destination Study Household Interview Survey Methodology and Results
Table 21Vehicle Trip Rates (per Household)By Household Size, Vehicle Availability Cross-Classification
Average of Mean Average of t Average of Mean Average of t Average of Mean Average of t Average of Mean Average of t Average of Mean Average of tHBW 0.914 13.32 1.422 16.34 2.327 12.37 2.240 15.54 1.547 26.97No Vehicles Available 0.00 . 0.00 . 0.00 .1 vehicle Available 1.07 12.65 1.15 5.26 3.42 5.40 0.82 2.00 1.24 13.492 Vehicles Available 0.87 7.41 1.71 14.49 1.64 6.05 2.25 10.90 1.72 19.863+ Vehicles Available 0.33 1.73 1.76 10.67 2.74 10.59 2.42 11.67 2.08 17.54HB-Shop 0.19 4.85 0.41 9.12 0.71 5.70 0.71 6.99 0.44 13.30No Vehicles Available 0.00 . 0.33 0.50 0.23 0.581 vehicle Available 0.24 4.51 0.31 3.55 0.00 . 0.00 . 0.23 5.402 Vehicles Available 0.07 1.38 0.37 7.26 0.94 4.15 0.57 4.86 0.48 9.873+ Vehicles Available 0.24 1.36 0.68 5.56 0.70 4.40 1.02 5.55 0.75 8.95HBO 0.58 8.15 1.06 14.25 1.05 6.34 2.01 11.56 1.08 19.63No Vehicles Available 0.00 . 0.11 0.50 0.08 0.581 vehicle Available 0.51 5.70 0.86 4.73 0.34 0.76 1.75 2.23 0.60 7.422 Vehicles Available 0.78 6.62 1.33 12.94 0.99 3.59 2.01 7.92 1.38 15.653+ Vehicles Available 1.26 5.39 1.07 7.35 1.37 5.99 2.03 8.21 1.47 13.22HBSchool (K-12) 0.00 0.80 0.00 0.76 0.47 4.49 0.42 4.92 0.15 6.85No Vehicles Available 0.00 . 0.00 . 0.00 .1 vehicle Available 0.01 0.81 0.00 . 0.00 . 0.93 1.61 0.03 1.722 Vehicles Available 0.00 . 0.01 0.81 0.33 2.70 0.31 3.17 0.14 4.983+ Vehicles Available 0.00 . 0.00 . 0.79 4.35 0.54 3.46 0.38 5.65NHB 1.43 11.06 1.55 13.61 2.03 6.07 2.34 8.06 1.73 19.21No Vehicles Available 0.00 . 0.11 0.50 0.08 0.581 vehicle Available 1.54 9.91 1.45 4.16 0.25 0.52 0.46 1.61 1.40 10.262 Vehicles Available 1.62 5.71 1.91 12.33 1.48 6.11 2.68 5.85 2.00 14.523+ Vehicles Available 1.10 2.23 1.57 7.51 3.29 5.28 2.03 5.97 2.13 10.27Internal-External (IE) 0.05 2.25 0.18 5.90 0.16 2.55 0.21 2.84 0.14 6.74No Vehicles Available 0.00 . 0.00 . 0.00 .1 vehicle Available 0.03 1.41 0.09 1.20 0.00 . 0.36 0.82 0.05 1.942 Vehicles Available 0.19 2.09 0.22 5.52 0.15 1.70 0.05 1.31 0.16 5.893+ Vehicles Available 0.00 . 0.22 3.24 0.21 2.10 0.45 2.70 0.27 4.35All Trips (Include HB-UNIV) 3.18 21.51 4.73 24.19 6.84 14.12 8.00 19.23 5.16 34.98No Vehicles Available 0.00 . 0.56 0.50 0.38 0.581 vehicle Available 3.39 21.10 4.18 9.30 4.01 4.17 4.32 2.71 3.60 22.662 Vehicles Available 3.54 10.94 5.61 23.51 5.54 10.25 7.88 12.94 5.91 28.243+ Vehicles Available 2.93 5.09 5.42 13.45 9.39 12.43 8.68 15.27 7.26 21.93
Rate is the mean estimated household trip rate t is Student's t-statistic measure
Italicized values are averagesl for each trip purpose
1-Person/Household 2-Persons/Household 3-Person/Household 4+Person/ Household All Households
Shaded cells are those with less than 95% confidence mean value is not 0.0
Fargo-Moorhead Origin-Destination Study Household Interview Survey Methodology and Results
Table 22PersonTrip Rates (per Household)By Household Size, Household Income ($2010) Cross-Classification
Rate t Rate t Rate t Rate t Rate tHBW 1.003 14.90 1.718 19.83 2.559 13.61 2.408 16.77 1.745 30.30Under $35,000 0.96 10.25 0.91 4.82 2.34 3.29 1.70 1.68 1.15 10.50$35- 50,000 1.21 7.34 2.01 14.17 1.75 3.22 1.98 5.93 1.79 16.89$50 - 100,000 1.09 6.52 2.09 14.46 2.88 9.41 2.63 13.02 2.24 22.04$100,000 or more 0.83 3.55 2.41 11.01 2.58 8.62 2.52 10.48 2.24 16.62HB-Shop 0.21 5.03 0.73 11.52 0.75 5.70 0.90 6.65 0.60 14.23Under $35,000 0.18 2.79 0.36 3.59 0.37 0.95 0.99 1.29 0.29 4.63$35- 50,000 0.39 3.51 1.31 7.91 0.37 1.22 1.18 2.01 1.00 7.80$50 - 100,000 0.26 3.66 0.62 6.83 0.90 4.85 0.71 4.14 0.65 9.98$100,000 or more 0.01 0.28 0.81 5.38 1.16 3.94 0.98 5.58 0.82 8.13HBO 0.88 10.71 1.67 16.89 1.76 7.81 3.17 12.32 1.71 22.27Under $35,000 1.04 7.47 1.74 7.41 1.08 1.71 3.23 2.63 1.35 10.17$35- 50,000 0.81 4.94 1.07 6.18 1.97 1.83 4.19 4.48 1.58 8.04$50 - 100,000 0.60 5.03 2.07 11.48 1.91 5.89 3.08 7.67 2.08 15.02$100,000 or more 0.20 0.80 1.78 8.64 2.45 5.39 2.77 8.69 2.04 11.94HBSchool (K-12) 0.00 0.88 0.13 5.09 1.27 8.38 2.91 14.35 0.77 13.23Under $35,000 0.01 0.61 0.27 2.92 1.37 2.93 2.69 3.82 0.37 4.79$35- 50,000 0.00 0.13 2.48 0.19 1.18 2.98 5.40 0.57 4.88$50 - 100,000 0.01 0.54 0.01 0.69 1.23 4.89 2.70 9.56 0.98 9.80$100,000 or more 0.00 0.05 1.47 1.61 5.67 3.21 8.40 1.58 8.83NHB 1.57 11.44 2.40 17.80 2.89 7.39 3.39 9.77 2.39 22.44Under $35,000 1.39 7.26 2.35 5.95 1.40 1.26 5.28 3.07 1.85 8.81$35- 50,000 0.69 3.54 2.32 9.77 1.67 3.09 4.70 3.41 2.27 8.91$50 - 100,000 2.01 7.74 2.70 12.37 3.56 5.48 3.18 6.00 2.90 15.04$100,000 or more 3.84 4.56 1.91 8.14 4.29 6.41 2.53 7.18 2.94 13.53Internal-External (IE) 0.05 2.25 0.30 6.73 0.18 2.80 0.32 3.56 0.21 7.74Under $35,000 0.02 1.07 0.52 3.43 0.00 0.00 0.17 2.89$35- 50,000 0.05 1.06 0.16 2.16 0.46 1.04 0.23 1.19 0.16 2.99$50 - 100,000 0.00 0.12 2.98 0.33 2.95 0.29 2.00 0.19 4.54$100,000 or more 0.37 1.36 0.45 4.58 0.08 1.05 0.48 3.04 0.37 5.32All Trips (Include HB-UNIV) 3.73 27.94 7.13 36.04 9.52 18.53 13.22 23.32 7.53 39.05Under $35,000 3.60 20.15 6.53 12.19 6.55 4.79 13.89 6.20 5.30 16.69$35- 50,000 3.16 9.87 7.02 19.32 6.96 3.73 15.62 7.57 7.49 15.52$50 - 100,000 4.00 15.83 7.78 24.29 10.96 15.41 12.68 14.06 9.17 28.43$100,000 or more 5.26 6.50 7.41 17.55 12.20 14.58 12.58 17.86 10.04 25.04
Rate is the mean estimated household trip rate t is Student's t-statistic measure
Italicized values are averagesl for each trip purpose
All Households
Shaded cells are those with less than 95% confidence mean value is not 0.0
1-Person/Household 2-Persons/Household 3-Person/Household 4+Person/ Household
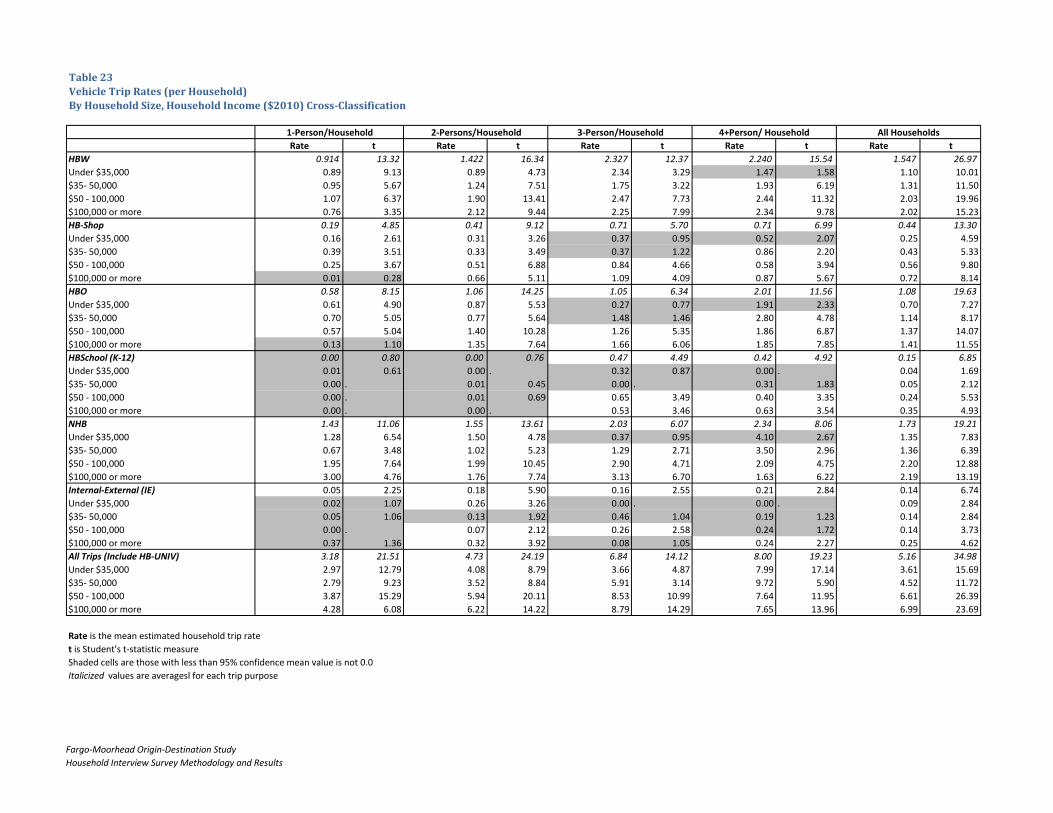
Fargo-Moorhead Origin-Destination Study Household Interview Survey Methodology and Results
Table 23Vehicle Trip Rates (per Household)By Household Size, Household Income ($2010) Cross-Classification
Rate t Rate t Rate t Rate t Rate tHBW 0.914 13.32 1.422 16.34 2.327 12.37 2.240 15.54 1.547 26.97Under $35,000 0.89 9.13 0.89 4.73 2.34 3.29 1.47 1.58 1.10 10.01$35- 50,000 0.95 5.67 1.24 7.51 1.75 3.22 1.93 6.19 1.31 11.50$50 - 100,000 1.07 6.37 1.90 13.41 2.47 7.73 2.44 11.32 2.03 19.96$100,000 or more 0.76 3.35 2.12 9.44 2.25 7.99 2.34 9.78 2.02 15.23HB-Shop 0.19 4.85 0.41 9.12 0.71 5.70 0.71 6.99 0.44 13.30Under $35,000 0.16 2.61 0.31 3.26 0.37 0.95 0.52 2.07 0.25 4.59$35- 50,000 0.39 3.51 0.33 3.49 0.37 1.22 0.86 2.20 0.43 5.33$50 - 100,000 0.25 3.67 0.51 6.88 0.84 4.66 0.58 3.94 0.56 9.80$100,000 or more 0.01 0.28 0.66 5.11 1.09 4.09 0.87 5.67 0.72 8.14HBO 0.58 8.15 1.06 14.25 1.05 6.34 2.01 11.56 1.08 19.63Under $35,000 0.61 4.90 0.87 5.53 0.27 0.77 1.91 2.33 0.70 7.27$35- 50,000 0.70 5.05 0.77 5.64 1.48 1.46 2.80 4.78 1.14 8.17$50 - 100,000 0.57 5.04 1.40 10.28 1.26 5.35 1.86 6.87 1.37 14.07$100,000 or more 0.13 1.10 1.35 7.64 1.66 6.06 1.85 7.85 1.41 11.55HBSchool (K-12) 0.00 0.80 0.00 0.76 0.47 4.49 0.42 4.92 0.15 6.85Under $35,000 0.01 0.61 0.00 . 0.32 0.87 0.00 . 0.04 1.69$35- 50,000 0.00 . 0.01 0.45 0.00 . 0.31 1.83 0.05 2.12$50 - 100,000 0.00 . 0.01 0.69 0.65 3.49 0.40 3.35 0.24 5.53$100,000 or more 0.00 . 0.00 . 0.53 3.46 0.63 3.54 0.35 4.93NHB 1.43 11.06 1.55 13.61 2.03 6.07 2.34 8.06 1.73 19.21Under $35,000 1.28 6.54 1.50 4.78 0.37 0.95 4.10 2.67 1.35 7.83$35- 50,000 0.67 3.48 1.02 5.23 1.29 2.71 3.50 2.96 1.36 6.39$50 - 100,000 1.95 7.64 1.99 10.45 2.90 4.71 2.09 4.75 2.20 12.88$100,000 or more 3.00 4.76 1.76 7.74 3.13 6.70 1.63 6.22 2.19 13.19Internal-External (IE) 0.05 2.25 0.18 5.90 0.16 2.55 0.21 2.84 0.14 6.74Under $35,000 0.02 1.07 0.26 3.26 0.00 . 0.00 . 0.09 2.84$35- 50,000 0.05 1.06 0.13 1.92 0.46 1.04 0.19 1.23 0.14 2.84$50 - 100,000 0.00 . 0.07 2.12 0.26 2.58 0.24 1.72 0.14 3.73$100,000 or more 0.37 1.36 0.32 3.92 0.08 1.05 0.24 2.27 0.25 4.62All Trips (Include HB-UNIV) 3.18 21.51 4.73 24.19 6.84 14.12 8.00 19.23 5.16 34.98Under $35,000 2.97 12.79 4.08 8.79 3.66 4.87 7.99 17.14 3.61 15.69$35- 50,000 2.79 9.23 3.52 8.84 5.91 3.14 9.72 5.90 4.52 11.72$50 - 100,000 3.87 15.29 5.94 20.11 8.53 10.99 7.64 11.95 6.61 26.39$100,000 or more 4.28 6.08 6.22 14.22 8.79 14.29 7.65 13.96 6.99 23.69
Rate is the mean estimated household trip rate t is Student's t-statistic measure
Italicized values are averagesl for each trip purpose
1-Person/Household 2-Persons/Household 3-Person/Household 4+Person/ Household All Households
Shaded cells are those with less than 95% confidence mean value is not 0.0
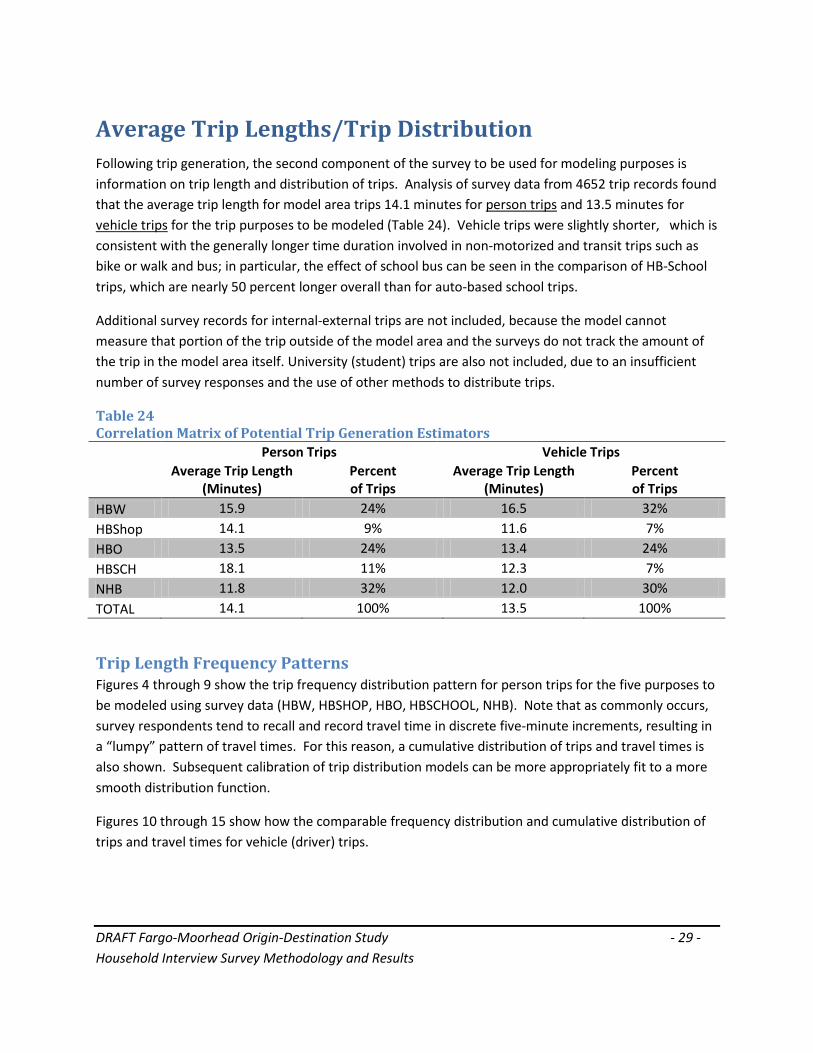
DRAFT Fargo-Moorhead Origin-Destination Study - 29 - Household Interview Survey Methodology and Results
Average Trip Lengths/Trip Distribution Following trip generation, the second component of the survey to be used for modeling purposes is information on trip length and distribution of trips. Analysis of survey data from 4652 trip records found that the average trip length for model area trips 14.1 minutes for person trips and 13.5 minutes for vehicle trips for the trip purposes to be modeled (Table 24). Vehicle trips were slightly shorter, which is consistent with the generally longer time duration involved in non-motorized and transit trips such as bike or walk and bus; in particular, the effect of school bus can be seen in the comparison of HB-School trips, which are nearly 50 percent longer overall than for auto-based school trips.
Additional survey records for internal-external trips are not included, because the model cannot measure that portion of the trip outside of the model area and the surveys do not track the amount of the trip in the model area itself. University (student) trips are also not included, due to an insufficient number of survey responses and the use of other methods to distribute trips.
Table 24 Correlation Matrix of Potential Trip Generation Estimators
Person Trips Vehicle Trips
Average Trip Length (Minutes)
Percent of Trips
Average Trip Length (Minutes)
Percent of Trips
HBW 15.9 24% 16.5 32% HBShop 14.1 9% 11.6 7% HBO 13.5 24% 13.4 24% HBSCH 18.1 11% 12.3 7% NHB 11.8 32% 12.0 30% TOTAL 14.1 100% 13.5 100%
Trip Length Frequency Patterns Figures 4 through 9 show the trip frequency distribution pattern for person trips for the five purposes to be modeled using survey data (HBW, HBSHOP, HBO, HBSCHOOL, NHB). Note that as commonly occurs, survey respondents tend to recall and record travel time in discrete five-minute increments, resulting in a “lumpy” pattern of travel times. For this reason, a cumulative distribution of trips and travel times is also shown. Subsequent calibration of trip distribution models can be more appropriately fit to a more smooth distribution function.
Figures 10 through 15 show how the comparable frequency distribution and cumulative distribution of trips and travel times for vehicle (driver) trips.
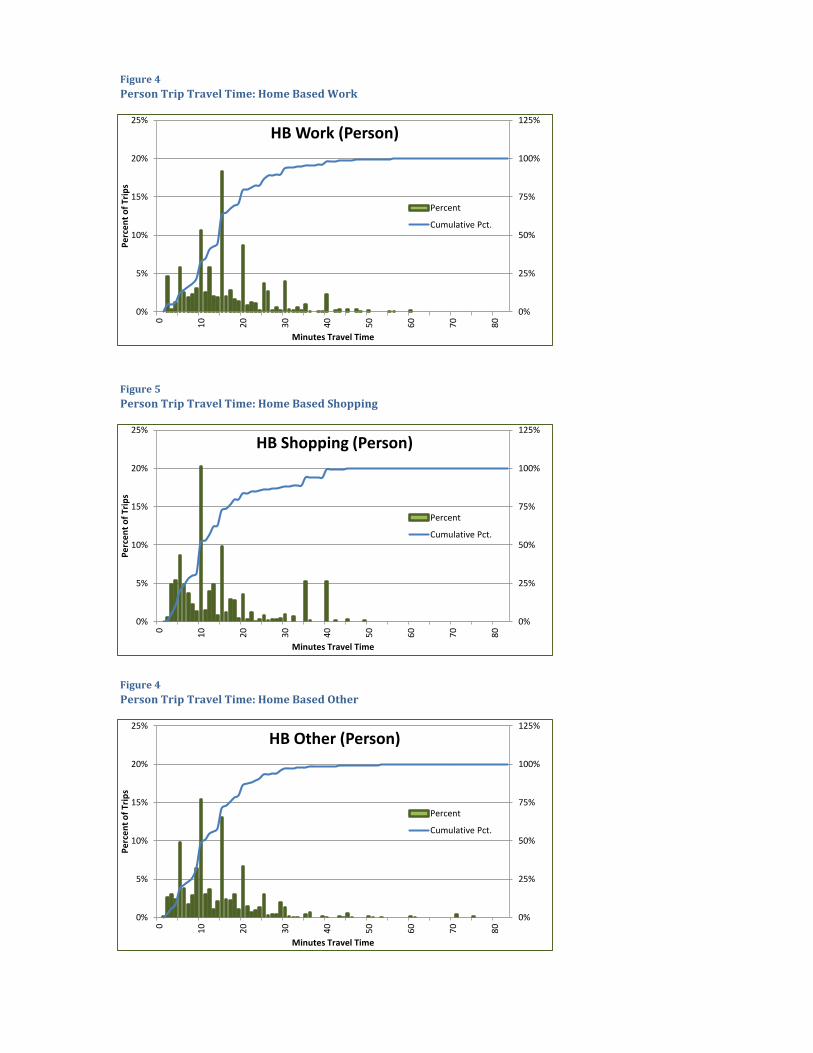
Figure 4
Person Trip Travel Time: Home Based Work
Figure 5
Person Trip Travel Time: Home Based Shopping
Figure 4
Person Trip Travel Time: Home Based Other
0%
25%
50%
75%
100%
125%
0%
5%
10%
15%
20%
25%
0
10
20
30
40
50
60
70
80
Pe
rce
nt
of
Trip
s
Minutes Travel Time
HB Other (Person)
Percent
Cumulative Pct.
0%
25%
50%
75%
100%
125%
0%
5%
10%
15%
20%
25%
0
10
20
30
40
50
60
70
80
Pe
rce
nt
of
Trip
s
Minutes Travel Time
HB Work (Person)
Percent
Cumulative Pct.
0%
25%
50%
75%
100%
125%
0%
5%
10%
15%
20%
25%
0
10
20
30
40
50
60
70
80
Pe
rce
nt
of
Trip
s
Minutes Travel Time
HB Shopping (Person)
Percent
Cumulative Pct.
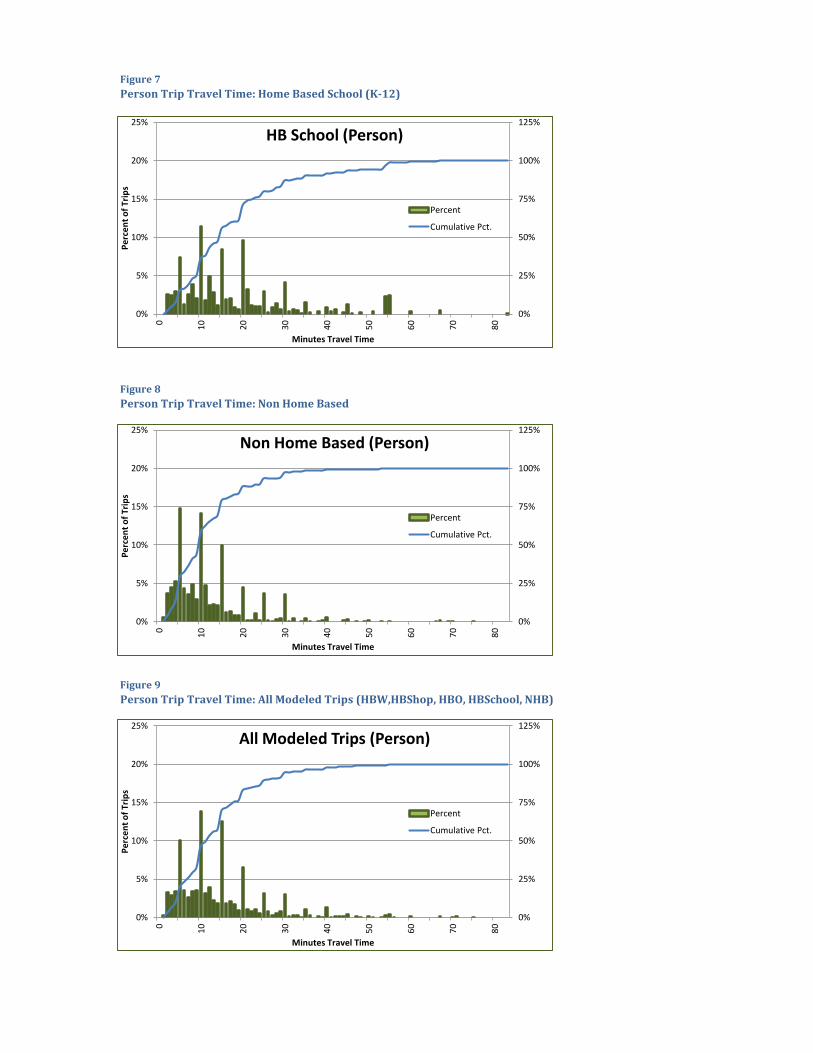
Figure 7
Person Trip Travel Time: Home Based School (K-12)
Figure 8
Person Trip Travel Time: Non Home Based
Figure 9
Person Trip Travel Time: All Modeled Trips (HBW,HBShop, HBO, HBSchool, NHB)
0%
25%
50%
75%
100%
125%
0%
5%
10%
15%
20%
25%
0
10
20
30
40
50
60
70
80
Pe
rce
nt
of
Trip
s
Minutes Travel Time
HB School (Person)
Percent
Cumulative Pct.
0%
25%
50%
75%
100%
125%
0%
5%
10%
15%
20%
25%
0
10
20
30
40
50
60
70
80
Pe
rce
nt
of
Trip
s
Minutes Travel Time
Non Home Based (Person)
Percent
Cumulative Pct.
0%
25%
50%
75%
100%
125%
0%
5%
10%
15%
20%
25%
0
10
20
30
40
50
60
70
80
Pe
rce
nt
of
Trip
s
Minutes Travel Time
All Modeled Trips (Person)
Percent
Cumulative Pct.
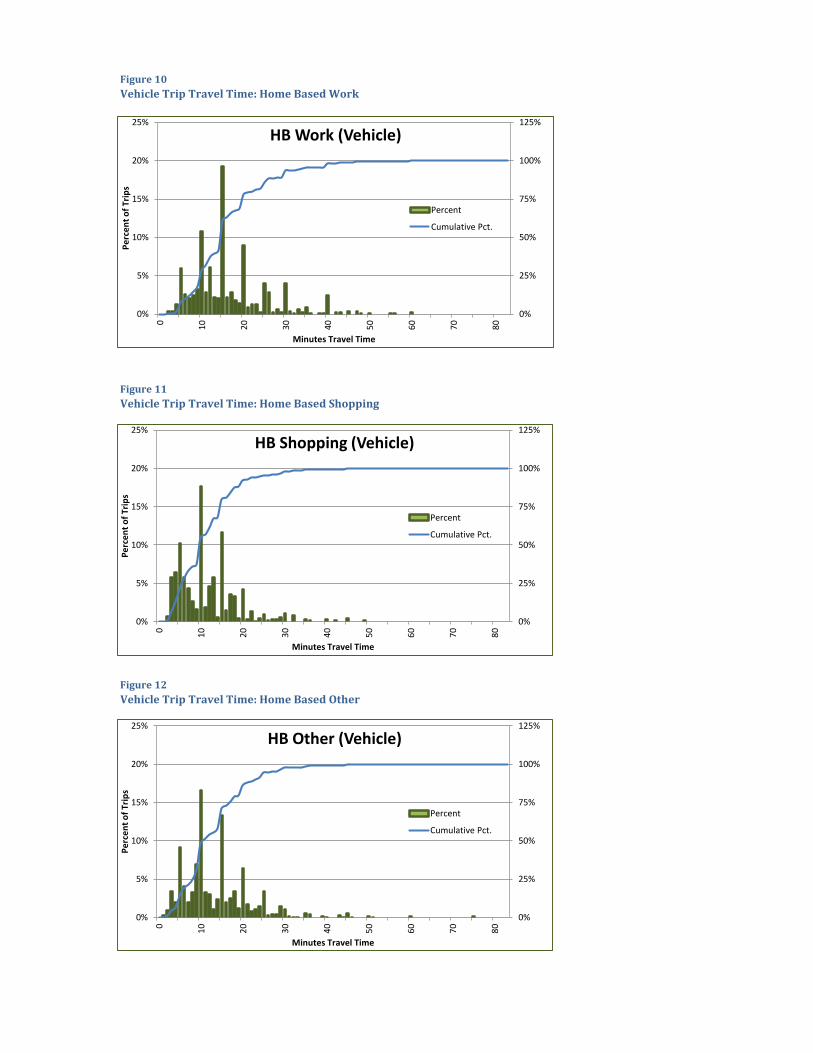
Figure 10
Vehicle Trip Travel Time: Home Based Work
Figure 11
Vehicle Trip Travel Time: Home Based Shopping
Figure 12
Vehicle Trip Travel Time: Home Based Other
0%
25%
50%
75%
100%
125%
0%
5%
10%
15%
20%
25%
0
10
20
30
40
50
60
70
80
Pe
rce
nt
of
Trip
s
Minutes Travel Time
HB Other (Vehicle)
Percent
Cumulative Pct.
0%
25%
50%
75%
100%
125%
0%
5%
10%
15%
20%
25%
0
10
20
30
40
50
60
70
80
Pe
rce
nt
of
Trip
s
Minutes Travel Time
HB Work (Vehicle)
Percent
Cumulative Pct.
0%
25%
50%
75%
100%
125%
0%
5%
10%
15%
20%
25%
0
10
20
30
40
50
60
70
80
Pe
rce
nt
of
Trip
s
Minutes Travel Time
HB Shopping (Vehicle)
Percent
Cumulative Pct.

Figure 13
Vehicle Trip Travel Time: Home Based School (K-12)
Figure 14
Vehicle Trip Travel Time: Non Home Based
Figure 15
Vehicle Trip Travel Time: All Modeled Trips (HBW,HBShop, HBO, HBSchool, NHB)
0%
25%
50%
75%
100%
125%
0%
5%
10%
15%
20%
25%
0
10
20
30
40
50
60
70
80
Pe
rce
nt
of
Trip
s
Minutes Travel Time
HB School (Vehicle)
Percent
Cumulative Pct.
0%
25%
50%
75%
100%
125%
0%
5%
10%
15%
20%
25%
0
10
20
30
40
50
60
70
80
Pe
rce
nt
of
Trip
s
Minutes Travel Time
Non Home Based (Vehicle)
Percent
Cumulative Pct.
0%
25%
50%
75%
100%
125%
0%
5%
10%
15%
20%
25%
0
10
20
30
40
50
60
70
80
Pe
rce
nt
of
Trip
s
Minutes Travel Time
All Modeled Trips (Vehicle)
Percent
Cumulative Pct.
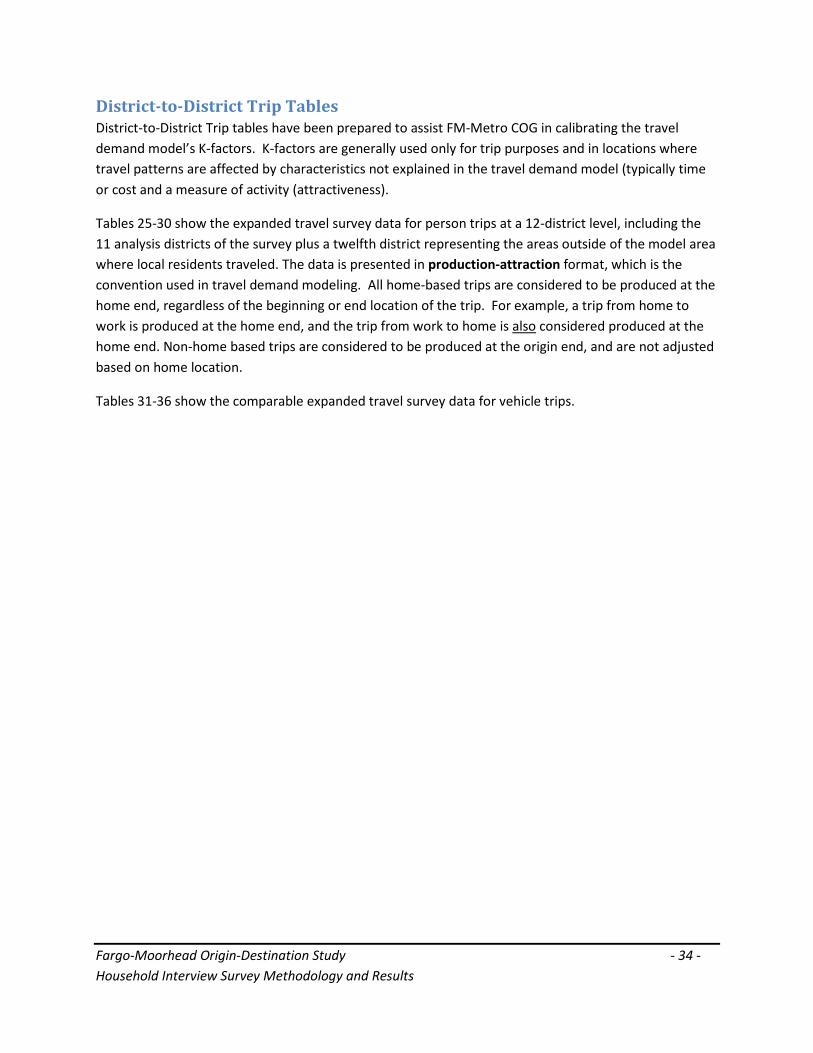
Fargo-Moorhead Origin-Destination Study - 34 - Household Interview Survey Methodology and Results
District-to-District Trip Tables District-to-District Trip tables have been prepared to assist FM-Metro COG in calibrating the travel demand model’s K-factors. K-factors are generally used only for trip purposes and in locations where travel patterns are affected by characteristics not explained in the travel demand model (typically time or cost and a measure of activity (attractiveness).
Tables 25-30 show the expanded travel survey data for person trips at a 12-district level, including the 11 analysis districts of the survey plus a twelfth district representing the areas outside of the model area where local residents traveled. The data is presented in production-attraction format, which is the convention used in travel demand modeling. All home-based trips are considered to be produced at the home end, regardless of the beginning or end location of the trip. For example, a trip from home to work is produced at the home end, and the trip from work to home is also considered produced at the home end. Non-home based trips are considered to be produced at the origin end, and are not adjusted based on home location.
Tables 31-36 show the comparable expanded travel survey data for vehicle trips.
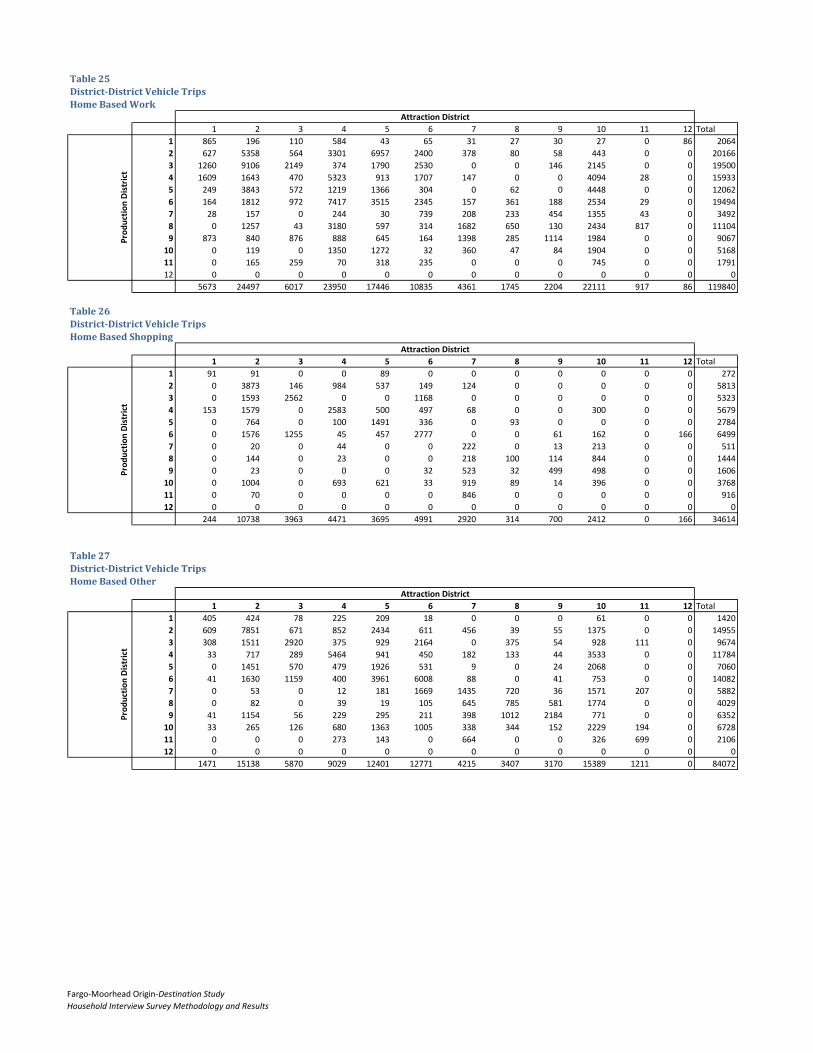
Table 25
District-District Vehicle Trips
Home Based Work
1 2 3 4 5 6 7 8 9 10 11 12 Total
1 865 196 110 584 43 65 31 27 30 27 0 86 2064
2 627 5358 564 3301 6957 2400 378 80 58 443 0 0 20166
3 1260 9106 2149 374 1790 2530 0 0 146 2145 0 0 19500
4 1609 1643 470 5323 913 1707 147 0 0 4094 28 0 15933
5 249 3843 572 1219 1366 304 0 62 0 4448 0 0 12062
6 164 1812 972 7417 3515 2345 157 361 188 2534 29 0 19494
7 28 157 0 244 30 739 208 233 454 1355 43 0 3492
8 0 1257 43 3180 597 314 1682 650 130 2434 817 0 11104
9 873 840 876 888 645 164 1398 285 1114 1984 0 0 9067
10 0 119 0 1350 1272 32 360 47 84 1904 0 0 5168
11 0 165 259 70 318 235 0 0 0 745 0 0 1791
12 0 0 0 0 0 0 0 0 0 0 0 0 0
5673 24497 6017 23950 17446 10835 4361 1745 2204 22111 917 86 119840
Table 26
District-District Vehicle Trips
Home Based Shopping
1 2 3 4 5 6 7 8 9 10 11 12 Total
1 91 91 0 0 89 0 0 0 0 0 0 0 272
2 0 3873 146 984 537 149 124 0 0 0 0 0 5813
3 0 1593 2562 0 0 1168 0 0 0 0 0 0 5323
4 153 1579 0 2583 500 497 68 0 0 300 0 0 5679
5 0 764 0 100 1491 336 0 93 0 0 0 0 2784
6 0 1576 1255 45 457 2777 0 0 61 162 0 166 6499
7 0 20 0 44 0 0 222 0 13 213 0 0 511
8 0 144 0 23 0 0 218 100 114 844 0 0 1444
9 0 23 0 0 0 32 523 32 499 498 0 0 1606
10 0 1004 0 693 621 33 919 89 14 396 0 0 3768
11 0 70 0 0 0 0 846 0 0 0 0 0 916
12 0 0 0 0 0 0 0 0 0 0 0 0 0
244 10738 3963 4471 3695 4991 2920 314 700 2412 0 166 34614
Table 27
District-District Vehicle Trips
Home Based Other
1 2 3 4 5 6 7 8 9 10 11 12 Total
1 405 424 78 225 209 18 0 0 0 61 0 0 1420
2 609 7851 671 852 2434 611 456 39 55 1375 0 0 14955
3 308 1511 2920 375 929 2164 0 375 54 928 111 0 9674
4 33 717 289 5464 941 450 182 133 44 3533 0 0 11784
5 0 1451 570 479 1926 531 9 0 24 2068 0 0 7060
6 41 1630 1159 400 3961 6008 88 0 41 753 0 0 14082
7 0 53 0 12 181 1669 1435 720 36 1571 207 0 5882
8 0 82 0 39 19 105 645 785 581 1774 0 0 4029
9 41 1154 56 229 295 211 398 1012 2184 771 0 0 6352
10 33 265 126 680 1363 1005 338 344 152 2229 194 0 6728
11 0 0 0 273 143 0 664 0 0 326 699 0 2106
12 0 0 0 0 0 0 0 0 0 0 0 0 0
1471 15138 5870 9029 12401 12771 4215 3407 3170 15389 1211 0 84072
Attraction DistrictP
rod
uct
ion
Dis
tric
t
Attraction District
Pro
du
ctio
n D
istr
ict
Attraction District
Pro
du
ctio
n D
istr
ict
Fargo-Moorhead Origin-Destination Study
Household Interview Survey Methodology and Results
Table 28
District-District Vehicle Trips
Home Based School (K-12)
1 2 3 4 5 6 7 8 9 10 11 12 Total
1 0 168 0 33 0 0 0 0 0 64 0 0 265
2 0 311 0 0 0 0 0 0 0 0 0 0 311
3 0 774 865 140 0 400 0 0 0 400 0 0 2578
4 0 0 0 300 438 0 0 0 0 333 0 0 1071
5 0 0 0 43 471 212 0 0 0 0 0 0 725
6 0 0 122 0 796 1272 0 0 0 0 0 0 2190
7 0 0 0 0 0 0 0 0 0 0 0 0 0
8 0 0 0 0 0 0 0 230 0 0 290 0 520
9 0 0 0 30 0 0 962 521 264 0 290 0 2068
10 0 0 0 1261 342 0 0 152 0 0 0 0 1756
11 0 0 0 0 0 0 0 200 0 0 0 0 200
12 0 0 0 0 0 0 0 0 0 0 0 0 0
0 1253 987 1807 2047 1883 962 1104 264 796 580 0 11684
Table 29
District-District Vehicle Trips
Non Home Based
1 2 3 4 5 6 7 8 9 10 11 12 Total
1 1009 866 0 61 298 233 0 0 0 133 0 0 2600
2 629 21545 1266 2083 4594 2880 142 19 480 6002 38 0 39678
3 69 2351 3000 0 463 1928 0 94 196 410 0 0 8511
4 321 1362 873 11219 1722 3028 135 1017 98 4740 84 65 24663
5 179 7733 697 1313 15401 3445 361 258 223 3590 38 219 33456
6 154 2559 1265 3591 3551 7258 419 989 501 2306 0 0 22592
7 0 106 121 832 380 240 1403 743 585 1696 756 0 6860
8 0 98 0 906 123 261 533 673 284 991 670 0 4540
9 0 47 94 17 0 279 743 585 651 1009 49 0 3473
10 884 2732 1841 4860 5219 4202 3992 993 619 13097 953 0 39391
11 41 118 0 0 0 35 642 713 0 1400 814 0 3763
12 0 0 0 62 0 0 0 0 0 0 0 0 62
3286 39517 9156 24943 31753 23788 8369 6082 3636 35373 3402 283 189589
Table 30
District-District Person Trips
Internal-External Trips
1 2 3 4 5 6 7 8 9 10 11 12 Total
1 0 0 0 0 0 0 0 0 0 0 0 303 303
2 0 0 0 0 0 0 0 0 0 0 0 0 0
3 0 0 0 0 0 0 0 0 0 0 0 842 842
4 0 0 0 0 0 0 0 0 0 0 0 1576 1576
5 0 0 0 0 0 0 0 0 0 0 0 597 597
6 0 0 0 0 0 0 0 0 0 0 0 2593 2593
7 0 0 0 0 0 0 0 0 0 0 0 356 356
8 0 0 0 0 0 0 0 0 0 0 0 580 580
9 0 0 0 0 0 0 0 0 0 0 0 802 802
10 0 0 0 0 0 0 0 0 0 0 0 687 687
11 0 0 0 0 0 0 0 0 0 0 0 164 164
12 0 9 0 0 0 0 65 0 0 33 468 514 1090
0 9 0 0 0 0 65 0 0 33 468 9013 9589
Attraction DistrictP
rod
uct
ion
Dis
tric
t
Attraction District
Pro
du
ctio
n D
istr
ict
Attraction District
Pro
du
ctio
n D
istr
ict
Fargo-Moorhead Origin-Destination Study
Household Interview Survey Methodology and Results
Table 31
District-District Person Trips
Home Based Work
1 2 3 4 5 6 7 8 9 10 11 12 Total
1 867 287 182 720 54 65 63 27 30 69 0 86 2451
2 627 5943 767 3721 7008 2400 378 80 58 443 0 0 21423
3 1260 9106 2322 374 2268 2530 0 0 146 2145 0 0 20151
4 1613 1714 471 6226 915 1711 147 0 0 4550 28 0 17376
5 266 4054 783 1478 1457 304 0 62 0 4599 0 0 13002
6 164 1812 972 7417 3590 3464 157 361 188 2534 57 0 20716
7 29 161 0 356 31 760 281 240 467 1393 45 0 3762
8 0 1262 43 3378 721 315 1930 791 407 2987 865 0 12700
9 872 839 875 1049 684 164 1723 285 1193 2048 0 0 9732
10 0 863 0 1338 1386 407 319 42 75 7883 0 0 12313
11 0 272 242 65 297 220 0 0 0 696 0 0 1791
12 0 0 0 0 0 0 0 0 0 0 0 0 0
5696 26314 6658 26122 18411 12340 4999 1887 2563 29346 995 86 135416
Table 32
District-District Person Trips
Home Based Shopping
1 2 3 4 5 6 7 8 9 10 11 12 Total
1 91 102 0 0 135 0 0 0 0 0 0 0 328
2 0 3986 146 987 539 396 124 0 0 0 0 0 6179
3 0 2072 2572 0 0 1222 0 0 0 0 0 0 5866
4 154 1812 0 3089 656 522 68 0 0 301 0 0 6602
5 0 991 0 92 1759 599 0 86 0 0 0 0 3526
6 0 1857 1383 45 496 3117 0 0 62 163 0 167 7290
7 0 16 0 34 0 0 175 107 10 168 0 0 511
8 0 155 0 25 14 0 234 107 122 1239 0 0 1896
9 0 23 0 0 0 64 523 64 630 498 0 0 1801
10 0 1702 0 1544 4549 54 1089 212 16 2521 0 0 11688
11 0 70 0 0 0 0 1105 0 0 0 259 0 1434
12 0 0 0 0 0 0 0 0 0 0 0 0 0
245 12786 4101 5817 8149 5973 3319 575 840 4890 259 167 47121
Table 33
District-District Person Trips
Home Based Other
1 2 3 4 5 6 7 8 9 10 11 12 Total
1 980 531 237 327 302 108 0 0 0 157 0 0 2642
2 1648 12118 867 903 2795 738 453 77 54 2270 0 0 21923
3 447 3066 3701 381 946 3400 0 1144 55 1722 113 0 14974
4 457 711 360 7976 2399 584 294 132 43 5078 0 0 18034
5 0 1899 549 720 2963 797 9 0 24 4682 0 0 11644
6 41 1861 1775 3569 4560 8851 87 0 40 1069 0 0 21853
7 0 61 0 79 182 1799 3131 737 186 1641 221 0 8036
8 0 107 0 140 221 192 1204 2252 628 3357 0 0 8099
9 42 1576 544 1007 682 319 605 1297 3423 1030 0 0 10524
10 21 198 80 476 3173 986 331 441 178 5699 122 0 11704
11 0 0 0 698 427 0 1370 142 0 323 875 0 3835
12 0 0 0 0 0 0 0 0 0 0 0 0 0
3635 22129 8112 16276 18651 17774 7484 6220 4630 27028 1331 0 133268
Attraction District
Pro
du
ctio
n D
istr
ict
Attraction District
Pro
du
ctio
n D
istr
ict
Attraction District
Pro
du
ctio
n D
istr
ict
Fargo-Moorhead Origin-Destination Study
Household Interview Survey Methodology and Results

Table 34
District-District Person Trips
Home Based School (K-12)
1 2 3 4 5 6 7 8 9 10 11 12 Total
1 0 477 65 762 0 0 0 0 0 0 0 0 1305
2 0 4716 700 360 0 0 0 0 0 0 0 0 5776
3 0 5482 6776 148 211 1267 0 0 0 422 0 0 14307
4 0 117 0 5149 797 0 0 0 309 1553 0 0 7924
5 0 0 0 0 2694 0 0 0 0 2636 0 0 5330
6 0 0 1186 474 3807 6926 0 24 0 0 0 0 12415
7 0 0 0 0 0 0 172 644 215 0 917 0 1948
8 0 0 0 338 0 0 86 2323 423 0 392 0 3563
9 0 0 0 91 0 0 1484 483 408 0 0 0 2467
10 0 0 0 1431 671 0 251 834 0 0 0 0 3187
11 0 0 0 0 0 0 0 1179 0 0 499 0 1677
12 0 0 0 0 0 0 0 0 0 0 0 0 0
0 10792 8727 8753 8180 8193 1994 5487 1355 4612 1808 0 59899
Table 35
District-District Person Trips
Non Home Based
1 2 3 4 5 6 7 8 9 10 11 12 Total
1 1422 1458 0 439 404 446 0 0 0 180 0 0 4349
2 1872 43570 2525 4314 8774 6138 506 29 726 9897 58 0 78409
3 96 3573 7034 0 645 3900 0 131 272 1322 0 0 16973
4 852 2331 1412 27711 3327 4380 181 1495 131 6877 112 87 48896
5 273 12592 1411 2544 35010 6360 1113 394 340 6346 58 334 66775
6 223 5323 2663 5532 6848 16400 608 1681 1992 3800 0 0 45071
7 0 425 149 1884 968 295 2928 1246 784 4091 951 0 13720
8 0 212 0 1291 175 408 1013 1652 1258 2116 954 0 9081
9 0 353 114 20 0 340 2175 878 1386 1619 60 0 6947
10 1127 5377 2403 6979 11602 5807 5309 1578 1071 35445 1516 0 78215
11 66 191 0 0 0 113 1358 2052 0 2263 1449 0 7492
12 0 0 0 87 0 0 0 0 0 0 0 0 87
5933 75407 17712 50801 67753 44586 15193 11136 7962 73956 5158 421 376016
Table 36
District-District Person Trips
Internal-External Trips
1 2 3 4 5 6 7 8 9 10 11 12 Total
1 0 0 0 0 0 0 0 0 0 0 0 721 721
2 0 0 0 0 0 0 0 0 0 0 0 0 0
3 0 0 0 0 0 0 0 0 0 0 0 145 145
4 0 0 0 0 0 0 0 0 0 0 0 610 610
5 0 0 0 0 0 0 0 0 0 0 0 144 144
6 0 0 0 0 0 0 0 0 0 0 0 1263 1263
7 0 0 0 0 0 0 0 0 0 0 0 321 321
8 0 0 0 0 0 0 0 0 0 0 0 64 64
9 0 0 0 0 0 0 0 0 0 0 0 797 797
10 0 0 0 0 0 0 0 0 0 0 0 330 330
11 0 0 0 0 0 0 0 0 0 0 0 67 67
12 0 17 131 67 936 1028 0 1028 4462 8920 0 1028 17616
0 17 131 67 936 1028 0 1028 4462 8920 0 5490 22077
Attraction District
Pro
du
ctio
n D
istr
ict
Attraction District
Pro
du
ctio
n D
istr
ict
Attraction District
Pro
du
ctio
n D
istr
ict
Fargo-Moorhead Origin-Destination Study
Household Interview Survey Methodology and Results
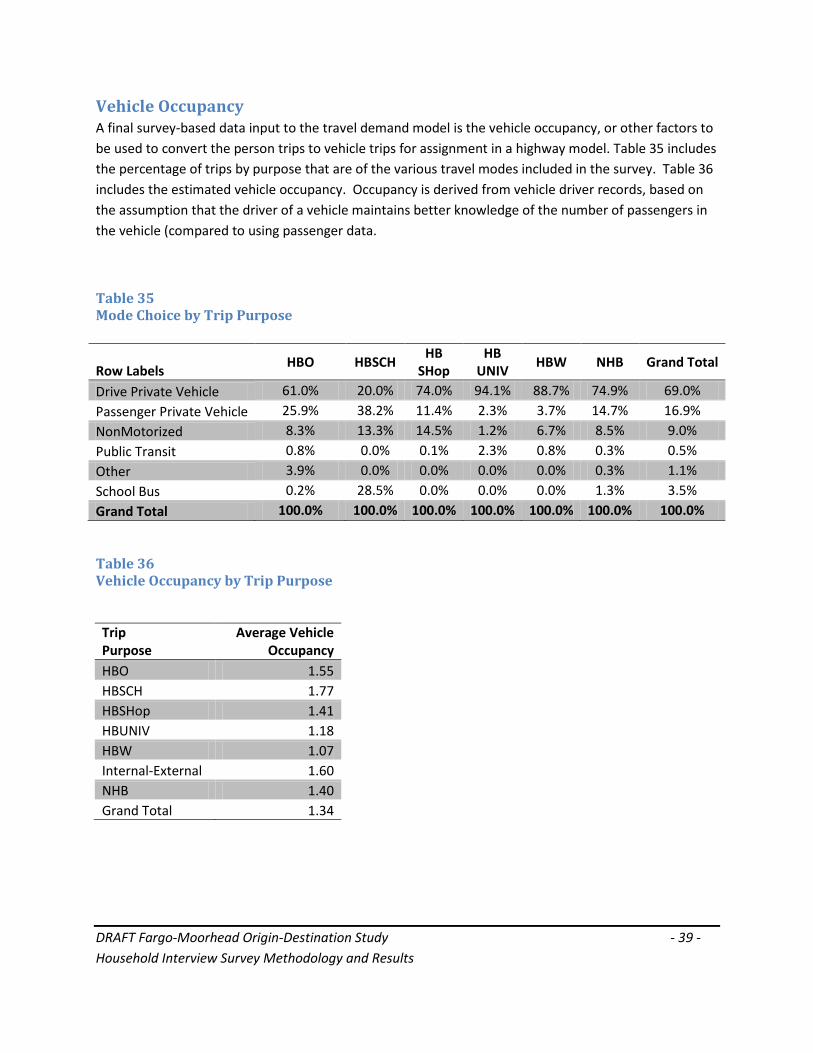
DRAFT Fargo-Moorhead Origin-Destination Study - 39 - Household Interview Survey Methodology and Results
Vehicle Occupancy A final survey-based data input to the travel demand model is the vehicle occupancy, or other factors to be used to convert the person trips to vehicle trips for assignment in a highway model. Table 35 includes the percentage of trips by purpose that are of the various travel modes included in the survey. Table 36 includes the estimated vehicle occupancy. Occupancy is derived from vehicle driver records, based on the assumption that the driver of a vehicle maintains better knowledge of the number of passengers in the vehicle (compared to using passenger data.
Table 35 Mode Choice by Trip Purpose
Row Labels HBO HBSCH HB
SHop HB
UNIV HBW NHB Grand Total
Drive Private Vehicle 61.0% 20.0% 74.0% 94.1% 88.7% 74.9% 69.0% Passenger Private Vehicle 25.9% 38.2% 11.4% 2.3% 3.7% 14.7% 16.9% NonMotorized 8.3% 13.3% 14.5% 1.2% 6.7% 8.5% 9.0% Public Transit 0.8% 0.0% 0.1% 2.3% 0.8% 0.3% 0.5% Other 3.9% 0.0% 0.0% 0.0% 0.0% 0.3% 1.1% School Bus 0.2% 28.5% 0.0% 0.0% 0.0% 1.3% 3.5% Grand Total 100.0% 100.0% 100.0% 100.0% 100.0% 100.0% 100.0%
Table 36 Vehicle Occupancy by Trip Purpose
Trip Purpose
Average Vehicle Occupancy
HBO 1.55 HBSCH 1.77 HBSHop 1.41 HBUNIV 1.18 HBW 1.07 Internal-External 1.60 NHB 1.40 Grand Total 1.34

Appendix A • Public Information/News Releases • Recruitment Letter • Recruitment Screener • Travel Diary
Press Release September 12, 2011
Contact: Joe Nigg, Principal Planner
[email protected] 701.232.3242 x28
Metro COG Announces Fargo-Moorhead Travel Survey Fargo, North Dakota. The Fargo-Moorhead Metropolitan Council of Governments (Metro COG) is conducting a regional travel behavioral study beginning in September 2011. During the next several months over 1,000 households throughout the metropolitan area will be recruited to participate in a metropolitan household survey. The household travel survey will be implemented by a professional research company, under contract with Metro COG. The survey is intended to collect important travel behavioral data which is used in Metro COG’s transportation models and planning processes. A telephone call center will be used to initially recruit a random sample of households; however, upon commitment to participate you will have the option of reporting your travel behavior (for a defined 24 hour period) online or by hard copy/regular mail. As the Metropolitan Planning Organization (MPO) for the Fargo-Moorhead area, one of Metro COG’s responsibilities is to ensure local travel patterns are documented as this data is critical in decision making and as a component in determining the need for future transportation projects. Metro COG recently released its 2010 Metropolitan traffic count map (www.fmmetrocog.org) which reflects current travel patterns in the FM Metropolitan Area. The 2010 traffic counts combined with 2010 Census data and data tabulated as part of this household survey will provide the framework for future updates to Metro COG’s long range traffic volume forecasts, years 2020 and 2040. Future traffic projections are a key variable in identifying and determining the need for future Federal aid projects. These investments are based on a number of dynamics including: land use, growth, local priorities, roadway characteristics and most importantly an understanding of future travel patterns. It is important to note that all information will be held strictly confidential and will be used only in combination with the information provided from other participating households. The information you provide will help ensure Metro COG’s ability to accurately project the transportation needs of this community. Additional information on the survey is also available on Metro COG’s website at www.fmmetrocog.org.
Fargo-Moorhead Metropolitan Council of Governments
Email: [email protected] http://www.fmmetrocog.org
701.232.3242 • FAX 701.232.5043 • Case Plaza Suite 232 • One 2nd Street North • Fargo, North Dakota 58102-4807
A PLANNING ORGANIZATION SERVING
FARGO, WEST FARGO, CASS COUNTY, NORTH DAKOTA AND MOORHEAD, DILWORTH, CLAY COUNTY, MINNESOTA

Press Release January 20, 2012
Contact: Joe Nigg, Principal Planner
[email protected] 701.232.3242 x28
Metro COG to Collect Additional Travel Surveys Fargo, North Dakota. In September of 2011 the Fargo-Moorhead Metropolitan Council of Governments (Metro COG) initiated a regional travel behavioral study where approximately 1,000 households were recruited to participate in the survey. The survey was designed to collect important travel behavioral data which is used in Metro COG’s transportation models and planning processes. Initial analysis of the data began in November (2011) and the contracted consultant has determined that additional surveys are needed (approximately 100 households), for certain metropolitan neighborhoods or sub-areas, to ensure statistically valid and accurate data representation. Consistent with the initial recruitment in September and October of 2011, a telephone call center will be used to recruit a random sample of households within these specific areas; however, upon commitment to participate you will have the option of reporting your travel behavior (for a defined 24 hour period) online or by hard copy/regular mail. It is important to note that all information will be held strictly confidential and will be used only in combination with the information provided from other participating households. The information you provide will help ensure Metro COG’s ability to accurately project the transportation needs of this community. Additional information on the survey is also available on Metro COG’s website at www.fmmetrocog.org.
Fargo-Moorhead Metropolitan Council of Governments
Email: [email protected] http://www.fmmetrocog.org
701.232.3242 • FAX 701.232.5043 • Case Plaza Suite 232 • One 2nd Street North • Fargo, North Dakota 58102-4807
A PLANNING ORGANIZATION SERVING
FARGO, WEST FARGO, CASS COUNTY, NORTH DAKOTA AND MOORHEAD, DILWORTH, CLAY COUNTY, MINNESOTA


O/D webpage structure Link on www.fmmetrocog.org title “Travel Survey Information” Main page: heading Travel Survey Information
Text: On these pages you will find information related to the travel behavior survey that Metro COG is administering beginning in September 2011 and through the fall. This webpage contains background information on the survey and why it is important for metropolitan households to participate. Links from Main page Frequently Asked Questions Links to Public Notices Links to Our Partners Contact Information
«FIRSTNAME» «LASTNAME» «DATE» «ADDRESS» «CITY», «STATE» «ZIP» Dear «FIRSTNAME»: Thank you and your household for agreeing to participate in the Regional Travel Survey! The household travel survey is being conducted by a professional research company, under contract with the Fargo-Moorhead Metropolitan Council of Governments (Metro COG). This survey is intended to collect important travel behavior data which is used in Metro COG’s transportation models, planning and decision making processes. The information you provide will help ensure that future transportation projects reflect what your community needs. We value your input, no matter how much or how little you travel. It is important to note that all information collected will be held strictly confidential and used only in combination with the information provided from other participating households. The way it works is simple. Just follow these steps:
1) Review the Instructions and Example inside the attached travel log.
2) Record your travel for 24 hours on «DISPLAY_DATE». Enclosed are travel logs for all household members. Use these logs to record each place you visit and stop you make, whether around town or out of town, on your travel day. We ask that an adult help anyone under age 16 fill out their travel logs.
3) Report your travel information to us in ONE of the following ways: ONLINE: Select the link below and each household member can enter their own travel information. An
adult can enter information for anyone under age 16. o «LINK TO HOUSEHOLD TRAVEL DIARY»
MAIL: Use the enclosed postage-paid envelope to return your completed travel logs. If you choose this option, we may need to call you to clarify or collect any missing information.
If you have questions, please contact Metro COG at 701.232.3242 (8 am–5:00 pm CDT on weekdays); or visit our website at http://www.fmmetrocog.org; or email John Schamber at [email protected] to learn more about the survey. Thank you again for providing the details that will help shape our region’s transportation future. Sincerely, Wade E. Kline Executive Director Metro COG
Fargo-Moorhead Metropolitan Council of Governments 701.232.3242 • FAX 701.232.5043 • Case Plaza Suite 232 • One 2nd Street North• Fargo, North Dakota 58102-4807
A PLANNING ORGANIZATION SERVING FARGO, WEST FARGO, CASS COUNTY, NORTH DAKOTA AND MOORHEAD, DILWORTH, CLAY COUNTY, MINNESOTA

«FIRSTNAME» «LASTNAME» «DATE» «ADDRESS» «CITY», «STATE» «ZIP» Dear «FIRSTNAME»: I’d like to invite you and your household to participate in a Regional Travel Study which will be conducted within the Fargo-Moorhead Metropolitan Area. The household travel survey is being implemented by a professional research company, under contract with the Fargo-Moorhead Metropolitan Council of Governments (Metro COG). The survey is intended to collect important travel behavior data which is used in Metro COG’s transportation models, planning and decision making processes. The information you provide will help ensure that future transportation projects reflect what your community needs. We value your input, no matter how much or how little you travel. You have been contacted by mail because we were unable to reach you by telephone. It is important that you have the opportunity to participate so that travel information is collected from a truly representative sample of Fargo-Moorhead Metropolitan Area residents. To participate you, and each person in your household, will keep a Travel Diary, recording all of your trips for a selected day. The travel diary form makes it easy to document and submit this travel information. It is important to note that all information collected will be held strictly confidential and used only in combination with the information provided from other participating households. The way it works is simple. We’ll send you a travel log for each family member, and then just follow these steps:
1) Review the Instructions and Example inside the travel log.
2) Record your travel for 24 hours on the day indicated. Use a travel log to record each place you visit and stop you make, whether around town or out of town, on your travel day. We ask that an adult help anyone under age 16 fill out their travel logs.
3) Report your travel information to us in ONE of the following ways: ONLINE: A unique link is provided and each household member can enter their own travel information.
An adult can enter information for anyone under age 16. MAIL: Use a postage-paid envelope provided to return your completed travel logs.
If you choose this option, we may need to call you to clarify or collect any missing information. To participate, call 1-800-xxx-xxxx or email John Schamber at [email protected]. Your participation will benefit the community and you will also benefit from improved transportation options in the years ahead. If you have questions, please contact Metro COG at 701.232.3242 (8 am–5:00 pm CDT on weekdays); or visit our website at http://www.fmmetrocog.org; or email John Schamber at [email protected] to learn more about the survey. Your privacy is guaranteed. Thank you in advance for providing the details that will help shape our region’s transportation future. Sincerely, Wade E. Kline Executive Director Metro COG
Fargo-Moorhead Metropolitan Council of Governments 701.232.3242 • FAX 701.232.5043 • Case Plaza Suite 232 • One 2nd Street North• Fargo, North Dakota 58102-4807
A PLANNING ORGANIZATION SERVING FARGO, WEST FARGO, CASS COUNTY, NORTH DAKOTA AND MOORHEAD, DILWORTH, CLAY COUNTY, MINNESOTA
Frequently Asked Questions Please read the answers to these frequently asked questions. Why is Metro COG conducting this survey? Traffic projections are a key variable in identifying and determining the need for future federal aid projects. These investments are based on a number of dynamics including: land use, growth, local priorities, roadway characteristics and most importantly an understanding of future travel patterns. One of Metro COG’s responsibilities is to ensure local travel patterns are documented as this data is critical in decision making and as a component in determining the need for future transportation projects. Metro COG will use the detailed information from survey respondents to create generalized travel pattern information for use in transportation modeling, planning, and funding. This survey is just one of many tools used to accomplish these tasks. How many people are taking this survey? The survey sample size is projected to include a minimum of 875 households. However due to sample error and potential reporting issues, project consultants anticipate that more than 1,000 households will be contacted to participate. How much of my time will this take? The ACCORA research staff will ask you some questions in advance of receiving the booklet in order to limit the amount of time you spend filling out the form. The survey is quick and should not take much time out of your assigned 24 hour period. Results are more accurate if the booklet is filled in before and after every trip taken, so respondents should keep the booklet with them throughout the day. Who is calling me/sending me letters? Metro COG has contracted with SRF Consulting and ACCORA Research to execute the survey. Phone calls originate from a call center contracted by ACCORA to make and receive calls on behalf of the survey. How did you get my phone number and/or address? Addresses which have landlines are publicly available through common websites such as whitepages.com and other clearinghouses. For the purposes of this survey, the information was purchased in bulk by ACCORA Research from a vendor who specializes in data gathering. Addresses without landlines were identified through the same method but were sent a letter instead of a phone call. All households were identified randomly. Why are you tracking my movements?/ This feels like an invasion of privacy. Metro COG is not interested in individual travel movements; instead, Metro COG is looking to identify trip generation rates by household type. For instance, a family of four has a very different travel pattern than a house full of college students. Furthermore, the data will be sorted into geographic “zones” rather than by individual addresses. The zones were created to demonstrate travel movement within the region. Metro COG is not interested in specific point-to-point data but rather learning the pattern of traffic travel.
Do my children have to participate? Children are an important part of the travel survey. School, child care, and activity-based trips are just as important as commute trips to work. We have specifically timed this survey to take place during the school year to ensure normal travel behavior patterns for households with children. Do I receive compensation for my time? Metro COG is not providing monetary compensation for filling out the survey. I am concerned about confidentiality after my survey is submitted. All identifying information is removed from the database and your travel data will be aggregated, used, and analyzed only in conjunction with other surveyed households. Do I have to mail back the paper booklet? Metro COG is providing an online response form to allow paperless submissions as an alternative to submitting the paper booklet (postage is pre-paid for those choosing the paper option). Metro COG and the project partners recommend that the booklet be taken with the respondent to ensure accurate recording. For example, a person can more easily indicate an 8:24am arrival time if the booklet is in the car with them, rather than guessing at the end of the day and submitting an 8:30am arrival time instead. Data accuracy is very important. Where can I fill out the online form? Click <here> for the online form. I have a question about filling in my responses in the packet or online form. Please contact ACCORA Research staffers directly to determine the best way to respond to the survey questions. They can be reached at 1-866-870-0773 ext. 8888 Can I see the end product of this survey? Yes. A report will be generated at the conclusion of the study that will outline all data collected, applicable analysis and any recommendations. The document will be available in draft form on Metro COG’s website at which point it is available for public inspection. Contact Metro COG for further details. Who do I contact with questions? Contact Katie White, Planner, at 701-232-3242 x35 or [email protected].

Fargo Moorhead Metropolitan Council of Governments Metro COG Origin Destination Mobility Study Recruitment Screener Draft 7 dated 04.27.11 A unique code will be assigned to each household and each person in household. 1- letter 5-digits 1-letter Zone Household Person in household Ask for Male or Female head of household Hello, this is (NAME), I’m calling on behalf of the Fargo-Moorhead Council of Governments, a planning agency focused on transportation issues in the Fargo-Moorhead Metropolitan Area. You may have heard of us as Metro COG. We’re conducting a travel study that will be used to help ensure Metro COG’s ability to accurately project the transportation needs of the community. [Outbound] You may have heard about it in the news. [Inbound] You received a letter announcing the study in the mail.
IF NEEDED/IF ASKED: The Fargo-Moorhead Metropolitan Council of Governments (Metro COG) is the Metropolitan Planning Organization (MPO) for the Fargo-Moorhead Metropolitan Area. An MPO is a transportation planning organization made up of representatives from local government and transportation authorities. If you have any questions about this travel study, you may contact Metro COG by telephone at 701-232-3242 or, by email at [email protected].
Fargo-Moorhead Metropolitan Council of Governments Case Plaza, Suite 232 e-mail: [email protected] One Second Street North Web Site: http://www.fmmetrocog.org Fargo, ND 58102-4807 Joe Nigg, Community Planner, Extension 28, or 701.232.3242 (ph) Katie White, Planner, Extension 35
INTERVIEWER, ENTER ZONE NUMBER FROM SAMPLE Zone Number: 1 2 3 4 5 6 7 8 9 10 To begin, I am going to ask some questions about where you live. This information will be combined with others and is critical in estimating the number of vehicles that will use a road in the future. 1. Do you own or rent your home? Own/buying (e.g. paying off a mortgage) Rent/lease or Provided by job or military 2. Which of the following statements best describes this building? READ LIST – stop when selected A one-family house detached from any other house A one-family house attached to one or more houses A building with 2 apartments i.e. a duplex A building with 3 apartments A building with 4 to 10 apartments A building with more than 10 apartments A dormitory or group quarter Other Please specify
3. Based on your responses I’d like to invite you and your household to participate in a Travel Study that is intended to collect important travel behavior data which is instrumental in planning and justifying every major transportation project built in the region. All information collected as part of the survey will be held strictly confidential and used only in combination with the information provided from other participating households (875 households to be sampled). To participate all you have to do is keep a Travel Diary which will document all of your trips for ONE selected day. We’ll send hard copies of the diary to your address, which will make it easy for you and family members to document and submit this travel information. Would you be willing to participate? Yes No 4. Since you have agreed to take part, I would like to verify your name and address to mail you the information. Record: Full name Street Address Apartment (if appropriate) City State Zip code Phone number There are several questions I need to ask about yourself and the people who are living at the address. The information will be used to make sure we have a representative sample of residents. Your responses will also be combined with others and used in the model to forecast transportation needs. All of your answers will be kept confidential. 5. Including yourself, how many people live at this address? Please do not include anyone who usually lives somewhere else or is just visiting, such as a college student away at school. (If further clarification is needed, include infants and children, housemates, roomers.)”
1 2 3 4 5 6 7 8 9 10 or more Refused
A B C D E F G H I J
If Refuse, Thank and Terminate IF Q5. IS MORE THAN 1 ASK Q6. 6. Do you currently have children living in the household? Yes No *DO NOT READ+ Don’t know/Refused 7. How many vehicles are owned, leased, or available for regular use by the people who currently live at this address? Please be sure to include motorcycles, mopeds and RVs.” (As clarification, regular use means “are in working order.) 8. How many bicycles in working condition are currently available to ride in your household? 1 2 3 4 5 6 7 8 or more Refused My next questions are about each household member. The questions build a profile of each household member and are used to forecast trips by age and gender. 9. As Person 1, what is your name? Last name: Record last name First name: Record first name 9b. Status of Person 1 in household Female head of household Male head of household
10. Record gender. Do not ask Female Male 11. In what year were you born? Record Year born 12. Are you currently employed…? Full time Part time Retired DO NOT READ Not employed, looking for work 13. Do you work at more than one job? Yes No If Q5. is more than 1 and Q13. Is "No" ASK Q14. 14. If "No" ASK: Does anyone in the household work more than one job? Yes No 15. What is the last grade or level of education that you completed? Was it…? READ LIST High School or less Technical or vocational school Some college College graduate, or Post graduate work or advanced degree *DO NOT READ+ Don’t know/Refused 16. Do you currently have a valid driver's license? Yes No Think now of the next person in the household. Ask Q19. if Q5. Is 2 17. What is Person 2's name? Last name: Record last name First name: Record first name 18. IF NECESSARY ASK: Is Person 2 Female or Male? Female Male 19. How is this person related to Person 1? Husband or Wife Unmarried partner Daughter Roomer or Boarder Son Housemate or Roommate Grandchild Foster Child Son-in-law Other nonrelative Daughter-in-law 20. In what year was Person 2 born? Record Year born
21. Is Person 2 employed…? Full time Part time Retired DO NOT READ Not employed, looking for work Do not ask Q22. If Q14. Is "No" 22. Does this person work at more than one job? Yes No 23. What is the last grade or level of education that Person 2 completed? IF NECESSARY READ LIST High School or less Technical or vocational school Some college College graduate, or Post graduate work or advanced degree *DO NOT READ+ Don’t know/Refused 24. Does Person 2 currently have a valid driver's license? Yes No Ask Q25. if Q5. Is 3 25. What is Person 3's name? Last name: Record last name First name: Record first name 26. IF NECESSARY ASK: Is Person 3 Female or Male? Female Male 27. How is this person related to Person 1? Husband or Wife Unmarried partner Daughter Roomer or Boarder Son Housemate or Roommate Grandchild Foster Child Son-in-law Other nonrelative Daughter-in-law 28. In what year was Person 3 born? Record Year born 29. Is Person 3 employed…? Full time Part time Retired DO NOT READ Not employed, looking for work Do not ask Q30. If Q14. Is "No" 30. Does this person work at more than one job? Yes No
31. What is the last grade or level of education that Person 3 completed? IF NECESSARY READ LIST High School or less Technical or vocational school Some college College graduate, or Post graduate work or advanced degree *DO NOT READ+ Don’t know/Refused 32. Does Person 3 currently have a valid driver's license? Yes No Questions of each household member
1. Year born 2. Relationship to head of household 3. gender 4. Job status 5. Number of jobs 6. Education level 7. Drivers license 8. Mobility limitation
200 Please stop me when I get to the category that best describes the total combined income for everyone living at this address for last year? Under $20,000 $50,000 to $65,000 $20,000 to $35,000 $65,000 to $100,000 $35,000 to $50,000 $100,000 or more *DO NOT READ+ Don’t know/Refused 201. If Refuse in Q200, ASK: Would the household income be $50,000 or less, or more than $50,000? $50,000 or less More than $50,000 202. May I please have your email address? IF NECESSARY, EXPLAIN THAT WE'LL USE IT ONLY IF WE NEED TO CONTACT THEM ABOUT THE TRAVEL STUDY RECORD EMAIL ADDRESS Enter “None” if not available 203. Did I reach you at [VERIFY PHONE NUMBER]? Yes No [DO NOT READ+ Don’t know/Refused 204. Is this the best telephone number to contact you at? Yes 1 SKIP TO END No 2 ASK Q26. 205. What is the best telephone number to contact you at? RECORD TELEPHONE NUMBER Thank you very much for agreeing to participate in this travel study. A travel diary will be mailed to your home for each person age 5 and above. Remember to complete it and return in the self-addressed stamped envelope.
Survey conducted by PTV NuStats on behalf of:
Chattanooga-Hamilton County/North Georgia Transportation Planning OrganizationSee the Instructions and Example inside!
Travel Log for:
<<First Name>>of the
<<Last Name>> Household
Your Travel Day is:<<TDATE>>
Your PIN# is: <<PINNO>>
<<RECPROJ>>-<<SAMPN>>-<<NDIARIES>>/<<HHSIZE>>-<<ASSN>>
Begin Here:
1. What is the name and address of your regular workplace?
Work Name: ____________________________________________
Address: ____________________________________________
City/State/Zip: ____________________________________________
2. What is the name and address of your school?
School Name: ____________________________________________
Address: ____________________________________________
City/State/Zip: ____________________________________________
3. Would you be willing to participate in future research activities?
Yes No
Not employed Work at home (for pay) Self-employed
Not a student
Home school
Carry this log with you to record information about ALL the PLACES you visit and stops you make on your travel day.
Thank you for your participation!
For more information about the study, contact:
Jeff Livingston, PTV NuStats1-800-447-8287, ext. 2256
or
visit the survey website athttp://surveys.nustats.com/mytravelsurvey
If you need help filling out your travel log, please call the toll-free survey hotline:
1-877-261-4621
NEED HELP OR HAVE QUESTIONS?
ONLINE – Enter your information online at http://surveys.nustats.com/mytravelsurvey using the PIN# printed on the label on the front of this travel log.
MAIL – Return your completed travel logs in the postage-paid envelope provided in your packet. We may need to call you to clarify or collect any missing information.
PHONE – Keep your completed travel logs by the phone and we will call to collect the information. Or, you can call our toll-free survey hotline (1-877-261-4621) to provide your information.
OR
OR
HOW DO I PROVIDE MY TRAVEL INFORMATION?
Dade
WalkerCounty
CatoosaCounty
G E O R G I A
TENNESSEEHamiltonCounty
RegionalTravel Survey
Accora Research
ONLINE - Enter your information online at http://www.accoraresearch.com/metrocog using the PIN# printed on the label on the front of this travel log.
OR
MAIL - Return your completed travel logs in the postage-paid envelope provided in your packet. We may need to call you to clarify or collect any missing information.
If you need help filling out your travel log,please call the toll-free survey hotline:
1-866-870-0773 ext. 8888
For more information about the study, contact:MetroCOG
or
visit the MetroCOG website athttp://www.fmmetrocog.org
Fargo-Moorhead MetropolitanCouncil of Governments
HouseholdTravelSurvey
Confidentiality:This survey is conducted in accordance with strict privacy provisions. All information, whether related to personal identity or travel and activities, will remain completely confidential. The information will not be published, sold, distributed, or otherwise made available to any third party.
TRAVEL LOG INSTRUCTIONS
Use this travel log to record information about ALL the PLACES you visit on your assigned travel day. Begin at 3 a.m. (or when you wake up) on your assigned travel day and end at 2:59 a.m. the next day (or when you go to sleep on your travel day).
For anyone who is unable to complete a travel log, we ask that an adult or parent complete the travel log for them.
Record one PLACE per page. Tell us the:
PLACES you visit. The place name, exact address or nearest cross-streets, city, state, and the zip code are critical for analyzing areas with traffic congestion.
A PLACE is any location you travel to, no matter how long you are there.
Examples: stopping for gas, drive-thru window, dropping off or picking up someone, going to work, walking to lunch or driving to a meeting during your workday, biking to the park, attending a sporting event, etc.
What is a PLACE?
If you ride the bus or carpool/vanpool: please record each bus stop or carpool/vanpool meeting place where you get on or off as a separate place.
EXACT TIMES you arrive and leave each place.
ACTIVITIES or what you do at each place. Write the code from LIST 2 - ACTIVITIES (codes are on the flap of the back cover).
How you TRAVEL to each place. Write the code from LIST 1 - MEANS OF TRAVEL (codes are on the flap of the back cover). We are interested in all types of travel: by auto, walking, biking, transit, etc.
Once you have completed your travel logs, follow the instructions for providing your travel information on the back cover of this log. Thank you!
Questions? Call the toll-free survey hotline: 1-877-261-4621
What TIME did you LEAVE? (Please record exact time)
H
I didn't leave this place You are DONE
______ : ______ am pmMove on to NEXT PLACE
Of those, how many were household members?
__________
FHow many others traveled with you? (DON’T include yourself)
_________
E
D If you traveled by PUBLIC TRANSIT, what was the route or line? _______________________________
What TIME did you ARRIVE at this place?
(Please record exact time)
B
______ : ______ am pm
HOW did you TRAVEL to this place? (Write code from LIST 1 on flap of the back cover)
CCode: ________
A WHAT is this PLACE?
My Home My Primary Job My School
My Second Job Transit Stop Other Place
Please tell us the NAME and ADDRESS of this PLACE:
City ZipState
Street address OR nearest cross-streets
Name of Other Place OR Transit stop
ExamplePLACE
What ACTIVITY did you do at this place?
(Write code from LIST 2 on flap of the back cover)
G
Code: ________
X
Happy Kids Daycare
901 Main Street
Anytown TN 99999
7 32 X
1
7 35 X
5
5
1
Get Well Pharmacy
700 Your Avenue
ND
47
19
8 05
1-866-870-0773, ext 8888
LIST 2 - ACTIVITIESAt My Home:1 Working at home (for pay or volunteer)2 Shopping (online, catalog, or by phone)3 Any other activities at home
Change Means of Travel/Transfer:
4 Change travel mode/transfer (from car to bus, walk to bus, etc.)
Quick Stops/Trips:5 Drop off passenger from car6 Pick up passenger from car7 Get gas8 Drive-thru (ATM, bank, fast food, etc.)
At My Work/Volunteer Location:9 Working/Doing my job10 Other work-related activities at work11 Volunteer work/activities
At My School, Daycare, College:12 Attending class/studying13 Other activities at school (eat lunch,
recreational, etc.)
At Other Places:14 Work-related (meeting, sales call, delivery)15 Service private vehicle (oil, repairs)16 Grocery/Food shopping17 Other routine shopping (clothing,
convenience store, household maintenance)18 Shopping for major purchases or
specialty items (appliances, electronics, new vehicle, major household repairs, etc.)
19 Household errands (bank, dry cleaning, etc.)20 Personal business (visit government office,
attorney, accountant, etc.)21 Eat meal out at restaurant/diner22 Health care (doctor, dentist, etc.)23 Civic or religious activities24 Outdoor recreation (jogging, biking, walking)25 Indoor recreation (gym, yoga, etc.)26 Entertainment (movies, spectator sports, etc.)27 Social/Visit friends/relatives28 Airport - business29 Airport - personal97 Other (write code 97 and specify activity)
LIST 1 - MEANS OF TRAVEL
Non-Motorized Travel:1 Walk2 Bike3 Wheelchair/Mobility scooter4 Skates/Skateboard/Kick scooter/Segway
Private Vehicle:5 Auto driver (car or small truck)
6 Auto passenger (car or small truck)
7 Carpool8 Motorcycle/Moped/Motorized scooter
Public Transit:9 Local bus (CARTA)
Other Travel Methods:10 School bus11 Charter bus (employer-provided or
other contracted)
12 Shuttle bus (Public or employer-provided)
13 Paratransit service (SETHRA)
14 Taxi15 Black Car Service/Limo97 Other (write code 97 and specify activity)
LIST 1 is inside flapLIST 2 is outside flap
QUESTIONS?
Visit the survey website:http://surveys.nustats.com/
mytravelsurvey
NEED HELP FILLING OUT YOUR TRAVEL LOG?
Call the toll-free survey hotline:
1-877-261-4621
NEED HELP FILLING OUT YOUR TRAVEL LOG?
Call the toll-free survey hotline:
1-866-870-0773, ext. 8888
QUESTIONS ABOUT THE STUDY?
MetroCOG701-232-3242
or
Visit the MetroCOG website:http://www.fmmetrocog.org
I 2 School Bus
I 3 Charter Bus (employer-provided or other
contracted)
I 4 Shuttle Bus (Public or employer-provided)
I 5 Taxi
I 6 Black Car Service/Limo
97 Other (write code 97 and specify activity)
I 0 Paratransit service
I I Metro Senior Ride
(MATBUS)
(MAT Paratransit)
Other Travel Methods:
PLACE
1
What TIME did you LEAVE?(Please record exact time)
C
I didn't leave this place today Answer D BELOW
______ : ______ am pm Move on to NEXT PLACE
D What is the MAIN reason you didn’t leave this place today?
I was sick I am home-bound, elderly, or disabled Vacation or personal day Worked at home (for pay) Child was sick Not scheduled to work Other household Worked around home (not for pay)
member was sick Other: __________________________________
IF YOU DIDN'T LEAVE THIS PLACE TODAY: You are done. Thank you!
WHERE were you at 3 a.m.?
A My Home My Primary Job My School
My Second Job Transit stop Other place
Please tell us the NAME and ADDRESS of this PLACE:
City ZipState
Street address OR nearest cross-streets
Name of Other Place OR Transit stop
REMEMBER! Each bus stop or carpool/vanpool meeting place (where you get on or off) is a PLACE.
BEGIN RECORDING YOUR TRAVEL HEREPLACE 1 is where your day begins, and your travel day begins at 3 a.m. Most people are home asleep at this time. If this is the case with you, check “My Home,” then record your activity at this place and the exact time you left to start your day.
PLACE
2
What TIME did you LEAVE? (Please record exact time)
H
I didn't leave this place You are DONE
______ : ______ am pmMove on to NEXT PLACE
Of those, how many were household members?
__________
FHow many others traveled with you? (DON’T include yourself)
_________
E
D If you traveled by PUBLIC TRANSIT, what was the route or line? _______________________________
What TIME did you ARRIVE at this place?
(Please record exact time)
B
______ : ______ am pm
HOW did you TRAVEL to this place? (Write code from LIST 1 on flap of the back cover)
CCode: ________
WHAT is this PLACE?
My Home My Primary Job My School
My Second Job Transit Stop Other Place
Please tell us the NAME and ADDRESS of this PLACE:
City ZipState
Street address OR nearest cross-streets
Name of Other Place OR Transit stop
What ACTIVITY did you do at this place?
(Write code from LIST 2 on flap of the back cover)
G
Code: ________
A
What ACTIVITY did you do at this place?
(Write code from LIST 2 on flap of the back cover)
BCode: ________
PLACE
4
What TIME did you LEAVE? (Please record exact time)
H
I didn't leave this place You are DONE
______ : ______ am pmMove on to NEXT PLACE
Of those, how many were household members?
__________
FHow many others traveled with you? (DON’T include yourself)
_________
E
D If you traveled by PUBLIC TRANSIT, what was the route or line? _______________________________
What TIME did you ARRIVE at this place?
(Please record exact time)
B
______ : ______ am pm
HOW did you TRAVEL to this place? (Write code from LIST 1 on flap of the back cover)
CCode: ________
WHAT is this PLACE?
My Home My Primary Job My School
My Second Job Transit Stop Other Place
Please tell us the NAME and ADDRESS of this PLACE:
City ZipState
Street address OR nearest cross-streets
Name of Other Place OR Transit stop
What ACTIVITY did you do at this place?
(Write code from LIST 2 on flap of the back cover)
G
Code: ________
A
PLACE
3
What TIME did you LEAVE? (Please record exact time)
H
I didn't leave this place You are DONE
______ : ______ am pmMove on to NEXT PLACE
Of those, how many were household members?
__________
FHow many others traveled with you? (DON’T include yourself)
_________
E
D If you traveled by PUBLIC TRANSIT, what was the route or line? _______________________________
What TIME did you ARRIVE at this place?
(Please record exact time)
B
______ : ______ am pm
HOW did you TRAVEL to this place? (Write code from LIST 1 on flap of the back cover)
CCode: ________
WHAT is this PLACE?
My Home My Primary Job My School
My Second Job Transit Stop Other Place
Please tell us the NAME and ADDRESS of this PLACE:
City ZipState
Street address OR nearest cross-streets
Name of Other Place OR Transit stop
What ACTIVITY did you do at this place?
(Write code from LIST 2 on flap of the back cover)
G
Code: ________
A
PLACE
6
What TIME did you LEAVE? (Please record exact time)
H
I didn't leave this place You are DONE
______ : ______ am pmMove on to NEXT PLACE
Of those, how many were household members?
__________
FHow many others traveled with you? (DON’T include yourself)
_________
E
D If you traveled by PUBLIC TRANSIT, what was the route or line? _______________________________
What TIME did you ARRIVE at this place?
(Please record exact time)
B
______ : ______ am pm
HOW did you TRAVEL to this place? (Write code from LIST 1 on flap of the back cover)
CCode: ________
WHAT is this PLACE?
My Home My Primary Job My School
My Second Job Transit Stop Other Place
Please tell us the NAME and ADDRESS of this PLACE:
City ZipState
Street address OR nearest cross-streets
Name of Other Place OR Transit stop
What ACTIVITY did you do at this place?
(Write code from LIST 2 on flap of the back cover)
G
Code: ________
A
PLACE
5
What TIME did you LEAVE? (Please record exact time)
H
I didn't leave this place You are DONE
______ : ______ am pmMove on to NEXT PLACE
Of those, how many were household members?
__________
FHow many others traveled with you? (DON’T include yourself)
_________
E
D If you traveled by PUBLIC TRANSIT, what was the route or line? _______________________________
What TIME did you ARRIVE at this place?
(Please record exact time)
B
______ : ______ am pm
HOW did you TRAVEL to this place? (Write code from LIST 1 on flap of the back cover)
CCode: ________
WHAT is this PLACE?
My Home My Primary Job My School
My Second Job Transit Stop Other Place
Please tell us the NAME and ADDRESS of this PLACE:
City ZipState
Street address OR nearest cross-streets
Name of Other Place OR Transit stop
What ACTIVITY did you do at this place?
(Write code from LIST 2 on flap of the back cover)
G
Code: ________
A

PLACE
8
What TIME did you LEAVE? (Please record exact time)
H
I didn't leave this place You are DONE
______ : ______ am pmMove on to NEXT PLACE
Of those, how many were household members?
__________
FHow many others traveled with you? (DON’T include yourself)
_________
E
D If you traveled by PUBLIC TRANSIT, what was the route or line? _______________________________
What TIME did you ARRIVE at this place?
(Please record exact time)
B
______ : ______ am pm
HOW did you TRAVEL to this place? (Write code from LIST 1 on flap of the back cover)
CCode: ________
WHAT is this PLACE?
My Home My Primary Job My School
My Second Job Transit Stop Other Place
Please tell us the NAME and ADDRESS of this PLACE:
City ZipState
Street address OR nearest cross-streets
Name of Other Place OR Transit stop
What ACTIVITY did you do at this place?
(Write code from LIST 2 on flap of the back cover)
G
Code: ________
A
PLACE
7
What TIME did you LEAVE? (Please record exact time)
H
I didn't leave this place You are DONE
______ : ______ am pmMove on to NEXT PLACE
Of those, how many were household members?
__________
FHow many others traveled with you? (DON’T include yourself)
_________
E
D If you traveled by PUBLIC TRANSIT, what was the route or line? _______________________________
What TIME did you ARRIVE at this place?
(Please record exact time)
B
______ : ______ am pm
HOW did you TRAVEL to this place? (Write code from LIST 1 on flap of the back cover)
CCode: ________
WHAT is this PLACE?
My Home My Primary Job My School
My Second Job Transit Stop Other Place
Please tell us the NAME and ADDRESS of this PLACE:
City ZipState
Street address OR nearest cross-streets
Name of Other Place OR Transit stop
What ACTIVITY did you do at this place?
(Write code from LIST 2 on flap of the back cover)
G
Code: ________
A

PLACE
10
What TIME did you LEAVE? (Please record exact time)
H
I didn't leave this place You are DONE
______ : ______ am pmMove on to NEXT PLACE
Of those, how many were household members?
__________
FHow many others traveled with you? (DON’T include yourself)
_________
E
D If you traveled by PUBLIC TRANSIT, what was the route or line? _______________________________
What TIME did you ARRIVE at this place?
(Please record exact time)
B
______ : ______ am pm
HOW did you TRAVEL to this place? (Write code from LIST 1 on flap of the back cover)
CCode: ________
WHAT is this PLACE?
My Home My Primary Job My School
My Second Job Transit Stop Other Place
Please tell us the NAME and ADDRESS of this PLACE:
City ZipState
Street address OR nearest cross-streets
Name of Other Place OR Transit stop
What ACTIVITY did you do at this place?
(Write code from LIST 2 on flap of the back cover)
G
Code: ________
A
PLACE
9
What TIME did you LEAVE? (Please record exact time)
H
I didn't leave this place You are DONE
______ : ______ am pmMove on to NEXT PLACE
Of those, how many were household members?
__________
FHow many others traveled with you? (DON’T include yourself)
_________
E
D If you traveled by PUBLIC TRANSIT, what was the route or line? _______________________________
What TIME did you ARRIVE at this place?
(Please record exact time)
B
______ : ______ am pm
HOW did you TRAVEL to this place? (Write code from LIST 1 on flap of the back cover)
CCode: ________
WHAT is this PLACE?
My Home My Primary Job My School
My Second Job Transit Stop Other Place
Please tell us the NAME and ADDRESS of this PLACE:
City ZipState
Street address OR nearest cross-streets
Name of Other Place OR Transit stop
What ACTIVITY did you do at this place?
(Write code from LIST 2 on flap of the back cover)
G
Code: ________
A

EX
TR
A P
LAC
ES
If yo
u m
ade
mor
e th
an 1
1 tr
ips,
use
the
cha
rt b
elow
to
writ
e in
form
atio
n on
the
oth
er p
lace
s yo
u w
ent.
Don
’t f
orge
t to
rec
ord
your
exa
ct t
imes
!
PLA
CE
#
A
WH
AT
is t
his
PLA
CE?
WH
AT
is t
he N
AM
E an
d A
DD
RES
S?
B
Wha
t T
IME
did
you
AR
RIV
E?(r
ecor
d ex
act
times
)
C
HO
W d
id y
ou
TR
AV
EL?
(use
LIS
T 1
)
G
Wha
t A
CT
IVIT
Y?
(use
LIS
T 2
)
H
Wha
t T
IME
did
you
LEA
VE?
(rec
ord
exac
t tim
es)
12
:
am/p
m
:
am/p
m
13
:
am/p
m
:
am/p
m
14
:
am/p
m
:
am/p
m
15
:
am/p
m
:
am/p
m
16
:
am/p
m
:
am/p
m
17
:
am/p
m
:
am/p
m
18
:
am/p
m
:
am/p
m
19
:
am/p
m
:
am/p
m
20
:
am/p
m
:
am/p
m
21
:
am/p
m
:
am/p
mPLACE
11
What TIME did you LEAVE? (Please record exact time)
H
I didn't leave this place You are DONE
______ : ______ am pmMove on to NEXT PLACE
Of those, how many were household members?
__________
FHow many others traveled with you? (DON’T include yourself)
_________
E
D If you traveled by PUBLIC TRANSIT, what was the route or line? _______________________________
What TIME did you ARRIVE at this place?
(Please record exact time)
B
______ : ______ am pm
HOW did you TRAVEL to this place? (Write code from LIST 1 on flap of the back cover)
CCode: ________
WHAT is this PLACE?
My Home My Primary Job My School
My Second Job Transit Stop Other Place
Please tell us the NAME and ADDRESS of this PLACE:
City ZipState
Street address OR nearest cross-streets
Name of Other Place OR Transit stop
What ACTIVITY did you do at this place?
(Write code from LIST 2 on flap of the back cover)
G
Code: ________
A
EXTR
A P
LAC
ES If
you
mad
e m
ore
th
an 1
1 tr
ips,
use
th
e ch
art
bel
ow
to w
rite
info
rmat
ion
on
th
e o
ther
pla
ces
you
wen
t.
Do
n’t
fo
rge
t to
re
cord
yo
ur
ex
act
tim
es!
BU
S, B
IKE,
or W
ALK
ING
TR
IPS?
If y
ou
hav
e m
ade
any
oth
er t
rip
s in
th
e la
st t
hir
ty d
ays
by
MAT
bu
s, b
icyc
le, o
r by
wal
kin
g,
ple
ase
ind
icat
e th
e ap
pro
xim
ate
nu
mb
er o
f tri
ps
and
th
e m
ost
co
mm
on
act
ivit
ies
for e
ach
:
Bu
s: ab
ou
t __
____
____
_ tr
ips,
usu
ally
for a
ctiv
itie
s (f
rom
LIS
T 2
on
back
cov
er) _
____
____
_
Bik
e:
abo
ut
____
____
___
trip
s, u
sual
ly fo
r act
ivit
ies
(fro
m L
IST
2 o
n ba
ck c
over
) ___
____
___
Wal
k:
abo
ut
____
____
___
trip
s, u
sual
ly fo
r act
ivit
ies
(fro
m L
IST
2 o
n ba
ck c
over
) ___
____
___
Appendix B • Data File Structure/Data Dictionary
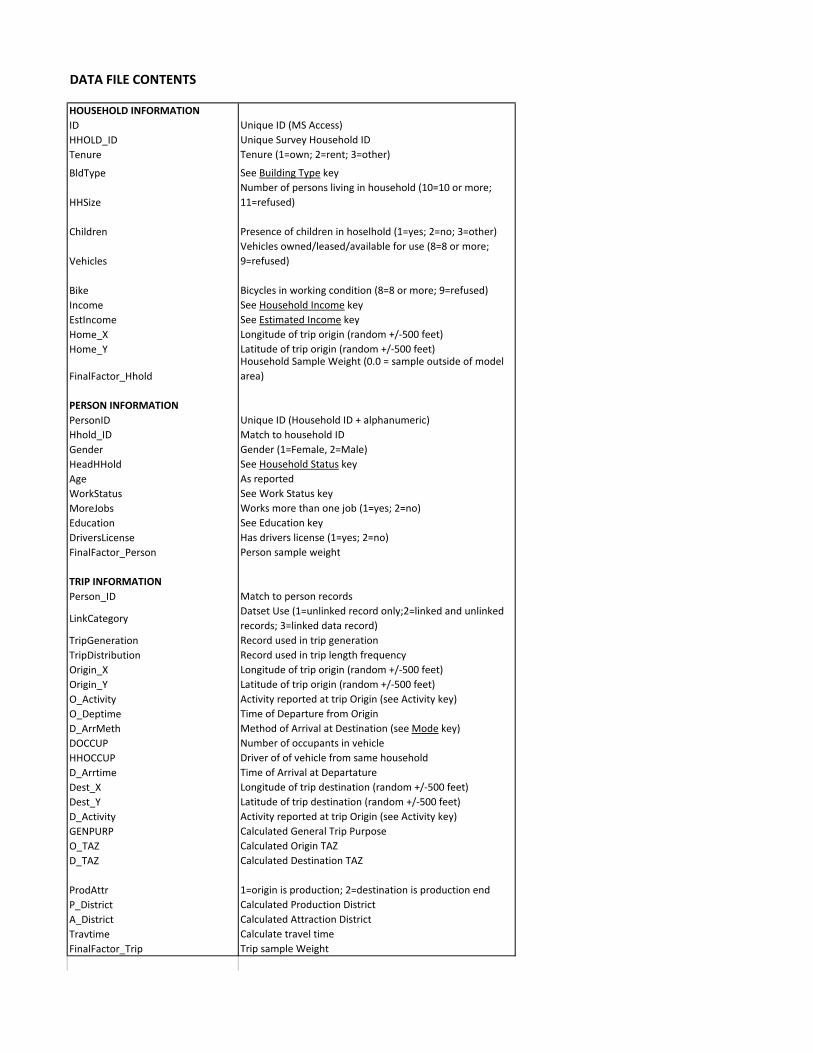
DATA FILE CONTENTS
HOUSEHOLD INFORMATIONID Unique ID (MS Access)HHOLD_ID Unique Survey Household IDTenure Tenure (1=own; 2=rent; 3=other)
BldType See Building Type key
HHSizeNumber of persons living in household (10=10 or more; 11=refused)
Children Presence of children in hoselhold (1=yes; 2=no; 3=other)
VehiclesVehicles owned/leased/available for use (8=8 or more; 9=refused)
Bike Bicycles in working condition (8=8 or more; 9=refused)Income See Household Income keyEstIncome See Estimated Income keyHome_X Longitude of trip origin (random +/-500 feet)Home_Y Latitude of trip origin (random +/-500 feet)
FinalFactor_HholdHousehold Sample Weight (0.0 = sample outside of model area)
PERSON INFORMATIONPersonID Unique ID (Household ID + alphanumeric)Hhold_ID Match to household IDGender Gender (1=Female, 2=Male)HeadHHold See Household Status keyAge As reportedWorkStatus See Work Status keyMoreJobs Works more than one job (1=yes; 2=no)Education See Education keyDriversLicense Has drivers license (1=yes; 2=no)FinalFactor_Person Person sample weight
TRIP INFORMATIONPerson_ID Match to person records
LinkCategoryDatset Use (1=unlinked record only;2=linked and unlinked records; 3=linked data record)
TripGeneration Record used in trip generationTripDistribution Record used in trip length frequencyOrigin_X Longitude of trip origin (random +/-500 feet)Origin_Y Latitude of trip origin (random +/-500 feet)O_Activity Activity reported at trip Origin (see Activity key)O_Deptime Time of Departure from OriginD_ArrMeth Method of Arrival at Destination (see Mode key)DOCCUP Number of occupants in vehicleHHOCCUP Driver of of vehicle from same householdD_Arrtime Time of Arrival at DepartatureDest_X Longitude of trip destination (random +/-500 feet)Dest_Y Latitude of trip destination (random +/-500 feet)D_Activity Activity reported at trip Origin (see Activity key)GENPURP Calculated General Trip PurposeO_TAZ Calculated Origin TAZD_TAZ Calculated Destination TAZ
ProdAttr 1=origin is production; 2=destination is production endP_District Calculated Production DistrictA_District Calculated Attraction DistrictTravtime Calculate travel timeFinalFactor_Trip Trip sample Weight
DATA FIELD KEYS
Tenure Activity1 Own/buying (e.g. paying off 1 Working at home (pay or volunteer)2 Rent/lease or 2 Shopping (phone, catalog or online)3 Provided by job or military 3 Other ctivities at home
4 Change travel modeBuilding Type 5 Drop off passenger from car
1 A one-family house detached from any other house 6 Pick up passenger from car2 A one-family house attached to one or more houses 7 Get gas/fuel3 A building with 2 apartments i.e. a duplex 8 Drive-thru (ATM, bank, food, etc.)4 A building with 3 apartments 9 Working/doing my job5 A building with 4 to 10 apartments 10 Other work-related activities at work6 A building with more than 10 apartments 11 Volunteer work/activities7 A dormitory or group quarter 12 Attending class/studying8 Other 13 Other activities at school (eat lunch, recreational, etc.)
14 Work-relatedHousehold Income 15 Service private vehicle (oil, repairs, etc.)
1 Under $20,000 16 Grocery/food shopping2 $20,000 to $35,000 17 Other routine shopping3 $35,000 to $50,000 18 Shoping for major purpose4 $50,000 to $65,000 19 Household errands (bank, etc.)5 $65,000 to $100,000 20 Personal business (visit government office, accountant, etc.)6 $100,000 or more 21 Eat meal out at restaurant/diner7 Don't Know/Refused 22 Health care (doctor, dentist, etc.)
23 Civic or religious activitiesEstimated Income 24 Outdoor recreation
1 $50,000 or less 25 Indoor recreation2 More than $50,000 26 Entertainment (movies, etc.)3 Don't Know/Refused 27 Social/visit friends/relatives
28 Airport - businessRelationship in household 29 Airport-personal
1 Husband or Wife 97 Other2 Daughter3 Son Mode4 Grandchild 1 Walk5 Son-in-law 2 Bike6 Daughter-in-law 3 Wheelchair/mobility scooter7 Unmarried partner 4 Skate/skateboard/kick scooter8 Roomer or Boarder 5 Auto driver9 Housemate or Roommate 6 Auto passenger
10 Foster Child 7 Carpool11 Other nonrelative 8 Motorcycle/moped/motorized scooter
9 Local bus (MATBUS)Work Status 10 Paratransit service (MAT Paratransit)
1 Full time 11 Metro Senior Ride2 Part time 12 School Bus3 Retired 13 Shuttle bus4 Not Employed/looking for work 14 Charter bus (public or employer)5 Student 15 Taxi6 Homemaker 16 Black Car Service/Limo7 Child 97 Other
Education Status1 High School or less2 Technical or vocational school3 Some college4 College graduate5 Post graduate work or advanced degree7 Current Student8 Child (not in school)6 Don't know/Refused

Appendix C • Trip Generation Investigation

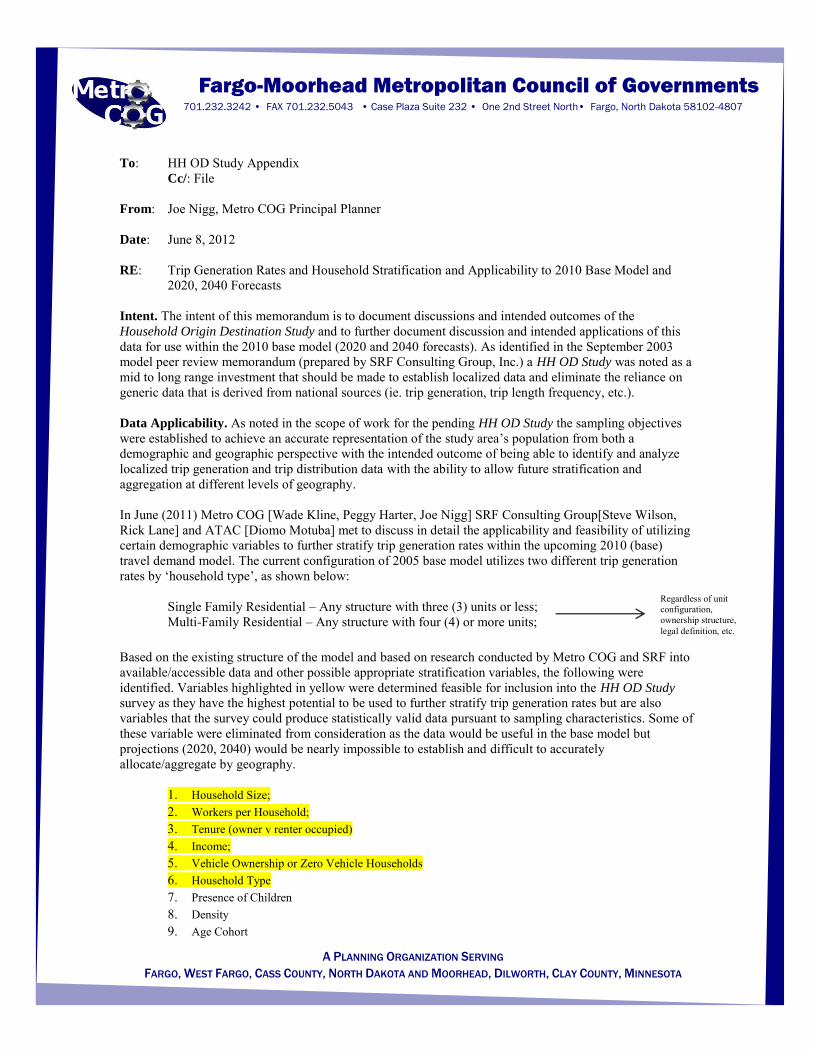
To: HH OD Study Appendix Cc/: File
From: Joe Nigg, Metro COG Principal Planner Date: June 8, 2012
RE: Trip Generation Rates and Household Stratification and Applicability to 2010 Base Model and
2020, 2040 Forecasts Intent. The intent of this memorandum is to document discussions and intended outcomes of the Household Origin Destination Study and to further document discussion and intended applications of this data for use within the 2010 base model (2020 and 2040 forecasts). As identified in the September 2003 model peer review memorandum (prepared by SRF Consulting Group, Inc.) a HH OD Study was noted as a mid to long range investment that should be made to establish localized data and eliminate the reliance on generic data that is derived from national sources (ie. trip generation, trip length frequency, etc.). Data Applicability. As noted in the scope of work for the pending HH OD Study the sampling objectives were established to achieve an accurate representation of the study area’s population from both a demographic and geographic perspective with the intended outcome of being able to identify and analyze localized trip generation and trip distribution data with the ability to allow future stratification and aggregation at different levels of geography. In June (2011) Metro COG [Wade Kline, Peggy Harter, Joe Nigg] SRF Consulting Group[Steve Wilson, Rick Lane] and ATAC [Diomo Motuba] met to discuss in detail the applicability and feasibility of utilizing certain demographic variables to further stratify trip generation rates within the upcoming 2010 (base) travel demand model. The current configuration of 2005 base model utilizes two different trip generation rates by ‘household type’, as shown below: Single Family Residential – Any structure with three (3) units or less; Multi-Family Residential – Any structure with four (4) or more units; Based on the existing structure of the model and based on research conducted by Metro COG and SRF into available/accessible data and other possible appropriate stratification variables, the following were identified. Variables highlighted in yellow were determined feasible for inclusion into the HH OD Study
survey as they have the highest potential to be used to further stratify trip generation rates but are also variables that the survey could produce statistically valid data pursuant to sampling characteristics. Some of these variable were eliminated from consideration as the data would be useful in the base model but projections (2020, 2040) would be nearly impossible to establish and difficult to accurately allocate/aggregate by geography.
1. Household Size; 2. Workers per Household; 3. Tenure (owner v renter occupied) 4. Income; 5. Vehicle Ownership or Zero Vehicle Households 6. Household Type 7. Presence of Children 8. Density 9. Age Cohort
Fargo-Moorhead Metropolitan Council of Governments 701.232.3242 • FAX 701.232.5043 • Case Plaza Suite 232 • One 2nd Street North• Fargo, North Dakota 58102-4807
A PLANNING ORGANIZATION SERVING
FARGO, WEST FARGO, CASS COUNTY, NORTH DAKOTA AND MOORHEAD, DILWORTH, CLAY COUNTY, MINNESOTA
Regardless of unit configuration, ownership structure, legal definition, etc.
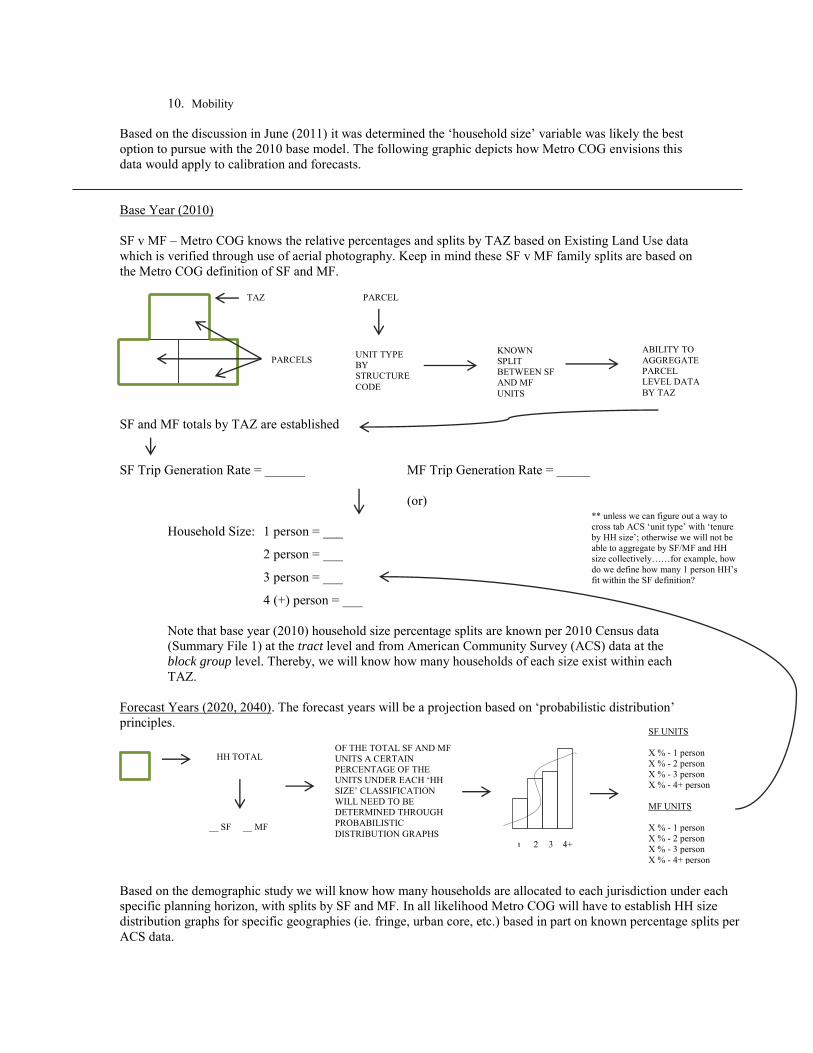
10. Mobility
Based on the discussion in June (2011) it was determined the ‘household size’ variable was likely the best option to pursue with the 2010 base model. The following graphic depicts how Metro COG envisions this data would apply to calibration and forecasts. Base Year (2010)
SF v MF – Metro COG knows the relative percentages and splits by TAZ based on Existing Land Use data which is verified through use of aerial photography. Keep in mind these SF v MF family splits are based on the Metro COG definition of SF and MF. SF and MF totals by TAZ are established SF Trip Generation Rate = ______ MF Trip Generation Rate = _____
(or)
Household Size: 1 person = ___
2 person = ___
3 person = ___
4 (+) person = ___ Note that base year (2010) household size percentage splits are known per 2010 Census data (Summary File 1) at the tract level and from American Community Survey (ACS) data at the block group level. Thereby, we will know how many households of each size exist within each TAZ.
Forecast Years (2020, 2040). The forecast years will be a projection based on ‘probabilistic distribution’ principles. Based on the demographic study we will know how many households are allocated to each jurisdiction under each specific planning horizon, with splits by SF and MF. In all likelihood Metro COG will have to establish HH size distribution graphs for specific geographies (ie. fringe, urban core, etc.) based in part on known percentage splits per ACS data.
TAZ
PARCELS
PARCEL
UNIT TYPE BY STRUCTURE CODE
KNOWN SPLIT BETWEEN SF AND MF UNITS
ABILITY TO AGGREGATE PARCEL LEVEL DATA BY TAZ
** unless we can figure out a way to cross tab ACS ‘unit type’ with ‘tenure by HH size’; otherwise we will not be able to aggregate by SF/MF and HH size collectively……for example, how do we define how many 1 person HH’s fit within the SF definition?
HH TOTAL
__ SF __ MF
OF THE TOTAL SF AND MF UNITS A CERTAIN PERCENTAGE OF THE UNITS UNDER EACH ‘HH SIZE’ CLASSIFICATION WILL NEED TO BE DETERMINED THROUGH PROBABILISTIC DISTRIBUTION GRAPHS
SF UNITS X % - 1 person X % - 2 person X % - 3 person X % - 4+ person MF UNITS X % - 1 person X % - 2 person X % - 3 person X % - 4+ person
1 2 3 4+

Person Trip Rates (per Household)By Housing Tenure
Own Rent TotalPurpose Cases 705 53 758HBW Rate 1.816 1.509 1.751
t-statistic 28.82 9.38 30.44p-value 0.000 0.000 0.000
HB-Shop Rate 0.628 0.618 0.626t-statistic 13.35 4.09 14.16p- value 0.000 0.000 0.000
HBO Rate 2.170 0.558 1.827t-statistic 19.91 4.69 18.77p- value 0.000 0.000 0.000
HBO-Tot Rate 2.798 1.177 2.453t-statistic 21.08 6.84 20.79p- value 0.000 0.000 0.000
HB-GrSch Rate 0.684 0.361 0.615t-statistic 11.75 3.53 11.94p- value 0.000 0.001 0.000
HB-HiSch Rate 0.194 0.011 0.155t-statistic 7.19 0.54 6.63p- value 0.000 0.594 0.000
HB-SchK12 Rate 0.878 0.372 0.770t-statistic 13.41 3.47 13.28p- value 0.000 0.001 0.000
HB-Univ Rate 0.040 0.074 0.047t-statistic 3.58 1.41 4.12p- value 0.000 0.164 0.000
HB-NHB Rate 2.562 1.954 2.433t-statistic 21.69 6.28 22.48p- value 0.000 0.000 0.000
IE Rate 0.258 0.009 0.205t-statistic 8.41 0.68 7.72p- value 0.000 0.502 0.000
Total Rate 8.428 5.094 7.719t-statistic 35.04 15.71 35.85p- value 0.000 0.000 0.000
Notes:Rate is the mean estimated household trip rate t-Statistic is Student's t-statistic measurep-value is probability that actual value is 0.0 (null hypothesis)Shaded cells are those with less than 95% confidence mean value is not 0.0
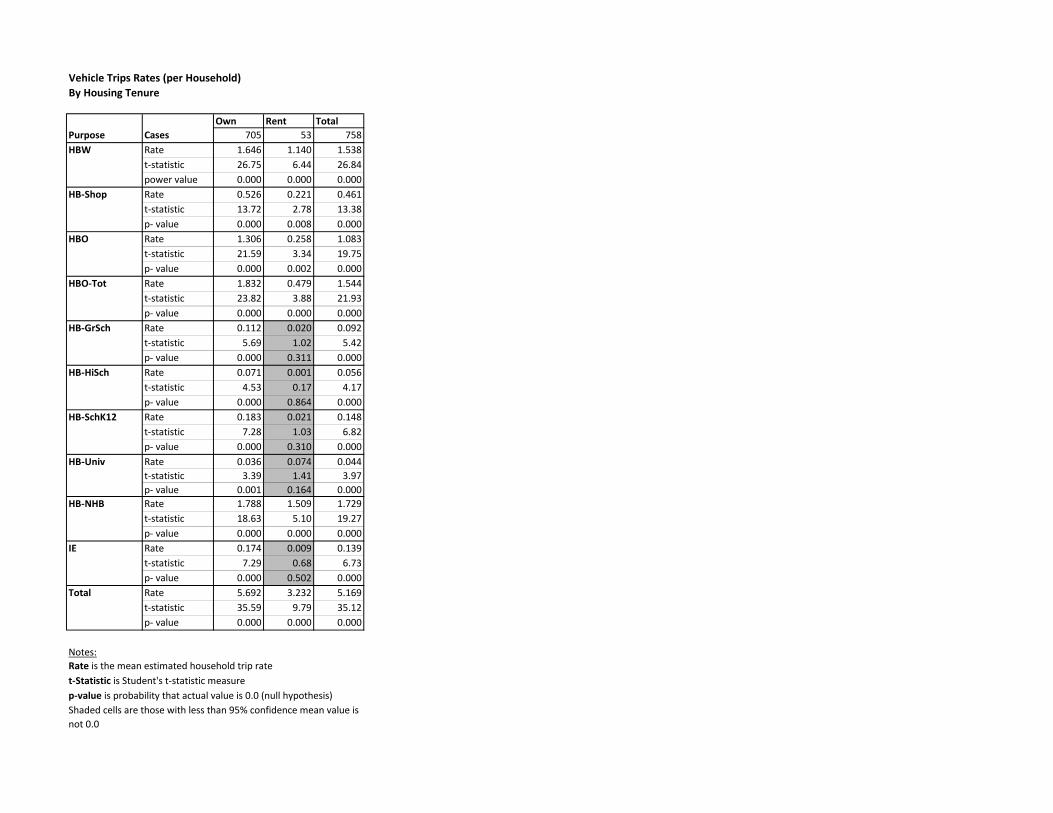
Vehicle Trips Rates (per Household)By Housing Tenure
Own Rent TotalPurpose Cases 705 53 758HBW Rate 1.646 1.140 1.538
t-statistic 26.75 6.44 26.84power value 0.000 0.000 0.000
HB-Shop Rate 0.526 0.221 0.461t-statistic 13.72 2.78 13.38p- value 0.000 0.008 0.000
HBO Rate 1.306 0.258 1.083t-statistic 21.59 3.34 19.75p- value 0.000 0.002 0.000
HBO-Tot Rate 1.832 0.479 1.544t-statistic 23.82 3.88 21.93p- value 0.000 0.000 0.000
HB-GrSch Rate 0.112 0.020 0.092t-statistic 5.69 1.02 5.42p- value 0.000 0.311 0.000
HB-HiSch Rate 0.071 0.001 0.056t-statistic 4.53 0.17 4.17p- value 0.000 0.864 0.000
HB-SchK12 Rate 0.183 0.021 0.148t-statistic 7.28 1.03 6.82p- value 0.000 0.310 0.000
HB-Univ Rate 0.036 0.074 0.044t-statistic 3.39 1.41 3.97p- value 0.001 0.164 0.000
HB-NHB Rate 1.788 1.509 1.729t-statistic 18.63 5.10 19.27p- value 0.000 0.000 0.000
IE Rate 0.174 0.009 0.139t-statistic 7.29 0.68 6.73p- value 0.000 0.502 0.000
Total Rate 5.692 3.232 5.169t-statistic 35.59 9.79 35.12p- value 0.000 0.000 0.000
Notes:Rate is the mean estimated household trip rate t-Statistic is Student's t-statistic measurep-value is probability that actual value is 0.0 (null hypothesis)Shaded cells are those with less than 95% confidence mean value is not 0.0
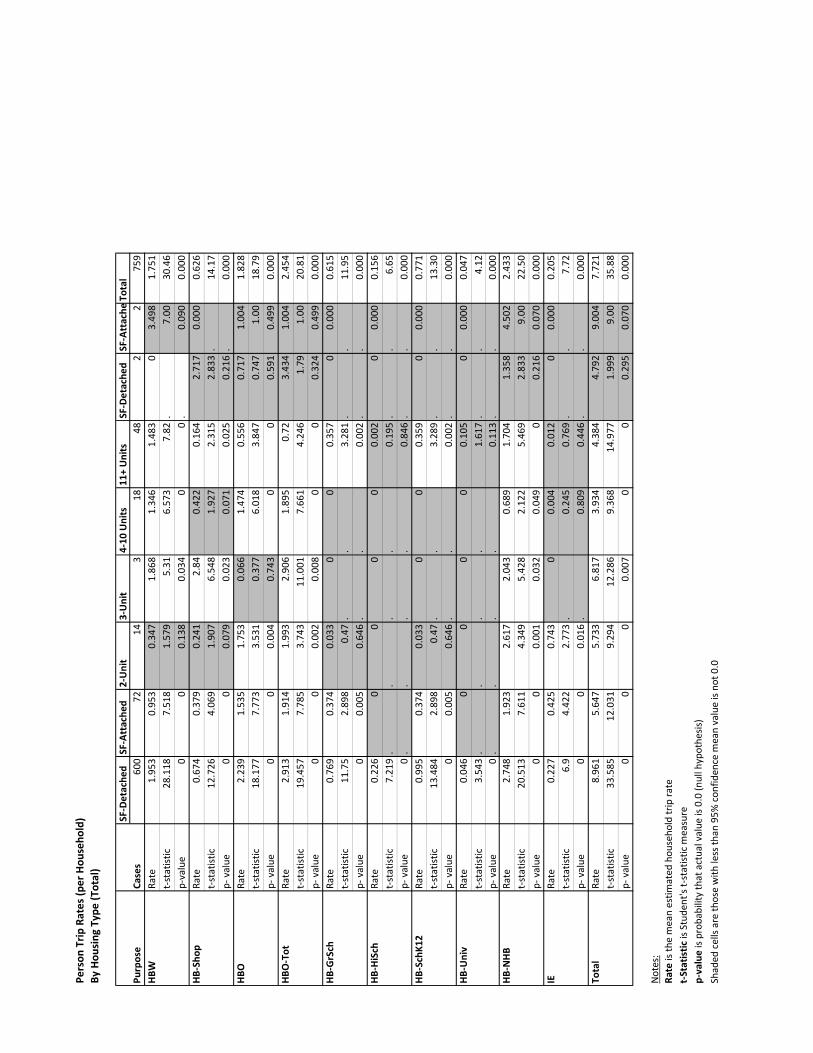
Pers
on T
rip R
ates
(per
Hou
seho
ld)
By H
ousi
ng T
ype
(Tot
al)
SF-D
etac
hed
SF-A
ttac
hed
2-U
nit
3-U
nit
4-10
Uni
ts11
+ U
nits
SF-D
etac
hed
SF-A
ttac
heTo
tal
Purp
ose
Case
s60
072
143
1848
22
759
HBW
Rate
1.95
30.
953
0.34
71.
868
1.34
61.
483
03.
498
1.75
1t-
stat
istic
28.1
187.
518
1.57
95.
316.
573
7.82
.7.
0030
.46
p-va
lue
00
0.13
80.
034
00
.0.
090
0.00
0HB
-Sho
pRa
te0.
674
0.37
90.
241
2.84
0.42
20.
164
2.71
70.
000
0.62
6t-
stat
istic
12.7
264.
069
1.90
76.
548
1.92
72.
315
2.83
3.
14.1
7p-
val
ue0
00.
079
0.02
30.
071
0.02
50.
216
.0.
000
HBO
Rate
2.23
91.
535
1.75
30.
066
1.47
40.
556
0.71
71.
004
1.82
8t-
stat
istic
18.1
777.
773
3.53
10.
377
6.01
83.
847
0.74
71.
0018
.79
p- v
alue
00
0.00
40.
743
00
0.59
10.
499
0.00
0HB
O-T
otRa
te2.
913
1.91
41.
993
2.90
61.
895
0.72
3.43
41.
004
2.45
4t-
stat
istic
19.4
577.
785
3.74
311
.001
7.66
14.
246
1.79
1.00
20.8
1p-
val
ue0
00.
002
0.00
80
00.
324
0.49
90.
000
HB-G
rSch
Rate
0.76
90.
374
0.03
30
00.
357
00.
000
0.61
5t-
stat
istic
11.7
52.
898
0.47
..
3.28
1.
.11
.95
p- v
alue
00.
005
0.64
6.
.0.
002
..
0.00
0HB
-HiS
chRa
te0.
226
00
00
0.00
20
0.00
00.
156
t-st
atist
ic7.
219
..
..
0.19
5.
.6.
65p-
val
ue0
..
..
0.84
6.
.0.
000
HB-S
chK1
2Ra
te0.
995
0.37
40.
033
00
0.35
90
0.00
00.
771
t-st
atist
ic13
.484
2.89
80.
47.
.3.
289
..
13.3
0p-
val
ue0
0.00
50.
646
..
0.00
2.
.0.
000
HB-U
niv
Rate
0.04
60
00
00.
105
00.
000
0.04
7t-
stat
istic
3.54
3.
..
.1.
617
..
4.12
p- v
alue
0.
..
.0.
113
..
0.00
0HB
-NHB
Rate
2.74
81.
923
2.61
72.
043
0.68
91.
704
1.35
84.
502
2.43
3t-
stat
istic
20.5
137.
611
4.34
95.
428
2.12
25.
469
2.83
39.
0022
.50
p- v
alue
00
0.00
10.
032
0.04
90
0.21
60.
070
0.00
0IE
Rate
0.22
70.
425
0.74
30
0.00
40.
012
00.
000
0.20
5t-
stat
istic
6.9
4.42
22.
773
.0.
245
0.76
9.
.7.
72p-
val
ue0
00.
016
.0.
809
0.44
6.
.0.
000
Tota
lRa
te8.
961
5.64
75.
733
6.81
73.
934
4.38
44.
792
9.00
47.
721
t-st
atist
ic33
.585
12.0
319.
294
12.2
869.
368
14.9
771.
999
9.00
35.8
8p-
val
ue0
00
0.00
70
00.
295
0.07
00.
000
Not
es:
Rate
is th
e m
ean
estim
ated
hou
seho
ld tr
ip ra
te
t-St
atis
tic is
Stu
dent
's t-
stat
istic
mea
sure
p-va
lue
is pr
obab
ility
that
act
ual v
alue
is 0
.0 (n
ull h
ypot
hesis
)Sh
aded
cel
ls ar
e th
ose
with
less
than
95%
con
fiden
ce m
ean
valu
e is
not 0
.0
Vehi
cle
Trip
s Rat
es (p
er H
ouse
hold
)By
Hou
sing
Typ
e (T
otal
)
SF-D
etac
hed
SF-A
ttac
hed
2-U
nit
3-U
nit
4-10
Uni
ts11
+ U
nits
Gro
up Q
uart
ers
Oth
erTo
tal
Purp
ose
Case
s60
072
143
1848
22
759
HBW
Rate
1.76
80.
912
0.24
20
1.34
61.
325
03.
498
1.53
9t-
stat
istic
25.8
787.
485
1.42
6.
6.57
36.
689
.7.
0026
.85
p-va
lue
00
0.17
7.
00
.0.
090
0.00
0HB
-Sho
pRa
te0.
560.
357
0.24
10.
039
0.42
20.
162
2.71
70.
000
0.46
1t-
stat
istic
13.1
353.
888
1.90
70.
284
1.92
72.
298
2.83
3.
13.3
8p-
val
ue0
00.
079
0.80
30.
071
0.02
60.
216
.0.
000
HBO
Rate
1.32
61.
078
1.06
30.
066
0.51
0.29
70.
717
1.00
41.
083
t-st
atist
ic19
.796
7.28
12.
729
0.37
72.
577
2.95
50.
747
1.00
19.7
6p-
val
ue0
00.
017
0.74
30.
020.
005
0.59
10.
499
0.00
0HB
O-T
otRa
te1.
886
1.43
51.
304
0.10
50.
931
0.45
93.
434
1.00
41.
545
t-st
atist
ic22
.352
6.94
82.
815
0.35
93.
136
3.40
81.
791.
0021
.95
p- v
alue
00
0.01
50.
754
0.00
60.
001
0.32
40.
499
0.00
0HB
-GrS
chRa
te0.
127
00.
033
00
0.02
80
0.00
00.
092
t-st
atist
ic5.
623
.0.
47.
.1.
167
..
5.42
p- v
alue
0.
0.64
6.
.0.
249
..
0.00
0HB
-HiS
chRa
te0.
082
00
00
0.00
20
0.00
00.
057
t-st
atist
ic4.
503
..
..
0.19
5.
.4.
19p-
val
ue0
..
..
0.84
6.
.0.
000
HB-S
chK1
2Ra
te0.
210
0.03
30
00.
030
0.00
00.
149
t-st
atist
ic7.
231
.0.
47.
.1.
169
..
6.84
p- v
alue
0.
0.64
6.
.0.
248
..
0.00
0HB
-Uni
vRa
te0.
042
00
00
0.10
50
0.00
00.
044
t-st
atist
ic3.
349
..
..
1.61
7.
.3.
98p-
val
ue0.
001
..
..
0.11
3.
.0.
000
HB-N
HBRa
te1.
923
1.48
42.
369
0.17
60.
644
1.45
31.
358
4.50
21.
729
t-st
atist
ic17
.48
6.87
63.
997
0.29
92.
175.
286
2.83
39.
0019
.29
p- v
alue
00
0.00
20.
793
0.04
40
0.21
60.
070
0.00
0IE
Rate
0.15
20.
259
0.74
30
0.00
40.
012
00.
000
0.13
9t-
stat
istic
5.89
64.
112
2.77
3.
0.24
50.
769
..
6.73
p- v
alue
00
0.01
6.
0.80
90.
446
..
0.00
0To
tal
Rate
6.01
44.
118
4.69
10.
281
2.92
53.
385
4.79
29.
004
5.17
1t-
stat
istic
33.8
5211
.911
6.31
50.
354
6.54
212
.95
1.99
99.
0035
.14
p- v
alue
00
00.
757
00
0.29
50.
070
0.00
0
Not
es:
Rate
is th
e m
ean
estim
ated
hou
seho
ld tr
ip ra
te
t-St
atis
tic is
Stu
dent
's t-
stat
istic
mea
sure
p-va
lue
is pr
obab
ility
that
act
ual v
alue
is 0
.0 (n
ull h
ypot
hesis
)Sh
aded
cel
ls ar
e th
ose
with
less
than
95%
con
fiden
ce m
ean
valu
e is
not 0
.0
Person Trip Rates (per Household)By Housing Type (Single- v. Multi-Family)
Single Family Multi-Family TotalPurpose Cases 690 69 759HBW Rate 1.817 1.453 1.751
t-statistic 29.047 9.673 30.46p-value 0 0 0.000
HB-Shop Rate 0.715 0.224 0.626t-statistic 14.488 2.964 14.17p- value 0 0.004 0.000
HBO Rate 2.074 0.714 1.828t-statistic 19.034 5.593 18.79p- value 0 0 0.000
HBO-Tot Rate 2.789 0.938 2.454t-statistic 21.221 6.21 20.81p- value 0 0 0.000
HB-GrSch Rate 0.686 0.294 0.615t-statistic 11.822 3.512 11.95p- value 0 0.001 0.000
HB-HiSch Rate 0.19 0.001 0.156t-statistic 7.042 0.213 6.65p- value 0 0.832 0.000
HB-SchK12 Rate 0.876 0.296 0.771t-statistic 13.399 3.521 13.30p- value 0 0.001 0.000
HB-Univ Rate 0.038 0.087 0.047t-statistic 3.475 1.757 4.12p- value 0.001 0.083 0.000
HB-NHB Rate 2.631 1.538 2.433t-statistic 22.204 6.169 22.50p- value 0 0 0.000
IE Rate 0.248 0.011 0.205t-statistic 8.138 0.862 7.72p- value 0 0.392 0.000
Total Rate 8.473 4.322 7.721t-statistic 35.677 17.934 35.88p- value 0 0 0.000
Notes:Rate is the mean estimated household trip rate t-Statistic is Student's t-statistic measurep-value is probability that actual value is 0.0 (null hypothesis)Shaded cells are those with less than 95% confidence mean value is not 0.0
Vehicle Trips Rates (per Household)By Housing Type (Single- v. Multi-Family)
Single Family Multi-Family TotalPurpose Cases 690 69 759HBW Rate 1.587 1.323 1.539
t-statistic 25.528 8.474 26.85p-value 0 0 0.000
HB-Shop Rate 0.514 0.223 0.461t-statistic 13.504 2.95 13.38p- value 0 0.004 0.000
HBO Rate 1.248 0.339 1.083t-statistic 20.652 3.868 19.76p- value 0 0 0.000
HBO-Tot Rate 1.762 0.562 1.545t-statistic 22.881 4.474 21.95p- value 0 0 0.000
HB-GrSch Rate 0.107 0.023 0.092t-statistic 5.517 1.271 5.42p- value 0 0.208 0.000
HB-HiSch Rate 0.069 0.001 0.057t-statistic 4.411 0.213 4.19p- value 0 0.832 0.000
HB-SchK12 Rate 0.176 0.025 0.149t-statistic 7.068 1.273 6.84p- value 0 0.207 0.000
HB-Univ Rate 0.035 0.087 0.044t-statistic 3.285 1.757 3.98p- value 0.001 0.083 0.000
HB-NHB Rate 1.819 1.324 1.729t-statistic 18.492 6.014 19.29p- value 0 0 0.000
IE Rate 0.167 0.011 0.139t-statistic 7.052 0.862 6.73p- value 0 0.392 0.000
Total Rate 5.578 3.33 5.171t-statistic 34.154 14.933 35.14p- value 0 0 0.000
0Notes:Rate is the mean estimated household trip rate t-Statistic is Student's t-statistic measurep-value is probability that actual value is 0.0 (null hypothesis)Shaded cells are those with less than 95% confidence mean value is not 0.0

Person Trip Rates (per Household)By Household Size
1- Person 2-Person 3-Person 4+ Persons TotalPurpose Cases 172 369 86 132 759HBW Rate 1.003 1.718 2.559 2.424 1.751
t-statistic 14.899 19.834 13.605 17.154 30.46p-value 0 0 0 0 0.000
HB-Shop Rate 0.206 0.731 0.747 1.035 0.626t-statistic 5.03 11.515 5.695 6.851 14.17p- value 0 0 0 0 0.000
HBO Rate 0.881 1.669 1.763 3.761 1.828t-statistic 10.708 16.891 7.805 9.404 18.79p- value 0 0 0 0 0.000
HBO-Tot Rate 1.087 2.4 2.51 4.796 2.454t-statistic 11.897 21.034 9.638 9.741 20.81p- value 0 0 0 0 0.000
HB-GrSch Rate 0.004 0.132 0.803 2.397 0.615t-statistic 0.875 5.093 6.001 12.521 11.95p- value 0.383 0 0 0 0.000
HB-HiSch Rate 0 0 0.468 0.461 0.156t-statistic . . 4.649 4.657 6.65p- value . . 0 0 0.000
HB-SchK12 Rate 0.004 0.132 1.271 2.858 0.771t-statistic 0.875 5.093 8.379 14.212 13.30p- value 0.383 0 0 0 0.000
HB-Univ Rate 0 0.045 0.113 0.077 0.047t-statistic . 2.901 2.028 2.33 4.12p- value . 0.004 0.046 0.021 0.000
HB-NHB Rate 1.572 2.401 2.886 3.573 2.433t-statistic 11.443 17.797 7.392 10.095 22.50p- value 0 0 0 0 0.000
HB-IE Rate 0.051 0.297 0.181 0.31 0.205t-statistic 2.247 6.733 2.795 3.516 7.72p- value 0.026 0 0.006 0.001 0.000
Total Rate 3.726 7.132 9.522 14.081 7.721t-statistic 27.942 36.04 18.532 19.643 35.88p- value 0 0 0 0 0.000
Notes:Rate is the mean estimated household trip rate t-Statistic is Student's t-statistic measurep-value is probability that actual value is 0.0 (null hypothesis)Shaded cells are those with less than 95% confidence mean value is not 0.0
Vehicle Trips Rates (per Household)By Household Size
1- Person 2-Person 1- Person 2-Person 3-Person 4+ Persons TotalPurpose Cases 172 369 86 132 759HBW Rate 0.914 1.422 2.327 2.18 1.539
t-statistic 13.319 16.336 12.368 15.015 26.85p-value 0 0 0 0 0.000
HB-Shop Rate 0.193 0.414 0.709 0.801 0.461t-statistic 4.847 9.118 5.7 7.254 13.38p- value 0 0 0 0 0.000
HBO Rate 0.578 1.058 1.047 2.006 1.083t-statistic 8.15 14.253 6.338 11.766 19.76p- value 0 0 0 0 0.000
HBO-Tot Rate 0.771 1.473 1.756 2.806 1.545t-statistic 9.297 15.581 8.158 12.941 21.95p- value 0 0 0 0 0.000
HB-GrSch Rate 0.004 0.003 0.312 0.232 0.092t-statistic 0.798 0.761 3.476 3.685 5.42p- value 0.426 0.447 0.001 0 0.000
HB-HiSch Rate 0 0 0.155 0.18 0.057t-statistic . . 2.477 3.092 4.19p- value . . 0.015 0.002 0.000
HB-SchK12 Rate 0.004 0.003 0.467 0.412 0.149t-statistic 0.798 0.761 4.486 4.858 6.84p- value 0.426 0.447 0 0 0.000
HB-Univ Rate 0 0.045 0.113 0.063 0.044t-statistic . 2.901 2.028 2.069 3.98p- value . 0.004 0.046 0.04 0.000
HB-NHB Rate 1.427 1.553 2.025 2.329 1.729t-statistic 11.062 13.614 6.069 8.173 19.29p- value 0 0 0 0 0.000
IE Rate 0.051 0.175 0.155 0.205 0.139t-statistic 2.247 5.895 2.546 2.81 6.73p- value 0.026 0 0.013 0.006 0.000
Total Rate 3.175 4.733 6.843 8.004 5.171t-statistic 21.507 24.193 14.122 19.568 35.14p- value 0 0 0 0 0.000
Notes:Rate is the mean estimated household trip rate t-Statistic is Student's t-statistic measurep-value is probability that actual value is 0.0 (null hypothesis)Shaded cells are those with less than 95% confidence mean value is not 0.0

Person Trip Rates (per Household)By Household Income ($2010)
Under $20,000 $20 - 35,000 $35- 50,000 $50 - 65,000 $65 - 100,000 $100,000 or more Under $20,Purpose Cases 39 91 156 106 197 170 759HBW Rate 0.477 1.419 1.791 1.887 2.443 2.237 1.751
t-statistic 2.818 11.028 16.894 10.019 20.912 16.621 30.46p- value 0.008 0 0 0 0 0 0.000
HB-Shop Rate 0.349 0.373 1.001 0.688 0.621 0.818 0.626t-statistic 2.836 3.458 7.795 5.874 8.078 8.129 14.17p- value 0.007 0.001 0 0 0 0 0.000
HBO Rate 1.666 1.662 1.578 1.339 2.502 2.043 1.828t-statistic 6.144 4.577 8.039 7.312 13.626 11.94 18.79p- value 0 0 0 0 0 0 0.000
HBO-Tot Rate 2.014 2.035 2.579 2.027 3.124 2.861 2.454t-statistic 7.048 4.516 10.543 9.414 14.992 13.631 20.81p- value 0 0 0 0 0 0 0.000
HB-GrSch Rate 0.442 0.288 0.569 0.526 0.864 1.146 0.615t-statistic 3.064 3.494 4.856 3.732 7.594 7.465 11.95p- value 0.004 0.001 0 0 0 0 0.000
HB-HiSch Rate 0.162 0.01 0.005 0.038 0.357 0.43 0.156t-statistic 1.829 0.68 0.881 2.045 4.989 5.459 6.65p- value 0.075 0.498 0.38 0.043 0 0 0.000
HB-SchK12 Rate 0.603 0.299 0.574 0.564 1.221 1.576 0.771t-statistic 3.828 3.465 4.877 3.957 9.266 8.83 13.30p- value 0 0.001 0 0 0 0 0.000
HB-Univ Rate 0.156 0 0.047 0.023 0.072 0.048 0.047t-statistic 1.796 . 1.603 1.566 2.674 1.969 4.12p- value 0.08 . 0.111 0.12 0.008 0.051 0.000
HB-NHB Rate 1.904 1.975 2.266 2.576 3.081 2.94 2.433t-statistic 4.553 7.438 8.907 7.576 13.249 13.532 22.50p- value 0 0 0 0 0 0 0.000
IE Rate 0.104 0.193 0.161 0.101 0.239 0.373 0.205t-statistic 1.251 2.557 2.99 2.653 3.926 5.316 7.72p- value 0.218 0.012 0.003 0.009 0 0 0.000
Total Rate 5.275 6.01 7.485 7.301 10.224 10.037 7.721t-statistic 8.362 9.077 15.518 15.324 25.061 25.04 35.88p- value 0 0 0 0 0 0 0.000
Notes:Rate is the mean estimated household trip rate t-Statistic is Student's t-statistic measurep-value is probability that actual value is 0.0 (null hypothesis)Shaded cells are those with less than 95% confidence mean value is not 0.0
Vehicle Trips Rates (per household)By Household Income ($2010)
0 Under $20,000 $20 - 35,000 $35- 50,000 $50 - 65,000 $65 - 100,000 $100,000 or more TotalPurpose Cases 39 91 156 106 197 170 759HBW Rate 0.365 1.334 1.314 1.734 2.201 2.018 1.539
t-statistic 2.177 10.528 11.5 9.034 18.978 15.227 26.85p- value 0.036 0 0 0 0 0 0.000
HB-Shop Rate 0.342 0.282 0.434 0.614 0.524 0.723 0.461t-statistic 2.82 3.611 5.325 5.679 8.059 8.141 13.38p- value 0.008 0.001 0 0 0 0 0.000
HBO Rate 0.744 0.709 1.136 0.836 1.664 1.41 1.083t-statistic 4.085 6.205 8.167 6.957 12.741 11.554 19.76p- value 0 0 0 0 0 0 0.000
HBO-Tot Rate 1.086 0.991 1.57 1.45 2.189 2.134 1.545t-statistic 4.687 6.443 8.727 8.882 14.18 13.14 21.95p- value 0 0 0 0 0 0 0.000
HB-GrSch Rate 0.148 0.004 0.054 0.197 0.106 0.173 0.092t-statistic 1.742 0.607 2.124 2.548 3.346 3.442 5.42p- value 0.09 0.545 0.035 0.012 0.001 0.001 0.000
HB-HiSch Rate 0 0 0 0.012 0.154 0.176 0.057t-statistic . . . 1.142 3.504 3.602 4.19p- value . . . 0.256 0.001 0 0.000
HB-SchK12 Rate 0.148 0.004 0.054 0.209 0.261 0.349 0.149t-statistic 1.742 0.607 2.124 2.691 4.941 4.933 6.84p- value 0.09 0.545 0.035 0.008 0 0 0.000
HB-Univ Rate 0.156 0 0.047 0.013 0.063 0.048 0.044t-statistic 1.796 . 1.603 1.156 2.517 1.969 3.98p- value 0.08 . 0.111 0.25 0.013 0.051 0.000
HB-NHB Rate 1.078 1.462 1.364 1.997 2.307 2.187 1.729t-statistic 3.134 7.431 6.385 6.244 11.691 13.192 19.29p- value 0.003 0 0 0 0 0 0.000
IE Rate 0.06 0.103 0.139 0.058 0.191 0.247 0.139t-statistic 1.41 2.458 2.842 1.83 3.371 4.615 6.73p- value 0.167 0.016 0.005 0.07 0.001 0 0.000
Total Rate 2.893 3.938 4.518 5.496 7.235 6.985 5.171t-statistic 5.665 15.804 11.723 13.417 23.503 23.685 35.14p- value 0 0 0 0 0 0 0.000
Notes:Rate is the mean estimated household trip rate t-Statistic is Student's t-statistic measurep-value is probability that actual value is 0.0 (null hypothesis)Shaded cells are those with less than 95% confidence mean value is not 0.0
Person Trip Rates (per Household)By Vehicles per Household
0-Vehicle/HH 1-Vehicle/HH 2-Vehicle/HH 3+-Vehicle/HH TotalPurpose Cases 5 178 361 215 759HBW Rate 1.077 1.364 1.861 2.264 1.751
t-statistic 2.385 14.332 21.032 19.096 30.46p-value 0.076 0 0 0 0.000
HB-Shop Rate 1.577 0.256 0.551 1.003 0.626t-statistic 2.105 5.735 9.768 8.705 14.17p- value 0.103 0 0 0 0.000
HBO Rate 0.847 1.019 2.118 2.658 1.828t-statistic 1.994 9.318 16.938 9.479 18.79p- value 0.117 0 0 0 0.000
HBO-Tot Rate 2.423 1.275 2.669 3.661 2.454t-statistic 5.576 10.687 18.576 10.364 20.81p- value 0.005 0 0 0 0.000
HB-GrSch Rate 0 0.383 0.831 0.697 0.615t-statistic . 5.659 9.019 7.297 11.95p- value . 0 0 0 0.000
HB-HiSch Rate 0 0.007 0.128 0.456 0.156t-statistic . 0.787 4.31 6.239 6.65p- value . 0.432 0 0 0.000
HB-SchK12 Rate 0 0.39 0.959 1.153 0.771t-statistic . 5.637 9.56 9.779 13.30p- value . 0 0 0 0.000
HB-Univ Rate 0 0.052 0.001 0.14 0.047t-statistic . 2.183 0.711 3.769 4.12p- value . 0.03 0.478 0 0.000
HB-NHB Rate 1.317 1.641 2.664 3.391 2.433t-statistic 3.799 10.273 16.227 13.576 22.50p- value 0.019 0 0 0 0.000
IE Rate 0 0.059 0.294 0.293 0.205t-statistic . 2.222 6.818 4.467 7.72p- value . 0.028 0 0 0.000
Total Rate 4.817 4.794 8.558 10.949 7.721t-statistic 4.635 24.399 28.418 20.477 35.88p- value 0.01 0 0 0 0.000
Notes:Rate is the mean estimated household trip rate t-Statistic is Student's t-statistic measurep-value is probability that actual value is 0.0 (null hypothesis)Shaded cells are those with less than 95% confidence mean value is not 0.0
Vehicle Trips Rates (per household)By Vehicles per Household
0-Vehicle/HH 1-Vehicle/HH 0-Vehicle/HH 1-Vehicle/HH 2-Vehicle/HH 3+-Vehicle/HH TotalPurpose Cases 5 178 361 215 759HBW Rate 0 1.24 1.724 2.035 1.539
t-statistic . 13.491 19.86 17.097 26.85p-value . 0 0 0 0.000
HB-Shop Rate 0.23 0.226 0.475 0.821 0.461t-statistic 0.576 5.396 9.871 9.259 13.38p- value 0.595 0 0 0 0.000
HBO Rate 0.077 0.596 1.375 1.481 1.083t-statistic 0.576 7.424 15.651 13.503 19.76p- value 0.595 0 0 0 0.000
HBO-Tot Rate 0.307 0.823 1.85 2.302 1.545t-statistic 0.576 8.804 17.259 15.228 21.95p- value 0.595 0 0 0 0.000
HB-GrSch Rate 0 0.031 0.118 0.153 0.092t-statistic . 1.719 4.785 3.196 5.42p- value . 0.087 0 0.002 0.000
HB-HiSch Rate 0 0 0.02 0.221 0.057t-statistic . . 1.509 4.65 4.19p- value . . 0.132 0 0.000
HB-SchK12 Rate 0 0.031 0.138 0.373 0.149t-statistic . 1.719 4.976 5.585 6.84p- value . 0.087 0 0 0.000
HB-Univ Rate 0 0.052 0 0.13 0.044t-statistic . 2.183 . 3.611 3.98p- value . 0.03 . 0 0.000
HB-NHB Rate 0.077 1.403 1.999 2.131 1.729t-statistic 0.576 10.263 14.519 10.404 19.29p- value 0.595 0 0 0 0.000
IE Rate 0 0.045 0.164 0.259 0.139t-statistic . 1.94 5.893 4.303 6.73p- value . 0.054 0 0 0.000
Total Rate 0.383 3.603 5.908 7.272 5.171t-statistic 0.576 22.662 28.242 22.289 35.14p- value 0.595 0 0 0 0.000
Notes:Rate is the mean estimated household trip rate t-Statistic is Student's t-statistic measurep-value is probability that actual value is 0.0 (null hypothesis)Shaded cells are those with less than 95% confidence mean value is not 0.0
Person Trip Rates (per Household)By Household Income, Clustered ($2010)
Under $35,000 $35- 50,000 $50 - 100,000 $100,000 or more TotalPurpose Cases 130 156 303 170 759HBW Rate 1.173 1.791 2.242 2.237 1.751
t-statistic 10.68 16.894 22.041 16.621 30.46p- value 0 0 0 0 0.000
HB-Shop Rate 0.366 1.001 0.645 0.818 0.626t-statistic 4.333 7.795 9.984 8.129 14.17p- value 0 0 0 0 0.000
HBO Rate 1.663 1.578 2.082 2.043 1.828t-statistic 6.128 8.039 15.016 11.94 18.79p- value 0 0 0 0 0.000
HBO-Tot Rate 2.029 2.579 2.728 2.861 2.454t-statistic 6.093 10.543 17.341 13.631 20.81p- value 0 0 0 0 0.000
HB-GrSch Rate 0.328 0.569 0.742 1.146 0.615t-statistic 4.578 4.856 8.322 7.465 11.95p- value 0 0 0 0 0.000
HB-HiSch Rate 0.05 0.005 0.242 0.43 0.156t-statistic 1.815 0.881 5.107 5.459 6.65p- value 0.072 0.38 0 0 0.000
HB-SchK12 Rate 0.378 0.574 0.984 1.576 0.771t-statistic 4.932 4.877 9.798 8.83 13.30p- value 0 0 0 0 0.000
HB-Univ Rate 0.041 0.047 0.054 0.048 0.047t-statistic 1.64 1.603 2.989 1.969 4.12p- value 0.103 0.111 0.003 0.051 0.000
HB-NHB Rate 1.956 2.266 2.899 2.94 2.433t-statistic 8.767 8.907 15.042 13.532 22.50p- value 0 0 0 0 0.000
IE Rate 0.17 0.161 0.189 0.373 0.205t-statistic 2.878 2.99 4.543 5.316 7.72p- value 0.005 0.003 0 0 0.000
Total Rate 5.818 7.485 9.169 10.037 7.721t-statistic 11.467 15.518 28.426 25.04 35.88p- value 0 0 0 0 0.000
Notes:Rate is the mean estimated household trip rate t-Statistic is Student's t-statistic measurep-value is probability that actual value is 0.0 (null hypothesis)Shaded cells are those with less than 95% confidence mean value is not 0.0
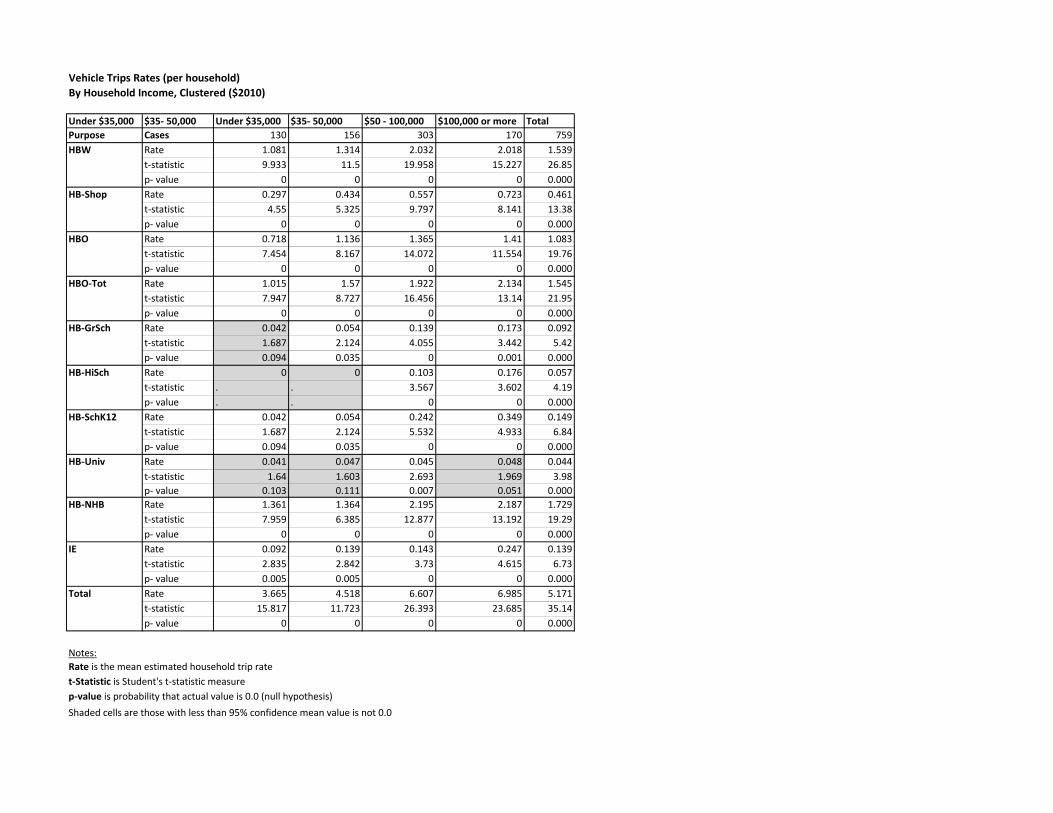
Vehicle Trips Rates (per household)By Household Income, Clustered ($2010)
Under $35,000 $35- 50,000 Under $35,000 $35- 50,000 $50 - 100,000 $100,000 or more TotalPurpose Cases 130 156 303 170 759HBW Rate 1.081 1.314 2.032 2.018 1.539
t-statistic 9.933 11.5 19.958 15.227 26.85p- value 0 0 0 0 0.000
HB-Shop Rate 0.297 0.434 0.557 0.723 0.461t-statistic 4.55 5.325 9.797 8.141 13.38p- value 0 0 0 0 0.000
HBO Rate 0.718 1.136 1.365 1.41 1.083t-statistic 7.454 8.167 14.072 11.554 19.76p- value 0 0 0 0 0.000
HBO-Tot Rate 1.015 1.57 1.922 2.134 1.545t-statistic 7.947 8.727 16.456 13.14 21.95p- value 0 0 0 0 0.000
HB-GrSch Rate 0.042 0.054 0.139 0.173 0.092t-statistic 1.687 2.124 4.055 3.442 5.42p- value 0.094 0.035 0 0.001 0.000
HB-HiSch Rate 0 0 0.103 0.176 0.057t-statistic . . 3.567 3.602 4.19p- value . . 0 0 0.000
HB-SchK12 Rate 0.042 0.054 0.242 0.349 0.149t-statistic 1.687 2.124 5.532 4.933 6.84p- value 0.094 0.035 0 0 0.000
HB-Univ Rate 0.041 0.047 0.045 0.048 0.044t-statistic 1.64 1.603 2.693 1.969 3.98p- value 0.103 0.111 0.007 0.051 0.000
HB-NHB Rate 1.361 1.364 2.195 2.187 1.729t-statistic 7.959 6.385 12.877 13.192 19.29p- value 0 0 0 0 0.000
IE Rate 0.092 0.139 0.143 0.247 0.139t-statistic 2.835 2.842 3.73 4.615 6.73p- value 0.005 0.005 0 0 0.000
Total Rate 3.665 4.518 6.607 6.985 5.171t-statistic 15.817 11.723 26.393 23.685 35.14p- value 0 0 0 0 0.000
Notes:Rate is the mean estimated household trip rate t-Statistic is Student's t-statistic measurep-value is probability that actual value is 0.0 (null hypothesis)Shaded cells are those with less than 95% confidence mean value is not 0.0
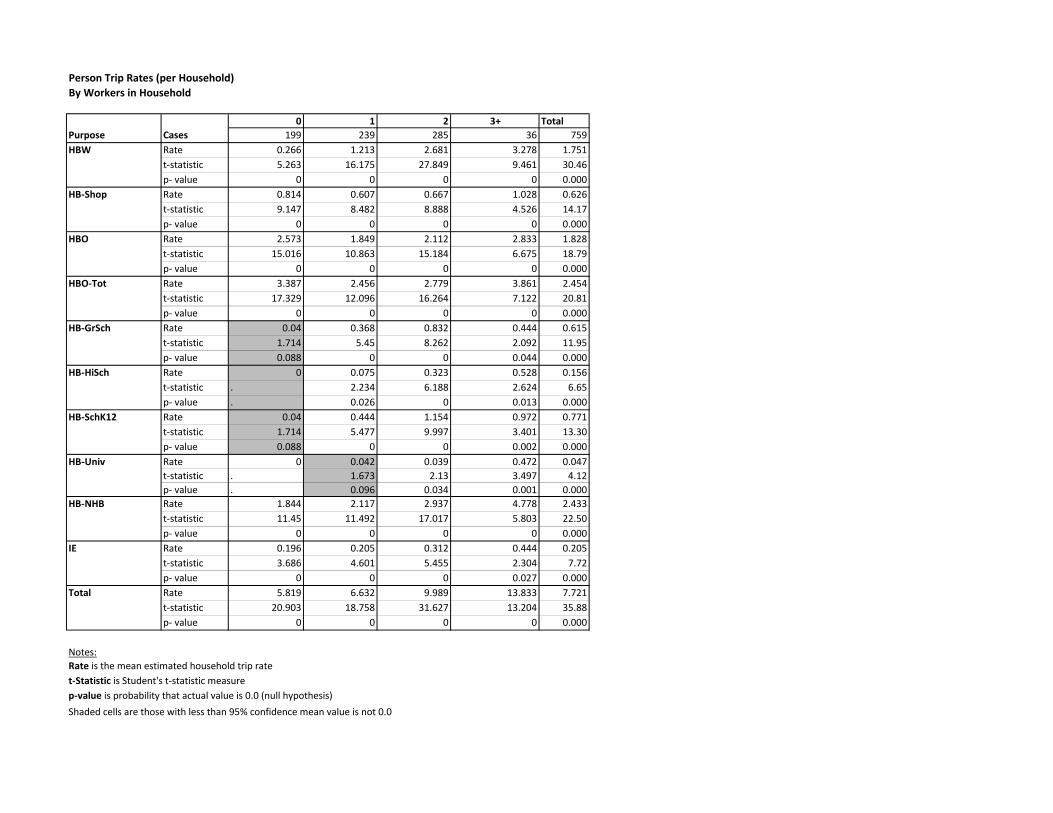
Person Trip Rates (per Household)By Workers in Household
0 1 2 3+ TotalPurpose Cases 199 239 285 36 759HBW Rate 0.266 1.213 2.681 3.278 1.751
t-statistic 5.263 16.175 27.849 9.461 30.46p- value 0 0 0 0 0.000
HB-Shop Rate 0.814 0.607 0.667 1.028 0.626t-statistic 9.147 8.482 8.888 4.526 14.17p- value 0 0 0 0 0.000
HBO Rate 2.573 1.849 2.112 2.833 1.828t-statistic 15.016 10.863 15.184 6.675 18.79p- value 0 0 0 0 0.000
HBO-Tot Rate 3.387 2.456 2.779 3.861 2.454t-statistic 17.329 12.096 16.264 7.122 20.81p- value 0 0 0 0 0.000
HB-GrSch Rate 0.04 0.368 0.832 0.444 0.615t-statistic 1.714 5.45 8.262 2.092 11.95p- value 0.088 0 0 0.044 0.000
HB-HiSch Rate 0 0.075 0.323 0.528 0.156t-statistic . 2.234 6.188 2.624 6.65p- value . 0.026 0 0.013 0.000
HB-SchK12 Rate 0.04 0.444 1.154 0.972 0.771t-statistic 1.714 5.477 9.997 3.401 13.30p- value 0.088 0 0 0.002 0.000
HB-Univ Rate 0 0.042 0.039 0.472 0.047t-statistic . 1.673 2.13 3.497 4.12p- value . 0.096 0.034 0.001 0.000
HB-NHB Rate 1.844 2.117 2.937 4.778 2.433t-statistic 11.45 11.492 17.017 5.803 22.50p- value 0 0 0 0 0.000
IE Rate 0.196 0.205 0.312 0.444 0.205t-statistic 3.686 4.601 5.455 2.304 7.72p- value 0 0 0 0.027 0.000
Total Rate 5.819 6.632 9.989 13.833 7.721t-statistic 20.903 18.758 31.627 13.204 35.88p- value 0 0 0 0 0.000
Notes:Rate is the mean estimated household trip rate t-Statistic is Student's t-statistic measurep-value is probability that actual value is 0.0 (null hypothesis)Shaded cells are those with less than 95% confidence mean value is not 0.0
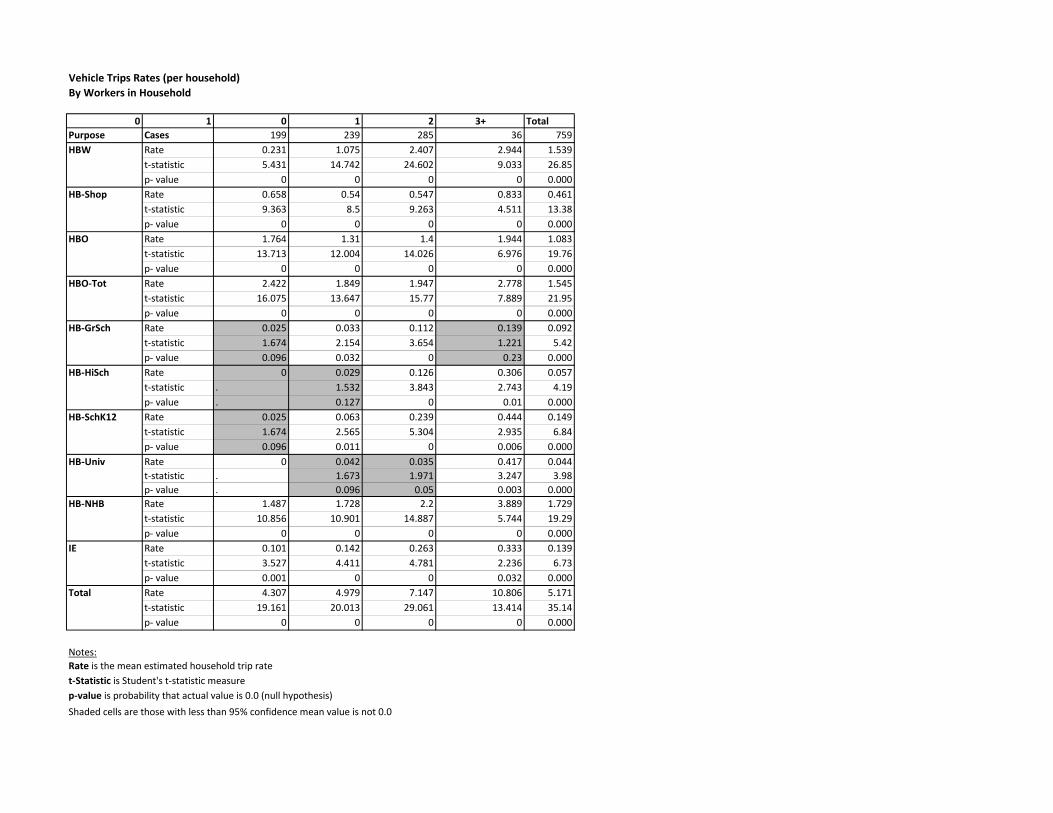
Vehicle Trips Rates (per household)By Workers in Household
0 1 0 1 2 3+ TotalPurpose Cases 199 239 285 36 759HBW Rate 0.231 1.075 2.407 2.944 1.539
t-statistic 5.431 14.742 24.602 9.033 26.85p- value 0 0 0 0 0.000
HB-Shop Rate 0.658 0.54 0.547 0.833 0.461t-statistic 9.363 8.5 9.263 4.511 13.38p- value 0 0 0 0 0.000
HBO Rate 1.764 1.31 1.4 1.944 1.083t-statistic 13.713 12.004 14.026 6.976 19.76p- value 0 0 0 0 0.000
HBO-Tot Rate 2.422 1.849 1.947 2.778 1.545t-statistic 16.075 13.647 15.77 7.889 21.95p- value 0 0 0 0 0.000
HB-GrSch Rate 0.025 0.033 0.112 0.139 0.092t-statistic 1.674 2.154 3.654 1.221 5.42p- value 0.096 0.032 0 0.23 0.000
HB-HiSch Rate 0 0.029 0.126 0.306 0.057t-statistic . 1.532 3.843 2.743 4.19p- value . 0.127 0 0.01 0.000
HB-SchK12 Rate 0.025 0.063 0.239 0.444 0.149t-statistic 1.674 2.565 5.304 2.935 6.84p- value 0.096 0.011 0 0.006 0.000
HB-Univ Rate 0 0.042 0.035 0.417 0.044t-statistic . 1.673 1.971 3.247 3.98p- value . 0.096 0.05 0.003 0.000
HB-NHB Rate 1.487 1.728 2.2 3.889 1.729t-statistic 10.856 10.901 14.887 5.744 19.29p- value 0 0 0 0 0.000
IE Rate 0.101 0.142 0.263 0.333 0.139t-statistic 3.527 4.411 4.781 2.236 6.73p- value 0.001 0 0 0.032 0.000
Total Rate 4.307 4.979 7.147 10.806 5.171t-statistic 19.161 20.013 29.061 13.414 35.14p- value 0 0 0 0 0.000
Notes:Rate is the mean estimated household trip rate t-Statistic is Student's t-statistic measurep-value is probability that actual value is 0.0 (null hypothesis)Shaded cells are those with less than 95% confidence mean value is not 0.0
To: Transportation Technical Committee (TTC) From: Wade E. Kline, Metro COG Date: July 5, 2012 Re: Consider First Half Financial and Progress for the 2012 Element of the 2011-2012
Unified Planning Work Program Please find attached the First Half Progress and Financial Report for the 2012 element of the 2011-2012 UPWP (Attachment 3a). The First Half Report is a narrative and financial summary of the actions and activities of Metro COG in relation to the 2012 element of the current UPWP through 6/30/2012. I will walk through the First Half Report in detail at the July TTC meeting. If you have questions in the interim, please don’t hesitate to contact me directly. I can submit that Metro COG is on time and on budget year to date, based on the expectations set for Metro COG by local units of government, Mn/DOT, and NDDOT. Requested Action: Recommend Policy Board approval of the First Half Financial and Progress Report of the 2012 element of the current UPWP, including the addition of $50,000 in funds to Undesignated Federal Funds (2012#Undes.), bringing the total balance of 2012#Undes. to $70,168.
Attachment 3
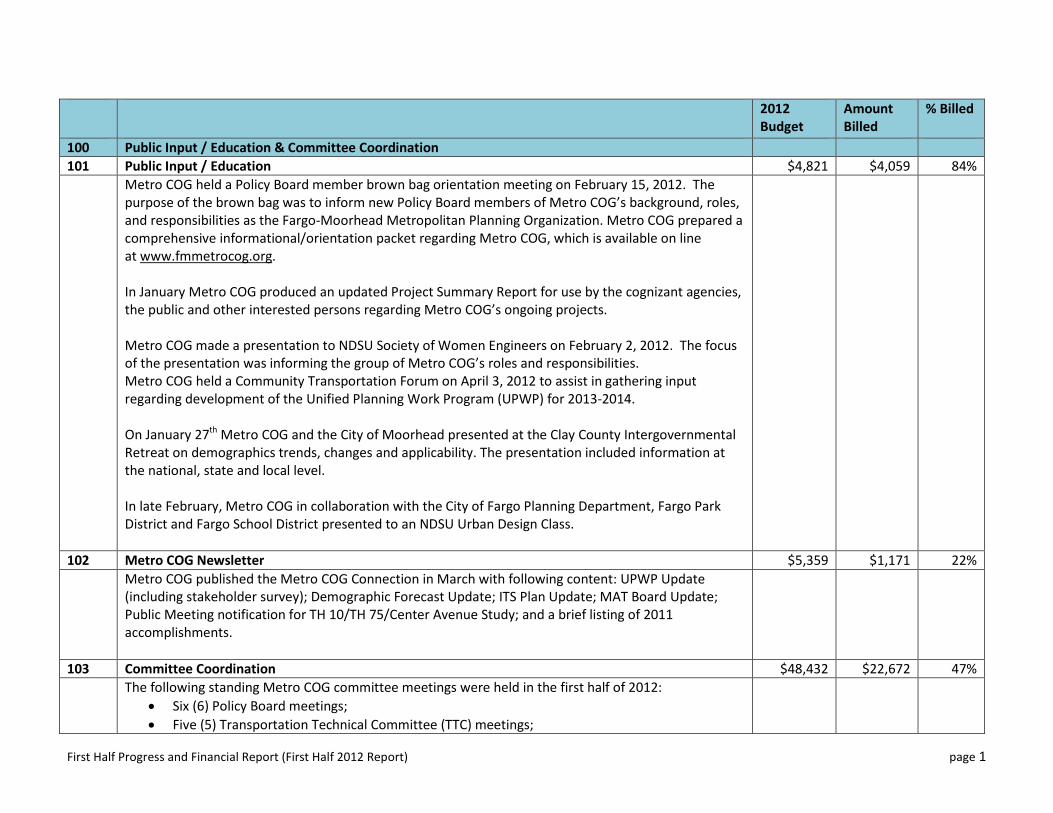
First Half Progress and Financial Report (First Half 2012 Report) page 1
2012 Budget
Amount Billed
% Billed
100 Public Input / Education & Committee Coordination 101 Public Input / Education $4,821 $4,059 84% Metro COG held a Policy Board member brown bag orientation meeting on February 15, 2012. The
purpose of the brown bag was to inform new Policy Board members of Metro COG’s background, roles, and responsibilities as the Fargo-Moorhead Metropolitan Planning Organization. Metro COG prepared a comprehensive informational/orientation packet regarding Metro COG, which is available on line at www.fmmetrocog.org. In January Metro COG produced an updated Project Summary Report for use by the cognizant agencies, the public and other interested persons regarding Metro COG’s ongoing projects. Metro COG made a presentation to NDSU Society of Women Engineers on February 2, 2012. The focus of the presentation was informing the group of Metro COG’s roles and responsibilities. Metro COG held a Community Transportation Forum on April 3, 2012 to assist in gathering input regarding development of the Unified Planning Work Program (UPWP) for 2013-2014. On January 27th Metro COG and the City of Moorhead presented at the Clay County Intergovernmental Retreat on demographics trends, changes and applicability. The presentation included information at the national, state and local level. In late February, Metro COG in collaboration with the City of Fargo Planning Department, Fargo Park District and Fargo School District presented to an NDSU Urban Design Class.
102 Metro COG Newsletter $5,359 $1,171 22% Metro COG published the Metro COG Connection in March with following content: UPWP Update
(including stakeholder survey); Demographic Forecast Update; ITS Plan Update; MAT Board Update; Public Meeting notification for TH 10/TH 75/Center Avenue Study; and a brief listing of 2011 accomplishments.
103 Committee Coordination $48,432 $22,672 47% The following standing Metro COG committee meetings were held in the first half of 2012:
• Six (6) Policy Board meetings; • Five (5) Transportation Technical Committee (TTC) meetings;
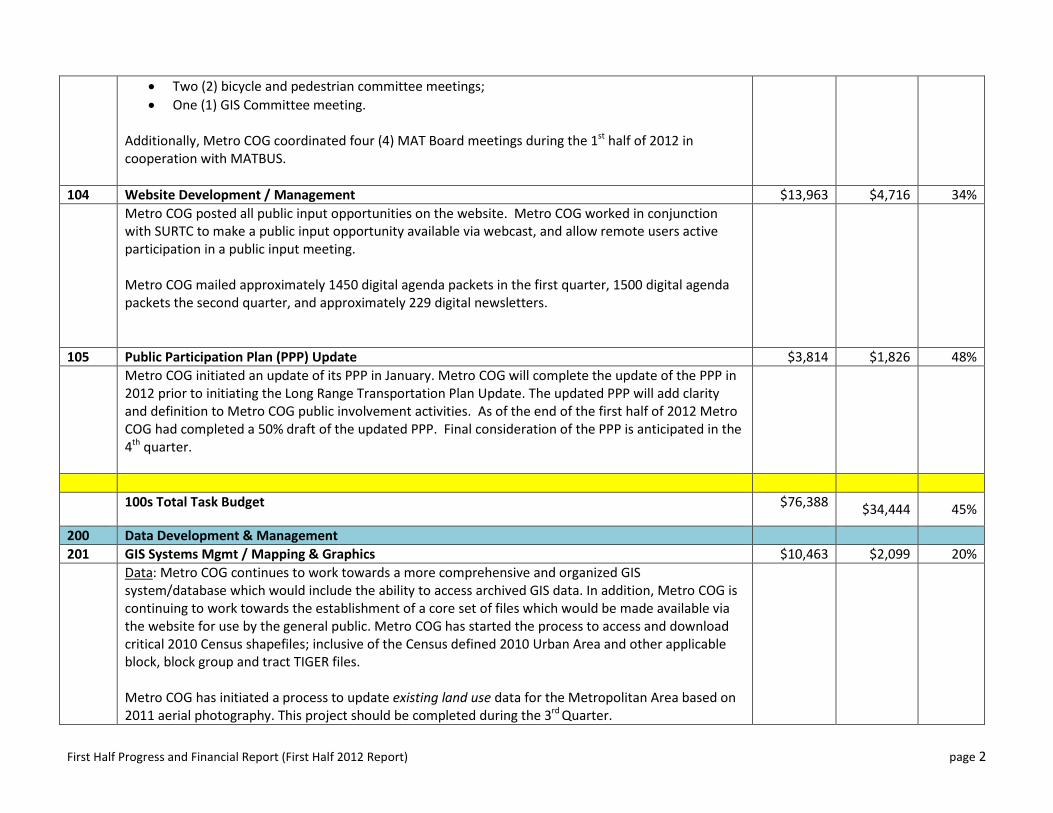
First Half Progress and Financial Report (First Half 2012 Report) page 2
• Two (2) bicycle and pedestrian committee meetings; • One (1) GIS Committee meeting.
Additionally, Metro COG coordinated four (4) MAT Board meetings during the 1st half of 2012 in cooperation with MATBUS.
104 Website Development / Management $13,963 $4,716 34% Metro COG posted all public input opportunities on the website. Metro COG worked in conjunction
with SURTC to make a public input opportunity available via webcast, and allow remote users active participation in a public input meeting. Metro COG mailed approximately 1450 digital agenda packets in the first quarter, 1500 digital agenda packets the second quarter, and approximately 229 digital newsletters.
105 Public Participation Plan (PPP) Update $3,814 $1,826 48% Metro COG initiated an update of its PPP in January. Metro COG will complete the update of the PPP in
2012 prior to initiating the Long Range Transportation Plan Update. The updated PPP will add clarity and definition to Metro COG public involvement activities. As of the end of the first half of 2012 Metro COG had completed a 50% draft of the updated PPP. Final consideration of the PPP is anticipated in the 4th quarter.
100s Total Task Budget $76,388 $34,444 45%
200 Data Development & Management 201 GIS Systems Mgmt / Mapping & Graphics $10,463 $2,099 20% Data: Metro COG continues to work towards a more comprehensive and organized GIS
system/database which would include the ability to access archived GIS data. In addition, Metro COG is continuing to work towards the establishment of a core set of files which would be made available via the website for use by the general public. Metro COG has started the process to access and download critical 2010 Census shapefiles; inclusive of the Census defined 2010 Urban Area and other applicable block, block group and tract TIGER files. Metro COG has initiated a process to update existing land use data for the Metropolitan Area based on 2011 aerial photography. This project should be completed during the 3rd Quarter.
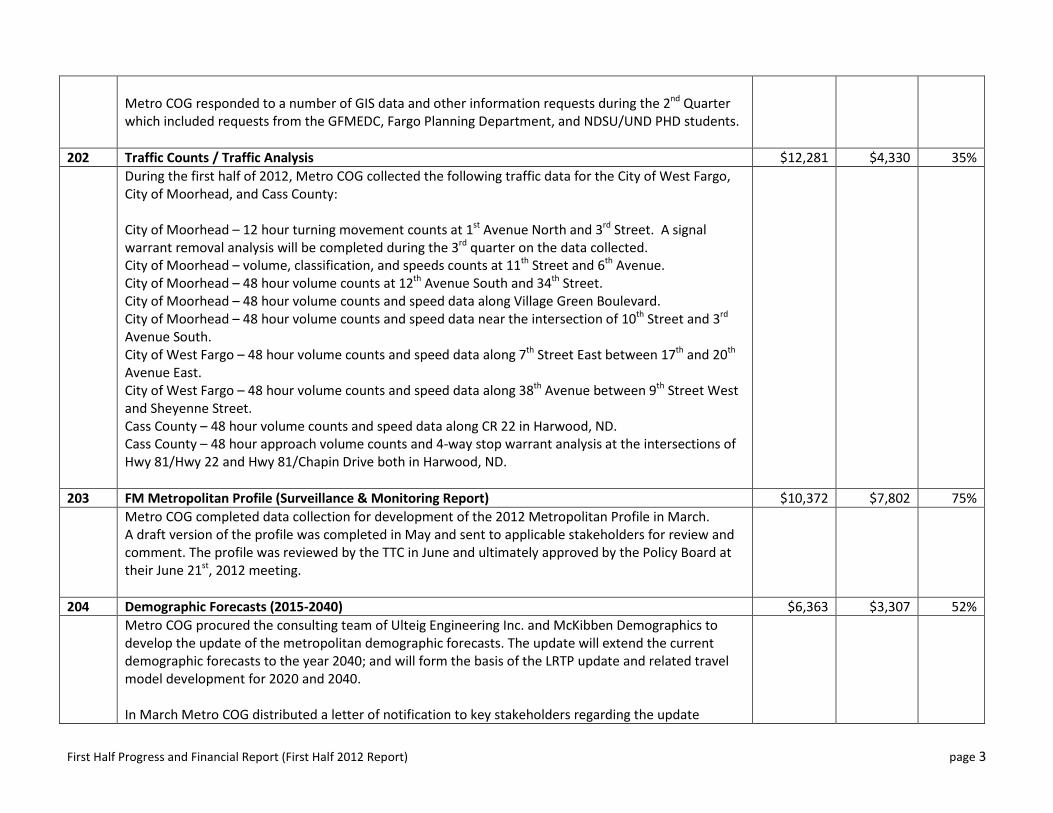
First Half Progress and Financial Report (First Half 2012 Report) page 3
Metro COG responded to a number of GIS data and other information requests during the 2nd Quarter which included requests from the GFMEDC, Fargo Planning Department, and NDSU/UND PHD students.
202 Traffic Counts / Traffic Analysis $12,281 $4,330 35% During the first half of 2012, Metro COG collected the following traffic data for the City of West Fargo,
City of Moorhead, and Cass County: City of Moorhead – 12 hour turning movement counts at 1st Avenue North and 3rd Street. A signal warrant removal analysis will be completed during the 3rd quarter on the data collected. City of Moorhead – volume, classification, and speeds counts at 11th Street and 6th Avenue. City of Moorhead – 48 hour volume counts at 12th Avenue South and 34th Street. City of Moorhead – 48 hour volume counts and speed data along Village Green Boulevard. City of Moorhead – 48 hour volume counts and speed data near the intersection of 10th Street and 3rd Avenue South. City of West Fargo – 48 hour volume counts and speed data along 7th Street East between 17th and 20th Avenue East. City of West Fargo – 48 hour volume counts and speed data along 38th Avenue between 9th Street West and Sheyenne Street. Cass County – 48 hour volume counts and speed data along CR 22 in Harwood, ND. Cass County – 48 hour approach volume counts and 4-way stop warrant analysis at the intersections of Hwy 81/Hwy 22 and Hwy 81/Chapin Drive both in Harwood, ND.
203 FM Metropolitan Profile (Surveillance & Monitoring Report) $10,372 $7,802 75% Metro COG completed data collection for development of the 2012 Metropolitan Profile in March.
A draft version of the profile was completed in May and sent to applicable stakeholders for review and comment. The profile was reviewed by the TTC in June and ultimately approved by the Policy Board at their June 21st, 2012 meeting.
204 Demographic Forecasts (2015-2040) $6,363 $3,307 52% Metro COG procured the consulting team of Ulteig Engineering Inc. and McKibben Demographics to
develop the update of the metropolitan demographic forecasts. The update will extend the current demographic forecasts to the year 2040; and will form the basis of the LRTP update and related travel model development for 2020 and 2040. In March Metro COG distributed a letter of notification to key stakeholders regarding the update
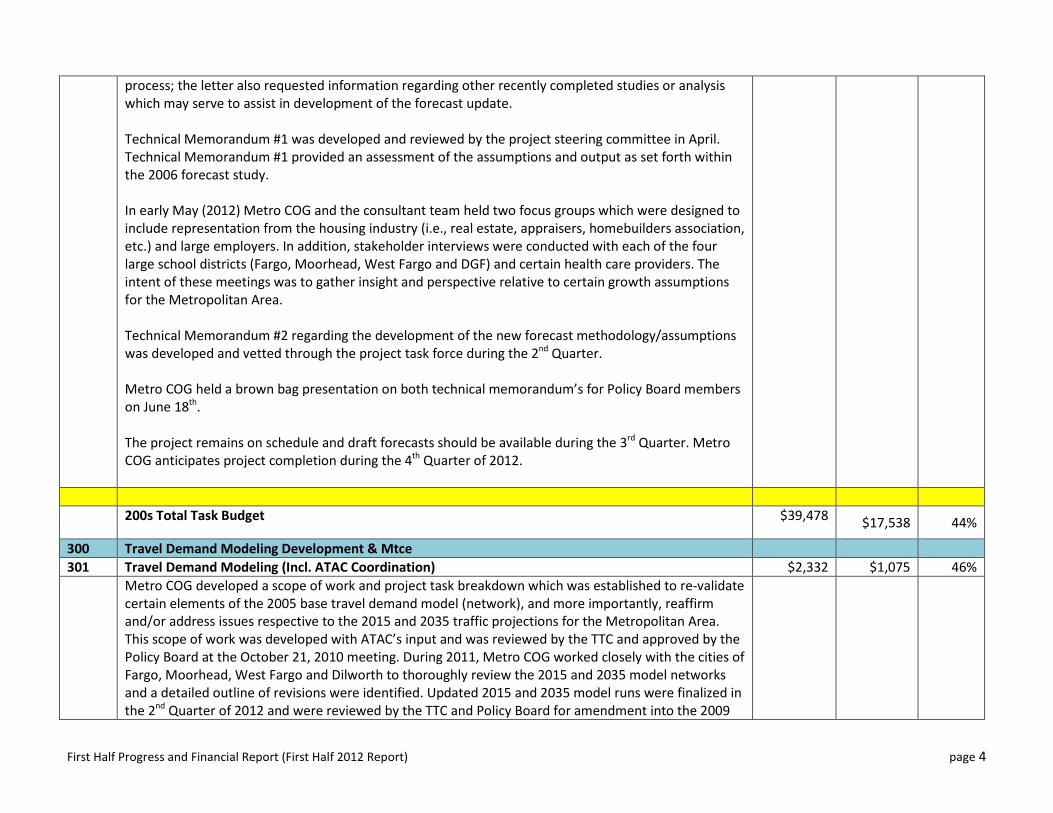
First Half Progress and Financial Report (First Half 2012 Report) page 4
process; the letter also requested information regarding other recently completed studies or analysis which may serve to assist in development of the forecast update. Technical Memorandum #1 was developed and reviewed by the project steering committee in April. Technical Memorandum #1 provided an assessment of the assumptions and output as set forth within the 2006 forecast study. In early May (2012) Metro COG and the consultant team held two focus groups which were designed to include representation from the housing industry (i.e., real estate, appraisers, homebuilders association, etc.) and large employers. In addition, stakeholder interviews were conducted with each of the four large school districts (Fargo, Moorhead, West Fargo and DGF) and certain health care providers. The intent of these meetings was to gather insight and perspective relative to certain growth assumptions for the Metropolitan Area. Technical Memorandum #2 regarding the development of the new forecast methodology/assumptions was developed and vetted through the project task force during the 2nd Quarter. Metro COG held a brown bag presentation on both technical memorandum’s for Policy Board members on June 18th. The project remains on schedule and draft forecasts should be available during the 3rd Quarter. Metro COG anticipates project completion during the 4th Quarter of 2012.
200s Total Task Budget $39,478 $17,538 44%
300 Travel Demand Modeling Development & Mtce 301 Travel Demand Modeling (Incl. ATAC Coordination) $2,332 $1,075 46% Metro COG developed a scope of work and project task breakdown which was established to re-validate
certain elements of the 2005 base travel demand model (network), and more importantly, reaffirm and/or address issues respective to the 2015 and 2035 traffic projections for the Metropolitan Area. This scope of work was developed with ATAC’s input and was reviewed by the TTC and approved by the Policy Board at the October 21, 2010 meeting. During 2011, Metro COG worked closely with the cities of Fargo, Moorhead, West Fargo and Dilworth to thoroughly review the 2015 and 2035 model networks and a detailed outline of revisions were identified. Updated 2015 and 2035 model runs were finalized in the 2nd Quarter of 2012 and were reviewed by the TTC and Policy Board for amendment into the 2009
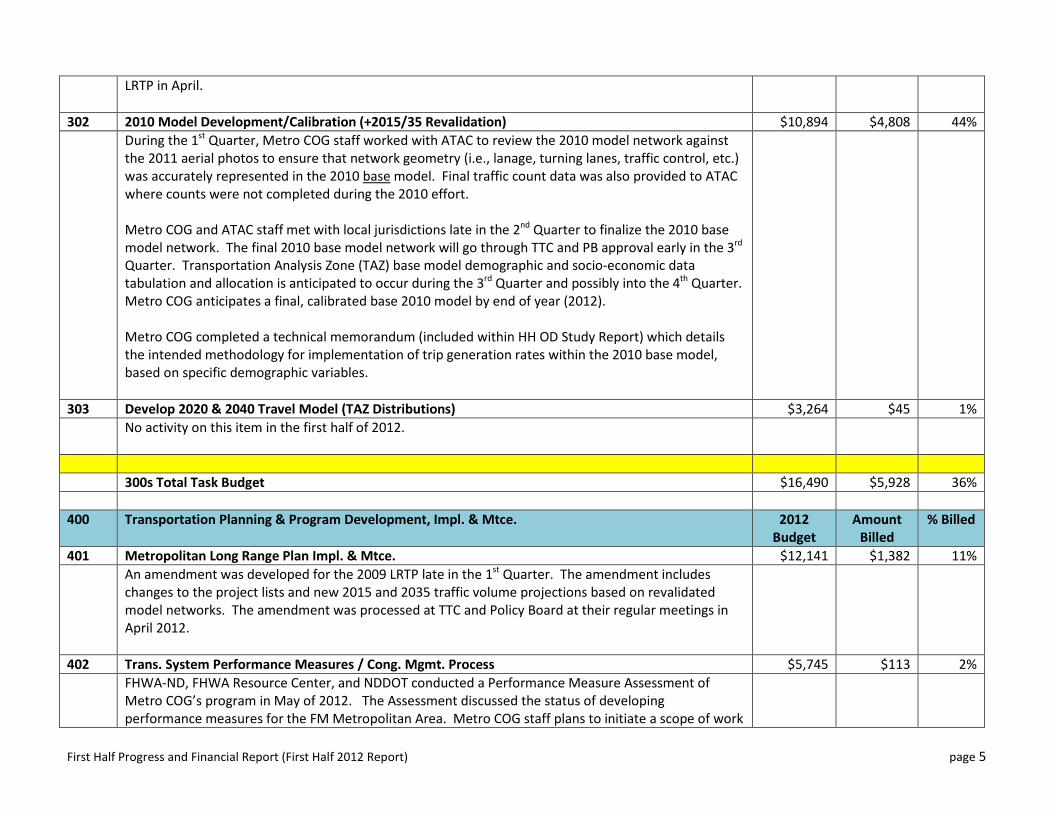
First Half Progress and Financial Report (First Half 2012 Report) page 5
LRTP in April.
302 2010 Model Development/Calibration (+2015/35 Revalidation) $10,894 $4,808 44% During the 1st Quarter, Metro COG staff worked with ATAC to review the 2010 model network against
the 2011 aerial photos to ensure that network geometry (i.e., lanage, turning lanes, traffic control, etc.) was accurately represented in the 2010 base model. Final traffic count data was also provided to ATAC where counts were not completed during the 2010 effort. Metro COG and ATAC staff met with local jurisdictions late in the 2nd Quarter to finalize the 2010 base model network. The final 2010 base model network will go through TTC and PB approval early in the 3rd Quarter. Transportation Analysis Zone (TAZ) base model demographic and socio-economic data tabulation and allocation is anticipated to occur during the 3rd Quarter and possibly into the 4th Quarter. Metro COG anticipates a final, calibrated base 2010 model by end of year (2012). Metro COG completed a technical memorandum (included within HH OD Study Report) which details the intended methodology for implementation of trip generation rates within the 2010 base model, based on specific demographic variables.
303 Develop 2020 & 2040 Travel Model (TAZ Distributions) $3,264 $45 1% No activity on this item in the first half of 2012.
300s Total Task Budget $16,490 $5,928 36% 400 Transportation Planning & Program Development, Impl. & Mtce. 2012
Budget Amount
Billed % Billed
401 Metropolitan Long Range Plan Impl. & Mtce. $12,141 $1,382 11% An amendment was developed for the 2009 LRTP late in the 1st Quarter. The amendment includes
changes to the project lists and new 2015 and 2035 traffic volume projections based on revalidated model networks. The amendment was processed at TTC and Policy Board at their regular meetings in April 2012.
402 Trans. System Performance Measures / Cong. Mgmt. Process $5,745 $113 2% FHWA-ND, FHWA Resource Center, and NDDOT conducted a Performance Measure Assessment of
Metro COG’s program in May of 2012. The Assessment discussed the status of developing performance measures for the FM Metropolitan Area. Metro COG staff plans to initiate a scope of work
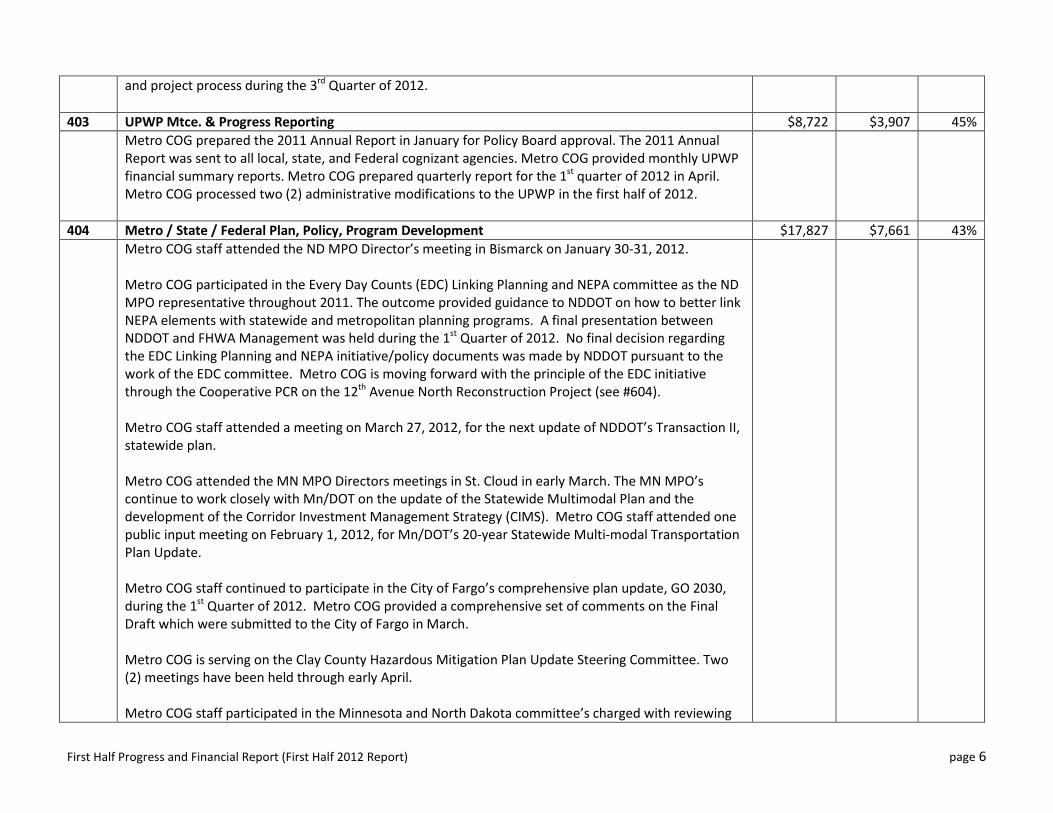
First Half Progress and Financial Report (First Half 2012 Report) page 6
and project process during the 3rd Quarter of 2012.
403 UPWP Mtce. & Progress Reporting $8,722 $3,907 45% Metro COG prepared the 2011 Annual Report in January for Policy Board approval. The 2011 Annual
Report was sent to all local, state, and Federal cognizant agencies. Metro COG provided monthly UPWP financial summary reports. Metro COG prepared quarterly report for the 1st quarter of 2012 in April. Metro COG processed two (2) administrative modifications to the UPWP in the first half of 2012.
404 Metro / State / Federal Plan, Policy, Program Development $17,827 $7,661 43% Metro COG staff attended the ND MPO Director’s meeting in Bismarck on January 30-31, 2012.
Metro COG participated in the Every Day Counts (EDC) Linking Planning and NEPA committee as the ND MPO representative throughout 2011. The outcome provided guidance to NDDOT on how to better link NEPA elements with statewide and metropolitan planning programs. A final presentation between NDDOT and FHWA Management was held during the 1st Quarter of 2012. No final decision regarding the EDC Linking Planning and NEPA initiative/policy documents was made by NDDOT pursuant to the work of the EDC committee. Metro COG is moving forward with the principle of the EDC initiative through the Cooperative PCR on the 12th Avenue North Reconstruction Project (see #604). Metro COG staff attended a meeting on March 27, 2012, for the next update of NDDOT’s Transaction II, statewide plan. Metro COG attended the MN MPO Directors meetings in St. Cloud in early March. The MN MPO’s continue to work closely with Mn/DOT on the update of the Statewide Multimodal Plan and the development of the Corridor Investment Management Strategy (CIMS). Metro COG staff attended one public input meeting on February 1, 2012, for Mn/DOT’s 20-year Statewide Multi-modal Transportation Plan Update. Metro COG staff continued to participate in the City of Fargo’s comprehensive plan update, GO 2030, during the 1st Quarter of 2012. Metro COG provided a comprehensive set of comments on the Final Draft which were submitted to the City of Fargo in March. Metro COG is serving on the Clay County Hazardous Mitigation Plan Update Steering Committee. Two (2) meetings have been held through early April. Metro COG staff participated in the Minnesota and North Dakota committee’s charged with reviewing
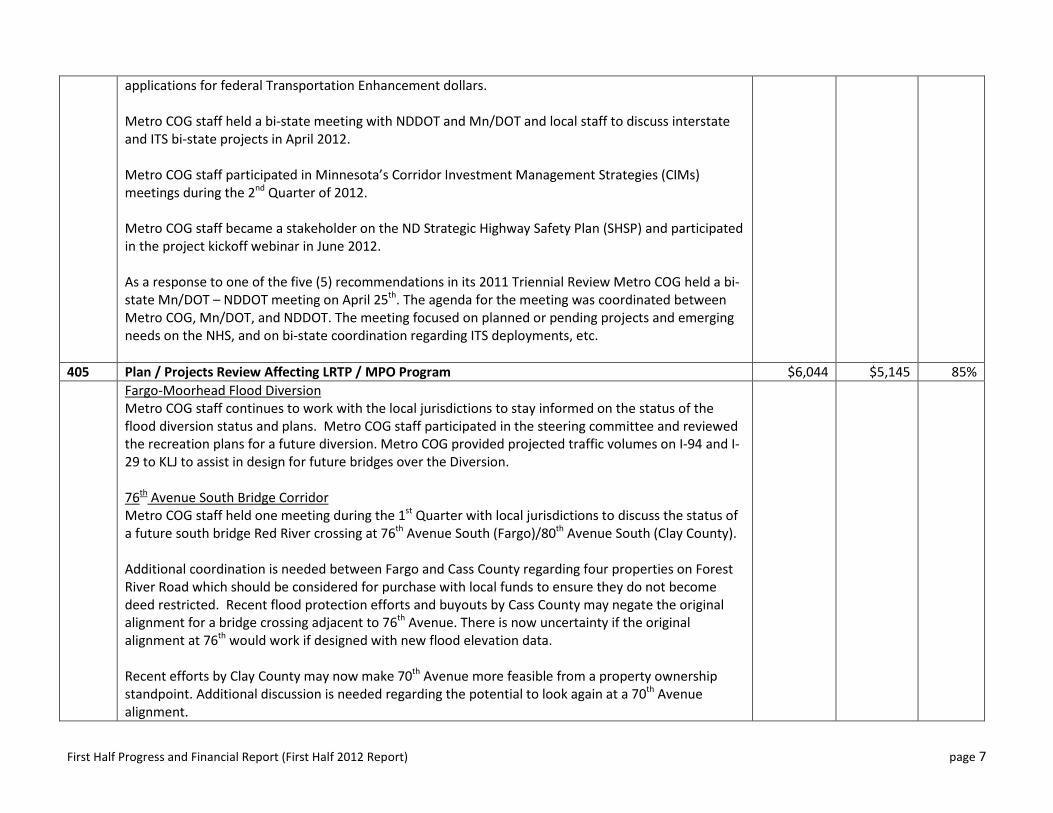
First Half Progress and Financial Report (First Half 2012 Report) page 7
applications for federal Transportation Enhancement dollars. Metro COG staff held a bi-state meeting with NDDOT and Mn/DOT and local staff to discuss interstate and ITS bi-state projects in April 2012. Metro COG staff participated in Minnesota’s Corridor Investment Management Strategies (CIMs) meetings during the 2nd Quarter of 2012. Metro COG staff became a stakeholder on the ND Strategic Highway Safety Plan (SHSP) and participated in the project kickoff webinar in June 2012. As a response to one of the five (5) recommendations in its 2011 Triennial Review Metro COG held a bi-state Mn/DOT – NDDOT meeting on April 25th. The agenda for the meeting was coordinated between Metro COG, Mn/DOT, and NDDOT. The meeting focused on planned or pending projects and emerging needs on the NHS, and on bi-state coordination regarding ITS deployments, etc.
405 Plan / Projects Review Affecting LRTP / MPO Program $6,044 $5,145 85% Fargo-Moorhead Flood Diversion
Metro COG staff continues to work with the local jurisdictions to stay informed on the status of the flood diversion status and plans. Metro COG staff participated in the steering committee and reviewed the recreation plans for a future diversion. Metro COG provided projected traffic volumes on I-94 and I-29 to KLJ to assist in design for future bridges over the Diversion. 76th Avenue South Bridge Corridor Metro COG staff held one meeting during the 1st Quarter with local jurisdictions to discuss the status of a future south bridge Red River crossing at 76th Avenue South (Fargo)/80th Avenue South (Clay County). Additional coordination is needed between Fargo and Cass County regarding four properties on Forest River Road which should be considered for purchase with local funds to ensure they do not become deed restricted. Recent flood protection efforts and buyouts by Cass County may negate the original alignment for a bridge crossing adjacent to 76th Avenue. There is now uncertainty if the original alignment at 76th would work if designed with new flood elevation data. Recent efforts by Clay County may now make 70th Avenue more feasible from a property ownership standpoint. Additional discussion is needed regarding the potential to look again at a 70th Avenue alignment.

First Half Progress and Financial Report (First Half 2012 Report) page 8
Given the amount of time which has passed since the original study, there is now a substantial gap in technical planning assumptions regarding the bridge alignment. Metro COG will continue to coordinate local discussions and guide decision making regarding the need to preserve a corridor for an additional bridge crossing south of 52nd Avenue. On its current trajectory, Metro COG would anticipate a substantial technical effort in the LRTP update (or possibly in the 2013-2014 UPWP) regarding corridor preservation for a bridge crossing(s). National Freight Planning Survey Metro COG completed a freight planning survey which is part of a national study being conducted by the University of North Carolina-Chapel Hill. The study is analyzing resources committed to freight planning and gauges the degree to which freight planning is part of the MPO program.
406 Metro. Trans. Planning Study (Func. Class, UAB. Et.al) $18,850 $974 5% Metro COG initiated this study during the 1st Quarter of 2012 which included some initial research into
existing conditions and specific research into rules/guidelines relative to urban area and roadway functional classifications. With the recent release of the 2010 census defined urban area and the need to complete a functional class update by end of year 2012, Metro COG is planning to complete these two tasks and transition other items within this project scope of work to be coordinated with the 2014 LRTP update. Work on establishing a federal-aid urban area and updated functional class network is anticipated for completion during the 3rd Quarter.
407 2013-2014 UPWP Development $8,815 $5,731 65% Metro COG staff developed a technical memorandum describing the purpose and process of the UPWP
including a preliminary list of projects to consider for each member jurisdiction. The memorandum outlines preliminary project concepts for discussion with local units of governments which was developed in coordination with locally developed CIPs, the TIP, and other planning/programming documents. Staff began meeting with jurisdiction to discuss the 2013-2014 UPWP during the end of the 1st Quarter and beginning of the 2nd Quarter. A Draft 40% 2013-2014 UPWP was completed and reviewed by TTC and Policy Board in June 2012. The bicycle-pedestrian committee will review the Draft UPWP in July 2012. A final work program will be presented to TTC and Policy Board during the 3rd Quarter and forwarded on to NDDOT and FHWA for approval.
408 LRTP Consistency Review $7,192 0%
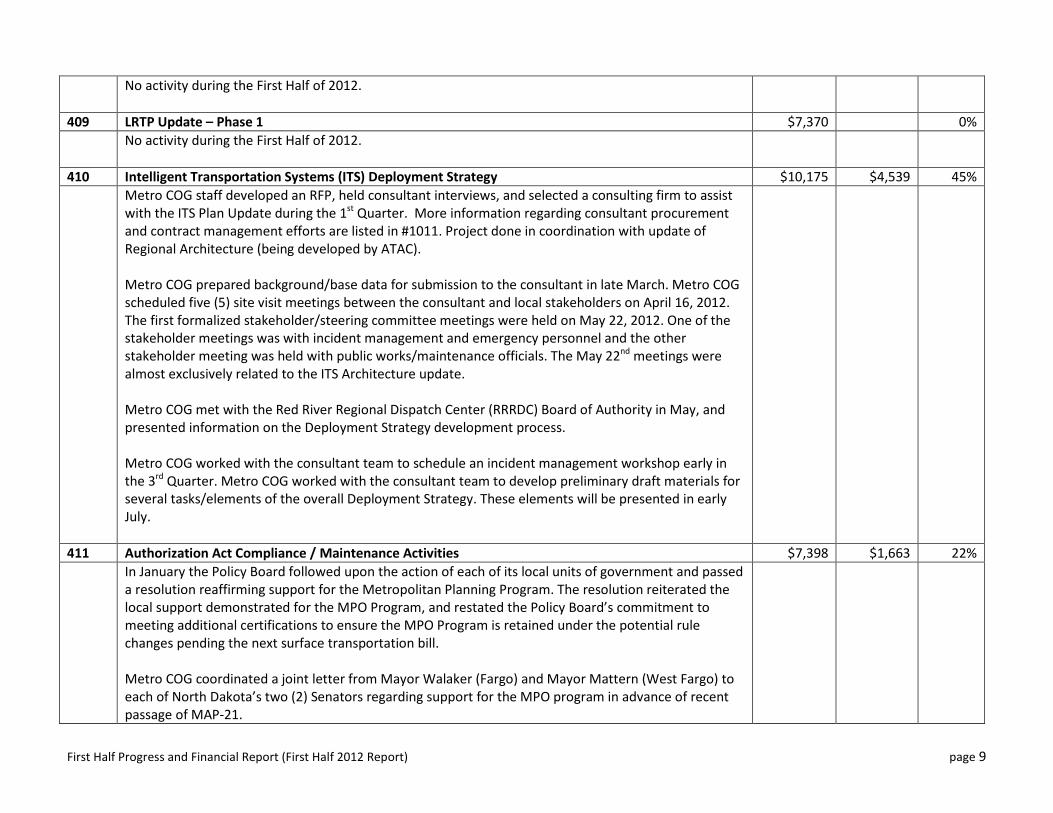
First Half Progress and Financial Report (First Half 2012 Report) page 9
No activity during the First Half of 2012.
409 LRTP Update – Phase 1 $7,370 0% No activity during the First Half of 2012.
410 Intelligent Transportation Systems (ITS) Deployment Strategy $10,175 $4,539 45% Metro COG staff developed an RFP, held consultant interviews, and selected a consulting firm to assist
with the ITS Plan Update during the 1st Quarter. More information regarding consultant procurement and contract management efforts are listed in #1011. Project done in coordination with update of Regional Architecture (being developed by ATAC). Metro COG prepared background/base data for submission to the consultant in late March. Metro COG scheduled five (5) site visit meetings between the consultant and local stakeholders on April 16, 2012. The first formalized stakeholder/steering committee meetings were held on May 22, 2012. One of the stakeholder meetings was with incident management and emergency personnel and the other stakeholder meeting was held with public works/maintenance officials. The May 22nd meetings were almost exclusively related to the ITS Architecture update. Metro COG met with the Red River Regional Dispatch Center (RRRDC) Board of Authority in May, and presented information on the Deployment Strategy development process. Metro COG worked with the consultant team to schedule an incident management workshop early in the 3rd Quarter. Metro COG worked with the consultant team to develop preliminary draft materials for several tasks/elements of the overall Deployment Strategy. These elements will be presented in early July.
411 Authorization Act Compliance / Maintenance Activities $7,398 $1,663 22% In January the Policy Board followed upon the action of each of its local units of government and passed
a resolution reaffirming support for the Metropolitan Planning Program. The resolution reiterated the local support demonstrated for the MPO Program, and restated the Policy Board’s commitment to meeting additional certifications to ensure the MPO Program is retained under the potential rule changes pending the next surface transportation bill. Metro COG coordinated a joint letter from Mayor Walaker (Fargo) and Mayor Mattern (West Fargo) to each of North Dakota’s two (2) Senators regarding support for the MPO program in advance of recent passage of MAP-21.
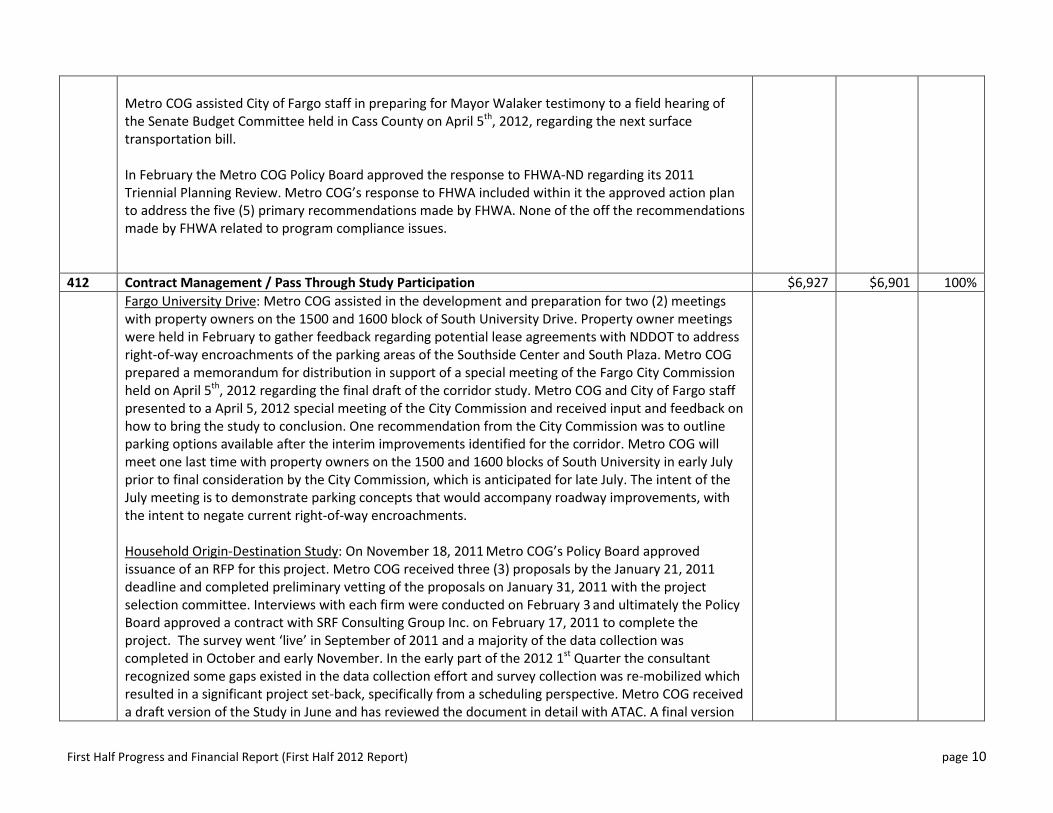
First Half Progress and Financial Report (First Half 2012 Report) page 10
Metro COG assisted City of Fargo staff in preparing for Mayor Walaker testimony to a field hearing of the Senate Budget Committee held in Cass County on April 5th, 2012, regarding the next surface transportation bill. In February the Metro COG Policy Board approved the response to FHWA-ND regarding its 2011 Triennial Planning Review. Metro COG’s response to FHWA included within it the approved action plan to address the five (5) primary recommendations made by FHWA. None of the off the recommendations made by FHWA related to program compliance issues.
412 Contract Management / Pass Through Study Participation $6,927 $6,901 100% Fargo University Drive: Metro COG assisted in the development and preparation for two (2) meetings
with property owners on the 1500 and 1600 block of South University Drive. Property owner meetings were held in February to gather feedback regarding potential lease agreements with NDDOT to address right-of-way encroachments of the parking areas of the Southside Center and South Plaza. Metro COG prepared a memorandum for distribution in support of a special meeting of the Fargo City Commission held on April 5th, 2012 regarding the final draft of the corridor study. Metro COG and City of Fargo staff presented to a April 5, 2012 special meeting of the City Commission and received input and feedback on how to bring the study to conclusion. One recommendation from the City Commission was to outline parking options available after the interim improvements identified for the corridor. Metro COG will meet one last time with property owners on the 1500 and 1600 blocks of South University in early July prior to final consideration by the City Commission, which is anticipated for late July. The intent of the July meeting is to demonstrate parking concepts that would accompany roadway improvements, with the intent to negate current right-of-way encroachments. Household Origin-Destination Study: On November 18, 2011 Metro COG’s Policy Board approved issuance of an RFP for this project. Metro COG received three (3) proposals by the January 21, 2011 deadline and completed preliminary vetting of the proposals on January 31, 2011 with the project selection committee. Interviews with each firm were conducted on February 3 and ultimately the Policy Board approved a contract with SRF Consulting Group Inc. on February 17, 2011 to complete the project. The survey went ‘live’ in September of 2011 and a majority of the data collection was completed in October and early November. In the early part of the 2012 1st Quarter the consultant recognized some gaps existed in the data collection effort and survey collection was re-mobilized which resulted in a significant project set-back, specifically from a scheduling perspective. Metro COG received a draft version of the Study in June and has reviewed the document in detail with ATAC. A final version
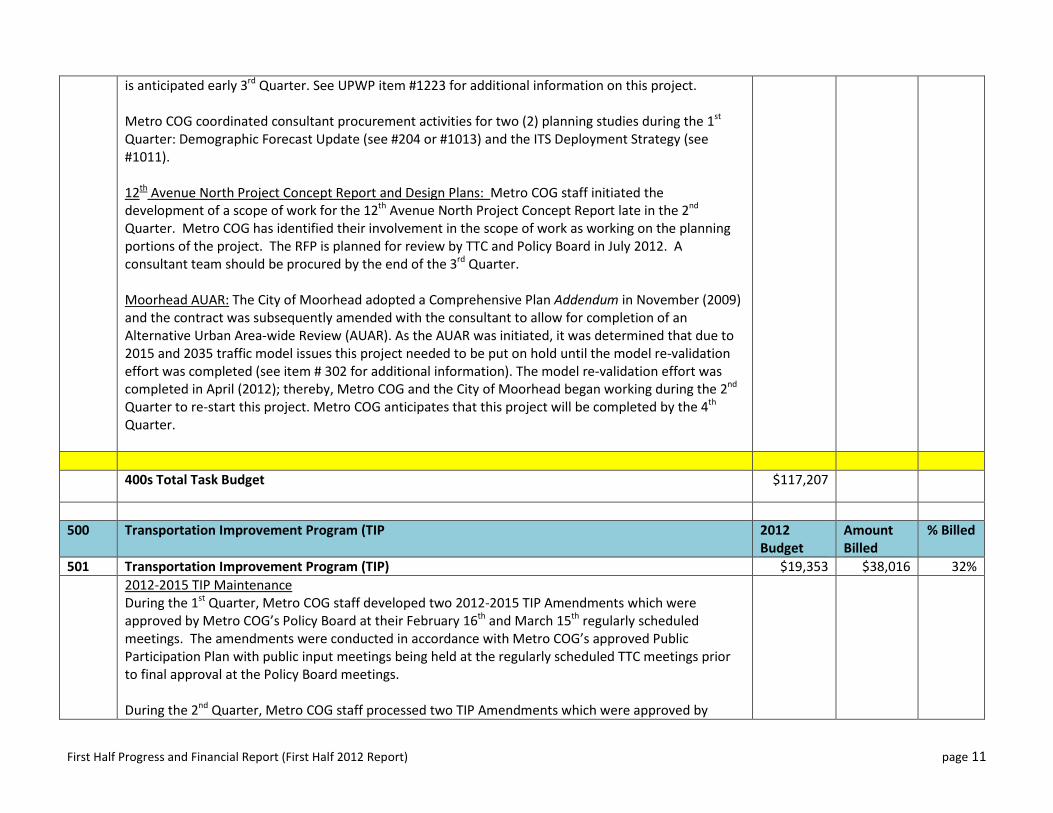
First Half Progress and Financial Report (First Half 2012 Report) page 11
is anticipated early 3rd Quarter. See UPWP item #1223 for additional information on this project. Metro COG coordinated consultant procurement activities for two (2) planning studies during the 1st Quarter: Demographic Forecast Update (see #204 or #1013) and the ITS Deployment Strategy (see #1011). 12th Avenue North Project Concept Report and Design Plans: Metro COG staff initiated the development of a scope of work for the 12th Avenue North Project Concept Report late in the 2nd Quarter. Metro COG has identified their involvement in the scope of work as working on the planning portions of the project. The RFP is planned for review by TTC and Policy Board in July 2012. A consultant team should be procured by the end of the 3rd Quarter. Moorhead AUAR: The City of Moorhead adopted a Comprehensive Plan Addendum in November (2009) and the contract was subsequently amended with the consultant to allow for completion of an Alternative Urban Area-wide Review (AUAR). As the AUAR was initiated, it was determined that due to 2015 and 2035 traffic model issues this project needed to be put on hold until the model re-validation effort was completed (see item # 302 for additional information). The model re-validation effort was completed in April (2012); thereby, Metro COG and the City of Moorhead began working during the 2nd Quarter to re-start this project. Metro COG anticipates that this project will be completed by the 4th Quarter.
400s Total Task Budget $117,207
500 Transportation Improvement Program (TIP 2012
Budget Amount Billed
% Billed
501 Transportation Improvement Program (TIP) $19,353 $38,016 32% 2012-2015 TIP Maintenance
During the 1st Quarter, Metro COG staff developed two 2012-2015 TIP Amendments which were approved by Metro COG’s Policy Board at their February 16th and March 15th regularly scheduled meetings. The amendments were conducted in accordance with Metro COG’s approved Public Participation Plan with public input meetings being held at the regularly scheduled TTC meetings prior to final approval at the Policy Board meetings. During the 2nd Quarter, Metro COG staff processed two TIP Amendments which were approved by
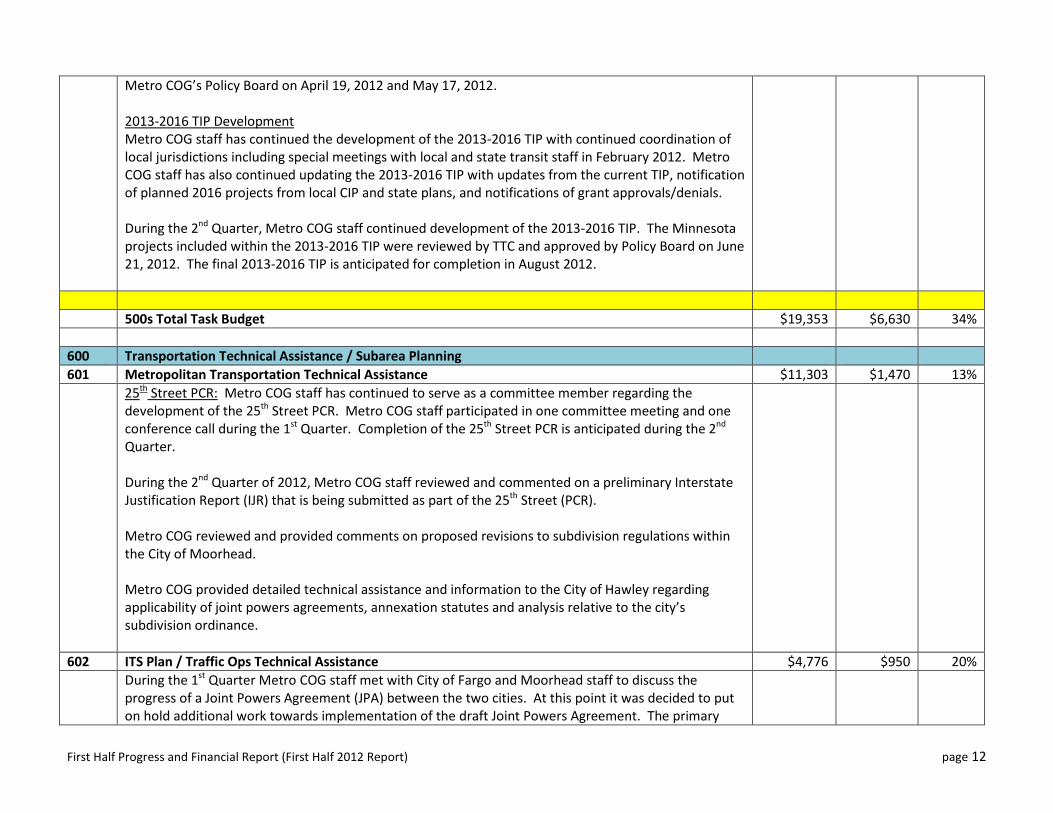
First Half Progress and Financial Report (First Half 2012 Report) page 12
Metro COG’s Policy Board on April 19, 2012 and May 17, 2012. 2013-2016 TIP Development Metro COG staff has continued the development of the 2013-2016 TIP with continued coordination of local jurisdictions including special meetings with local and state transit staff in February 2012. Metro COG staff has also continued updating the 2013-2016 TIP with updates from the current TIP, notification of planned 2016 projects from local CIP and state plans, and notifications of grant approvals/denials. During the 2nd Quarter, Metro COG staff continued development of the 2013-2016 TIP. The Minnesota projects included within the 2013-2016 TIP were reviewed by TTC and approved by Policy Board on June 21, 2012. The final 2013-2016 TIP is anticipated for completion in August 2012.
500s Total Task Budget $19,353 $6,630 34% 600 Transportation Technical Assistance / Subarea Planning 601 Metropolitan Transportation Technical Assistance $11,303 $1,470 13% 25th Street PCR: Metro COG staff has continued to serve as a committee member regarding the
development of the 25th Street PCR. Metro COG staff participated in one committee meeting and one conference call during the 1st Quarter. Completion of the 25th Street PCR is anticipated during the 2nd Quarter. During the 2nd Quarter of 2012, Metro COG staff reviewed and commented on a preliminary Interstate Justification Report (IJR) that is being submitted as part of the 25th Street (PCR). Metro COG reviewed and provided comments on proposed revisions to subdivision regulations within the City of Moorhead. Metro COG provided detailed technical assistance and information to the City of Hawley regarding applicability of joint powers agreements, annexation statutes and analysis relative to the city’s subdivision ordinance.
602 ITS Plan / Traffic Ops Technical Assistance $4,776 $950 20% During the 1st Quarter Metro COG staff met with City of Fargo and Moorhead staff to discuss the
progress of a Joint Powers Agreement (JPA) between the two cities. At this point it was decided to put on hold additional work towards implementation of the draft Joint Powers Agreement. The primary
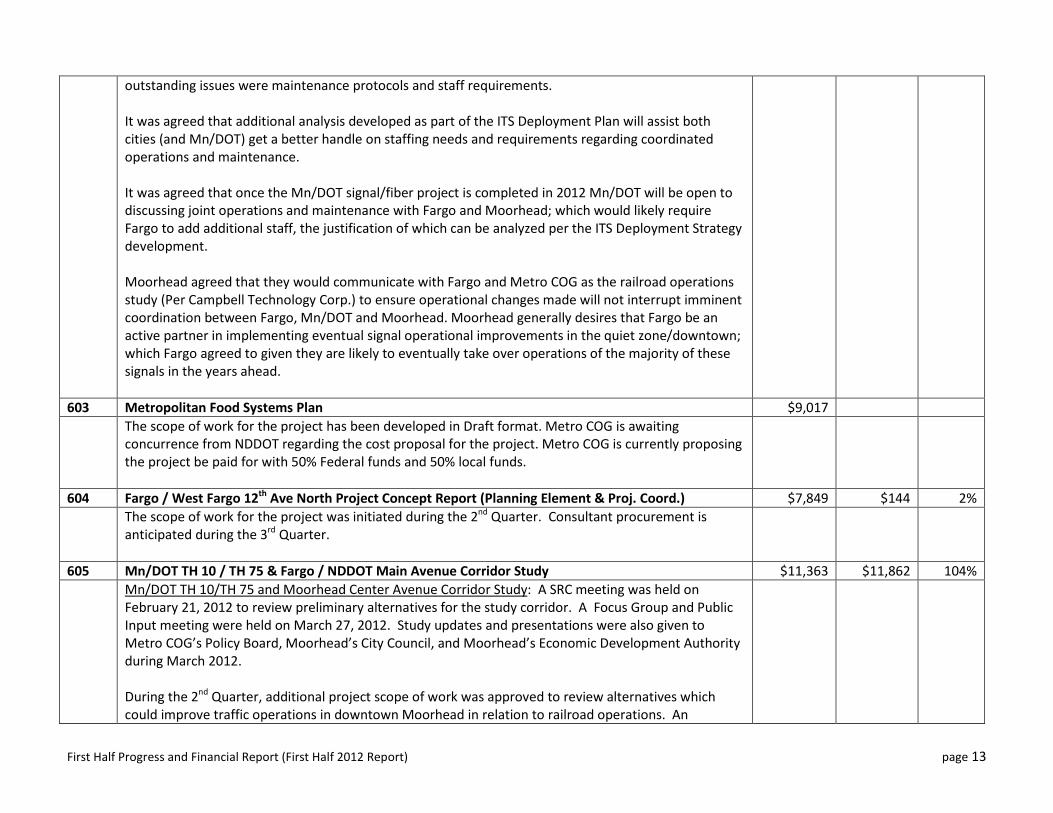
First Half Progress and Financial Report (First Half 2012 Report) page 13
outstanding issues were maintenance protocols and staff requirements. It was agreed that additional analysis developed as part of the ITS Deployment Plan will assist both cities (and Mn/DOT) get a better handle on staffing needs and requirements regarding coordinated operations and maintenance. It was agreed that once the Mn/DOT signal/fiber project is completed in 2012 Mn/DOT will be open to discussing joint operations and maintenance with Fargo and Moorhead; which would likely require Fargo to add additional staff, the justification of which can be analyzed per the ITS Deployment Strategy development. Moorhead agreed that they would communicate with Fargo and Metro COG as the railroad operations study (Per Campbell Technology Corp.) to ensure operational changes made will not interrupt imminent coordination between Fargo, Mn/DOT and Moorhead. Moorhead generally desires that Fargo be an active partner in implementing eventual signal operational improvements in the quiet zone/downtown; which Fargo agreed to given they are likely to eventually take over operations of the majority of these signals in the years ahead.
603 Metropolitan Food Systems Plan $9,017 The scope of work for the project has been developed in Draft format. Metro COG is awaiting
concurrence from NDDOT regarding the cost proposal for the project. Metro COG is currently proposing the project be paid for with 50% Federal funds and 50% local funds.
604 Fargo / West Fargo 12th Ave North Project Concept Report (Planning Element & Proj. Coord.) $7,849 $144 2% The scope of work for the project was initiated during the 2nd Quarter. Consultant procurement is
anticipated during the 3rd Quarter.
605 Mn/DOT TH 10 / TH 75 & Fargo / NDDOT Main Avenue Corridor Study $11,363 $11,862 104% Mn/DOT TH 10/TH 75 and Moorhead Center Avenue Corridor Study: A SRC meeting was held on
February 21, 2012 to review preliminary alternatives for the study corridor. A Focus Group and Public Input meeting were held on March 27, 2012. Study updates and presentations were also given to Metro COG’s Policy Board, Moorhead’s City Council, and Moorhead’s Economic Development Authority during March 2012. During the 2nd Quarter, additional project scope of work was approved to review alternatives which could improve traffic operations in downtown Moorhead in relation to railroad operations. An
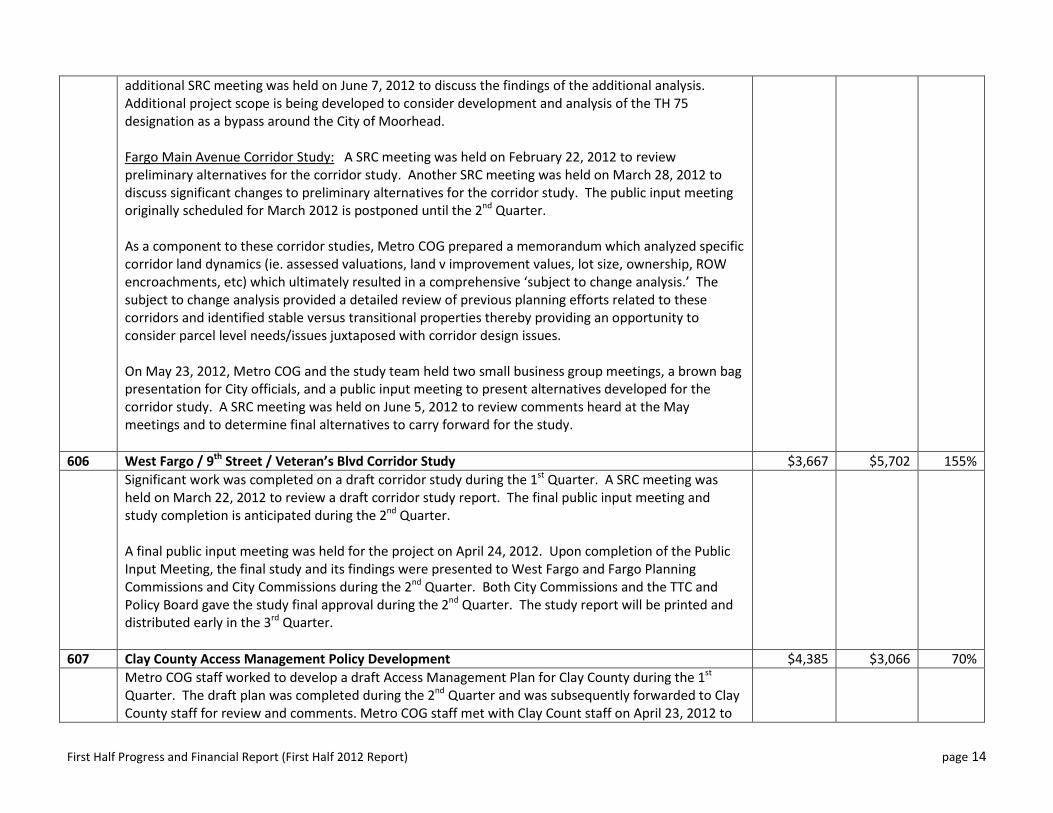
First Half Progress and Financial Report (First Half 2012 Report) page 14
additional SRC meeting was held on June 7, 2012 to discuss the findings of the additional analysis. Additional project scope is being developed to consider development and analysis of the TH 75 designation as a bypass around the City of Moorhead. Fargo Main Avenue Corridor Study: A SRC meeting was held on February 22, 2012 to review preliminary alternatives for the corridor study. Another SRC meeting was held on March 28, 2012 to discuss significant changes to preliminary alternatives for the corridor study. The public input meeting originally scheduled for March 2012 is postponed until the 2nd Quarter. As a component to these corridor studies, Metro COG prepared a memorandum which analyzed specific corridor land dynamics (ie. assessed valuations, land v improvement values, lot size, ownership, ROW encroachments, etc) which ultimately resulted in a comprehensive ‘subject to change analysis.’ The subject to change analysis provided a detailed review of previous planning efforts related to these corridors and identified stable versus transitional properties thereby providing an opportunity to consider parcel level needs/issues juxtaposed with corridor design issues. On May 23, 2012, Metro COG and the study team held two small business group meetings, a brown bag presentation for City officials, and a public input meeting to present alternatives developed for the corridor study. A SRC meeting was held on June 5, 2012 to review comments heard at the May meetings and to determine final alternatives to carry forward for the study.
606 West Fargo / 9th Street / Veteran’s Blvd Corridor Study $3,667 $5,702 155% Significant work was completed on a draft corridor study during the 1st Quarter. A SRC meeting was
held on March 22, 2012 to review a draft corridor study report. The final public input meeting and study completion is anticipated during the 2nd Quarter. A final public input meeting was held for the project on April 24, 2012. Upon completion of the Public Input Meeting, the final study and its findings were presented to West Fargo and Fargo Planning Commissions and City Commissions during the 2nd Quarter. Both City Commissions and the TTC and Policy Board gave the study final approval during the 2nd Quarter. The study report will be printed and distributed early in the 3rd Quarter.
607 Clay County Access Management Policy Development $4,385 $3,066 70% Metro COG staff worked to develop a draft Access Management Plan for Clay County during the 1st
Quarter. The draft plan was completed during the 2nd Quarter and was subsequently forwarded to Clay County staff for review and comments. Metro COG staff met with Clay Count staff on April 23, 2012 to
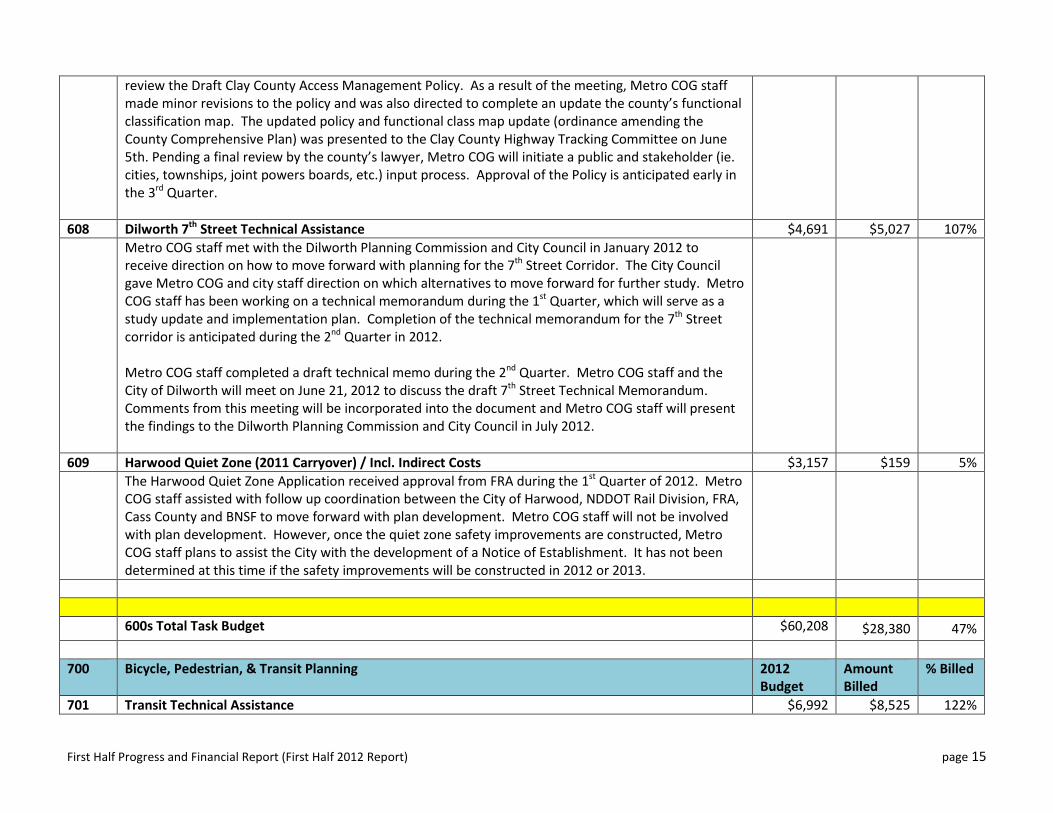
First Half Progress and Financial Report (First Half 2012 Report) page 15
review the Draft Clay County Access Management Policy. As a result of the meeting, Metro COG staff made minor revisions to the policy and was also directed to complete an update the county’s functional classification map. The updated policy and functional class map update (ordinance amending the County Comprehensive Plan) was presented to the Clay County Highway Tracking Committee on June 5th. Pending a final review by the county’s lawyer, Metro COG will initiate a public and stakeholder (ie. cities, townships, joint powers boards, etc.) input process. Approval of the Policy is anticipated early in the 3rd Quarter.
608 Dilworth 7th Street Technical Assistance $4,691 $5,027 107% Metro COG staff met with the Dilworth Planning Commission and City Council in January 2012 to
receive direction on how to move forward with planning for the 7th Street Corridor. The City Council gave Metro COG and city staff direction on which alternatives to move forward for further study. Metro COG staff has been working on a technical memorandum during the 1st Quarter, which will serve as a study update and implementation plan. Completion of the technical memorandum for the 7th Street corridor is anticipated during the 2nd Quarter in 2012. Metro COG staff completed a draft technical memo during the 2nd Quarter. Metro COG staff and the City of Dilworth will meet on June 21, 2012 to discuss the draft 7th Street Technical Memorandum. Comments from this meeting will be incorporated into the document and Metro COG staff will present the findings to the Dilworth Planning Commission and City Council in July 2012.
609 Harwood Quiet Zone (2011 Carryover) / Incl. Indirect Costs $3,157 $159 5% The Harwood Quiet Zone Application received approval from FRA during the 1st Quarter of 2012. Metro
COG staff assisted with follow up coordination between the City of Harwood, NDDOT Rail Division, FRA, Cass County and BNSF to move forward with plan development. Metro COG staff will not be involved with plan development. However, once the quiet zone safety improvements are constructed, Metro COG staff plans to assist the City with the development of a Notice of Establishment. It has not been determined at this time if the safety improvements will be constructed in 2012 or 2013.
600s Total Task Budget $60,208 $28,380 47% 700 Bicycle, Pedestrian, & Transit Planning 2012
Budget Amount Billed
% Billed
701 Transit Technical Assistance $6,992 $8,525 122%
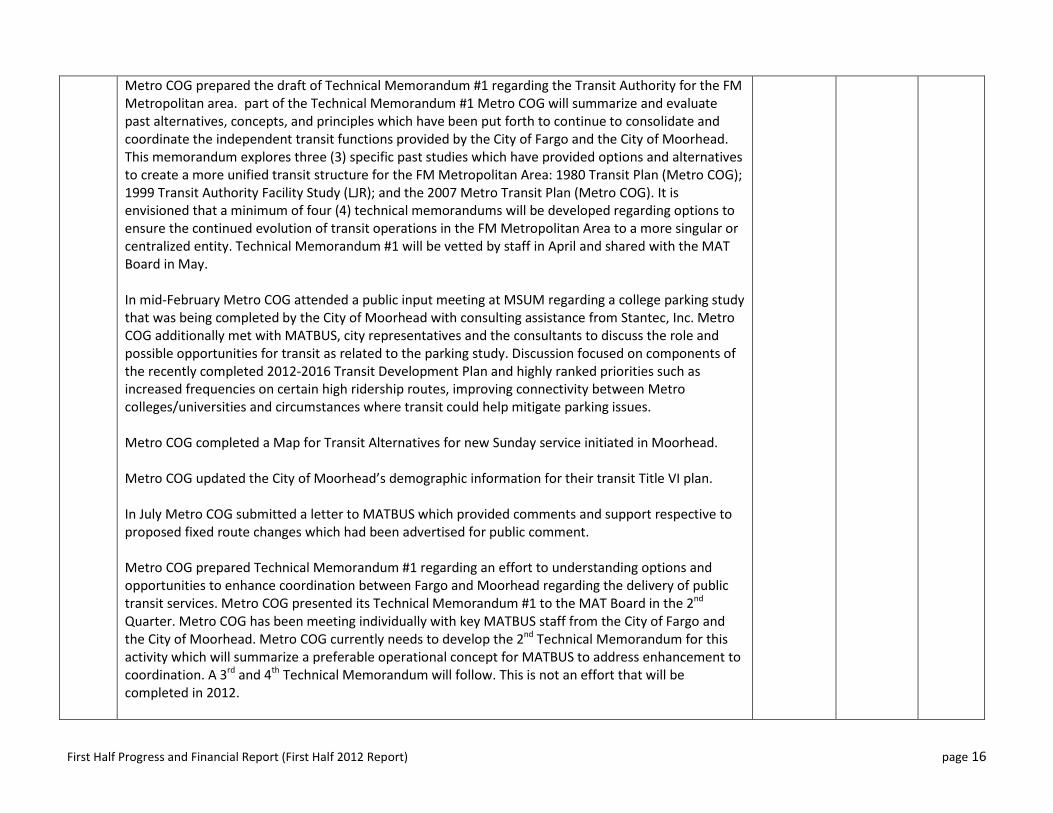
First Half Progress and Financial Report (First Half 2012 Report) page 16
Metro COG prepared the draft of Technical Memorandum #1 regarding the Transit Authority for the FM Metropolitan area. part of the Technical Memorandum #1 Metro COG will summarize and evaluate past alternatives, concepts, and principles which have been put forth to continue to consolidate and coordinate the independent transit functions provided by the City of Fargo and the City of Moorhead. This memorandum explores three (3) specific past studies which have provided options and alternatives to create a more unified transit structure for the FM Metropolitan Area: 1980 Transit Plan (Metro COG); 1999 Transit Authority Facility Study (LJR); and the 2007 Metro Transit Plan (Metro COG). It is envisioned that a minimum of four (4) technical memorandums will be developed regarding options to ensure the continued evolution of transit operations in the FM Metropolitan Area to a more singular or centralized entity. Technical Memorandum #1 will be vetted by staff in April and shared with the MAT Board in May. In mid-February Metro COG attended a public input meeting at MSUM regarding a college parking study that was being completed by the City of Moorhead with consulting assistance from Stantec, Inc. Metro COG additionally met with MATBUS, city representatives and the consultants to discuss the role and possible opportunities for transit as related to the parking study. Discussion focused on components of the recently completed 2012-2016 Transit Development Plan and highly ranked priorities such as increased frequencies on certain high ridership routes, improving connectivity between Metro colleges/universities and circumstances where transit could help mitigate parking issues. Metro COG completed a Map for Transit Alternatives for new Sunday service initiated in Moorhead. Metro COG updated the City of Moorhead’s demographic information for their transit Title VI plan. In July Metro COG submitted a letter to MATBUS which provided comments and support respective to proposed fixed route changes which had been advertised for public comment. Metro COG prepared Technical Memorandum #1 regarding an effort to understanding options and opportunities to enhance coordination between Fargo and Moorhead regarding the delivery of public transit services. Metro COG presented its Technical Memorandum #1 to the MAT Board in the 2nd Quarter. Metro COG has been meeting individually with key MATBUS staff from the City of Fargo and the City of Moorhead. Metro COG currently needs to develop the 2nd Technical Memorandum for this activity which will summarize a preferable operational concept for MATBUS to address enhancement to coordination. A 3rd and 4th Technical Memorandum will follow. This is not an effort that will be completed in 2012.
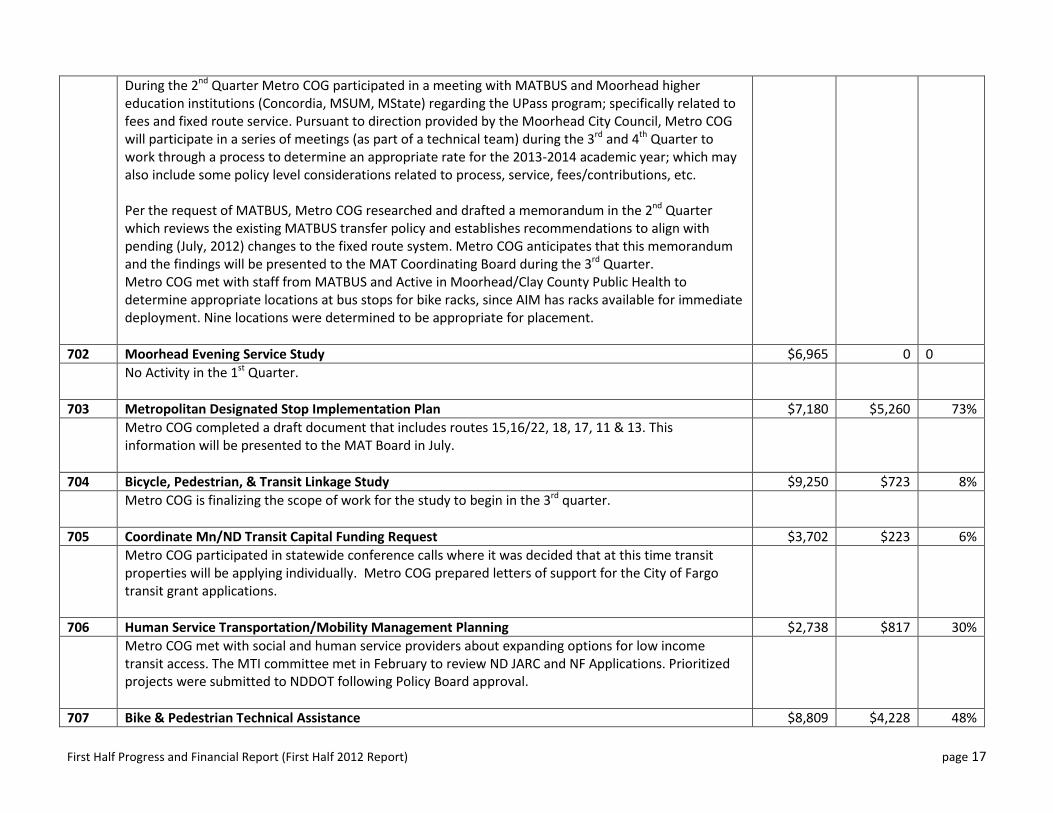
First Half Progress and Financial Report (First Half 2012 Report) page 17
During the 2nd Quarter Metro COG participated in a meeting with MATBUS and Moorhead higher education institutions (Concordia, MSUM, MState) regarding the UPass program; specifically related to fees and fixed route service. Pursuant to direction provided by the Moorhead City Council, Metro COG will participate in a series of meetings (as part of a technical team) during the 3rd and 4th Quarter to work through a process to determine an appropriate rate for the 2013-2014 academic year; which may also include some policy level considerations related to process, service, fees/contributions, etc. Per the request of MATBUS, Metro COG researched and drafted a memorandum in the 2nd Quarter which reviews the existing MATBUS transfer policy and establishes recommendations to align with pending (July, 2012) changes to the fixed route system. Metro COG anticipates that this memorandum and the findings will be presented to the MAT Coordinating Board during the 3rd Quarter. Metro COG met with staff from MATBUS and Active in Moorhead/Clay County Public Health to determine appropriate locations at bus stops for bike racks, since AIM has racks available for immediate deployment. Nine locations were determined to be appropriate for placement.
702 Moorhead Evening Service Study $6,965 0 0 No Activity in the 1st Quarter.
703 Metropolitan Designated Stop Implementation Plan $7,180 $5,260 73% Metro COG completed a draft document that includes routes 15,16/22, 18, 17, 11 & 13. This
information will be presented to the MAT Board in July.
704 Bicycle, Pedestrian, & Transit Linkage Study $9,250 $723 8% Metro COG is finalizing the scope of work for the study to begin in the 3rd quarter.
705 Coordinate Mn/ND Transit Capital Funding Request $3,702 $223 6% Metro COG participated in statewide conference calls where it was decided that at this time transit
properties will be applying individually. Metro COG prepared letters of support for the City of Fargo transit grant applications.
706 Human Service Transportation/Mobility Management Planning $2,738 $817 30% Metro COG met with social and human service providers about expanding options for low income
transit access. The MTI committee met in February to review ND JARC and NF Applications. Prioritized projects were submitted to NDDOT following Policy Board approval.
707 Bike & Pedestrian Technical Assistance $8,809 $4,228 48%

First Half Progress and Financial Report (First Half 2012 Report) page 18
Metro COG staff provided assistance to the City of Fargo to review and develop additional public input opportunities regarding the recommendations from the NDSU Bicycle and Pedestrian Study which was completed in 2010. Metro COG staff attended meetings with local jurisdiction agencies to discuss education and encouragement opportunities and the eventual creation of a regional clearinghouse for that kind of information. Metro COG staff attended two public input meetings during the 2nd Quarter on April 3, 2012 and April 9, 2012 regarding alternative bicycle routes for the NDSU main campus to downtown connection. Metro COG staff assisted the City of Fargo in June 2012 with collecting and reviewing crash data for downtown Fargo, particularly on the 10th Street and University Drive corridors.
708 Moorhead River Lot Utilization Study $8,535 $653 8% Metro COG has worked with the City of Moorhead to develop a draft scope of work for the River
Corridor Study. Metro COG will seek City of Moorhead approval of the scope of work in July.
709 Active Living / Healthy Community Initiative Participation $799 $187 23% Metro COG attended meetings which provided updates in active living across the region.
710 Metropolitan Bike Summit $3,407 $1,346 40% Metro COG is working with a subcommittee on the development and implementation of the bike
summit. Several pieces of key planning information were determined (name: Folks ‘n Spokes, the Red River Valley Bike Summit, date: September 15, 2012 with some events on September 14, location: Fargo South High School, keynote speaker: Dorian Grilley of Bike MN). A schedule of events has been created to address education and encouragement issues with the goal of bringing all bicycle users to the next level of the bicycling comfort level and skill. Metro COG has retained an unpaid intern to handle marketing materials and content for the event.
711 Metropolitan Bikeway Map Update $2,413 $2,432 101% Metro COG’s new intern used his extensive GIS and Adobe Suite knowledge to create the 2012
Metropolitan Bikeways Map. Further information about the bicycle network was provided by local jurisdictions to create a map current as of December 2011. Bicycle education information was added as well. The Metropolitan Bicycle and Pedestrian Committee reviewed the map at its March 8 meeting and approved its design, with some minor changes. Pending approval by the Policy Board on April 19, 5,000
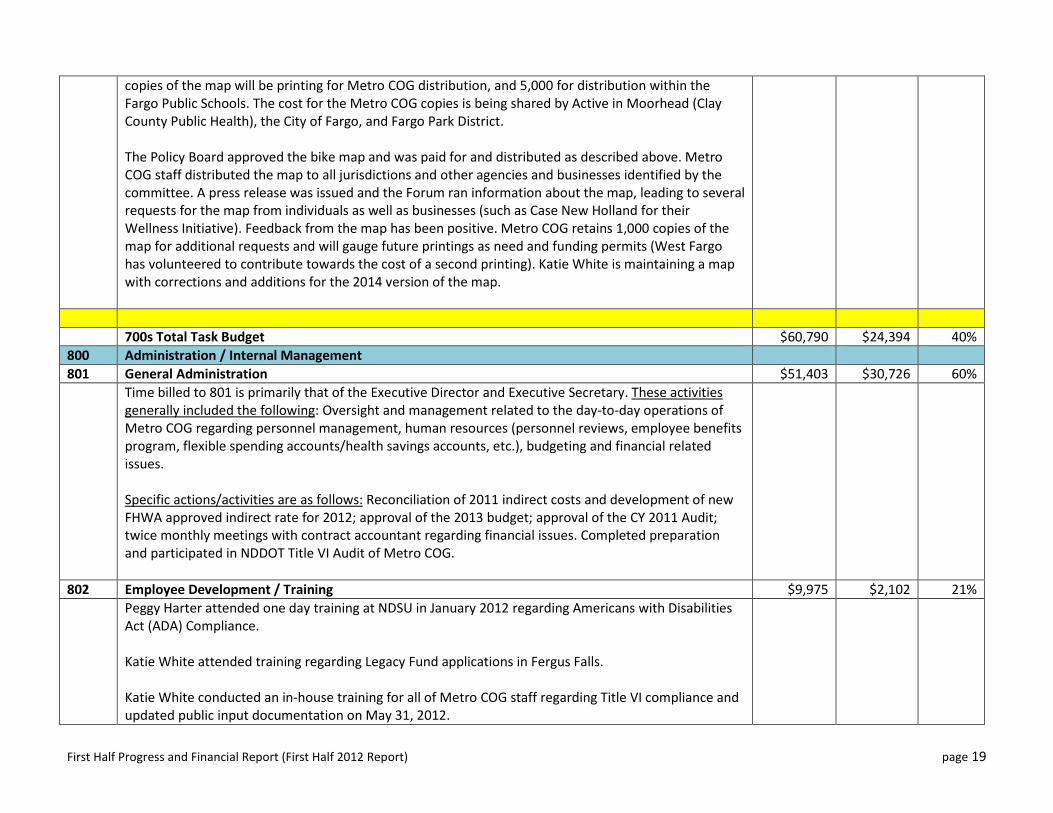
First Half Progress and Financial Report (First Half 2012 Report) page 19
copies of the map will be printing for Metro COG distribution, and 5,000 for distribution within the Fargo Public Schools. The cost for the Metro COG copies is being shared by Active in Moorhead (Clay County Public Health), the City of Fargo, and Fargo Park District. The Policy Board approved the bike map and was paid for and distributed as described above. Metro COG staff distributed the map to all jurisdictions and other agencies and businesses identified by the committee. A press release was issued and the Forum ran information about the map, leading to several requests for the map from individuals as well as businesses (such as Case New Holland for their Wellness Initiative). Feedback from the map has been positive. Metro COG retains 1,000 copies of the map for additional requests and will gauge future printings as need and funding permits (West Fargo has volunteered to contribute towards the cost of a second printing). Katie White is maintaining a map with corrections and additions for the 2014 version of the map.
700s Total Task Budget $60,790 $24,394 40% 800 Administration / Internal Management 801 General Administration $51,403 $30,726 60% Time billed to 801 is primarily that of the Executive Director and Executive Secretary. These activities
generally included the following: Oversight and management related to the day-to-day operations of Metro COG regarding personnel management, human resources (personnel reviews, employee benefits program, flexible spending accounts/health savings accounts, etc.), budgeting and financial related issues. Specific actions/activities are as follows: Reconciliation of 2011 indirect costs and development of new FHWA approved indirect rate for 2012; approval of the 2013 budget; approval of the CY 2011 Audit; twice monthly meetings with contract accountant regarding financial issues. Completed preparation and participated in NDDOT Title VI Audit of Metro COG.
802 Employee Development / Training $9,975 $2,102 21% Peggy Harter attended one day training at NDSU in January 2012 regarding Americans with Disabilities
Act (ADA) Compliance. Katie White attended training regarding Legacy Fund applications in Fergus Falls. Katie White conducted an in-house training for all of Metro COG staff regarding Title VI compliance and updated public input documentation on May 31, 2012.

First Half Progress and Financial Report (First Half 2012 Report) page 20
Metro COG staff participated in a webinar on April 27th which featured a panel of FHWA, FTA and Census Bureau staff regarding new Urban Area Boundaries and their interplay with federal planning requirements. In the 3rd and 4th Quarters Metro COG will be utilizing the census defined urban area boundary to establish the adjusted or federal-aid urban area for the Fargo-Moorhead Metropolitan Area.
803 Information Technology (IT) Mtce / Management $11,139 $5,764 52% Hours billed to 803 relate to day-to-day and ongoing maintenance of Metro COG’s information
technology assets. These hours are almost exclusively billed by the Planner who is responsible for Metro COG Information Technology/Information Systems management.
804 Intern Labor $8,000 $1,876 23% Metro COG currently has an intern on staff. Hours not directly attributable to specific projects are billed
to 804.
800s Total Task Budget $80,517 $40,468 50% 900 Overhead & Capital Expenditures 2012
Budget Amount Billed
% Billed
900 Overhead & Capital Expenditures (federal eligible) $100,850 $1,861 2%
900a Travel / Registration $12,500 1,726 14% 900b Vacant $0 900c Dues / Subscriptions $2,850 983 34% 900d Office Supplies $5,000 1,079 22% 900e Postage $5,250 2,673 51% 900f Advertising / Newsletter $5,150 1,991 39% 900g Office Rent $32,750 16,464 50% 900h Insurance $4,000 4,792 120% 900i Telephone $4,200 1,398 33% 900j Network Support (Software) $2,500 2,315 93% 900k Audit $5,000 4,200 84%
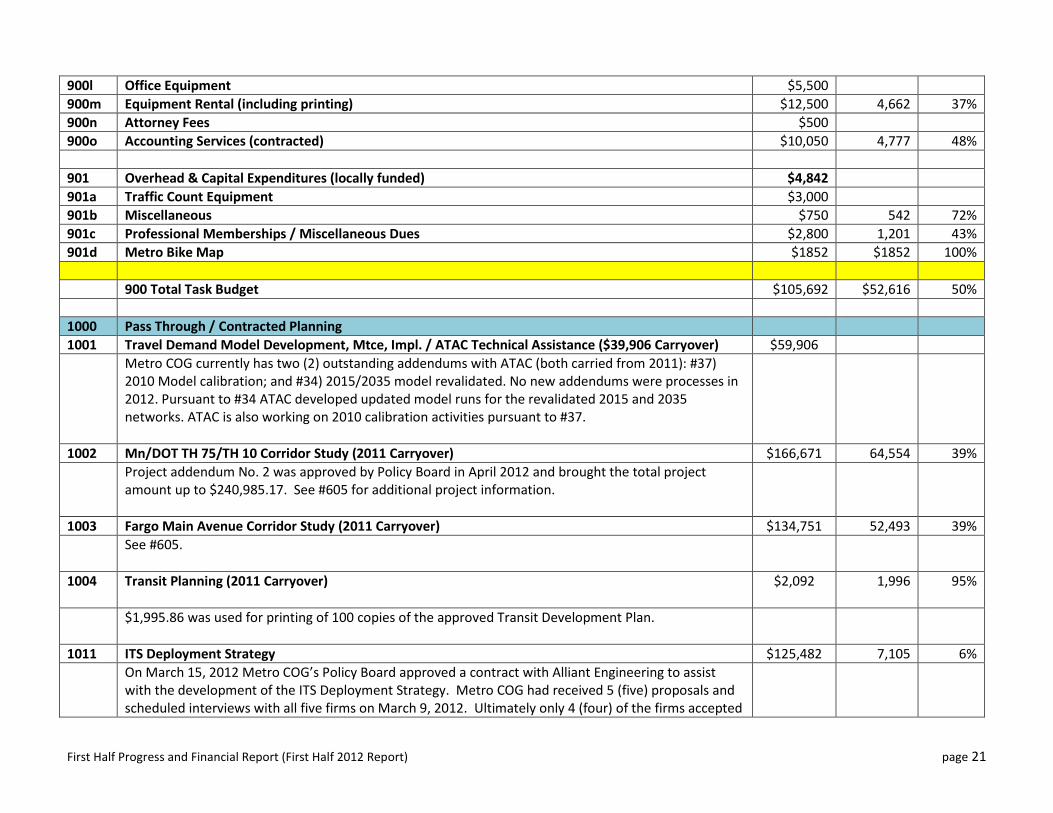
First Half Progress and Financial Report (First Half 2012 Report) page 21
900l Office Equipment $5,500 900m Equipment Rental (including printing) $12,500 4,662 37% 900n Attorney Fees $500 900o Accounting Services (contracted) $10,050 4,777 48% 901 Overhead & Capital Expenditures (locally funded) $4,842 901a Traffic Count Equipment $3,000 901b Miscellaneous $750 542 72% 901c Professional Memberships / Miscellaneous Dues $2,800 1,201 43% 901d Metro Bike Map $1852 $1852 100% 900 Total Task Budget $105,692 $52,616 50% 1000 Pass Through / Contracted Planning 1001 Travel Demand Model Development, Mtce, Impl. / ATAC Technical Assistance ($39,906 Carryover) $59,906 Metro COG currently has two (2) outstanding addendums with ATAC (both carried from 2011): #37)
2010 Model calibration; and #34) 2015/2035 model revalidated. No new addendums were processes in 2012. Pursuant to #34 ATAC developed updated model runs for the revalidated 2015 and 2035 networks. ATAC is also working on 2010 calibration activities pursuant to #37.
1002 Mn/DOT TH 75/TH 10 Corridor Study (2011 Carryover) $166,671 64,554 39% Project addendum No. 2 was approved by Policy Board in April 2012 and brought the total project
amount up to $240,985.17. See #605 for additional project information.
1003 Fargo Main Avenue Corridor Study (2011 Carryover) $134,751 52,493 39% See #605.
1004 Transit Planning (2011 Carryover) $2,092 1,996
95%
$1,995.86 was used for printing of 100 copies of the approved Transit Development Plan.
1011 ITS Deployment Strategy $125,482 7,105 6% On March 15, 2012 Metro COG’s Policy Board approved a contract with Alliant Engineering to assist
with the development of the ITS Deployment Strategy. Metro COG had received 5 (five) proposals and scheduled interviews with all five firms on March 9, 2012. Ultimately only 4 (four) of the firms accepted
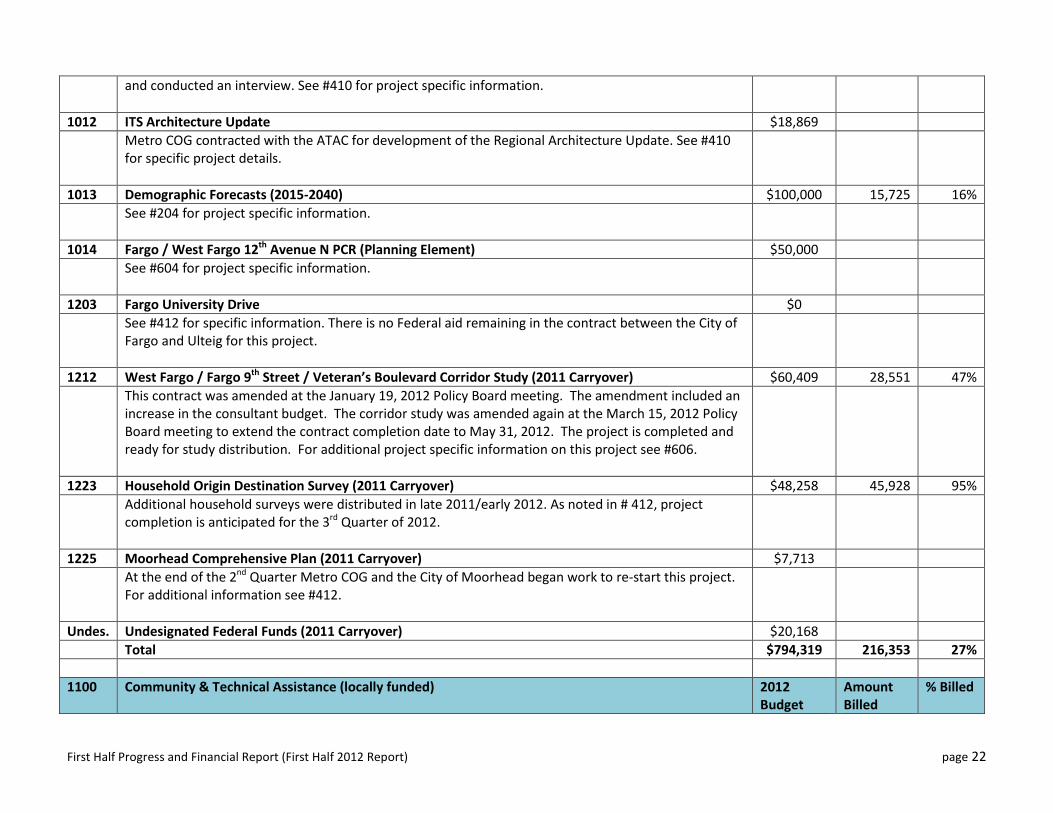
First Half Progress and Financial Report (First Half 2012 Report) page 22
and conducted an interview. See #410 for project specific information.
1012 ITS Architecture Update $18,869 Metro COG contracted with the ATAC for development of the Regional Architecture Update. See #410
for specific project details.
1013 Demographic Forecasts (2015-2040) $100,000 15,725 16% See #204 for project specific information.
1014 Fargo / West Fargo 12th Avenue N PCR (Planning Element) $50,000 See #604 for project specific information.
1203 Fargo University Drive $0 See #412 for specific information. There is no Federal aid remaining in the contract between the City of
Fargo and Ulteig for this project.
1212 West Fargo / Fargo 9th Street / Veteran’s Boulevard Corridor Study (2011 Carryover) $60,409 28,551 47% This contract was amended at the January 19, 2012 Policy Board meeting. The amendment included an
increase in the consultant budget. The corridor study was amended again at the March 15, 2012 Policy Board meeting to extend the contract completion date to May 31, 2012. The project is completed and ready for study distribution. For additional project specific information on this project see #606.
1223 Household Origin Destination Survey (2011 Carryover) $48,258 45,928 95% Additional household surveys were distributed in late 2011/early 2012. As noted in # 412, project
completion is anticipated for the 3rd Quarter of 2012.
1225 Moorhead Comprehensive Plan (2011 Carryover) $7,713 At the end of the 2nd Quarter Metro COG and the City of Moorhead began work to re-start this project.
For additional information see #412.
Undes. Undesignated Federal Funds (2011 Carryover) $20,168 Total $794,319 216,353 27% 1100 Community & Technical Assistance (locally funded) 2012
Budget Amount Billed
% Billed
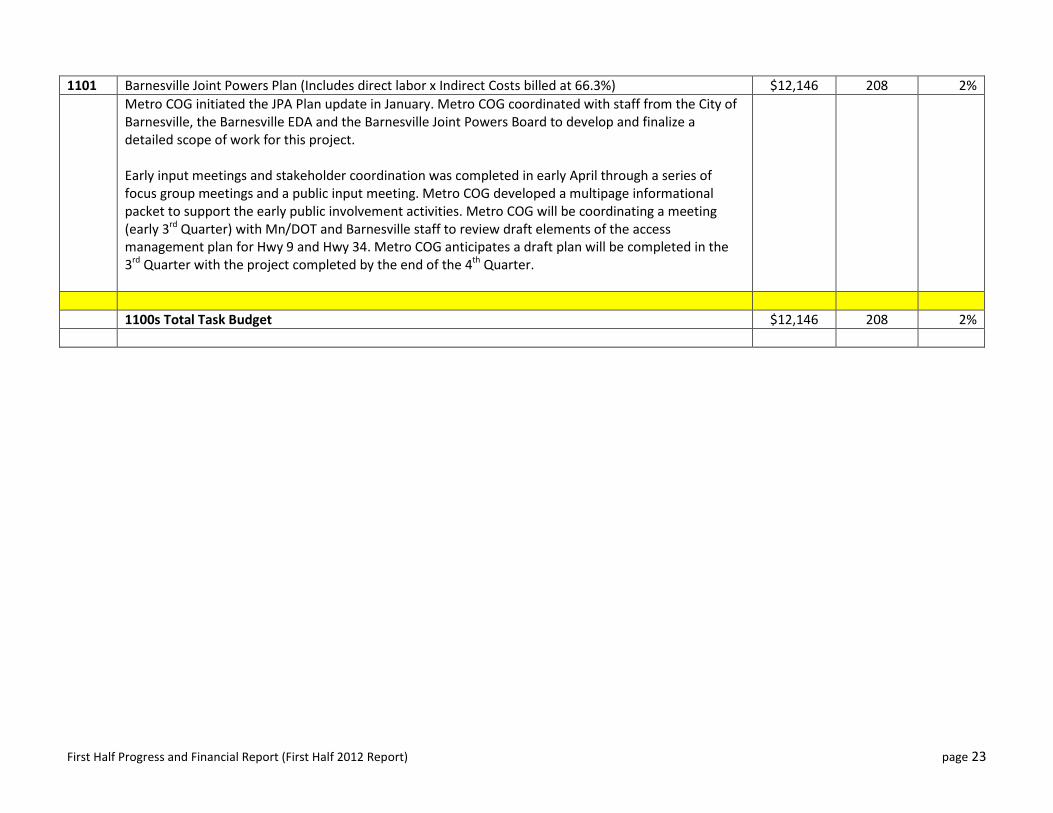
First Half Progress and Financial Report (First Half 2012 Report) page 23
1101 Barnesville Joint Powers Plan (Includes direct labor x Indirect Costs billed at 66.3%) $12,146 208 2% Metro COG initiated the JPA Plan update in January. Metro COG coordinated with staff from the City of
Barnesville, the Barnesville EDA and the Barnesville Joint Powers Board to develop and finalize a detailed scope of work for this project. Early input meetings and stakeholder coordination was completed in early April through a series of focus group meetings and a public input meeting. Metro COG developed a multipage informational packet to support the early public involvement activities. Metro COG will be coordinating a meeting (early 3rd Quarter) with Mn/DOT and Barnesville staff to review draft elements of the access management plan for Hwy 9 and Hwy 34. Metro COG anticipates a draft plan will be completed in the 3rd Quarter with the project completed by the end of the 4th Quarter.
1100s Total Task Budget $12,146 208 2%
To: Transportation Technical Committee (TTC) From: Wade E. Kline, Metro COG Date: July 5, 2012 Re: Consider Resolution Regarding Fargo University Drive Corridor Study Please find attached a resolution regarding the Fargo University Drive Corridor Study. The attached resolution would be forwarded to the Metro COG Policy Board, which in essence recommends the City of Fargo approve the Corridor Study. Metro COG and the City Fargo have been working on this study since late 2008. Metro COG, the City of Fargo, and NDDOT have invested substantial resources since early 2011 to address and rectify a number of pesky issues along the corridor to bring this study to a cooperative conclusion. Final property outreach was scheduled for the 2nd week of July. Fargo’s Public Works Project Evaluation Committee (PWPEC) will be sending a recommendation to the City Commission in late July. If you have questions on this item please don’t hesitate to contact me directly. Requested Action: Recommend Policy Board of the Resolution Regarding the Fargo University Drive Corridor Study.
Attachment 4
Resolution Regarding the Fargo University Corridor Study WHEREAS, the Fargo-Moorhead Metropolitan Council of Governments (Metro COG) is responsible for the planning and development of a safe and functional multimodal transportation system for the FM Metropolitan area;
WHEREAS, Metro COG, as the metropolitan planning organization (MPO), is designated by the Governors of North Dakota and Minnesota to maintain the metropolitan area’s transportation planning process in accordance with federal regulations;
WHEREAS, Metro COG and the City of Fargo have completed the task of developing a corridor study on University Drive in Fargo between 13th Avenue and 25th Street South (herein after Study) which served to identify investment needs along the corridor which is identified by Metro COG as a Principal Arterial; is on the NDDOT Regional System; and is also considered Regionally Significant Transportation Infrastructure (RSTI); and
WHEREAS, the Study developed an agreed to implementation plan between the City of Fargo, NDDOT, and adjacent property owners regarding both interim and long term improvements to address issues identified along the corridor; and WHEREAS, the Study recognized the addition of a 3rd Southbound lane as a preference between 13th Avenue and 17th Avenue, and as such will require the development of at least a ten (10) year lease between property owners on the 1500 and 1600 block of University Drive and NDDOT to address right-of-way encroachments in this area; and WHEREAS, the development of Metro COG’s pending Unified Planning Work Program (UPWP) for 2013-2014 will include additional planning and relevant engineering work to further the agreed to actions and implementation plan identified as part of the Study; and WHEREAS, the Policy Board is aware of the pending action to approve the Study by the Fargo City Commission; with appropriate comment opportunity provided to relevant divisions of the NDDOT; and NOW, THEREFORE, BE IT RESOLVED, that the Metro COG Policy Board does herby find the Study to be consistent with the overall goals and objectives of the metropolitan planning program, including the Long Range Transportation Plan for the FM Metropolitan area; and BE IT FURTHER RESOLVED, that the Metro COG Policy Board does hereby recommend the Fargo City Commission approve the Study as the locally developed plan to guide future investments in the Study area. _________________________________ _________________________________ Vern Bennett, Chair Wade E. Kline, Executive Director
Attachment 4a
To: Transportation Technical Committee (TTC) From: Peggy Harter, Senior Transportation Planner, Metro COG Date: July 3, 2012 Re: 12th Avenue North (CR 19 to 45th Street) Request for Proposals (RFP) (2012#1014) Background. Metro COG has worked cooperatively with the City of West Fargo, City of Fargo and Cass County, North Dakota to develop this RFP. The corridor includes 12th Avenue North from County Road 19 (CR 19) to 45th Street. The project has received federal aid for construction in 2015. The RFP has been developed as a 3-phase project which includes the following: Phase I – Planning Elements of the Project Concept Report Phase II – Project Development (Non-Planning Elements) of the Project Concept Report Phase III - Design
The attached RFP (Attachment 5a) details the specific task items, deliverables, and contract information specific to each phase of the project. This project has been developed as a linking planning and NEPA project. The purpose of the project is to complete the planning elements of the programmed project in conjunction with the non-planning elements of the environmental documentation (i.e. the Project Concept Report) and utilize the same consulting firm for the planning, NEPA, and design phases of the project to reduce redundancy of the same work being completed. Phase I of this project is eighty (80) percent federally funded with a not to exceed budget of $100,000. The local match for Phase I of the project will be split 40/40/20 between West Fargo, Fargo, and Cass County respectively. Phases II and III of the project will be paid for solely with local funds split 40/40/20 between West Fargo, Fargo and Cass County respectively. A not to exceed budget has not been developed for Phases II and III for the project. The project is planned to start with a notice to proceed at the end of September 2012 with final document (PCR) submittal in February 2014 and final plan submittal in December 2014. If you have any questions, comments or concerns prior to the TTC meeting please feel free to contact me at (701) 232-3242 Ext 33 or by e-mail at [email protected]. Recommended Action: It is requested that the TTC recommend approval of the draft RFP and forward the document to the Policy Board for consideration at the July 19, 2012 meeting.
Attachment 5
FARGO-MOORHEAD
METROPOLITAN COUNCIL OF GOVERNMENTS
REQUEST FOR PROPOSALS (RFP)
PROJECT NO. 1014
12th
Avenue North (45th
Street to CR 19)
Cooperative Project Concept Report
And
Project Design Plans
July 2012
APPROVED:
____________________________
Wade E. Kline
Metro COG, Executive Director
2
REQUEST FOR PROPOSALS (RFP) The Fargo-Moorhead Metropolitan Council of Governments (Metro COG) along with their project
partners (City of West Fargo, City of Fargo, and Cass County) requests proposals from qualified
consultants for the following project:
12th Avenue NE (45
th Street to CR 19)
Cooperative Project Concept Report (PCR) and Engineering/Design Plans
Qualifications based selection criteria will be used to analyze proposals from responding consultants. Upon
completion of technical ranking, the Council will enter into negotiations with the top ranked firm. Sealed
cost proposals shall be submitted with the RFP. The cost proposal of the top ranked firm will be opened
during contract negotiations. Those firms not selected for direct negotiations will have their unopened cost
proposals returned. Metro COG reserves the right to reject any or all submittals. This project is divided
into the following phases:
Phase I – Planning elements of the Project Concept Report ($100,000 – 80% Federally Funded);
Phase II – Project Concept Report; and
Phase III – Engineering Design Plans;
Preliminary planning level costs for construction of the project were estimated at $11,454,062. The total
cost of this project is to be split 40% City of West Fargo funds, 40% City of Fargo Funds and 20% Cass
County Funds. Phase I has a not to exceed budget of $100,000 which is 80% Federally Funded and 20%
Local Match Funds. A budget for Phases II and III have not been identified for the project. A separate
contract will be held with Metro COG for Phase I and with the City of West Fargo for Phases II and III.
Interested firms should contact Ms. Joan Geyer, Executive Secretary at Metro COG, Case Plaza, Suite 232,
One North 2nd
Street, Fargo, ND 58102 for a full copy of the RFP. Copies can also be requested by
telephoning 701.232.3242, or by e-mail: [email protected]. Copies will be available for
download in .pdf format at www.fmmetrocog.org.
All proposals received by Noon (12 p.m.) on Friday August 17, 2012 at the Metro COG office will be
given equal consideration. Minority, women-owned and disadvantaged business enterprises are encouraged
to participate. Respondents must submit ten (10) copies of the proposal. The full length of each proposal
should not exceed twenty (20) double sided pages (for a total of 40 pages); including any supporting
material, charts or tables. Metro COG will not accept spiral bound proposals. Consultants are encouraged
to prepare proposals in a format that will ensure efficient disposal and are encouraged to use materials
which are easily recycled. Sealed cost proposals must still be provided in hard copy by the due date noted
above. Hard copies of technical and/or cost proposals should be shipped to ensure timely delivery to the
contact as defined below:
Peggy Harter, Metro COG
Case Plaza, Suite 232
One North 2nd
Street
Fargo, ND 58102
Fax versions will be not accepted as substitutes for the hard copies. Once submitted, the proposals will
become the property of Metro COG. Note – This document is available in alternative formats for persons
with disabilities by calling Ms. Joan Geyer, Executive Secretary at 701.232.3242.

Request for Proposals (RFP)
12th Avenue NE (45th Street to CR 19), #1014
3
TABLE OF CONTENTS
I. Purpose of Request..............................................................................................3
II. Project Background and Project Objective..........................................................3
III. Scope of Work and Performance Tasks...............................................................5
IV. Implementation Schedule....................................................................................9
V. General RFP Instructions....................................................................................10
VI. Evaluation and Selection Process........................................................................10
VII. Proposal Content and Format..............................................................................11
VIII. Available Information.........................................................................................12
IX. Contractual Information......................................................................................12
I. PURPOSE OF REQUEST:
The purpose of this Request for Proposals (RFP) is to provide interested consulting firms with
enough information about the professional services desired by the Fargo-Moorhead Metropolitan
Council of Governments (Metro COG) and its project partners (City of West Fargo, City of
Fargo, and Cass County). This information is meant to convey the general intent of Metro COG
and the project partners in regards to the study and to further guide interested firms in the
preparation/submittal of a proposal.
II. PROJECT BACKGROUND and PROJECT OBJECTIVE.
Existing Conditions
The 12th
Avenue NE corridor from 45th
Street to CR 19 is currently a 2-lane rural roadway. The
corridor has a high percentage of trucks as compared to passenger vehicles. It currently serves as
a farm to market roadway and serves agricultural processors, industrial, heavy commercial and
residential uses. It is classified as a minor arterial roadway and provides transportation to three
jurisdictions (West Fargo, Fargo, and Cass County).
Related Studies/Documents
Metro COG staff completed a Comprehensive Plan for the City of West Fargo in January 2008.
A major component of the transportation element of the plan identified the need for a project on
12th
Avenue NE from 45th
Street to CR 19. A technical memorandum was completed for the 12th
Avenue NE corridor as part of the appendix to the 2008 City of West Fargo Comprehensive Plan.
Request for Proposals (RFP)
12th Avenue NE (45th Street to CR 19), #1014
4
The technical memorandum included analysis of existing and forecast traffic volumes,
intersection operations, access management, right-of-way, intersection control, railroad crossings,
aesthetic opportunities, and multi-modal opportunities. Within the technical memorandum, the
corridor was identified to be reconstructed as a 3-lane modified urban section with shallow
ditches and storm sewer. The technical memorandum also recommended inclusion of wide curb
lanes and shared use paths for non-motorized modes of transportation. An electronic copy of the
12th
Avenue NE Technical Memorandum is attached.
The 12th
Avenue NE project was also listed in Metro COG’s 2009 Update of the Long Range
Transportation Plan (LRTP) as a long term project (2021-2035).
In 2011, the City of West Fargo submitted a federal grant application for reconstruction of the
12th
Avenue NE corridor from 45th
Street to County Road 19 (CR 19). The project was selected
by NDDOT to receive Federal Surface Transportation Urban Roads (STP/U) grant funds in 2015.
The project was awarded to receive 80% STP/U Federal Funds of $9,163,250.
In 2012, Metro COG and its project partners worked together to develop a Memorandum of
Understanding (MOU) between the City of Fargo, City of West Fargo, and Cass County which
identifies project cost splits and jurisdictional transfers which will be included as part of this
project. The attached MOU has been reviewed and signed by the governing boards of all three
project partners.
In 2012, Metro COG worked with the Cities of Fargo and West Fargo and a consultant team in
the completion of a 9th
Street/Veterans Boulevard Corridor Study. The study limits included the
intersection of 12th
Avenue NE. The study found that there was a high crash rate at the 12th
Avenue NE and 9th
Street East intersection and ultimately recommended that a future project
consider safety measures including a round-a-bout at the intersection.
Project Objective
Metro COG and it project partners have identified the objective of this project as follows:
Identify the purpose and need for the project based on issues identified; and
The project alternatives should be developed to respond to the issues and purpose and
need. At a minimum one “No Build” alternative and one “Build” alternative need to be
identified. However, the “Build” alternatives should not be limited to one alternative.
Develop a method of evaluation which aids the project partners in selection of a “Build
Alternative” for the project corridor; and
Complete a Project Concept Report (or other appropriate environmental document as
needed) in coordination with National Environmental Policy Act (NEPA) compliance as
in accordance with North Dakota Department of Transportations (NDDOT) Design
Manual ; and
Develop an approved set of design plans for the “Build Alternative” for the project
corridor; and

Request for Proposals (RFP)
12th Avenue NE (45th Street to CR 19), #1014
5
III. SCOPE OF WORK and PERFORMANCE TASKS.
The Scope of Work for this project has been divided into three sub-areas as identified on page 2 of this
RFP. The three sub-areas, their corresponding tasks, and detailed cost/billing information is provided
below:
PHASE I – PLANNING ELEMENTS OF THE PROJECT CONCEPT REPORT (PCR)
The cost for this phase of the project has a not to exceed dollar value of $100,000 of which 80% is
federally funded. This planning element portion of the PCR (Phase I) shall have a means of separate
billing from the other phases identified which are inclusive of project development and engineering. Phase
I shall be a separate contract with the contracted consulting firm and Metro COG. The planning elements
of the PCR will be developed into a series of technical memorandum which later can be directly inserted
into the PCR or other appropriate environmental document. The tasks which are to be included within the
planning elements of the PCR include the following:
Task 1.0 Existing and Forecast Year 2035 Project Conditions
The consultant shall be responsible for collecting all data for the existing and forecast year
conditions. Please note in section VIII of this RFP that Metro COG and the Cities of Fargo and
West Fargo have offered to help conduct traffic counts for the roadway and at the major
intersections. Please identify the data collection elements in your proposal which you plan to
conduct yourself and what is expected of the project partners. The consultant is responsible
for analyzing 2035 traffic forecasts from the 2005 (base) travel demand model that was
developed as part of the 2009 LRTP. The consultant shall then recommend either use of the
2035 traffic forecasts as provided by the travel demand model or an alternative methodology to
develop the forecast traffic volumes. The existing project conditions to be completed for the
planning portion of the PCR should include the following as applicable:
Project Construction History
Functional and Funding Classification
Geometry
Typical Section
Pavement Conditions
Traffic Operations/Data and Level of Service (LOS) – Existing and forecast year 2035
conditions for the project corridor and the following key intersections:
o CR 19 (west project limit)
o Armour Street
o CR 17
o Center Street
o 9th Street East
o 45th Street (east project limit)
Crash Data
Structures
Right of Way
Access Control
Lighting
Utilities
Parking
Railroad Crossings
Sidewalks, Multi-use Trails, and Shared-use Paths (ADA Compliance)
Request for Proposals (RFP)
12th Avenue NE (45th Street to CR 19), #1014
6
Transit Facilities
ITS
Task 1 Deliverable: The Existing Project Conditions as outlined above including their
associated technical analysis should be included in Technical Memorandum No. 1. The
technical memo shall also identify all data collected as part of the existing condition
analysis and methodologies used to develop future year traffic forecast data.
Task 2.0 Public Input
The planning level element of the PCR shall include the following public input elements:
Study Review Committee (SRC) – The SRC shall meet for a minimum of four (4) SRC
meetings throughout the planning process. The SRC shall include at a minimum one
representative from all of the project partners. Metro COG staff will be responsible
for scheduling the SRC meetings. The consultant shall identify within their proposal
key times during the planning level phase in which the study meetings should be held.
The consultant will be responsible for developing materials necessary to conduct the
SRC meetings and for developing meeting minutes for distribution and documentation
of the SRC meetings.
Public Input Meetings – Two (2) Public Input Meetings shall be held throughout the
planning process. The first meeting should be held to introduce the project to the
public, review existing project corridor conditions with the public, and request input
from the public on the project corridors issues/needs. The second public meeting
should be held after the study alternatives have been developed and technically
evaluated to collect public input on the proposed study alternatives. The consultant
will be responsible for advertising the two public input meeting as outlined within the
requirements of the NDDOT Design Manual. Metro COG staff will provide a
summary of the two public input meetings. The consultant team is responsible for
presentation material at the meetings, including but not limited to sign in sheets,
comment forms, handouts, roll drawings, meeting display boards, and meeting
presentations.
Task 2 Deliverable: The SRC and Public Input Meetings should be summarized and included
in Technical Memorandum No. 2
Task 3.0 Identification of Issues and Project Purpose and Need
The identification of issues shall be a summary of all of the project “issues” that were
identified during the analysis of existing and forecast year conditions, review of existing
plans/documents, and public input received. The identification of issues will develop the basis
for the “Purpose and Need” statement for the project. See the NDDOT Design Manual for a
sample “Purpose and Need” statement.
Task 3 Deliverable: The issues identified throughout the study process and the identified
Purpose and Need for the project should be included in Technical Memorandum No. 3.
Task 4.0 Development and Analysis of Project Alternatives
The project alternatives should be developed to respond to the issues and purpose and need as
identified in Technical Memorandum No. 3. At a minimum one “No Build” alternative and
Request for Proposals (RFP)
12th Avenue NE (45th Street to CR 19), #1014
7
one “Build” alternative need to be identified. However, the “Build” alternatives should not be
limited to one alternative. A number of “Build” alternatives and/or sub-alternatives may be
identified to satisfy the purpose and need for the project. The following should be included
for the development and analysis of the alternatives:
Description of the No-Build Alternative
Description of the Proposed Build Alternatives and Sub-alternatives
Analysis/Review of All Alternatives Inclusive of the following as applicable:
o Geometry
o Typical Section
o Traffic Operations – (Corridor LOS, Major Intersection LOS, Potential
Crash Reductions)
o Structures
o Right of Way
o Access Control
o Lighting
o Utilities
o Parking
o Railroad Crossings
o Sidewalks, Multi-use Trails, and Shared-use Paths (ADA Compliance)
o Transit Facilities
o ITS
Summary of Estimated Cost for All Build Alternatives and Sub-alternatives
Maintenance Responsibility Discussion
Jurisdictional Transfer Discussion
Deliverable: The Development and Analysis of Project Alternatives shall be included in
Technical Memorandum No. 4. All “Build” alternatives developed shall be shown in
conceptual level plan view drawings to assist as a visual graphic for understanding and
evaluating each alternative.
Task 5.0 Environmental Impact Review of Project Alternatives
Solicitation of Views (SOV) letters shall be sent out to agencies as identified in NDDOT’s
Design Manual. The following environmental impacts should be reviewed for each corridor
alternative based on review of the project corridor and responses from SOV letters:
Land Use
Prime and Unique Farmlands
Social
Relocations
Economic
Pedestrians/Bicyclists
Air Quality
Noise
Water Quality
Wetlands
Water body modification, wildlife, and invasive plant species
Floodplain
State Scenic River
Request for Proposals (RFP)
12th Avenue NE (45th Street to CR 19), #1014
8
Threatened and Endangered Species
Hazardous Waste
Visual
Energy
Trees
Temporary Construction (traffic control, phasing, detours, alternative routes, air, noise,
and/or water quality impacts)
Low income and minority living areas
Section 4(f) and 6(f) involvement
Deliverable: The Environmental Impact Review for Project Alternatives shall be included in
Technical Memorandum No. 4.
Task 6.0 Evaluation of Project Alternatives
The evaluation of project alternatives shall include a methodology to evaluate all of the project
alternatives, including the “No Build” alternative. The evaluation should be inclusive of the
technical analysis, public input, the projects Purpose and Need, project cost, and
environmental impacts. Based on the project evaluation process, the SRC can recommend that
some of the “Build” alternatives are found to be “not technically feasible” and should not be
further considered. If an alternative is deemed “not technically feasible” by the SRC, the
justification for the determination shall be documented.
Deliverable: The Evaluation of Project Alternatives shall be included in Technical
Memorandum No. 4.
PHASE II – PROJECT CONCEPT REPORT
This project phase includes the full completion of the Project Concept Report as identified in the NDDOT
Design Manual. It should be noted that the tasks identified within Phase II are to be billed separately from
the Planning Level Elements of the PCR (Phase I) under a separate contract with the City of West Fargo.
A budget has not been set for Phase II of the project. The tasks for this subarea include the following:
Task 7.0 Incorporate Planning Level Elements into the PCR
Technical Memorandum 1.0 through 4.0 should have been completed so that the information
within them can be easily transitioned into the PCR.
Task 8.0 Additional Tasks for the PCR which are Considered Project Development
The additional PCR tasks, considered project development, are inclusive of the following:
Completion of a 90-1 Survey for the Existing Project Conditions
Drainage Analysis for the Existing Project Conditions
Drainage Analysis for all of the Proposed Build Alternatives
Traffic Control Work Zone Safety and Mobility if applicable
Work Zone Traffic Control
Cultural Resources Review for the Environmental Impacts Review
Third Public Input Meeting or Public Hearing (whichever is determined necessary) – to
bring the Draft PCR document back to the public for final comments
Management Presentations – Meeting for NDDOT and other technical and/or elected
city/county officials as needed for project consensus
Request for Proposals (RFP)
12th Avenue NE (45th Street to CR 19), #1014
9
Completion of the PCR document including all sections identified within the NDDOT
Design Manual. This includes development of an Executive Summary and Decisions
Document. The PCR shall be completed and stamped by a Professional Engineer
licensed in the state of North Dakota, as identified within NDDOT’s Design Manual.
The PCR shall have final approvals from all project partners, NDDOT, and FHWA.
Deliverable: Completed and signed PCR, executive summary, and decisions document.
PHASE III – ENGINEERING DESIGN PLANS
Engineering design plans shall be completed for the recommended alternative from the approved PCR.
The design plans shall be completed according to NDDOT standards as found in the NDDOT Design
Manual. It should be noted that the tasks identified within Phase III are to be billed separately from the
Planning Level Elements of the PCR (Phase I) under a separate contract with the City of West Fargo. A
budget has not been set for Phase III of the project. The following tasks shall be completed as part of
completing the design plans for the project:
Task 9.0 50% Design Plans
The consultant shall meet with the project partners and conduct a Design Meeting when they
have 50% Design Plans completed.
Task 10.0 95% Design Plans and PS&E
The consultant shall meet with project partners and conduct a PS&E Design Meeting when
design plans are 95% completed.
IV. IMPLEMENTATION SCHEDULE.
a) Consultant Selection
Advertise for Consultant Proposals July 20, 2012
Due date for Proposal Submittals August 17, 2012
Selection Committee/Review Proposals August 20 – 24, 2012
Identify Finalists August 24, 2012
Interview Finalists August 29, 2012
Contract Negotiations August 29 – 31, 2012
Metro COG Board, City and County Commission September 20, 2012
Approvals & Contract Execution
b) Project Development
Notice to Proceed September 21, 2012
Project Start-Up September 21, 2012
Phase I Completed December 2013
Phase II Completed February 2014
Phase III Completed (Final Plans Complete) December 1, 2014
Bid Opening February 2015

Request for Proposals (RFP)
12th Avenue NE (45th Street to CR 19), #1014
10
V. EVALUATION and SELECTION PROCESS.
a) Selection Committee. Metro COG shall establish a selection committee which will include
representation from the following jurisdictions: Metro COG (1 staff), West Fargo (2 staff), Fargo
(2 staff), Cass County (1 staff), and NDDOT (1 staff – tie breaker vote if needed). The selection
committee will also serve as representatives on any established steering committee. The RFP
selection process will be administered under the following criteria:
i. Understanding the Scope of Work and Proposed Project Objectives [40 points] –
Does the consultant demonstrate an understanding of the project objectives?
What is the proposed approach to effectively and efficiently complete the identified
tasks? What is the proposed work plan? What technical analysis needs to be
completed in order to effectively address project issues?
What is the proposed schedule for completing the three project Phases?
What is the proposed public input plan and methodology to establish consensus on
recommendations or alternatives?
ii. Related Experience on Similar Projects or Studies [30 points] –
Does the consultant (including sub-consultants, if any) have the ability to complete
both the technical engineering/planning requirements that will be required all three
phases of the project?
Does the consultant have a documented history of successfully completing similar
projects or studies?
iii. Expertise of the Professional Team Members Assigned to the Project [30 points] –
What are the technical and professional skills of each team member?
What will be the assigned role of each team member and level of participation? This
should be outlined within a spreadsheet that clearly depicts roles and levels of
participation for each team member assigned to the project. Does the consultant have
a registered Professional Engineer on staff to author the PCR?
What is the availability of key personnel relative to the proposed schedule and the
defined study objectives?
VI. PROPOSAL CONTENT and FORMAT.
a) Proposal Content. At minimum, proposals shall include the following sections:
i. Introduction and Executive Summary. This section shall document the firm name,
business address (including telephone, FAX, email address(es), year established, type
of ownership and parent company (if any), project manager name and qualifications,
and any major facts/features/recommendations/conclusions that may differentiate this
proposal form others, if any.
ii. Work Plan and Project Approach Methodology. Proposals shall include the
following, at minimum:
Request for Proposals (RFP)
12th Avenue NE (45th Street to CR 19), #1014
11
A detailed work plan identifying the major tasks to be accomplished relative to the
project objectives, a detailed approach for completing all three phases of the project
and a summary of the proposed methodology to establish consensus on
recommendations and/or identified alternatives;
Identify the proposed public input strategy and level of participation envisioned from
any steering committee beyond the minimal requirements as set forth in the RFP if
deemed necessary;
Provide a detailed schedule including task breakdown, deliverable due dates and
personnel availability. The detailed task breakdown shall include hours attributed to
each team member and/or sub-consultant and the total number of hours allocated to
complete the project.
In summary, the RFP shall clearly explain the methodology that will be used to
satisfactory complete the required services. The respondent shall document within the
RFP an overall understanding of the project background, project scope, data collection
requirements/needs, public input strategy(ies), ability to complete technical analysis,
technical cost projections and the ability to use advanced technology/software.
b) References. Proposals shall include, at minimum, references of three (3) clients for whom
similar work has been completed.
c) Submittal Information. Respondents shall submit (10) ten copies of the proposal. The full
length of each proposal shall not exceed twenty (20) double sided pages (for a total of 40 pages);
including supporting material, charts or tables. Metro COG will not accept spiral bound
proposals.
d) Signature. Proposals shall be signed in ink by an authorized member of the firm/project team.
VII. GENERAL RFP REQUIREMENTS.
a) Questions/Comments. Any questions or comments and all proposal submissions shall be
directed to the appropriate Metro COG contact.
b) Sealed Cost Proposal. All proposals must be clearly identified and marked with the appropriate
project name; inclusive of a separately sealed cost proposal per the requirements of this RFP.
Cost proposals shall be based on an hourly “not to exceed” amount and shall follow the general
format as provided within Appendix A of this RFP. Metro COG may decide, in its sole
discretion, to negotiate a price for the project after the selection committee completes its final
ranking. Negotiation will begin with the consultant identified as the most qualified per
requirements of this RFP, as determined in the evaluation/selection process. If Metro COG is
unable to negotiate a contract for services negotiations will be terminated and negotiations will
begin with the next most qualified consultant. This process will continue until a satisfactory
contract has been negotiated.
c) Respondent Qualifications. Respondents must submit evidence that they have relevant past
experience and have previously delivered services similar to the requested services within this
RFP. Each respondent may also be required to show that similar work has been performed in a
satisfactory manner and that no claims of any kind are pending against such work. No proposal
Request for Proposals (RFP)
12th Avenue NE (45th Street to CR 19), #1014
12
will be accepted from a respondent whom is engaged in any work that would impair his/her
ability to perform or finance this work.
d) Disadvantaged Business Enterprise. Pursuant to Department of Transportation policy and 49
CFR Part 23, Metro COG supports the participation of DBE/MBE businesses in the
performance of contracts financed with federal funds under this RFP. Consultants shall make an
effort to involve DBE/MBE businesses in this project. If the consultant is a DBE/MBE, a
statement indicating that the business is certified DBE/MBE in North Dakota or Minnesota shall
be included within the proposal. If the consultant intends to utilize a DBE/MBE to complete a
portion of this work, a statement of the subcontractor’s certification shall be included. The
percent of the total proposed cost to be completed by the DBE/MBE shall be shown within the
proposal. Respondents should substantiate (within proposal) efforts made to include DBE/MBE
businesses.
e) US DOT Policy Statement on Bicycle and Pedestrian Accommodations. Consultants are
advised to review and consider the US DOT Policy Statement on Bicycle and Pedestrian
Accommodation issued in March of 2010 when developing written proposals.
VIII. ADDITIONAL INFORMATION.
a) A separate project contract will be needed between the selected consultant and Metro COG for
the Phase I portion of the project. Metro COG staff will be the primary project contact during
Phase I.
b) A separate project contract will be needed between the selected consultant and the City of West
Fargo for Phases II and III of the project. City of West Fargo staff will be the primary project
contact during Phases II and III.
c) This project has federal programmed dollars for construction in 2015.
d) Metro COG and City staff will plan to assist with traffic data collection after construction is
completed along Main Avenue and after school is back in session in the Fall of 2012. The data
collection that is assumed to be completed by Metro COG and by the consultant team should be
clearly articulated within the proposal.
e) The 12th Avenue North Technical Memorandum from West Fargo’s 2008 Comprehensive Plan,
12th Avenue North Memorandum of Understanding (signed in 2012), 2010 traffic counts, and
2009 LRTP traffic projections for years 2015 and 2035 can be found on Metro COG’s website:
http://www.fmmetrocog.org/
IX. CONTRACTUAL INFORMATION.
a) Metro COG and/or West Fargo reserves the right to reject any or all proposals or to award the
contract to the next most qualified firm if the successful firm does not execute a contract within
forty-five (45) days after the award of the proposal. Metro COG and/or West Fargo will not pay
for any information contained in proposals obtained from participating firms.
Request for Proposals (RFP)
12th Avenue NE (45th Street to CR 19), #1014
13
b) Metro COG and/or West Fargo reserves the right to request clarification on any information
submitted and additionally reserves the right to request additional information of one (1) or more
applicants.
c) Any proposal may be withdrawn up until the proposal submission deadline. Any proposals not
withdrawn shall constitute an irrevocable offer for services set forth within the RFP for a period
of ninety (90) days or until one or more of the proposals have been approved by the Metro COG
Policy Board and/or West Fargo City Commission.
d) If, through any cause, the firm shall fail to fulfill in a timely and proper manner the obligations
agreed to, Metro COG and/or West Fargo shall have the right to terminate its contract by
specifying the date of termination in a written notice to the firm at least ninety (90) working days
before the termination date. In this event, the firm shall be entitled to just and equitable
compensation for any satisfactory work completed.
e) Any agreement or contract resulting from the acceptance of a proposal shall be on forms either
supplied by or approved by Metro COG and/or West Fargo and shall contain, as a minimum,
applicable provisions of the Request for Proposals. Metro COG and/or West Fargo reserves the
right to reject any agreement that does not conform to the Request for Proposal and any Metro
COG requirements for agreements and contracts.
f) The firm shall not assign any interest in the contract and shall not transfer any interest in the
same without prior written consent of Metro COG and/or West Fargo.
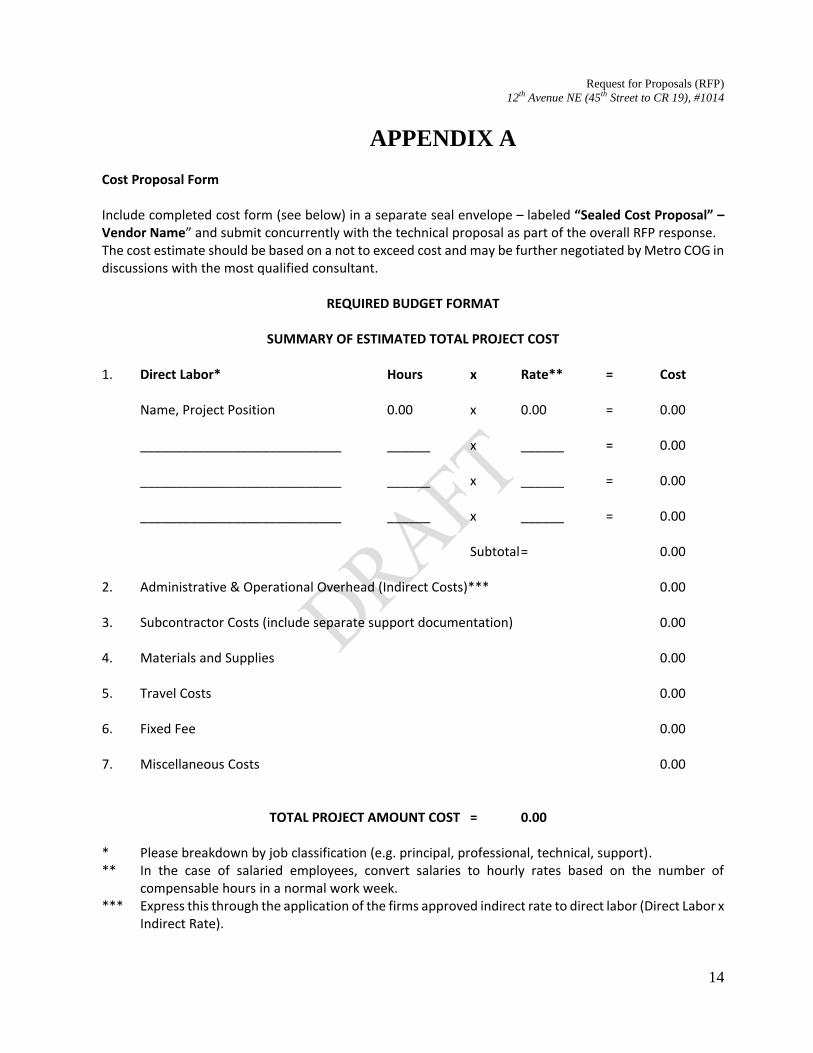
Request for Proposals (RFP)
12th Avenue NE (45th Street to CR 19), #1014
14
APPENDIX A
Cost Proposal Form Include completed cost form (see below) in a separate seal envelope – labeled “Sealed Cost Proposal” – Vendor Name” and submit concurrently with the technical proposal as part of the overall RFP response. The cost estimate should be based on a not to exceed cost and may be further negotiated by Metro COG in discussions with the most qualified consultant.
REQUIRED BUDGET FORMAT
SUMMARY OF ESTIMATED TOTAL PROJECT COST 1. Direct Labor* Hours x Rate** = Cost
Name, Project Position 0.00 x 0.00 = 0.00
____________________________ ______ x ______ = 0.00
____________________________ ______ x ______ = 0.00
____________________________ ______ x ______ = 0.00
Subtotal = 0.00 2. Administrative & Operational Overhead (Indirect Costs)*** 0.00 3. Subcontractor Costs (include separate support documentation) 0.00 4. Materials and Supplies 0.00 5. Travel Costs 0.00
6. Fixed Fee 0.00 7. Miscellaneous Costs 0.00
TOTAL PROJECT AMOUNT COST = 0.00 * Please breakdown by job classification (e.g. principal, professional, technical, support). ** In the case of salaried employees, convert salaries to hourly rates based on the number of
compensable hours in a normal work week. *** Express this through the application of the firms approved indirect rate to direct labor (Direct Labor x
Indirect Rate).
Request for Proposals (RFP)
12th Avenue NE (45th Street to CR 19), #1014
15
DEBARMENT OR SUSPENSION CERTIFICATION
The Participant, (name of firm) certifies to the best of its knowledge and
belief, that it and its principals:
1. Are not presently debarred, suspended, proposed for debarment, declared ineligible, or voluntarily
excluded from covered transactions by any Federal department or agency;
2. Have not within a three-year period preceding this proposal been convicted of or had a civil
judgement rendered against them for commission of fraud or a criminal offense in connection with
obtaining, attempting to obtain, or performing a public (Federal, State, or Local) transaction or
contract under a public transaction; violation of Federal or State antitrust statutes or commission of
embezzlement, theft, forgery, bribery, falsification or destruction of records, making false
statements, or receiving stolen property;
3. Are not presently indicted for or otherwise criminally or civilly charged by a governmental entity
(Federal, State, or Local) with commission of any of the offenses enumerated in paragraph two (2)
of this certification; and
4. Have not within a three-year period preceding this application/proposal had one or more public
transactions (Federal, State, or Local) terminated for cause of default.
THE PARTICIPANT, CERTIFIES OR AFFIRMS THE TRUTHFULNESS AND ACCURACY
OF THE CONTENTS OF THE STATEMENTS SUBMITTED ON OR WITH THIS
CERTIFICATION AND UNDERSTANDS THAT THE PROVISIONS OF 31 U.S.C. 3801 ET
SEQ. ARE APPLICABLE THERETO.
___________________________________ Date
(Signature of Authorized Official)
___________________________________
(Title of Authorized Official)
Request for Proposals (RFP)
12th Avenue NE (45th Street to CR 19), #1014
16
CERTIFICATION
OF
RESTRICTION ON LOBBYING
I ________________________________________________, hereby certify on behalf of
(Name and title of grantee official)
_________________________________________ that:
(Name of grantee)
(1) No federal appropriated funds have been paid or will be paid, by or on behalf of the undersigned, to
any person for influencing or attempting to influence an officer or employee of any agency, a
Member of Congress, an officer or employee of Congress, or an employee of a Member of
Congress in connection with the awarding of any Federal contract, the making of any Federal grant,
the making of any Federal loan, the entering into of any cooperative agreement, and the extension,
continuation, renewal, amendment, or modification of any Federal contract, grant, loan, or
cooperative agreement.
(2) If any funds other than Federal appropriated funds have been paid or will be paid to any person for
influencing or attempting to influence an officer or employee of any agency, a Member of
Congress, an officer or employee of Congress, or an employee of a Member of Congress in
connection with this Federal contract, grant, loan, or cooperative agreement, the undersigned shall
complete and submit Standard Form-LLL, "Disclosure Form to Report Lobbying" in accordance
with its instructions.
(3) The undersigned shall require that the language of this certification be included in the award
documents for all subawards at all tiers (including sub-contracts, sub-grants, and contracts under
grants, loans, and cooperative agreements) and that all sub-recipients shall certify and disclose
accordingly.
This certification is a material representation of fact upon which reliance is placed when this transaction
was made or entered into. Submission of this certification is a prerequisite for making or entering into this
transaction imposed by section 1352, title 31, US Code. Any person who fails to file the required
certification shall be subject to a civil penalty of not less than $10,000 and not more than $100,000 for
each such failure.
Executed this _______ day of ______________ , ______
By ___________________________________
(Signature of Authorized Official)
____________________________________
(Title of authorized official
To: Transportation Technical Committee (TTC) From: Peggy Harter, Senior Transportation Planner, Metro COG Date: July 3, 2012 Re: Addendum No. 3 to the Contract with SRF Consulting Group, Inc. Regarding the Mn/DOT TH 10 (Red
River to TH 336), Mn/DOT TH 75 (Main Ave to 20th Ave South), & Moorhead Center Avenue (Red River to 8th Street) Corridor Studies (#2011 #1002)
Metro COG staff is requesting recommendation for approval of Addendum No. 3 to the Contract with SRF Consulting Group, Inc. regarding the Mn/DOT TH 10 (Red River to TH 336), Mn/DOT TH 75 (Main Ave to 20th Ave South), & Moorhead Center Avenue (Red River to 8th Street) Corridor Studies (#2011 #1002). Addendum No. 3 includes increasing the overall cost of the contract by $28,853.27 to cover the additional services to study the re-designation of TH 75 outside of downtown Moorhead. Addendum No. 3 also recommends extending the contract completion date out to March 31, 2013. Attachment 6a gives a detailed description and cost/hours estimate for the additional services. Metro COG staff discussed the addendum with both Mn/DOT and City of Moorhead staff during the week of June 25, 2012. The recommendation of these discussions was to move forward with the additional study with the understanding that Mn/DOT would pay the 20% local match for Addendum No. 3 to the contract. Metro COG is proposing that the total contract increase of $28,853.27 would be funded 80% ($23,082.61) by Metro COG undesignated federal funds and 20% ($5,770.66) local match by Mn/DOT.
The following items would need to be approved as part of the approval of Addendum No. 3 to this contract:
• Transfer $23,082.61 from the Undesignated Federal fund balance (2012#Undes.) to the Mn/DOT TH 10 (Red River to TH 336), Mn/DOT TH 75 (Main Ave to 20th Ave South), & Moorhead Center Avenue (Red River to 8th Street) Corridor Studies (#2011 #1002);
The remaining 20% ($5,770.66) of the contract addendum would be local funds to be covered by Mn/DOT and would require a contract addendum between Metro COG and Mn/DOT. If approved, the contract with SRF Consulting Group, Inc. will increase to $269,838.44. Pending your recommendation, the Addendum will be forwarded to the Metro COG Policy Board for consideration on July 19, 2012. Recommended Action: Recommend Policy Board approval of Addendum No. 3 to the contract with SRF Consulting Group Inc. on the Mn/DOT TH 10, Mn/DOT TH 75, & Moorhead Center Avenue Corridor Studies to pay for additional services and increase the approved budget for 2012#1002 by $28,853.27 for a new budget total of $269,838.44 by transferring $23,082.61 from 2012#Undes funds assuming the remaining $5770.66 is to be paid for by Mn/DOT and also to extend the contract completion date out to March 31, 2013.
Attachment 6
EXHIBIT B
Addendum No. 3 to
Services Agreement
“Fargo Main Avenue (25th
Street to Red River), Mn/DOT TH 10 (Red River to TH 336), Mn/DOT TH
75 (Main Avenue to 20th
Avenue South), & Moorhead Center Avenue (Red River to 8th
Street)
Corridor Studies (2011 #1002 & 1003)”
This Addendum to that certain Services Agreement dated May 19, 2011, is made effective as of
July 19, 2012, by and between the undersigned parties. The Addendum immediately preceding this
Addendum was dated April 19, 2012.
1. Services to be provided: See attached scope and hours spreadsheet for additional study to re-
designate TH 75 outside of downtown Moorhead.
2. Fees: Total project budget will increase project no (2011 #1002) by $28,853.27 to cover the
additional services. This will bring the total project budget up to $269,838.44.
3. Schedule: The final completion date shall be changed from October 31, 2012 to March 31,
2013.
FARGO-MOORHEAD METROPOLITAN
COUNCIL OF GOVERNMENTS
By _______________________________________
Wade E. Kline, Executive Director
Dated _____________________________________
SRF Consulting group, inc.
By ______________________________________
Its ______________________________________
Dated ____________________________________
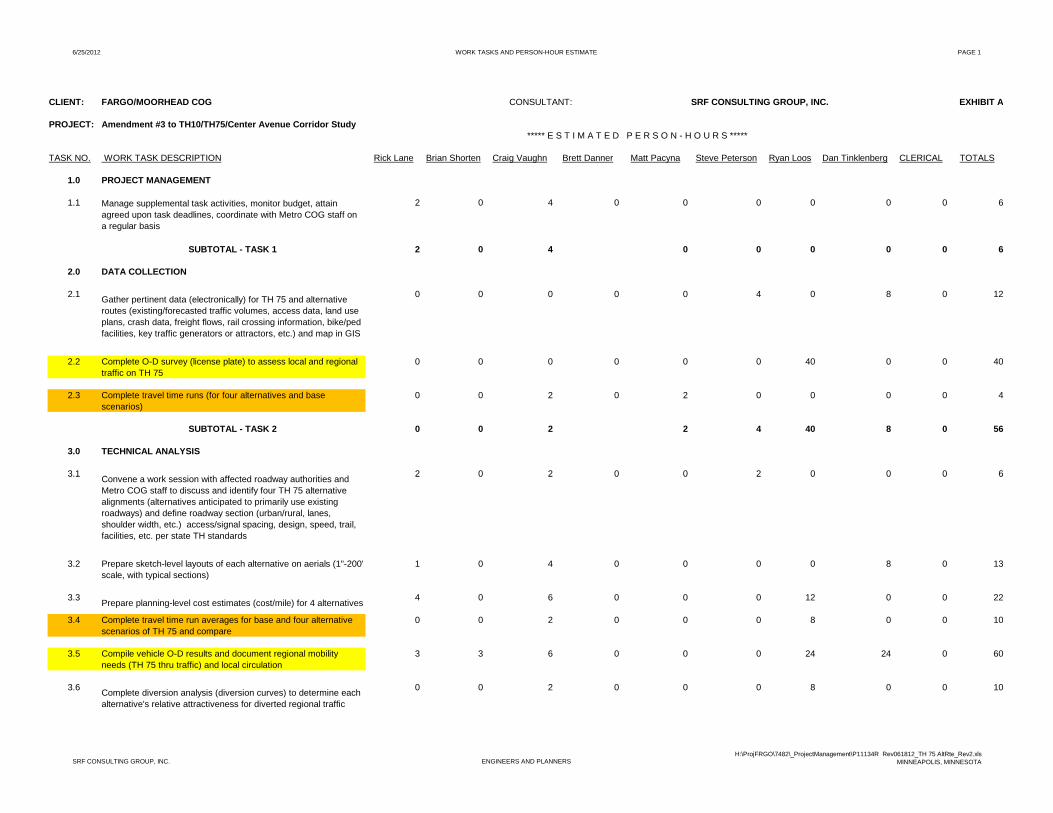
6/25/2012 WORK TASKS AND PERSON-HOUR ESTIMATE PAGE 1
CLIENT: FARGO/MOORHEAD COG CONSULTANT: SRF CONSULTING GROUP, INC. EXHIBIT A
PROJECT: Amendment #3 to TH10/TH75/Center Avenue Corridor Study ***** E S T I M A T E D P E R S O N - H O U R S *****
TASK NO. WORK TASK DESCRIPTION Rick Lane Brian Shorten Craig Vaughn Brett Danner Matt Pacyna Steve Peterson Ryan Loos Dan Tinklenberg CLERICAL TOTALS
1.0 PROJECT MANAGEMENT
1.1 Manage supplemental task activities, monitor budget, attain agreed upon task deadlines, coordinate with Metro COG staff on a regular basis
2 0 4 0 0 0 0 0 0 6
SUBTOTAL - TASK 1 2 0 4 0 0 0 0 0 6
2.0 DATA COLLECTION
2.1Gather pertinent data (electronically) for TH 75 and alternative routes (existing/forecasted traffic volumes, access data, land use plans, crash data, freight flows, rail crossing information, bike/ped facilities, key traffic generators or attractors, etc.) and map in GIS
0 0 0 0 0 4 0 8 0 12
2.2 Complete O-D survey (license plate) to assess local and regional traffic on TH 75
0 0 0 0 0 0 40 0 0 40
2.3 Complete travel time runs (for four alternatives and base scenarios)
0 0 2 0 2 0 0 0 0 4
SUBTOTAL - TASK 2 0 0 2 2 4 40 8 0 56
3.0 TECHNICAL ANALYSIS
3.1C k i ith ff t d d th iti d
2 0 2 0 0 2 0 0 0 63.1Convene a work session with affected roadway authorities and Metro COG staff to discuss and identify four TH 75 alternative alignments (alternatives anticipated to primarily use existing roadways) and define roadway section (urban/rural, lanes, shoulder width, etc.) access/signal spacing, design, speed, trail, facilities, etc. per state TH standards
2 0 2 0 0 2 0 0 0 6
3.2 Prepare sketch-level layouts of each alternative on aerials (1"-200' scale, with typical sections)
1 0 4 0 0 0 0 8 0 13
3.3Prepare planning-level cost estimates (cost/mile) for 4 alternatives
4 0 6 0 0 0 12 0 0 22
3.4 Complete travel time run averages for base and four alternative scenarios of TH 75 and compare
0 0 2 0 0 0 8 0 0 10
3.5 Compile vehicle O-D results and document regional mobility needs (TH 75 thru traffic) and local circulation
3 3 6 0 0 0 24 24 0 60
3.6Complete diversion analysis (diversion curves) to determine each alternative's relative attractiveness for diverted regional traffic
0 0 2 0 0 0 8 0 0 10
SRF CONSULTING GROUP, INC. ENGINEERS AND PLANNERSH:\ProjFRGO\7482\_ProjectManagement\P11134R Rev061812_TH 75 AltRte_Rev2.xls
MINNEAPOLIS, MINNESOTA
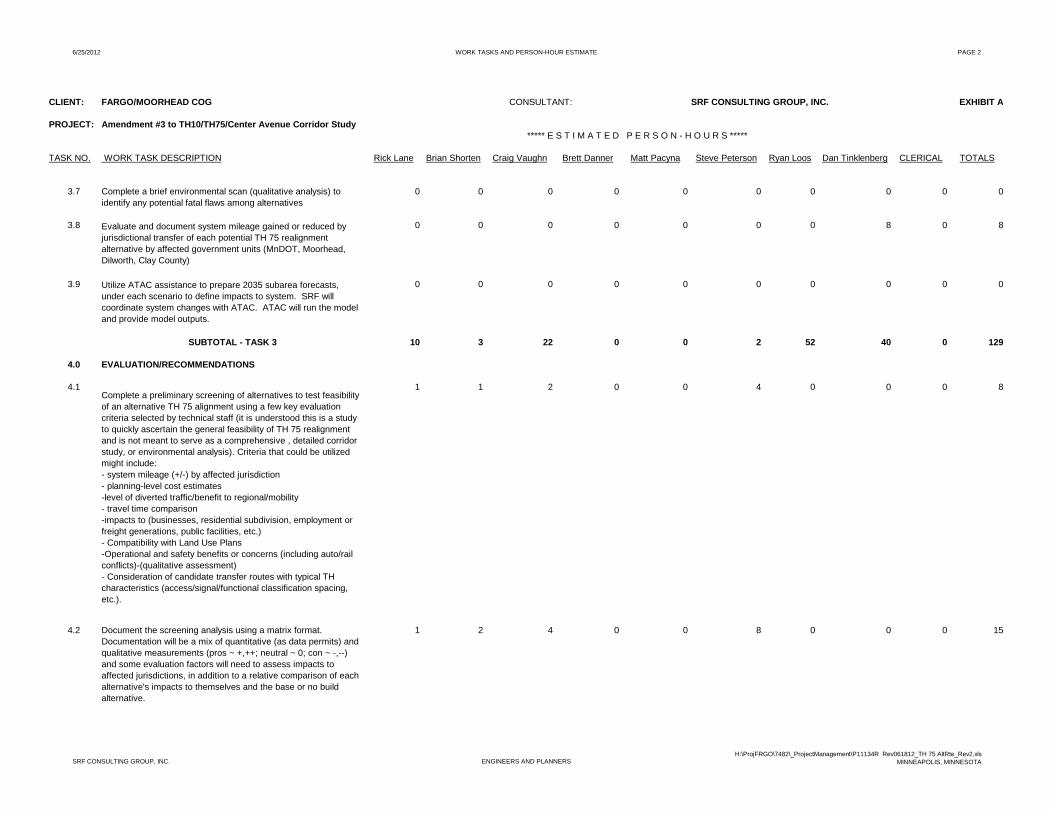
6/25/2012 WORK TASKS AND PERSON-HOUR ESTIMATE PAGE 2
CLIENT: FARGO/MOORHEAD COG CONSULTANT: SRF CONSULTING GROUP, INC. EXHIBIT A
PROJECT: Amendment #3 to TH10/TH75/Center Avenue Corridor Study ***** E S T I M A T E D P E R S O N - H O U R S *****
TASK NO. WORK TASK DESCRIPTION Rick Lane Brian Shorten Craig Vaughn Brett Danner Matt Pacyna Steve Peterson Ryan Loos Dan Tinklenberg CLERICAL TOTALS
3.7 Complete a brief environmental scan (qualitative analysis) to identify any potential fatal flaws among alternatives
0 0 0 0 0 0 0 0 0 0
3.8 Evaluate and document system mileage gained or reduced by jurisdictional transfer of each potential TH 75 realignment alternative by affected government units (MnDOT, Moorhead, Dilworth, Clay County)
0 0 0 0 0 0 0 8 0 8
3.9 Utilize ATAC assistance to prepare 2035 subarea forecasts, under each scenario to define impacts to system. SRF will coordinate system changes with ATAC. ATAC will run the model and provide model outputs.
0 0 0 0 0 0 0 0 0 0
SUBTOTAL - TASK 3 10 3 22 0 0 2 52 40 0 129
4.0 EVALUATION/RECOMMENDATIONS
4.1Complete a preliminary screening of alternatives to test feasibility of an alternative TH 75 alignment using a few key evaluation criteria selected by technical staff (it is understood this is a study to quickly ascertain the general feasibility of TH 75 realignment and is not meant to serve as a comprehensive , detailed corridor study, or environmental analysis). Criteria that could be utilized might include: - system mileage (+/-) by affected jurisdiction
1 1 2 0 0 4 0 0 0 8
system mileage (+/ ) by affected jurisdiction- planning-level cost estimates-level of diverted traffic/benefit to regional/mobility- travel time comparison-impacts to (businesses, residential subdivision, employment or freight generations, public facilities, etc.)- Compatibility with Land Use Plans-Operational and safety benefits or concerns (including auto/rail conflicts)-(qualitative assessment)- Consideration of candidate transfer routes with typical TH characteristics (access/signal/functional classification spacing, etc.).
4.2 Document the screening analysis using a matrix format. Documentation will be a mix of quantitative (as data permits) and qualitative measurements (pros ~ +,++; neutral ~ 0; con ~ -,--) and some evaluation factors will need to assess impacts to affected jurisdictions, in addition to a relative comparison of each alternative's impacts to themselves and the base or no build alternative.
1 2 4 0 0 8 0 0 0 15
SRF CONSULTING GROUP, INC. ENGINEERS AND PLANNERSH:\ProjFRGO\7482\_ProjectManagement\P11134R Rev061812_TH 75 AltRte_Rev2.xls
MINNEAPOLIS, MINNESOTA
6/25/2012 WORK TASKS AND PERSON-HOUR ESTIMATE PAGE 3
CLIENT: FARGO/MOORHEAD COG CONSULTANT: SRF CONSULTING GROUP, INC. EXHIBIT A
PROJECT: Amendment #3 to TH10/TH75/Center Avenue Corridor Study ***** E S T I M A T E D P E R S O N - H O U R S *****
TASK NO. WORK TASK DESCRIPTION Rick Lane Brian Shorten Craig Vaughn Brett Danner Matt Pacyna Steve Peterson Ryan Loos Dan Tinklenberg CLERICAL TOTALS
4.3 Meet with technical staff and present the draft evaluation, make one revision, and again meet with technical staff to determine a recommendation.
6 2 12 0 0 4 0 0 0 24
SUBTOTAL - TASK 4 8 5 18 0 0 16 0 0 0 47
5.0 IMPLEMENTATION PLAN
5.1 If an alternative is deemed feasible, prepare a list of activities needed to further advance the concept (ex., corridor study, jurisdictional transfer agreements, system designation and functional/classification changes, etc.).
2 4 0 0 0 4 0 0 0 10
SUBTOTAL - TASK 5 2 4 0 0 4 0 0 0 10
6.0 REPORT PREPARATION
6.1 Prepare a draft technical memorandum summarizing the findings and submit to technical staff from affected jurisdictions for their respective comments.
1 2 4 0 0 16 0 0 4 27
6.2 Revise and prepare final memorandum. Metro COG staff will present this document and its findings to policy leaders. Include as an appendix to the TH10/TH75/Center Avenue Corridor Study. (It is understood Metro COG staff will complete all public involvement and local government presentations).
0 1 3 0 0 8 0 0 2 14
SUBTOTAL - TASK 6 1 3 7 0 0 24 0 0 6 41
SRF CONSULTING GROUP, INC. ENGINEERS AND PLANNERSH:\ProjFRGO\7482\_ProjectManagement\P11134R Rev061812_TH 75 AltRte_Rev2.xls
MINNEAPOLIS, MINNESOTA

6/25/2012 WORK TASKS AND PERSON-HOUR ESTIMATE PAGE 4
CLIENT: FARGO/MOORHEAD COG CONSULTANT: SRF CONSULTING GROUP, INC. EXHIBIT A
PROJECT: Amendment #3 to TH10/TH75/Center Avenue Corridor Study ***** E S T I M A T E D P E R S O N - H O U R S *****
TASK NO. WORK TASK DESCRIPTION Rick Lane Brian Shorten Craig Vaughn Brett Danner Matt Pacyna Steve Peterson Ryan Loos Dan Tinklenberg CLERICAL TOTALS
TOTAL ESTIMATED PERSON-HOURS 23 15 53 0 2 50 92 48 6 289
AVERAGE HOURLY PAYROLL RATES $55.73 $57.53 $41.35 $34.15 $28.64 $27.57 $24.14 $25.50 $18.42
ESTIMATED LABOR $1,281.79 $862.95 $2,191.55 $0.00 $57.28 $1,378.50 $2,220.88 $1,224.00 $110.52 $9,327.47
ESTIMATED OVERHEAD COST 161.67% $15,079.72
TOTAL ESTIMATED LABOR AND OVERHEAD $24,407.19
FIXED FEE 15% $3,661.08
ESTIMATED DIRECT NON-SALARY EXPENSES: $785.00
TOTAL ESTIMATED FEE $28,853.27===========
MILEAGE: Personal Vehicles 1000 Miles @ $0.555 $555.00
MEALS: 1 PERSON AT 2/DAY FOR 2 DAYS 4 MEALS @ $15.000 $60.00
HOTEL: 1 PERSON FOR 1 NIGHT EA 2 NIGHTS @ $85.000 $170.00
ESTIMATED DIRECT NON-SALARY EXPENSES $785.00=========
SRF CONSULTING GROUP, INC. ENGINEERS AND PLANNERSH:\ProjFRGO\7482\_ProjectManagement\P11134R Rev061812_TH 75 AltRte_Rev2.xls
MINNEAPOLIS, MINNESOTA

To: Transportation Technical Committee From: Katie White, Metro COG Date: July 5, 2012 Re: Consider Approval of the Moorhead River Corridor scope of work. The City of Moorhead has requested that Metro COG study the recently vacated lots along the Red River between 60th Avenue South and 28th Avenue North for potential recreational and educational uses. While the primary use of the river corridor is for flood protection measures, both elected officials and city residents see significant potential along the corridor for community amenities and facilities. The 2008 Red River Corridor Study was an initial look at the potential for recreational amenities but was constrained by the private land ownership at the time. With nearly the entire corridor back in the City’s care, it is possible to re-evaluate the initial findings of the Red River Corridor Study and create a specific plan for improvements along the river. The end product of the Moorhead River Corridor Study will consist of a long-range, multi-year vision for what the river corridor could look like, and projects that could be incorporated into the Capital Improvement Program for the City of Moorhead in the years to come. Metro COG will be bringing this scope of work to the Moorhead Planning Commission on July 10; at the TTC meeting on July 12 we will provide feedback from that meeting and any recommended changes to the document. Requested Action: Recommend the Policy Board approval of the Moorhead River Corridor Study scope of work, contingent on the approvals of both the Moorhead Planning Commission and Moorhead City Council.
Attachment 7
1 Moorhead River Corridor Study 2012#708_Draft
Moorhead River Corridor Study – Preliminary Scope of Work
Background
As a result of the floods of 2009, 2010, and 2011, the City of Moorhead initiated a number of interrelated flood mitigation actions. One of the most visible actions is the proactive acquisition of flood-prone properties adjacent to the river. Through that effort, a large portion of private property along the Red River has been transferred to public ownership. The priority use for this property is for flood risk reductionprotection.
A number of citizens have inquired about the future for these areas adjacent to the river. The City of Moorhead has requested that the Fargo-Moorhead Metropolitan Council of Governments (Metro COG) assist in a planning study to develop a long term strategy for the river corridor through Moorhead.
The Moorhead River Corridor Study will focus primarily on the property recently acquired, but will also consider the entire corridor between approximately 60th Avenue South and 28th Avenue North. The recent floods have opened up the need to evaluate strategies to preserve the river corridor in Moorhead as a flood protectionmitigation asset, while at the same time ensuring it is maintained to meet the needs and expectations of Moorhead residents, and to the extent possible, capitalize on feasible opportunities.
The end product of the Moorhead River Corridor Study will consist of a long-range, multi-year vision for what the river corridor could look like, and projects that could be incorporated into the Capital Improvement Program for the City of Moorhead in the years to come.
Project Management
Metro COG staff will lead the development of the Moorhead River Corridor Study. Metro COG will be responsible for stakeholder coordination, project development, and plan preparation activities. The City of Moorhead and its departments will provide available data as needed to support project development efforts. Metro COG will defer to the City of Moorhead for input and guidance throughout the development of the River Corridor Study. Metro COG will be assisted by a multi-disciplinary project team from the City of Moorhead, including direct contact with the City Manager;s offices.
Review of Prior Documents
Metro COG staff will review relevant documents and previous studies that could provide guidance on the development of the River Corridor Study. Plans evaluated in the 2008 Red River Greenway Study include:
o Red River Action Plan (1989); o Regional Urban/Design Assistance Team (1989); o Fargo Riverfront Development Master Pan (2002); o Four-Community Sports Facility Framework Plan for the Metropolitan Area (2005); o Fargo-Moorhead Downtown Framework Plan Update (2007);
Attachment 7a
2 Moorhead River Corridor Study 2012#708_Draft
More recent documents to review as part of this Study include:
o Red River Greenway Study (2008); o Moorhead Regional Park Plan; o Moorhead Comprehensive Plan (2009); o North Moorhead/Oakport Growth Area Plan & AUAR; o Metropolitan Bicycle and Pedestrian Plan (2011); o Previous work conducted by local colleges on Woodland Park concepts;
These plans will be reviewed to understand previously developed concepts and principles that may relate to the Moorhead River Corridor Study.
Public Input
Public Input Meetings
The overall plan development process will be guided by Metro COG’s Public Participation Plan (PPP). This will include up to four (4) public input meetings. Public input meetings will be structured so as to gather input and feedback from Moorhead residents and the general public regarding various aspects of the Study. Public input meetings are envisioned at key milestones within the overall project. The format and content of the public input meetings will be developed in cooperation between Moorhead and Metro COG. The City of Moorhead will be responsible for publishing all public input meeting notices; and mailing all notifications to affected property owners in a fashion that is compliant with Metro COG’s PPP.
Internal Municipal Communication and Input
Metro COG will gather input from internal municipal committees and boards to include the following:
o City Council o Park Advisory Board o Planning Commission o Economic Development Authority o Others as determined by the City of Moorhead
This input can be gathered through attendance at regular meetings of these boards/committees; or through the scheduling of “special purpose meetings”, as determined appropriate by the City of Moorhead. Interim reports and or memorandum developed as part of the study would be vetted through these internal boards/committees, as determined appropriate by the City of Moorhead.
Existing Conditions, Issues, and Opportunities
Property Ownership Assessment
Metro COG in cooperation with the City of Moorhead will develop an assessment of current lands held in City/public ownership. The assessment will also focus on property currently identified by the City of

3 Moorhead River Corridor Study 2012#708_Draft
Moorhead as priority property acquisitions with the intent to increase citywide flood protectionmitigation.
Flood Constraints
Since the primary function purpose for clearingfor the River Corridor of residential uses is flood controlmitigation, any potential new recreational or interpretative facilities proposed as a result of this Study must not compromise the integrity of the flood protectionrisk reduction system. Metro COG will work in cooperation with the City of Moorhead to develop flood stage assumptions to guide planning efforts regarding the implementation of future facilities or reuse activities inoutside (on the wet side) and inside (on the dry side) of existing or future levee systems along the Moorhead River Corridor. A map will be produced in cooperation with City staff in advance of the first public meetings to outline various barriers/limitations due to flooding, geotechnical conditions, and/or other constraints.
River Corridor Opportunities Sites
Portions of the River Corridor through the Fargo-Moorhead area host a prominent network of shared-use paths that is supported by three seasonal bridges that connect Moorhead to Fargo. This network of paths is considered the backbone of the recreational trail system in Moorhead and Fargo. Metro COG has worked with Moorhead and Fargo in the past to work towards planning and funding solutions to replace two of these bridges (Lindenwood/Gooseberry Parks and Oak Grove/Memorial Parks). Through previous planning Metro COG has identified other potential bicycle and pedestrian bridges across the Red River that would improve interregional connections along the River Corridor.
The 2008 Red River Greenway Study identified Expansion Opportunities Sites along the River Corridor throughout the FM Metropolitan area. The intent of identifying Expansion Opportunity Sites was driven by the desire to provide connections between key destinations along and adjacent to the River Corridor. The Moorhead River Corridor Study will reevaluate past planning in this area and establish strategies to further strengthen connections to destinations along the River Corridor, both in Moorhead and in Fargo, with in the limitations and constraints identified along the corridor.
River Corridor Plan & Strategy Development
Facility Evaluation
Based in large part upon public involvement and citizen participation, Metro COG and the City of Moorhead will develop a set of recommendations and strategies that would foster measured integration of flood tolerant, low maintenance facilities and/or reuse activities within or adjacent to the River Corridor. The following would be envisioned as part of the River Corridor Plan:
o Trees & Landscaping: Outline the strategy and potential for tree planting and landscaping improvements. The flood mitigation improvements constructed on many of the acquired lots required the removal of trees. Replacement of lost trees, and opportunities for landscaping enhancements, will be considered within the limitations
4 Moorhead River Corridor Study 2012#708_Draft
of vegetation free zones and vegetation management zones required to ensure the structural integrity of the flood mitigation improvements.
o Trails & Shared Use Paths: Outline the strategy for the potential addition of new trails and shared use paths on properties recently acquired. The goal is to expand upon the existing trail system which runs along the Red River in the City Moorhead, with an attempt to make connections to existing or future facilities planned by the City of Fargo. This analysis would likely include a discussion regarding future bicycle and pedestrian connections spanning the Red River.
o Recreational Facilities: The plan will explore, in consultation with the public, the potential to add recreational amenities along the Red River, keeping in mind that any new facilities need to be low maintenance and flood tolerant. This may present itself in the form of ‘pods’ of activity areas along the corridor and/or exploration of opportunities to highlight or further enhance existing core regional parks such as Gooseberry, Woodlawn and MB Johnson Park.
o Common Space: The plan will explore the feasibility of developing low intensity common space for gatherings/events that can be used by the City to support existing or future parks and recreation programming.
o Community Gardens: The plan will explore the development of community garden
space(s) to allow for residents and citizens to plant and grow food for either personal consumption for resale at community/farmers markets.
o Public Art: The plan will explore opportunities for public art to be incorporated with the
proposed project components to ensure an attractive destination for residents and tourists.
Maintenance
The Study will outline the strategy to maintain existing and future lands held by the City; including an understanding of the maintenance needs for the addition of any new facilities, common space, or reuses developed as part of the planning process. This element of the Study will also explore the structure and intent of existing and future lease agreements between the City of Moorhead and adjacent property owners regarding lots owned by the City.
Funding and Implementation Plan
The Moorhead River Corridor Study will be developed with an eye on fiscal reasonableness. A detailed implementation plan will be developed that would reflect realistically available local, State, and Federal resources. Metro COG in cooperation with the City of Moorhead will develop a prioritized implementation plan to guide implementation of the River Corridor Study by building projects into the Capital Improvement Program and existing available resources.
5 Moorhead River Corridor Study 2012#708_Draft
Metro COG will assist in identifying potential funding sources, and as part of a separate work program item could assist the City of Moorhead prepare grant applications for relevant potential funding sources.
Consultant/Contractor Assistance
Pending the first round of public involvement and dependent upon the type of detail required as the Moorhead River Corridor Study is developed, a third party contractor may be needed to provide specialized technical assistance to support the planning process. Specialized technical assistance may be required from a consultant to assistant in understanding the types and kinds of facilities relevant and feasible along the River Corridor, if supported publically. Technical assistance may also be required to develop cost estimates to support the development of the implementation plan. Technical assistance may also be needed regarding environmental considerations applicable to various implementation elements of the Moorhead River Corridor Study, including landscaping and re-vegetation plans.
Plan Preparation & Approvals
Metro COG will develop summary documentation at appropriate points in the planning process to assist in interim decision making by the City of Moorhead. To ensure a final plan is consistent with City goals and objectives, Metro COG would envision City Council direction at critical points in the planning process prior to final approval. It is envisioned that the Metro COG will prepare documentation roughly conforming to the following elements of the planning process:
o Existing Conditions, Issues Identification, & Summary of Early Public Input;
• After an initial a compilation and review of existing conditions and following the first public input meeting, Metro COG will present an Issues and Opportunities Memorandum to the Moorhead City Council. The Memorandum will document existing conditions and limitations along the River Corridor and present a range of potential opportunities identified by the public, residents, City staff, and Metro COG. Action on this Memorandum would be structured so as to guide details regarding the next phase of the River Corridor Study.
o Alternative Development & Analysis;
• Following action and direction from the City Council on the Issues and Opportunities Memorandum, Metro COG in cooperation with City Staff would prepare an Alternatives Memorandum outlining a set of potential specific enhancements and maintenance programs for the River Corridor. The Memorandum would include an evaluation of each alternative based on a metric of opportunities and limitations developed as part of the existing conditions analysis.
o Recommendations, Strategies, & Implementation Plan;
• Following action and direction from the City Council on the Alternatives Memorandum, Metro COG in cooperation with City Staff will prepare a
6 Moorhead River Corridor Study 2012#708_Draft
Recommendation, Strategies, and Implementation Plan for City Council action. This memorandum would outline a set of recommendations and strategies for advancing enhancements along the River Corridor. This Memorandum will also include an implementation plan that demonstrates a general phasing of how preferred enhancements are programmed and implemented in the years ahead.
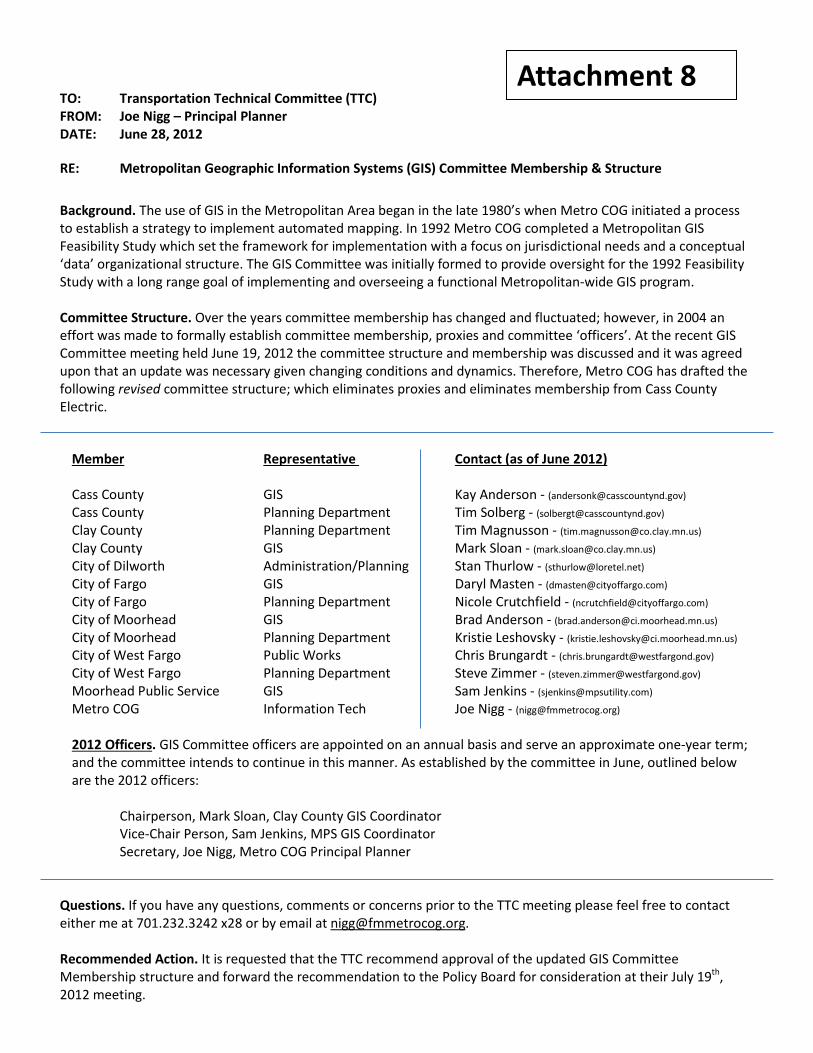
TO: Transportation Technical Committee (TTC) FROM: Joe Nigg – Principal Planner DATE: June 28, 2012 RE: Metropolitan Geographic Information Systems (GIS) Committee Membership & Structure
Background. The use of GIS in the Metropolitan Area began in the late 1980’s when Metro COG initiated a process to establish a strategy to implement automated mapping. In 1992 Metro COG completed a Metropolitan GIS Feasibility Study which set the framework for implementation with a focus on jurisdictional needs and a conceptual ‘data’ organizational structure. The GIS Committee was initially formed to provide oversight for the 1992 Feasibility Study with a long range goal of implementing and overseeing a functional Metropolitan-wide GIS program. Committee Structure. Over the years committee membership has changed and fluctuated; however, in 2004 an effort was made to formally establish committee membership, proxies and committee ‘officers’. At the recent GIS Committee meeting held June 19, 2012 the committee structure and membership was discussed and it was agreed upon that an update was necessary given changing conditions and dynamics. Therefore, Metro COG has drafted the following revised committee structure; which eliminates proxies and eliminates membership from Cass County Electric.
Member Representative Contact (as of June 2012) Cass County GIS Kay Anderson - ([email protected]) Cass County Planning Department Tim Solberg - ([email protected]) Clay County Planning Department Tim Magnusson - ([email protected]) Clay County GIS Mark Sloan - ([email protected]) City of Dilworth Administration/Planning Stan Thurlow - ([email protected]) City of Fargo GIS Daryl Masten - ([email protected])
City of Fargo Planning Department Nicole Crutchfield - ([email protected]) City of Moorhead GIS Brad Anderson - ([email protected]) City of Moorhead Planning Department Kristie Leshovsky - ([email protected]) City of West Fargo Public Works Chris Brungardt - ([email protected]) City of West Fargo Planning Department Steve Zimmer - ([email protected]) Moorhead Public Service GIS Sam Jenkins - ([email protected]) Metro COG Information Tech Joe Nigg - ([email protected]) 2012 Officers. GIS Committee officers are appointed on an annual basis and serve an approximate one-year term; and the committee intends to continue in this manner. As established by the committee in June, outlined below are the 2012 officers: Chairperson, Mark Sloan, Clay County GIS Coordinator Vice-Chair Person, Sam Jenkins, MPS GIS Coordinator
Secretary, Joe Nigg, Metro COG Principal Planner Questions. If you have any questions, comments or concerns prior to the TTC meeting please feel free to contact either me at 701.232.3242 x28 or by email at [email protected]. Recommended Action. It is requested that the TTC recommend approval of the updated GIS Committee Membership structure and forward the recommendation to the Policy Board for consideration at their July 19th, 2012 meeting.
Attachment 8
To: Transportation Technical Committee From: Katie White, Metro COG Date: July 12, 2012 Re: Consider Approval of the Metropolitan Food Systems Plan scope of work.
Clay County Public Health and Fargo Cass Public Health have requested the Fargo-Moorhead Metropolitan Council of Governments (Metro COG) develop a plan to address food access and local food issues. In December, 2011 the Policy Board amended the current 2011-2012 UPWP to include the Metropolitan Food Systems Plan. At the time the project was amended into the UPWP, it was understood that before starting the project Metro COG would develop a scope of work and funding plan for the project, in coordination with NDDOT and FHWA. At the June 2012 TTC meeting, this body approved the administrative modification of the UPWP to create a funding strategy for this project. The Policy Board will be meeting next week to discuss the administrative modification, as well as this scope of work, should TTC approve and recommend the motion.
The attached scope of work details the transportation, land use, community development, and public involvement components involved with this plan. Clay County Public Health and Fargo Cass Public Health have already dedicated several hours of staff time to preliminary data collection and task force management. Key components of the plan include: local agriculture opportunities, land use regulations, economic development opportunities, food security, and food waste and recycling. Metro COG’s experience in plan preparation and organization is an important component of this project’s region-wide success.
Requested Action: Recommend Policy Board approval of the Metropolitan Food Systems Plan Scope of Work.
Attachment 9
1
Fargo-Moorhead Metropolitan Food Systems Study
Scope of Work
Background In late 2010 the Cass Clay Food Systems Initiative (CCFSI) was created in response to the growing interest in assuring access to healthy food for all residents and providing opportunities to grow and consume locally grown food. The goal of CCFSI is to impact all levels of the community food system to assure that residents have access to safe, nutritious, and affordable foods. CCFSI aims to improve the production, sales, distribution, and consumption of healthy and locally grown foods within the Fargo-Moorhead metropolitan area. Strengthening the local food system will positively impact the health, food security, economy, and environment of the two-state community. The CCFSI Steering Committee includes members from the University of Minnesota Extension Service, North Dakota State University Cass County Extension Service, Fargo Cass Public Health, and Clay County Public Health. These partners recruited members for the Initiative’s Planning Committee from all sectors of the local food system. The Planning Committee set the direction of the Initiative, developed a framework, and defined five task force groups: Economic Development, Food Access, Food Infrastructure, Urban Agriculture, and Outreach & Education. The initiative sponsored a community engagement event in September 2011 and currently has 80 members involved in regular task force meetings. Work by the CCFSI to strengthen the local food systems is a regional issue that crosses jurisdictional boundaries. Food producers and distributors operate within and throughout the entire region; the coordination of an emphasis on local foods needs to be region-wide as well. Coordinated planning is necessary to ensure successful implementation of the whole food system from farmer to table. The Cass Clay Food Systems Initiative, with guidance from Metro COG, has prepared the following scope of work to create a food systems report detailing existing conditions and a strategy to create a stronger community for local, healthy foods.
Existing Conditions
The Fargo-Moorhead Metropolitan Area is located in the Red River Valley region of glacial Lake Agassiz. When the glacial lake retreated 10,000 years ago it left behind nutrient-rich soil which was identified by farmers in the 1800s as an ideal place to grow crops. This has resulted in a regional emphasis on commodity production, which means that food produced in the greater Fargo-Moorhead area is shipped elsewhere for processing before being returned for sale and consumption at the region’s grocery stores. Eating more local foods is a sustainable alternative by reducing the excess transportation and energy costs involved in the traditional food system, in addition to supporting the economic vitality of the FM Metropolitan Area.
Attachment RA-9a
_______ 2 - Fargo-Moorhead Metropolitan Area Food Systems Study – Scope of Work Prepared by the Fargo-Moorhead Metropolitan Council of Goverments and Cass Clay Food Systems Initiative
Despite the richness and diversity of the area’s agriculture community, there remains a lack of healthy, local foods to consume. Property owners within the urban area may choose to plant fruits and vegetables for private consumption, but those renting or owning multi-family units do not have access to land for planting and harvesting. While two large community gardens exist (Probstfield and Yunker Farm), these are located on the far edge of the urban area which makes it nearly impossible to access by bus and difficult to reach using a bicycle, especially for families. Additionally, there is an increasing interest by citizens to find space within neighborhoods to garden. Having the ability to choose to produce, eat, and cook locally-sourced foods is an important part of community connectivity and long-term livability.
Relevance to Surface Transportation
The Cass Clay Food System Initiative has partnered with the Fargo-Moorhead Metropolitan Council of Governments (Metro COG) regarding the creation of a plan to address food access and local food issues. Metro COG is the region’s metropolitan planning organization (MPO), the state- and federally-designated transportation planning agency for the area. Metro COG is one of the few truly region-wide, bi-state entities that work on a multi-jurisdictional scale. Metro COG would not be the first MPO to create a food system plan; the Chicago Metropolitan Agency for Planning (CMAP) created a food systems strategy, dedicated an entire section of its long range plan to local food, and actively participates in food systems planning. Metro COG is qualified to proceed with this project based on the Federal Highway Administration (FHWA) planning factors, their relationship to the Department of Transportation’s livability and sustainability principles, and the direct impact in the environmental justice (EJ) targeted areas of low income and minority populations. The scope of this project, as discussed below, has a variety of impacts on the region and its relationship to transportation and land use issues. Pursuant to 23 CFR 450.306, several current FHWA/FTA Planning Factors are relevant to a food systems plan for the FM Metropolitan Area.
Metropolitan Transportation Planning Factors
1) Economic Vitality of an Area - 23 CFR 450.306(1)
As mentioned above, the FM Metropolitan Area is located in an ideal environment for agriculture. Over the past several decades this has been used to develop large-scale agriculture businesses and farms, focusing primarily on commodity products and wholesale commerce. An increased emphasis on locally-based foods, suppliers, and consumers would increase the economic vitality of small-scale production (whether it is small in physical, production, or population size). Supporting these activities will establish a well-rounded economy for food production and sales, instead of limiting availability and accessibility to large supermarkets. This plan will ultimately create an environment that is accessible to independent and entrepreneurial businesses to supplement the current market for food in Fargo-Moorhead.
A recent study by the City of Fargo found that the average household spends 27% of its income on transportation, higher than almost every other category of household spending. Bringing
_______ 3 - Fargo-Moorhead Metropolitan Area Food Systems Study – Scope of Work Prepared by the Fargo-Moorhead Metropolitan Council of Goverments and Cass Clay Food Systems Initiative
food alternatives to neighborhoods would free up some of those funds for alternative purchases and uses.
2) Accessibility and Mobility of People and Freight - 23 CFR 450.306(4)
Food is constantly in motion throughout the FM Metropolitan Area, from raw sugar beets being transported during harvest season to semi-trucks full of canned goods deposited at large institutional buyers. By providing a framework to create an alternative food system in the immediate FM Metropolitan Area, the food system will naturally become entwined with the existing transportation network, increasing access to locally developed food products for those with limited incomes who are currently facing mobility limitations (i.e. low income and minority populations).
Additionally, increasing the number of local access points for food reduces commute time to buy food, likely leading to a decline in the vehicle miles traveled, particularly during peak periods along the FM Metropolitan Area’s busiest commercial corridors. Increasing access to local foods within neighborhoods and at local developed markets increases the likelihood of residents to make food related trips by public transit, as a pedestrian, or on a bicycle.
3) Environment, Energy Conservation, and Quality of Life – 23 CFR 450.306(5)
Promoting the development of a strong local food system will make healthy alternatives easier to reach, thereby improving the public health of area residents, particularly those with lower incomes and minority populations. Locating community gardens and other key components of food infrastructure in established, walkable neighborhoods will decrease the amount of emissions due to automobile use, affecting both the environment and energy conservation. This is one of many small changes that can be made to decrease the total number of vehicle miles traveled and its related side effects.
Partnership for Livability
Since 2009 the DOT, EPA, and HUD have been working to forward the Partnership for Livability. The development of a Food Systems Plan is seen as a way to develop strategies to achieve increased livability with in the FM Metropolitan Area. As a whole, the Food Systems Plan brings together stakeholders from transportation, planning, human services, and educators to develop multi-disciplinary strategies to improve access to food. The outcome of the effort will serve to strengthen programmatic commitments among partnering agencies to ensure better use of Federal aid distributed in the FM Metropolitan Area to food production, and access to food via existing transportation network.
1) Livability
Addressing the issue of livability is not a new concept for the FM Metropolitan Area. The City of Fargo has already worked on livable community initiatives, including the downtown renaissance zone, as documented in the “Livability in Transportation Guidebook” from the
_______ 4 - Fargo-Moorhead Metropolitan Area Food Systems Study – Scope of Work Prepared by the Fargo-Moorhead Metropolitan Council of Goverments and Cass Clay Food Systems Initiative
FHWA. Other cities such as Moorhead (MN) and West Fargo (ND) have embraced reinvestment strategies to bring vitality back to older neighborhoods to better utilize existing public infrastructure. The food system plan will be an additional, separate component to ongoing livability improvements region-wide.
a. Enhance Economic Competitiveness
As outlined above, the Food Systems Plan will develop policies to develop an environment that is amenable to local food entrepreneurship, providing a valuable alternative to, and competitor for, traditional food suppliers. Local businesses will be better equipped to compete with large corporations for a consumers’ dollar. These smaller operations are likely to be located in neighborhood-based locations, allowing for easier access by all residents of a residential area, in comparison to large supermarkets that are traditionally found in commercial corridors accessible only by automobile. This initiative aims to identify market opportunities to reinvest along existing transportation systems which are more accessible to lower income and minority populations, and which are able to meet larger commuter demands.
b. Support Existing Communities
An important component of the Food System Plan will be the establishment of guidelines for locating new community gardens. Preliminary analysis indicates that existing communities are the ideal location for these amenities, as they would use currently underutilized land in areas where transportation and water resources are already established and available. A renewed focus on the established communities promotes the health of a city’s core area and the best use of existing road and utility infrastructure. Community gardens are one component of the larger redevelopment strategies available to local governments.
c. Value Communities and Neighborhoods
The food system plan places a high value on communities and neighborhoods by bringing food to where the people live, rather than by requiring individuals and families to travel further distances to obtain food. Cities and local governments will use the plan to guide policy- and decision-making, but the end result will be projects adequately scaled for implementation at the neighborhood level, with a regional impact on the health and wellness of the larger area. Utilizing the available land, transportation network, and utility structures in Fargo-Moorhead will highlight its unique character and other benefits of living and working here.
2) Sustainability
Farmland continues to disappear in the immediate area surrounding Fargo-Moorhead, slowly eliminating the connection between the people and the food they eat. As described above, the
_______ 5 - Fargo-Moorhead Metropolitan Area Food Systems Study – Scope of Work Prepared by the Fargo-Moorhead Metropolitan Council of Goverments and Cass Clay Food Systems Initiative
food that is produced nearby is commodity-based and meant for processing, not consumption. Furthermore, improving the quality of food resources closer to residential neighborhoods decreases the necessity for a car, or for longer trips in a car. Re-establishing a connection between food and its consumers promotes sustainability on a region-wide scale.
Relationship to Environmental Justice Areas
Environmental justice target groups are most likely to have problems and concerns regarding food access. A primary goal will be to identify strategies to bring healthy, local food in closer proximity to those who currently do not have the opportunity to buy and eat it. Preliminary data analysis conducted by local health organizations shows the existence of “food deserts” within the FM Metropolitan Area where low-income and minority populations are isolated from existing food markets and retail outlets. Metro COG, Fargo Cass Public Health, and Clay County Public Health have worked together in the past to affirm that nearly all area grocery stores are accessible using MATBUS, the region’s transit provider, demonstrating a minimum standard of service for healthy eating options.
Scope of Work
1.0 Project Management
Metro COG staff in consultation with designated Cass Clay Food Systems Initiative representatives (serving as the Study Review Committee) will lead the development of the Food Systems Plan. Metro COG will be responsible for stakeholder coordination, project development, and plan preparation development. Significant work has been completed already in identifying key members and components of the current food system. Fargo Cass Public Health and Clay County Public Health staff will assist in data collection and public participation meetings utilizing existing resources as appropriate. 2.0 Public Involvement
The overall plan development process will be guided by Metro COG’s Public Participation Plan (PPP), as developed pursuant to 23 CFR 450.316.
2.1 Study Review Committee (SRC)
The Study Review Committee (SRC) will be composed of key leadership from the CCFSI, listed below, which include each of the existing Task Force leaders and other key community interests. There will be six (6) meetings of the SRC. The SRC will be responsible for providing overall project direction to Metro COG. The SRC will meet periodically throughout the plan development process, and will be responsible for guiding the actions of Metro COG.
• Kim Lipetzky, Fargo Cass Public Health • Gina Nolte, Clay County Public Health • Abby Gold, North Dakota State University Extension and University of Minnesota Extension • Jon Evert, Clay County Commissioner • Mike Williams, Fargo City Commissioner

_______ 6 - Fargo-Moorhead Metropolitan Area Food Systems Study – Scope of Work Prepared by the Fargo-Moorhead Metropolitan Council of Goverments and Cass Clay Food Systems Initiative
• Kim Citrowske, Fargo Planning and Development • Deb Haugen, Independent Health, Wellness, and Fitness Consultant • Jonathan Moser, ND FARRMS • Rita Ussatis, Cass County Extension • Sara Van Offelen, University of Minnesota Extension – Moorhead • Melissa Kossick, High Plains Reader • Megan Ness, North Dakota State University Extension • Jamie Holding Eagle, Citizen
2.2 Public Input Meetings
Metro COG will host two (2) public input meetings: one at the beginning of the process to solicit guidance, and one at the end for feedback on the final document. Metro COG will utilize a database of interested persons generated in cooperation with the SRC. Metro COG will also use its list of stakeholders to ensure adequate participation from low income and minority populations, as well as other interested persons who have indicated a desire to participate in the CCFSI process.
2.3 Focus Groups & Key Person Interviews
Metro COG will host 8-10 focus group meetings. Focus group members will be drawn from the CCFSI task forces that have already been established as well as regional growers, producers, consumers, and other interested parties identified by CCFSI. A limited number of key person interviews with experts and professionals in the food systems fields will be conducted.
It is understood that the CCFSI will make arrangements for meeting room space and assist in the identification of participants and other key stakeholders for the public involvement meetings. CCFSI and Metro COG will coordinate on the development of meeting summaries/minutes, etc. Metro COG will be responsible for all meeting facilitation.
3.0 Food Systems Data Collection and Evaluation
Metro COG and the SRC have agreed to the final series of measurable and relevant data needs and available data from various departments and agencies to be used for the report. This list was generated in part by a survey of CCFSI members. For the purposes of data collection, the geographic boundaries used for each of these categories will vary but will center on the FM Metropolitan Statistical Area (MSA). It is understood that the SRC in cooperation with the CCFSI will be active and cooperative in continuing seek new data to support the Food System Report and to share existing collected to date.
A phone survey was conducted in the spring of 2012 regarding local food consumption by non-chain restaurants and institutions. This data will be incorporated into the final product created by Metro COG. Any future data collection, support documents, and summaries will be provided to Metro COG for use in the plan development process.
3.1 Assessment of Existing Community Based Agriculture Production Levels and Opportunities Areas
_______ 7 - Fargo-Moorhead Metropolitan Area Food Systems Study – Scope of Work Prepared by the Fargo-Moorhead Metropolitan Council of Goverments and Cass Clay Food Systems Initiative
Data will be gathered to demonstrate the current state of community based agricultural production in the FM Metropolitan Area. This includes the number of traditional farms and their acreage for growing products, estimated acreage of urban land in agricultural production, and the number of CSA farms and distributors. This information will come from a combination of standardized reporting sources as well as direct contact by CCFSI participants or Metro COG. This component of the plan will evaluate existing and potential agriculture productivity in the area, and identify opportunities for increase production of community based agriculture. An assessment of the existing conditions of community agriculture in the following areas:
• Number/percent of retail food businesses that sell local food; • Percent and/or amount institutions purchasing from local sources; • Number of stores (grocery/convenience) carrying fresh produce; • Number/percentages of local distributors/processors of local foods; • Number of local distributors/processors that utilize local foods; • Existing locations of community gardens, farmers’ markets, urban beekeeping, and
animal husbandry will be identified using direct contact with owners or operators.
3.2 Land Use, Regulation & Public Policy Analysis
Metro COG will develop an assessment of local conditions to determine available locations for expanding all components of the food system to increase development of community based agriculture (as outlined in Section 3.1). This will involve the use of existing and future land use conditions, and an assessment of local public policy and regulations regarding community based agriculture. An inventory of vacant land will be conducted and evaluated to gauge the potential for further expansion of community based agriculture. This element of the analysis will look to develop an understanding of current limitations of current land use and zoning policies on the expansion of community based agriculture in the FM Metropolitan Area.
3.3 Community & Demographic Profile Regarding Access to Food
Metro COG will use a host of existing data sources to demonstrate the accessibility of food to various demographic elements of the FM Metropolitan Area. Existing data sources will be used to map grocery stores and other regional food businesses to determine if there is adequate access to a variety of foods through traditional and non-traditional outlets. Food access will be looked at in relation to existing demographics and community transportation assets.
The ability of low-income individuals and families to have adequate access to healthy and local foods is one of the key goals of the CCFSI and is best understood through comprehensive data analysis. The following data sets will used to demonstrate the accessibility of food within the FM Metropolitan Area:
• Number of farmers markets that accept nutrition program coupons (SNAP, WIC, Senior FM coupons);
• Number/percentage of low income living greater than 1 mile to a grocery store;
_______ 8 - Fargo-Moorhead Metropolitan Area Food Systems Study – Scope of Work Prepared by the Fargo-Moorhead Metropolitan Council of Goverments and Cass Clay Food Systems Initiative
• Number of households with no car living greater than 1 mile to a grocery store; • Proportion of households within ½ mile of a Farmer’s Market; • Proportion of households within ½ mile of a community garden; • Proximity of grocery stores to public transit; • Proximity of grocery stores to bicycle and pedestrian facilities.
3.4 Economic Development
This section of the plan will deal specifically with the impact that local food has on the local economy. The economic value of the food market will be evaluated using local jobs and production value totals gathered through direct contact or data aggregation services where available. Components of economic development are integrated into other sections of the food systems plan, such as existing agricultural productivity. This section of the Plan will demonstrate the existing economic nexus regarding community based agriculture within the FM Metropolitan Area. The goal will be to identify opportunities to expand the existing opportunities to achieve greater market share.
3.5 Food Security
WIC and SNAP data will be used to determine if healthy, local foods are available to and accessible by populations that are most at risk for not receiving adequate nutrition. The analysis will entail a collection and organization of federal food nutrition program participation rates. Non-profit social service data will be used to determine the demand and availability of food resources for those that do not qualify for traditional federal programs. Data from local food pantries and the Great Plains Food Bank will provide information related to hunger and the number of residents accessing services.
Since food prices have risen considerably over the past several years, it will be important to know the percent change in consumer price index (CPI) for food as it relates to percent change in wages. This would affect the quantity and perhaps quality or content of the foods purchased in Cass and Clay Counties.
A standard for “low-income” will need to be established and agreed to by members of the CCFSI through the creation of an analysis of food security thresholds across the various programs that are available. A discussion among public health officials demonstrated a potential preference for 185% of the poverty level, due to its common use for several social service programs.
3.6 Food Waste and Recycling
Metro COG will gather examples of regional composting and waste-disposal methods from across the country to determine a set of best practices for use in the FM Metropolitan Area. The intent will be to create synergy between larger composting programs and community based agriculture.
4.0 Report Preparation
Metro COG, the SRC, and the CCFSI will use the data resources listed above and others to describe existing conditions in the areas of food access, urban agriculture and production, food infrastructure,
_______ 9 - Fargo-Moorhead Metropolitan Area Food Systems Study – Scope of Work Prepared by the Fargo-Moorhead Metropolitan Council of Goverments and Cass Clay Food Systems Initiative
economics, health and environment. The following documents will be prepared by Metro COG staff with assistance from the SRC and members of the CCFSI. These documents will be researched and written incrementally and will in aggregate amount to a final Food Systems Report.
Metro COG envisions the development of the following interim reports or technical memorandum as plan development proceeds:
• Existing Conditions:
o Based on the data uncovered in sections 2.0 and 3.0 above with contributions from the SRC and CCFSI;
• Issue Identification - Challenges and Opportunities;
o Analysis of existing conditions;
o Analysis of existing policies;
• Recommendations, Strategies, and Implementation Plan;
o Examples of best practices from across the country that are relevant for implementation within the FM Metropolitan Area;
o A clear implementation plan/strategy that addressees the five (5) primary focus areas of CCFSI:
Outreach and Education
Food Infrastructure
Economic Development
Urban/Community Agriculture
Food Access
Upon completion of the planning process Metro COG will generate a concise Executive Summary and Final Report. The Final Report will be inclusive of all data and analysis developed as part of the plan development process; and may include appendices with additional support information. The CCFSI and the SRC will work with Metro COG and be involved in writing certain sections of the report. The CCFSI membership will remain informed and involved throughout the plan development process via group task force meetings.
5.0 Approvals
Resolutions from each local unit of government will be obtained in support of the food systems study final report, as well as final adoption of the Food Systems Plan by the Metro COG Policy Board.
TO: Transportation Technical Committee (TTC) FROM: Joe Nigg – Principal Planner DATE: June 28, 2012 RE: Moorhead Alternative Urban Area-wide Review (AUAR) Contract Addendum
Background. In October of 2008 Metro COG finalized a contract for services with Bonestroo Inc. to complete an update to the 2004 Moorhead Comprehensive Plan and Growth Area Plans. In November (2009) the City of Moorhead adopted the updated Comprehensive Plan. In December (2009) Metro COG’s Policy Board approved an addendum to this existing contract which allocated additional non-designated federal funds to allow completion of an Alternative Urban Areawide Review (AUAR) for the south and east growth areas in Moorhead. An AUAR is essentially a blanket environmental document which covers a large area or multiple development proposals. As part of the AUAR scope of work, Metro COG committed resources (both internally and through the ATAC technical assistance budget) to assist in project coordination; and more importantly, to provide model output data for a ‘full build’ scenario. Due to 2015 and 2035 travel demand model validity concerns the AUAR was put on hold in September (2011) and the contract was extended until March 31, 2012. Metro COG completed model re-validation efforts in April of 2012 which included the adoption of updated 2015 and 2035 traffic forecast models. Thus, project partners are looking to get this project back on track and completed. Contract Addendum. The attached addendum extends the AUAR contract with Stantec, Inc. (formerly Bonestroo, Inc.) until March 31, 2013. The total budget for this environmental document was originally established at $16,000, of which $7,713 remains. Due to the significant delay to complete the project some of the research and work completed by Stantec will need to be re-evaluated and/or redone. The addendum allocates an additional $5,000 ($4K undesignated; 1K local) to finalize the AUAR document; thereby establishing a revised total project budget at $12,713. Questions. If you have any questions, comments or concerns prior to the TTC meeting please feel free to contact me at 701.232.3242 x28 or by email at [email protected]. Recommended Action: It is requested that the TTC recommend approval of the Moorhead AUAR contract addendum and forward the recommendation to the Policy Board for consideration at their July 19th, 2012 meeting.
Attachment 10
Exhibit B Addendum No. 5 to Services Agreement
Moorhead Comprehensive Plan / AUAR Update
This addendum to the Services Agreement dated October 17, 2008 (amended December 9, 2009) is made effective as of July 19th, 2012 by and between the undersigned parties.
1. Services to be provided:
No changes to elements within the original scope of work; however, the final document shall be prepared in a technical memorandum format consistent with requirements and expectations of the Minnesota Environmental Quality Board for AUAR updates.
2. Schedule:
To extend the period of performance on the Moorhead Comprehensive Plan / AUAR Update from March 31, 2012 to March 31, 2013.
Fargo-Moorhead Metropolitan Council of Governments
By: _______________________________________ Wade E. Kline, Executive Director
Dated: ____________________________________
Bonestroo
By: ________________________________________
Its: ________________________________________
Dated: ______________________________________