fin prep nal evaluat pared by: tion for sa an diego g gas & elect
TRANSCRIPT
Fin
PrepDr. JoMs. CDr. St
nal Evaluat
pared by: onathan CooCandice Churtephen Geor
tion for Sa
k, Senior Corchwell, Senirge, Senior V
an Diego G
nsultant ior ConsultanVice Presiden
Gas & Elect
nt t
tric's Plug‐Pricing
Submitted
in Electric and Techn to San DiegoSubmitted
Fe
Vehicle TOnology Stuo Gas & ElecBy Nexant, bruary 20, 20
OU udy ctric Inc. 014
Tab
1 Ex
2 In
2.1
2.2
2.3
2.4
2.5
2.6
3 A
3.1
3.2
3.3
4 A
5 El
5.1
5.2
5.3
5.4
6 Co
Appen
A
A
A
Appen
B.
B.
Appen
Fina
ble of C
xecutive Summ
ntroduction.....
Study Backgr
Study Partici
EV Charging
Metering an
Experimenta
Report Orga
nalysis of EV C
EV Charging
Average Loa
Dynamic Loa
nalysis of Who
lectricity Dema
Model Descr
Data ............
Results ........
Implications
onclusions .....
Nissanndix A
.1 Nissan LE
.2 EV Projec
.3 Photos of
Modendix B
.1 Model ...
.2 Estimatio
Linkinndix C
al Evaluation for Sa
Conten
mary ................
.......................
round .............
ipants .............
Equipment ....
d Billing ..........
al Design .........
nization ..........
harging Data f
Events ...........
d Shapes ........
ad Analysis ......
ole‐house Data
and Model ......
ription ............
.......................
.......................
for EV Rate De
.......................
n LEAF Feature
EAF Features ...
ct Background
f EV Charging a
el Developmen
.......................
on ....................
g EV Charging
an Diego Gas & Ele
ts
.......................
.......................
.......................
.......................
.......................
.......................
.......................
.......................
for Customers
.......................
.......................
.......................
for EV‐TOU‐2
.......................
.......................
.......................
.......................
esign ...............
.......................
es & EV Project
.......................
.......................
and Metering E
t .....................
.......................
.......................
Behavior to Su
ectric's Plug‐in Ele
.......................
.......................
.......................
.......................
.......................
.......................
.......................
.......................
in Rate Experim
.......................
.......................
.......................
Customers in
.......................
.......................
.......................
.......................
.......................
.......................
t Background .
.......................
.......................
Equipment .....
.......................
.......................
.......................
urvey Respons
ectric Vehicle TOU
.......................
.......................
.......................
.......................
.......................
.......................
.......................
.......................
ment ..............
.......................
.......................
.......................
the EV Project
.......................
.......................
.......................
.......................
.......................
.......................
.......................
.......................
.......................
.......................
.......................
.......................
.......................
es ...................
Pricing and Techn
........................
........................
........................
........................
........................
........................
........................
........................
........................
........................
........................
........................
t and Not in the
........................
........................
........................
........................
........................
........................
........................
........................
........................
........................
........................
........................
........................
........................
nology Study
.................... 1
.................... 1
.................... 1
.................... 2
.................... 6
.................... 6
.................... 8
.................. 11
.................. 12
.................. 12
.................. 17
.................. 23
e Study ..... 28
.................. 30
.................. 30
.................. 34
.................. 37
.................. 42
.................. 44
.................. 46
.................. 46
.................. 46
.................. 46
.................. 48
.................. 48
.................. 50
.................. 54
i

Executive Summary
Final Evaluation for San Diego Gas & Electric's Plug‐in Electric Vehicle TOU Pricing and Technology Study 1
1 Executive Summary
This report documents results from San Diego Gas & Electric Company’s (SDG&E’s) multi‐year plug‐in
electric vehicle (EV)1 Pricing and Technology Study (Study), incorporating a temporary experimental EV
rate approved by the California Public Utilities Commission (CPUC).2 The Study employed a randomized
control trial (RCT) experimental research design whereby SDG&E EV customer participants were
randomly assigned to one of three EV tariffs, each with different price ratios between on‐peak, off‐peak
and super off‐peak rates. The Study was approved by the CPUC to provide an early view of EV customer
charging response to time‐varying rates for EV charging to help inform state electricity pricing policy.
Customer decisions regarding when they charge their EV at home have major implications regarding
distribution system planning and operations as well as system capacity needs. It is important to
understand the degree to which pricing and technology influence these decisions before the rate of EV
adoption increases in SDG&E’s service territory, especially if it is determined that pricing and technology
have a strong influence. For example, if EVs are charged at peak times, then each vehicle is roughly
equivalent to an additional household’s load added to a neighborhood.3 This could require adding
system capacity, as well as near term distribution system upgrades. On the other hand, if EV customers
can be encouraged to charge during off‐peak times when system capacity is plentiful then
enhancements to system capacity can be avoided or deferred.
Overview of Experiment
The San Diego region was one of a number of regional sites selected for launching the EV Project,
funded by the U.S. Department of Energy (DOE) as the nation’s largest deployment of EV charging
infrastructure. The selection of the San Diego region for the EV Project was in part due to Nissan’s
announcement to target the region for the 2011 launch of the Nissan LEAF deployment in significant
volumes. Together, these unique market conditions created an opportunity for SDG&E to propose and
design a study with CPUC approval to examine EV customer time‐of‐use charging behavior.
The Study tested three experimental TOU rates, each of which has three periods: peak, off‐peak and
super off‐peak. Customers who chose to be part of the rate experiment through the EV Project
qualifying process were randomly assigned to one of the three TOU rates for the duration of the Study.
The rates apply only to load or usage from the electric vehicle supply equipment (charging unit) and not
to the customer’s entire house load, and were separately metered and billed. The Study only examines
charging behavior at home; it does not look at public or other non‐home charging facilities.
Each rate consists of different prices for charging during each of the TOU periods. The on‐peak period
runs from noon to 8 PM, the off‐peak period runs from 8 PM to 12 AM and 5 AM to noon, and the super
1 All vehicles in the SDG&E rate experiment are PEVs (all electric Plug-in Electric Vehicles); however, for simplicity these vehicles are referred to as EVs in this report.
2 SDG&E EV TOU Pricing and Technology Study, Advice Letter 2157-E (U 902-E), filed March 26, 2010 and approved by the CPUC, June 24, 2010, Resolution E-4334.
3 Typical peak EV charging load for a given household in this study is 2.5-3 kW. Households in SDG&E’s territory typically have peak summer loads of 1-2 kW. Typical summer loads vary depending on many factors, such as the presence of central air-conditioning.

Executive Summary
Final Evaluation for San Diego Gas & Electric's Plug‐in Electric Vehicle TOU Pricing and Technology Study 2
off‐peak period runs from 12 AM to 5 AM. These TOU periods do not vary by day of week and make no
exceptions for holidays, or summer and winter seasons. The three rates were designed to test low,
medium and high price ratios between the on‐peak and super off‐peak TOU periods. In addition, the
three rates have different price ratios between on‐peak and off‐peak prices and between the summer
and winter seasons. The low rate (EPEV‐L) has an on‐peak to super‐off peak price ratio of roughly 2:1,
the medium rate (EPEV‐M) has a ratio of roughly 4:1 and the high rate (EPEV‐H) ratio is roughly 6:1.
Approximately 430 participants were assigned to one of the three experimental rates.
In this experiment, the SDG&E customer participants all had the following characteristics:
qualified to participate in the nationwide EV Project;
owned or leased the all‐electric Nissan LEAF;
were on one of three randomly assigned experimental time‐of‐use (TOU) EV rates;
had a Level 2 (240 volt) home charging unit (provided by the EV Project);
had technology available to them through the LEAF or charging unit to set charging times; and
all EV charging loads were separately metered (and billed) on a dedicated 40 amp home circuit.
The key findings of this Study are the product of a two‐year effort to observe and describe when EV
charging takes place, to estimate the effect of the TOU price signal on EV charging and to assess the
degree to which EV charging behavior changes or persists over time.
Key Finding 1: Participant EV Charging Takes Place Mostly During the Super Off‐peak Period
Using Charging Timers
Customers participating in the Study, who are subject to TOU prices for their EV charging, begin the vast
majority of their EV charging events during the super off‐peak period, specifically between 12 AM and 2
AM. Using the shares of total electricity consumption during each period, EPEV‐H and EPEV‐M
customers had the highest percent of total charging done during the super off‐peak period (85% and
83%, respectively), while EPEV‐L customers had 78% of all charging done during the super off‐peak
period (78%). This charging pattern was facilitated by using the charging time setting technology
available standard with the Nissan LEAF and charging unit. Figure 1‐1 shows the charging behavior of
customers on each of the three experimental tariffs.

Executive Summary
Final Evaluation for San Diego Gas & Electric's Plug‐in Electric Vehicle TOU Pricing and Technology Study 3
Figure 1‐1: Average Daily EV Load Shapes for All Customers on Experimental Rates (Weekdays and Weekends Combined: Charging Days Only)
Other conclusions about the timing of EV charging include the following:
Participant EV charging frequency is greater on weekdays than on weekends;
Participant EV charging events lasts about three hours on average;
Participant EV charging patterns do not vary by season;
The majority of participants do not charge their EVs every day. On days that participants do charge their EVs, charging events generally occur only once per day;
The majority of participants appear to consistently use timers to control the time of day when EV charging occurs; and
Participants with Photovoltaic (PV) systems have similar charging patterns as non‐PV participants, when compared across all rates. However, participants with PV are less price responsive than non‐PV participants.
Key Finding 2: Participant EV Charging Exhibit Learning Behavior
During the first four months of participation in the Study, customers in the EPEV‐L and EPEV‐M rate
groups increased their share of super off‐peak charging and decreased their share of peak period
charging, a trend seen for both weekday and weekends. In contrast, EPEV‐H customers generally
SOP OP P OP0
12
3kW
0 5 12 20 24Hour Ending
EPEV-L EPEV-MEPEV-H

Executive Summary
Final Evaluation for San Diego Gas & Electric's Plug‐in Electric Vehicle TOU Pricing and Technology Study 4
exhibited consistent charging behavior for the entire duration of the Study. Figure 1‐2 shows the
average weekday charging behavior for each rate as function of the number of months after a
customer’s first charging session. For EPEV‐L and EPEV‐M customers, the share of super off‐peak
charging increases by 1.8‐2.9% per month and the share of peak charging decreases by 0‐1.3% per
month during the learning phase compared to the rest of the Study period. Super off‐peak charging
shares remain relatively stable after the initial upward trend.
Figure 1‐2: Average Super‐off Peak Proportion of Daily EV Energy Consumption, by Months on Rate4
Key Finding 3: Participant EV Charging Behavior Responds to Price Signals
Formal hypothesis tests show that providing stronger price signals to customers causes them to charge
relatively more during super off‐peak hours and charge less during the on‐peak period on both
weekdays and weekends. Pair‐wise differences in percentage charging shares between rates are shown
in Table 1‐1. Compared to the EPEV‐L rate with the smallest price ratio, the EPEV‐M rate increased the
share of weekday charging during the super off‐peak period by 4 percentage points and reduced the
share of peak period charging by 2 percentage points. The EPEV‐H rate had a larger effect, increasing
the super off‐peak charging share by about 6 percentage points and reducing the peak charging share by
3 percentage points relative to the EPEV‐L rate.
4 Bars in the graph represent 95% confidence intervals for each average monthly super off-peak charging share.
70
80
90
Avg
. % c
harg
ing
su
per
off-
peak
0 6 12 18 24 30Months in study
EPEV-H EPEV-MEPEV-L
Weekday

Executive Summary
Final Evaluation for San Diego Gas & Electric's Plug‐in Electric Vehicle TOU Pricing and Technology Study 5
Table 1‐1: Tests of Pair‐wise Differences in Percentage Charging Shares Between Rates
Day Type Charging Share EPEVL – EPEVM EPEVL – EPEVH EPEVM – EPEVH
Weekday % Peak 1.80 3.08 1.29
% Super Off‐Peak ‐4.16 ‐6.04 ‐1.87
Weekend % Peak 2.33 3.25 0.92
% Super Off‐Peak ‐4.06 ‐6.62 ‐2.55
= Significant at 1%
= Significant at 5%
= Not Significant at 5%
Key Finding 4: EV Customers Are Most Responsive to Changes in On‐Peak and Off‐peak Prices
In order to apply findings from this Study to future electric vehicle charging rates or to EV rates in other
regions, a structural economic model of charging behavior was used to explicitly capture the trade‐offs
associated with charging during one period versus another and provide estimates of price elasticities for
EV charging5. The main conclusions from the model are the following:
Study participants are more responsive to changes in either the peak or off‐peak price than to a change in the super off‐peak price;
Study participants who do not own PV systems exhibit similar responses to changes in the price of electricity used for EV charging as to changes in the price of electricity used for other household loads – own‐price elasticity estimates are in the range of ‐0.3 to ‐0.5;
Study participants who own a PV system are significantly less responsive to prices than their non‐PV counterparts; and
Simulations of EV charging behavior under TOU rates with other price ratios suggest that a price ratio of 6:1 between peak and super off‐peak periods would result in customers using about 90% of their electricity for EV charging during the super off‐peak period and that further increases would provide only marginal additional increases in this percentage.
The primary conclusion from the Study is that TOU prices in conjunction with enabling technology, such
as the on‐board LEAF charging timer or the timer in the charging unit, results in the vast majority of EV
customers charging overnight and in the early morning rather than during on‐peak times. A large body
of evidence suggests that the simple enabling technology of charging timers make it easy and
convenient to charge overnight so that a strong tendency for overnight charging is induced by a small
rate differential.
This Study provides insight on EV customers’ response to time‐varying rates for EV charging and
constitutes valuable information that can inform rate‐setting policy at the CPUC as well as other
5 Price elasticities are quantitative measures of price responsiveness that denote the percentage change in quantity demanded that would result from a 1% change in the price. Negative values mean as price increases, usage falls. A value of -0.3 means that a 10% price increase would result in a 3% reduction in usage.

Executive Summary
Final Evaluation for San Diego Gas & Electric's Plug‐in Electric Vehicle TOU Pricing and Technology Study 6
jurisdictions. However, the results presented in this report must be viewed in the proper context – all
data analyzed here represent the behavior and choices of customers who are early adopters of a new
technology – in this case, an all‐electric EV. Their behavior can reasonably be expected to be similar to
EV customers in the near future, but the extent to which the charging behavior of early adopters
represents the behavior of customers who adopt EVs over a longer time horizon is unclear. It is possible
that early adopters are demographically different from later adopters, however the relationship
between these demographic characteristics and EV charging decisions is not yet known. The analysis
contained in this report is an important and necessary starting point and provides heretofore non‐
existent information about trends and outcomes in the early stage of EV technology adoption.
Acknowledgements
Final Evaluation for San Diego Gas & Electric's Plug‐in Electric Vehicle TOU Pricing and Technology Study 1
Acknowledgements
The Research Design Team would like to acknowledge the valuable contributions provided during the
research planning and implementation process from the following individuals and organizations.
The Research Design Team: Gregory Haddow, Leslie Willoughby, Kathryn Smith and Candice Churchwell
The Research Advisory Panel:
Boulder Energy Group – Bill Le Blanc
California Center for Sustainable Energy – Mike Ferry
California Energy Commission PIER – Phil Misemer
California Public Utility Commission – Staff
Coulomb Technologies, Inc. – Richard Lowenthal
ECOtality, Inc. – Don Karner
Edison Electric Institute – Rick Tempchin
Electric Power Research Institute – Bernie Neenan
Sacramento Municipal Utility District – Bill Boyce
Southern California Edison – Russ Garwacki
United States Environmental Protection Agency – Zoltan Jung
University of California Davis – Tom Turrentine
University of California San Diego – Graff Zivin and Ben Gilbert
University of San Diego‐Energy Policy Initiatives Center – Scott Anders & Nilmini Silva‐Send
The SDG&E Research Planning and Implementation Team:
Billing – Ken Clay, Cindy De La Rosa and Christopher Swartz
Clean Transportation – Jeff Reed, Greg Haddow, Joel Pointon, JC Martin, Chris Chen, James Ozenne and Jason Greenblatt
Consumer Research – Pat Kuhl
Customer Services – Ed Fong and Bill Saxe
Electric Load Analysis– Leslie Willoughby and Kathryn Smith
Rate Design – Lisa Davidson, Bob Hansen and Cyndee Fang
Resource Planning – Rob Anderson and Dave Barker
Smart Grid / Electric T&D – Lee Krevat, Tom Bialek and Mike Turner
Smart Meter / Metering – Ted Reguly, John Vanderlinde and Sydney Furbush

Introduction
Final Evaluation for San Diego Gas & Electric's Plug‐in Electric Vehicle TOU Pricing and Technology Study 1
2 Introduction
As explained in the Executive Summary, this report documents results from SDG&E’s multi‐year, plug‐in
electric vehicle Pricing and Technology Study, incorporating a temporary experimental EV rate approved
by the CPUC. The Study employed a randomized control trial experimental research design whereby
SDG&E EV customer participants were randomly assigned to one of three temporary TOU tariffs, each
with different price ratios between on‐peak, off‐peak and super off‐peak TOU periods. It is important to
understand the degree to which pricing and technology influences customer charging decisions before
EV adoption increases in SDG&E’s service territory. If EVs are charged at peak times, each vehicle is
roughly equivalent to an additional household’s load added to a neighborhood.6 This could require
adding peaking capacity or making costly investments in the distribution system. On the other hand, if
EV customers can be induced to charge during off‐peak times, both supply and distribution system
capacity investments can be avoided or deferred.
2.1 Study Background
This Study is timely, taking advantage of a unique market condition in the SDG&E service territory: the
2011 launch of the EV Project7 and initial Nissan LEAF deployment. The San Diego region was one of a
number of regional sites selected for launching the EV Project, funded by the U.S. Department of Energy
as the nation’s largest deployment of EV charging infrastructure. This award was announced August 5,
2009 and provided home electric vehicle supply equipment (EVSE or charging unit), to the first 1,000
customers who purchased or leased a Nissan LEAF EV in the region (please see Appendix A for a
summary of Nissan LEAF features, as well as a description of the EV Project). The selection of the San
Diego region for the EV Project was in part due to Nissan’s announcement to target the region for the
2011 launch of the Nissan LEAF deployment in significant volumes. These unique market conditions
created an opportunity for SDG&E to propose a research plan, with approval from the CPUC, to study EV
customer time‐of‐use charging behavior. Insights gained from this Study will inform the CPUC’s rate
making policies for utility EV customers.
Once the CPUC approved the Study in June 2010, SDG&E worked with the EV Project staff to create a
process by which SDG&E customers who qualified for EV Project participation would be offered the
opportunity to participate in the SDG&E Study. Customer recruitment into the Study commenced in July
2010 and continued through 2012 (Study data collection took place from early 2011 to October 2013).
The primary goal of the SDG&E Study is to understand the potential impact of EV charging on electric
utility infrastructure as well as identify methods to mitigate any negative impacts from integrating these
loads into the grid. SDG&E seeks to better understand the degree to which time‐variant pricing with
6 Typical peak EV charging load for a given household in this study is 2.5-3 kW. Households in SDG&E’s territory typically have peak summer time loads of 1-2 kW. Typical summer loads vary depending on many factors, such as the presence of central air-conditioning.
7 In the remainder of this report, we use “Study” to refer to the SDG&E experiment and “EV Project” to refer to the DOE project. The SDG&E Study participants were a subset of customers who participated in the DOE EV Project.

Introduction
Final Evaluation for San Diego Gas & Electric's Plug‐in Electric Vehicle TOU Pricing and Technology Study 2
enabling technology can achieve this goal. The Study addresses a number of important questions,
including:8
What are the impacts of various TOU rates on EV charging behavior?
How is EV charging behavior affected by the availability of enabling technology, such as the timer on the charging unit or the timer on‐board the LEAF?
Do EV charging patterns change over time as customers become more familiar with the pricing and resulting charging costs, as well as with the enabling technology?
This Study estimates the impact of EV‐specific TOU rates on energy consumption patterns due to
charging decisions by EV customers over roughly two and a half years. The Study examines the impact
of three experimental EV TOU rates, each of which has three pricing periods: on‐peak, off‐peak and
super off‐peak. The rates applied to electricity consumption for EV charging only, and not to the
customer’s whole house usage. The TOU periods are the same for all three experimental rates: the on‐
peak period runs from noon to 8 PM, the off‐peak period runs from 8 PM to 12 AM and 5 AM to noon
and the super off‐peak period runs from 12 AM to 5 AM. These TOU periods do not vary by day of week
and make no exceptions for holidays, but the prices in each period do differ between summer (May 1 –
October 31) and winter months (November 1 – April 30). The three rates were designed to test low,
medium and high price ratios between the super off‐peak to on‐peak prices. In addition, there are
different price ratios between the three tariffs in the on‐peak to off‐peak price and between summer
and winter seasons. As described below, Study participants were randomly assigned to one of the three
experimental EV TOU rates, which eliminated any selection bias that would result from customers
choosing a rate that best met their expected driving needs and lifestyle. For comparative purposes, the
EV charging patterns from a population of LEAF customers on the standard whole house EV TOU rate
were also analyzed.
2.2 Study Participants
Approximately 700 EV Project participants were recruited into the SDG&E Study and 430 of these
participants agreed to be randomly assigned to one of the three experimental EV rates (EPEV‐L, EPEV‐M,
and EPEV‐H).9 Recruitment was based on meeting the following criteria: dedicated home parking,
access to home electrical panel, own or lease an all‐electric Nissan LEAF and agreeing to the installation
of a Blink home Level 2 charging unit. The purpose of the screening criteria was to create a
homogeneous Study sample to achieve internal validity for the Study. The extent to which this
population represents future EV customers is not yet known, however demographic data obtained from
EV Project participant surveys indicates that the participant population is representative of market
segments targeted by the auto industry for EV sales10.
8 These research objectives were filed with the CPUC and more details can be found at http://regarchive.sdge.com/tm2/pdf/2157-E.pdf.
9 Source: http://avt.inl.gov/pdf/EVProj/LeafsVoltsByRegionMapQ32013.pdf; EV Project participants also include 272 Chevy Volts, and 386 car2go vehicles (car share program), which were not eligible to participate in this Study.
10 Source: http://www.theevproject.com/cms-assets/documents/128842-80098.devproj.pdf
Introduction
Final Evaluation for San Diego Gas & Electric's Plug‐in Electric Vehicle TOU Pricing and Technology Study 3
Not all customers who were part of the EV Project participated in the Study. There were several reasons
for this, including problems with configuration of their home, installation costs that exceeded the
installation allowance offered by the EV Project or a desire to not be placed on an experimental rate.
Three rate options were available for the group of customers who did not choose to be in the Study.
First, they could continue to have all their usage, including EV charging, billed on their current rate,
which for most participants is the standard tiered residential rate that is undifferentiated by time of day.
Second, SDG&E offers an EV rate (EV‐TOU‐2) that applies to the entire load of a customer’s home (a TOU
rate applicable to a single home meter). EV‐TOU‐2 also has three rate periods, but has an on‐peak
period that runs from noon to 6 PM rather than noon to 8 PM for the separately metered EV loads for
the Study participants. The EV‐TOU‐2 rate periods also do not vary by day of week, but on holidays the
EV‐TOU‐2 on‐peak period moves to off‐peak status. Finally, SDG&E also offers an electric vehicle TOU
rate (EV‐TOU) that, like the experimental rates, applies to only the EV load and usage. This rate requires
customers to install a separate parallel meter and is rarely chosen.
Figure 2‐1 shows how participation increased over time as customers enrolled in the Study, and Figure
2‐2 shows the locations of EV Project participants by rate. The number of enrollments for experimental
rates shows an initial acceleration, followed by a leveling off in late 2011, with lower numbers of
customers entering the Study in late 2012. The map shows the large geographic scale of both the EV
Project and the Study. Study participants’ homes are located throughout the SDG&E service territory,
with the highest number of participants residing in Carmel Valley, a community in the northern part of
the city of San Diego. There do not appear to be any patterns in the location of EVs participating in the
Study, which lessens concerns about geographic biases that may arise in the analysis.

Introduction
Final Evaluation for San Diego Gas & Electric's Plug‐in Electric Vehicle TOU Pricing and Technology Study 4
Figure 2‐1: Cumulative Number of Study Participants on Experimental Rates11
11 The number of study participants is derived from estimated EV delivery dates and dates from billing data.
2011 Feb Mar Apr May Jun Jul Aug Sep Oct Nov Dec 2012 Feb Mar Apr May Jun Jul Aug Sep Oct Nov Dec 2013 Feb Mar Apr May Jun Jul Aug Sep
Study Participants 11 13 24 74 124 205 251 291 313 330 343 352 363 372 376 381 384 388 395 402 405 406 411 414 419 421 426 430 430 430 430 430 430
0
100
200
300
400
500
Number of Customers on EPEV
Rates

Introduction
Final Evaluation for San Diego Gas & Electric's Plug‐in Electric Vehicle TOU Pricing and Technology Study 5
Figure 2‐2: Locations of Study Participants12
12 Not shown in this map are Nissan LEAFs that reside in Orange County that were not eligible to participate in the San Diego-based EV Project, but are within SDG&E’s service territory, a portion of these Orange County LEAFs are on the whole-house TOU rate (EV-TOU-2) and are included in the analysis in Section 4.

Introduction
Final Evaluation for San Diego Gas & Electric's Plug‐in Electric Vehicle TOU Pricing and Technology Study 6
2.3 EV Charging Equipment
All customers in the EV Project who acquired a LEAF were offered a Level 2 charging unit for home
installation (approximate value $1,499) and a DC Fast Charge port on the LEAF (approximate value $700)
at no‐cost, along with up to $1,200 in credit toward the installation of the equipment.13 Upon
enrollment in the Study, a charging unit was installed at the EV customer’s home that provided power at
240 Volts (V) and 30‐40 Amps (note that a Level 1, portable EV Cord Set is provided standard with each
LEAF that conveniently plugs into a standard wall outlet at 120 V and 12 Amps). The Level 2 charging
unit allows for faster vehicle charging compared to Level 1 charging and adds approximately 12 miles of
range per hour of charging time compared to approximately 5 miles of range per hour of charging with
the Level 1 Cord Set14. The installation cost for the charging unit ranges from about $600 to $2,000,
depending on the configuration of the customer’s home and on the electrical complexity of the
installation. In many cases, the $1,200 credit offered by ECOtality for installation covered the entire cost
of the installation. The customer was obligated to pay for any installation costs above $1,200.
The Nissan LEAF and charging unit both come with timers that allow customers to manage EV charging.
The on‐board LEAF technology allows customers to set start and/or end times for charging, as well as a
maximum charge percent (e.g., 80% or 100% of the battery capacity) and the home Level 2 charging unit
offers similar capabilities. Additionally, the LEAF timer has an override option should a customer decide
to charge during times of day outside of the programmed charging period. This enabling technology was
expected to have a strong influence on EV charging behavior by making it more convenient for them to
charge during a preferred time and to take advantage of the lowest possible TOU prices.
2.4 Metering and Billing
The charging unit was installed on a dedicated circuit of the home’s electric distribution system, which
allowed for a second utility billing meter (in series with the main house meter) to measure the electric
consumption for EV charging. Installation of the second meter socket box and safety disconnect breaker
was typically performed during the same time as the Level 2 charging unit installation. SDG&E later set
the billing meter after the charging station installation passed inspection by the electrical permitting
authority. As part of the Study, SDG&E paid the cost of the second meter, the meter socket box and the
electrical safety disconnect breaker. This metering arrangement was required for all Study
participants15.
Subtractive billing separated the EV electricity usage from the rest of the home’s electricity usage, and
was applied to create a separate EV usage bill for customers participating in the Study. The monthly bill
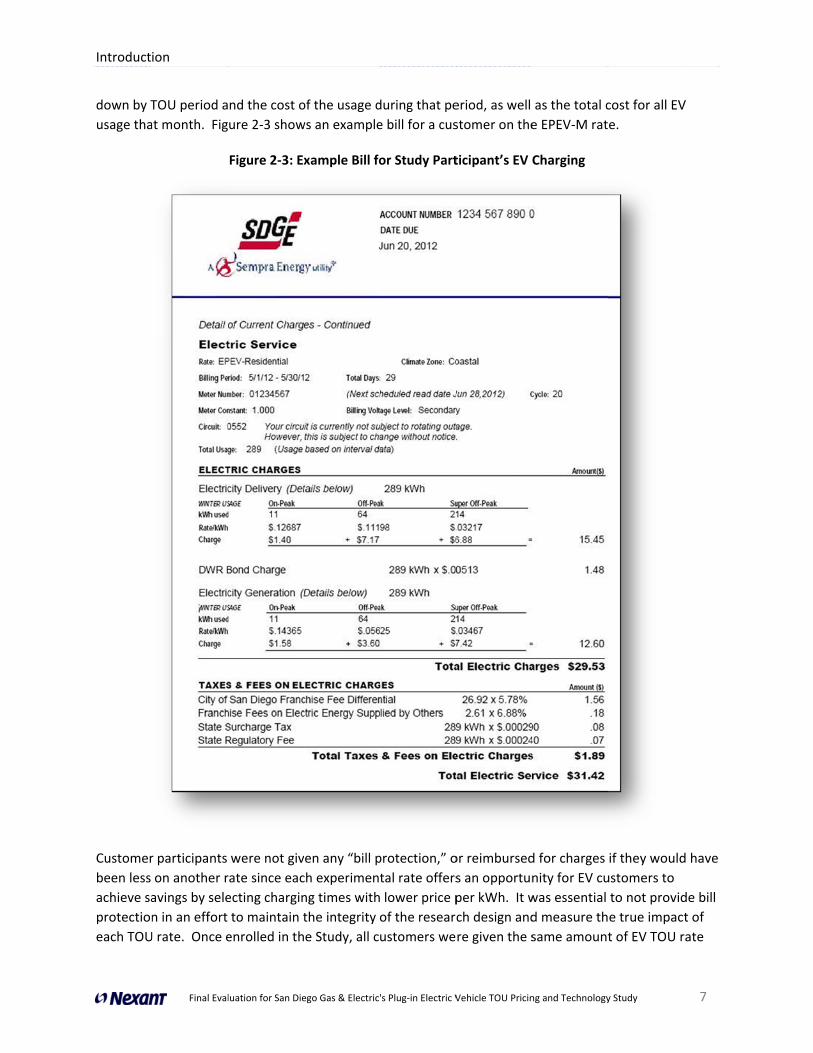
contains both the usage for the home and EV, with the total cost shown separately. EV usage is broken
13 This equipment and installation subsidy was provided by ECOtality and funded partially by DOE and partially by shareholders of ECOtality. See http://www.theevproject.com/downloads/documents/FAQ_DOE_ECOtality_The_EV_Project_20120924.pdf for more information.
14 EV range is dependent on driving style, conditions and speed, while the length of time for charging depends on the battery’s state of charge at the beginning of the charging session, which rarely is low.
15 Appendix A.3 has photos of each component of the metering arrangement.
Introduct
down by T
usage tha
Customer
been less
achieve sa
protection
each TOU
ion
Final Eval
TOU period a
at month. Fig
r participants
on another r
avings by sele
n in an effort
U rate. Once e
luation for San Die
nd the cost o
ure 2‐3 show
Figure 2‐3: Ex
were not giv
rate since eac
ecting chargin
to maintain t
enrolled in th
ego Gas & Electric'
of the usage d
ws an example
xample Bill fo
en any “bill p
ch experiment
ng times with
the integrity o
e Study, all c
's Plug‐in Electric V
during that pe
e bill for a cus
or Study Part
protection,” o
tal rate offers
lower price p
of the researc
ustomers we
Vehicle TOU Pricin
eriod, as well
stomer on the
ticipant’s EV C
or reimbursed
s an opportun
per kWh. It w
ch design and
re given the s
ng and Technology
as the total c
e EPEV‐M rat
Charging
d for charges
nity for EV cu
was essential
d measure th
same amount
y Study
cost for all EV
e.
if they would
ustomers to
to not provid
e true impact
t of EV TOU r
7
V
d have
de bill
t of
ate
Introduction
Final Evaluation for San Diego Gas & Electric's Plug‐in Electric Vehicle TOU Pricing and Technology Study 8
information through direct discussions with SDG&E staff, the SDG&E website, printed collateral and the
monthly bill. The content of the information was timely, educational and relevant, and was refreshed at
regular intervals.
2.5 Experimental Design
Table 2‐1 lists details of the experimental EV rates for Study participants as well as the whole house and
standard residential rates that were otherwise applicable. Participants who agreed to participate in the
Study were randomly assigned to an EV experimental rate (EPEV‐L, EPEV‐M or EPEV‐H). Early in the
experiment, participants were randomly assigned to one of two rates (EPEV‐H or EPEV‐M) due to the
prevailing concern that the population size necessary to reduce sampling error would not be achieved;
after a few months of recruiting, this concern was reduced and the third rate schedule (EPEV‐L) was
added to the random assignment scheme with price ratios similar to the whole house EV‐TOU‐2 rate.
Use of the third rate schedule allows for a better understanding of customers’ demand for charging load
at different times of the day. Also, independent sources of variation in two of the three TOU periods
allows for a fully‐identified demand model of charging behavior.
The three experimental rates differ by the ratio of on‐peak to super off‐peak rates. EPEV‐L has the
lowest ratio, offering participants fairly mild incentives to charge during the super off‐peak period, and a
relatively small disincentive to charge during on‐peak. During the summer, the on‐peak rate
($0.25/kWh) is just under two times the super off‐peak rate ($0.13/kWh). During the winter, the on‐
peak rate ($0.17/kWh) is 24% higher than the super‐off‐peak rate ($0.13/kWh).
EPEV‐M has a larger price ratio. During the summer, the on‐peak rate ($0.28/kWh) is four times the
super off‐peak rate ($0.07). During the winter, the on‐peak rate ($0.23/kWh) is almost three times the
super off‐peak rate ($0.08/kWh).
EPEV‐H has the largest price ratio and is intended to provide the strongest incentive for super off‐peak
charging and the largest disincentive for on‐peak charging. During the summer, the on‐peak rate
($0.36/kWh) is six times larger than the super off‐peak rate ($0.06/kWh). During the winter, the on‐
peak rate ($0.32/kWh) is nearly five times larger than the super off‐peak rate ($0.07/kWh).
The three rates also differ in their ratios of on‐peak to off‐peak prices. Here again, EPEV‐L provides the
mildest price differentials and EPEV‐H provides the strongest on‐peak to off‐peak ratio. In general, the
price ratios are lowest for EPEV‐L and increase for EPEV‐M and EPEV‐H.

Introduction
Final Evaluation for San Diego Gas & Electric's Plug‐in Electric Vehicle TOU Pricing and Technology Study 9
Table 2‐1: Rates Available to EV Project Participants16 Total Rates Effective March 1 – June 30, 2012
Period
EV‐TOU‐2
SDG&E Study Rates
EPEV‐L EPEV‐M EPEV‐H
$/kWh Ratio to Super Off‐
peak $/kWh
Ratio to Super Off‐
peak $/kWh
Ratio to Super Off‐
peak $/kWh
Ratio to Super Off‐
peak
Summer
Peak17 $0.25 1.84 $0.25 2.02 $0.28 3.83 $0.36 5.71
Off‐peak $0.16 1.16 $0.16 1.23 $0.17 2.41 $0.14 2.28
Super Off‐peak
$0.13
$0.13
$0.07
$0.06
Winter
Peak $0.16 1.21 $0.17 1.24 $0.23 3.03 $0.32 4.83
Off‐peak $0.16 1.16 $0.16 1.19 $0.16 2.02 $0.13 1.93
Super Off‐peak
$0.14
$0.13
$0.08
$0.07
Period DR
$/kWh
Summer
Tier 1 $0.14
Tier 2 $0.17
Tier 3 $0.26
Tier 4 $0.28
Winter
Tier 1 $0.14
Tier 2 $0.17
Tier 3 $0.24
Tier 4 $0.26
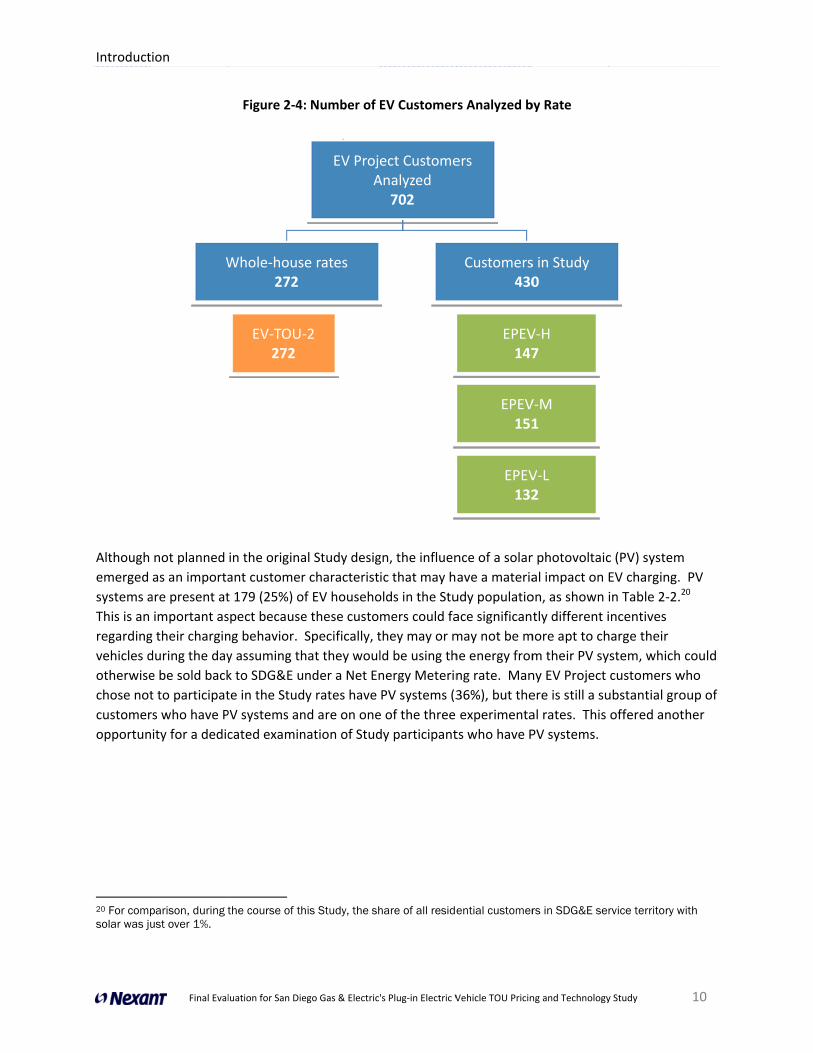
Figure 2‐4 shows the distribution of EV Project customers across rate options that were analyzed as part
of this Study, as of September 24, 2013.18 Of the 702 customers that were analyzed, 430 enrolled in an
experimental rate and 272 enrolled in the EV‐TOU‐2, whole house rate.19
16 These rates represent the total bundled rates that include the Utility Distribution Company (UDC) charge, the Department of Water Resources Bond Charge (DWR-BC) and Electric Energy Commodity Charge (EECC) rates. Prices are rounded to two decimal places to simplify presentation.
17 The peak period for the three experimental rates was from noon to 8 PM while the peak period for the EV-TOU-2 rate was from noon to 6 PM.
18 A small number of EV Project participants remained on the non-time varying DR rate or chose SDG&E’s non-pilot EV TOU rate that requires installation of a separate EV charging meter.
19 Not everyone who wanted an experimental rate was enrolled due to EVSE installation problems or costs, so it would be incorrect to conclude from this data that 39% (272/702) chose the EV-TOU-2 rate over the experimental tariffs.
Introduct
Although
emerged
systems a
This is an
regarding
vehicles d
otherwise
chose not
customer
opportun
20 For compsolar was ju
ion
Final Eval
not planned
as an importa
are present at
important as
g their chargin
during the day
e be sold back
t to participat
s who have P
ity for a dedic
parison, during tust over 1%.
W
luation for San Die
Figure 2‐4:
in the origina
ant customer
t 179 (25%) o
spect because
ng behavior.
y assuming th
k to SDG&E u
te in the Stud
PV systems an
cated examin
the course of th
Whole‐hous272
EV‐TOU‐272
ego Gas & Electric'
: Number of E
al Study desig
r characterist
f EV househo
e these custom
Specifically, t
hat they woul
nder a Net En
y rates have
nd are on one
nation of Stud
his Study, the sh
e rates
EV ProjeA
‐2
's Plug‐in Electric V
EV Customer
gn, the influen
ic that may h
olds in the Stu
mers could fa
they may or m
ld be using th
nergy Meterin
PV systems (3
e of the three
dy participant
hare of all reside
ect CustomeAnalyzed
702
Vehicle TOU Pricin
rs Analyzed b
nce of a solar
ave a materia
udy populatio
ace significan
may not be m
he energy from
ng rate. Man
36%), but the
experimenta
ts who have P
ential customer
Customers430
ers
EPEV147
EPEV151
EPEV132
ng and Technology
by Rate
r photovoltaic
al impact on
on, as shown
tly different i
more apt to ch
m their PV sy
ny EV Project
ere is still a su
al rates. This
PV systems.
rs in SDG&E se
s in Study 0
V‐H 7
V‐M 1
V‐L 2
y Study
c (PV) system
EV charging.
in Table 2‐2.2
incentives
harge their
ystem, which
customers w
ubstantial gro
offered anot
rvice territory w
10
PV 20
could
who
oup of
her
with
Introduction
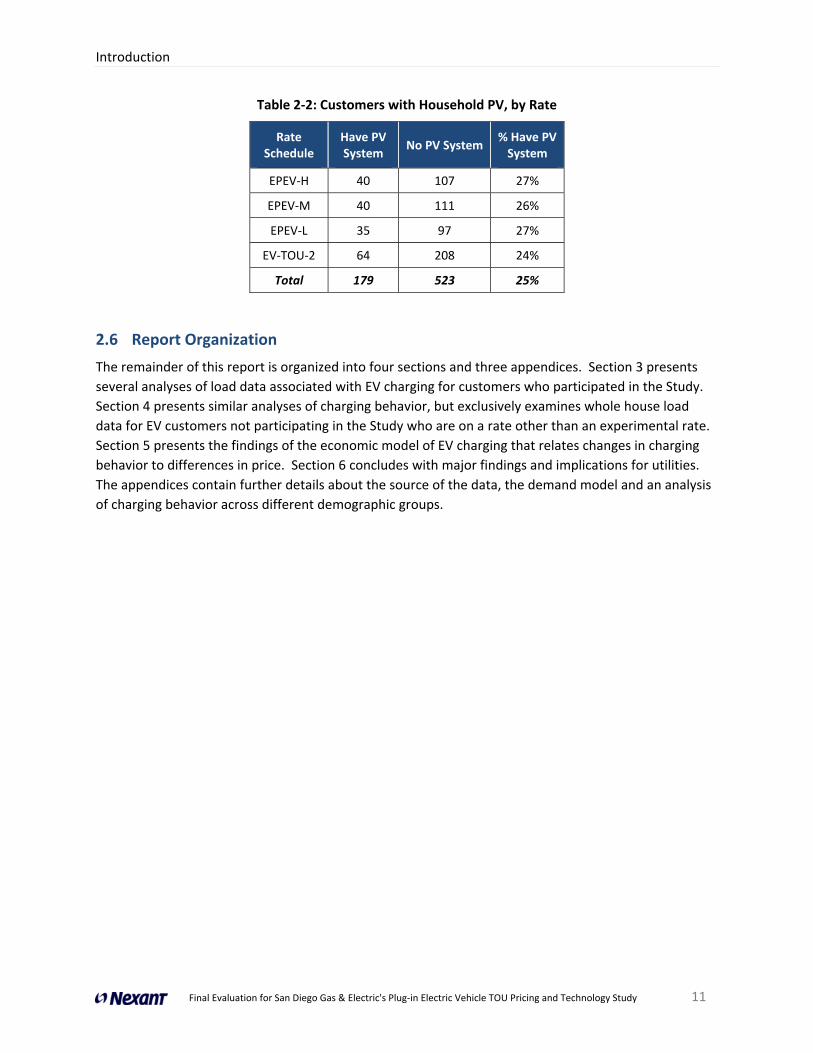
Final Evaluation for San Diego Gas & Electric's Plug‐in Electric Vehicle TOU Pricing and Technology Study 11
Table 2‐2: Customers with Household PV, by Rate
Rate Schedule
Have PV System
No PV System % Have PV System
EPEV‐H 40 107 27%
EPEV‐M 40 111 26%
EPEV‐L 35 97 27%
EV‐TOU‐2 64 208 24%
Total 179 523 25%
2.6 Report Organization
The remainder of this report is organized into four sections and three appendices. Section 3 presents
several analyses of load data associated with EV charging for customers who participated in the Study.
Section 4 presents similar analyses of charging behavior, but exclusively examines whole house load
data for EV customers not participating in the Study who are on a rate other than an experimental rate.
Section 5 presents the findings of the economic model of EV charging that relates changes in charging
behavior to differences in price. Section 6 concludes with major findings and implications for utilities.
The appendices contain further details about the source of the data, the demand model and an analysis
of charging behavior across different demographic groups.

Analysis of EV Charging Data for Customers in Rate Experiment
Final Evaluation for San Diego Gas & Electric's Plug‐in Electric Vehicle TOU Pricing and Technology Study 12
3 Analysis of EV Charging Data for Customers in Rate Experiment
This section presents descriptive analyses of EV charging load and usage data and examines important
patterns in the data. All of the results presented in this section pertain only to customers in the SDG&E
Study who are on experimental rates.21 The analysis covers both those who do and do not have PV
systems. Additional analysis for Study participants in support of the demand modeling is presented in
Section 5. Results for the whole house, EV‐TOU‐2 rate group are presented in Section 4.
3.1 EV Charging Events
EV charging data was analyzed at hourly intervals to generate summary information about charging
events. Any hour in which electricity use was greater than 0.4 kWh was considered part of a charging
event and a set of consecutive charging intervals comprises one charging event. Figure 3‐1 shows the
fraction of total charging events that occurred on each day of the week. Charging events are defined by
the hour when charging began. Most charging events occurred during the super off‐peak period from
12 AM to 5 AM, so each day in the figure can also be interpreted as charging during the previous night.
As an example, if a customer plugged in their EV at 11:30 PM Sunday and charging completed at 3 AM
Monday, that charging event was counted as occurring on Sunday. Of note is that charging events are
less frequent on the weekends (e.g., Saturday night into Sunday morning and Sunday night into Monday
morning) than during the work week of Monday through Friday.
Figure 3‐1: EV Charging Events by Day of the Week
21 Unless otherwise stated, graphs and charts display information for all customers on experimental rates using only days during which charging activity occurred.
0% 4% 8% 12% 16%
Sunday
Monday
Tuesday
Wednesday
Thursday
Friday
Saturday
% of Total Charging Events
Analysis of EV Charging Data for Customers in Rate Experiment
Final Evaluation for San Diego Gas & Electric's Plug‐in Electric Vehicle TOU Pricing and Technology Study 13
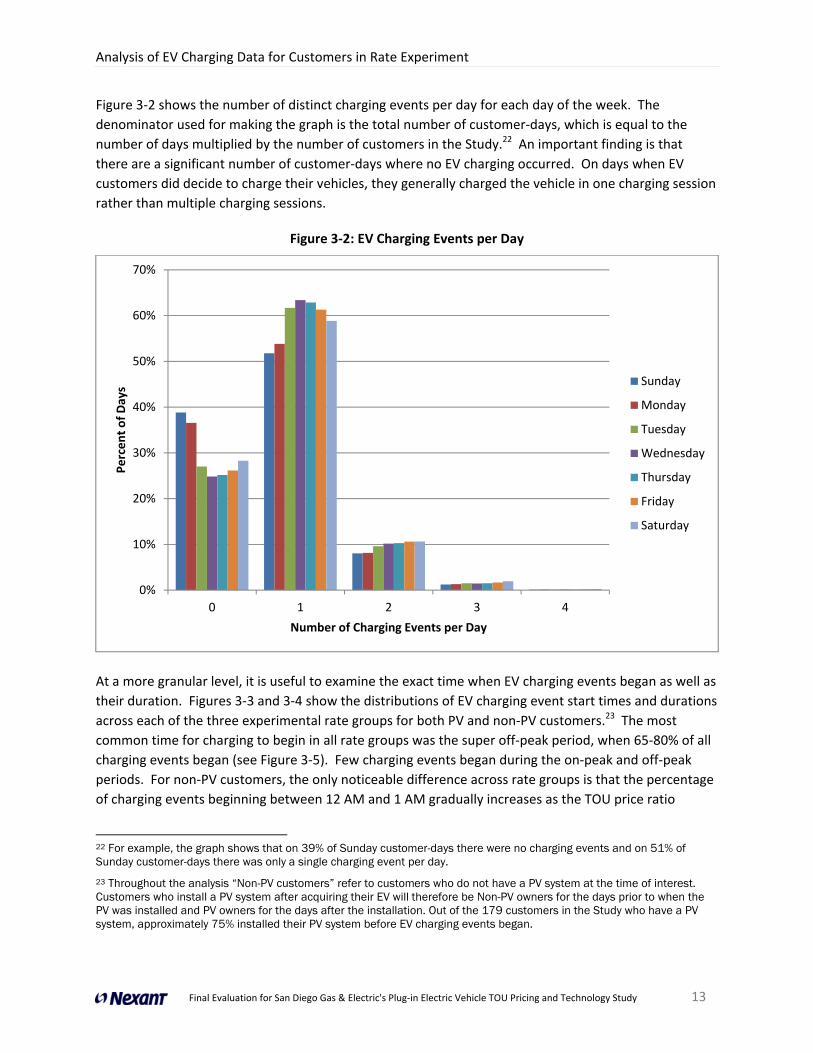
Figure 3‐2 shows the number of distinct charging events per day for each day of the week. The
denominator used for making the graph is the total number of customer‐days, which is equal to the
number of days multiplied by the number of customers in the Study.22 An important finding is that
there are a significant number of customer‐days where no EV charging occurred. On days when EV
customers did decide to charge their vehicles, they generally charged the vehicle in one charging session
rather than multiple charging sessions.
Figure 3‐2: EV Charging Events per Day
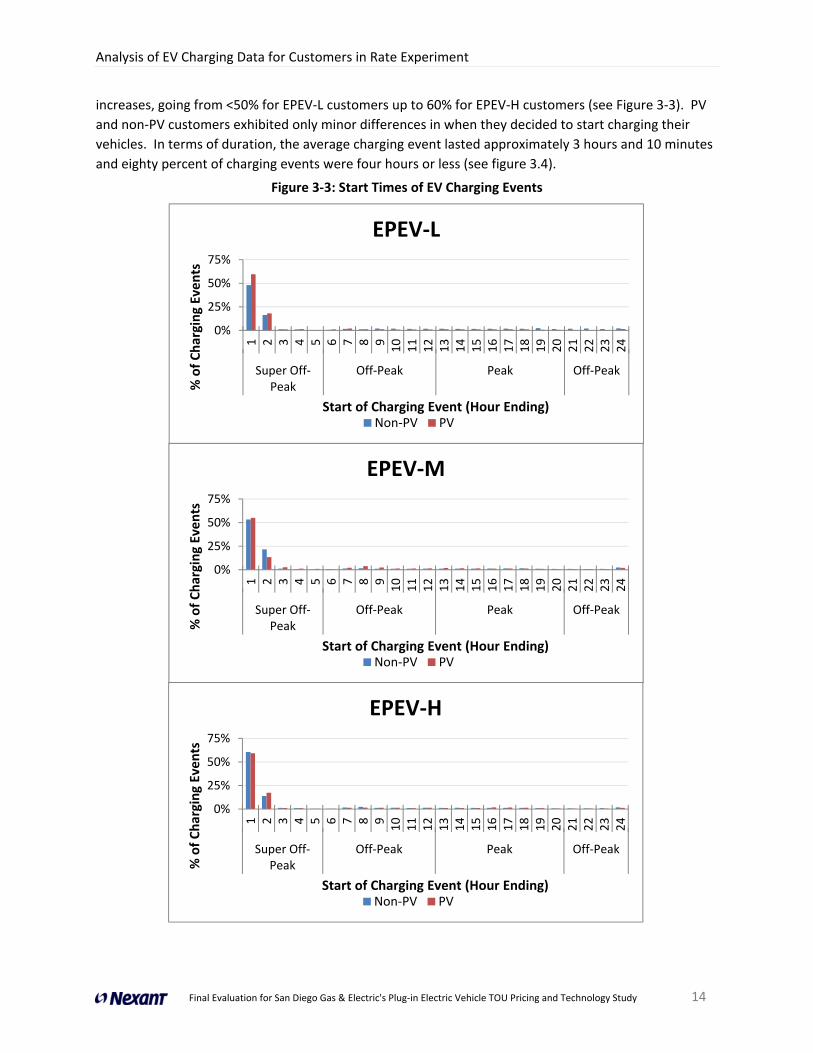
At a more granular level, it is useful to examine the exact time when EV charging events began as well as
their duration. Figures 3‐3 and 3‐4 show the distributions of EV charging event start times and durations
across each of the three experimental rate groups for both PV and non‐PV customers.23 The most
common time for charging to begin in all rate groups was the super off‐peak period, when 65‐80% of all
charging events began (see Figure 3‐5). Few charging events began during the on‐peak and off‐peak
periods. For non‐PV customers, the only noticeable difference across rate groups is that the percentage
of charging events beginning between 12 AM and 1 AM gradually increases as the TOU price ratio
22 For example, the graph shows that on 39% of Sunday customer-days there were no charging events and on 51% of Sunday customer-days there was only a single charging event per day.
23 Throughout the analysis “Non-PV customers” refer to customers who do not have a PV system at the time of interest. Customers who install a PV system after acquiring their EV will therefore be Non-PV owners for the days prior to when the PV was installed and PV owners for the days after the installation. Out of the 179 customers in the Study who have a PV system, approximately 75% installed their PV system before EV charging events began.
0%
10%
20%
30%
40%
50%
60%
70%
0 1 2 3 4
Percent of Days
Number of Charging Events per Day
Sunday
Monday
Tuesday
Wednesday
Thursday
Friday
Saturday
Analysis of EV Charging Data for Customers in Rate Experiment
Final Evaluation for San Diego Gas & Electric's Plug‐in Electric Vehicle TOU Pricing and Technology Study 14
increases, going from <50% for EPEV‐L customers up to 60% for EPEV‐H customers (see Figure 3‐3). PV
and non‐PV customers exhibited only minor differences in when they decided to start charging their
vehicles. In terms of duration, the average charging event lasted approximately 3 hours and 10 minutes
and eighty percent of charging events were four hours or less (see figure 3.4).
Figure 3‐3: Start Times of EV Charging Events
0%
25%
50%
75%
1 2 3 4 5 6 7 8 910
11
12
13
14
15
16
17
18
19
20
21
22
23
24
Super Off‐Peak
Off‐Peak Peak Off‐Peak
% of Charging Events
Start of Charging Event (Hour Ending)
EPEV‐M
Non‐PV PV
0%
25%
50%
75%
1 2 3 4 5 6 7 8 910
11
12
13
14
15
16
17
18
19
20
21
22
23
24
Super Off‐Peak
Off‐Peak Peak Off‐Peak
% of Charging Events
Start of Charging Event (Hour Ending)
EPEV‐H
Non‐PV PV
0%
25%
50%
75%1 2 3 4 5 6 7 8 910
11
12
13
14
15
16
17
18
19
20
21
22
23
24
Super Off‐Peak
Off‐Peak Peak Off‐Peak
% of Charging Events
Start of Charging Event (Hour Ending)
EPEV‐L
Non‐PV PV

Analysis of EV Charging Data for Customers in Rate Experiment
Final Evaluation for San Diego Gas & Electric's Plug‐in Electric Vehicle TOU Pricing and Technology Study 15
Figure 3‐4: Duration of EV Charging Events
Note: The interval data used to make this figure is at the hourly level. Because of this, the duration of charging events were rounded up to the nearest whole number. For example, a charging event that began at 12:30 AM and ended at 3:45 AM (3 h, 15 m) was classified as a 4-hour charging event in the figure.
0%
10%
20%
30%
1 2 3 4 5 6 7 8 9 10 11 12
% of Charging Events
Duration of Charging Event (Hours)
EPEV‐L
Non‐PV PV
0%
10%
20%
30%
1 2 3 4 5 6 7 8 9 10 11 12
% of Charging Events
Duration of Charging Event (Hours)
EPEV‐M
Non‐PV PV
0%
10%
20%
30%
1 2 3 4 5 6 7 8 9 10 11 12
% of Charging Events
Duration of Charging Event (Hours)
EPEV‐H
Non‐PV PV

Analysis of EV Charging Data for Customers in Rate Experiment
Final Evaluation for San Diego Gas & Electric's Plug‐in Electric Vehicle TOU Pricing and Technology Study 16
Figure 3‐5: Start Times for EV Charging Events by Rate Period
The fact that so many charging events started at the beginning of the super off‐peak period, which is
also at a time of day that would be inconvenient for many customers to manually initiate charging,
suggests that EV customers regularly used the timers on either their EV or charging station. To further
investigate the degree to which timers were used, the start times of charging events for each individual
EV customer were analyzed. It was expected that customers who used timers regularly would generally
start charging their EVs at or around the same time each day, that is, they would exhibit very consistent
charging behavior. To quantify this consistency, hourly interval data was used to identify the most
common start hour for charging and the share of that owner’s total charging events that began during
that hour. Given that 60‐80% of charging events start during the super off‐peak period (Figure 3‐5), this
regularity is very likely due to timer usage.
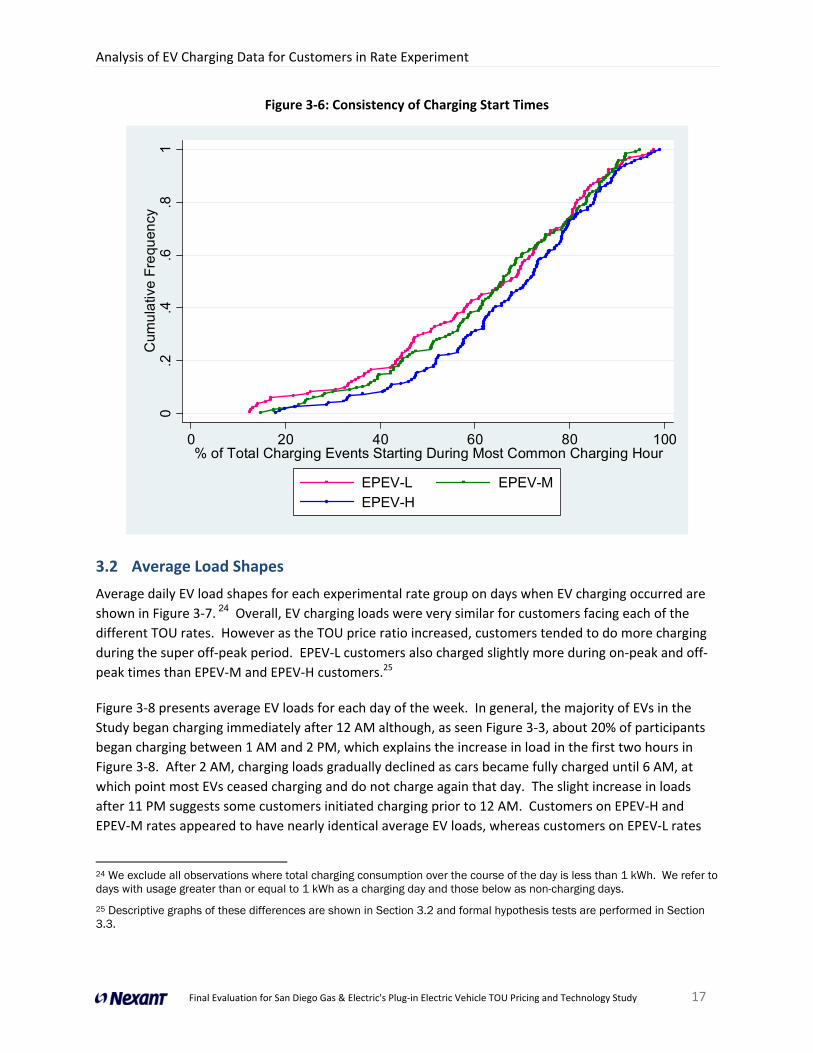
Figures 3‐6 shows the cumulative frequencies for the measurement of charging consistency grouped by
rate. The x‐axis shows the percentage of a customer’s charging events that started during that
customer’s most common start time. For example, suppose an EV customer had 10 total EV charging
events with six events starting between 12 AM and 1 AM, three events starting between 6 AM and 7 AM
and one event starting between 8 PM and 9 PM. For this customer, the most common start time was
between 12 AM and 1 AM and the percentage would be 60%. Lines further to the right in the graph
indicate more consistent charging behavior. The figure suggests that customers facing TOU rates with
higher price ratios used their timer more regularly (or possibly over‐rode their timer setting less
frequently). A similar analysis was conducted comparing weekday charging with weekend charging and
showed charging behavior on weekdays was slightly more consistent than charging on weekends, across
the three rates.
0%
20%
40%
60%
80%
100%
Non‐PV
PV
Non‐PV
PV
Non‐PV
PV
EPEV‐L EPEV‐M EPEV‐H
% of Charging Events
Super Off‐peak
Off‐Peak
Peak
Analysis of EV Charging Data for Customers in Rate Experiment
Final Evaluation for San Diego Gas & Electric's Plug‐in Electric Vehicle TOU Pricing and Technology Study 17
Figure 3‐6: Consistency of Charging Start Times
3.2 Average Load Shapes
Average daily EV load shapes for each experimental rate group on days when EV charging occurred are
shown in Figure 3‐7. 24 Overall, EV charging loads were very similar for customers facing each of the
different TOU rates. However as the TOU price ratio increased, customers tended to do more charging
during the super off‐peak period. EPEV‐L customers also charged slightly more during on‐peak and off‐
peak times than EPEV‐M and EPEV‐H customers.25
Figure 3‐8 presents average EV loads for each day of the week. In general, the majority of EVs in the
Study began charging immediately after 12 AM although, as seen Figure 3‐3, about 20% of participants
began charging between 1 AM and 2 PM, which explains the increase in load in the first two hours in
Figure 3‐8. After 2 AM, charging loads gradually declined as cars became fully charged until 6 AM, at
which point most EVs ceased charging and do not charge again that day. The slight increase in loads
after 11 PM suggests some customers initiated charging prior to 12 AM. Customers on EPEV‐H and
EPEV‐M rates appeared to have nearly identical average EV loads, whereas customers on EPEV‐L rates
24 We exclude all observations where total charging consumption over the course of the day is less than 1 kWh. We refer to days with usage greater than or equal to 1 kWh as a charging day and those below as non-charging days.
25 Descriptive graphs of these differences are shown in Section 3.2 and formal hypothesis tests are performed in Section 3.3.
0.2
.4.6
.81
Cum
ula
tive
Fre
quen
cy
0 20 40 60 80 100% of Total Charging Events Starting During Most Common Charging Hour
EPEV-L EPEV-MEPEV-H

Analysis of EV Charging Data for Customers in Rate Experiment
Final Evaluation for San Diego Gas & Electric's Plug‐in Electric Vehicle TOU Pricing and Technology Study 18
had lower average loads after 12 AM and slightly higher average loads in the evening off‐peak hours
prior to 12 AM. The total level of charging usage is similar across the three groups, but there was a
noticeable small increase in off‐peak and on‐peak charging on weekends for all rate groups. Non‐
charging days were included in this figure to capture the fact that EVs were charged less often on
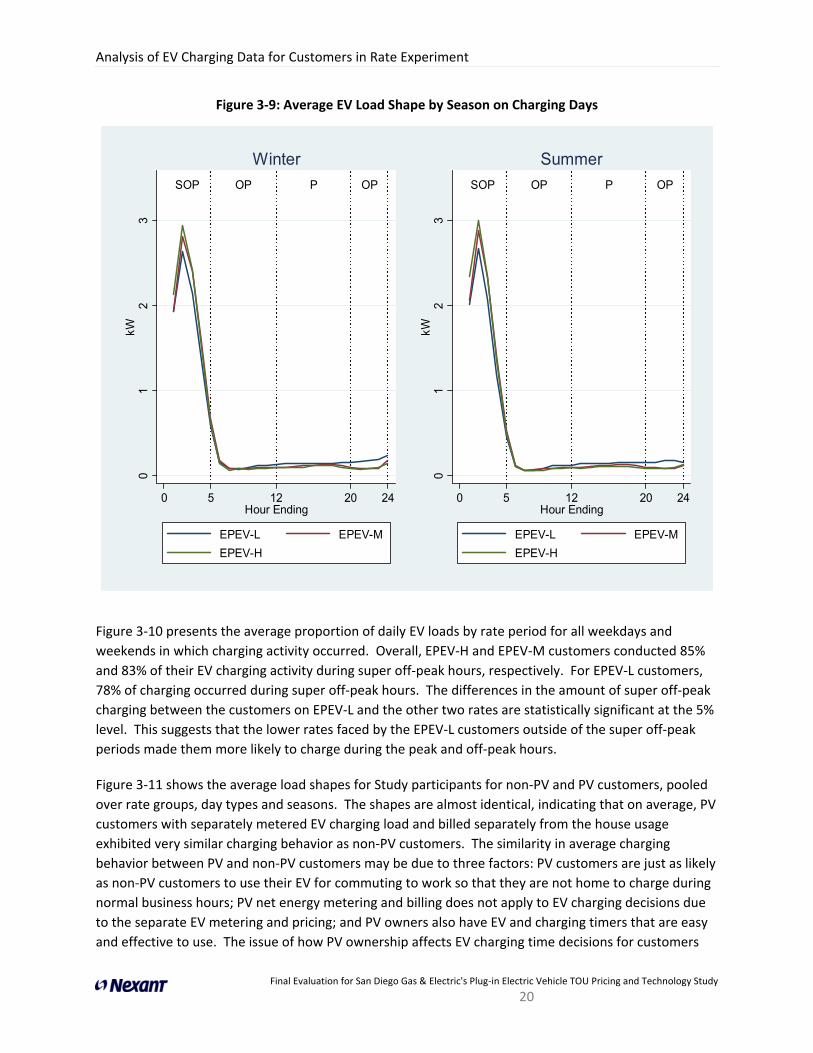
Sunday and Monday, likely reflecting lower EV usage on weekends compared to weekdays. Figure 3‐9
shows average load shapes split out by season; there were no discernible differences in loads.
Figure 3‐7: Average Daily EV Load Shapes on Charging Days
SOP OP P OP
01
23
kW
0 5 12 20 24Hour Ending
EPEV-L EPEV-MEPEV-H

Analysis of EV Charging Data for Customers in Rate Experiment
Final Evaluation for San Diego Gas & Electric's Plug‐in Electric Vehicle TOU Pricing and Technology Study 19
Figure 3‐8: Average EV Load, by Rate Schedule and Day of Week (Charging and Non‐Charging Days26)
26 This graph contains both charging and non-charging days in order to capture the relative amounts of charging that took place on each day of the week.
0
0.5
1
1.5
2
2.5
kW
Day and Hour Starting
EPEV‐L EPEV‐M EPEV‐H
Analysis of EV Charging Data for Customers in Rate Experiment
Final Evaluation for San Diego Gas & Electric's Plug‐in Electric Vehicle TOU Pricing and Technology Study
20
Figure 3‐9: Average EV Load Shape by Season on Charging Days
Figure 3‐10 presents the average proportion of daily EV loads by rate period for all weekdays and
weekends in which charging activity occurred. Overall, EPEV‐H and EPEV‐M customers conducted 85%
and 83% of their EV charging activity during super off‐peak hours, respectively. For EPEV‐L customers,
78% of charging occurred during super off‐peak hours. The differences in the amount of super off‐peak
charging between the customers on EPEV‐L and the other two rates are statistically significant at the 5%
level. This suggests that the lower rates faced by the EPEV‐L customers outside of the super off‐peak
periods made them more likely to charge during the peak and off‐peak hours.
Figure 3‐11 shows the average load shapes for Study participants for non‐PV and PV customers, pooled
over rate groups, day types and seasons. The shapes are almost identical, indicating that on average, PV
customers with separately metered EV charging load and billed separately from the house usage
exhibited very similar charging behavior as non‐PV customers. The similarity in average charging
behavior between PV and non‐PV customers may be due to three factors: PV customers are just as likely
as non‐PV customers to use their EV for commuting to work so that they are not home to charge during
normal business hours; PV net energy metering and billing does not apply to EV charging decisions due
to the separate EV metering and pricing; and PV owners also have EV and charging timers that are easy
and effective to use. The issue of how PV ownership affects EV charging time decisions for customers
SOP OP P OP
01
23
kW
0 5 12 20 24Hour Ending
EPEV-L EPEV-M
EPEV-H
Winter
SOP OP P OP
01
23
kW
0 5 12 20 24Hour Ending
EPEV-L EPEV-M
EPEV-H
Summer

Analysis of EV Charging Data for Customers in Rate Experiment
Final Evaluation for San Diego Gas & Electric's Plug‐in Electric Vehicle TOU Pricing and Technology Study
21
0%
20%
40%
60%
80%
100%
EPEV‐L EPEV‐M EPEV‐H
Weekend
Peak
Off‐peak
Super Off‐peak
with whole house EV‐TOU‐2 rates is discussed in greater detail in Section 4 and the impact of PV
ownership on EV price responsiveness is discussed in Section 5.
Figure 3‐10: Average Proportion of Daily EV Energy Consumption by Rate Period on Charging Days
Figure 3‐11: EV Charging Load Shapes for Non‐PV and PV Owners on Charging Days
Finally, it is interesting to compare load profiles for customers who charge their EVs with different
degrees of consistency. Using the measure of consistency defined in Section 3.1, Figure 3‐6, if less than
33% of events started during the most common start period for a customer, they were defined as
0%
20%
40%
60%
80%
100%
EPEV‐L EPEV‐M EPEV‐H
Avg. Share of Daily Charging
Weekday
SOP OP P OP
01
23
kW
0 5 12 20 24hour
Non-PV PV
Load Shapes for PV and non-PV Owners
Analysis of EV Charging Data for Customers in Rate Experiment
Final Evaluation for San Diego Gas & Electric's Plug‐in Electric Vehicle TOU Pricing and Technology Study
22
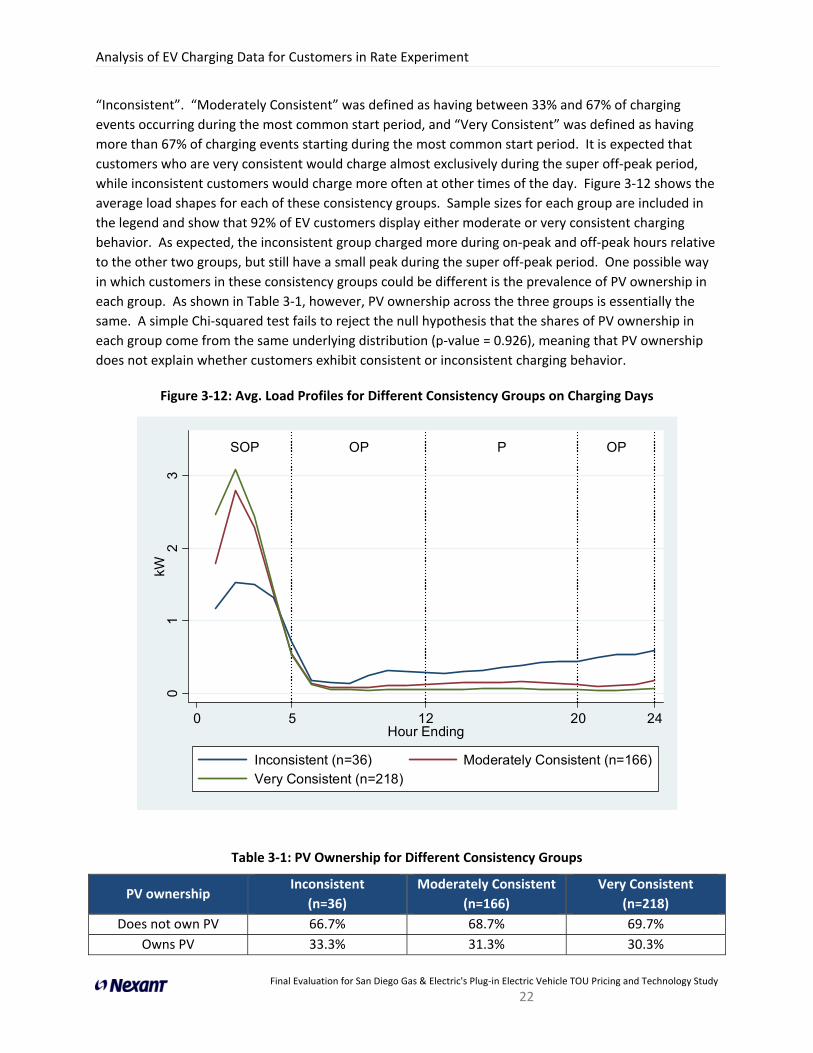
“Inconsistent”. “Moderately Consistent” was defined as having between 33% and 67% of charging
events occurring during the most common start period, and “Very Consistent” was defined as having
more than 67% of charging events starting during the most common start period. It is expected that
customers who are very consistent would charge almost exclusively during the super off‐peak period,
while inconsistent customers would charge more often at other times of the day. Figure 3‐12 shows the
average load shapes for each of these consistency groups. Sample sizes for each group are included in
the legend and show that 92% of EV customers display either moderate or very consistent charging
behavior. As expected, the inconsistent group charged more during on‐peak and off‐peak hours relative
to the other two groups, but still have a small peak during the super off‐peak period. One possible way
in which customers in these consistency groups could be different is the prevalence of PV ownership in
each group. As shown in Table 3‐1, however, PV ownership across the three groups is essentially the
same. A simple Chi‐squared test fails to reject the null hypothesis that the shares of PV ownership in
each group come from the same underlying distribution (p‐value = 0.926), meaning that PV ownership
does not explain whether customers exhibit consistent or inconsistent charging behavior.
Figure 3‐12: Avg. Load Profiles for Different Consistency Groups on Charging Days
Table 3‐1: PV Ownership for Different Consistency Groups
PV ownership Inconsistent
(n=36)
Moderately Consistent
(n=166)
Very Consistent
(n=218)
Does not own PV 66.7% 68.7% 69.7%
Owns PV 33.3% 31.3% 30.3%
SOP OP P OP
01
23
kW
0 5 12 20 24Hour Ending
Inconsistent (n=36) Moderately Consistent (n=166)Very Consistent (n=218)
Analysis of EV Charging Data for Customers in Rate Experiment
Final Evaluation for San Diego Gas & Electric's Plug‐in Electric Vehicle TOU Pricing and Technology Study
23
3.3 Dynamic Load Analysis
The figures presented in the previous section provide many insights into how EV customers charge their
vehicles at home, the impact of TOU rates and the importance of enabling technology (in this case
charging timers), but they provide only a static view of EV charging behavior. Another important
dimension to consider is time. In particular, it is important to explore whether EV charging behavior is
changing over time and whether or not the patterns shown in the static analysis are persistent. This
section addresses these topics by primarily analyzing EV loads as a function of the amount of time that a
customer remains in the Study. The focus of this section is on the share of EV charging that occurred in
the on‐peak and super off‐peak periods for each of the rate groups.
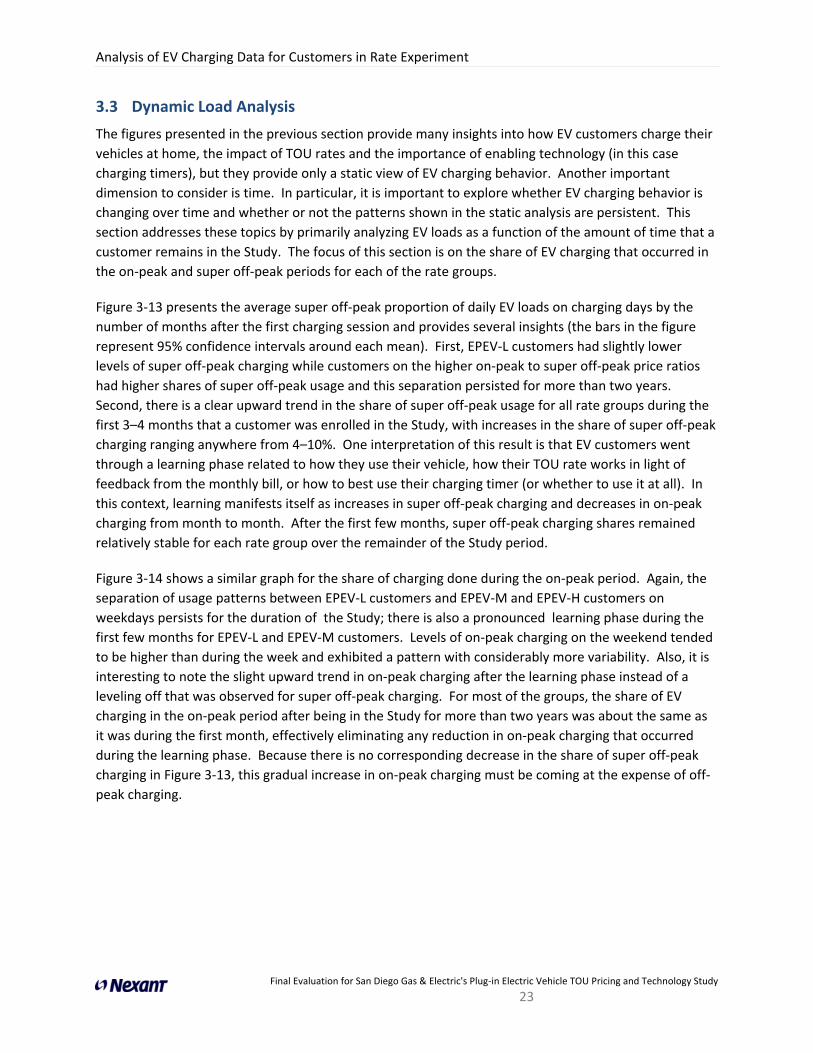
Figure 3‐13 presents the average super off‐peak proportion of daily EV loads on charging days by the
number of months after the first charging session and provides several insights (the bars in the figure
represent 95% confidence intervals around each mean). First, EPEV‐L customers had slightly lower
levels of super off‐peak charging while customers on the higher on‐peak to super off‐peak price ratios
had higher shares of super off‐peak usage and this separation persisted for more than two years.
Second, there is a clear upward trend in the share of super off‐peak usage for all rate groups during the
first 3–4 months that a customer was enrolled in the Study, with increases in the share of super off‐peak
charging ranging anywhere from 4–10%. One interpretation of this result is that EV customers went
through a learning phase related to how they use their vehicle, how their TOU rate works in light of
feedback from the monthly bill, or how to best use their charging timer (or whether to use it at all). In
this context, learning manifests itself as increases in super off‐peak charging and decreases in on‐peak
charging from month to month. After the first few months, super off‐peak charging shares remained
relatively stable for each rate group over the remainder of the Study period.
Figure 3‐14 shows a similar graph for the share of charging done during the on‐peak period. Again, the
separation of usage patterns between EPEV‐L customers and EPEV‐M and EPEV‐H customers on
weekdays persists for the duration of the Study; there is also a pronounced learning phase during the
first few months for EPEV‐L and EPEV‐M customers. Levels of on‐peak charging on the weekend tended
to be higher than during the week and exhibited a pattern with considerably more variability. Also, it is
interesting to note the slight upward trend in on‐peak charging after the learning phase instead of a
leveling off that was observed for super off‐peak charging. For most of the groups, the share of EV
charging in the on‐peak period after being in the Study for more than two years was about the same as
it was during the first month, effectively eliminating any reduction in on‐peak charging that occurred
during the learning phase. Because there is no corresponding decrease in the share of super off‐peak
charging in Figure 3‐13, this gradual increase in on‐peak charging must be coming at the expense of off‐
peak charging.
Analysis of EV Charging Data for Customers in Rate Experiment
Final Evaluation for San Diego Gas & Electric's Plug‐in Electric Vehicle TOU Pricing and Technology Study
24
Figure 3‐13: Average Super‐off Peak Proportion of Daily EV Energy Consumption on Charging Days, by Months on Rate27
27 The sharp upturn at the right hand side of the graph for the EPEV-L group on weekends reflects the behavior of the small sample of customers that were the first to join the study. This probably reflects their steady state behavior at the end of their initial learning period, which became masked in the graph by the behavior of new entrants, rather than some change in behavior near the end of the study period.
70
80
90
Avg
. % c
harg
ing
su
per
off-
peak
0 6 12 18 24 30Months in study
EPEV-H EPEV-MEPEV-L
Weekday
70
80
90
Avg
. % c
harg
ing
su
per
off-
peak
0 6 12 18 24 30Months in study
EPEV-H EPEV-MEPEV-L
Weekend

Analysis of EV Charging Data for Customers in Rate Experiment
Final Evaluation for San Diego Gas & Electric's Plug‐in Electric Vehicle TOU Pricing and Technology Study
25
Figure 3‐14: Average Peak Proportion of Daily EV Energy Consumption on Charging Days, by Months on Rate28
28 Similar to Figure 3-13, the sharp downturn at the right hand side of the graph for the EPEV-L group on weekends reflects the behavior of the small sample of customers that were the first to join the study. Together with Figure 3-13, the figure suggests that early adopters substituted super off-peak charging for charging during the peak period.
05
10
15
Avg
. % c
harg
ing
on-
pea
k
0 6 12 18 24 30Months in study
EPEV-H EPEV-MEPEV-L
Weekday
05
10
15
Avg
. % c
harg
ing
on-
pea
k
0 6 12 18 24 30Months in study
EPEV-H EPEV-MEPEV-L
Weekend
Analysis of EV Charging Data for Customers in Rate Experiment
Final Evaluation for San Diego Gas & Electric's Plug‐in Electric Vehicle TOU Pricing and Technology Study
26
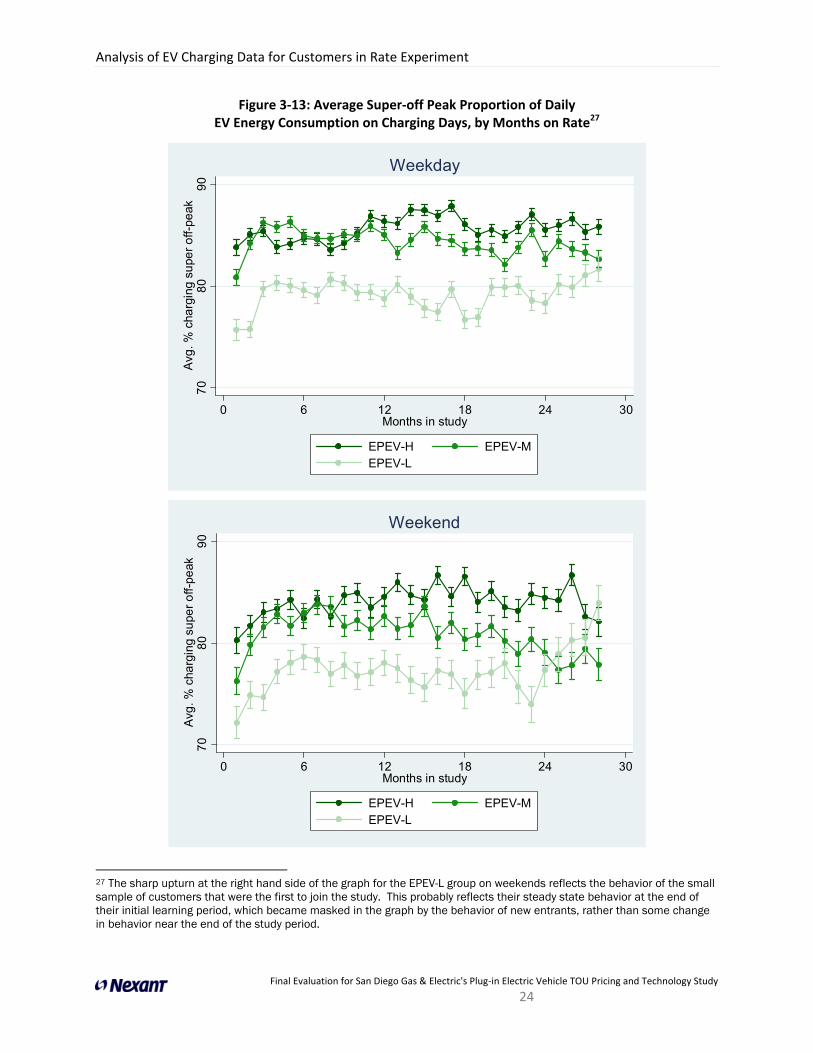
To formally test for differences in charging shares between the three rate groups, a regression model
was estimated on the monthly data shown in Figure 3‐13 with dummy variables denoting a customer’s
rate included as regressors. Using monthly observations for each customer provides a panel data set
that allows for the use of a more powerful regression model.29 The estimated coefficients from this
model provide measures of the average differences in percentage charging shares between customers
on different rates. These differences were obtained using a random‐effects model30 incorporating
panel‐corrected standard errors with individual‐specific AR1 corrections to account for the fact that the
observations for a given individual over time are likely to be related to each other.31,32 The t‐statistics
for the rate dummies provide pairwise tests of differences in the impacts of the rates. These differences
are shown in Table 3‐2, which shows that the impacts of the three rates on charging shares are
statistically different from one another, mostly at a significance level of 1%. The EPEV‐H rate induced
more super off‐peak charging and less on‐peak charging than both the EPEV‐L and EPEV‐M rates. The
estimated differences in the table can be interpreted as causal given the randomized experimental
design of this Study. For example, the EPEV‐H rate increased the share of weekday charging during the
super off‐peak period by 6% compared to the EPEV‐L rate and almost 2% compared to the EPEV‐M rate.
Table 3‐2: Tests of Pair‐wise Differences in Percentage Charging Shares between Rates
Day Type Charging Share EPEVL – EPEVM EPEVL – EPEVH EPEVM – EPEVH
Weekday % Peak 1.80 3.08 1.29
% Super Off‐Peak ‐4.16 ‐6.04 ‐1.87
Weekend % Peak 2.33 3.25 0.92
% Super Off‐Peak ‐4.06 ‐6.62 ‐2.55
= Significant at 1%
= Significant at 5%
= Not Significant at 5%
To formally test for the presence of a learning effect, a regression model with random effects was
estimated for each rate group containing three explanatory variables: the number of months in the
Study, a dummy variable denoting whether a given month is one of the first four months for an
29 Panel data is defined as data containing multiple observations over time for each unit of analysis. The term “panel” refers to a unit of analysis. In this case the panels are the EV customers and each customer has monthly observations.
30 The two most common panel regression models used are the fixed effects model and the random effects model. Each assumes that there are unobserved characteristics of each individual that influence the outcome of interest. The random effects model assumes that these characteristics are not related to a customer’s rate, which is a good assumption in this case due to the random assignment of rates.
31 Panel data observations are likely to be related in two different ways. First, each individual has their own unique characteristics and circumstances that will be important determinants of their charging patterns in every month. Second, charging behavior for an individual in any given month is likely to be related to that individual’s charging behavior in previous months. This second data feature is known as autocorrelation (or serial correlation) and is a common issue when analyzing observations over time. An AR1 process is one where an observation in any given month is affected by the observation in the previous month. An AR2 process is when an observation is influenced not only by the previous observation, but also the observation two periods ago.
32 An alternative model that could be used is a panel regression model with random effects and robust standard errors. Random effects are valid in this circumstance because individuals were randomly assigned to different rates. This model was also estimated and yields the same qualitative results as the PCSE model.
Analysis of EV Charging Data for Customers in Rate Experiment
Final Evaluation for San Diego Gas & Electric's Plug‐in Electric Vehicle TOU Pricing and Technology Study
27
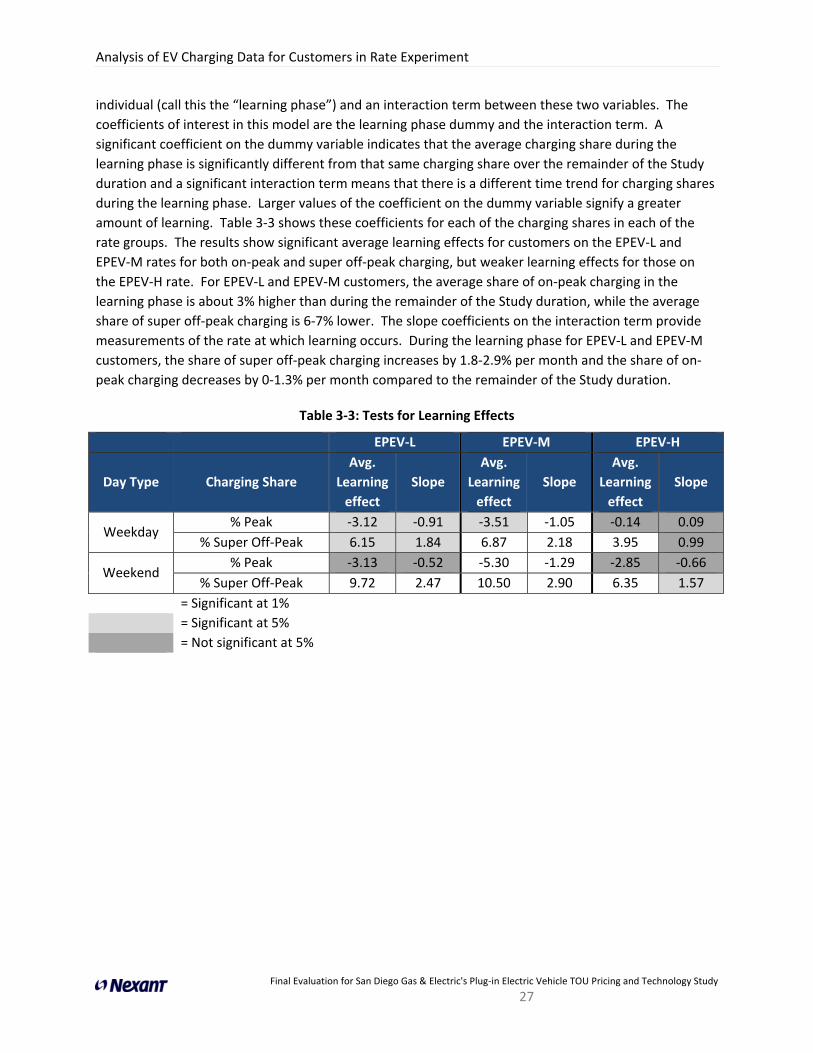
individual (call this the “learning phase”) and an interaction term between these two variables. The
coefficients of interest in this model are the learning phase dummy and the interaction term. A
significant coefficient on the dummy variable indicates that the average charging share during the
learning phase is significantly different from that same charging share over the remainder of the Study
duration and a significant interaction term means that there is a different time trend for charging shares
during the learning phase. Larger values of the coefficient on the dummy variable signify a greater
amount of learning. Table 3‐3 shows these coefficients for each of the charging shares in each of the
rate groups. The results show significant average learning effects for customers on the EPEV‐L and
EPEV‐M rates for both on‐peak and super off‐peak charging, but weaker learning effects for those on
the EPEV‐H rate. For EPEV‐L and EPEV‐M customers, the average share of on‐peak charging in the
learning phase is about 3% higher than during the remainder of the Study duration, while the average
share of super off‐peak charging is 6‐7% lower. The slope coefficients on the interaction term provide
measurements of the rate at which learning occurs. During the learning phase for EPEV‐L and EPEV‐M
customers, the share of super off‐peak charging increases by 1.8‐2.9% per month and the share of on‐
peak charging decreases by 0‐1.3% per month compared to the remainder of the Study duration.
Table 3‐3: Tests for Learning Effects
EPEV‐L EPEV‐M EPEV‐H
Day Type Charging Share
Avg.
Learning
effect
Slope
Avg.
Learning
effect
Slope
Avg.
Learning
effect
Slope
Weekday % Peak ‐3.12 ‐0.91 ‐3.51 ‐1.05 ‐0.14 0.09
% Super Off‐Peak 6.15 1.84 6.87 2.18 3.95 0.99
Weekend % Peak ‐3.13 ‐0.52 ‐5.30 ‐1.29 ‐2.85 ‐0.66
% Super Off‐Peak 9.72 2.47 10.50 2.90 6.35 1.57
= Significant at 1%
= Significant at 5%
= Not significant at 5%

Analysis of Whole‐house Data for EV‐TOU‐2 Customers in the EV Project and Not in the Study
Final Evaluation for San Diego Gas & Electric's Plug‐in Electric Vehicle TOU Pricing and Technology Study
28
4 Analysis of Whole‐house Data for EV‐TOU‐2 Customers in the EV Project and Not in the Study
As discussed previously, in addition to customers in one of the three experimental rate groups (EPEV‐L,
EPEV‐M and EPEV‐H), some EV customers who were screened to participate in the EV Project either
chose not to participate in the Study or had home configurations that did not lend themselves to the
installation of a separate meter and disconnect breaker serving the charging station. These customers
were given the choice to either enroll in a whole‐house TOU rate (EV‐TOU‐2) with prices almost identical
to the EPEV‐L rate, or remain on the standard, tiered residential rate that does not vary over time of
day. This section presents analysis of EV charging behavior for the group that enrolled on the whole‐
house TOU rate (i.e., the entire household usage is subject to a TOU rate structure).
Because this group was not in the Study and was not randomly assigned to an experimental EV rate,
there are several limitations in comparing EV‐TOU‐2 customers to the Study customers. These
limitations are noted and discussed throughout this section with the primary focus on drawing
conclusions within the EV‐TOU‐2 group based on data before and after acquiring an EV.33
Figure 4‐1 shows the load profiles for EV‐TOU‐2 customers before and after the acquisition of an EV,
split out by PV ownership. To account for seasonal load patterns, only customers having 9 months of
data pre‐ and post‐EV acquisition were included. For this group, customers were on the DR rate prior to
acquiring an EV and then switched to the EV‐TOU‐2 rate after receiving their EV. Thus, the “After EV”
load profile in each panel in Figure 4‐1 captures not only the impact of the EV load, but also non‐EV load
(other household end‐use) responses to the price signals in the TOU rate. Still, the figure provides some
interesting insights into the overall household load impacts of acquiring an EV.
33 Such a pre/post analysis is also vulnerable to making incorrect statements about the causal impacts of EVs on whole-house electricity consumption. Because of this, most of the analysis in this section should be treated as descriptive.
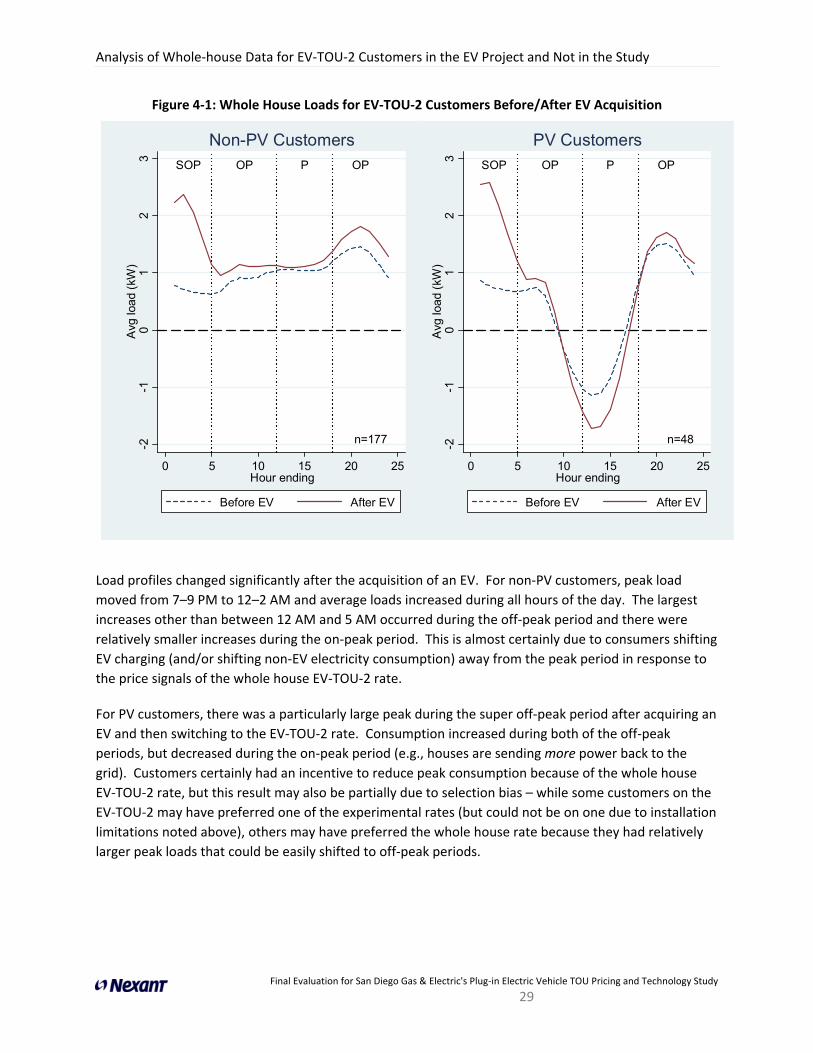
Analysis of Whole‐house Data for EV‐TOU‐2 Customers in the EV Project and Not in the Study
Final Evaluation for San Diego Gas & Electric's Plug‐in Electric Vehicle TOU Pricing and Technology Study
29
Figure 4‐1: Whole House Loads for EV‐TOU‐2 Customers Before/After EV Acquisition
Load profiles changed significantly after the acquisition of an EV. For non‐PV customers, peak load
moved from 7–9 PM to 12–2 AM and average loads increased during all hours of the day. The largest
increases other than between 12 AM and 5 AM occurred during the off‐peak period and there were
relatively smaller increases during the on‐peak period. This is almost certainly due to consumers shifting
EV charging (and/or shifting non‐EV electricity consumption) away from the peak period in response to
the price signals of the whole house EV‐TOU‐2 rate.
For PV customers, there was a particularly large peak during the super off‐peak period after acquiring an
EV and then switching to the EV‐TOU‐2 rate. Consumption increased during both of the off‐peak
periods, but decreased during the on‐peak period (e.g., houses are sending more power back to the
grid). Customers certainly had an incentive to reduce peak consumption because of the whole house
EV‐TOU‐2 rate, but this result may also be partially due to selection bias – while some customers on the
EV‐TOU‐2 may have preferred one of the experimental rates (but could not be on one due to installation
limitations noted above), others may have preferred the whole house rate because they had relatively
larger peak loads that could be easily shifted to off‐peak periods.
n=177
SOP OP P OP
-2-1
01
23
Avg
load
(kW
)
0 5 10 15 20 25Hour ending
Before EV After EV
Non-PV Customers
n=48
SOP OP P OP
-2-1
01
23
Avg
load
(kW
)
0 5 10 15 20 25Hour ending
Before EV After EV
PV Customers

Electricity Demand Model
Final Evaluation for San Diego Gas & Electric's Plug‐in Electric Vehicle TOU Pricing and Technology Study
30
5 Electricity Demand Model
Although descriptive graphs and statistics of EV charging load are highly informative about participant
behavior, it is important to understand how the results can be extrapolated to other populations and
other TOU pricing structures. To perform such an extrapolation requires a model of demand for EV
charging. The primary output of such a model will be estimates of elasticities of demand, which are a
way of summarizing how demand for EV charging would respond to a range of TOU rate prices.
This section describes the methodology for estimating a structural economic model of demand for EV
charging within the Study and its EV TOU rates. First is a description of the model used for the analysis,
followed by a description of the estimation procedure. The final subsection contains results from the
estimation and puts them into a broader context.
5.1 Model Description
To estimate the effects of TOU pricing on EV charging behavior using the available data, a structural
economic model of demand is specified in which consumers choose the amount of EV charging in each
TOU period with the goal of minimizing the total cost of EV charging given the prices in each period and
driver‐specific factors, such as the need for use of a vehicle, the schedule of the customer/driver and the
current state of charge in the EV. The prices affecting this decision are known and enter the model
directly, whereas the driver‐specific factors are unobserved and are captured by parameters estimated
by assuming cost minimizing behavior on EV charging decisions.
Focusing on the price‐related aspects of the EV charging decision, EV customers made trade‐offs
between charging during convenient times and charging during less expensive periods. These trade‐offs
can be captured and quantified by using price elasticities. Price elasticities measure the responsiveness
of purchase decisions to a change in the price of a particular good. In this case, elasticities show how
the quantity of EV charging during one period changes when the price of EV charging changes during
that same period (own‐price elasticity) or during another period (cross‐price elasticity). It is important
to recognize that the amount of EV charging a household does at any time is determined both by how
much it costs at that time (including opportunity costs) and by how much it costs at other times. For
example, charging right now for $0.35/kWh might be quite unattractive if the price one hour from now
is $0.15/kWh and might be quite attractive if the price one hour from now is $0.75/kWh. Charging very
early in the morning is almost certainly more attractive than driving home from work in the middle of
the day to charge. So, a customer’s EV charging at any given time is determined by the entire schedule
of prices and costs that the household faces, rather than just by those in the current period.
Elasticities of demand can be defined and estimated for virtually any good that consumers buy.
Therefore, it is possible to interpret the elasticities estimated for this rate experiment in the context of
elasticities of demand for other consumer goods. Elasticities of demand are influenced by a number of
factors, such as:
Availability of substitutes: customers will be more sensitive to changes in price (more elastic) with the availability of close substitutes (e.g., charging in one time period can be a close substitute for charging in another time period);

Electricity Demand Model
Final Evaluation for San Diego Gas & Electric's Plug‐in Electric Vehicle TOU Pricing and Technology Study
31
Percentage of income: customers will be more sensitive to the price of a good the higher the expenditure share is in terms of the percentage of a typical customer’s income;
Necessity: customers will be less sensitive to price if a good is a necessity; and
Duration: customers will be more sensitive to price in the long run, as it gives them more time to change behavior.
Table 5‐1 provides examples of the own‐price elasticity of demand for a number of goods. The way to
interpret these values is that they indicate by what percentage the quantity demanded will change for a
percentage change in price. Own‐price elasticities generally have a negative sign, indicating that an
increase in price will result in a decrease in demand. For example, the value of ‐0.1 for salt tells us that a
1% increase in the price of salt will reduce the quantity demanded by 0.1%. Elasticities are generally
considered according to their absolute values, so values closer to zero indicate items that have lower
elasticities or have more inelastic demand. In general, items on the list that are necessities (such as salt)
and that have no close substitutes (such as coffee) have elasticities much closer to zero (e.g., lower)
than items that are non‐necessities (such as restaurant meals) and items that have close substitutes
(such as Chevrolets).
Table 5‐1: Example Elasticities34
Product Elasticity
Salt ‐0.1
Coffee ‐0.3
Daily Electricity ‐0.3 to ‐0.5
Fish (cod) consumed at home ‐0.5
Taxi, short‐run ‐0.6
Movies ‐0.9
Housing, owner occupied ‐1.2
Private education ‐1.1
Radio and television receivers ‐1.2
Restaurant meals ‐2.3
Foreign travel, long‐run ‐4.0
Chevrolet automobiles ‐4.0
Fresh tomatoes ‐4.6
34 Elasticities in this table were taken from http://welkerswikinomics.wetpaint.com/page/PED+for+Various+Products. The original sources are: Economics: Private and Public Choice, James D. Gwartney and Richard L. Stroup, eighth edition 1997, seventh edition 1995; primary sources: Hendrick S. Houthakker and Lester D. Taylor, Consumer Demand in the United States, 1929-1970 (Cambridge: Harvard University Press, 1966,1970); Douglas R. Bohi, Analyzing Demand Behavior (Baltimore: Johns Hopkins University Press, 1981); Hsaing-tai Cheng and Oral Capps, Jr., "Demand for Fish" American Journal of Agricultural Economics, August 1988; and U.S. Department of Agriculture.

Electricity Demand Model
Final Evaluation for San Diego Gas & Electric's Plug‐in Electric Vehicle TOU Pricing and Technology Study
32
The model in this analysis defines the elasticities that determine a customer’s EV charging behavior
as follows:
: The elasticity of on‐peak charging with respect to the price of on‐peak charging. This
quantity tells us how much the quantity of on‐peak EV charging is expected to change when the price of on‐peak charging changes (all other things held constant). This is also referred to as the own‐price elasticity of on‐peak charging. The elasticity of off‐peak EV charging with respect to its price and the elasticity of super off‐peak charging with respect to its price have similar interpretations and are denoted by and , respectively, where the op subscript refers to the off‐peak period and sop refers to the super off‐peak period;
: The elasticity of on‐peak charging with respect to the price of off‐peak charging. This is a
cross‐price elasticity that shows how much the quantity of on‐peak charging is expected to change when the price of off‐peak charging changes; and
: The elasticity of off‐peak charging with respect to the price of on‐peak charging, which is
also a cross‐price elasticity. The remaining cross‐price elasticities are denoted similarly: ,
, , and . The notation can be somewhat confusing due to the double
subscript. These values should not be considered as second derivatives and consequently, cross‐price elasticities are not necessarily symmetric. For example, it is not necessarily the case that . (In fact, that will be true only rarely.)
The elasticities are defined as applying to EV charging during the TOU time periods. However, customer
decision‐making probably takes place at a more granular level of time; households decide not only
between charging during on‐peak and off‐peak periods, but also between charging from 2 to 3 PM, for
example. The pricing experiment analyzed here only allowed us to model decision‐making over the
experimental rate’s TOU time periods because those are the only time periods over which different sets
of prices were observed. There are no customers in the experiment who faced different prices at 2 PM
than at 3 PM, so it is not possible to make any inference about how customers responded to different
prices at those times.
To estimate the elasticities listed above, a system of electricity demand equations derived from a
generalized Leontief cost function were estimated. This framework treats customers as a unit or agent
that consumes many inputs (e.g., electricity use) that go into the production of many outputs, such as
labor, meals, entertainment, transportation, etc. These outputs jointly contribute to a household’s
utility or well‐being. The focus is on one output and one input in particular: the use of an EV and the
electricity used to charge it. Although it is the case that a customer’s use of an EV contributes to well‐
being in a way that depends on many other factors in the household, there is insufficient data for each
customer to model this aspect of the problem. Instead, we assume that the household’s EV charging
decisions are separable from its decisions to consume other goods and services. This allows us to model
EV charging decisions separately from other household decisions. This strong assumption is virtually
always used in demand modeling and is a result of the limited data available to modelers.
Using this framework, the estimation procedure uses the amounts of electricity consumed to charge the
EV in each of the pricing periods: on‐peak, off‐peak and super off‐peak. A cost function is specified that
includes prices, quantities and parameters that describe the total costs of EV charging associated with a
given level of EV usage and estimates the parameters of the cost function using load data and the price

Electricity Demand Model
Final Evaluation for San Diego Gas & Electric's Plug‐in Electric Vehicle TOU Pricing and Technology Study
33
variation across customers in the pilot. A generalized Leontief (GL) cost function is used that is
essentially a special case of the model presented in Aigner, Newman and Tishler (1994),35 who use the
GL functional form to examine non‐residential TOU rates in Israel. As with their model, three distinct
periods of consumption are used: on‐peak, off‐peak and super off‐peak. After estimating the
parameters of the cost function, elasticities are calculated for the experimental TOU rates, which can be
used to estimate impacts for other possible TOU rates.
The foundation of the model is the assumption that the customer chooses consumption during each
period to minimize the cost function that contains total household production and electricity prices
during different periods of the day.36 For any given set of prices, there is an optimal amount of
production (and therefore utility) that the household can achieve, and the solution to minimizing the
cost function represents the lowest cost at which a customer can achieve that level of production under
a given set of prices.
The GL cost function is defined such that the cost of EV charging (C) is a function of EV usage (y), prices
(p fori 1,2,3) and parameters (β fori, j 1,2,3).37
∑ ⁄ (1)
From the cost function, it is possible to derive equations that define the share of each period’s
expenditure ( ) as a percentage of total expenditure in terms of prices and parameters.38
∑⁄
∑ ∑⁄ , , (2)
In equation (2) the j and k indices each go from 1 to 3. Together, these share equations make up a
system of seemingly unrelated regressions (SUR). The estimation of the SUR is done in STATA, using the
nlsur function, which fits a system of nonlinear equations by feasible, generalized nonlinear least
squares.
35 Aigner, D. J., J. Newman and A. Tishler. "The Response of Small and Medium-size Business Customers to Time-of-Use (TOU) Electricity Rates in Israel." Journal of Applied Econometrics. (1994). 36 A detailed description of the derivation of model is included in Appendix B.
37 To keep notation simple in the model development, we use 1, 2, 3 to denote the peak, off-peak and super off-peak periods, respectively, rather than p, op and sop.
38 Note that the model does not differentiate among days and therefore within the model there is no difference between expenditure shares at a daily level and expenditure shares at a monthly level (as long as the distinction between weekends and weekdays is handled consistently). The model is estimated on monthly usage shares.

Electricity Demand Model
Final Evaluation for San Diego Gas & Electric's Plug‐in Electric Vehicle TOU Pricing and Technology Study
34
The estimated parameters are those that minimize the squared difference between the predicted and
actual share for each month of each customer. From these estimated parameters, the own‐price
elasticities were calculated using:
∑ ⁄ ⁄ , , (3)
and the cross price elasticities using: ⁄ ⁄
∑ ⁄ ⁄ (4)
These elasticities correspond to those defined above. In both (3) and (4), the index k goes from 1 to 3.
5.2 Data
The data used to estimate the model comes from 430 customers who were on an experimental EV TOU
rate at some point during the Study period. In order to maximize the price variation that is used to
identify the model, data for all of the rate groups and both seasons was included in the estimation. The
data covers the period from January 2011 until October 2013 and originates as 15‐minute or 1‐hour
interval measurements of kWh. The electricity rates from Table 2‐1 are used as the prices in the model.
The interval data is then converted into monthly shares of on‐peak, off‐peak and super off‐peak
consumption, by customer, as a fraction of total monthly expenditure respectively. Appendix B shows
results for alternative choices of data as model inputs.
A good first step in analyzing Study results is to evaluate the implementation of the experimental design.
In this case, a crucial part of the experiment is that customers who chose to be part of the pricing
experiment are randomly assigned to one of three rates. It is important therefore to assess whether
that random assignment has been achieved without any selection bias entering the experiment. To
address this, Table 5‐2 shows the results of a validation exercise using data from a survey completed
during the Study that demonstrates the successful randomization of customers onto one of the three
experimental TOU rates. The table shows counts of customers with observed characteristics across the
three rates to demonstrate that the distributions of these characteristics are similar within each TOU
rate. The observed characteristics in the table are climate zone, reported age from the survey, reported
education, reported income and whether or not a customer responded to the survey. The table shows
both raw counts for each TOU rate within each characteristic category and the percentage of customers
on each rate with that characteristic. As the table shows, in general, the distribution of each
characteristic is similar across each of the three experimental EV TOU rates.
Table 5‐2 also shows the results of a statistical test that shows whether there is any evidence that the
distribution of a given characteristic is correlated with the EV TOU rates. This test is known as Fisher’s
exact probability test, and it is a common way of judging whether distributions of two variables are
correlated within a population. In this test, small values in the far right column of the table would
indicate that there was a meaningful correlation between the distribution of the characteristic in the
population and the TOU rate, which would suggest that some type of selection bias may have entered
the experiment. Generally, values below 0.05 would be cause for further investigation. For this pilot, all
values are above 0.2, indicating that there is no evidence of selection bias.
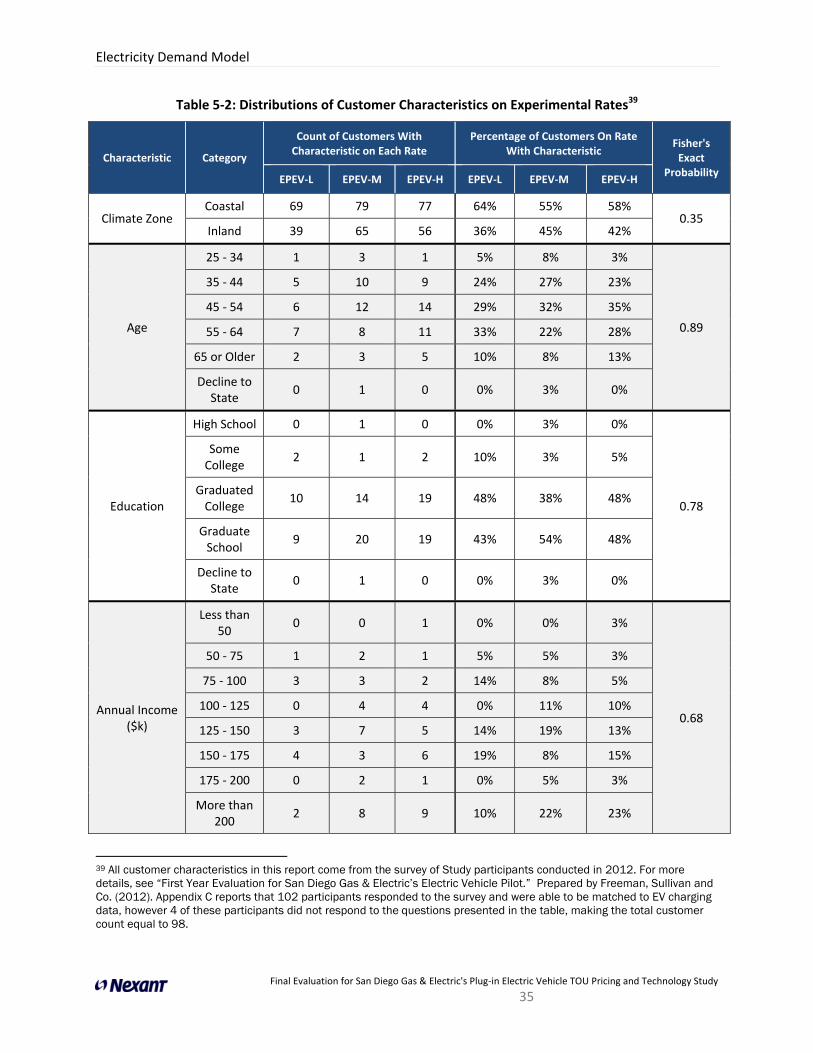
Electricity Demand Model
Final Evaluation for San Diego Gas & Electric's Plug‐in Electric Vehicle TOU Pricing and Technology Study
35
Table 5‐2: Distributions of Customer Characteristics on Experimental Rates39
Characteristic Category
Count of Customers With Characteristic on Each Rate
Percentage of Customers On Rate With Characteristic
Fisher's Exact
Probability EPEV‐L EPEV‐M EPEV‐H EPEV‐L EPEV‐M EPEV‐H
Climate Zone Coastal 69 79 77 64% 55% 58%
0.35 Inland 39 65 56 36% 45% 42%
Age
25 ‐ 34 1 3 1 5% 8% 3%
0.89
35 ‐ 44 5 10 9 24% 27% 23%
45 ‐ 54 6 12 14 29% 32% 35%
55 ‐ 64 7 8 11 33% 22% 28%
65 or Older 2 3 5 10% 8% 13%
Decline to State
0 1 0 0% 3% 0%
Education
High School 0 1 0 0% 3% 0%
0.78
Some College
2 1 2 10% 3% 5%
Graduated College
10 14 19 48% 38% 48%
Graduate School
9 20 19 43% 54% 48%
Decline to State
0 1 0 0% 3% 0%
Annual Income ($k)
Less than 50
0 0 1 0% 0% 3%
0.68
50 ‐ 75 1 2 1 5% 5% 3%
75 ‐ 100 3 3 2 14% 8% 5%
100 ‐ 125 0 4 4 0% 11% 10%
125 ‐ 150 3 7 5 14% 19% 13%
150 ‐ 175 4 3 6 19% 8% 15%
175 ‐ 200 0 2 1 0% 5% 3%
More than 200
2 8 9 10% 22% 23%
39 All customer characteristics in this report come from the survey of Study participants conducted in 2012. For more details, see “First Year Evaluation for San Diego Gas & Electric’s Electric Vehicle Pilot.” Prepared by Freeman, Sullivan and Co. (2012). Appendix C reports that 102 participants responded to the survey and were able to be matched to EV charging data, however 4 of these participants did not respond to the questions presented in the table, making the total customer count equal to 98.

Electricity Demand Model
Final Evaluation for San Diego Gas & Electric's Plug‐in Electric Vehicle TOU Pricing and Technology Study
36
Characteristic Category
Count of Customers With Characteristic on Each Rate
Percentage of Customers On Rate With Characteristic
Fisher's Exact
Probability EPEV‐L EPEV‐M EPEV‐H EPEV‐L EPEV‐M EPEV‐H
Decline to State
8 8 11 38% 22% 28%
Survey Response
Yes 23 37 42 21% 26% 31% 0.22
No 85 106 94 79% 74% 69%
Table 5‐3 shows the average usage in each period by rate group on weekdays and Table 5‐4 shows the
same for weekends. As was shown in Figures 3‐8 through 3‐12, the basic pattern is the same in each
table, with the vast majority of charging occurring during the super off‐peak period for all groups on
both weekdays and weekends.
Table 5‐3: Average Weekday Demand for Each Period by Rate
Rates
Average kW per Period % Load per Period
Peak Off‐peak Super Off‐peak Peak Off‐peak Super Off‐
peak
EPEV‐L 0.10 0.11 1.28 7% 7% 86%
EPEV‐M 0.09 0.09 1.44 6% 6% 89%
EPEV‐H 0.07 0.08 1.41 4% 5% 90%
Table 5‐4: Average Weekend Demand for Each Period by Rate
Rates
Average kW by Period % Load per Period
Peak Off‐peak Super Off‐peak Peak Off‐peak Super Off‐
peak
EPEV‐L 0.11 0.10 1.19 8% 7% 85%
EPEV‐M 0.09 0.08 1.34 6% 5% 89%
EPEV‐H 0.08 0.07 1.34 5% 5% 90%
Figure 5‐1 shows histograms of the shares of total EV charging expenditure in each rate period for every
customer‐month included in the Study. As the histograms show, the share of expense for super off‐peak
charging is much higher than the share of on‐peak and off‐peak charging due to the fact that most
charging occurs during the super off‐peak period.
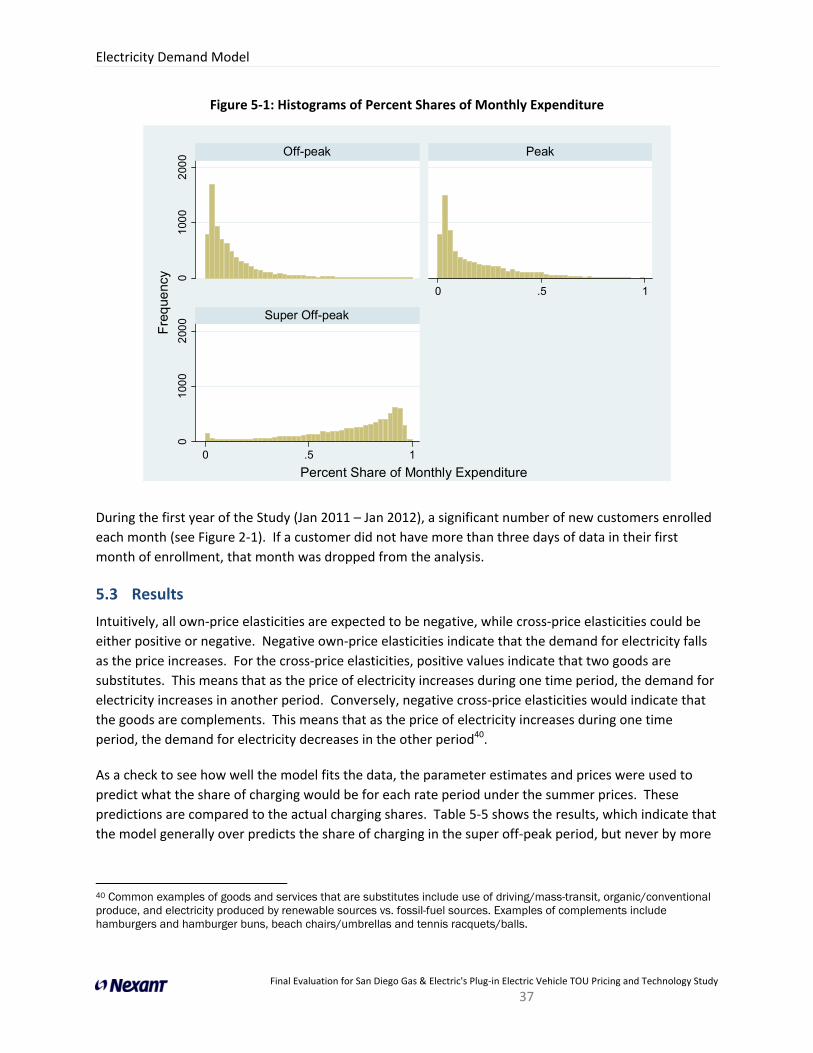
Electricity Demand Model
Final Evaluation for San Diego Gas & Electric's Plug‐in Electric Vehicle TOU Pricing and Technology Study
37
Figure 5‐1: Histograms of Percent Shares of Monthly Expenditure
During the first year of the Study (Jan 2011 – Jan 2012), a significant number of new customers enrolled
each month (see Figure 2‐1). If a customer did not have more than three days of data in their first
month of enrollment, that month was dropped from the analysis.
5.3 Results
Intuitively, all own‐price elasticities are expected to be negative, while cross‐price elasticities could be
either positive or negative. Negative own‐price elasticities indicate that the demand for electricity falls
as the price increases. For the cross‐price elasticities, positive values indicate that two goods are
substitutes. This means that as the price of electricity increases during one time period, the demand for
electricity increases in another period. Conversely, negative cross‐price elasticities would indicate that
the goods are complements. This means that as the price of electricity increases during one time
period, the demand for electricity decreases in the other period40.
As a check to see how well the model fits the data, the parameter estimates and prices were used to
predict what the share of charging would be for each rate period under the summer prices. These
predictions are compared to the actual charging shares. Table 5‐5 shows the results, which indicate that
the model generally over predicts the share of charging in the super off‐peak period, but never by more
40 Common examples of goods and services that are substitutes include use of driving/mass-transit, organic/conventional produce, and electricity produced by renewable sources vs. fossil-fuel sources. Examples of complements include hamburgers and hamburger buns, beach chairs/umbrellas and tennis racquets/balls.
01
000
200
00
100
02
000
0 .5 1
0 .5 1
Off-peak Peak
Super Off-peak
Fre
que
ncy
Percent Share of Monthly Expenditure

Electricity Demand Model
Final Evaluation for San Diego Gas & Electric's Plug‐in Electric Vehicle TOU Pricing and Technology Study
38
than 6%. This indicates that the model does a good job of predicting the average monthly EV charging
shares for each of the rate groups at these prices.
Table 5‐5: Predicted Versus Actual Usage Shares
Day Type Rates
Usage Shares (%)
Predicted Actual
Peak Off‐Peak Super Off‐
Peak Peak Off‐Peak
Super Off‐Peak
Weekday
EPEV‐L 10% 12% 78% 11% 16% 73%
EPEV‐M 6% 8% 87% 7% 9% 84%
EPEV‐H 4% 8% 89% 6% 9% 84%
Weekend
EPEV‐L 13% 11% 76% 14% 14% 72%
EPEV‐M 7% 7% 85% 11% 10% 79%
EPEV‐H 5% 8% 88% 9% 8% 82%
Note: Not all shares total 100% due to rounding.
The R2 value is an additional way to consider how well the model fits the data. The model consists of
two equations being fit to the data. The equations describe the share of expenditure in the on‐peak
period and the super off‐peak period. The off‐peak EV charging share is fully determined by the other
two equations because the total of the expenditure shares must sum to 100%. The R2 value of the super
off‐peak to on‐peak period equation is 0.89 for weekdays and 0.86 for weekends, indicating a very close
fit of the model to the data. The R2 value of the on‐peak period equation is 0.45 for weekdays and 0.43
for weekends, indicating a looser model fit with more unexplained variation. The model is likely
predicting super off‐peak period EV charging better because that is when a large fraction of EV charging
occurs. On‐peak period charging, on the other hand, is much rarer, more idiosyncratic and therefore
more difficult to estimate accurately.
Using the parameter estimates obtained from the model, we calculated the associated elasticities for
several subgroups of the experiment population. Table 5‐6 shows elasticity estimates for non‐PV
customers for both the weekday and weekend models.41 Note from Equation (3) that the elasticity
formulas include prices, so even though the estimated cost function parameters are constant across rate
groups, the elasticities themselves will vary. Two prices are required to estimate the elasticities and so
the table reports elasticities using the appropriate period prices for each experimental rate. Thus, the
table should be interpreted as having three estimates of each price elasticity (one from each rate) on
both weekdays and weekends. Although standard errors are not shown, all of the elasticity estimates
are significantly different from zero at a 99% confidence level.
41 Additional tables of results, including results from different subsets of the data are included in Appendix B.

Electricity Demand Model
Final Evaluation for San Diego Gas & Electric's Plug‐in Electric Vehicle TOU Pricing and Technology Study
39
Table 5‐6: Elasticity Results by Day Type for Non‐PV Customers42
Type of Price
Elasticity Elasticity
Day Type
Weekday Weekend
EPEV‐L EPEV‐M EPEV‐H EPEV‐L EPEV‐M EPEV‐H
Own
‐0.42 ‐0.38 ‐0.36 ‐0.47 ‐0.46 ‐0.45
‐0.45 ‐0.42 ‐0.41 ‐0.46 ‐0.45 ‐0.44
‐0.23 ‐0.27 ‐0.28 ‐0.26 ‐0.30 ‐0.31
Cross
‐0.19 ‐0.27 ‐0.25 ‐0.12 ‐0.17 ‐0.16
‐0.17 ‐0.28 ‐0.40 ‐0.14 ‐0.23 ‐0.32
0.61 0.65 0.60 0.60 0.63 0.62
0.11 0.13 0.15 0.14 0.17 0.19
0.61 0.69 0.80 0.60 0.67 0.76
0.12 0.14 0.13 0.12 0.13 0.12
Note: All estimates are statistically significant at a 99% confidence level.
The own‐price elasticities are all negative, as expected; because an increase in the price of charging
during a given period should cause a decrease in demand during that period. Despite the fact that the
EV charging load shapes are quite different from those associated with a typical whole house residential
TOU rate, the estimated own‐price elasticities for EV charging are similar to other types of residential
load. The elasticities for the on‐peak period and off‐peak period are higher than that for the super off‐
peak period, but all three elasticities fall in the range of results found during the California Statewide
Pricing Pilot, where daily own‐price elasticities for residential customers were estimated to be between
negative 0.3‐0.5.43 The lower own‐price elasticity estimates for the super off‐peak period are likely due
to a combination of charging timers making it relatively easy for EV charging during that period,
customer schedules that limit long charging events to the off‐peak or super‐off peak periods and the
fact that the average length of a charging period fits fully within the super‐off peak time period.
Not all of the cross‐price elasticities are positive, which is somewhat surprising, but not entirely
implausible. It is generally expected that electricity usage between any two periods would be
substitutes, but Table 5‐8 suggests that electricity usage between the on‐peak and off‐peak periods are
partially complementary because and are negative across all price schedules. This implies
that all else being equal, an increase in the off‐peak period price causes a decrease in the usage of
42 The elasticities presented here differ significantly from the estimates contained in the interim report for this project (see “First Year Evaluation for San Diego Gas & Electric’s Electric Vehicle Pilot.” Prepared by Freeman, Sullivan and Co., (2012)). In the prior report, the share equations were incorrectly specified in terms of kWh usage rather than expenditure shares. This significantly overstated the price elasticities. The estimates presented here are based on the same theoretical framework as the prior analysis, but here the framework was properly applied, whereas previously it was not.
43 See “Impact Evaluation of the California Statewide Pricing Pilot.” Prepared by Charles River Associates, (2005).

Electricity Demand Model
Final Evaluation for San Diego Gas & Electric's Plug‐in Electric Vehicle TOU Pricing and Technology Study
40
electricity in the on‐peak period and vice versa. Such a result suggests that many customers may not
differentiate between the on‐peak and off‐peak periods in their EV charging decisions. A simple rule a
customer might use to decide when to charge that could lead to this pattern would be, “use the
charging timer to charge overnight as much as possible, and then charge at other times as necessary.”
Elasticities can also be calculated for different seasons as well as for PV owners. Results for these
subgroups of the Study population are shown in Table 5‐7 and Table 5‐8, respectively. As seen in Table
5‐7, there is very little variation in elasticities across seasons.
Table 5‐7: Elasticity Results by Season for Non‐PV Owners
Day Type Type of Price
Elasticity Elasticity
Rates
Summer Winter
EPEV‐L EPEV‐M EPEV‐H EPEV‐L EPEV‐M EPEV‐H
Weekday
Own
‐0.41 ‐0.37 ‐0.35 ‐0.43 ‐0.38 ‐0.36
‐0.44 ‐0.41 ‐0.40 ‐0.45 ‐0.42 ‐0.41
‐0.23 ‐0.27 ‐0.29 ‐0.22 ‐0.26 ‐0.28
Cross
‐0.19 ‐0.29 ‐0.26 ‐0.19 ‐0.26 ‐0.24
‐0.19 ‐0.30 ‐0.43 ‐0.14 ‐0.25 ‐0.37
0.60 0.66 0.61 0.62 0.64 0.60
0.11 0.13 0.16 0.10 0.13 0.15
0.64 0.71 0.83 0.59 0.68 0.78
0.12 0.14 0.13 0.12 0.14 0.13
Weekend
Own
‐0.47 ‐0.46 ‐0.45 ‐0.48 ‐0.46 ‐0.46
‐0.46 ‐0.44 ‐0.43 ‐0.46 ‐0.45 ‐0.44
‐0.26 ‐0.31 ‐0.32 ‐0.25 ‐0.29 ‐0.31
Cross
‐0.12 ‐0.18 ‐0.17 ‐0.12 ‐0.16 ‐0.16
‐0.16 ‐0.25 ‐0.34 ‐0.12 ‐0.21 ‐0.30
0.59 0.64 0.62 0.60 0.63 0.61
0.15 0.17 0.20 0.13 0.16 0.19
0.62 0.69 0.78 0.58 0.66 0.74
0.12 0.14 0.12 0.12 0.13 0.12
Note: All estimates significant at a 99% confidence level.
Table 5‐8 shows the price elasticities for PV owners. Although the average load shapes for the two
groups are very similar, there are several differences with respect to how the two groups respond to
prices. PV owners have lower own‐price elasticities across the board and the own‐price elasticity for
off‐peak prices is no longer significantly different from zero. Examining the cross‐price elasticities,
consumers respond to changes in super off‐peak prices by shifting EV charging to the on‐peak period
on weekdays and to both the on‐peak and off‐peak periods on weekends. Off‐peak prices seem to
have little bearing on EV charging behavior for PV customers. There are very few differences in the

Electricity Demand Model
Final Evaluation for San Diego Gas & Electric's Plug‐in Electric Vehicle TOU Pricing and Technology Study
41
estimated elasticities across seasons, which is not surprising based on the seasonal load profiles shown
in Section 3.
Table 5‐8: Elasticity Results by Day Type for PV Owners
Type of Price
Elasticity Elasticity
Day Type
Weekday Weekend
EPEV‐L EPEV‐M EPEV‐H EPEV‐L EPEV‐M EPEV‐H
Own
‐0.29 ‐0.23 ‐0.20 ‐0.39 ‐0.36 ‐0.33
0.12 0.16 0.23 ‐0.31 ‐0.27 ‐0.27
‐0.06 ‐0.08 ‐0.10 ‐0.10 ‐0.13 ‐0.15
Cross
‐0.15 ‐0.19 ‐0.16 ‐0.02 ‐0.03 ‐0.02
‐0.17 ‐0.20 ‐0.29 ‐0.03 ‐0.04 ‐0.05
0.45 0.41 0.36 0.41 0.38 0.36
0.06 0.08 0.09 0.06 0.09 0.10
0.05 0.04 0.04 0.34 0.31 0.32
0.01 0.01 0.01 0.04 0.05 0.04
= Significant at a 99% confidence level
= Significant at a 95% confidence level
= Not significant at a 95% confidence level
Though only minor differences in price responsiveness exist between day types and seasons, PV
customers are less price sensitive than non‐PV customers in each of the pricing periods. One possible
explanation for this is that selling PV electricity back to the grid is valued more highly than using it to
charge an EV, thus further constraining the times that are available for EV charging. Another possibility
is that PV owners have certain characteristics that cause them to place an even higher premium on
charging overnight regardless of the prices they face (e.g., the results show a selection effect).
Characteristics that would fit this hypothesis include PV customers being relatively wealthier so that
they are less concerned with the price during different periods, having stronger environmental
preferences that lead to a stronger preference for overnight charging or a having stronger preferences
for automating their charging by using the timers. Some supporting evidence for this reasoning can be
found by looking at the average share of charging by rate period for the different rate groups split out by
customers who install a PV system at some point in the Study (either before or after acquiring an EV)
and customers who never install a PV system. Figure 5‐2 shows that the share of total charging by rate
period varies across the three experimental rates for non‐PV owners but is largely constant for PV
owners.
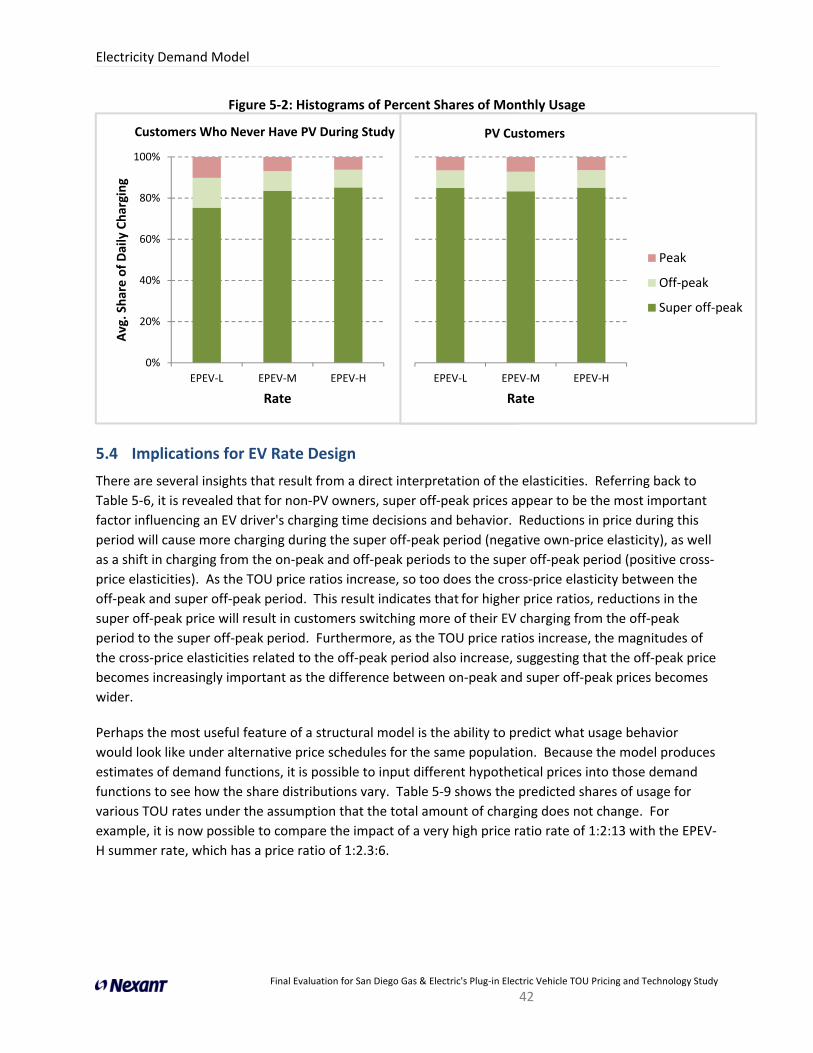
Electricity Demand Model
Final Evaluation for San Diego Gas & Electric's Plug‐in Electric Vehicle TOU Pricing and Technology Study
42
Figure 5‐2: Histograms of Percent Shares of Monthly Usage
5.4 Implications for EV Rate Design
There are several insights that result from a direct interpretation of the elasticities. Referring back to
Table 5‐6, it is revealed that for non‐PV owners, super off‐peak prices appear to be the most important
factor influencing an EV driver's charging time decisions and behavior. Reductions in price during this
period will cause more charging during the super off‐peak period (negative own‐price elasticity), as well
as a shift in charging from the on‐peak and off‐peak periods to the super off‐peak period (positive cross‐
price elasticities). As the TOU price ratios increase, so too does the cross‐price elasticity between the
off‐peak and super off‐peak period. This result indicates that for higher price ratios, reductions in the
super off‐peak price will result in customers switching more of their EV charging from the off‐peak
period to the super off‐peak period. Furthermore, as the TOU price ratios increase, the magnitudes of
the cross‐price elasticities related to the off‐peak period also increase, suggesting that the off‐peak price
becomes increasingly important as the difference between on‐peak and super off‐peak prices becomes
wider.
Perhaps the most useful feature of a structural model is the ability to predict what usage behavior
would look like under alternative price schedules for the same population. Because the model produces
estimates of demand functions, it is possible to input different hypothetical prices into those demand
functions to see how the share distributions vary. Table 5‐9 shows the predicted shares of usage for
various TOU rates under the assumption that the total amount of charging does not change. For
example, it is now possible to compare the impact of a very high price ratio rate of 1:2:13 with the EPEV‐
H summer rate, which has a price ratio of 1:2.3:6.
0%
20%
40%
60%
80%
100%
EPEV‐L EPEV‐M EPEV‐H
Avg. Share of Daily Charging
Rate
Customers Who Never Have PV During Study
Peak
Off‐peak
Super off‐peak
EPEV‐L EPEV‐M EPEV‐H
Rate
PV Customers
Peak
Off‐peak
Super off‐peak
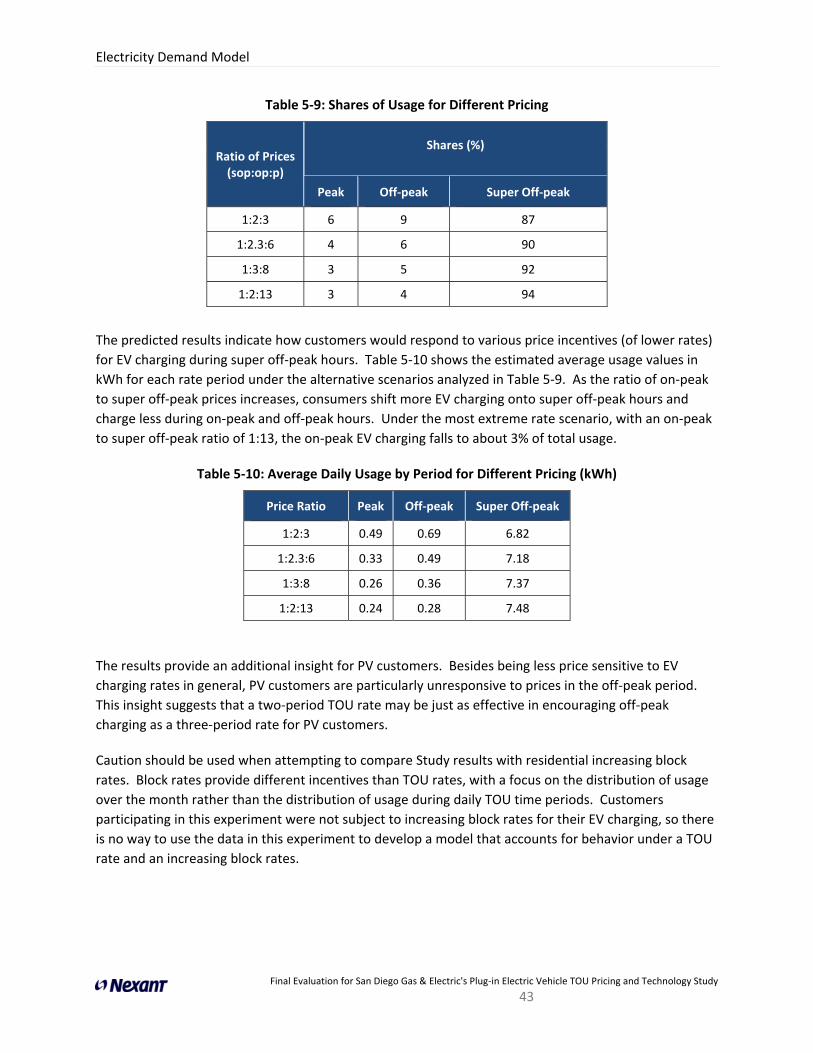
Electricity Demand Model
Final Evaluation for San Diego Gas & Electric's Plug‐in Electric Vehicle TOU Pricing and Technology Study
43
Table 5‐9: Shares of Usage for Different Pricing
Ratio of Prices (sop:op:p)
Shares (%)
Peak Off‐peak Super Off‐peak
1:2:3 6 9 87
1:2.3:6 4 6 90
1:3:8 3 5 92
1:2:13 3 4 94
The predicted results indicate how customers would respond to various price incentives (of lower rates)
for EV charging during super off‐peak hours. Table 5‐10 shows the estimated average usage values in
kWh for each rate period under the alternative scenarios analyzed in Table 5‐9. As the ratio of on‐peak
to super off‐peak prices increases, consumers shift more EV charging onto super off‐peak hours and
charge less during on‐peak and off‐peak hours. Under the most extreme rate scenario, with an on‐peak
to super off‐peak ratio of 1:13, the on‐peak EV charging falls to about 3% of total usage.
Table 5‐10: Average Daily Usage by Period for Different Pricing (kWh)
Price Ratio Peak Off‐peak Super Off‐peak
1:2:3 0.49 0.69 6.82
1:2.3:6 0.33 0.49 7.18
1:3:8 0.26 0.36 7.37
1:2:13 0.24 0.28 7.48
The results provide an additional insight for PV customers. Besides being less price sensitive to EV
charging rates in general, PV customers are particularly unresponsive to prices in the off‐peak period.
This insight suggests that a two‐period TOU rate may be just as effective in encouraging off‐peak
charging as a three‐period rate for PV customers.
Caution should be used when attempting to compare Study results with residential increasing block
rates. Block rates provide different incentives than TOU rates, with a focus on the distribution of usage
over the month rather than the distribution of usage during daily TOU time periods. Customers
participating in this experiment were not subject to increasing block rates for their EV charging, so there
is no way to use the data in this experiment to develop a model that accounts for behavior under a TOU
rate and an increasing block rates.

Conclusions
Final Evaluation for San Diego Gas & Electric's Plug‐in Electric Vehicle TOU Pricing and Technology Study
44
6 Conclusions
This report documents results from San Diego Gas & Electric Company’s (SDG&E’s) multi‐year plug‐in EV
Pricing and Technology Study, which used an innovative research design to randomly assign EV
customers to one of three temporary experimental rates for EV usage, billed separately from the rest of
their premises usage. Each experimental rate had varying price differences between on‐peak, off‐peak
and super off‐peak prices. This Study provides a relevant and timely perspective of EV customer
response to time‐varying rates for EV charging, to inform CPUC rate policy.
The key findings of the report are:
Most EV charging takes place during the super off‐peak period aided by charging timers;
EV customers exhibit learning behavior;
EV charging behavior responds to price signals; and
EV customers are most responsive to changes in on‐peak and off‐peak prices.
Customers in the rate experiment began the vast majority of their EV charging events during early super
off‐peak hours (between 12 AM and 2 AM) and charged their vehicles less frequently on weekends. An
average charging event lasted for about three hours and owners generally charged their vehicles only
once per day. Enabling technology in the form of timers appear to be heavily used by a majority of EV
customers and there is some evidence that customers facing stronger price signals are more likely to
adhere to a fixed EV charging schedule.
EV charging patterns do not vary between seasons and on average, there is no difference in charging
loads between PV customers and non‐PV customers in the experimental TOU rate groups. EV charging
behavior is very similar between customers on the TOU rates with strong price signals (EPEV‐M and
EPEV‐H), but customers facing the weakest price signals (EPEV‐L) charge relatively more outside of the
super off‐peak period. This suggests that the degree to which customers respond to the TOU rate
depends on the price signal strength (on‐peak to off‐peak price ratio) up to a point, after which further
increases in the price ratio have a minimal impact on charging behavior.
There is also evidence that EV customers exhibit learning behavior. During the first four months of
Study enrollment, consumers in all three experimental rate groups (particularly those on the EPEV‐L and
EPEV‐M rates) increased their share of super off‐peak charging and decreased their share of on‐peak
charging. During this learning phase, the share of super off‐peak charging for EPEV‐L and EPEV‐M
customers increased by 1.8‐2.9% per month and the share of on‐peak charging decreased by 0‐1.3% per
month compared to the rest of the Study period. This pattern occurs both on weekdays and weekends
and could be explained by some form of learning about the charging timer technology as well as learning
about the cost impact of by charging during various TOU periods through the monthly bill. Super off‐
peak charging shares stay relatively stable after this initial upward trend, while on‐peak charging shares
gradually increase over the remainder of the Study period.
Elasticity estimates from the structural demand model show that the responsiveness of non‐PV
customers to changes in the price of electricity used for EV charging is similar to observed price
Conclusions
Final Evaluation for San Diego Gas & Electric's Plug‐in Electric Vehicle TOU Pricing and Technology Study
45
responses for residential household consumption from prior estimates (own price elasticities in the
range of negative 0.3‐0.5). PV customers, however, are much less price sensitive in all rate periods
despite their similar load shapes and appear to not be influenced by the price in the off‐peak period.
Simulations of EV charging behavior under TOU rates with other price ratios suggest that a mild price
differential between the super off‐peak and on‐peak periods results in consumers using 80‐90% of their
electricity for EV charging during the super off‐peak period, with further increases in the price ratio
having diminishing impacts.
This Study provides insight on EV customers’ response to time‐varying rates for EV charging and
constitutes valuable information that can inform rate‐setting policy at the CPUC as well as other
jurisdictions. However, the results presented in this report must be viewed in the proper context – all
data analyzed here represent the behavior and choices of customers who are early adopters of a new
technology – in this case, an all‐electric EV. Their behavior can reasonably be expected to be similar to
EV customers in the near future, but may not be representative of a future population of customers who
may eventually adopt EVs years from now. Nonetheless, the analysis contained in this report is an
important and necessary starting point and provides heretofore non‐existent information about trends
and outcomes in the early stage of EV technology adoption.

Nissan LEA
Append
A.1 N
Fi
E
10
A
Li
A
<
R
D
H
A.2 EV This proje
EVs and c
and Techn
DE‐FOA‐0
which wa
and Nashv
$200 milli
of which w
additiona
92
AC
6
A.3 Ph
The follow
Figure A.3
Pricing an
44 Source h
45 See http:
AF Features &
Nissadix A
Nissan LEAF
ive Passenger
PA average 7
00% Electric ‐
ccepts Level
ithium Ion Ba
bout 7 hours
30 min to go
ecycled mate
isplays SOC in
as on‐board c
Project Bac
ect was an EC
harging infra
nology Labora
0000028)45. T
s subsequent
ville/Knoxville
ion in project
was ARRA. A
l infrastructu
25 “Free Allo
bout 500 Levhargers (majo
DC (480V) “F
hotos of EV
wing photos s
3‐2) that was
nd Technology
ttp://www.plug
://energyindepe
& EV Project B
Final Eva
an LEAF Fe
F Features
r Hatchback
3 mile range
‐ Zero Emissio
1, Level 2 and
ttery (24kWh
for full charg
to 80% SOC
erials for inter
n “distance to
charging time
ckground
Otality, U.S. D
structure in U
atory Recove
The following
tly expanded
e/Chattanoog
t funding was
n additional $
re. Infrastruc
wance” Level
vel 2 (220V) chority deploye
Fast Chargers”
Charging a
show the Leve
installed at e
y Study, respe
ginamerica.org/s
endence.wi.gov/
Background
aluation for San D
eatures & E
when fully ch
on Vehicle
d DC Fast Cha
h capacity)
ge – Level 2 (2
on DC Fast Ch
rior and othe
o empty,” GIS
e and duratio
DOE and Niss
U.S. history un
ry Act (Transp
cities make u
during 2010:
ga.
secured to d
$8 million gra
cture planned
l 2 (220V) cha
harging unitsd late 2012 t
” (deployed la
and Meterin
el 2 EV chargi
each custome
ectively.
sites/default/fi
/docview.asp?d
iego Gas & Electri
EV Project
harged44
arging
240v, 3.3 kW
harge
r component
S Map of area
n settings an
an collaborat
nder the U. S
portation Ele
up the scope o
San Diego, S
eploy chargin
ant from CEC
d for the San
arging units –
at about 130hrough mid‐2
ate 2012 thro
ng Equipme
ing unit (see F
r’s home as a
les/imagecache
docid=16303&l
c's Plug‐in Electric
46
Backgrou
charge powe
ts
a reachable
d remote app
tion to carry o
. Department
ctrification Fu
of participatio
Seattle, Portla
ng infrastruct
to eTec was a
Diego region
– Blink Reside
0 locations – P2013)
ough mid‐201
ent
Figure A.3‐1)
a part of the E
e/image_full/ve
locid=160 for m
c Vehicle TOU Pric
6
nd
er)
plications
out the larges
t of Energy’s
unding Oppo
on as origina
and/Salem, Ph
tures in the U
awarded for i
was as follow
ntial Charging
Public and Co
13)
and metering
EV Project an
ehicle-images/n
more details.
ing and Technolog
st deploymen
National Ene
rtunity Numb
lly announced
hoenix/Tucso
U.S. ‐‐ $100 m
installing
ws:
g Installation
ommercial
g equipment
d SDG&E’s EV
nissan_leaf_3.jp
gy Study
nt of
rgy
ber:
d,
on
illion
s
(See
V
pg

Nissan LEAF Features & EV Project Background
Final Evaluation for San Diego Gas & Electric's Plug‐in Electric Vehicle TOU Pricing and Technology Study
47
Figure A.3‐1: Level 2 EV Charging Unit
Figure A.3‐2: Dedicated EV Meter, Socket and Disconnect Box
Model De
Append
This appe
and estim
B.1 Mo
In this rep
function.
Tishler (19
with three
The GL co
obtain inp
facilitating
sophistica
concavity
procedure
satisfy glo
unique so
productio
Faruqui a
relatively
(having th
own‐price
translog m
substituta
The GL m
looking at
examining
GL model
produced
46 Diewert, Political Eco
47 Tishler, AEconomics
48 Faruqui, with Peak L
49 Chung, CEnergy Jour
50 Woo, C. “(1985).
evelopment
Moddix B
ndix provides
mated.
odel
port, the ener
The model u
994), who exa
e‐period prici
ost function (d
put demand e
g econometri
ated to take a
for the sake
e). More com
obal concavity
olution to a pr
on function th
nd Malko (19
few restrictio
hree distinct T
e elasticities a
model used in
ability betwee
odel also ten
t commercial
g TOU price v
produced a b
counter‐intu
W. E. "An Appliconomy. (1971).
A. and S. Lipovet and Statistics.
A and J. R. MalkLoad Pricing.” En
C. and D. J. Aignernal, (1981).
“Demand for Ele
Final Eva
del Develo
s a more tech
rgy usage for
used was esse
amined non‐r
ing: peak, off
derived from
equations tha
ic estimation
advantage of
of estimation
mplex models
y.47 Global co
roblem. In th
hat minimize t
983)48 claim th
ons on the su
TOU rates for
and cross‐pric
n Chung and A
en periods.50
ds to perform
TOU rates, W
variations ran
better fit, and
uitive positive
cation of the Sh
tsky, “The Flexib(1997).
ko. 1983. “The nergy Vol. 8. (19
er. "Industrial a
ectricity of Sma
aluation for San D
opment
hnical descrip
EV Charging
entially a spec
residential TO
‐peak and su
a GL product
at are linear in
. The GL func
the experime
n (and therefo
s, like the CES
oncavity is im
his setting, co
the aggregate
hat the GL spe
bstitution po
r each of the t
ce elasticities
Aigner (1981)
m well with re
Woo (1985) hi
ging from 8:1
d more intuiti
e own‐price e
ephard Duality
ble CES-GBC Fa
Residential Dem983).
nd commercial
ll Nonresidentia
iego Gas & Electri
tion how the
was modeled
cial case of th
OU rates in Isr
per off‐peak.
tion function)
n technologic
ction was an a
ental design, a
ore ensuring
‐GBC, include
mportant for o
ncavity mean
e differences
ecification of
ossibilities. Th
three time pe
between all
)49 are incapa
elatively large
ighlights the b
1 to 2:1 in pea
ive elasticity r
lasticities for
Theorem: A Gen
amily of Cost Fu
mand for Electr
demand for ele
al Customers un
c's Plug‐in Electric
48
electricity de
d using a gene
he model pres
rael. This rep
) was introdu
cal parameter
appealing cho
and simple en
unique soluti
e more param
optimization p
ns that there
between the
ffers improve
his feature all
eriods) to be f
of the time p
ble of testing
e price variati
benefits of th
ak to off‐peak
results, than
some of the
neralized Leont
nctions: Derivat
icity by Time-of-
ectricity by time-
nder Time-Of-Us
c Vehicle TOU Pric
8
emand mode
eralized Leon
sented in Aign
port used the
ced by Diewe
rs for the pur
oice because
nough to sati
ions to the es
meters and do
problems, be
is a set of par
e actual and p
d flexibility b
lows the expe
fully utilized w
periods. Othe
g the hypothe
ons. In a sim
he GL specific
k ratios. Woo
the translog
pricing perio
tief Production F
tion and Applica
-Use: A Survey o
-of-day: A Califo
se (TOU) Pricing
ing and Technolog
el was specifie
tief (GL) cost
ner, Newman
case of the m
ert (1971)46 to
poses of
it is sufficien
sfy global
stimation
o not necessa
cause it impli
rameters for
predicted valu
ecause it imp
erimental des
while estimat
er models, like
esis of zero
ilar experime
ation when
o found that t
model, which
ds.
Function." Journ
ation”, Review o
of Twelve Exper
ornia case study
.” The Energy Jo
gy Study
ed
n and
model
o
tly
arily
ies a
our
ues.
poses
sign
ting
e the
ent
the
h
nal of
of
iments
y," The
ournal.
Model Development
Final Evaluation for San Diego Gas & Electric's Plug‐in Electric Vehicle TOU Pricing and Technology Study
49
The model used one‐hour interval data that measures EV charging usage. The data was aggregated such
that dependent variables are the monthly average shares of on‐peak, off‐peak, and super off‐peak,
weekday EV charging. Therefore, the shares represent each pricing period’s fraction of the total
monthly expenditure on energy consumed for EV charging. Share models were used as a way of
normalizing EV charging loads so that relative usage within a given pricing period could be easily
compared across customers in a panel model.
The foundation of the model is a three input generalized Leontief production function of the form:
y α x x⁄
(B-1a)
where y is output, x fori 1,2,3 are inputs (which in this is case electricity used during each price period), and α fori, j 1,2,3 are unknown parameters. This function describes how a household in
the Study produces value from its EV charging consumption at different times of day.
Given equation (B‐1a), Nexant assumed that a customer can then find the minimum cost usage
allocation to produce a given feasible amount of value for any price schedule:p fori 1,2,3. Solving this cost minimization problem,
min x p
subject to the constraint
(B-1b)
y α x x⁄
(B-1c)
results in the cost function of Aigner, Newman and Tishler (1994):
C y β p p⁄
(B-2)
With input prices p fori 1,2,3 and parameters β fori, j 1,2,3 which are unknown parameters to
be estimated.
Model Development
Final Evaluation for San Diego Gas & Electric's Plug‐in Electric Vehicle TOU Pricing and Technology Study
50
At the point where costs are minimized, the rate of change of the cost as price changes is equal to the
level of demand of that commodity. Therefore, taking the partial derivatives of the cost function with
respect to input price yields the demand for each input i:
y βp
p
⁄
1,2,3 (B-3)
The resulting share equations are:
∑
∑ β p p⁄
∑ ∑ β p p⁄ 1,2,3 (B-4)
where is the share of the th input in total electricity expenditure and is the electricity use during
the period when is in effect. Note that in the denominator of (B‐4), the k and j indices each go from 1
to 3. Dividing the top and the bottom of equation (B‐4) by demonstrates that the share equations are
dependent only on the price ratios ⁄ , for 1,2,3. Taking the derivative of the demand (B‐3) with
respect to the prices, the own‐price and cross‐price elasticities then respectively become:
lnln
∗12
β
∑ β p ⁄ p ⁄ 1 1,2,3 (B-5a)
and
lnln
∗12
β p ⁄ p ⁄
∑ β p ⁄ p ⁄ (B-5b)
B.2 Estimation
Classical additive disturbances are added to the model for each of the share equations (B‐4), which
result in equations (B‐8) below. Aggregated one‐hour data was used to estimate the monthly
expenditure share equations (B‐4) subject to the constraints (B‐6), (B‐7a) and (B‐7b). Since the shares
must add up to one, the equation for the super off peak period is deleted ( 1 ). The
remaining share equations from (B‐5), subject to the constraints (B‐6), (B‐7a) and (B‐7b) were then
estimated using nonlinear seemingly unrelated regressions (SUR).
This results in the system:
∑ β p p⁄
∑ ∑ β p p⁄ 1,2
(B-8)

Model Development
Final Evaluation for San Diego Gas & Electric's Plug‐in Electric Vehicle TOU Pricing and Technology Study
51
where
β β Wβ for i, j 1,2,3 (B-9a)
β β , 3,3 (B-9b)
and
β12
β , 3,3 (B-9c)
The estimation of the SUR model was done in STATA, using the nlsur function, which fits a system of
nonlinear equations by feasible generalized nonlinear least squares (FGNLS). FGNLS was used because
the error variance matrix is unknown, but can be estimated in the first stage of the estimation (see (B‐
11) below). This procedure corrects for the autocorrelation that is likely to exist in the observations for
each individual owner.
The NLSUR model takes into account the notion that the errors between two nonlinear regression
equations can be correlated. If these errors are correlated, the SUR model can improve the efficiency of
the estimation. In the case of the share equations derived above, this relationship should be clear, as
the total shares: peak, off‐peak and super off‐peak, must add up to one. Therefore, overestimating one
share should result in an underestimation of one or more of the other shares.
Using matrix notation, the FGNLS estimator for N observations is , such that:
≡ , ′ ,′
(B-10)
Where , is the vector of functions , for 1,2given in (A‐6) for the jth
observation.

Model Development
Final Evaluation for San Diego Gas & Electric's Plug‐in Electric Vehicle TOU Pricing and Technology Study
52
The FGNLS estimation procedure is essentially a two stage process. In the first step the NLS regression
was run assuming in (B‐10). This provided a consistent estimate of ,
which was then used to estimate as follows:
1 ′ (B-11)
where
, (B-12)
was then plugged into (B‐10) for which gives a new and final estimate of , .
Table B‐1 presents the estimates of the β coefficients in the model for non‐PV owners. Separate models
were estimated for weekdays and weekends, and the table shows sets of parameters for each. The
reason for this separate weekday and weekend modeling is a household’s decisions about charging
might be expected to be quite different on weekends than on weekdays. The parameter estimates in
the table all have quite low standard errors and fairly small confidence intervals. The parameters for the
weekday model are quite similar to the parameters for the weekend model, but two of them (β13 and
β33) are different at an 90% confidence level, which is more than what would be expected due to
random variation alone even if there were no systematic differences in customer behavior on weekends.
This is not surprising given the results shown in Tables 5‐3 and 5‐4, which indicate that average charging
patterns are quite similar between weekends and weekdays. Recall, these parameters are estimated
pieces of the cost function, they are not elasticity estimates. However, with these estimates Nexant can
derive the own‐price elasticities and cross‐price elasticities for each period.

Model Development
Final Evaluation for San Diego Gas & Electric's Plug‐in Electric Vehicle TOU Pricing and Technology Study
53
Table B‐1: Model Coefficient Estimates
Weekend/ Weekday Parameter Coefficient Std. Err. 95% Confidence Interval
Weekday
β11 0.007** 0.002 0.003 0.010
β12 ‐0.019** 0.003 ‐0.025 ‐0.013
β13 0.066** 0.004 0.058 0.075
β22 0.007 0.007 ‐0.007 0.021
β23 0.087** 0.007 0.074 0.100
β33 0.217** 0.011 0.196 0.238
Weekend
β11 0.003 0.002 ‐0.002 0.008
β12 ‐0.015** 0.003 ‐0.022 ‐0.009
β13 0.084** 0.005 0.074 0.095
β22 0.006 0.008 ‐0.010 0.022
β23 0.083** 0.007 0.069 0.098
β33 0.187** 0.012 0.164 0.210
Significance Codes: *=5%, **=1%
Linking EV
Append
This sectio
2011, SDG
knowledg
Approxim
were not
activities.
Vision Crit
usage dat
reminder
There we
responses
to EV cha
linked to w
below tha
results of
Figure C‐1
to their se
correspon
at home.
while at h
that they
51 See “Inte
V Charging Be
Linkidix C
on presents f
G&E invited p
ge, behavior a
mately 476 par
sent invitatio
Participants
tical. A uniqu
ta. Follow‐up
.
re 205 custom
s to the surve
rging and wh
whole‐house
at further exa
the survey, in
1 shows the a
elf‐reported p
nds to the 50
According to
home in their
charge at cha
erim Report for S
ehavior to Sur
Final Eva
ng EV Cha
findings on su
participants in
and attitudes
rticipants we
ons due to the
s completed t
ue participant
p invitations w
mers who res
ey.51 Since th
ole‐house loa
load data an
amine survey
ndicating tha
average daily
percentage of
survey partic
o the interval
survey respo
arging station
San Diego Gas
rvey Respons
aluation for San D
rging Beha
urvey respons
n the rate exp
related to EV
re sent mail o
eir stated des
he survey by
t code was us
were sent app
ponded to th
at analysis to
ad data. Out
d 102 can be
results in ligh
t survey resp
load profiles
f home charg
cipants who r
data, particip
onses have gre
ns away from
& Electric's Elec
es
iego Gas & Electri
avior to Su
ses associated
periment to p
V use and cha
or email invita
sire to opt‐ou
following a U
sed to link a p
proximately o
he survey and
ook place, how
of the 205 su
linked to EV
ht of this new
onses are con
for three gro
ging activity.
eported enga
pants who ind
eater average
home in thei
ctric Vehicle Pilo
c's Plug‐in Electric
54
urvey Resp
d with EV cha
articipate in a
rging.
ations. Appro
ut of SDG&E r
URL link to a s
participant’s s
one week afte
d the interim r
wever, survey
urvey particip
charging dat
w link. These a
nsistent with
oups of custom
For example,
aging in 95% o
dicate that th
e daily usage
ir survey resp
ot” prepared fo
c Vehicle TOU Pric
4
ponses
arging behavio
a survey of cu
oximately 12
elated survey
survey websit
survey respon
er the initial in
report extens
y responses c
pants, 156 of t
a. A few ana
analyses corr
metered loa
mers, divided
the red line
or more of th
hey do most o
than particip
ponses.
r SDG&E by The
ing and Technolog
or. In Novem
ustomer
1 participants
y or marketin
te hosted by
nses with the
nvitation, as a
sively docume
can now be lin
them can be
lyses are prov
roborate the
d data.
d according
in the graph
heir charging
of their chargi
pants who ind
e FSC Group.
gy Study
mber
s
g
eir
a
ented
nked
vided
while
ing
dicate

Linking EV Charging Behavior to Survey Responses
Final Evaluation for San Diego Gas & Electric's Plug‐in Electric Vehicle TOU Pricing and Technology Study
55
Figure C‐1: Average Survey Participant Load Profiles by Reported Percent of Charging Activity at Home
Table C‐1 shows average demand categorized by the percentage of home charging activity and TOU
period. The basic pattern shown in Figure C‐1 arises here as well. Customers with lower proportions of
at‐home charging have lower levels of off‐peak and peak charging as well as super off‐peak charging.
Table C‐1: Average Survey Participant TOU Period Demand (kW) by Percent of Charging Activity at Home
TOU Period 95% or more 90% or less 80% or less
Super Off Peak 1.42 1.06 0.80
Off Peak 0.08 0.05 0.05
Peak 0.08 0.04 0.03
One of the survey questions asked participants to indicate if they use the charging timer on their EV.
The customers who used the timer were asked the start and end times during which they set the timer.
The interval data of the 89 survey participants who indicated that they used the timer was examined to
determine if most of their charging activity took place during the time period set by the participants.
Based on EV charging data, these respondents engage in 86% of their total charging during the time
periods they indicated on the survey, indicating both that these respondents responded accurately and
that they do the vast majority of their charging with the timer.
Another survey question asked participants how often they used the Nissan LEAF for driving to work or
school, short trips around town, vacations, long trips, business or work use. Participants were
categorized into two groups – those who stated they use the LEAF more than once per week and those
0
0.5
1
1.5
2
2.5
0 3 6 9 12 15 18 21
kW
Hour Starting
95% or more (n=50) 90% or less (n=16) 80% or less (n=10)
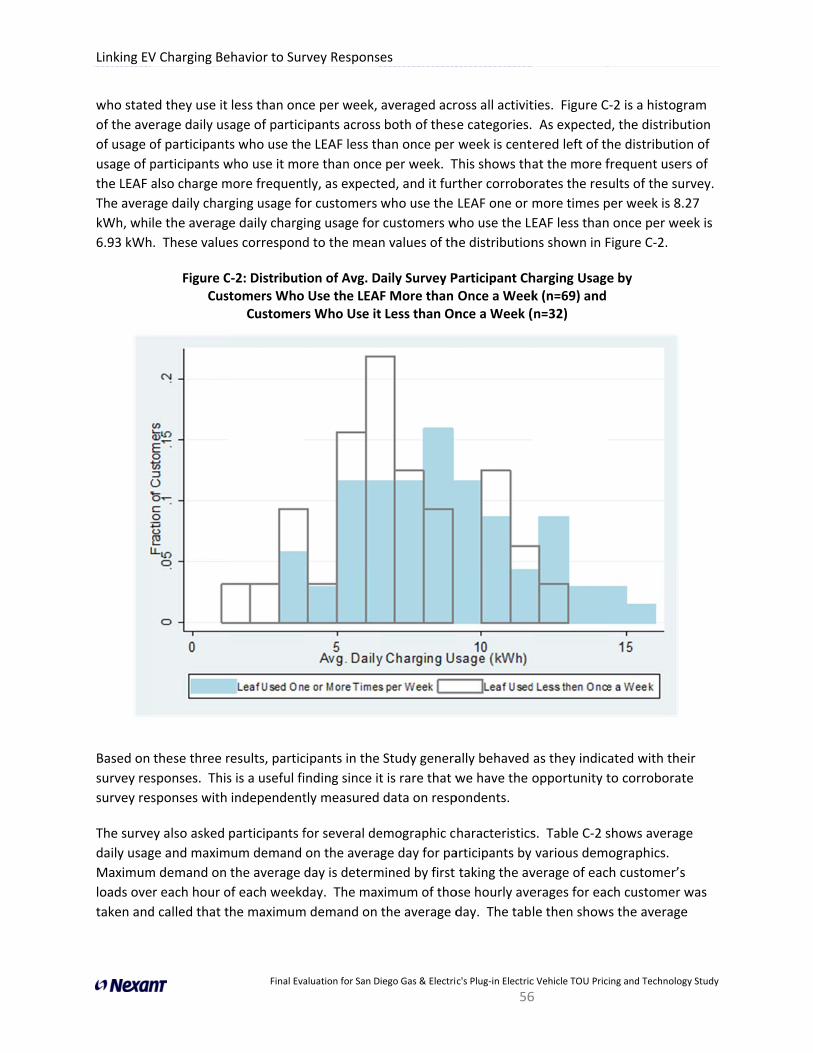
Linking EV
who state
of the ave
of usage o
usage of p
the LEAF a
The avera
kWh, whi
6.93 kWh
Based on
survey res
survey res
The surve
daily usag
Maximum
loads ove
taken and
V Charging Be
ed they use it
erage daily us
of participant
participants w
also charge m
age daily char
le the averag
. These value
Figure CCus
these three r
sponses. This
sponses with
ey also asked
ge and maxim
m demand on
r each hour o
d called that t
ehavior to Sur
Final Eva
less than onc
sage of partic
ts who use th
who use it mo
more frequent
rging usage fo
e daily chargi
es correspond
C‐2: Distributistomers Who
Customer
results, partic
s is a useful fi
independent
participants f
mum demand
the average
of each weekd
the maximum
rvey Respons
aluation for San D
ce per week,
ipants across
e LEAF less th
ore than once
tly, as expect
or customers
ing usage for
d to the mean
ion of Avg. D Use the LEArs Who Use it
cipants in the
inding since it
tly measured
for several de
on the avera
day is determ
day. The max
m demand on
es
iego Gas & Electri
averaged acr
both of thes
han once per
e per week. T
ed, and it fur
who use the
customers w
n values of th
aily Survey PF More than t Less than On
Study genera
t is rare that w
data on resp
emographic c
ge day for pa
mined by first
ximum of tho
the average d
c's Plug‐in Electric
56
ross all activit
e categories.
week is cent
This shows tha
rther corrobo
LEAF one or m
who use the LE
he distribution
Participant ChOnce a Weeknce a Week (
ally behaved
we have the o
pondents.
haracteristics
articipants by
taking the av
ose hourly ave
day. The tab
c Vehicle TOU Pric
6
ties. Figure C
As expected
ered left of th
at the more f
orates the res
more times p
EAF less than
ns shown in F
harging Usagek (n=69) and (n=32)
as they indica
opportunity t
s. Table C‐2 s
various dem
verage of eac
erages for eac
le then show
ing and Technolog
‐2 is a histogr
d, the distribu
he distributio
frequent user
ults of the su
per week is 8.
n once per we
Figure C‐2.
e by
ated with the
to corroborat
shows averag
ographics.
h customer’s
ch customer w
s the average
gy Study
ram
ution
on of
rs of
rvey.
27
eek is
eir
te
ge
s
was
e

Linking EV Charging Behavior to Survey Responses
Final Evaluation for San Diego Gas & Electric's Plug‐in Electric Vehicle TOU Pricing and Technology Study
57
value of those maximums across customers within each category. The metric is meant to reflect a
customer’s typical maximum usage on a weekday.
Although there are some differences in daily usage and maximum demand across different
demographics, no strong trends emerge. For example, respondents aged 35‐44 have higher daily
average usage than those aged 25‐34, but they also have higher usage than those aged 45‐54, showing
that there is no strong relationship between age and usage. Similar points hold for income and
education levels.
Table C‐2: Usage by Demographic Characteristics from Survey Participant Load Profiles
Demographic Characteristic Avg. Daily
Usage (kWh)
Maximum Demand on the Average Day (kW)
Number of
Customers
Gender
Male 7.89 2.20 78
Female 8.89 2.34 19
Decline to State 9.18 2.38 1
Age
25 – 34 7.21 1.92 5
35 – 44 9.47 2.39 24
45 – 54 8.29 2.32 32
55 – 64 6.88 2.06 26
65 or Older 7.67 2.12 10
Decline to State 9.18 2.38 1
Education
High School 8.41 2.37 1
Some College 7.95 2.08 5
Graduated College 8.10 2.23 43
Graduate School 8.08 2.24 48
Decline to State 9.18 2.38 1
Income (1,000 $'s)
Less than 50 10.00 3.04 1
50 – 75 9.14 2.23 4
75 – 100 7.69 2.04 8
100 – 125 7.80 2.15 8
125 – 150 8.39 2.39 15
150 – 175 8.12 2.38 13

Linking EV Charging Behavior to Survey Responses
Final Evaluation for San Diego Gas & Electric's Plug‐in Electric Vehicle TOU Pricing and Technology Study
58
Demographic Characteristic Avg. Daily
Usage (kWh)
Maximum Demand on the Average Day (kW)
Number of
Customers
175 – 200 9.46 2.32 3
More than 200 8.46 2.35 19
Decline to State 7.50 2.02 27
In addition to overall usage, it is of interest whether any demographic groups show a propensity for
super off‐peak charging. To address this, Tables C‐3 through C‐5 illustrate the average customer’s share
of super off‐peak usage relative to total usage across different demographic categories. Although there
is some variation across demographic groups, no strong patterns emerge.
Table C‐3: Usage Ratios by Age from Survey Participant Load Profiles
Age Ratio of Avg. Hourly Super Off‐peak Usage to Avg. Hourly Usage
Percent of Customers Number of Customers
EPEV‐L EPEV‐M EPEV‐H
25 – 34 0.66 20 60 20 5
35 – 44 0.70 21 42 38 24
45 – 54 0.72 19 38 44 32
55 – 64 0.66 27 31 42 26
65 or Older 0.69 20 30 50 10
Decline to State 0.70 0 100 0 1
Table C‐4: Usage Ratios by Education from Survey Participant Load Profiles
Education Ratio of Avg. Hourly Super Off‐peak Usage to Avg. Hourly Usage
Percent of Customers Number of Customers
EPEV‐L EPEV‐M EPEV‐H
High School 0.73 0 100 0 1
Some College 0.65 40 20 40 5
Graduated College
0.69 23 33 44 43
Graduate School
0.70 19 42 40 48
Decline to State 0.70 0 100 0 1

Linking EV Charging Behavior to Survey Responses
Final Evaluation for San Diego Gas & Electric's Plug‐in Electric Vehicle TOU Pricing and Technology Study
59
Table C‐5: Usage Ratios by Income from Survey Participant Load Profiles
Income Ratio of Avg. Hourly Super Off‐peak Usage to Avg. Hourly Usage
Percent of Customers Number of Customers
EPEV‐L EPEV‐M EPEV‐H
Less than 50 0.86 0 0 100 1
50 ‐ 75 0.68 25 50 25 4
75 ‐ 100 0.63 38 38 25 8
100 ‐ 125 0.70 0 50 50 8
125 ‐ 150 0.67 20 47 33 15
150 ‐ 175 0.78 31 23 46 13
175 ‐ 200 0.67 0 67 33 3
More than 200 0.71 11 42 47 19
Decline to State 0.66 30 30 41 27
These demographic analyses of charging demand show that demand characteristics are relatively
constant across a wide range of incomes, educations and ages. This is a useful finding because it
suggests that EV charging patterns are driven by unobservable characteristics that are not strongly
correlated with demographics. In this case, it also further corroborates the idea that the presence of the
EV charging timer, in conjunction with the TOU pricing, is sufficient to strongly influence EV charging
patterns despite major differences in customer characteristics.