final five-year review report third five-year review … · u.s. army materiel command final...
TRANSCRIPT

U.S. ARMY
MATERIEL COMMAND
FFIINNAALL
FIVE-YEAR REVIEW REPORT THIRD FIVE-YEAR REVIEW REPORT FOR
THE FORMER DEFENSE DEPOT OGDEN WEBER COUNTY, UTAH
Defense Depot, Hill, Utah (DDHU) – Ogden Site
June 2007
UU..SS.. AARRMMYY
MMAATTEERRIIEELL CCOOMMMMAANNDD
Final FIV
E-Y
EA
R R
EV
IEW
RE
POR
T
TH
IRD
FIVE
-YE
AR
RE
VIE
W R
EPO
RT
FOR
T
HE
FOR
ME
R D
EFE
NSE
DE
POT
OG
DE
N
WE
BE
R C
OU
NT
Y, U
TA
HF
June 2007

[This page intentionally left blank.]
i
Five-Year Review Report
Table of Contents
List of Acronyms ............................................................................................................ iv Executive Summary ....................................................................................................... vi Five-Year Review Summary Form ................................................................................. xi I. Introduction ...............................................................................................................1 II. Site Chronology.........................................................................................................2 III. Background ...............................................................................................................7
History .....................................................................................................................7 Physical Characteristics ..........................................................................................8 Land and Resource Use..........................................................................................9
IV. Remedial Actions....................................................................................................11
OU1 .......................................................................................................................11 OU2 .......................................................................................................................13 OU3 .......................................................................................................................17 OU4 .......................................................................................................................18 OU1 and OU4 Groundwater Treatment Systems Descriptions and Effectiveness 23
V. Progress Since the Last Five-Year Review............................................................29 VI. Five-Year Review Process ......................................................................................35
Administrative Components...................................................................................35 Community Notification and Involvement ..............................................................35 Document Review .................................................................................................36 Data Review ..........................................................................................................36 Site Inspection .......................................................................................................40 Interviews ..............................................................................................................41
VII. Technical Assessment ......................................................................................... 42
Question A: Is the remedy functioning as intended by the decision documents? 42 Question B: Are the exposure assumptions, toxicity data, cleanup levels, and remedial action objectives (RAOs) used at the time of the remedy selection still valid? ..................................................................................................................... 45
Question C: Has any other information come to light that could call into question the protectiveness of the remedy?......................................................................... 46 Technical Assessment Summary .......................................................................... 46
ii
VIII. Issues......................................................................................................................47 IX. Recommendations and Follow-up Actions..........................................................47 X. Protectiveness Statement(s).................................................................................49 XI. Next Review.............................................................................................................49 Tables
Table 1 – Chronology of Site Events ....................................................................... 2 Table 2 – Annual System Operations/O&M Costs................................................. 26 Table 3 – Actions Taken Since the Last Five-Year Review ................................... 35 Table 4 - Vinyl Chloride Concentration Trends and Averages............................... 40 Table 5 – Changes in Chemical-Specific Standards.............................................. 42 Table 6 – Changes in Action-Specific Requirements............................................. 42 Table 7 – Changes in Location-Specific Requirements ......................................... 42 Table 8 – Issues .................................................................................................... 47 Table 9 – Recommendations and Follow-up Actions............................................. 48
Attachments Site Maps, Groundwater Elevation Contour Maps and Vinyl Chloride Contour Maps List of Documents Reviewed
Tables of Groundwater Sample Analytical Results and Time vs. Concentration Graphs Documenting Remedy Performance
Interview Report Site Inspection Checklist Photos Documenting Site Conditions SWMUs and other Sites ARARs for OU1, OU2 and OU4 Quitclaim Deed Former DDOU July 2000 Appendix Comments received from Support Agencies
iii

List of Acronyms ARARs Applicable or Relevant and Appropriate Requirements bgs below ground surface BRAC Base Realignment and Closure CERCLA Comprehensive Environmental Response, Compensation and Liability Act COC Chemical of Concern CSS Contaminant Screening Site cy cubic yard(s) DLA Defense Logistic Agency DCE cis 1,2-Dichloroethene DDHU Defense Distribution Depot Hill Utah DDOU Defense Depot Ogden Utah DNAPL Dense Non-Aqueous Phase Liquid EPA Environmental Protection Agency ESD Explanation of Significant Difference FFA Federal Facility Agreement FOST Finding of Suitability to Transfer FUDS Formerly Used Defense Site gpm gallons per minute IRB Iron-Related Bacteria MCL Maximum Contaminant Level MDL Method Detection Limit mg/kg milligrams per kilogram NAID National Association of Installation Developers NCP National Contingency Plan NPL National Priorities List NOT Non-Operational Test O&M Operation and Maintenance OLRA Ogden Local Redevelopment Authority OU Operable Unit PCBs Polychlorinated Biphenyls PCE Tetrachloroethene PQL Practical Quantitation Limit RI/FS Remedial Investigation/Feasibility Study ROD Record of Decision SHMP Sodium hexametaphosphate TCE Trichloroethene TPH Total Petroleum Hydrocarbons UDEQ Utah Department of Environmental Quality USACE US Army Corps of Engineers VC Vinyl Chloride VOCs Volatile Organic Compounds µg/L micrograms per liter
iv

[This page intentionally left blank.]
v
Executive Summary The U.S. Army Corps of Engineers has conducted the Third Five-Year Review of the Defense Distribution Depot Hill Ogden. The purpose of this Five-Year Review is to determine whether the remedial actions implemented at the site are protective of human health and the environment. This Five-Year Review is required because hazardous chemicals remain on site at concentrations above levels specified by the Records of Decision, thereby preventing unlimited use and unrestricted exposure. There are currently two Operable Units (OU1 and OU4/OU4 Hotspot) with groundwater being remediated for vinyl chloride, the main contaminant of concern. The remedial actions at OU1 and OU4 include excavation of contaminated soils, remediation of contaminated groundwater treatment by pump-and-treat and institutional controls. OU2, OU3 and other SWMUs and sites have been closed. The trigger for this five-year review was the completion of Second Five-Year Review Report for the Former Defense Depot Ogden dated March 2001. This five-year review found that the remedies had been constructed and implemented in accordance with the applicable Records of Decision (ROD), Record of Decision Amendment and an Explanation of Significant Difference. USACE concluded from a data evaluation in 2005 that the optimized OU1 pump-and-treat system probably will not meet the Remedial Action Objects (the Maximum Contaminant Levels (MCL) for vinyl chloride) because it had operated for over 11 years and contaminant levels had stabilized by 1999. Therefore, the USACE recommended that other remedial options be explored. In 2003 a chemical oxidant was injected into the contaminated aquifer at several sites along or near the Plain City Canal which was backfilled with waste materials from a disposal/burn pit at OU4 (but later excavated and backfilled with clean material). The injection did not provide any obvious decrease in contaminant levels in groundwater. Therefore, in May 2005, the USACE began conducting a non-operational test (NOT) of the system, with regulatory approval, to determine if the system is actually required to prevent plume migration. If the plume remains relatively stable, then an alternative remedial measures study may be conducted to determine a more practical and cost-effective remedial alternative, such as Monitored Natural Attenuation. Seven quarters of groundwater monitoring since plant shutdown indicate that the vinyl chloride plume remains relatively stable and is not migrating down gradient. Concentrations of vinyl chloride continue to fluctuate just above or below the MCL at seven wells, causing the area of attainment to form three to four small isolated plumes with a total area of about 2 to 7 acres since 1999. The largest area is defined by the June quarterly samples when groundwater levels are high. Based on a preliminary evaluation of the data, the Seventh Quarter NOT monitoring report recommended focused annual groundwater monitoring of the plume for VOCs and natural attenuation parameters to commence in June 2008. OU2 comprised two areas of soil contaminated with pesticides, and two former fire-training burn pits which were the source of a volatile organic compound (TCE)
vi

groundwater plume. A total of 245 tons of soil contaminated with chlordane and bromacil was excavated in four stages between 1991 and 1994. An abbreviated risk assessment showed that the remaining, widespread bromacil contamination that is slightly above the 1 mg/kg ROD cleanup standard posed minimal endangerment to the public. An Explanation of Significant Difference for the OU2 ROD to allow leaving the remaining bromacil contamination in place was accepted by the US EPA in August 1994. A groundwater pump-and-treat system removed about 3.7 pounds of TCE and 10.2 pounds of DCE between 1992 and 1998, when it was shut down to study potential alternative remedial measures. In 2000, 3,850 cubic yards (cy) of non-contaminated soil and 2,575 cy of soil contaminated with hydrocarbons (TPH) and VOCs were excavated down to 3 to 9 feet below the water table at the two former burn pits, and 6,000 gallons of soybean vegetable oil was then injected into the floor of the excavation. Just down gradient of the burn pit excavation, 9,765 gallons of soybean oil were injected to form a bioreactive wall across the shallow aquifer. All eight quarters of groundwater monitoring down gradient of the bioreactive wall between 2000 and 2002 showed concentrations of TCE less than the MCL of 5 micrograms/liter (µg/L). All cleanup goals for contaminated soil and groundwater at OU2 were achieved and a Remedial Action Report was submitted to Regulators in June 2002. The OU2 pump-and-treat system was removed in 2002. DDHU Ogden was the first Federal facility in the nation to receive a RCRA Part B closeout permit for a groundwater treatment system because of the closure of OU2. The remedy at OU2 is protective of human health and the environment because remedial measures were implemented that resulted in all remedial action objectives being met. OU3 consisted of Burial Sites 1, 3-A, 3-B and 3-C where riot control agent, white smoke containers, chemical warfare agent identification kits, rubber boots, halozone water purification tables and other wastes were disposed of. The soil contamination part of OU3 was closed after a total of 940 cy of contaminated soil were excavated from two of the Burial Sites between 1993 and 1995. VOC-contaminated groundwater is being remediated as part of OU1. The OU4 groundwater treatment system is operating as designed. However, it appears that the system is not cost-effective because it has not achieved the Remedial Action Objectives (Maximum Contaminant Levels) even though it has been operating for 12 years, or more than twice the minimum time frame specified by the ROD (5 years). For this reason, a Remedial Action Alternative Investigation/Feasibility Study (RAAI/FS) is being conducted to evaluate Remedial Action Alternatives that would provide a more cost-effective and timely means of meeting the RAOs. The northern part of the OU4 wellfield was temporarily shutdown to attain static groundwater levels for the investigation. The field investigation in the main contaminant source area was completed in April 2006. The April 2006 investigation discovered a few inches of separate-phase oil floating on the groundwater table and significant residual soil contamination above, at and below the groundwater table in the source area which was partly excavated in 1995.
vii
Absorbent socks were installed in the 4 wells with the thickest free product on September 9, 2006. By September 20, 2006 rudimentary measurements indicated that no more than 4.4 gal of free product had been recovered with the socks, and new socks did not recover any additional free product. Extraction in the northern part of the wellfield was re-started in December 2006. Monitoring of 8 wells in the main source area up until March 2007 indicated that after start up of the north wellfield, floating free product thickness decreased to sheens in all but one well. In addition to the removal of product by the socks, remaining free product was apparently smeared out in the vadose zone as the water table dropped due to groundwater extraction. The USACE concluded that removing the remaining floating free product was not feasible. The OU4 Hotspot extraction trench prevents the OU4/OU4 Hotspot contaminant plume from migrating offsite to the west. The OU4 Hotspot treatment system of ozonation/hydrogen peroxide was bypassed in September 2003 because the total concentration of volatile organic compounds (VOCs) in the influent were much less than the standard required by the permit to discharge the effluent to the sanitary sewer system. It appears that the several µg/L of vinyl chloride flowing into the extraction trench are being removed in the trench by oxidation or volatilization. Unexcavated and unremediated VOC soil contamination remains beneath two large, active warehouses (Buildings 15C and 16C) just upgradient of the extraction trench and appears to act as a continuing source of low-level groundwater contamination. The potential pathway between this contamination and warehouse workers is incomplete as long as the warehouse concrete slab floors remain intact and impervious to vapor intrusion. In addition to the OUs, nine areas at DDHU Ogden that may have been contaminated by petroleum products, PCBs and pesticides were investigated as Contamination Screening Sites (CCSs), and these areas were remediated as necessary and closed. Twenty-three Solid Waste Management Units (SWMUs) were investigated, and where warranted, remediated pursuant to the Resource Conservation and Recover Act (RCRA) Part-B Permit. In addition, 38 Base Realignment and Closure (BRAC) sites where contaminant releases occurred or may have occurred were investigated and remediated as necessary. All BRAC sites were closed by 2002. The remedies at OU2, OU3, the CSSs, SWMUs and BRAC sites have been, and continue to protective of human health and the environment in the long term. The remedies at OU1 and OU4/OU4 Hotspot are considered protective of human health and the environment in the short-term. Institutional controls are preventing exposure. In addition, pump-and-treat system operations contain the groundwater contamination and prevent it from migrating offsite. However, in order to meet the long term remedial action objectives at OU1 and OU4 the following actions are recommended:
• Complete the final (eighth) Quarter of the OU1 NOT and fully evaluate the test results, then confer with UDEQ and EPA on which remedial action alternative should be implemented to achieve closure;
• At OU4, implement and monitor the chemical oxidant injection bench and pilot-
viii

ix
scale studies recommended by the RAAI/FS to determine if a full-scale installation(s) of the alternative(s) should replace or supplement the pump-and-treat system;
• Determine if additional remedial measures are warranted at former OU4 Hotspot disposal/burn pit to reduce time that extraction trench must operate to meet remedial action objectives; and
• Ensure by regular inspection that proper signs are posted on inside and outside walls of the warehouse Buildings 15C and 16C, that no disturbance of the soil beneath the foundations of Buildings is permitted without written approval and that the concrete slab floor remains intact and impervious to vapors.
Long-term protectiveness of the remedial actions will be verified by continuing semi-annual monitoring of the OU4 plume and beginning in June 2008, annual monitoring of the OU1 plume.

[This page intentionally left blank.]
x
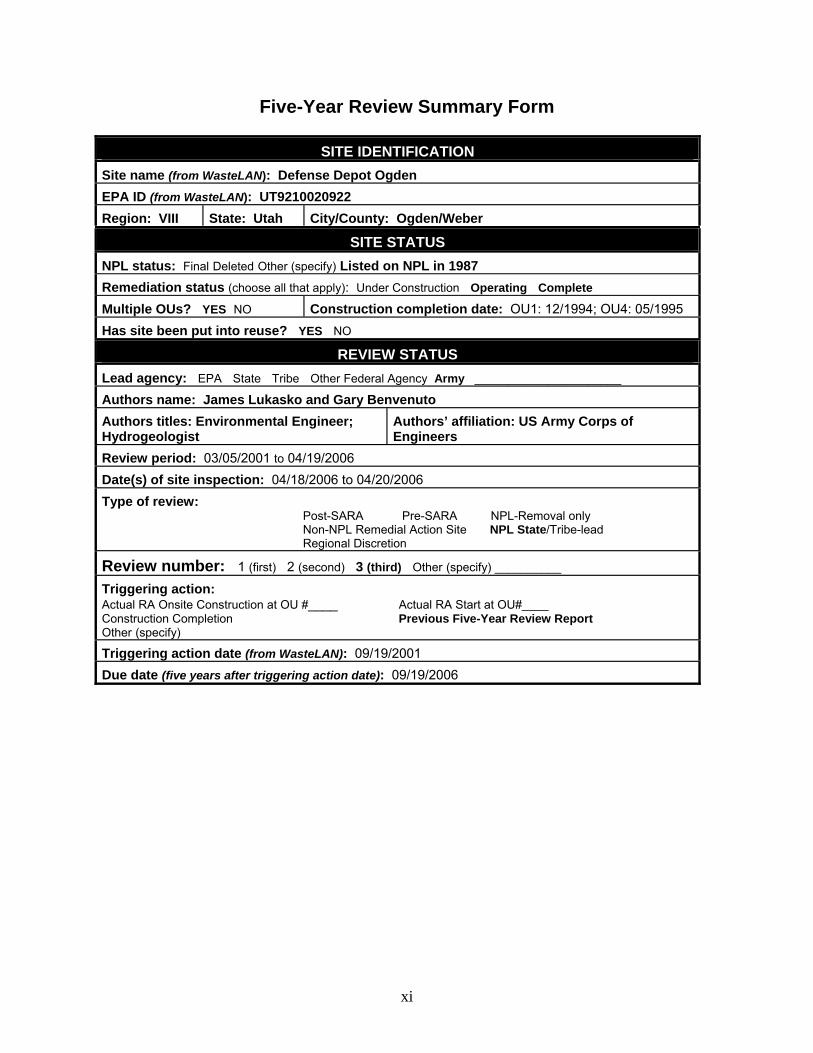
Five-Year Review Summary Form
SITE IDENTIFICATION
Site name (from WasteLAN): Defense Depot Ogden EPA ID (from WasteLAN): UT9210020922 Region: VIII State: Utah City/County: Ogden/Weber
SITE STATUS
NPL status: Final Deleted Other (specify) Listed on NPL in 1987 Remediation status (choose all that apply): Under Construction Operating Complete Multiple OUs? YES NO Construction completion date: OU1: 12/1994; OU4: 05/1995 Has site been put into reuse? YES NO
REVIEW STATUS
Lead agency: EPA State Tribe Other Federal Agency Army ______________________ Authors name: James Lukasko and Gary Benvenuto Authors titles: Environmental Engineer; Hydrogeologist
Authors’ affiliation: US Army Corps of Engineers
Review period: 03/05/2001 to 04/19/2006 Date(s) of site inspection: 04/18/2006 to 04/20/2006 Type of review:
Post-SARA Pre-SARA NPL-Removal only Non-NPL Remedial Action Site NPL State/Tribe-lead Regional Discretion
Review number: 1 (first) 2 (second) 3 (third) Other (specify) __________
Triggering action: Actual RA Onsite Construction at OU #____ Actual RA Start at OU#____ Construction Completion Previous Five-Year Review Report Other (specify) Triggering action date (from WasteLAN): 09/19/2001 Due date (five years after triggering action date): 09/19/2006
xi
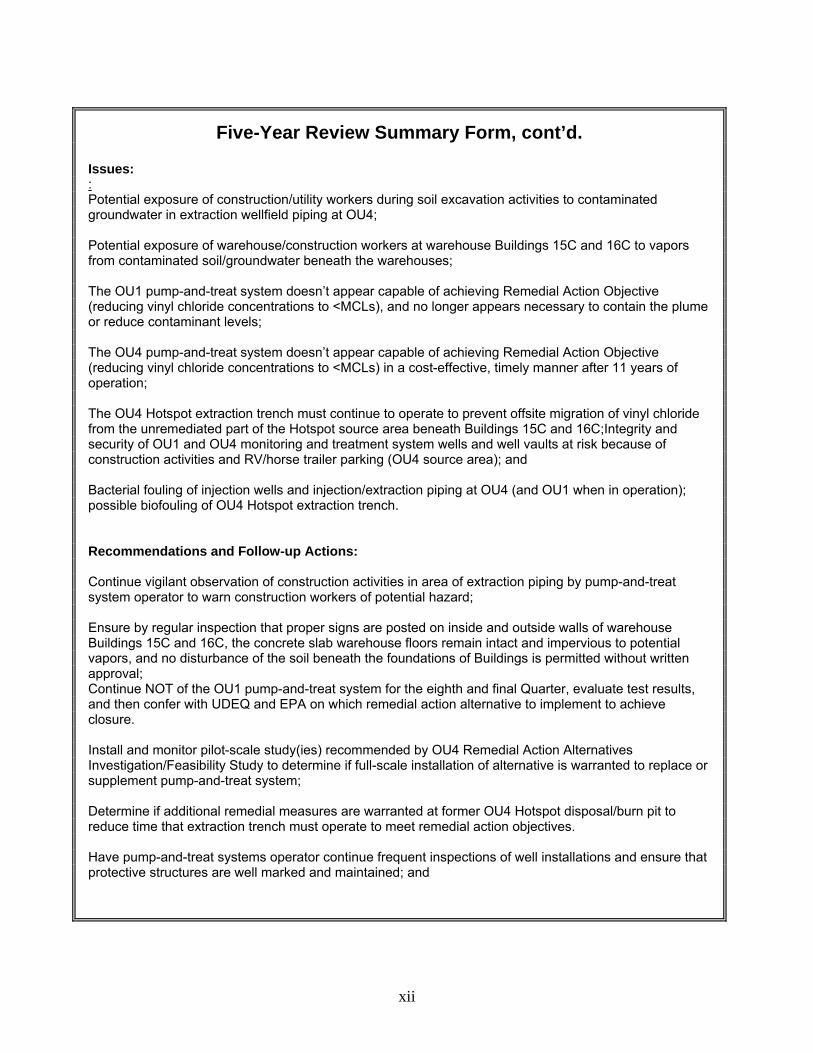
Five-Year Review Summary Form, cont’d. Issues: : Potential exposure of construction/utility workers during soil excavation activities to contaminated groundwater in extraction wellfield piping at OU4;
Potential exposure of warehouse/construction workers at warehouse Buildings 15C and 16C to vapors from contaminated soil/groundwater beneath the warehouses; The OU1 pump-and-treat system doesn’t appear capable of achieving Remedial Action Objective (reducing vinyl chloride concentrations to <MCLs), and no longer appears necessary to contain the plume or reduce contaminant levels; The OU4 pump-and-treat system doesn’t appear capable of achieving Remedial Action Objective (reducing vinyl chloride concentrations to <MCLs) in a cost-effective, timely manner after 11 years of operation; The OU4 Hotspot extraction trench must continue to operate to prevent offsite migration of vinyl chloride from the unremediated part of the Hotspot source area beneath Buildings 15C and 16C;Integrity and security of OU1 and OU4 monitoring and treatment system wells and well vaults at risk because of construction activities and RV/horse trailer parking (OU4 source area); and Bacterial fouling of injection wells and injection/extraction piping at OU4 (and OU1 when in operation); possible biofouling of OU4 Hotspot extraction trench. Recommendations and Follow-up Actions: Continue vigilant observation of construction activities in area of extraction piping by pump-and-treat system operator to warn construction workers of potential hazard; Ensure by regular inspection that proper signs are posted on inside and outside walls of warehouse Buildings 15C and 16C, the concrete slab warehouse floors remain intact and impervious to potential vapors, and no disturbance of the soil beneath the foundations of Buildings is permitted without written approval; Continue NOT of the OU1 pump-and-treat system for the eighth and final Quarter, evaluate test results, and then confer with UDEQ and EPA on which remedial action alternative to implement to achieve closure. Install and monitor pilot-scale study(ies) recommended by OU4 Remedial Action Alternatives Investigation/Feasibility Study to determine if full-scale installation of alternative is warranted to replace or supplement pump-and-treat system; Determine if additional remedial measures are warranted at former OU4 Hotspot disposal/burn pit to reduce time that extraction trench must operate to meet remedial action objectives. Have pump-and-treat systems operator continue frequent inspections of well installations and ensure that protective structures are well marked and maintained; and
xii
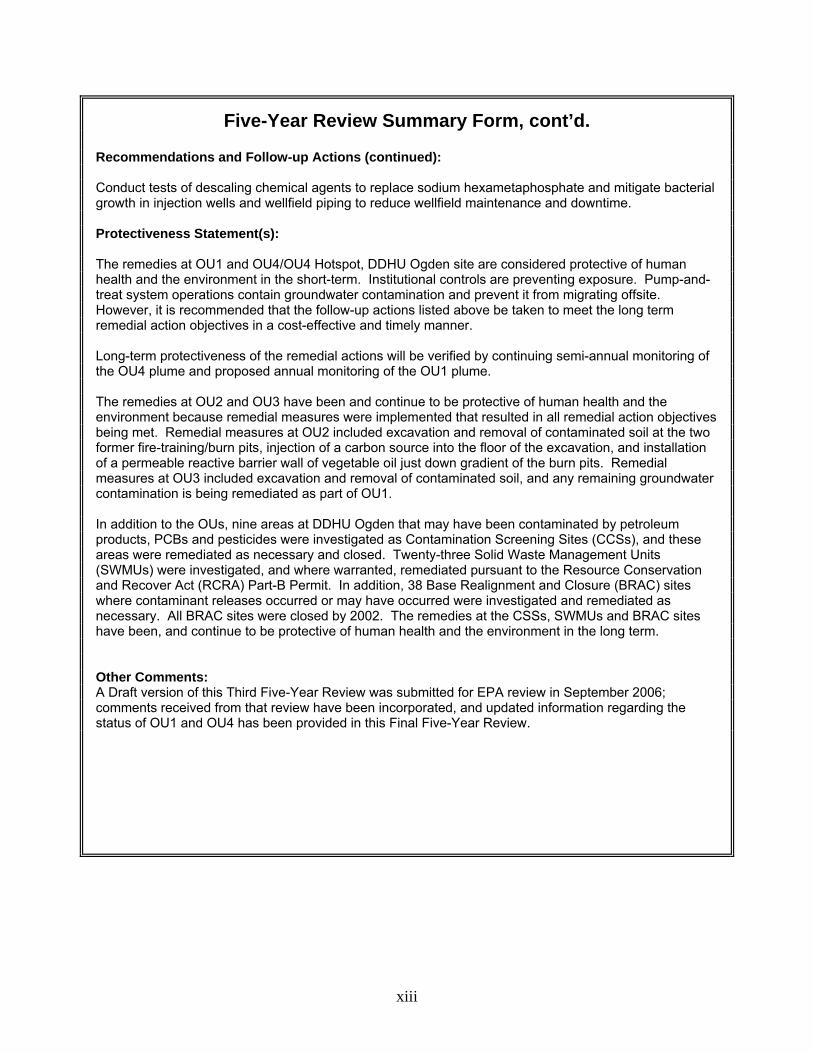
Five-Year Review Summary Form, cont’d. Recommendations and Follow-up Actions (continued): Conduct tests of descaling chemical agents to replace sodium hexametaphosphate and mitigate bacterial growth in injection wells and wellfield piping to reduce wellfield maintenance and downtime. Protectiveness Statement(s): The remedies at OU1 and OU4/OU4 Hotspot, DDHU Ogden site are considered protective of human health and the environment in the short-term. Institutional controls are preventing exposure. Pump-and-treat system operations contain groundwater contamination and prevent it from migrating offsite. However, it is recommended that the follow-up actions listed above be taken to meet the long term remedial action objectives in a cost-effective and timely manner. Long-term protectiveness of the remedial actions will be verified by continuing semi-annual monitoring of the OU4 plume and proposed annual monitoring of the OU1 plume. The remedies at OU2 and OU3 have been and continue to be protective of human health and the environment because remedial measures were implemented that resulted in all remedial action objectives being met. Remedial measures at OU2 included excavation and removal of contaminated soil at the two former fire-training/burn pits, injection of a carbon source into the floor of the excavation, and installation of a permeable reactive barrier wall of vegetable oil just down gradient of the burn pits. Remedial measures at OU3 included excavation and removal of contaminated soil, and any remaining groundwater contamination is being remediated as part of OU1. In addition to the OUs, nine areas at DDHU Ogden that may have been contaminated by petroleum products, PCBs and pesticides were investigated as Contamination Screening Sites (CCSs), and these areas were remediated as necessary and closed. Twenty-three Solid Waste Management Units (SWMUs) were investigated, and where warranted, remediated pursuant to the Resource Conservation and Recover Act (RCRA) Part-B Permit. In addition, 38 Base Realignment and Closure (BRAC) sites where contaminant releases occurred or may have occurred were investigated and remediated as necessary. All BRAC sites were closed by 2002. The remedies at the CSSs, SWMUs and BRAC sites have been, and continue to be protective of human health and the environment in the long term. Other Comments: A Draft version of this Third Five-Year Review was submitted for EPA review in September 2006; comments received from that review have been incorporated, and updated information regarding the status of OU1 and OU4 has been provided in this Final Five-Year Review.
xiii
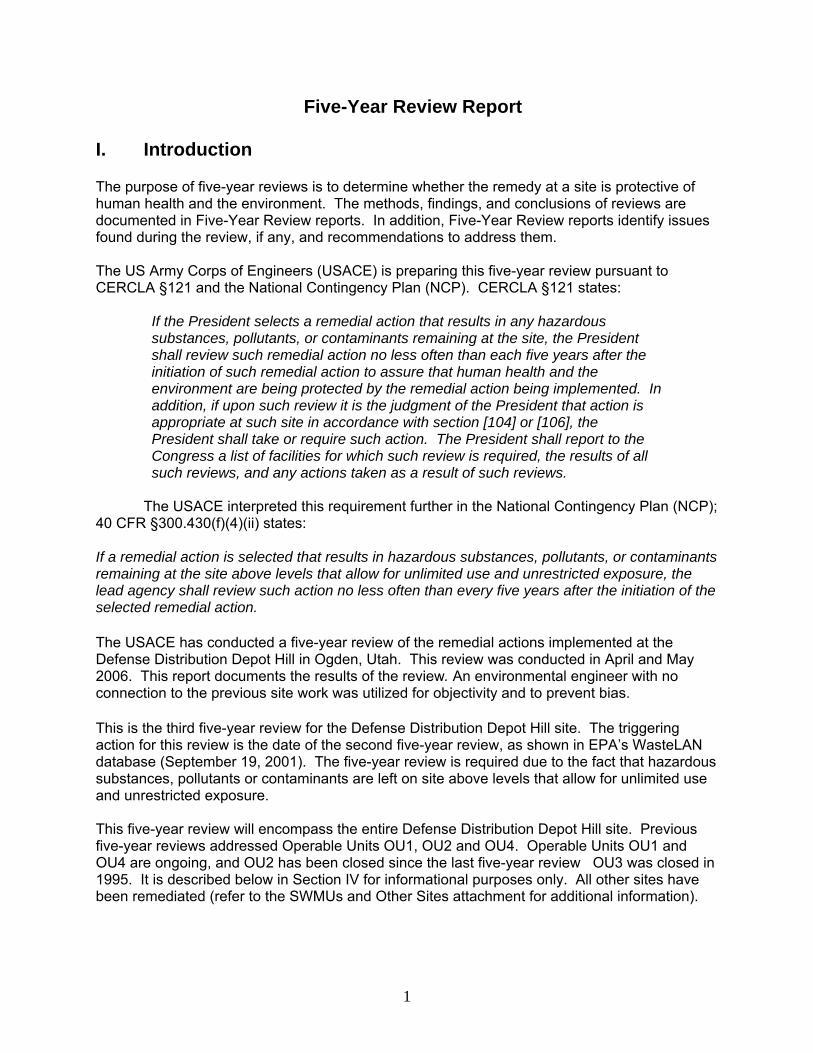
Five-Year Review Report I. Introduction The purpose of five-year reviews is to determine whether the remedy at a site is protective of human health and the environment. The methods, findings, and conclusions of reviews are documented in Five-Year Review reports. In addition, Five-Year Review reports identify issues found during the review, if any, and recommendations to address them. The US Army Corps of Engineers (USACE) is preparing this five-year review pursuant to CERCLA §121 and the National Contingency Plan (NCP). CERCLA §121 states:
If the President selects a remedial action that results in any hazardous substances, pollutants, or contaminants remaining at the site, the President shall review such remedial action no less often than each five years after the initiation of such remedial action to assure that human health and the environment are being protected by the remedial action being implemented. In addition, if upon such review it is the judgment of the President that action is appropriate at such site in accordance with section [104] or [106], the President shall take or require such action. The President shall report to the Congress a list of facilities for which such review is required, the results of all such reviews, and any actions taken as a result of such reviews.
The USACE interpreted this requirement further in the National Contingency Plan (NCP); 40 CFR §300.430(f)(4)(ii) states: If a remedial action is selected that results in hazardous substances, pollutants, or contaminants remaining at the site above levels that allow for unlimited use and unrestricted exposure, the lead agency shall review such action no less often than every five years after the initiation of the selected remedial action. The USACE has conducted a five-year review of the remedial actions implemented at the Defense Distribution Depot Hill in Ogden, Utah. This review was conducted in April and May 2006. This report documents the results of the review. An environmental engineer with no connection to the previous site work was utilized for objectivity and to prevent bias. This is the third five-year review for the Defense Distribution Depot Hill site. The triggering action for this review is the date of the second five-year review, as shown in EPA’s WasteLAN database (September 19, 2001). The five-year review is required due to the fact that hazardous substances, pollutants or contaminants are left on site above levels that allow for unlimited use and unrestricted exposure. This five-year review will encompass the entire Defense Distribution Depot Hill site. Previous five-year reviews addressed Operable Units OU1, OU2 and OU4. Operable Units OU1 and OU4 are ongoing, and OU2 has been closed since the last five-year review OU3 was closed in 1995. It is described below in Section IV for informational purposes only. All other sites have been remediated (refer to the SWMUs and Other Sites attachment for additional information).
1
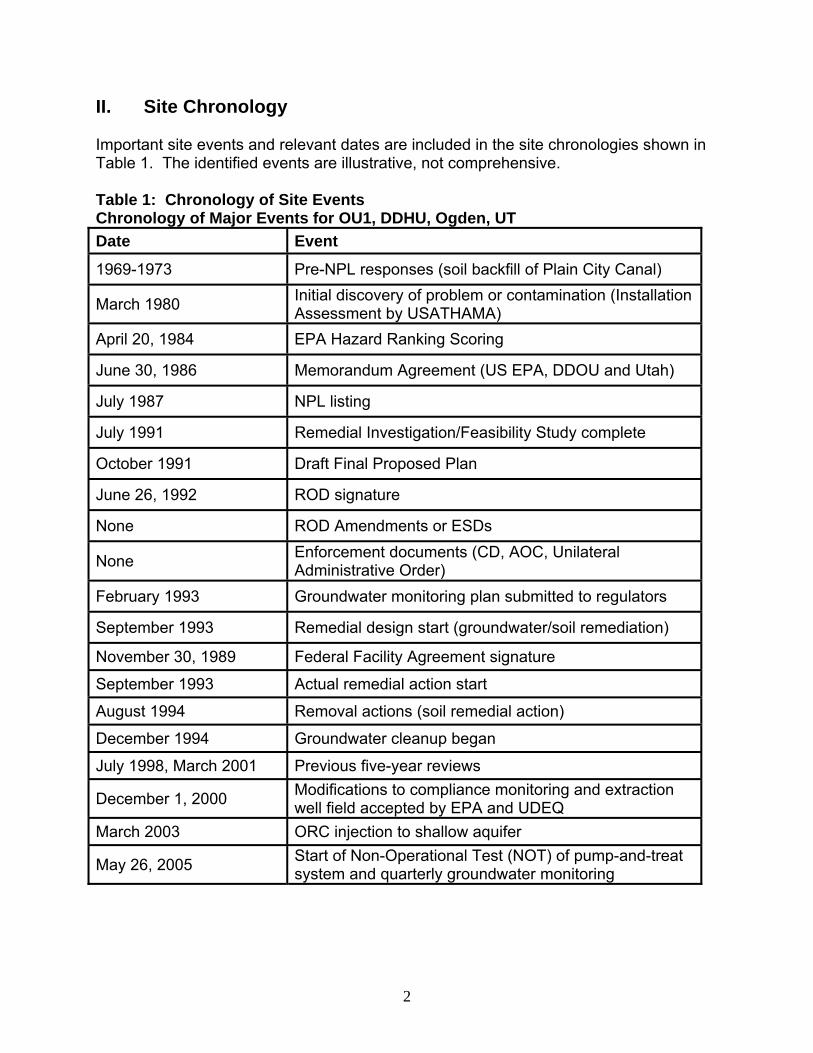
II. Site Chronology Important site events and relevant dates are included in the site chronologies shown in Table 1. The identified events are illustrative, not comprehensive. Table 1: Chronology of Site Events Chronology of Major Events for OU1, DDHU, Ogden, UT Date Event
1969-1973 Pre-NPL responses (soil backfill of Plain City Canal) Initial discovery of problem or contamination (Installation Assessment by USATHAMA) March 1980
April 20, 1984 EPA Hazard Ranking Scoring
June 30, 1986 Memorandum Agreement (US EPA, DDOU and Utah)
July 1987 NPL listing
July 1991 Remedial Investigation/Feasibility Study complete
October 1991 Draft Final Proposed Plan
June 26, 1992 ROD signature
None ROD Amendments or ESDs Enforcement documents (CD, AOC, Unilateral Administrative Order) None
February 1993 Groundwater monitoring plan submitted to regulators
September 1993 Remedial design start (groundwater/soil remediation)
November 30, 1989 Federal Facility Agreement signature
September 1993 Actual remedial action start
August 1994 Removal actions (soil remedial action)
December 1994 Groundwater cleanup began
July 1998, March 2001 Previous five-year reviews Modifications to compliance monitoring and extraction well field accepted by EPA and UDEQ December 1, 2000
March 2003 ORC injection to shallow aquifer Start of Non-Operational Test (NOT) of pump-and-treat system and quarterly groundwater monitoring May 26, 2005
2
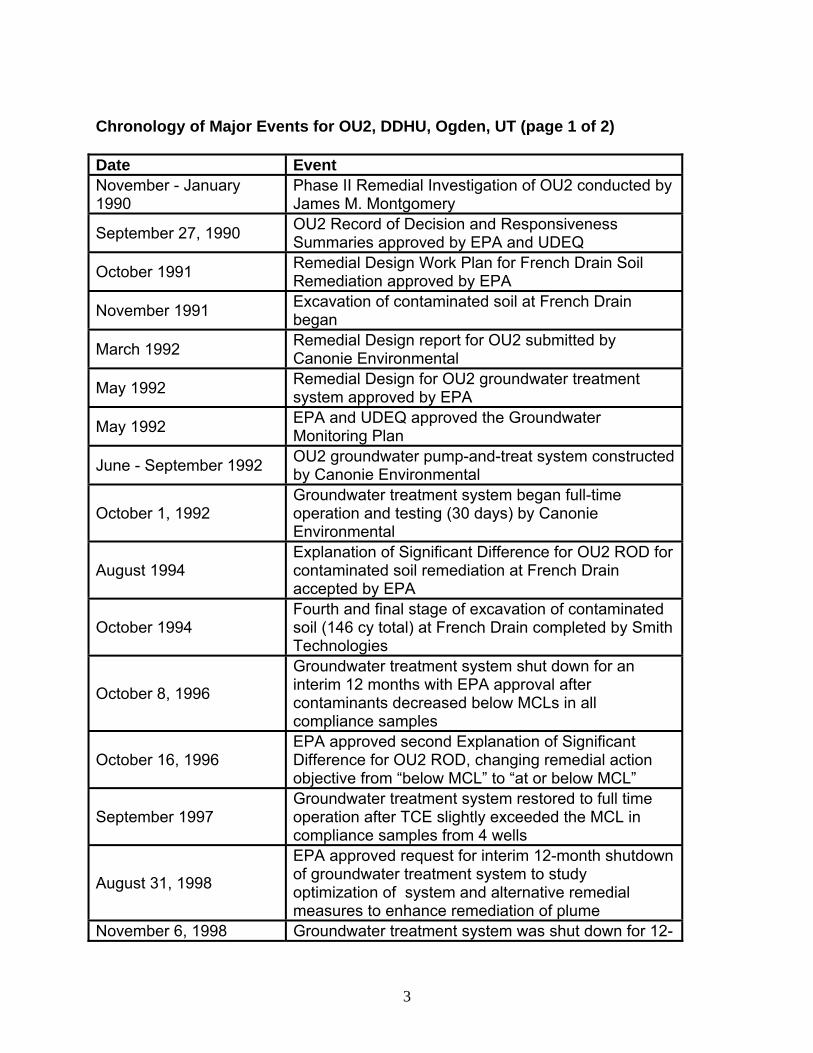
Chronology of Major Events for OU2, DDHU, Ogden, UT (page 1 of 2) Date Event November - January 1990
Phase II Remedial Investigation of OU2 conducted by James M. Montgomery OU2 Record of Decision and Responsiveness Summaries approved by EPA and UDEQ September 27, 1990
Remedial Design Work Plan for French Drain Soil Remediation approved by EPA October 1991
Excavation of contaminated soil at French Drain began November 1991
Remedial Design report for OU2 submitted by Canonie Environmental March 1992
Remedial Design for OU2 groundwater treatment system approved by EPA May 1992
EPA and UDEQ approved the Groundwater Monitoring Plan May 1992
OU2 groundwater pump-and-treat system constructed by Canonie Environmental June - September 1992
Groundwater treatment system began full-time operation and testing (30 days) by Canonie Environmental
October 1, 1992
Explanation of Significant Difference for OU2 ROD for contaminated soil remediation at French Drain accepted by EPA
August 1994
Fourth and final stage of excavation of contaminated soil (146 cy total) at French Drain completed by Smith Technologies
October 1994
Groundwater treatment system shut down for an interim 12 months with EPA approval after contaminants decreased below MCLs in all compliance samples
October 8, 1996
EPA approved second Explanation of Significant Difference for OU2 ROD, changing remedial action objective from “below MCL” to “at or below MCL”
October 16, 1996
Groundwater treatment system restored to full time operation after TCE slightly exceeded the MCL in compliance samples from 4 wells
September 1997
EPA approved request for interim 12-month shutdown of groundwater treatment system to study optimization of system and alternative remedial measures to enhance remediation of plume
August 31, 1998
November 6, 1998 Groundwater treatment system was shut down for 12-
3
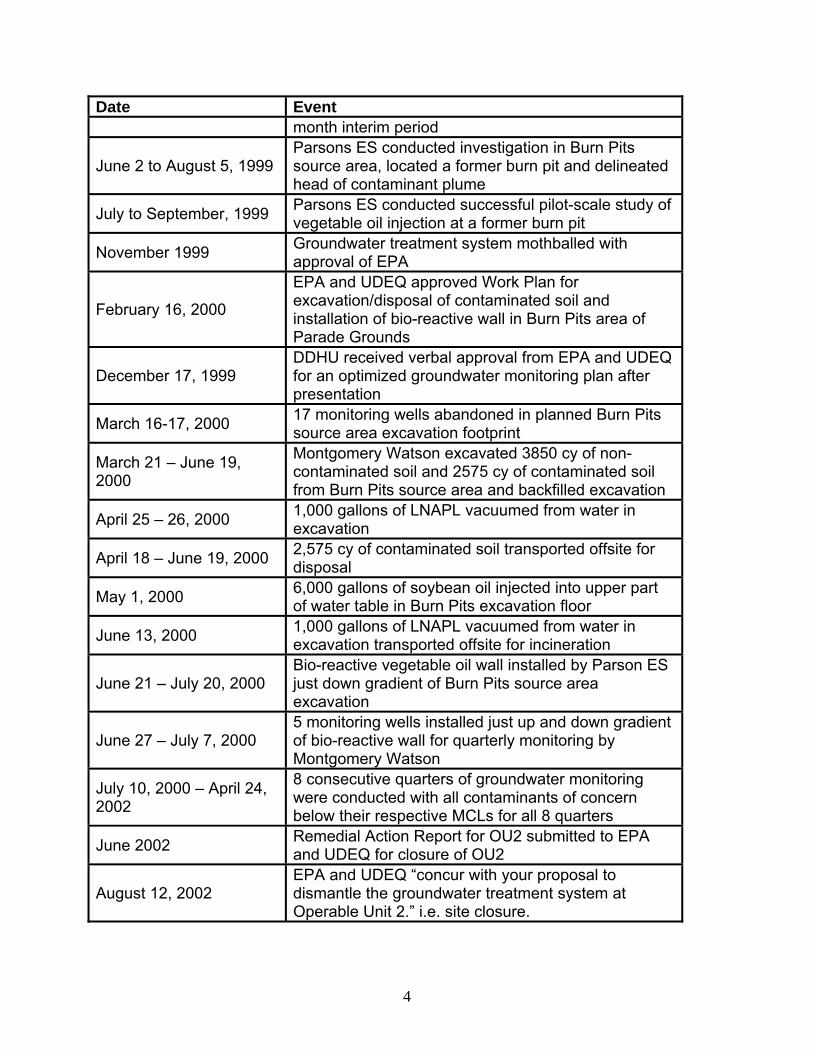
Date Event month interim period Parsons ES conducted investigation in Burn Pits source area, located a former burn pit and delineated head of contaminant plume
June 2 to August 5, 1999
Parsons ES conducted successful pilot-scale study of vegetable oil injection at a former burn pit July to September, 1999
Groundwater treatment system mothballed with approval of EPA November 1999
EPA and UDEQ approved Work Plan for excavation/disposal of contaminated soil and installation of bio-reactive wall in Burn Pits area of Parade Grounds
February 16, 2000
DDHU received verbal approval from EPA and UDEQ for an optimized groundwater monitoring plan after presentation
December 17, 1999
17 monitoring wells abandoned in planned Burn Pits source area excavation footprint March 16-17, 2000
Montgomery Watson excavated 3850 cy of non-contaminated soil and 2575 cy of contaminated soil from Burn Pits source area and backfilled excavation
March 21 – June 19, 2000
1,000 gallons of LNAPL vacuumed from water in excavation April 25 – 26, 2000
2,575 cy of contaminated soil transported offsite for disposal April 18 – June 19, 2000
6,000 gallons of soybean oil injected into upper part of water table in Burn Pits excavation floor May 1, 2000
1,000 gallons of LNAPL vacuumed from water in excavation transported offsite for incineration June 13, 2000
Bio-reactive vegetable oil wall installed by Parson ES just down gradient of Burn Pits source area excavation
June 21 – July 20, 2000
5 monitoring wells installed just up and down gradient of bio-reactive wall for quarterly monitoring by Montgomery Watson
June 27 – July 7, 2000
8 consecutive quarters of groundwater monitoring were conducted with all contaminants of concern below their respective MCLs for all 8 quarters
July 10, 2000 – April 24, 2002
Remedial Action Report for OU2 submitted to EPA and UDEQ for closure of OU2 June 2002
August 12, 2002 EPA and UDEQ “concur with your proposal to dismantle the groundwater treatment system at Operable Unit 2.” i.e. site closure.
4
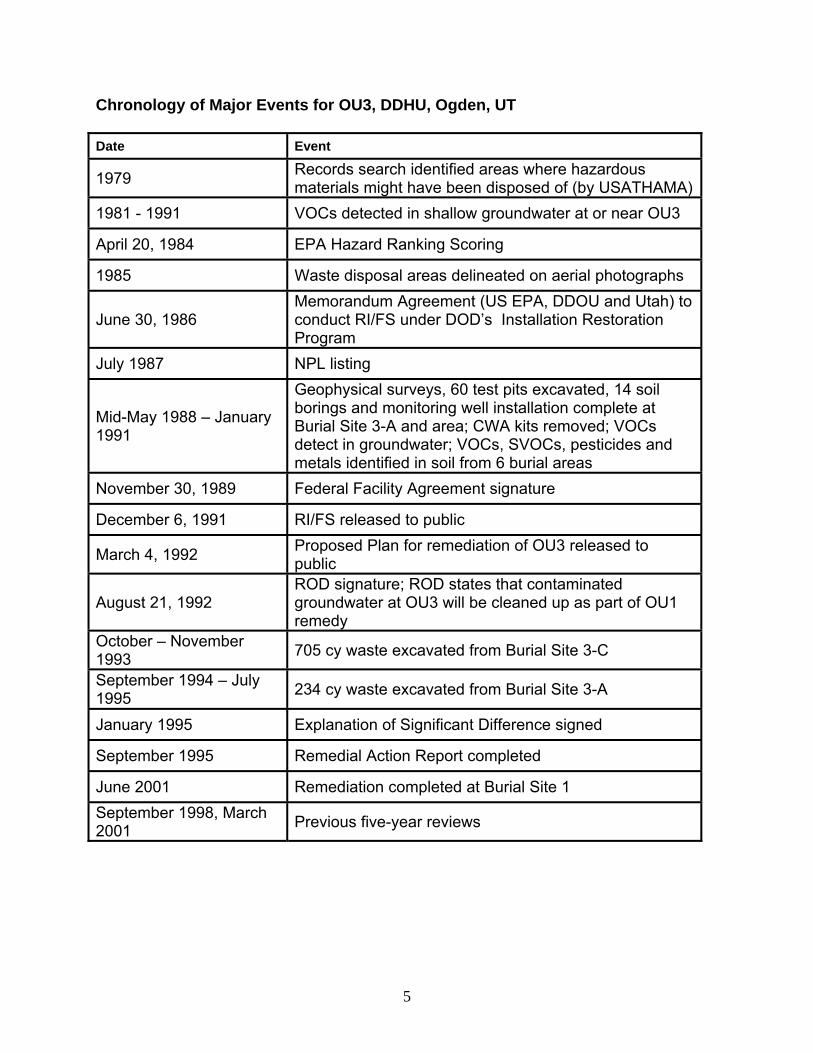
Chronology of Major Events for OU3, DDHU, Ogden, UT Date Event
Records search identified areas where hazardous materials might have been disposed of (by USATHAMA)1979
1981 - 1991 VOCs detected in shallow groundwater at or near OU3
April 20, 1984 EPA Hazard Ranking Scoring
1985 Waste disposal areas delineated on aerial photographs Memorandum Agreement (US EPA, DDOU and Utah) to conduct RI/FS under DOD’s Installation Restoration Program
June 30, 1986
July 1987 NPL listing Geophysical surveys, 60 test pits excavated, 14 soil borings and monitoring well installation complete at Burial Site 3-A and area; CWA kits removed; VOCs detect in groundwater; VOCs, SVOCs, pesticides and metals identified in soil from 6 burial areas
Mid-May 1988 – January 1991
November 30, 1989 Federal Facility Agreement signature
December 6, 1991 RI/FS released to public Proposed Plan for remediation of OU3 released to public March 4, 1992
ROD signature; ROD states that contaminated groundwater at OU3 will be cleaned up as part of OU1 remedy
August 21, 1992
October – November 1993 705 cy waste excavated from Burial Site 3-C
September 1994 – July 1995 234 cy waste excavated from Burial Site 3-A
January 1995 Explanation of Significant Difference signed
September 1995 Remedial Action Report completed
June 2001 Remediation completed at Burial Site 1 September 1998, March 2001 Previous five-year reviews
5

Chronology of Major Events for OU4, DDHU, Ogden, UT Date Event
Initial discovery of problem or contamination (Installation Assessment by USATHAMA) March 1980
1981 Monitoring wells detect VOCs
April 20, 1984 EPA Hazard Ranking Scoring
June 30, 1986 Memorandum Agreement (US EPA, DDOU and Utah)
1985-1986 Hydrogeology and waste disposal area investigation
July 1987 NPL listing
November 30, 1989 Federal Facility Agreement signature
September 1991 Remedial Investigation/Feasibility Study complete
December 1991 Draft Final Proposed Plan
September 28, 1992 ROD signature Enforcement documents (CD, AOC, Unilateral Administrative Order) None
May 1993 Groundwater monitoring plan submitted to regulators
October 1993 Remedial design start
October 1993 Actual remedial action start
June 1995 Soil remedial action complete
July 1995 Groundwater clean up began
June 2000 ROD amended to include OU4 Hotspot remediation
March 20, 2003 EPA and UDEQ approve optimization plan for wellfield
Not applicable Final Close-out Report
Not applicable Deletion from NPL September 1998, March 2001 Previous five-year reviews
6
III. Background History The Defense Distribution Depot Hill, Utah (DDHU) – Ogden Site (Ogden site) is located 40 miles north of Salt Lake City, Utah, along the original right-of-way of the Central Pacific Railroad in the northern reaches of the City of Ogden, Weber County. The 1,100-acre Ogden site was originally purchased from the City of Ogden in 1940 and activated on September 15, 1941 under the name Utah General Depot. It was occupied by the Quartermaster Corps, Chemical Warfare Service, medical Corps, the U.S. Army Corps of Engineers (USACE) and the Signal Corps. In 1964, the facility was renamed the Defense Distribution Depot Ogden, Utah (DDOU). The facility served primarily as a supply depot until it closed in 1997. In July 1987, DDOU was listed on the Environmental Protection Agency’s (EPA) National Priorities List, which brought DDOU under the Federal Facilities provisions of Section 120 of the Comprehensive Environmental Response, Compensation and Liability Act (CERCLA). In 1989, DDOU, EPA and Utah Department of Environmental Quality (UDEQ) signed a Federal Facility Agreement to address the procedural framework and schedule for environmental restoration of the installation. In 1995, the DDOU installation was listed for Base Realignment and Closure (BRAC), and subsequently was closed in 1997. Continuing operations at the installation, now referred to as DDHU – Ogden Site, was transferred from the control of the Defense Logistic Agency (DLA) to the Army Materiel Command (AMC) on October 1, 2003. As a supply depot, DDOU’s mission included the receipt, storage, maintenance, inventory and issue of centrally managed, non-ordnance items to military installations and other Federal agencies. DDOU formerly occupied 1,128 acres and had 155 buildings used for covered storage, administration, vehicle maintenance and family housing. Items processed and stored at the facility included food, clothing, textiles, packaged petroleum, industrial/commercial chemicals including DDT, pressurized gases, and general medical, industrial construction and electronic supplies. Other items that may have been stored at DDOU in the past include one-ton containers of mustard gas and U.S. military chemical warfare agent identification kits. Until the late 1970s, liquid and solid materials were disposed of at DDOU. Oily liquid materials and combustible solvents were incinerated in onsite burning pits, and solid materials were burned and buried onsite or taken offsite for disposal. Six contaminated disposal areas were identified and divided into four operable units (OU1 through OU4), defined as discrete parts of a remedial action that can function independently as a unit and contribute to preventing or minimizing a release or threat of release. Groundwater sampling at the Ogden site identified volatile organic compounds (VOCs), including trichloroethene (TCE), vinyl chloride (VC) and cis-1,2-dichloroethylene (DCE) in a shallow aquifer. Three primary groundwater contaminant plumes were delineated and included with OU1, OU2 and OU4. Baseline quantitative human health and qualitative ecological risk assessments were completed for soil and groundwater contamination at OU1, OU2, OU3 and OU4 as part of the RI/FS for each OU. The results of the human
7
health risk assessments, including the base risk, hazard quotient, clean-up levels and clean-up risk/hazard quotient for each of the COCs in soil and groundwater are summarized in the soil and groundwater remediation criteria tables appended to the RODs for the OUs. These tables are attached. The RI/FSs and RODs for the OUs state that “no significant environmental threats appear to be associated” with the OUs. Final Record of Decision and Responsiveness Summaries (RODs) were submitted by DDHU for each of the OUs and approved by the UDEQ and the EPA. The ROD and Explanation of Significant Difference (ESD) dates are as follows: OU1: June 26, 1992; OU2: September 27, 1990 (ESDs prepared in September 1994 and October 1996); OU3: August 21, 1992 (ESD signed in January 1995); and OU4: September 28, 1992, and OU4 Amendment: June 2000. Physical Characteristics The facility is located in a topographically flat area within the Great Salt Lake Valley of the Lake Bonneville Basin. Surface elevations at the depot vary from 4,292 feet above mean sea level at the northern boundary to 4,247 above mean sea level at the southwestern boundary. The Ogden site is drained by Mill and Four-Mile Creeks, which traverse it from east to west. Much of Four-Mile Creek is encased in pipe where it flows across the Ogden site. Both creeks are diverted into irrigation ditches west of the Ogden site, which then feed into the Weber River three miles west of the Ogden site. The Ogden site is underlain by unconsolidated lacustrine and alluvial deposits of Quaternary and Recent age. The principle groundwater resources in the area are part of the East Shore Area hydrogeologic division. The main aquifers in the East Shore Area are the Sunset and Delta aquifers, which are confined and lie at depths of between 200 to 400 feet and 500 to 700 feet below ground surface (bgs), respectively. Groundwater below the facility is found at shallow depths of 5 to 13 feet bgs, generally in an unconfined to semi-confined aquifer of clayey silty sandy gravel with relatively low yields of water of naturally poor quality based on average values for total dissolved solids. The shallow aquifer in the area of the Ogden site is classified by the State of Utah as a Class II aquifer, which is a potential future source of drinking water. Recharge to the shallow aquifer is principally by seepage from the Weber River, canals, small streams, and infiltration of precipitation and excess irrigation water. Groundwater levels are generally highest in June and July, presumably due to infiltration from full irrigation canals and irrigation, and lowest in January and February. The overall hydraulic gradient (generally less than 0.003) and inferred groundwater flow directions, to the northwest in the southern portions, and to the southwest in the northern portions of the Ogden site, tend to remain more or less unchanged from high to low groundwater level seasons. The shallow, unconfined aquifer is underlain at a depth of about 20-30 feet bgs by a silty clay aquitard with a thickness of 50 to 100 feet. A deeper confined aquifer was located
8
at 125 feet bgs in the northern part of the Ogden site. It exhibits artesian conditions. Thus, there is a relatively strong upward component of the hydraulic gradient between the deeper confined aquifer and the shallow aquifer. This indicates that it is unlikely that dissolved contaminants in the shallow aquifer would migrate to the deeper confined aquifer. Land and Resource Use All of the previous functions of the facility have been relocated. The remaining Federal uses comprise a major Internal Revenue Service Operations facility and a U.S. Army Reserves enclave. Reuse of portions of the former Depot began in late 1997. Some of the old warehouses are now leased by the City of Ogden for activities including light manufacturing, warehousing, medical-laser manufacturing, rail manufacturing, medical storage and food supplement production. All of the former Depot land area and buildings have been transferred by land deed back to the City of Ogden, the original owner. In 1998 and January 1999, two Finding of Suitability to Transfer (FOST) documents were developed and approved by the State of Utah, the EPA and the Department of the Army. The FOSTs allowed the transfer of 544 acres of uncontaminated property to the Ogden Local Redevelopment Authority. The development of additional FOSTs was completed in August 2003. The Department of Defense retains responsibility for all remediation activities required as a result of past military activities on the installation. The former Depot has been renamed the Business Depot Ogden. It is undergoing rapid large-scale redevelopment by the Boyer Company, the Master Lessor and Developer. Redevelopment includes the installation of new buried utilities, road realignments and improvements, and construction of large warehouses and office/commercial buildings, as well as landscaping and other improvements. A number of the old wooden Depot warehouses have been torn down, but there are still quite a few of the brick warehouses that have been rehabilitated and are in use. There is about 6.5 million square feet of industrial and office space at the Business Depot. DDHU Ogden been recognized for its successful redevelopment. The Business Depot Ogden was awarded the prestigious Facility of the Year Award by the National Association of Installation Developers (NAID) in August, 2002. This award recognizes facilities that make outstanding achievements in revitalizing Base Realignment and Closure (BRAC) communities. There have been no changes in land use or expected land use, or in exposure routes or receptors on or near the site since the RODs were signed.
9
Institutional Controls: The Quitclaim Deed between the US Secretary of the Army and Ogden City for the former depot, dated July 24, 2000 (for FOST 2) includes a number of land use restrictions, requirements and conditions that relate to remedial action activities, including the following:
1. The Army maintains the right to: a. Access the property for to conduct and oversee any investigations of air,
water, sediments and soils, response action, remedial action, removal action or corrective action as defined under CERCLA to protect human health and the environment;
b. Install, operate, maintain and/or remove groundwater monitoring, extraction and treatment systems and perform monitoring of groundwater.
2. The Army will remove contaminated groundwater treatment systems and properly abandon wells and wellfield piping.
3. The City of Ogden shall not access, modify or otherwise tamper with, disrupt, inflict damage, obstruct or impede any groundwater monitoring, extraction and/or treatment systems and equipment.
4. The City of Ogden and all successors and assigns shall not conduct nor allow its agents to conduct any disturbance of the groundwater underlying specified Parcels (the area of the OUs) without prior written approval of the Army, EPA and UDEQ.
5. The City of Ogden shall not inject any materials into monitoring or treatment system wells or extract any fluids from them.
Note that the Quitclaim Deed does not include an institutional control preventing the City of Ogden from excavating soil in areas outside those of the extraction wellfield piping. Presumably this is because all soil has been remediated to cleanup levels (with the exception of soil at the OU4 Hotspot, which is restricted from disturbance in the OU4 ROD Amendment). Agreements between the Department of Defense and the City of Ogden ensure that the Ogden DDOU Reuse Plan specifies the zoning of the Business Park Ogden land as industrial/commercial. This zoning restriction is consistent with the level of cleanup goals and criteria for soil and groundwater contamination at the various contaminated subsites that have been remediated at the former Depot. The Division of Water Rights is the state agency that regulates appropriation and distribution of surface water and groundwater in the state of Utah. All waters in Utah are public property. Therefore the Quitclaim Deed does not address the issue of groundwater use at the former Depot. However, as indicated above in institutional control No.4 in the Quitclaim Deed, the City of Ogden cannot disturb groundwater in the areas of the OU plumes.
10
Land use in the area surrounding the Ogden site is a mixture of residential and commercial. The site is not located in or near an environmentally sensitive area. IV. Remedial Actions OU1 OU1 is located in the southwestern part of the Ogden site and comprises the backfill material in the southern part of the backfilled Plain City Canal and a shallow groundwater plume of VC and DCE. The ROD for OU1 outlines the following Remedial Action Objectives and requirements:
• Protection of Human Health and the Environment through the following engineering controls:
Excavation and removal of all backfilled soil and debris from the Plain City Canal to comply with the established cleanup criteria
Extraction and treatment of all groundwater until contaminant concentrations are below their MCLs in all OU1 groundwater compliance samples.
• Compliance with Applicable or Relevant and Appropriate Requirements
(ARARs).
• Chemical-specific requirements: The groundwater quality ARARs for OU1 are based on the Safe Drinking Water Act MCLs, the maximum permissible level of a contaminant in water that is delivered to any user of a public water system.
The OU1 ROD (June 1992) specified that when the groundwater contaminant concentrations had been maintained below the MCLs for one year, the pump-and-treat system will be shut down but compliance monitoring will continue until the next scheduled statutory five-year review. If the remediation goals are exceeded during the shutdown in any compliance monitoring well, groundwater treatment will recommence and this procedure will be repeated. However, if the compliance is maintained until the next scheduled statutory review, the remedy will be considered complete. The groundwater monitoring plan for OU1 (JMM 1993) specified that compliance at each monitoring well is to be based on the mean or average COC concentration over time. The OU1 ROD included an estimate of the volume of contaminated groundwater of 56 million gallons (volume of groundwater with VC concentrations ≥2 µg/L). The ROD also indicated that the groundwater restoration time frame using a pump-and-treat system was a minimum of five years after commencement of remedial work. However, the ROD also noted that “the ability of the pump-and-treat technology to achieve and maintain low contaminant levels may be limited, as evidence by experience at other
11
sites”. Annual Operation and Maintenance (O&M) costs were estimated at $146,000. The present worth cost of the soil and groundwater remediation project were estimated at $2.2 million based on a 7-year duration of treatment and monitoring. Plain City Canal Soil Contamination Plain City Canal was an irrigation canal between two branches of Mill Creek that was backfilled from 1969 to 1973 with burning-pit debris from Burial Site 4-A located near the northern facility boundary in OU4. Backfill in the Plain City Canal comprised glass, ash, charcoal, asphalt, partially burned plastic-coated electrical wire, wood, concrete, plastic and metal fragment mixed with silty sand and gravel. Pesticides, PCBs, metals, dioxins and furans were detected in the canal backfill. The canal backfill is considered as one of the sources for the VOC groundwater at OU1, even though VOCs were not detected in the backfill. The remedial design/remedial action contract for OU1 was awarded in September 1993. The remediation of the backfill materials in the part of the Plain City Canal associated with OU1 was completed in August 1994 by excavating the old backfill and backfilling the Canal with clean fill materials. A BRAC Site Investigation Report identified the entire remaining portion of the Plain City Canal as warranting additional investigation prior to transferring land ownership back to the City of Ogden. Thirteen separate areas along the Canal were identified in the Plain City Canal Remedial Investigation Report as requiring remediation. Soil remediation of the backfill materials was completed in December 1999. It included excavation and disposal of backfill from a total of 2,250 linear feet along the Canal. This additional remedial action triggered an Explanation of Significant Difference (ESD) for the OU1 ROD in July 2000. The ESD explains the significant differences between the soil remediation cleanup level, costs of the cleanup and the increased volume of soil excavated from the Plain City Canal as listed in the original ROD. OU1 Groundwater Contamination At OU1 the groundwater contamination is restricted to a shallow unconfined-to-semi-confined aquifer which consists of an up to 30-foot thick unit of silty clayey gravels, sands and sandy gravels with moderate to low permeability. The aquifer is locally overlain by several feet of clay or silts which at least partially confine it. The aquifer is underlain by an extensive silty clay aquitard; it is estimated from several boreholes to be about 50 to 100 feet thick. The clay aquitard is underlain by an artesian, confined aquifer. The water table at the southern end of the OU1 VC plume area was an average of 7.5 feet below ground surface in 2004. At the north end of the plume area it was at an average depth of 8.4 feet below ground surface. The groundwater table varies seasonally, and tends to be highest in June or July (or occasionally September) and lowest in January or December. The higher water levels in the summer months result
12
from the high water levels in nearby summer irrigation ditches. Groundwater flows northwesterly at an average hydraulic gradient of about 0.002. The most widespread VOCs detected in the groundwater of the shallow aquifer at OU1 are VC and DCE, both breakdown products of TCE, which is detected very locally near potential source areas. However, VC is the only VOC (and COC) that has ever been detected at concentrations exceeding its MCL (2 µg/L). A groundwater pump-and-treat system installed to remediate the OU1 VC plume began operation in December 1994. The system consisted of 16 extraction wells, a single air stripping tower and 16 injection wells. On December 2, 2000, regulators approved two new extraction wells and revisions to the groundwater compliance monitoring program for OU1 to optimize the recovery and monitoring of the plume. The total number of extraction wells was reduced to nine. OU2 OU2 comprised three areas of soil contamination and a groundwater plume. These areas included the following and are discussed in more detail below: French drain area, Former Pesticide Storage Building (Building 51), Former Burn Pits Parade Ground Area, and the OU2 Plume as defined by the ROD (a 14-acre area of groundwater contaminated with TCE). The Remedial Action Objectives stated in the ROD for OU2 are the same as those outlined above for OU1, with the following difference for the soil remediation. The selected remedy for OU2 protects human health and the environment through excavation and incineration of all soil containing at least 1 mg/kg of bromacil or chlordane from the French Drain. The OU2 ROD also specifies that groundwater will be treated until contaminant concentrations in all groundwater samples are below their MCLs and contaminants without MCLs pose less than one in a million excess cancer risk. After the remediation is completed, monitoring is to be conducted for at least two years on a quarterly basis, or five years after the initiation of remedial activities, whichever is later. The ROD included an estimate that groundwater extraction and treatment would last two and one-half years, with some uncertainty associated with it. The ROD estimated that the pump-and-treat system would reduce the contaminant volume of groundwater by about 50 million gallons. It also estimated the annual O&M costs of $103,000. French Drain Area The French Drain was located in the southeastern part of the Ogden site, just northwest of Building 23. The French Drain consisted of an 8.5-foot by 20-foot by 2.5 to 4-foot deep excavation backfilled with gravel. The drain was covered by a series of railroad rails spaced three inches apart and a metal grating. It was surrounded by an asphalt-
13

paved parking and storage area. Former depot employees indicated that the French Drain Area was used for mixing and loading pesticides and herbicides between the early 1970s and 1985. Empty pesticide and herbicide containers were rinsed, and the rinsate discharged into the French Drain. Ultimately, the rinsate percolated into the ground because the drain was not connected to any sewer or storm drain line. A sample of fill collected in late 1989 from less than one foot below the metal grating at the French Drain contained approximately 3,700 mg/kg bromacil and 450 mg/kg chlordane. Additional investigations indicated there was no evidence of aerially extensive pesticide/herbicide contamination in the groundwater beneath or down gradient from the French Drain. Chlordane was detected in concentrations of up to 4.6 mg/L in four of the eight groundwater samples collected from monitoring well AEHA-03, which is immediately adjacent to the French Drain. Chlordane was never detected in any other monitoring well at OU2. This appeared to confirm reports that the French Drain was used only for occasional overflow and rinsing and not for disposal of pesticides, herbicides or other contaminants. Very small concentrations of the VOCs chlorobenzene, 1,1-DCE and m,p-xylenes were detected in the 1989 shallow fill sample. A total of 245 tons (nearly 160 cy) of soil contaminated with chlordane and bromacil was excavated in four stages between November 1991 and October 1994 and shipped to 1) the Ensco facility in El Dorado, Arkansas, 2) Chemical Waste Management in Port Arthur, Texas and 3) LWD, Inc. in Calvert City, Kentucky for incineration and disposal based on waste characterization criteria. Confirmation sampling indicated concentrations of bromacil above the 1 mg/kg cleanup standard established by the ROD were widespread. An abbreviated risk assessment of the remaining soils in the French Drain area indicated the remaining concentrations of bromacil of up to 16 mg/kg posed minimal endangerment to the public, and an Explanation of Significant Difference (ESD) for the OU2 ROD was submitted by DDHU to allow leaving the remaining bromacil contamination. The ESD was accepted by the US EPA in August 1994. VOCs, including tetrachloroethene (PCE) (up to 1.3 mg/L), TCE (up to 13 mg/L) and DCE (up to 24 mg/L), were detected in groundwater samples from monitoring wells immediately surrounding and down gradient of the French Drain. However, none of the VOCs detected in the groundwater samples were detected in the 1989 shallow fill sample from the French Drain. Former Pesticide Storage Building (Building 51) The former Pesticide Storage Building (Building 51) is located 800 feet southwest of the French Drain. The building was used for storing and mixing pesticides until January 1984, when a new pesticide facility 250 feet to the northeast (Building 21) was employed for this purpose. Sixteen soil samples were collected in December 1997 from depths of 1 foot and 2.5 feet at eight sites 10 feet around Building 51. They contained concentrations of DDT that were more than an order of magnitude below the residential screening level of
14

2 mg/kg. Therefore, no additional investigation of Building 51 for pesticides was conducted. Pesticides were not detected in a groundwater sample from a monitoring well located adjacent to Building 51. Former Burn Pits, Parade Ground Area The Parade Ground is a grassy lawn area now covered by a baseball outfield. It is located 900 feet south-southeast of the former French Drain. Based on a review of DDHU records, two oil and solvent burning pits measuring approximately 6 feet by 9 feet reportedly operated from 1955 to 1965 in this area. Two small circular features were tentatively identified as the Parade Ground area Burn Pits in a 1958 aerial photograph at a location approximately 200 and 260 feet southeast of monitoring well JMM-13. The photograph indicates the entire burn pits area was 50 to 100 feet wide and 180 feet long. The centers of the two burn pits appear to have been 60 feet apart. The source of the soil contamination later identified at the burn pits appears to have been organic solvents and oil or diesel fuel that were poured into shallow pits and ignited for the purpose of fire training. The soil contamination was the only identified source of groundwater contamination in the OU2 plume, which extended down gradient (northwesterly) from the Burn Pits area. Remediation of the Former Burn Pits soil and groundwater are described below. OU2 Groundwater Plume as Defined by the ROD The OU2 groundwater plume of TCE and DCE contamination was generally delineated by six events of groundwater sampling between April 1986 and November 1991. These events included sampling 19 monitoring wells that were installed in August 1981 and between September 1988 and November 1992. The portion of the plume that contained concentrations of TCE exceeding the MCL of 5 mg/L was estimated to have an area of 11 acres and a volume of 27 million gallons. The portion of the plume with TCE concentrations exceeding the MCL extended about 1750 feet to the northwest from the burn pits and had a maximum width of 450 feet. The highest concentrations of contaminants (25 mg/L TCE and 200 mg/L DCE) were detected in December 1989, at monitoring well JMM-13, which is 225 feet northwest and down gradient of the northwesterly of the two burn pits in the source area. Remedial Actions: A groundwater treatment system for OU2 was installed between June and October 1, 1992 and tested October 1992. The system comprised 10 extraction wells, 20 gravity-fed injection wells around the perimeter of the contaminant plume, and a treatment plant where the extracted groundwater was treated by passing it through an air stripping tower. The treatment system operated from October 1, 1992 to November 6, 1998, with an interim shutdown between October 8, 1996 and September 30, 1997. The EPA approved the interim shutdown after all compliance well samples contained
15
concentrations of the contaminants of concern (TCE and DCE) below their MCLs. The system treated a total of 183,595,260 gallons of groundwater at an average operating flow rate of 72.54 gpm between October 1, 1992 and November 6, 1998. The system removed a calculated total of 3.741 pounds of TCE and 10.163 pounds of DCE. On August 31, 1998, the EPA Region VIII office approved DDHU’s request for an interim 12-month shutdown of the treatment system to study optimization of the pump-and-treat system and potential alternative remedial measures to enhance remediation of the contaminant plume and select a more efficient and cost effective remedy. After November 6, 1998, the system was turned on only to obtain extraction well water samples during the four quarterly monitoring events in 1999. In November 1999, with EPA approval, the treatment plant was mothballed such that it could be turned on with 30 days notice if significant rebound of the TCE contamination in groundwater became apparent during continued quarterly sampling. A study of the OU2 contaminant plume for evaluating alternative treatment methods was conducted in June 1999. One of the former burn pits was located and sampled in a soil boring. The head of the contaminant plume was delineated, and a 5-foot-thick oily ‘smear zone’ associated with a seasonally fluctuating water table was located. A pilot study of vegetable oil injection showed almost immediate immobilization of the dissolved contaminants followed by their enhanced degradation induced by a strongly anaerobic zone in the aquifer. Transport computer modeling of the data suggested the TCE plume would rebound from the source if source controls were not implemented. As a result, detailed plans were completed and approved for excavation/disposal of shallow soil contamination in the Burn Pits area and the installation of an injected vegetable oil bio-reactive wall. Remedial activities at the former Burn Pits were completed between March 16 and August 16, 2000. These included:
• Abandoning 17 monitoring wells; • Excavating and stockpiling 3,850 cy of non-contaminated soil; excavating 2,575
cy of contaminated soil down to 3 to 9 feet below the water table and disposing of these soils offsite;
• Vacuuming and incinerating 1,000 gallons of a LNAPL/water mixture; • Placing 6,000 gallons of soybean oil into pea gravel backfill; backfilling with the
excavated non-contaminated soil; 1,655 cy of clean imported fill, and 1,240 cy of imported topsoil;
• Injecting 9,765 gallons of soybean vegetable oil to form an arcuate bio-reactive wall across the contaminated shallow aquifer; and
• Installing four groundwater compliance monitoring wells just upgradient and down gradient of the bio-reactive wall.
A new quarterly groundwater compliance monitoring plan was approved by the EPA and UDEQ on December 17, 1999, to focus on the effectiveness of the former Burn Pits source area controls in reducing groundwater concentrations of TCE below its MCL.
16
The plan comprised analyzing for VOCs in samples from one well upgradient of the bio-reactive wall, and six wells 30 to 470 feet down gradient of it. It was conducted for eight consecutive quarters between July 10, 2000 and April 24, 2002; the first quarterly sample event was after the former Burn Pits soil excavation was backfilled but before the bio-reactive wall was installed. The concentrations of the contaminants of concern, TCE, DCE, PCE and benzene, were less than their respective MCLs of 5 µg/L, 70 µg/L, 5 µg/L and 5 µg/L for all eight quarters of groundwater sampling of the compliance wells. All cleanup goals for the contaminated soil and groundwater at OU2 as specified and required by the ROD were achieved through remedial actions by DDHU, and a Remedial Action Report was submitted to Regulators in June 2002. After receiving approval from EPA and UDEQ on August 12, 2002, the OU2 groundwater pump-and-treat system, including the treatment plant, injection and extraction wells and piping, and monitoring wells were removed between October 30 and late December 2002. DDHU Ogden was the first Federal facility in the nation to receive a RCRA Part B closeout permit for a groundwater treatment system because of the closure of OU2. OU3 OU3 is located near the southwestern corner of the former Depot and consists of four separate disposal areas designated Burial Sites 1, 3-A, 3-B and 3-C and the Mustard Storage Facility. OU3 is briefly presented here for completeness. The soil remediation at OU3 is complete and groundwater is being remediated as part of OU1. Burial Site 1 is located in the southwest corner of the Ogden Site (now part of the Ogden Nature Center). The burial site was reportedly used in the mid-1940s to dispose of riot control agent and white smoke containers. Remedial action at Burial Site 1 was completed in June 2001. Burial Site 3-A is located about 200 to 550 feet east of Burial Site 3-B, and in the southwest-central part of the original OU1 groundwater plume. Materials were disposed of at six discrete burial areas within the site in the early 1950s to mid-1960s. The materials were identified by trenching and included military chemical warfare agent identifications kits, several empty 55-gallon drums, gas mask air purification canisters, two small jars of an oil-based paint, broken glass containers, smoke and tear gas grenades, and two drum-like objects containing a thick sludge within which VOCs were identified. In one of the six burial areas, small concentrations of the VOCs, 1,1,2,2-tetrachloroethane and TCE were detected in soil samples. Between September 1994 and July 1995, 234 cubic yards of waste materials were excavated from an area 19 feet by 83 feet by 4 feet (deep) for transport and disposal.
17
Burial Site 3-B is located about 350 feet northeast of Burial Site 1. Apparently only non-toxic materials were disposed of in this small site, including more than 1,000 Arctic-style rubber boots. However, no evidence of these materials was found in soil borings. Burial Site 3-C is about 70 to 225 feet northwest of Burial Site 3-A and comprises an 8-foot wide by 198-foot long by 6 to 12-foot deep area where tens of thousands of small glass jars containing halozone water purification tablets were buried. Between October 26, 1993 and November 11, 1993 705 cubic yards of waste materials were excavated from the site and transported to a Subtitle D landfill. OU3 has been closed and will not be further discussed in this five-year review. OU4 OU4 is adjacent to the northern boundary of the Ogden site. It consists of Burial Sites 4-A through 4-E, the oil burning pit area, the OU4 Hotspot and former disposal trenches, and a plume of groundwater contaminated by VC and DCE. Lithologic succession at OU4 A OU4 source area investigation was completed in Spring 2006 as part of a Remedial Alternatives Analysis ((RAA); report pending). Preliminary results have been used to refine the near-surface lithologic succession at OU4:
1. An upper, semi-confining to confining unit of silt and some clay with sand laminations extending 0 to 10 feet bgs, and with an average thickness of 5 ft. In several areas JMM (1991) found this unit was absent. The water table often occurs at or near the base of this unit. The depth to groundwater generally ranges from 6 ft to 10 ft bgs, and tends to increase from northeast to southwest.
2. A shallow, contaminated aquifer comprising poorly sorted sandy gravels, flowing,
well sorted sands, locally with some silt and clay, with a thickness of 15 to 25 ft. Aquifer sediments recovered in Geoprobe boreholes were remarkably clean with little silt or clay. It is enigmatic that extraction wells in such a porous aquifer are poor volumetric producers;
A shallow aquitard of soft, saturated, organic-rich silty clay with interbedded silty sand and gravel lenses. The average depth to the top of the aquitard is about 22 ft bgs and four boreholes drilled through the aquitard indicate it is 65 to 85 ft thick. Overall, the top of the aquitard slopes to the southeast in the northwestern half of OU4, but is relatively flat with localized subdued highs and lows in the southeastern half of OU4. At the OU4 Hotspot, the aquitard lies at a little shallower depth and the shallow aquifer thins slightly to the west from the Hotspot source area. Near the OU4 source area, the aquitard slopes to the southwest-to-south into a small basin centered on JMM-45 and JMM-56. It is possible that any DNAPL reaching the top of the aquitard from the former
18
burn/disposal pits in the source area may have migrated down the slope of the aquitard, redistributing the DNAPL into this potential secondary source area; and
3. A deeper artesian aquifer was intersected in three deep boreholes. The uppermost part consists of sand with clayey sand intervals or sandy gravel to sand. The three monitoring wells with screens in this aquifer have historically had water levels that are at or somewhat above the ground surface (although a recent prolonged drought dropped these water levels to bgs). Thus, there is an upward directed vertical component of the hydraulic gradient between the shallow and deeper aquifers, which should prevent any migration of groundwater contamination with VOCs from the shallow aquifer, through the shallow clay aquitard and into the deep artesian aquifer.
Groundwater at OU4 flows generally to the south, then toward the southwest downgradient of the main portion of the plume with an average horizontal gradient of approximately 0.002. JMM found that hydraulic gradients varied across OU4 from 0.0017 to 0.0035. The average gradient along the entire OU4 plume in January 2006 was 0.0026. OU4 Record of Decision Remedial Action Objectives The Remedial Action Objectives stated in the ROD for OU4 are the same as those outlined above for OU1, with the following difference for the soil remediation. The OU4 ROD states that all backfilled soil and debris in Burial Sites 4-A and 4-E are to be excavated and removed to such that soils remaining in the excavation do not exceed established criteria. Furthermore, the water purification tablet bottles in Burial Site 4-D were to be removed. The OU4 ROD specifies the same conditions for determining when the groundwater remediation is complete as those specified in the OU1 ROD (see above). The groundwater monitoring plan for OU4 (JMM 1993) specified that compliance at each monitoring well is to be based on the mean or average COC concentration. The OU4 ROD included an estimate of the volume of contaminated groundwater of 65 million gallons (volume of groundwater with VC concentrations ≥2 µg/L). The ROD also indicated that the groundwater restoration time frame using a pump-and-treat system was a minimum of five years after commencement of remedial work. However, the ROD also noted that “the ability of the pump-and-treat technology to achieve and maintain low contaminant levels may be limited, as evidence by experience at other sites”. Annual O&M costs were estimated at $230,000. The present worth cost of the soil and groundwater remediation project were estimated at $4.5 million based on a 12-year duration of treatment and monitoring. The OU4 ROD was amended in April 2000 to include specific remedial actions and goals to address soil contamination at a localized hotspot with OU4 and associated groundwater contamination which were discovered during the implementation of the OU4 ROD (contaminated groundwater was found at proposed locations for injection wells). The Amendment was required because a fundamental change was made to the
19
final Remedial Action Plan described in the OU4 ROD. The OU4 Hotspot remediation plan included excavating contaminated soil from the Hotspot between two large, actively used, warehouse buildings (Buildings 15C (359) and 16C (367), but leaving contaminated soil beneath the concrete floor of one of the buildings (estimated at 1,850 cy total including 200 cy below the water table). Soil cleanup goals were develop specific to the OU4 Hotspot based on a risk assessment. The goals were 32 mg/kg VC, 1,850 mg/kg lead, 5,000 mg/kg diesel and 10,000 mg/kg oil and grease. The OU4 ROD Amendment also included a new remedy for remediating contaminated groundwater down gradient of the OU4 Hotspot. The selected remedy consists of an extraction trench installed along the western boundary of the former Depot. The trench was designed to be long enough to prevent contaminated groundwater from migrating off the Depot. The water extracted from the trench is conveyed to an ozonation treatment system near the western Depot boundary. Treated water is discharged to the sanitary sewer system. The Amendment contained an estimate of 2.5 million gallons of impacted groundwater. It also provided a “conservative” estimate that the groundwater RAOs should be achieved in about 10 years. The discharge of treated water requires a permit from the Central Weber Sewer Improvement District. This permit limits both the daily maximum and the daily average discharge to 100 µg/L total VOCs, and requires reporting of quarterly monitoring analytical results (using EPA Method 624) of the plant effluent to the District. The Amendment projected that the costs for O&M of the groundwater treatment system would be $100,000, and stated that the actual costs for the entire OU4 Hotspot remediation project were $5.3 million. Institutional Controls: The OU4 ROD Amendment recognized the continued risks to groundwater associated with any contaminated soil left in place beneath the buildings. This required implementing institutional controls which take the form of land use restrictions, including:
• Restricting the property for commercial and industrial use only; • Not permitting access for use of the groundwater underlying the property without
written approval of the DDHU, EPA and UDEQ; • Ensure that future users of the property do not tamper with, damage or impede
the groundwater treatment or monitoring systems; • Not permitting excavation, digging or disturbance of the soil beneath the
foundations of Building 15C and 16C without written approval; • Restricting the disturbance of the foundation elements for Buildings 15C and 16C
which would result in direct human contact with the underlying soils without written approval;
• Posting warning signs within Building 15C and 16C and within any future buildings constructed on those building sites stating: “No excavation Beneath the Building Foundation without Prior Approval”; and
• Providing a restrictive covenant to the land deed to the City of Ogden that would inform future land owners of the subsurface contamination and provide for continuing maintenance of the buildings and floor slabs.
20
Soil Contamination and Remediation Burial Site 4-A contained two shallow burning pits that were used from the mid-1950s to 1975. Wood, crating material, paper, dispensary wastes and used motor oils and greases mixed with solvents were disposed of and burned at this burial site. Burial Site 4-B was reportedly used for the disposal of fluorescent tubes from the mid-1950s to the late 1960s. Burial Site 4-C consisted for four shallow trenches used as a sanitary landfill from 1969 to 1972 to dispose of (primarily) cans of jelly and jam. Methyl bromide cylinders were reportedly disposed of at Burial Site 4-D between the mid-1940s and mid-1960s, but only halazone water purification tablets were found. Burial Site 4-E was used as an oil holding/burning pit for waste oils and spent solvents from the mid-1950s to the mid-1960s. The wastes were also set on fire to provide training for the Depot’s fire department. Burial Site 4-E is the most northerly of the OU4 burial sites and is located adjacent to the northern boundary of the former Depot. A very limited soil investigation in the early 1990s indicated that waste materials buried at Burial Site 4-E were the most likely source of VOC groundwater contamination at OU4 (Confirmed by the RAA investigation, Spring 2006). A remedial design/remedial action contract was awarded in October 1993 to perform the soil and groundwater cleanup at OU4. Between February and July 1994, 23,100 cy of soil contaminated with petroleum products and other wastes were excavated from Burial Sites 4-A, 4-E and 4-D and disposed of at the Grassy Mountain facility in Clive, Utah. The bottles of water purification tablets excavated from 4-D were incinerated at Chemical Waste Management’s Port Arthur, Texas facility. The excavations were generally 6 feet deep and extended 2.5 feet below the water table. It is interesting to note that a composite confirmation soil sample collected in 1994 along 100 ft of the western part of the 4-E excavation contained relatively high levels of DCE (3,400 µg/kg), PCE (260 µg/kg) and xylene (44,000 µg/kg). The OU4 Hotspot is located in the northwestern part of the Ogden site and comprises a groundwater plume of VC contamination emanating from the area of a former oil pit and disposal trenches in the area between and under Buildings 15C and 16C. The oil pit was believed to be circular with a diameter of about 60 feet. Building 16C may have been constructed over a small portion of the pit. Waste oils were poured onto the surface and burned at the oil pit between 1941 and about 1951. Office, construction and residential waste and debris were disposed of in a series of six trenches. The wastes were burned after adding accelerants, possibly including kerosene, diesel fuel and waste oil. Between September 1998 and January 1999, 4775 tons of hazardous waste soil and debris were excavated from the OU4 Hotspot area between Buildings 15C and 16C (including the Oil Pit, Trench A, Trench B and Test Pit #1). The Oil Pit excavation was 64 feet wide, 130 to 145 feet long and 7 feet deep, or one foot below the water table, and yielded 3,399 tons of hazardous waste soil. The contaminated soil was shipped to several disposal facilities: Safety Kleen’s facilities in Aragonite, Utah, Clive, Utah, and Deer Park, Texas for incineration, and Envirosafe’s hazardous waste landfill in Mountain Home, Idaho and Safety Kleen’s landfill in Grassy Mountain, Utah for disposal. Contaminated soil and debris beneath the buildings were left in place.
21

The area of the backfilled excavation was capped with asphalt paving where it existed previously. DDHU and regulators considered the buildings’ concrete floor to be low-permeability caps. Confirmation samples from the eastern and western sidewalls of the Oil Pit excavation indicated that TPH (mostly motor-oil range, up to 22,000 mg/kg) and lead (up to 41 mg/kg) contamination remained beneath Buildings 15C and 16C, but no chlorinated aliphatic hydrocarbons including VC. However, PCE (up to 750 µg/kg) and DCE (up to 7,400 µg/kg) were detected in waste characterization soil samples (total 53 collected). Confirmation samples were not collected from the bottom of the excavation which was one foot below the water table. About 3,000 pounds of oxygen release compound (ORC©) were placed in the bottom of the excavation to promote biodegradation of residual petroleum hydrocarbons in the saturated zone beneath Building 16C and below excavated areas in the Hotspot. An Amendment was made to the OU4 ROD in September 2000 to describe the fundamental changes made to the final Remedial Action Plan for OU4 because of the OU4 Hotspot remedial action. Institutional controls prohibiting disturbance of the concrete building floors and subsurface soils are included in the ROD amendment. Groundwater Contamination The contaminants of concern in groundwater at OU4 are VC, benzene, DCE, TCE, PCB Arochlor 1260 and arsenic. The area of attainment for VC (defined as the 2 µg/L contour) at OU4 was estimated to be 50 acres (about 3,900 feet long) in 1992. The total volume of groundwater within this area of attainment was estimated as 65 million gallons assuming the entire saturated thickness of the shallow aquifer is contaminated. In June 2004, the last time all the groundwater monitoring compliance wells and a large series of additional, non-compliance extraction wells were sampled at one time, the VC plume was about 450 to 900 feet wide. The narrowest part of the plume is halfway along it, in the area of JMM-58. The June 2004 analytical results also show that the area of attainment for the OU4 plume actually is split in two at JMM-58 where VC was 1.7 µg/L. The highest concentrations of VC between 2000 and June 2004 (163 to 430 µg/L) were at JMM-53R which is just down gradient of the main OU4 source area (at Excavation 4-E). Concentrations of VC have ranged up to 130 to 240 µg/L at four other wells in or down gradient of this source area: 4EW-02, -06, -08 and JMM-45. At the OU4 Hotspot, the closest down gradient monitoring well to the former oil pit source area is HS-03. Building 16C is located between the well and the former oil pit, a distance of about 250 feet. Between September 2000 and July 2005, groundwater samples from HS-03 contained from 3.2 to 7.8 µg/L VC, 1.0 to 2.2 µg/L DCE and a trace of benzene. TCE and PCE were not detected at HS-03. The low concentrations of VC and DCE suggest that if there still is a source of VOC contamination in the soil beneath Building 16C that was left during excavation of the former Oil Pit, then the source area concentrations are also relatively low.
22
OU1 and OU4 Groundwater Treatment Systems Descriptions and Effectiveness Groundwater is currently being remediated at OU1 and OU4 by separate pump-and-treat systems. However, the pump-and-treat system at OU1 is temporarily shut down for a ‘Non-Operational Test. Descriptions of the groundwater treatment systems, changes to the configuration of the systems, and annual system operating and maintenance costs are presented below. OU1 Groundwater Treatment System Description and Operations The OU1 groundwater treatment system consists of 18 extraction wells, conveyance lines, air stripping treatment system and 16 injection wells. The treatment system was designed to reduce the concentration of VOCs to below their MCLs at a design rate of 100 gpm plus or minus 25%. Extracted groundwater is pumped to a 3,000-gallon aboveground HDPE surge tank. The water is pumped from the surge tank to the top of the air-stripping tower by a 125-gpm pump. There is also a 125-gpm standby pump. There is one stripping tower three feet in diameter with approximately 17 feet of packing media designed for a flow rate of 75 to 125 gpm. VOC vapors from the air stripper are discharged directly to atmosphere without additional treatment. Treated water flows by gravity from the air stripper to a 1,500 gallon above ground HDPE storage tank. Water is then pumped by an injection pump (with one standby pump) through bag filters to the 16 injection wells and into the shallow aquifer. The injection wells are constructed of 6-inch diameter flush-threaded PVC casing and screen. A sequestering agent injection system is added to control scale buildup in the system. Extraction conveyance piping consists of approximately 5,125 feet of pipe and the injection conveyance piping consists of approximately 9,400 feet of pipe; both are constructed of 1 to 4-inch HDPE pipe. The volume of groundwater extracted, treated at the OU1 plant and injected back into the ground since full-scale operations began in 1994 through June 2005, was over 363 million gallons. Groundwater is extracted from 18 wells at a rate of approximately 1 to 10 gallons per minute (gpm) each. Extractions wells are constructed of 6-inch diameter flush-threaded PVC casing and PVC screens. Between startup in October 1994 and July 1998 the average extraction rate was about 60 gpm. Between October 1998 and July 2000, it averaged about 100 gpm. From the 2000 system optimization until the May 2005 Non-operational test (NOT, discussed further under “OU1 O&M”), the extraction rate averaged about 48 gpm. The approximate total mass of VC removed by the OU1 treatment system to July 3, 2004 was estimated as 2,400 g (5.3 lb); the total DCE removed is estimated as 4,475 g
23

(9.9 lb). Parsons Engineering Science (2001) calculated that the cost of VC removal by the P&T system to December 2000 was $793,000 per pound. OU1 Compliance Groundwater Monitoring Program The compliance groundwater monitoring plan for OU1 was developed during the remedial design for OU1 and was issued by JMM as the “Final Ground-Water Monitoring Plan for Operable Unit 1” in February 1993. The monitoring plan included eight monitoring wells within the VC plume, one upgradient well, three down-gradient wells and three cross-gradient wells, for a total of 15 wells. The compliance monitoring wells were sampled just before startup of the P&T system, then monitored quarterly during the first year of system operation. After that, the wells were monitored semi-annually until the May 2005 NOT. OU4 Groundwater Treatment System Description and Operations The OU4 treatment system consists of three main components: a wellfield of extraction and injection wells, a treatment plant and groundwater compliance monitoring wells. A field of 33 wells extracts groundwater from various parts of the OU4 groundwater plume at depths of 19 to 30 feet bgs. Two of these extraction wells were added to the system in 2003 to increase contaminant mass recovery. Treated groundwater is injected into 25 wells distributed around the flanks of the plume at depths of 16 to 30 feet bgs. The injection and extraction wells are constructed of 6-inch diameter PVC and have screens 10 or 15 feet long. Extraction and injection rates are generally less than 10 gpm per well. The volume of groundwater extracted, treated at the OU4 plant and injected into the ground since full-scale operations began in July 1995 through the end of 2005, was over 439 million gallons. The contract required a minimum flow rate of 100 gpm, and a minimum ‘uptime’ of 90% until September 2003 when an optimization study focused on reducing contaminant mass resulted in the shutdown of 14 of the 31 existing wells that had been pumping groundwater that had non-detectable concentrations of VC. After September 2003, the total flow rate was reduced to an average of 51 gpm (between September 2003 and March 2005). With the addition of EW-32 and EW-33, a total of 19 extraction wells remained online. The total flow rate after shutting down the wells in the northern wellfield in August 2005 for the Remedial Action Alternatives investigation (see below) averaged about 18 gpm. The average total weekly flow rate since starting up the wellfield on December 7, 2006 to May 16, 2007 was 34 gpm. Further optimization of the system by shutting down 11 extraction wells in the southern half of OU4 has been proposed and is under review by the EPA. These wells have been shown to be ineffective at significant contaminant mass removal, and constitute a cumulative flow of approximately 10 gpm. In addition, in June 2007 four injection wells and one extraction well in the OU4 source area were redeveloped in an attempt to increase their flow capacities; preliminary results are encouraging and analysis is continuing to see if this exercise should be expanded to additional source area wells.
24
Groundwater extracted from the contaminant plume by the extraction wells is pumped into a common-conveyance pipeline system and transferred to a surge tank in the treatment plant. The surge tank provides storage and equalization capacity for the extracted water. Groundwater is pumped from the surge tank through a chemical addition point into an air stripper. Sodium hexametaphosphate (SHMP), a sequestering agent, is added to the water to inhibit scaling of the air stripper and injection wells. The air stripper facilitates the transfer of VOCs in the groundwater to air by blowing air up through a packed tower while water flows down the tower. The treated water is discharged from the bottom of the tower into a storage tank and the air containing VOCs is discharged to the atmosphere. An air pollution control device is not installed on the air stripper because air emissions are below regulatory requirements. Injection pumps transfer the treated groundwater from the storage tank through a set of bag filters and pressure reducing valves before discharging to the injection wells. The treated water is distributed to 25 injection wells. The level in each injection well is controlled with level switches that signal the control panel and a solenoid valve at the wellhead. The extraction, treatment and injection systems are designed to operate automatically and unattended except for normal maintenance. In the event of an operational problem, the control system activates a series of alarms and automatic shutdown switches as appropriate, and an auto dialer notifies the operator. In the event of electrical power failure, the treatment system equipment is designed to fail in whichever open/closed positions will shut down the facility safely. OU4 Hotspot Treatment System Description and Operations The OU4 Hotspot treatment plant began full-time operation in April 1999. The treatment system consists of an ozone generation system, hydrogen peroxide feed system, oxidation reaction vessels, and an ozone destruction unit. The ozone/peroxide treatment unit was bypassed on September 3, 2003 and extracted groundwater is discharged to the sanitary sewer under a permit from the Central Weber Sewer Improvement District. The extraction trench system consists of a 300-foot long trench just east of the western boundary of the former Depot, a centrally located sump with two sump pumps that alternately pump groundwater to the treatment plant, a leak detection system, conveyance piping, two piezometers, three treatment manifold headers and two cleanout ports. The function of the trench is to capture groundwater contaminated with VC across the width of the plume at the western boundary of DDHU, and deliver it to the treatment system. The trench was excavated to a depth of 15 feet, through the shallow aquifer containing the groundwater contamination into the underlying clay-rich aquitard. The thickness of the aquifer in the trench walls has an average of 6.2 feet. The base of the aquifer varies in depth from 10 to 15 feet bgs. As of December 28, 2005, the OU4 Hotspot treatment system had extracted and discharged a total of 48.1 million gallons since the system started. The average trench
25

extraction rate between June 30 and December 28, 2005 was 15.7 gpm. The treatment plant cannot hydraulically accommodate a flow rate of more than 20 gpm. OU1 and OU4 Pump-and-Treat Systems: Operation and Maintenance Cost Annual Cost: AEEC has been operating and maintaining (O&M) the OU1 and OU4 groundwater pump-and-treat systems for more than five years. There are currently two fulltime operators on site during the week. Table 2 below summarizes the annual costs of the total OU remediation programs, including those to operate and maintain the OU1 and OU4/OU4 Hotspot systems. The FY01 total includes the cost of soil and groundwater remediation at the OU2 Parade Grounds. The FY02 total includes the cost of the OU2 groundwater treatment system demolition. The $1.8 million reduction in annual O&M costs from FY02 to FY03 resulted from two factors: 1) the FY02 total included the cost of removing the OU2 groundwater treatment system; and 2) a change in contractors from Chung and Associates to AEEC, and wellfield optimization programs at OU1 and OU4 which resulted in the operation of fewer injection and extraction wells. The $250,000 reduction in costs between FY04 and FY05 was a result of the City of Ogden completing the OU1 north wellfield abandonment project in preparation of storm drain and road improvements, and shutting down the OU1 treatment system as part of the NOT. Table 2: Annual OU1 and OU4/OU4 Hotspot Pump-and-Treat Systems Operations & Maintenance Costs.
FISCAL YEAR*
TOTAL COST ROUNDED TO NEAREST $1,000
FY01 $2,821,000 FY02 $2,987,000 FY03 $1,193,000 FY04 $1,223,000 FY05 $977,000 FY06 $785,000
*Fiscal year is October 1 through September 30 OU1 O&M: Prior to the shutdown of the treatment system at OU1 for the NOT in May 2005, The general preventative maintenance program included regular inspections and cleaning of the injection and extraction wells, surge/storage tanks, stripper tow media and wellfield piping. The program included frequent replacement of bag filters, pump servicing and replacement, and replacement of damaged or old components. The injection and extraction wells required frequent purging and swabbing to remove and mitigate biofouling. In addition, in recent years the collection lines were periodically pneumatically purged to remove biofouling. As part of the NOT, the pump-and-treat system was shut down on May 26, 2005.
26
Extraction well pumps and injection well drop-pining and probes were removed, decontaminated and stored at the OU1 plant. Between September 20 and 30, 2005, the treatment plant and wellfield were mothballed. This included pneumatically purging the wellfield piping, cleaning the surge and storage tanks with a pressure washer, inspecting the air stripper tower packing material, and testing the heating system inside the treatment system (which was left on to prevent freezing of the pipes). Poison was placed in all well vaults, and a cat is maintained in the treatment plant to control rodents. All well vaults were secured with locks, and warning signs were placed at the treatment facility to minimize vandalism and theft. Spare parts, tools, documents, etc. were taken to the OU4 treatment facility for storage and use. Until completion of the NOT, quarterly maintenance and inspection is being conducted on the treatment system to minimize any deterioration of the system components and ensure that that it can be started up in a short period of time at reasonably little cost. The quarterly maintenance and inspections activities include: 1. Completion of all activities listed on a maintenance and inspection checklist. 2. Maintenance of the treatment plant grounds within the fenced area and the areas
immediately surrounding the extraction and injection wells, including weed control. 3. General housekeeping of well vaults and the plant, including rodent control. 4. Checking for cracks, corrosion and other signs of possible equipment failure if the
plant is restarted. 5. Making minor repairs to fencing, treatment plant walls and roof, well vaults and
protective bollards to maintain equipment integrity and security. 6. Maintaining inspection records in an organized filing system at the OU1 treatment
plant. 7. Performing extra maintenance and repairs on an as-needed basis. A letter report is submitted to the USACE, U.S. Army Materiel Command, UDEQ and EPA within 45 days of completing the activities, which summarizes all maintenance activities and includes completed maintenance checklist forms and recommendations for extra maintenance and repairs. Between October and December 2005 maintenance included replacing rodent control poison in all well vaults, repairing a well bollard and cleaning the inside of the treatment plant. OU4/OU4 Hotspot O&M: The OU4 and OU1 treatment systems are of very similar design. Therefore, OU4 O&M requirements are very similar to those described for OU1. Biofouling of the extraction wells by iron-reducing bacteria and the injection wells by sulfate-reducing bacteria is a significant persistent problem that requires cleaning of the wells every one to three weeks. As described above, redevelopment of these wells may prove to be a cost-effective way to increase flows. The wells are cleaned when a noticeable decrease in the production flow rate is noticed. It is believed that the biofouling in the injection wells may actually be enhanced by the addition of sodium hexametaphosphate to the treatment plant influent. SHMP contains phosphate which is a primary nutrient for some bacteria growth. The SHMP is added to inhibit scaling on the treatment plant components, especially the packing in the air stripping tower. AEEC
27
has informally proposed adding an acid called AN-310H to the effluent. AEEC has been using the chemical successfully at a Las Vegas, NV treatment plant they operate. The extraction and injection well piping at OU4 is purged pneumatically on a quarterly basis to prevent and remove bacterial growth. This has increased the efficiency of the extraction system and reduced some maintenance time. However, it results in using up a large number of bag filters. The most common cause of plant alarms and shutdowns resulting in significant downtime is power outages to the OU4 and OU4 Hotspot treatment plants. Another common cause at OU4 is the flooding of injection wells due to rain and high groundwater or equipment failure. However, AEEC has been very diligent in their preventative maintenance program, which has kept unexpected equipment failures at a fairly low incidence rate. The most common equipment failure resulting in a system alarm in the past two years appears to have been related to the blower for the air stripping tower. The “uptime” for the OU4 treatment system ranged from 95.2% to 99% between October 2003 and December 2005. Occasionally, City of Ogden contractors and construction workers sever or damage a pipe that forms part of the OU4 or OU1 wellfield. There is a large amount of construction and underground utility repair, upgrading and installation taking place throughout the Business Park. The Ogden City Engineering Department of Public Works has a map showing the location of the wellfield piping. However,, many of the locations are unmarked at the surface, and the piping location map is rather generalized. At OU1, contractors severed part of an extraction pipe and cause a minor spill of contaminated groundwater several years ago. AEEC responded in an appropriate manner and mitigated the spill. AEEC has indicated that some contractors appear to be unaware that they are working proximate to wellfield piping. Therefore, as a preventative measure, AEEC keeps a close eye on all trenching and other excavation activities in the immediate vicinity of the OU1 and OU4/OU4 Hotspot wellfield piping. The O&M requirements of the OU4 Hotspot treatment system were greatly reduced when the ozone/peroxide treatment unit was bypassed on September 3, 2003. The unit had been troublesome for years and caused a large number of long plant shutdowns. Malfunctions of the unit or power failures often lead to increase ozone concentrations in the emissions stack, which tripped an alarm and plant shutdown. Since the ozone/peroxide unit was bypassed, the most common reason for plant shutdown is power outages to the plant. The “uptime” for the OU4 Hotspot treatment system ranged from 93.9% to 98.6% between October 2003 and December 2005. Monitoring Well Abandonment Program at Ogden Site Two well abandonment projects were completed in June to July 2001 and November 2002 at a number of RCRA SWMU Building sites and at OU2 after DDHU obtained site closures. All wells were abandoned in accordance with the State of Utah, Utah Division of Water Rights Administrative Rules for Water Well Drillers (UAC Rule R655-4-12 –
28
Abandonment of Wells). The abandoned wells included 106 groundwater monitoring wells, 10 vegetable oil injection wells at OU2 and 5 soil vapor extraction wells. V. Progress Since the Last Review No deficiencies were noted in the Second Five-Year Report. However, the Recommendations and Follow-up Actions section of the report indicated that the DLA had initiated optimization studies of OU1, OU2 and OU4 “to see if it was possible to modify the current system to expedite the accomplishment of the remediation objective while reducing operating costs”. The report implied that the recommendations from these studies should be implemented. These are described below for OU1 and OU4. Remedial measures completed to achieve site closure at OU2 are described above in Section IV. OU1 Optimization Measures Implemented and Changes in Operations Compliance Monitoring Program On December 1, 2000, EPA and UDEQ regulators approved a revised groundwater compliance monitoring program for OU1, as part of a program to optimize recovery and monitoring of the plume. The number of compliance wells was reduced from 15 to 13. The compliance monitoring program at OU1 also included collecting groundwater level measurements at 32 monitoring wells on a monthly basis. In June 2001, the low-flow purging and sampling technique was implemented for compliance sampling, and replaced the conventional higher volume (minimum of three well volumes) purging technique. Pump-and-Treat System Optimization Projects As a result of wellfield evaluation studies by Kleinfelder, USACE and Parsons Engineering Science (Parsons) a major wellfield optimization program was instituted in late 2000, as summarized below. Kleinfelder Wellfield Evaluation Study Report: Kleinfelder’s November 1999 evaluation study of the OU1 P&T system and groundwater monitoring plan recommended a number of modifications to the treatment system and compliance monitoring program to optimize them. On December 1, 2000, UDEQ and the EPA approved, by letter, DDHU’s request to implement these optimization modifications. The optimization modifications that were implemented at OU1 included the following:
• Removing 7 wells from the compliance monitoring plan (JMM-6, -17, -20, -29, -48, -62 and –63) because these distal wells do not help delineate the perimeter of the plume;
• Adding 5 wells to the compliance monitoring plan (JMM-1, -2, -51, ESE-13 and –14) because they will provide better resolution of the existing VC plume;
29
• Shutting down 9 extraction wells (1EW-1, -6, -7, -10, -11, -12, -13, -14 and –15) pumping groundwater that meets the ROD cleanup goals (MCLs) to increase the volumes of groundwater from areas where the VC concentrations exceed the cleanup goals. In mid-2003, one of these extraction wells (1EW-10) was restarted because of persistent low-concentration VC contamination in the southeasternmost part of the wellfield.
Parsons Remedial Process Optimization Evaluation: In 2000, the Defense Logistics Agency (DLA) contracted Parsons to evaluate the OU1 (and OU4) treatment system as part of the DLA’s remedial process optimization (RPO) initiative. Parsons submitted a 322 page Draft RPO report in November 2000. After receiving additional data from DDHU and the USACE, Parsons re-submitted the RPO report with an addendum of revised recommendations in approximately June 2001. Parsons concluded that the OU1 pump-and treat system is not an effective means of removing the remaining VOC mass to meet remedial action objects because of the relatively little mass of VC removed to date, the relatively little mass that likely remains in the OU1 groundwater, the current low mass removal rate of the treatment system and the likelihood that little TCE/DCE source mass remains. Parsons recommended:
• The pump-and-treat system be turned off to determine if VC concentrations in groundwater will rebound when the system is not operating;
• The groundwater quality be monitored for VOCs and natural attenuation parameters for one year in order to assess the plume stability under natural (non-pumping) conditions to provide information to support additional remedy-optimization evaluations; and
• Making no changes to the monitoring program that was revised by DDHU in December 2000 because the revised program is similar to the optimized monitoring program recommended in the draft RPO report.
Remaining Source Area Investigations Additional passive soil gas sampling and borehole soil sampling surveys were conducted in the area of Burial Sites 3-A and 3-C to delineate potential source areas in more detail. Passive Soil Gas Sampling: Eleven passive soil gas samples were collected by Kleinfelder in August 2000 to fill in between samples collected in August 1999 in the area of Burial Site 3-C (mostly between 1EW-16 and JMM-22). The infill samples were collected proximate to the sites of four temporary monitoring well groundwater samples with 2.3 to 6.7 µg/L VC to determine if the more widely spaced passive soil gas samples (30.5 feet) missed a small potential source area. Low, but anomalous, amounts of DCE were detected 50 feet northeast of 1EW-16 and 20 feet southeast of JMM-22.
30
Borehole Soil Sampling: Two boreholes were installed just west of JMM-51 on August 29, 2000 to test for soil contamination potentially associated with the two highest masses of TCE detected by the August 1999 passive soil gas survey at the northern edge of Burial Site 3-A. They intersected a ‘smear zone’ of weathered petroleum products with a minimum thickness of 3 or 4 feet and 7 to 4 feet bgs. Soil samples from the ‘smear zone’ intervals contained only trace concentrations of TCE. These results suggest that the source of VC contamination in groundwater in the area of JMM-51 and the passive soil gas anomaly is, at least in part, small concentrations of TCE in soil associated with an oily ‘smear zone’ at the water table. The results also indicated that in situ treatment would be more cost effective in remediating the remaining VOC soil contamination in sources areas at OU1 than excavation and disposal. Additional Remedial System Changes and Activities Extraction Well Installation: Two new extraction wells were installed between January 9 and 15, 2001 to increase VC mass recovery near potential source areas and attempt to shorten the time to reach cleanup goals. Extraction well 1EW-17 was installed about 45 feet northwest and down gradient of JMM-22 and Burial Site 3-C in an area which has yielded samples with an average VC concentration of 6.2 µg/L since 1992. Extraction well 1EW-18 was installed about 15 feet north of JMM-59 (with an average of 1.2 µg/L VC since 1992) and just north of Burial Site 3-A. It is also about 30 feet north, and 45 feet northwest of the two passive soil gas samples that marked the prominent TCE soil gas anomaly. Volumetric extraction rates for the two new wells have been relatively low, about 2 to 3.5 gpm. Concentration of VC decreased in 1EW-17 from 5 µg/L to 2.8 µg/L between February 2001 and January 2004, and from 2.8 µg/L to 0.7J µg/L in 1EW-18. ORC Injection in Potential Source Areas: In early 2002, DDHU and the USACE took a more aggressive approach to remediating areas of potential residual VOC soil contamination that appear to be the sources of VC in groundwater at concentrations persisting just above the MCL. The oxygen release compound (ORC®) was injected into the contaminated aquifer sediments in an attempt to enhance aerobic microbial activity and biodegradation of VC in the oxygen-poor groundwater. In March 2003, a slurry containing 5,520 pounds of ORC® and 165 pounds of powdered sugar was injected in the contaminated aquifer at 84 points at 15-foot centers at depth intervals generally from 5 to 8 feet bgs to an average depth of 30 feet. ORC® injection points were located at eight suspected source areas of VOC contamination based on passive soil gas survey results, previous disposal history and groundwater sample results, including five areas along the former Plain City Canal. A groundwater monitoring program for VOCs was conducted to help assess possible effects of the ORC® injection. It included a baseline (pre-injection) sampling of five extraction wells in March 2003 and the normal compliance monitoring wells in December 2002. A comparison between the pre- and post-ORC® injection
31

concentrations of VC for wells within 50 feet of the injection points suggested apparently mixed results:
No change in five wells; Possible decreases in two; Possible increase in one; and Probable increase in one.
It was concluded by the USACE that these changes in VC were more related to changes in the water table than ORC® injection and that the ORC® injection program had no obvious effects on groundwater quality at OU1. North Wellfield Demolition: In December 2004, the City of Ogden initiated the OU1 North Wellfield Demolition project prior to making improvements to roads and the surface drainage system in the area. The project included the abandonment and removal of four extraction wells, five injection wells, four compliance groundwater monitoring wells and associated groundwater extraction and injection piping. The project was approved by the USACE, Army Materiel Command, EPA and UDEQ, and was completed between January 4 and February 3, 2005. A visual evaluation of time-series graphs for OU1 May 2005 groundwater monitoring data by the USACE indicated that the VC concentrations showed stable trends in 22 of the 38 monitoring and extraction wells (see attached time-series graphs). The wells with stable trends are widespread and located within and outside the VC plumes. Two down gradient wells showed decreasing trends. The well with the highest average VC concentration of 6.1 µg/L (JMM-22) may show a slightly decreasing trend. Concentrations of VC at the three monitoring wells and six extraction wells within the plume had averages that range from 2.0 to 4.1 µg/L, that is, at or somewhat greater than the MCL. VC concentrations at five of these wells varied unsystematically from somewhat above to somewhat below the MCL. Based on the above evaluation the USACE concluded that operating the current optimized pump-and-treat system may not meet the remedial goals in a timely and cost-effective manner and that other remedial options should be explored. The USACE suggested conducting a non-operational test (NOT) to determine if the system is effective or ineffective. If the plume starts migrating a significant distance after system shutdown, the pump-and-treat system will be restarted or an alternative, more cost-effective and efficient remedial action will be proposed in a ROD amendment and implemented. If the NOT results indicate that the plume remains relatively stable, and that, therefore, the treatment system is ineffective, then an alternative remedial measures study may be conducted to determine a more practical and cost-effective remedial alternative. USACE received approval to temporarily shut down the groundwater treatment system at OU1 in May 2005, in accordance with the NOT Work Plan, dated May 2005. The groundwater treatment plant at OU1 was shutdown in on May 26, 2005 and
32
groundwater monitoring frequency increased from semi-annual to quarterly at a larger group of monitoring and extraction wells focused within and just down gradient of the three plume areas. The Baseline and the first seven quarters of groundwater monitoring have been completed and reported. The Seventh Quarter sampling event was in March 2007. The Eighth Quarter sampling event was completed in June 2007. Preliminary analyses of the data to date indicate the plume areas are not migrating down gradient and concentrations within the plume areas are not increasing. OU4 Optimization Measures Implemented and Changes in Operations A three tiered plan for the optimization of the OU4 pump-and-treat system was proposed by USACE and approved by the EPA and UDEQ on March 20, 2003. The first element of the plan involved shutting down 14 extraction wells (4EW-4, -5, -10, -12, -13, -15, -16, -17, -20, -23, -26, -28, -30, -31) that had been extracting groundwater in which VC was not detected for at least two years. The 14 extraction wells were shut down during the week of August 6 through 13, 2003. The second element of the optimization plan was to install two new extraction wells in the portion of the contaminant plume with the highest concentrations of VC to achieve greater contaminant mass removal. In August 2003, two new groundwater extraction wells (4EW-32 and 4EW-33) were installed by AEEC between existing extraction wells down gradient of the main source area. Both of these wells turned out to relatively good producers (weekly extraction rates of 3.5 gpm and 5.7 gpm, respectively during 2004). The third element of the optimization plan was to bypass the OU4 Hotspot ozone/peroxide treatment system and pump groundwater directly from the extraction trench to the sanitary sewers. This element is described in more detail in the subsection on the OU4 Hotspot below. In April 2003, the frequency of sampling the influent and effluent waters from the OU4 treatment plant for VOC analyses was increased from semi-annually to monthly to better monitor changes in extraction well configurations. Between June 28 and September 22, 2005, AEEC completed modifications to the OU4 wellfield as part of the Westgate Realignment Project for the City of Ogden. The modifications included:
• Moving extraction well 4EW-31 650 ft to the north to just north of monitoring well HS-03 and in the down gradient area of the OU4 Hotspot source area;
• Abandoning three injection wells (4IW-16, -17 and -18); • Modifying piping to extraction well 4EW-30 so that it can be converted to an
injection well to improve plume containment; and • Removing piping in the southern portion of the OU4 wellfield and installing new
piping to the north of the old piping to accommodate road widening and construction.
33
On August 24, 2005, the northern part of the wellfield was shut down to facilitate a remedial alternative action investigation conducted by Kleinfelder, Inc. in April 2006. The shutdown involved 19 extraction wells and 10 injection wells. The purpose of the investigation was to provide site-specific soil and groundwater data for evaluating the cost-effectiveness and technical feasibility of six remedial action alternatives. The evaluation of remedial alternatives is being conducted because the current pump-and-treat systems does not appear to be able to reach MCLs in a cost-effect and timely fashion. The north wellfield was turned back on December 7, 2006. Regulators had approved an extended shutdown to allow the USACE to formulate possible plans to remove a thin layer of floating petroleum product that was discovered in the OU4 main source area during the investigation. The free product covered an area of about 0.7 acre and was up to 5.7 inches thick in monitoring wells. Analyses indicate the free product comprises about 95% hydrocarbons in the diesel fuel and motor oil range. The oil contains up to approximately 0.08% total VOCs, comprising predominantly isomers of benzene, xylenes, naphthalene and naphthalene isomers, and toluene, but also DCE (up to 11,714 ppb), PCE (up to 4,130 ppb), TCE (up to 1,177 ppb) and vinyl chloride (up to 445 ppb). This indicates that the floating free product could be a significant continuing source of VOCs to groundwater including chlorinated hydrocarbons. Absorbent socks were installed in the 4 wells with the thickest free product on September 9, 2006. By September 20, 2006 rudimentary measurements indicated that no more than 4.4 gal of free product had been recovered with the socks, and new socks did not recover any additional free product. Monitoring of 8 wells in the main source area up until March 2007 indicated that after start up of the north wellfield in December 2006, floating free product thickness decreased to sheens in all but one well where it was about 5.9 inches thick. Apparently, the remaining free product not recovered by the absorbent socks was smeared out in the vadose zone as the water table dropped due to groundwater extraction. The USACE concluded that removing the remaining floating free product was not feasible. Kleinfelder West concluded in their preliminary evaluation report on their OU4 remedial action alternatives investigation (March 2007) that in situ chemical oxidation or chemical dechlorination in the OU4 source area provide the most cost-effective and shortest duration remedial solution to directly remediate the residual contamination that continues to partition into the groundwater. They also concluded that monitored natural attenuation was the most cost effective alternative for remediating the contaminated groundwater. Kleinfelder West recommended that bench and field-scale pilot tests of four chemical oxidants be conducted in the OU4 source area to determine their effectiveness in remediating residual VOC contamination. Upon completion of the bench scale tests, it is anticipated that one chemical oxidant will be chosen for use in a field-scale pilot test, and a soil-mixing delivery technique will be used to distribute the oxidant to the aquifer and smear-zone sediments. The tests are planned for the summer of 2007. Kleinfelder also recommended the evaluation of enhanced monitored natural attenuation for remediating groundwater contamination by testing various electron donors and anaerobic bacteria augmentation.
34

OU4 Hotspot Treatment System: The ozone generation and destruction units at the OU4 Hotspot treatment facility were turned off and bypassed on September 3, 2003 because the concentration of VC in the plant influent has been consistently less than the method detection limit and the total concentration of VOCs in the influent are much less than the effluent discharge permit standard. It appears that the several µg/L of VC flowing into the extraction trench are being removed in the trench, perhaps by oxidation or volatilization. AEEC made adjustments to the trench extraction pump in 2000 or so that resulted in steady drawdown within the trench and a significant depression in the water table in the adjoining sediments. This greatly increased the capture efficiency of the extraction trench. Table 3: Follow-up Actions to Recommendations Made in Last Five-Year Review
Issues from Previous Review
Recommendations/ Follow-up Actions
Party Responsible
Milestone Date
Action Taken and Outcome
Date of Action
None N/A N/A N/A N/A N/A
VI. Five-Year Review Process Administrative Components The EPA and Utah DEQ were notified of the initiation of the five-year review in March 2006. The review team was led by April Fontaine, USACE Project Manager for DDHU, and included staff with expertise in environmental engineering, geology, hydrogeology and risk assessment. The Army TEAD and the USACE’s Hazardous, Toxic and Radioactive Waste Center of Expertise assisted in the review and as the representatives for the Army. From April 1 to August 31, 2006, the review team established a review schedule with the following components: 1. Community involvement; 2. Document review; 3. Data review; 4. Site inspection; 5. Local onsite interviews; and 6. Five-Year Review Report development and review. Community Involvement At the site inspection meeting, representatives from the Army, EPA, and Utah DEQ decided based on previous experience that no community notification was required other than a public notice in the local newspaper indicating when and where the final
35
Third 5-Year Review Report would be made available to the public in the Boyer Building, Business Depot Ogden. Document Review This five-year review consisted of a review of relevant documents including remedial action reports, groundwater treatment reports, O&M records, ARARs, RODs, and ESDs. Refer to the attachment List of Documents Reviewed for a complete listing. Applicable Federal and Utah regulations and cleanup standards were also reviewed. Data Review Data included in the remedial action reports and groundwater-monitoring reports were reviewed. The Attachment Tables and Figures Documenting Remedy Performance contain extensive groundwater and treatment data in tabular and concentration vs. time formats. The concentration trends and contaminant plume changes at OU1 and OU4 since system startup are summarized below. There have been no changes to cleanup standards or ARARs. OU1 Contaminant Concentration Trends and Plume Changes Plume Area of Attainment: The OU1 area of attainment (area with concentrations of VC greater than the Maximum Contaminant Level (MCL) of 2 micrograms/liter (μg/L)) has been reduced from a single plume of about 32 acres in 1994 to three or four isolated areas totaling about four acres in March 2007. The areas are proximate to old waste burial sites. The VC plume more or less stabilized into its present configuration between 1994 and July 1999, although VC concentrations in individual wells occasionally vary between just above and below the MCL. In general, VOC concentrations in semi-annual groundwater samples were higher in July (64% of the time) than January (36% of the time). Based on the NOT quarterly sampling, VC concentrations are generally the highest in the June groundwater samples when water levels are high. Concentration Trend of Plant Influent: The concentration of VC in the treatment plant influent decreased from about 3 µg/L at plant startup to 1 to 1.5 µg/L by January 2002 then increased somewhat to 2 to 3 µg/L between June 2003 and June 2004, that is, nearly the same as at startup. There appears to have been a small increase in VC concentrations associated with the wellfield optimization in January 2001 (see below), and a more obvious increase associated with the startup of extraction well 1EW-10 (and the concurrent injection of Oxygen Release Compound® (ORC); see below). The concentration of DCE in the influent has decreased overall since startup from about 5.5 µg/L to 3 µg/L (the MCL for DCE is 70 µg/L).
36

Concentration Trends at Monitoring Wells: The OU1 Seventh Quarter NOT monitoring report summarized the results from March 2007 (see concentration trends graphs for individual wells in Attachment section). A preliminary evaluation of the vinyl chloride concentration and plume data by the USACE in the Seventh Quarter OU1 NOT monitoring report (June 2007) indicates that the three or four small, isolated plumes have remained relatively stable between the Baseline and Seventh Quarter. NOT and previous data indicate that the plumes have remained stable since about July 1999. The data also indicate that the plumes are not migrating down gradient. The quarterly variations in the size and shape of the plumes result from the fact that concentrations of vinyl chloride vary from just above the MCL of 2 µg/L to just below the MCL at 6 widely separated monitoring wells and 6 extraction wells. The pattern of quarterly increases or decreases in concentration is unique for 19 of the 23 NOT monitoring wells. Although these relative changes appear random, there appears to be a distinct seasonality to the concentrations. June is the month when there is a coincidence between a large number of wells with seasonal high concentrations and the least number of wells with seasonal low concentrations. The USACE also concluded in the Seventh Quarter NOT monitoring report that the NOT monitoring program shows that the pump-and-treat system was failing to continue to reduce VC concentrations and that natural attenuation of the plume is occurring, though the concentrations are still fluctuating just below or above the MCL. The lack of correlation between the trace concentrations of TCE and concentrations of DCE suggests that the main source of VC is the TCE degradation daughter product, DCE. The low, relatively constant concentrations of DCE in groundwater suggests that the source of dissolved DCE is DCE that sorbed to the soil from the plume when VOC concentrations were higher. Thus, the USACE concluded, it appears that the most cost effective and practical means of remediating the VC plume is monitored natural attenuation. The USACE recommends annual sampling for VOCs and natural attenuation and physical/chemical parameters after completion of the 8 quarters of NOT groundwater monitoring. OU4 Contaminant Concentration Trends and Plume Changes Plume Area of Attainment: A comparison of the October 1995 VC OU4 plume contour map with the June 2004 map shows that since the startup of the pump-and-treat system the area of attainment plume has become much narrower (one third to one half less) along all of its length and that the VC concentrations have been greatly reduced. The area of attainment has been reduced by approximately 60 to 70 % or more. In fact, it appears that the area of attainment has split into two or possibly three areas. This is indicated by VC concentrations of a little less than 2 µg/L at wells JMM-58 and 4EW-19, which are midway along the plume, and non-detected and 1.2 µg/L concentrations at 4EW-24 and 4EW-21 two-thirds the way along the plume. Furthermore, in 1995, the 100 µg/L contour extended from the main source area down gradient to nearly midway
37
along the plume length. In 2004, it was restricted to a small area around 4EW-06 and JMM-53R just down gradient of the main source area. Thus, it is possible that the portion of the plume migrating from the main source area is being attenuated somewhere between 4EW-14 and JMM-58, perhaps because of drawdown around the extraction wells, and/or because of natural attenuation. Concentration Trend of Plant Influent: The OU4 treatment plant influent between September 1996 and August 2005 (just before shutting down the northern wellfield for the RAA investigation) contained average concentrations of 4.1 µg/L TCE, 62 µg/L DCE, 31 µg/L VC and 2.7 µg/L benzene. During the northern wellfield shutdown, the influent concentrations of TCE, VC and benzene decreased to between the Method Detection Limit (MDL) and Practical Quantitation Limit (PQL), and DCE to 4 µg/L. This indicates that the vast majority of the VOC mass extracted by the system is from the northern, upgradient part of the plume, and very little mass is removed from the downgradient portion. Based on these data, UDEQ and EPA regulators, on May 22, 2007, granted tentative approval to shutting down the southwestern half of the extraction wellfield (except 4EW-29 and 4EW-31). Final approval will be granted by the Regulators after approval of a technical memorandum justifying the southwestern wellfield shutdown is submitted by the USACE. The injection wells in the southwestern wellfield area will continue to be operated as necessary to maintain sufficient injection capacity. Concentration Trends at Monitoring Wells: Perhaps the two most important compliance monitoring wells are HS-05 and HS-06 because they are located just west of the western boundary of the site and just down gradient from the OU4 Hotspot extraction trench. Samples from these two wells measure the effectiveness of the extraction trench at capturing the tail of the OU4 plume and preventing the plume from migrating offsite. The concentrations of VC in these two wells have been less than the MDL or PQL since December 2001. These results show the extraction trench is effective at plume capture. Concentrations of VC in 9 other OU4/OU4 Hotspot compliance wells have been <MDL since July 1995 (6 wells) or October 1998 (2 wells) or September 2000 (1 well). All but two of these wells are on the flanks of the plume and are being monitored to measure lateral containment of the plume (JMM-44 is upgradient; HS-10 is near the toe of the plume). Four wells within the plume showed decreasing trends from 1995 to 1999 (JMM-09, -56 and -57) or to 2002 (JMM-64). Five monitoring wells show more recent steady concentration trends over different time intervals starting in October 1999 to June 2003 (JMM-09, -46, -57, -57, and HS-08; see table below for details). None of the wells show increasing concentration trends. As part of wellfield optimization, and in addition to semi-annual compliance sampling, 12 extraction wells and 8 monitoring wells within the plume have been sampled five times for VOC analyses from August 2000 to June 2004. The data indicates that VC concentrations have decreased in this period at 7 wells, increased at 4 wells, and been more or less stable at 7 wells. The wellfield optimization results, when considered with
38

the compliance well sample results, suggest that the increasing VC concentration trends occur in the main source area (at 4EW-02, -03 and -06), decreasing trends occur in the area about 300 to 600 ft down gradient of the main source, and stable or decreasing trends occur within the remainder of the down gradient portion of the plume.
39
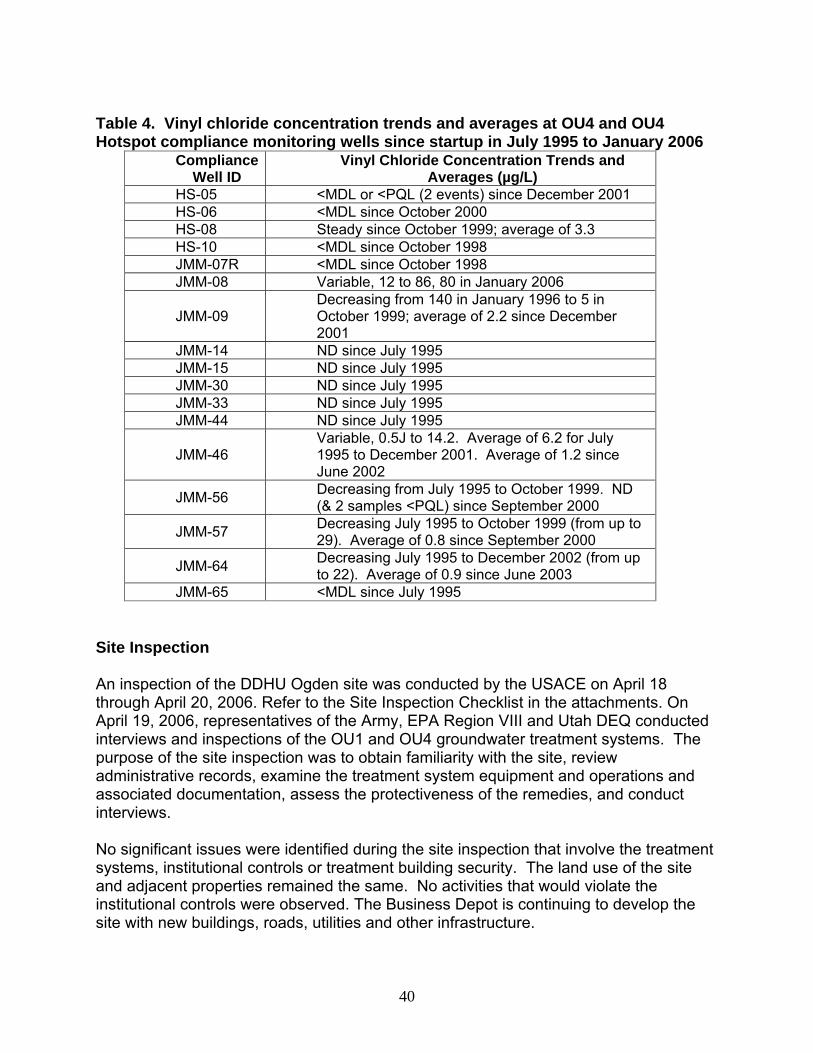
Table 4. Vinyl chloride concentration trends and averages at OU4 and OU4 Hotspot compliance monitoring wells since startup in July 1995 to January 2006
Compliance Well ID
Vinyl Chloride Concentration Trends and Averages (µg/L)
HS-05 <MDL or <PQL (2 events) since December 2001 HS-06 <MDL since October 2000 HS-08 Steady since October 1999; average of 3.3 HS-10 <MDL since October 1998 JMM-07R <MDL since October 1998 JMM-08 Variable, 12 to 86, 80 in January 2006
Decreasing from 140 in January 1996 to 5 in October 1999; average of 2.2 since December 2001
JMM-09
JMM-14 ND since July 1995 JMM-15 ND since July 1995 JMM-30 ND since July 1995 JMM-33 ND since July 1995 JMM-44 ND since July 1995
Variable, 0.5J to 14.2. Average of 6.2 for July 1995 to December 2001. Average of 1.2 since June 2002
JMM-46
Decreasing from July 1995 to October 1999. ND (& 2 samples <PQL) since September 2000 JMM-56
Decreasing July 1995 to October 1999 (from up to 29). Average of 0.8 since September 2000 JMM-57
Decreasing July 1995 to December 2002 (from up to 22). Average of 0.9 since June 2003 JMM-64
JMM-65 <MDL since July 1995 Site Inspection An inspection of the DDHU Ogden site was conducted by the USACE on April 18 through April 20, 2006. Refer to the Site Inspection Checklist in the attachments. On April 19, 2006, representatives of the Army, EPA Region VIII and Utah DEQ conducted interviews and inspections of the OU1 and OU4 groundwater treatment systems. The purpose of the site inspection was to obtain familiarity with the site, review administrative records, examine the treatment system equipment and operations and associated documentation, assess the protectiveness of the remedies, and conduct interviews. No significant issues were identified during the site inspection that involve the treatment systems, institutional controls or treatment building security. The land use of the site and adjacent properties remained the same. No activities that would violate the institutional controls were observed. The Business Depot is continuing to develop the site with new buildings, roads, utilities and other infrastructure.
40
The treatment systems and associated wells remain in good condition and secured. The treatment system at OU1 remains shut down as part of the Non Operational Test. The OU1 plant is being well maintained. The treatment buildings for OU4 and OU4 Hot Spot are functioning properly. The treatment buildings were all clean and in good order. The administrative record is intact, contains historic reports and documents, and is located in the Boyer Building. Interviews Interviews were conducted with site representatives, regulators, and treatment system operators to assess the site history, current conditions, and remedy effectiveness. Refer to the Interview Report in the attachments. The following individuals were interviewed to obtain information and their perspectives. Name Title Organization Jim Kiefer Environmental Scientist EPA Region VIII Muhammad Slam Engineer Utah, DEQ Larry McFarland TEAD and Army, TEAD DDHU Environmental Manager Ross Sollars Project Manager AEEC Ed Larrat O&M Manager AEEC Marc Sydow Geologist USACE April Fontaine Project Manager USACE Paul Feldman Program Manager USACE Gary Benvenuto Hydrogeologist USACE All interviewees indicated that the remediation work at DDHU was successful and continues to be protective of human health and the environment. Deed restrictions are utilized as part of the institutional controls. No unusual situations or problems for the site were reported. The transformation of this former depot into a successful business park via the BRAC process has been achieved. AEEC personnel indicated to the USACE in March 2006 that there were two ongoing issues regarding maintenance of the OU1 and OU4/OU4 Hotspot wellfield wells and piping. The first is that there is the constant threat to the buried wellfield piping of being impacted during excavation and grading work by business depot developer’s contractors. Apparently some contractors are not aware of the existence of wellfield piping at their construction site. AEEC makes frequent inspections of construction sites near wellfield piping and notifies contractors of the piping locations. In addition, AEEC frequently inspects monitoring and treatment system well installations that are near active construction projects to try and avoid or minimize damage to them, and ensure that damage wells and protective structures are repaired quickly. The bollards, monitoring wells and treatment system well vaults are particularly vulnerable to damage in the northern part of the OU4 wellfield. This area is adjacent to the Ogden fairgrounds and is used to park horse trailers during rodeos.
41
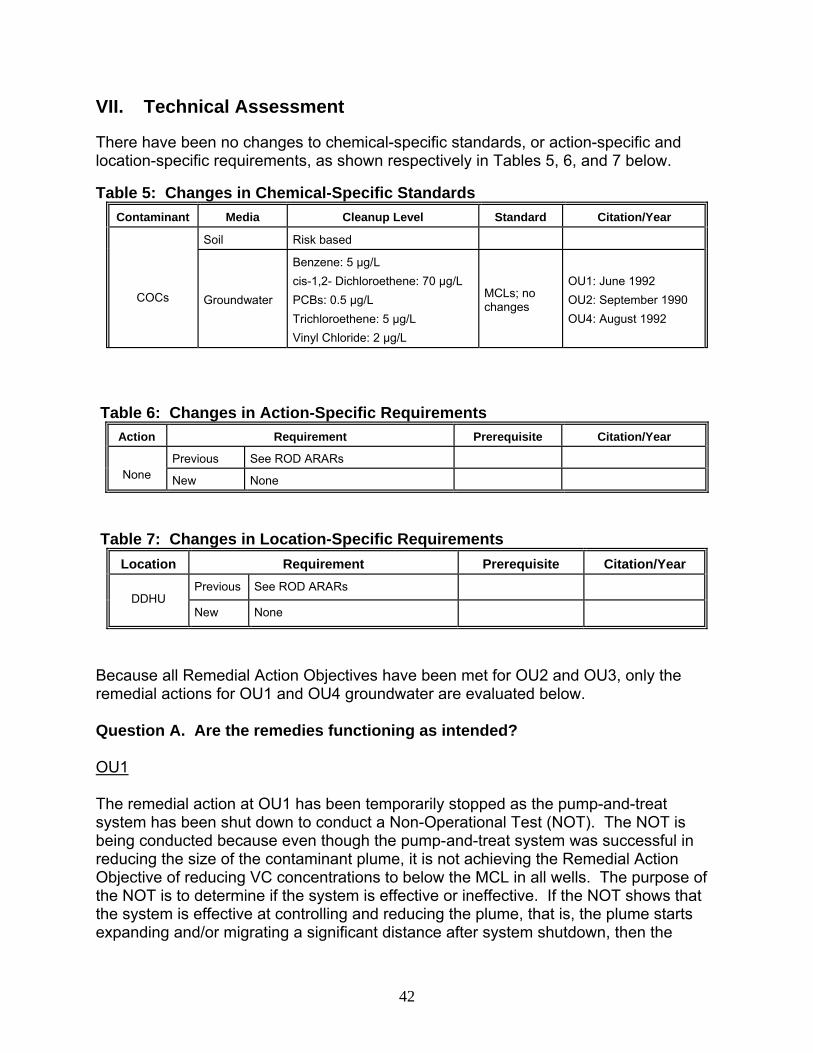
VII. Technical Assessment
There have been no changes to chemical-specific standards, or action-specific and location-specific requirements, as shown respectively in Tables 5, 6, and 7 below. Table 5: Changes in Chemical-Specific Standards
Contaminant Media Cleanup Level Standard Citation/Year
Soil Risk based
COCs Groundwater
Benzene: 5 µg/L cis-1,2- Dichloroethene: 70 µg/L PCBs: 0.5 µg/L Trichloroethene: 5 µg/L Vinyl Chloride: 2 µg/L
MCLs; no changes
OU1: June 1992 OU2: September 1990 OU4: August 1992
Table 6: Changes in Action-Specific Requirements
Action Requirement Prerequisite Citation/Year
Previous See ROD ARARs None New None
Table 7: Changes in Location-Specific Requirements
Citation/Year Location Requirement Prerequisite Previous See ROD ARARs
DDHU New None
Because all Remedial Action Objectives have been met for OU2 and OU3, only the remedial actions for OU1 and OU4 groundwater are evaluated below. Question A. Are the remedies functioning as intended? OU1 The remedial action at OU1 has been temporarily stopped as the pump-and-treat system has been shut down to conduct a Non-Operational Test (NOT). The NOT is being conducted because even though the pump-and-treat system was successful in reducing the size of the contaminant plume, it is not achieving the Remedial Action Objective of reducing VC concentrations to below the MCL in all wells. The purpose of the NOT is to determine if the system is effective or ineffective. If the NOT shows that the system is effective at controlling and reducing the plume, that is, the plume starts expanding and/or migrating a significant distance after system shutdown, then the
42
system will be restarted or an alternative, more cost-effective and efficient remedial action will be proposed in a Final ROD amendment. If the NOT shows that the plume remains relatively stable without active extraction of groundwater, and that, therefore, the treatment system is no long functioning effectively, then an alternative remedial measures study may be conducted to determine a more practical and cost-effective remedial alternative. A review of the analytical results for the first seven quarters of the OU1 NOT groundwater sampling, including a qualitative visual examination of the time-series graphs and the baseline and quarterly VC plume maps indicates that the plumes have not started to migrate down gradient, but remain relatively stable (see attached time-series graphs and plume series compilation map). The time-series graphs show that VC concentration trends at 5 compliance monitoring wells are stable but above (or occasionally below) the MCL, and stable and below the MCL at 7 wells. Overall, then, it appears that natural factors such as dispersion, sorption and chemical and biological degradation are preventing the plume from migrating down gradient. The results from the first seven quarters of the NOT suggest that the OU1 pump-and-treat system was no longer reducing VC concentrations. It appears unlikely that continued operation of the system would achieve the Remedial Action Objectives in a cost-effective and timely manner. The OU1 system operated for 11 years, which was more than twice the minimum time frame specified by the ROD (5 years). Injection of an oxidizing agent into the aquifer sediments beneath the former Plain City Canal which was backfilled with waste from a disposal/burn pit at OU4, failed to provide any obvious reduction in VC concentrations. It appears that low levels of residual VC, DCE and possibly TCE contamination occur below the watertable that are very difficult to precisely locate. If the Eighth Quarter NOT groundwater monitoring shows that the VC plume continues to be stable, then alternative remedial actions such as monitored natural attenuation will be evaluated, as specified by the NOT Work Plan. The OU1 pump-and-treat system is shut down but being maintained so that if required it can be turned back on in a timely manner. It is anticipated that maintenance of the system will cease during 2008, and the system will be dismantled and removed in 2009. All institutional controls to prevent exposure to contaminated groundwater are in place and functioning properly. However, the pump-and-treat system operator has to remain vigilant and watch for damage or potentially damaging situations because of the large number of City of Ogden or Business Depot contractors excavating and grading in the area of the wellfield and treatment plant. OU4 Kleinfelder West evaluated the feasibility of six remedial action alternatives based on the results of a field investigation of soil and groundwater in the OU4 source area in April 2006. It appears that the current pump-and-treat systems will not be able to the remedial action objective for VC (the MCL) in a cost-effect and timely manner. The
43

OU4 system has been operating for 12 years, or more than twice the minimum time frame specified by the ROD (5 years). The six remedial action alternatives being considered were:
• A permeable reactive barrier (PRB); • Chemical injection in the source area; • Soil vapor extraction (SVE) coupled with air sparging; • Monitored natural attenuation (MNA); • A new groundwater extraction trench similar to the OU4 Hotspot trench as an
alternative to the existing pump-and-treat system; and • Optimization of the current pump-and-treat system (including evaluating the
possibility of discharging extracted groundwater to the sanitary sewer). Kleinfelder West concluded in their preliminary evaluation report on their OU4 remedial action alternatives investigation (March 2007) that in situ chemical oxidation or chemical dechlorination in the OU4 source area provide the most cost-effective and shortest duration solution to directly remediate the residual contamination that continues to partition into the groundwater. Bench and pilot-scale tests are planned to begin in summer 2007 to evaluate this alternative. They also concluded that monitored natural attenuation was the most cost-effective alternative for remediating contaminated groundwater. It may be necessary to implement more than one of these remedial action alternatives to achieve the objectives. The OU4 and OU4 Hotspot treatment systems are operating efficiently and being well maintained. However, controlling the biofouling at the injection wells requires extraordinary effort (cleaning every one to three weeks) and is an issue that should be investigated. Since the Draft Five-Year Review was submitted, USACE directed AEEC to redevelop four injection and one extraction wells in the OU4 source area to determine if this procedure could effective increase flow rates. This work was performed in June 2007, and early indications are promising. AEEC has recently reduced the amount of the descaling agent, sodium hexametaphosphate added to the influent to determine if it is enhancing bacterial growth. Pneumatic purging of both extraction and injection piping is now conducted approximately quarterly to mitigate in-piping biofouling. The OU4 Hotspot extraction trench remains very effective at preventing the toe of the OU4/OU4 Hotspot plume from migrating offsite to the west. Institutional controls are in place and prevent exposure of contaminated groundwater and soil to potential receptors. However, the integrity of the treatment system piping and wells and monitoring wells is under constant threat because of the large scale of road, utilities and building construction activities occurring at the Business Depot as part of a development plan.
44
Question B. Are the exposure assumptions, toxicity data, cleanup levels, and remedial action objectives used at the site at the time of remedy selection still valid? Exposure Pathways: Contaminated soil and fill materials and soil vapors at OU1 and OU4, and contaminated groundwater at OU1 and OU4 represent potential pathways for exposure of susceptible populations. The indoor air pathway for vapors from contaminated soil and groundwater have become a greater concern with the EPA since the last Five Year Review. However, the EPA or other Federal and State agencies have not yet issued guidelines on how to evaluate this exposure pathway. With respect to contaminated soil at OU1 and OU4/OU4 Hotspot, no new or changed exposure pathways or human or ecological receptors have been identified. Hypothetical receptors that could potentially be exposed to soil and soil vapor contaminants at OU1 and OU4 are onsite construction workers and business employees. However, removal of contaminated soils at OU1 and OU4 has effectively isolated contaminants in vadose-zone soils from potential direct human exposure. Therefore, surface and near-surface soils at OU1 and OU4 do not represent a completed receptor exposure pathway. At the OU4 Hotspot source area, however, shallow contaminated soil (and groundwater) remains beneath an undelineated portions of the warehouse Buildings 15-C and 16-C immediately east and west of the former disposal/burn pit. It is important that the institutional controls here be maintained and that the warehouse users and the City of Ogden continue to observe them to protect against direct exposure. No known completed exposure pathways currently exist from the domestic use of groundwater. However, exposure of off-site residents and onsite workers is considered to be a potential future exposure pathway, and to represent viable exposure routes through ingestion, inhalation, and dermal exposure. The primary migration route and potential exposure pathway for COCs associated with OU1 and OU4 is groundwater with dissolved VOCs moving advectively to potential downgradient receptors. It is unlikely, however, that this shallow, low yield aquifer would be used as a domestic water supply, and use of groundwater is regulated by the State of Utah (via issuance of well drilling permits).
There have been no changes to cleanup standards (MCLs) or ARARs. No new contaminants or unanticipated toxic byproducts of the remedies have been identified. There have been no physical changes to the site that would affect the protectiveness of the remedies. The remedial action objectives for groundwater at OU1 and OU4 were defined by the ROD as the MCLs and were not based on a site-specific risk assessment. Thus, although there have been changes to the values for toxicity parameters and contaminant properties in the past 5 years, the applicable MCLs have not been modified, and therefore the protectiveness of the remedies for groundwater
45
contamination has not changed. Recent changes in the toxicity parameters, contaminant properties and risk assessment methodology would probably lead to a revision of the soil cleanup goals at the OU4 Hotspot. However, the only contaminated soil remaining at the OU4 Hotspot after the excavations were completed in January 1999 is that beneath Buildings 15C and 16C. A revision of soil cleanup goals would not affect the protectiveness of the selected remedy because the regulators consider the buildings’ concrete floors to be low-permeability caps that effectively make the pathway from the contaminated soil to the occupants of the buildings incomplete. As long as the floors of the buildings are periodically examined and remain intact, there is no evident pathway for vapor intrusion into the buildings. Question C. Has any other information come to light that could call into question the protectiveness of the remedy? No new ecological risks have been identified at the site. There have been no impacts on the protectiveness of the remedies from natural disasters, changing conditions, or continued site development (apart from the severing of an extraction pipeline at OU1 in December 2002). There is no other information that calls into question the protectiveness of the remedies at DDHU. Technical Assessment Summary Based on a review of the groundwater monitoring data, a site inspection and interviews, the OU4 pump-and-treat remedy for contaminated groundwater is operating as intended by the OU4 ROD and ROD Amendment, in terms of containing the contamination. The OU1 pump-and-treat system has been at least temporarily shut down as part of a Non-operational test. Both pump-and-treat systems have not achieved the remedial action objectives of reducing the concentrations of COCs to less than their MCLs. There have been no changes in the physical conditions of the site that would affect the protectiveness of the remedies. All the remedial action objectives and ARARs for soil have been met at OU1 and OU2. However, at OU4 they have not because soil above and below the water table with higher concentrations of VOCs were not completely excavated at the main source area. Furthermore, residual and very thin layer of floating oil with significant concentrations of VOCs remain in a smear zone. At the OU4 Hotspot former Oil Pit, contaminated soil remains beneath the eastern part of Building 16C and western part of Building 15C. The Army, UDEQ and EPA agreed that these soils are capped by the buildings’ concrete slabs and do not require additional remediation. The remedial action objectives and ARARs for groundwater at OU2 have been met. At OU1 and OU4 they have not because VC concentrations remain above the MCL. There have been no changes to cleanup standards. There is no other information that questions the protectiveness of the remedies at DDHU.
46

47
VIII. Issues Table 8 below summarizes the main issues and concerns described above. Corresponding recommendations and follow-up actions are discussed in Section IX. Table 8: Issues
Issues Affects Current
Protectiveness (Y/N)
Affects Future Protectiveness
(Y/N)
Potential exposure of construction/utility workers during soil excavation activities to contaminated groundwater in extraction wellfield piping at OU4
N N
Potential exposure of warehouse/construction workers at Buildings 15C and 16C to vapors from contaminated soil/groundwater beneath the buildings. This pathway is incomplete as long as the concrete slab floors remain intact and impervious
N N
The OU1 pump-and-treat system doesn’t appear capable of achieving Remedial Action Objective (reducing vinyl chloride concentrations to <MCLs) after operating 11 years, and no longer appears necessary to contain the plume
N Y
The OU4 pump-and-treat system doesn’t appear capable of achieving Remedial Action Objective (reducing vinyl chloride concentrations to <MCLs) in a cost-effective, timely manner after 12 years of operation
N Y
The OU4 Hotspot extraction trench must continue to operate to prevent offsite migration of vinyl chloride from the unremediated part of the Hotspot source area beneath Building 16C and 15C
N Y
Integrity and security of OU1 and OU4 monitoring and treatment system wells and well vaults are at risk because of construction activities and RV/horse trailer parking (OU4 source area)
N N
Bacterial fouling of injection wells and injection/extraction piping at OU4 (and OU1 when in operation); possible biofouling of OU4 Hotspot extraction trench
N N
IX. Recommendations and Follow-up Actions Recommendations and follow-up actions are provided below in Table 9 to increase the effectiveness and protectiveness of the remedy, reduce long-term costs, promote technical improvement and achieve site closeout in a cost-effective timely manner.
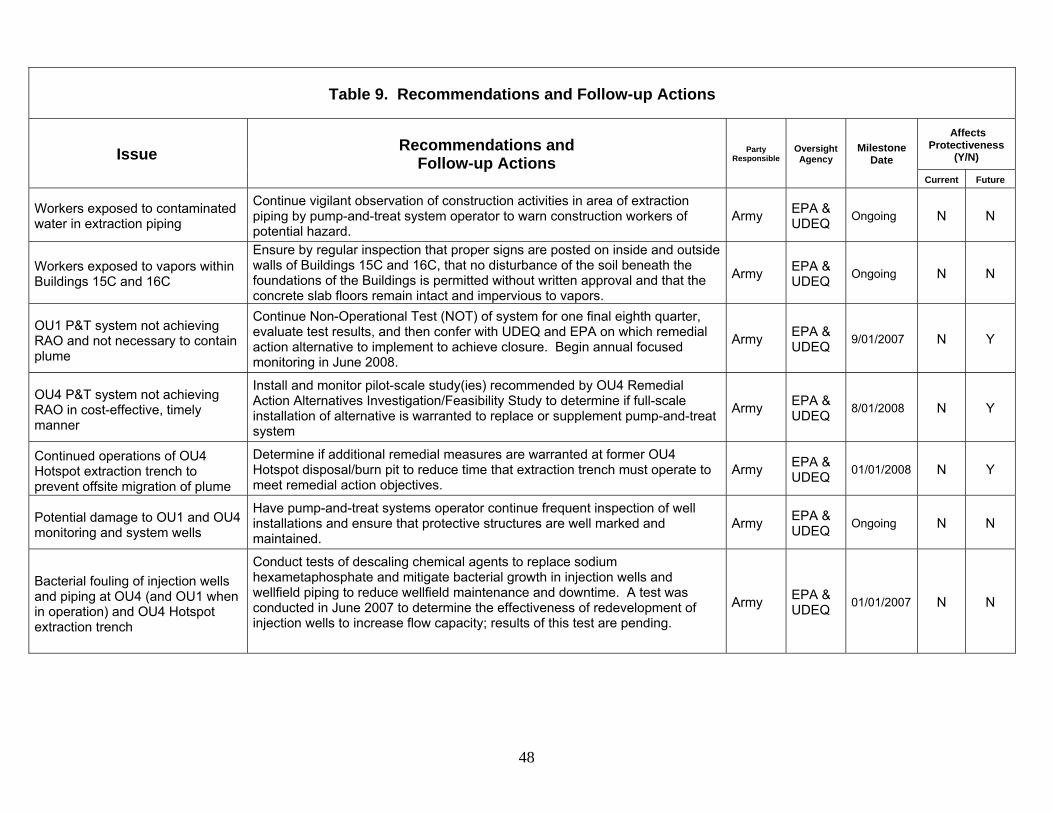
48
Table 9. Recommendations and Follow-up Actions
Affects Protectiveness
(Y/N) Issue Recommendations and Follow-up Actions
Party Responsible
Oversight Agency
Milestone Date
Current Future
Workers exposed to contaminated water in extraction piping
Continue vigilant observation of construction activities in area of extraction piping by pump-and-treat system operator to warn construction workers of potential hazard.
Army EPA & UDEQ Ongoing N N
Workers exposed to vapors within Buildings 15C and 16C
Ensure by regular inspection that proper signs are posted on inside and outside walls of Buildings 15C and 16C, that no disturbance of the soil beneath the foundations of the Buildings is permitted without written approval and that the concrete slab floors remain intact and impervious to vapors.
Army EPA & UDEQ Ongoing N N
OU1 P&T system not achieving RAO and not necessary to contain plume
Continue Non-Operational Test (NOT) of system for one final eighth quarter, evaluate test results, and then confer with UDEQ and EPA on which remedial action alternative to implement to achieve closure. Begin annual focused monitoring in June 2008.
Army EPA & UDEQ 9/01/2007 N Y
OU4 P&T system not achieving RAO in cost-effective, timely manner
Install and monitor pilot-scale study(ies) recommended by OU4 Remedial Action Alternatives Investigation/Feasibility Study to determine if full-scale installation of alternative is warranted to replace or supplement pump-and-treat system
Army EPA & UDEQ 8/01/2008 N Y
Continued operations of OU4 Hotspot extraction trench to prevent offsite migration of plume
Determine if additional remedial measures are warranted at former OU4 Hotspot disposal/burn pit to reduce time that extraction trench must operate to meet remedial action objectives.
Army EPA & UDEQ 01/01/2008 N Y
Potential damage to OU1 and OU4 monitoring and system wells
Have pump-and-treat systems operator continue frequent inspection of well installations and ensure that protective structures are well marked and maintained.
Army EPA & UDEQ Ongoing N N
Bacterial fouling of injection wells and piping at OU4 (and OU1 when in operation) and OU4 Hotspot extraction trench
Conduct tests of descaling chemical agents to replace sodium hexametaphosphate and mitigate bacterial growth in injection wells and wellfield piping to reduce wellfield maintenance and downtime. A test was conducted in June 2007 to determine the effectiveness of redevelopment of injection wells to increase flow capacity; results of this test are pending.
Army EPA & UDEQ 01/01/2007 N N

X. Protectiveness Statements The remedies at OU1 and OU4/OU4 Hotspot, DDHU Ogden site are considered protective of human health and the environment in the short-term because institutional controls are preventing exposure to, or the ingestion of, contaminated groundwater and soil. All threats at the site have been addressed through excavation and disposal of contaminated soil, and maintenance of warehouse concrete slab floors capping remaining contaminated soil at the OU4 Hotspot, with warning signs posted at the warehouses. In addition, pump-and-treat system operations contain the groundwater contamination and prevent it from migrating offsite. However, in order to meet the long term remedial action objectives at OU1 and OU4 in a cost-effective and timely manner, the following actions are recommended:
• Complete the Eighth Quarter of OU1 Non-Operational Test (NOT) of the pump-and-treat system, evaluate the test results, and confer with UDEQ and EPA on which remedial action alternative should be implemented to achieve closure;
• At OU4, install and monitor the pilot-scale study or studies recommended by the Remedial Action Alternatives Investigation/Feasibility Study of the main source area to determine if full-scale installation(s) of the alternative(s) should replace or supplement the pump-and-treat system; and
• Determine if additional remedial measures are warranted at the former OU4 Hotspot disposal/burn pit to reduce the time that extraction trench must operate to meet the remedial action objective.
Long-term protectiveness of the remedial actions will be verified by continuing semi-annual monitoring of the OU4 plume and interim quarterly monitoring of the OU1 plume followed by annual monitoring beginning June 2008. The remedy at OU2 is protective of human health and the environment because remedial measures were implemented that resulted in all remedial action objectives being met. Remedial measures included excavation and removal of contaminated soil at the two former fire-training/burn pits, injection of a carbon source into the floor of the excavation, and installation of a permeable reactive barrier wall of vegetable oil just down gradient of the burn pits. XI. Next Review The next five-year review for the Defense Distribution Depot Hill, Ogden, Utah is required by July 2012, five years from the date of regulator concurrence with the protectiveness statements in this review.
49

Attachments Site Maps List of Documents Reviewed
Tables of Groundwater Sample Analytical Results and Time vs. Concentration Graphs Documenting Remedy Performance
Interview Report Site Inspection Checklist Photos Documenting Site Conditions SWMUs and other Sites ARARs for OU1, OU2 and OU4 Quitclaim Deed Former DDOU July 2000
Site Maps, Groundwater Elevation Contour Maps and Vinyl Chloride Contour Maps
DDHU Regional Map
DDHU OU Map
OU1 Location Map
OU1 Site Map
OU2 Site Map
OU4 Location Map
OU1 GW Elev Contours 3/12/2007
OU1 VC Plume 3/2007
OU1 VC Plumes June 2005 - March 2007
OU4 GW Elev Contours 12/2005
OU4 VC Contours 01/2005
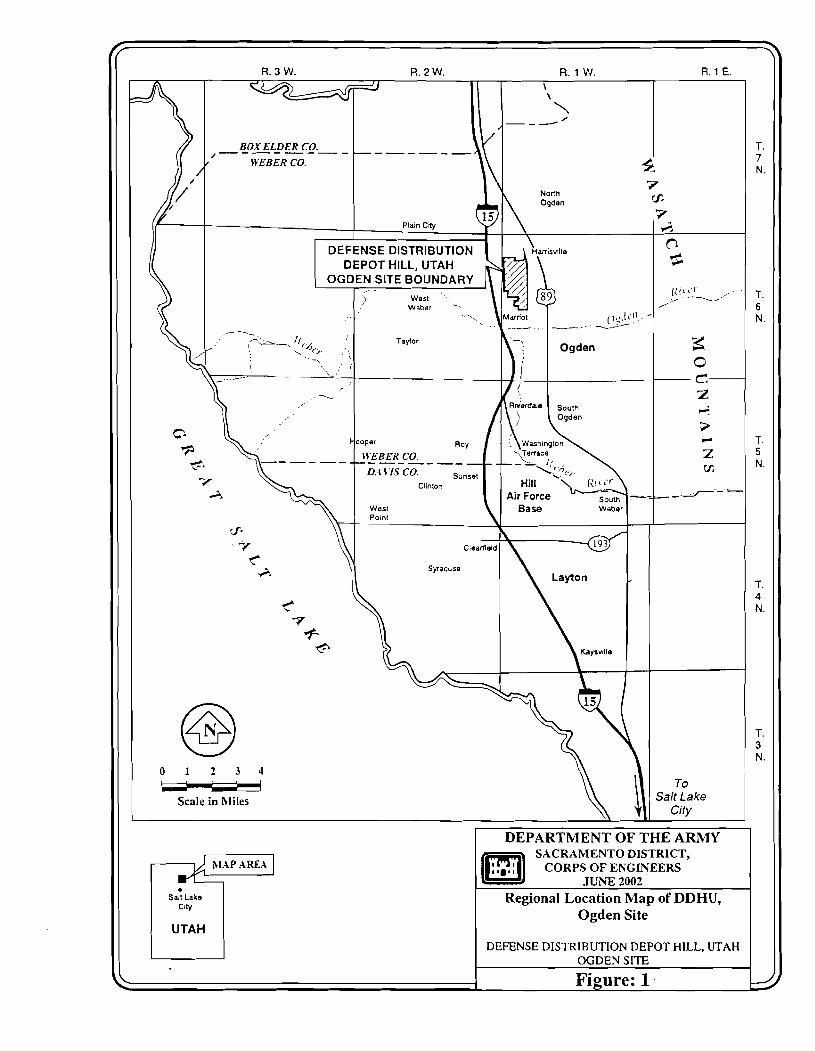
R. 3 W. R. 2 W. R. 1 W. R. 1 E. \ \
\ /
BOX ELDER CO. ------- T. I - - -
WEBER CO. $ 7 N.
NOrIh 7
Ogden C n
Plain Crty 7 a
DEFENSE DISTRIBUTION \ 0 DEPOT HILL, UTAH s
OGDEN SITE BOUNDARY
0 1 2 3 4 - Scale in hliles
DEPARTMENT OF THE ARMY SACRAMENTO DISTRICT,
Regional Location Map of DDHU,
DEFENSE DISTRIBUTION DEPOT HILL. UTAH OGDEN SITE
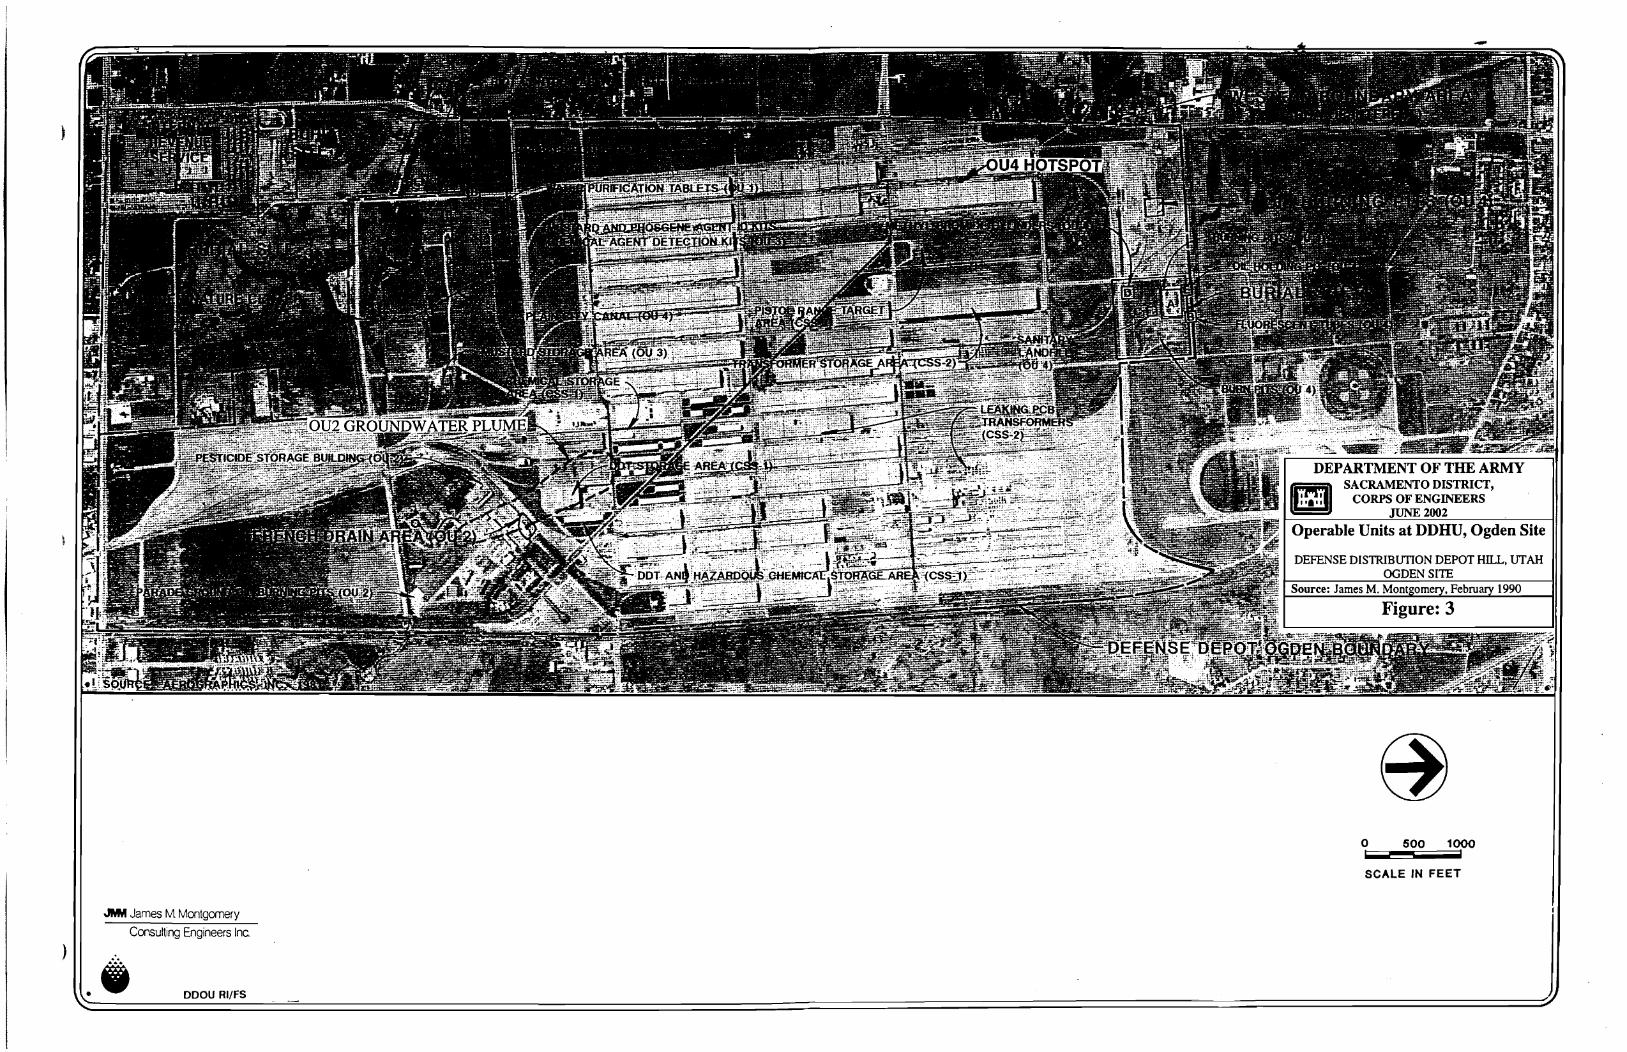
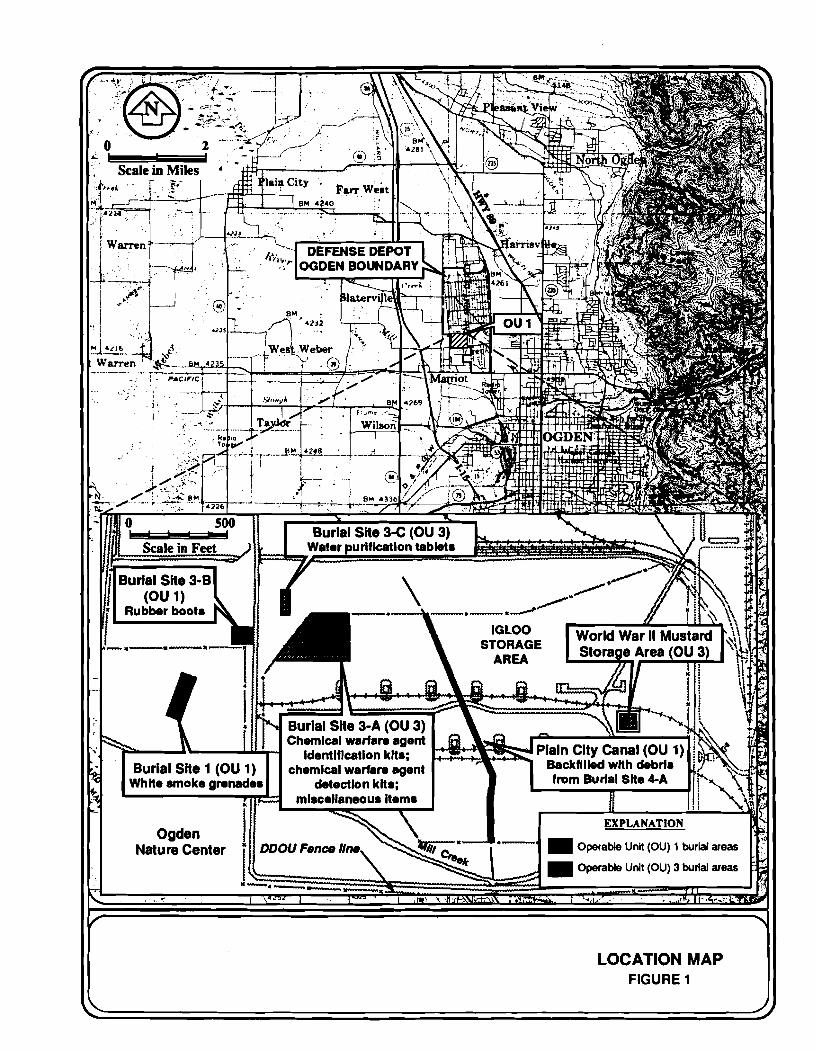
Burial Site 3-8
"-.-a
Operable Unit (OU) 1 burial areas
Operable Unlt (OU) 3 burial areas
LOCATION MAP FIGURE 1
\
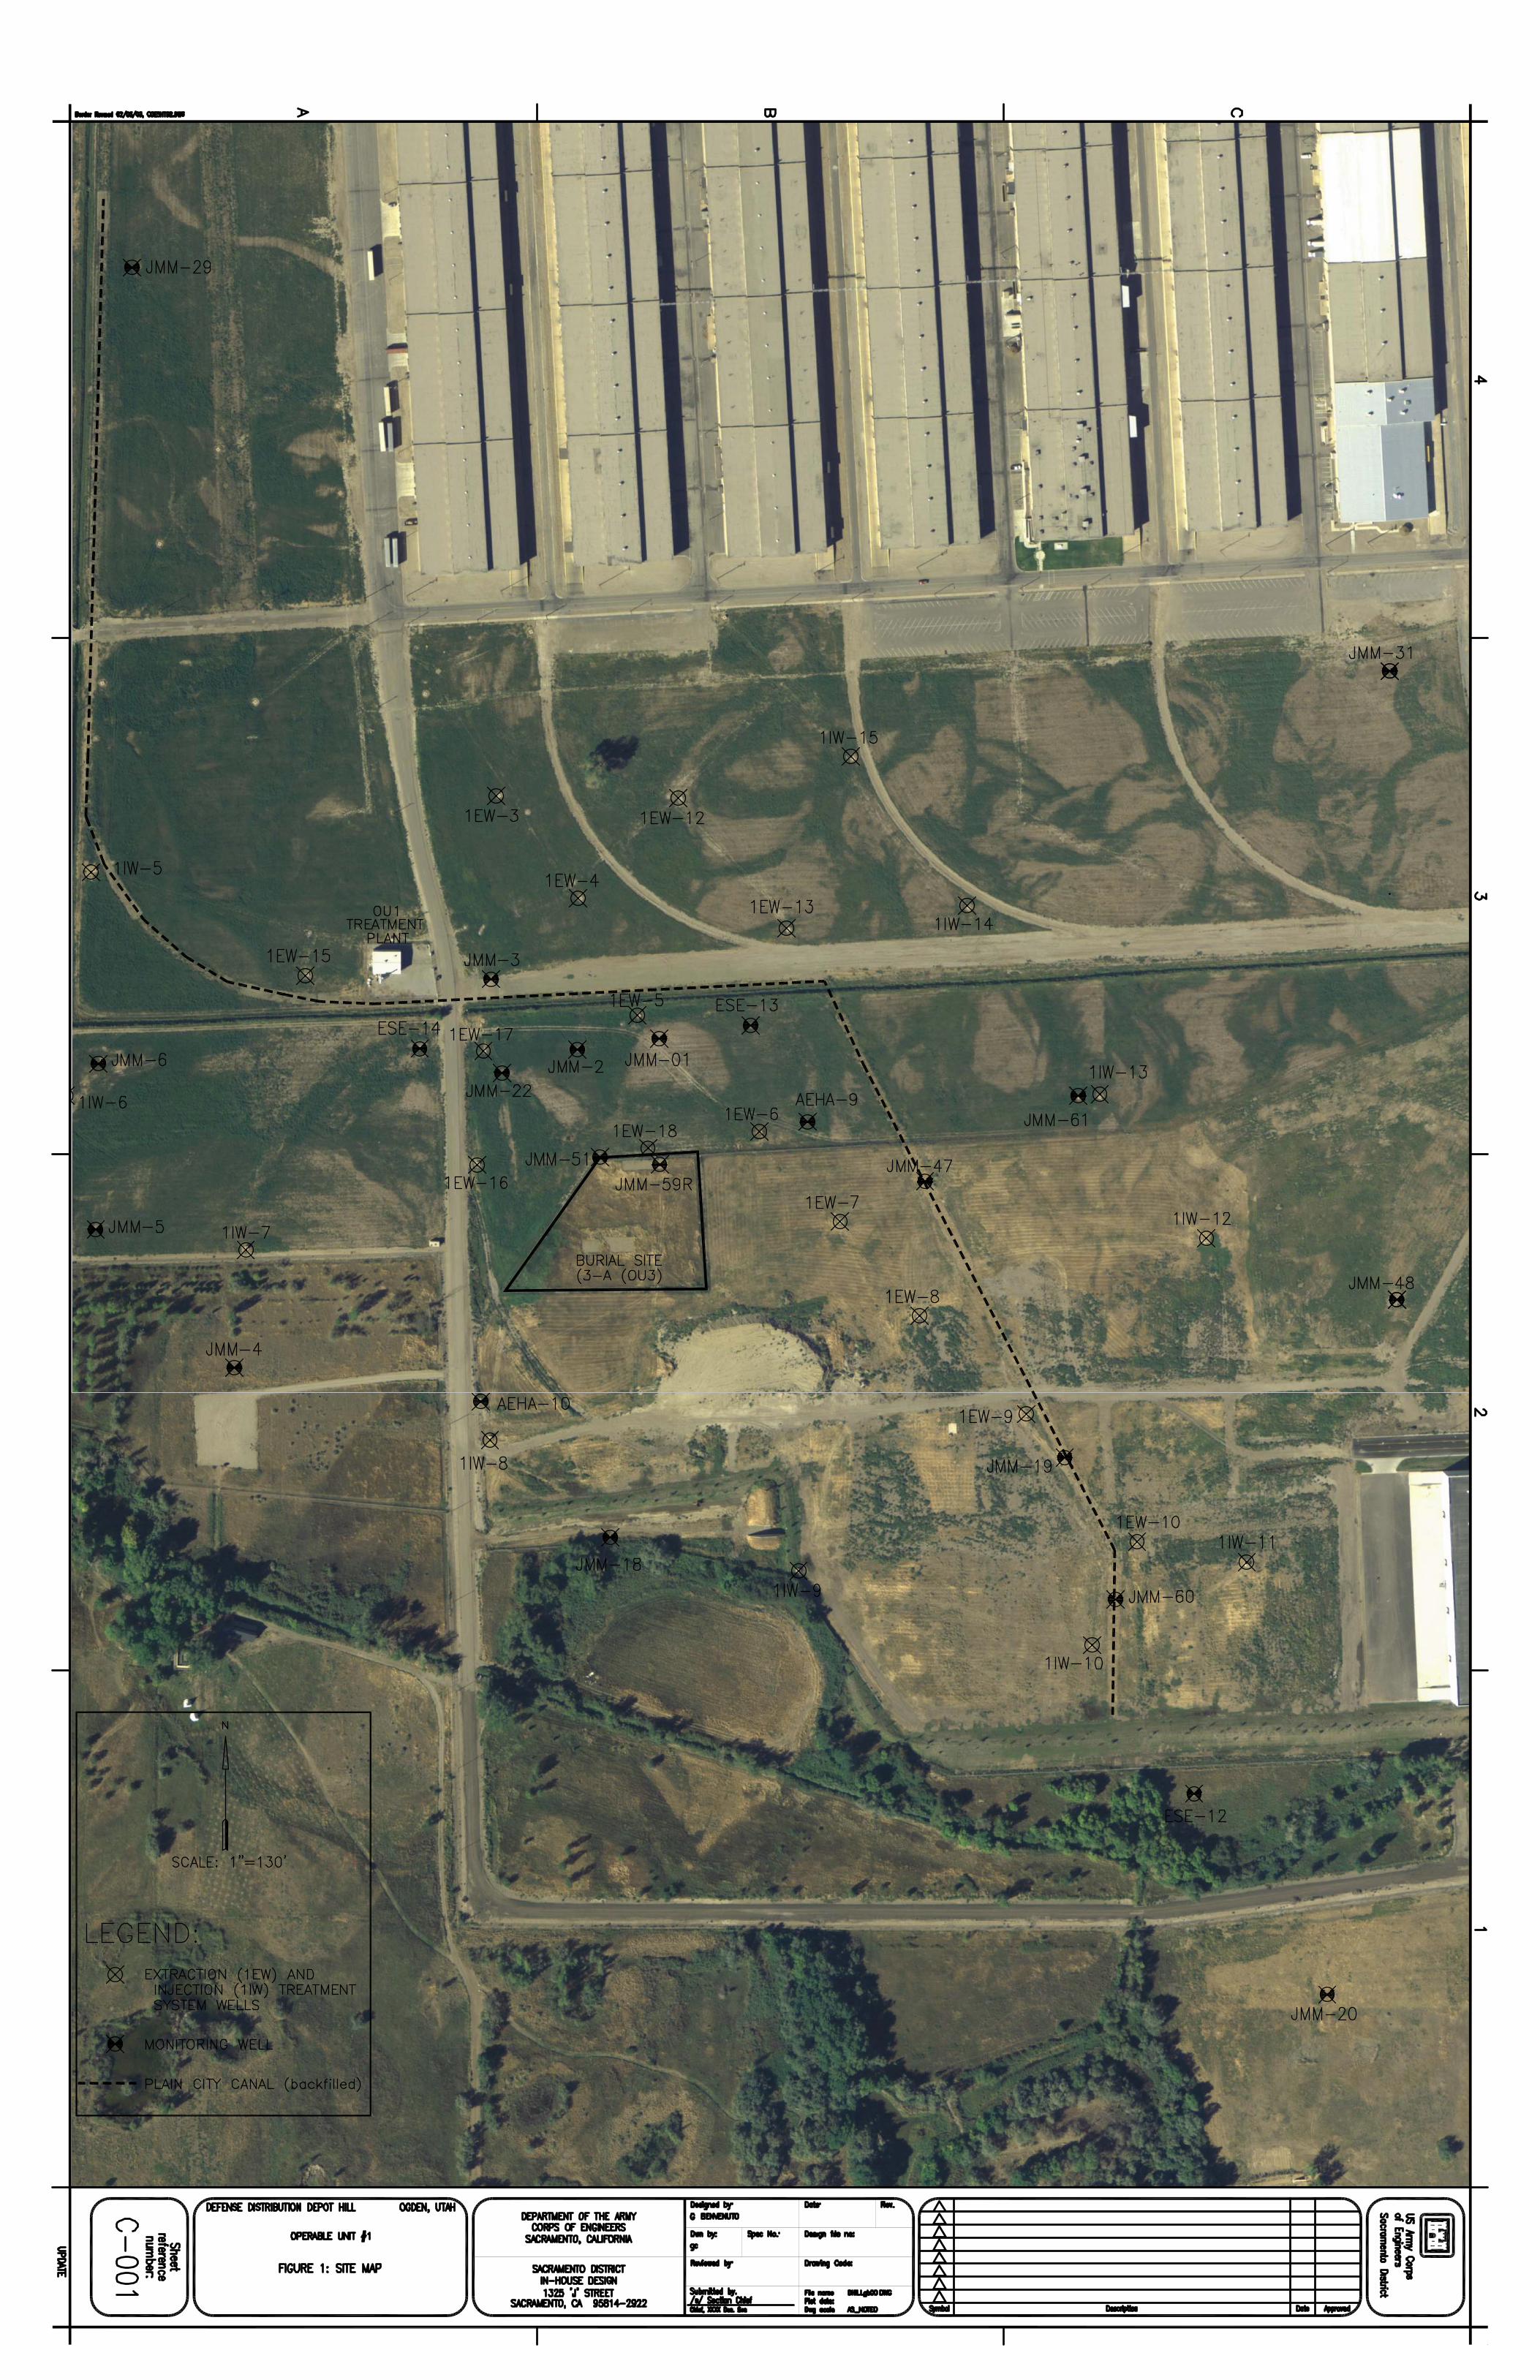
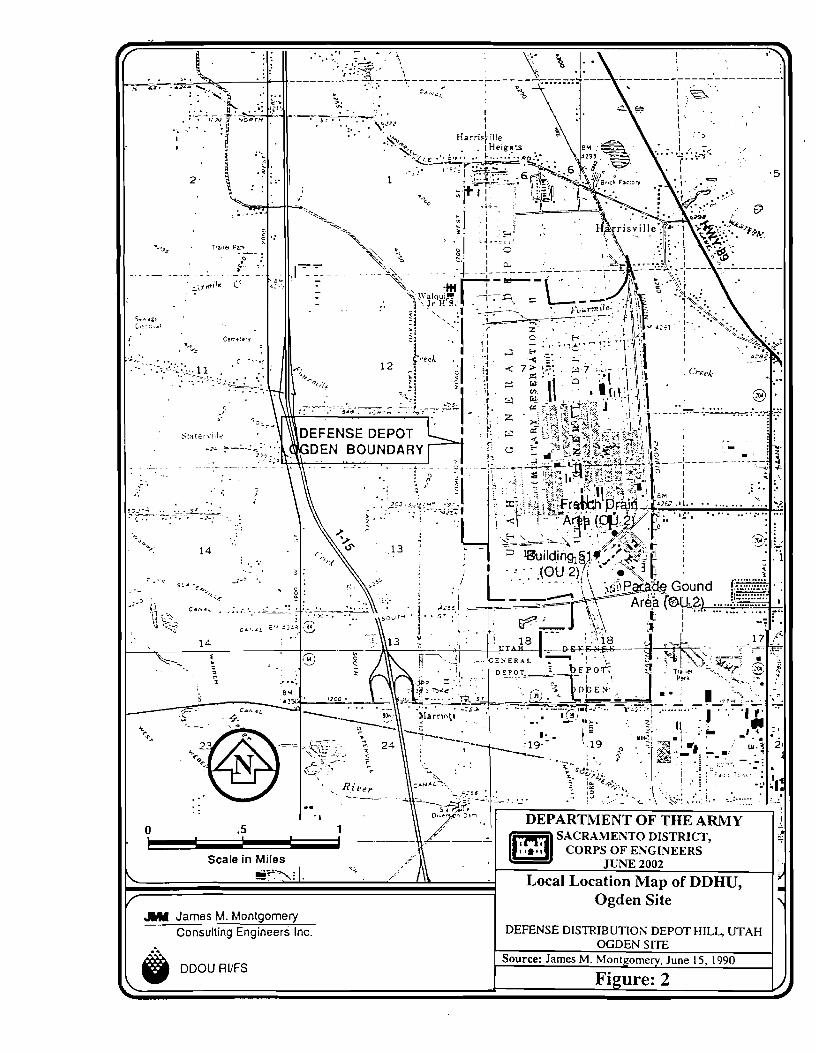
James M. Montgomery Consulting Engineers Inc. DEFENSE DISTR OT HILL, UTAH
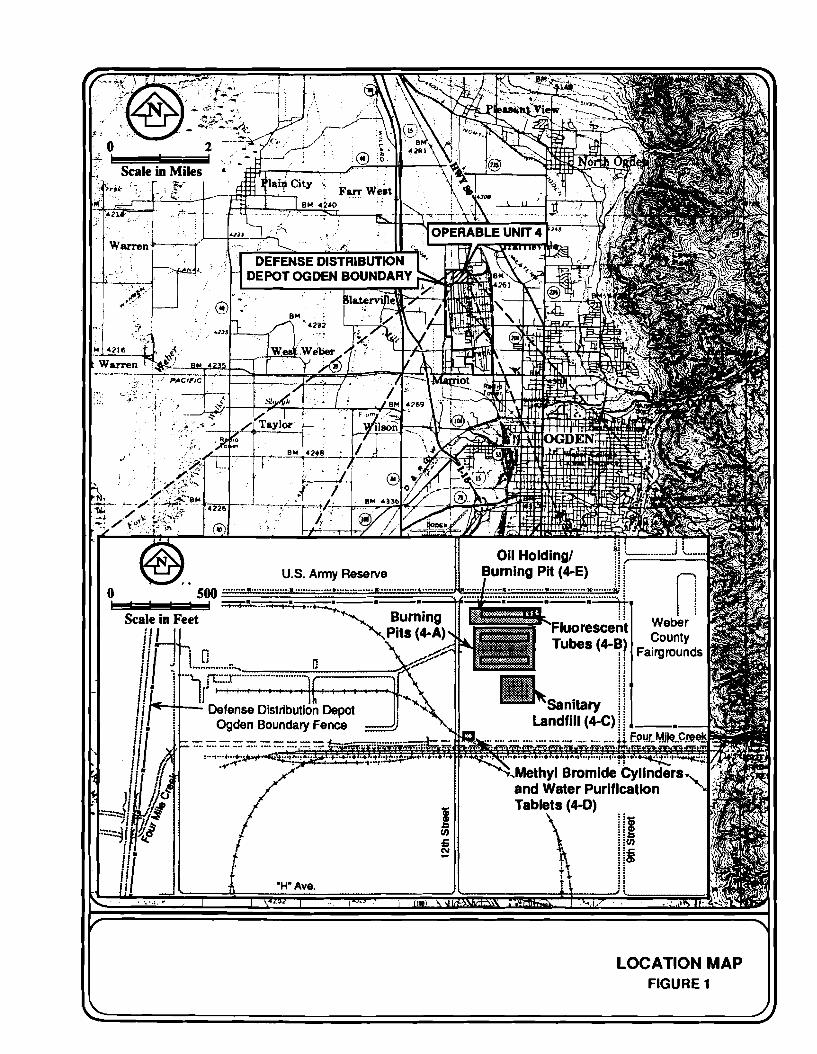
LOCATION MAP FIGURE 1
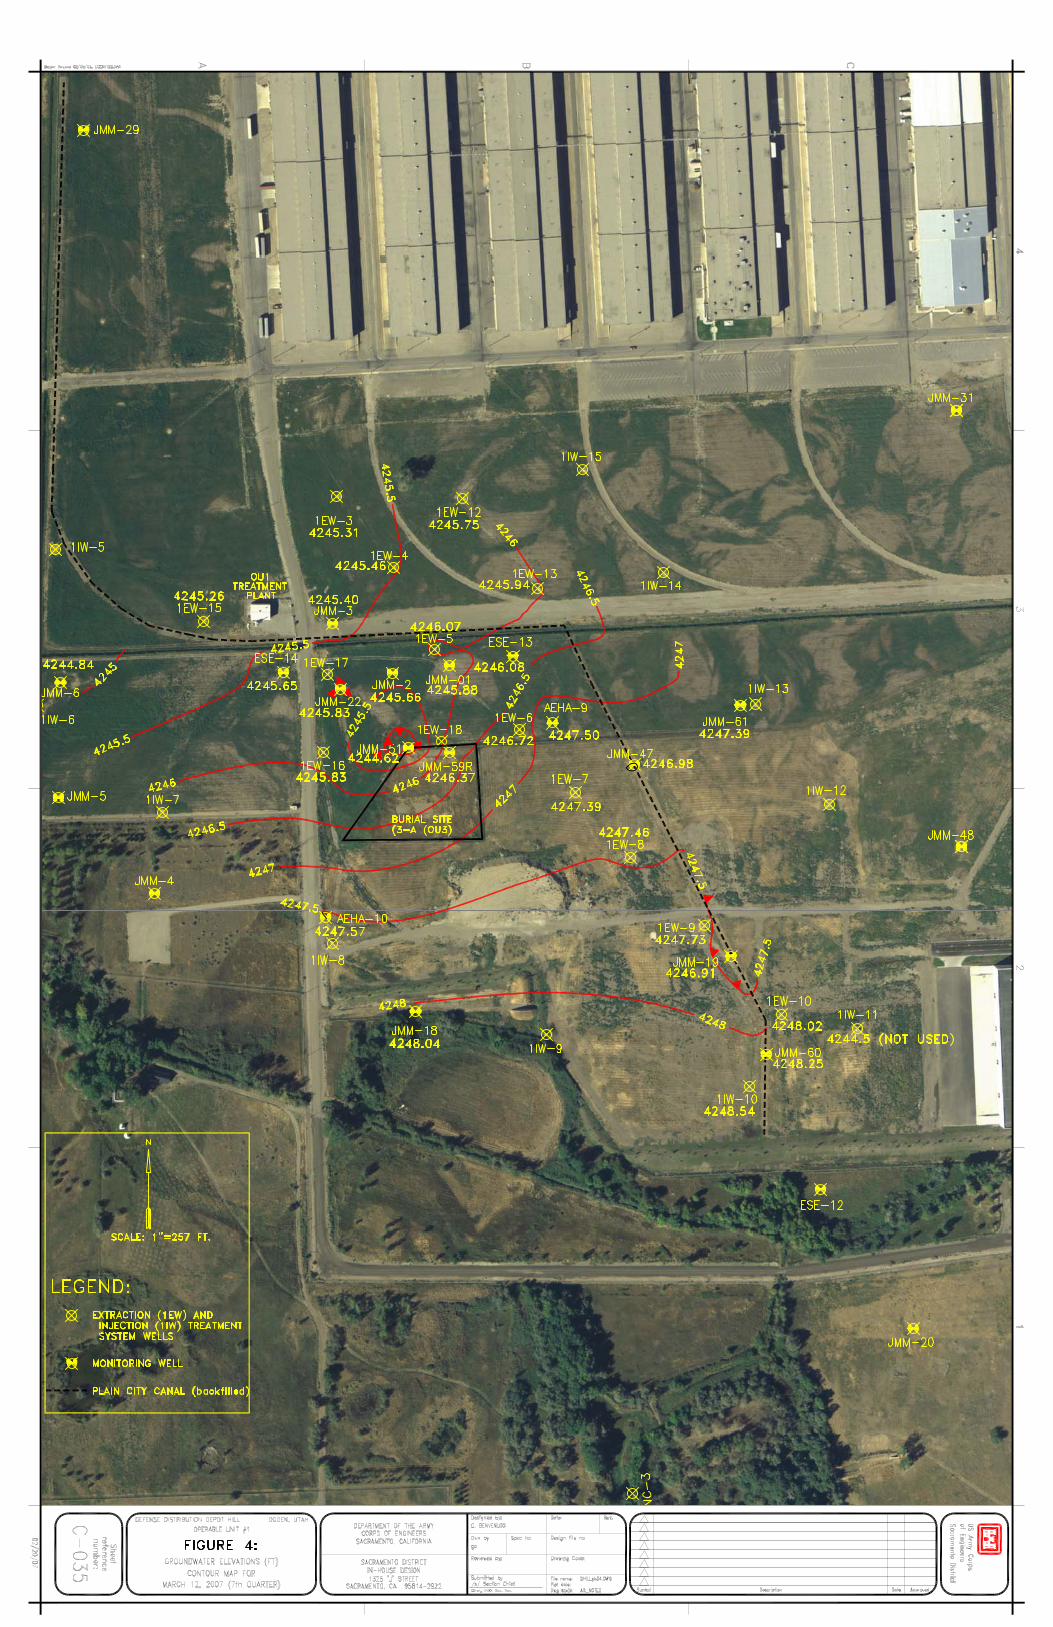
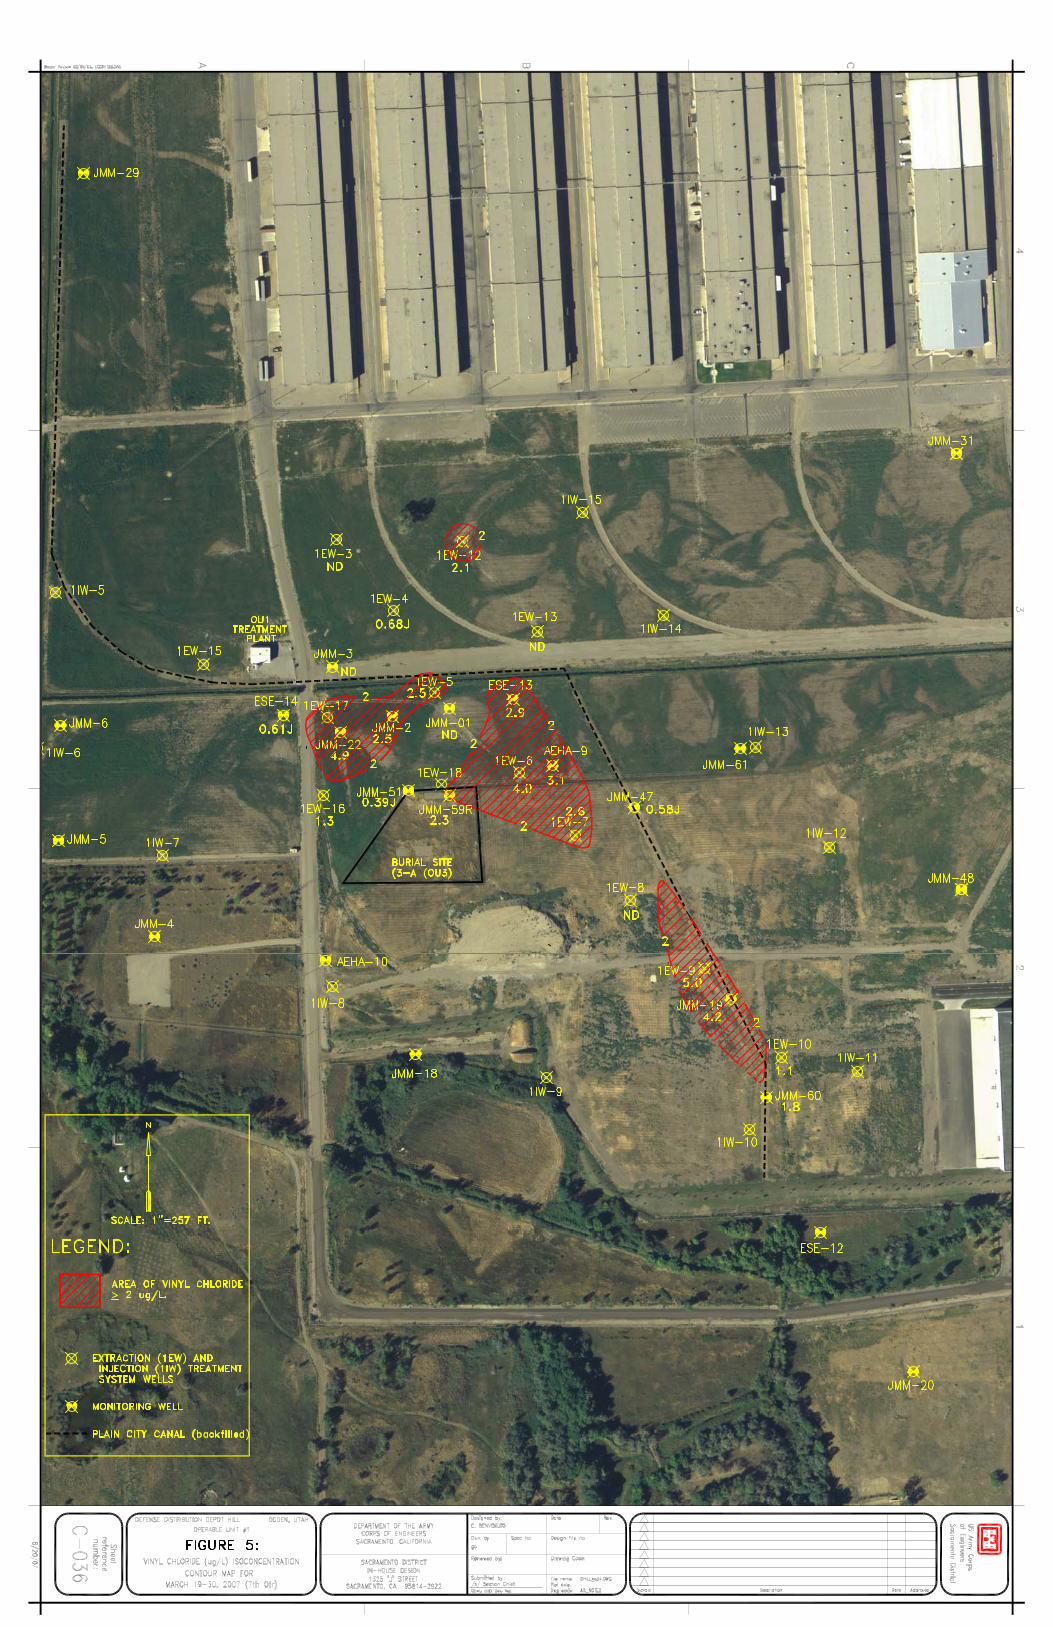
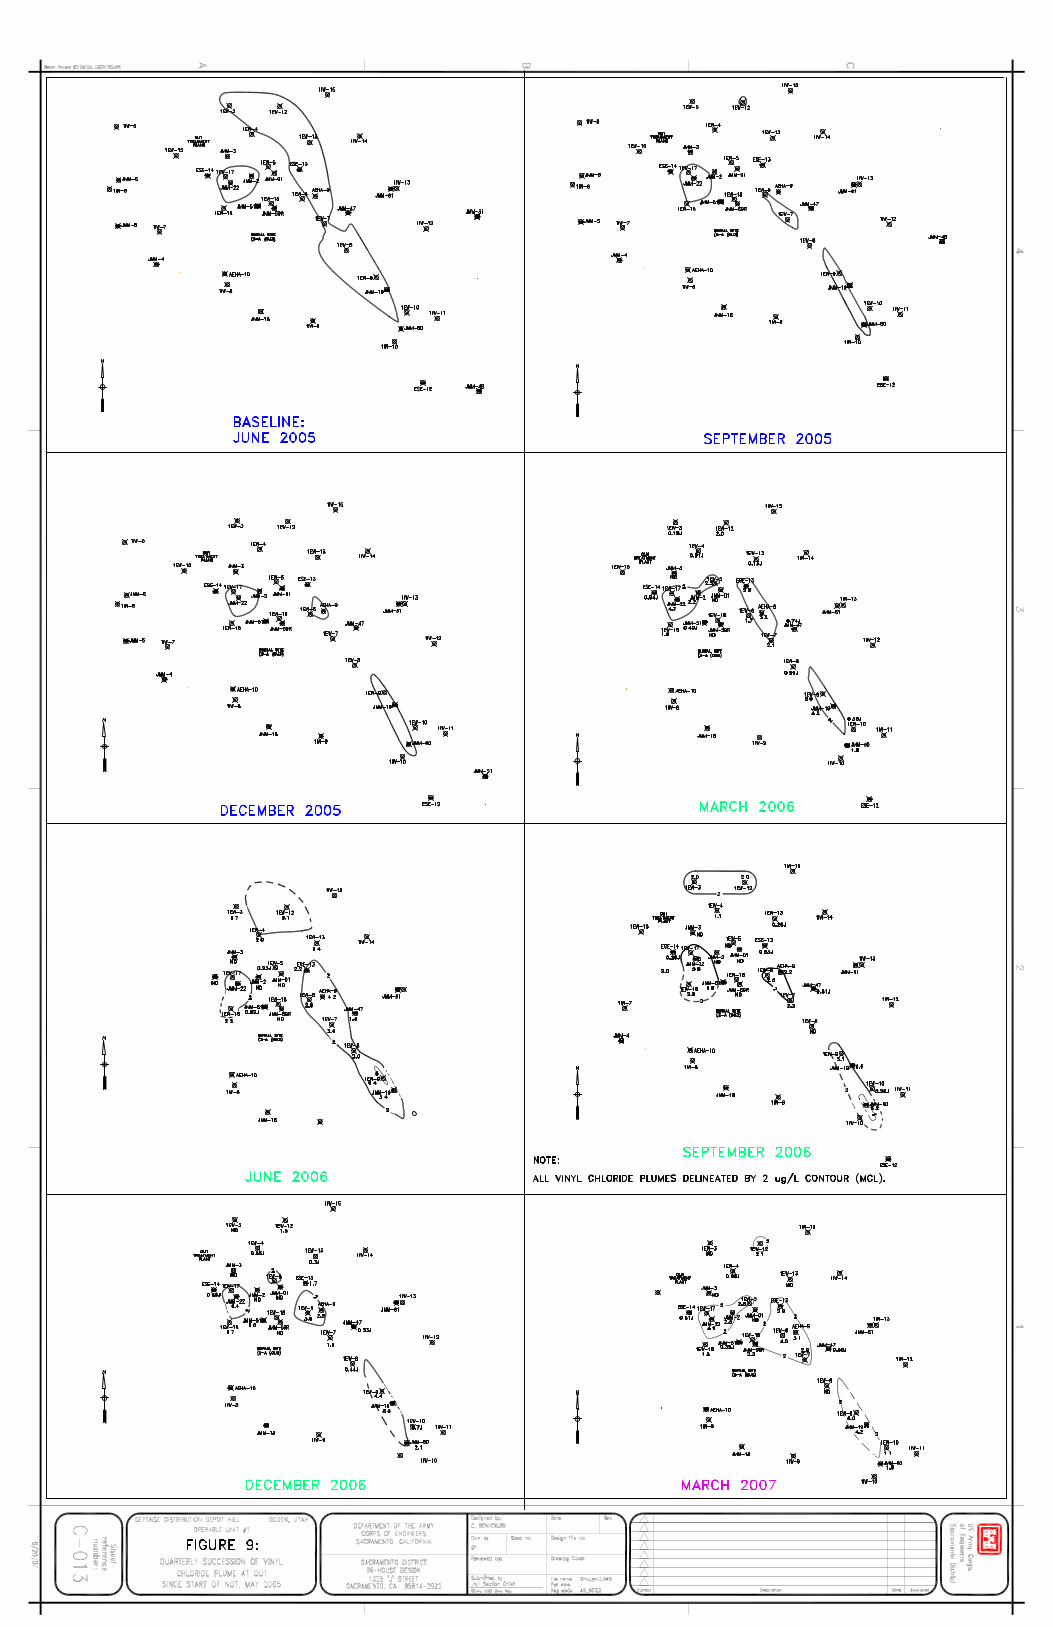
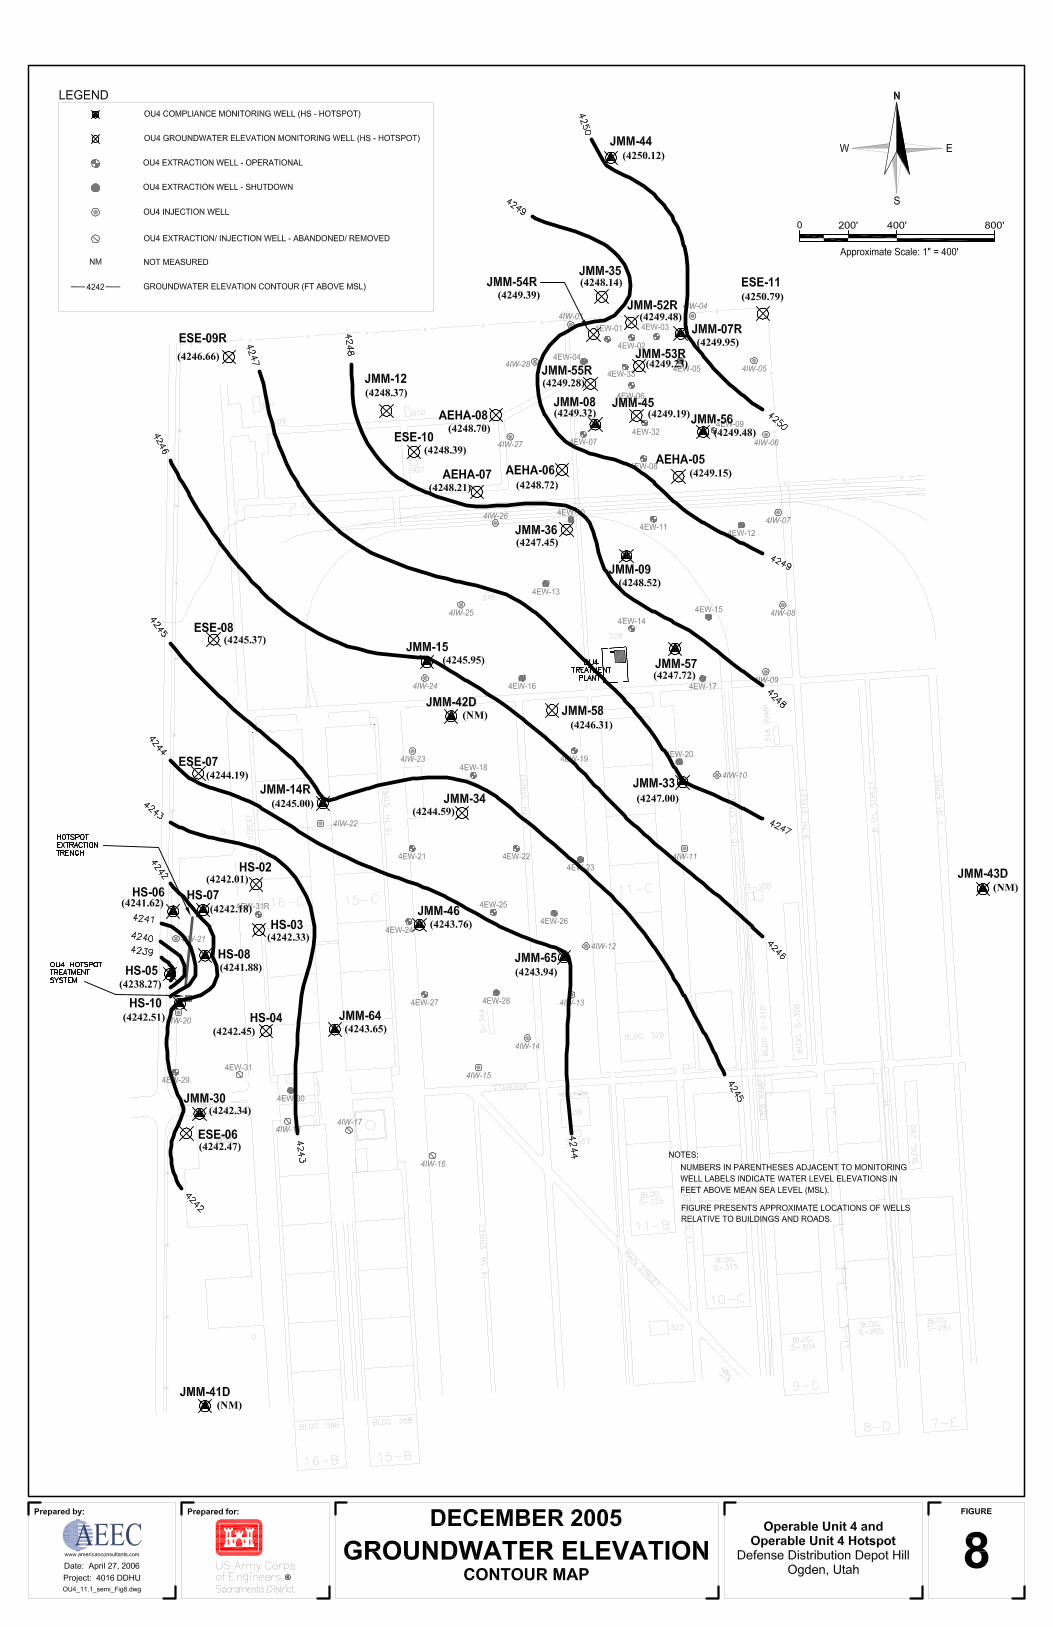

List of Documents Reviewed Baseline Groundwater Monitoring Report, Non-Operation Test of Pump-and-
Operable Unit 1, November 1, 2005, USACE.
1, Defense Kleinfelder.
t,
of ,
den
ot
t
Treat System, DDHU, Ogden Site Defense Distribution Depot Hill Ogden Site, Utah, Final Version 6, BRAC Cleanup Plan, 31 August 2002, Parsons Engineering Science. Federal Facilities Agreement. June 11, 1992.
ield Activity Report, North Wellfield Demolition, Operable Unit FDistribution Depot Hill, Ogden, Utah, July 2005. AEEC/ Field Activity Report, Operable Unit 4 Wellfield, Modifications in Support of
4 HotspoWestgate Realignment Project, Operable Unit 4 and Operable Unit DHU, Ogden, Utah, February 2006, AEEC. D
First Seven Quarters of Groundwater Monitoring Report, Non-Operational TestPump-and-Treat System, DDHU, Ogden Site Operable Unit No. 1, February 10
006 through June 2007, USACE. 2 Five-Year Review Report, Second Five-Year Review Report for the Former Defense Depot Ogden, Ogden, Utah, March 2001. Five-Year Review, Operable Unit 1, Defense Distribution Depot Hill Utah, OgSite, Ogden, Utah, July 1998. Five-Year Review, Operable Unit 2, Defense Distribution Depot Hill Utah, Ogden Site, Ogden, Utah, June 1996. Five-Year Review, Operable Unit 4, Defense Distribution Depot Hill Utah, Ogden Site, Ogden, Utah, September 1998. Groundwater Extraction and Treatment Effectiveness Review, Summary Document, Operable Unit 4 Groundwater Remedial System, DDHU, Plexus Scientific Corporation, March 2005. Ground-Water Monitoring Plan for Operable Unit 1, Defense Distribution DepOgden, Utah, February 17, 1993, James M. Montgomery. Ground-Water Monitoring Plan for Operable Unit 4, Defense Distribution Depot Ogden, Utah, May 1993, James M. Montgomery. Inspection and Maintenance Report, Groundwater Data Tables, Third Quarter, Twelfth Year, Operable Unit 1, Non-Operational Test, Defense Distribution DepoHill Ogden Site, Utah, April 2006, AEEC.
Quarterly Inspection and Maintenance Reports, Operable Unit 1, DDHU, Ogden, UT, March 13, 2006 through May 2, 2007, AEEC.
992.
lder West, INC.
iation of
water and Soil, June 002, USACE.
Hotspot, Groundwater Treatment Systems, DDHU, Ogden, Utah, arch 2006, AEEC.
Record of Decision and Responsiveness Summary for Operable Unit 1, Defense Distribution Depot Hill Ogden Site, Utah, June 10, 1 Record of Decision and Responsiveness Summary for Operable Unit 4, Defense Distribution Depot Hill Ogden Site, Utah, August 3, 1992. Remedial Action Alternative Investigation Preliminary Evaluation Report Operable Unit 4, DDHU, UT, Final, March 1, 2007, Kleinfe Remedial Action Report, DDHU, Ogden Site Operable Unit No. 2, RemedContaminated Groundwater and Soil, June 2002, USACE. Remedial Action Report, Defense Depot, Hill, Utah (DDHU)-Ogden Site, Operable Unit No. 2, Remediation of Contaminated Ground2 Semi-Annual Operations Report, First Half, Eleventh Year, Operable Unit 4 and Operable Unit 4M
Tables of Groundwater Sample Analytical Results and Time vs. Concentration Graphs OU1 Groundwater Data (Time-series graphs for VC, DCE and TCE)
OU1 Groundwater Analytical Data
OU2 Groundwater Data (OU2 Post-Shutdown)
OU2 Groundwater Data
OU4 Groundwater Data (Data tables and time-series graphs for VC and DCE and GW elevations)
OU4 Groundwater Data

7th Quarter Monitoring ReportOU 1 Non-Operational Test
DDHU, Ogden, UT
Aug-98 Jul-99 Jun-05 Sep-05 Dec-05 Mar-06 Jun-06 Sep-06 Dec-06 Mar-07cis-1,2-Dichloroethene (µg/L) 3.6 2.2 2.1 2.9 1.2 1.6 2.4 2.9 1.6 1.3Trichloroethene (µg/L) 0.95 0.5 1 1 0.37 1 1 1 0.49 0.48Vinyl Chloride (µg/L) 0.54 0.8 2.2 1.4 1 0.18 1.7 2.0 1 1
Notes:1 Shaded cell: Analyte not detected above Method Quantitation Limit (MQL); value in cell is MQL for this sample.
MCL for DCE is 70 μg/L, TCE is 5 μg/L, and vinyl chloride is 2 μg/LMCL = Maximum Contaminant Level μg/L = micrograms per literTCE = trichloroethene DCE = cis-1,2-dichloroetheneVC = vinyl chloride
1EW-03
0
1
2
3
4
5
6
Jan-
92
Jul-9
2
Jan-
93
Jul-9
3
Jan-
94
Jul-9
4
Jan-
95
Jul-9
5
Jan-
96
Jul-9
6
Jan-
97
Jul-9
7
Jan-
98
Jul-9
8
Jan-
99
Jul-9
9
Jan-
00
Jul-0
0
Jan-
01
Jul-0
1
Jan-
02
Jul-0
2
Jan-
03
Jul-0
3
Jan-
04
Jul-0
4
Jan-
05
Jul-0
5
Jan-
06
Jul-0
6
Jan-
07
Sample Date
Con
cent
ratio
n (u
g/L)
cis-1,2-Dichloroethene (µg/L) Trichloroethene (µg/L) TCE-MCLVinyl Chloride (µg/L) VC-MCL
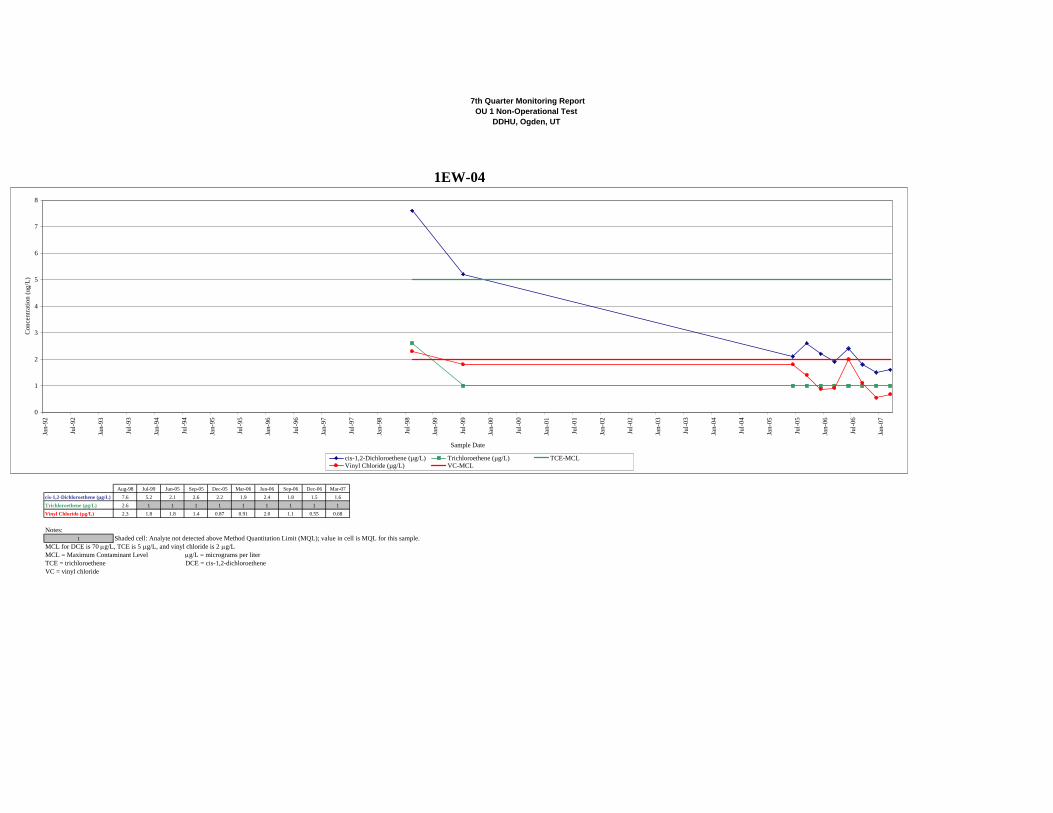
7th Quarter Monitoring ReportOU 1 Non-Operational Test
DDHU, Ogden, UT
Aug-98 Jul-99 Jun-05 Sep-05 Dec-05 Mar-06 Jun-06 Sep-06 Dec-06 Mar-07cis-1,2-Dichloroethene (µg/L) 7.6 5.2 2.1 2.6 2.2 1.9 2.4 1.8 1.5 1.6Trichloroethene (µg/L) 2.6 1 1 1 1 1 1 1 1 1Vinyl Chloride (µg/L) 2.3 1.8 1.8 1.4 0.87 0.91 2.0 1.1 0.55 0.68
Notes:1 Shaded cell: Analyte not detected above Method Quantitation Limit (MQL); value in cell is MQL for this sample.
MCL for DCE is 70 μg/L, TCE is 5 μg/L, and vinyl chloride is 2 μg/LMCL = Maximum Contaminant Level μg/L = micrograms per literTCE = trichloroethene DCE = cis-1,2-dichloroetheneVC = vinyl chloride
1EW-04
0
1
2
3
4
5
6
7
8
Jan-
92
Jul-9
2
Jan-
93
Jul-9
3
Jan-
94
Jul-9
4
Jan-
95
Jul-9
5
Jan-
96
Jul-9
6
Jan-
97
Jul-9
7
Jan-
98
Jul-9
8
Jan-
99
Jul-9
9
Jan-
00
Jul-0
0
Jan-
01
Jul-0
1
Jan-
02
Jul-0
2
Jan-
03
Jul-0
3
Jan-
04
Jul-0
4
Jan-
05
Jul-0
5
Jan-
06
Jul-0
6
Jan-
07
Sample Date
Con
cent
ratio
n (u
g/L)
cis-1,2-Dichloroethene (µg/L) Trichloroethene (µg/L) TCE-MCLVinyl Chloride (µg/L) VC-MCL
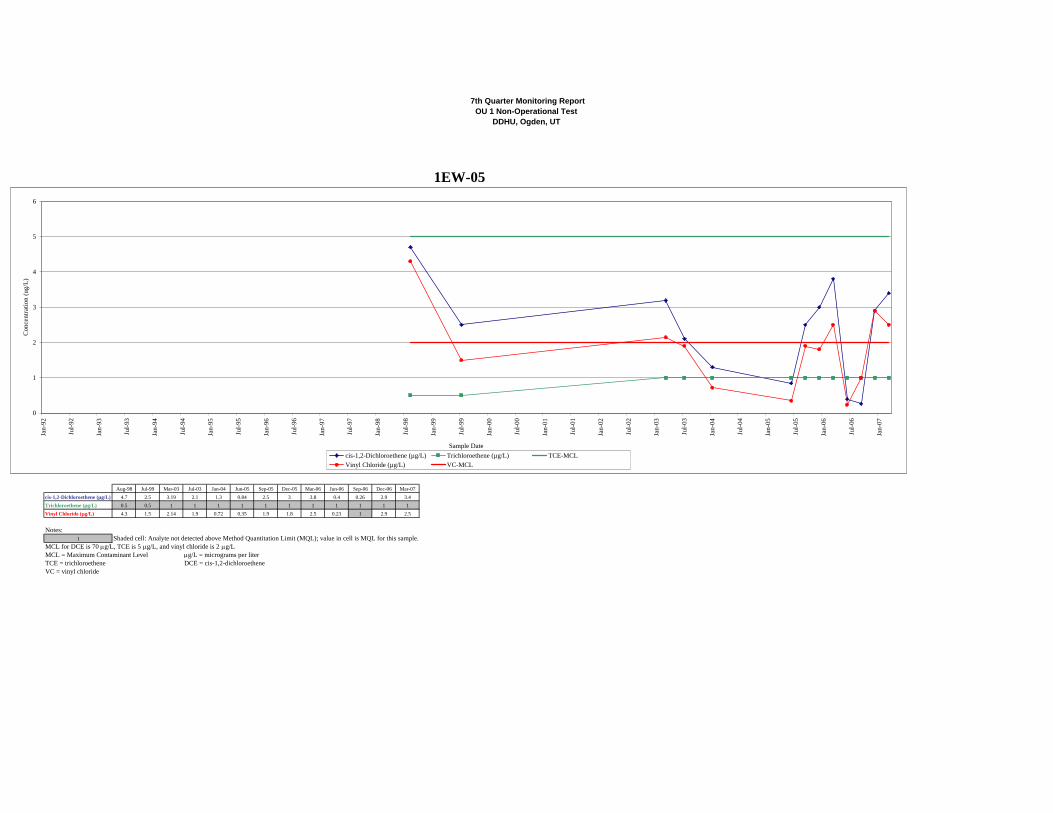
7th Quarter Monitoring ReportOU 1 Non-Operational Test
DDHU, Ogden, UT
Aug-98 Jul-99 Mar-03 Jul-03 Jan-04 Jun-05 Sep-05 Dec-05 Mar-06 Jun-06 Sep-06 Dec-06 Mar-07cis-1,2-Dichloroethene (µg/L) 4.7 2.5 3.19 2.1 1.3 0.84 2.5 3 3.8 0.4 0.26 2.9 3.4Trichloroethene (µg/L) 0.5 0.5 1 1 1 1 1 1 1 1 1 1 1Vinyl Chloride (µg/L) 4.3 1.5 2.14 1.9 0.72 0.35 1.9 1.8 2.5 0.23 1 2.9 2.5
Notes:1 Shaded cell: Analyte not detected above Method Quantitation Limit (MQL); value in cell is MQL for this sample.
MCL for DCE is 70 μg/L, TCE is 5 μg/L, and vinyl chloride is 2 μg/LMCL = Maximum Contaminant Level μg/L = micrograms per literTCE = trichloroethene DCE = cis-1,2-dichloroetheneVC = vinyl chloride
1EW-05
0
1
2
3
4
5
6
Jan-
92
Jul-9
2
Jan-
93
Jul-9
3
Jan-
94
Jul-9
4
Jan-
95
Jul-9
5
Jan-
96
Jul-9
6
Jan-
97
Jul-9
7
Jan-
98
Jul-9
8
Jan-
99
Jul-9
9
Jan-
00
Jul-0
0
Jan-
01
Jul-0
1
Jan-
02
Jul-0
2
Jan-
03
Jul-0
3
Jan-
04
Jul-0
4
Jan-
05
Jul-0
5
Jan-
06
Jul-0
6
Jan-
07
Sample Date
Con
cent
ratio
n (u
g/L)
cis-1,2-Dichloroethene (µg/L) Trichloroethene (µg/L) TCE-MCLVinyl Chloride (µg/L) VC-MCL
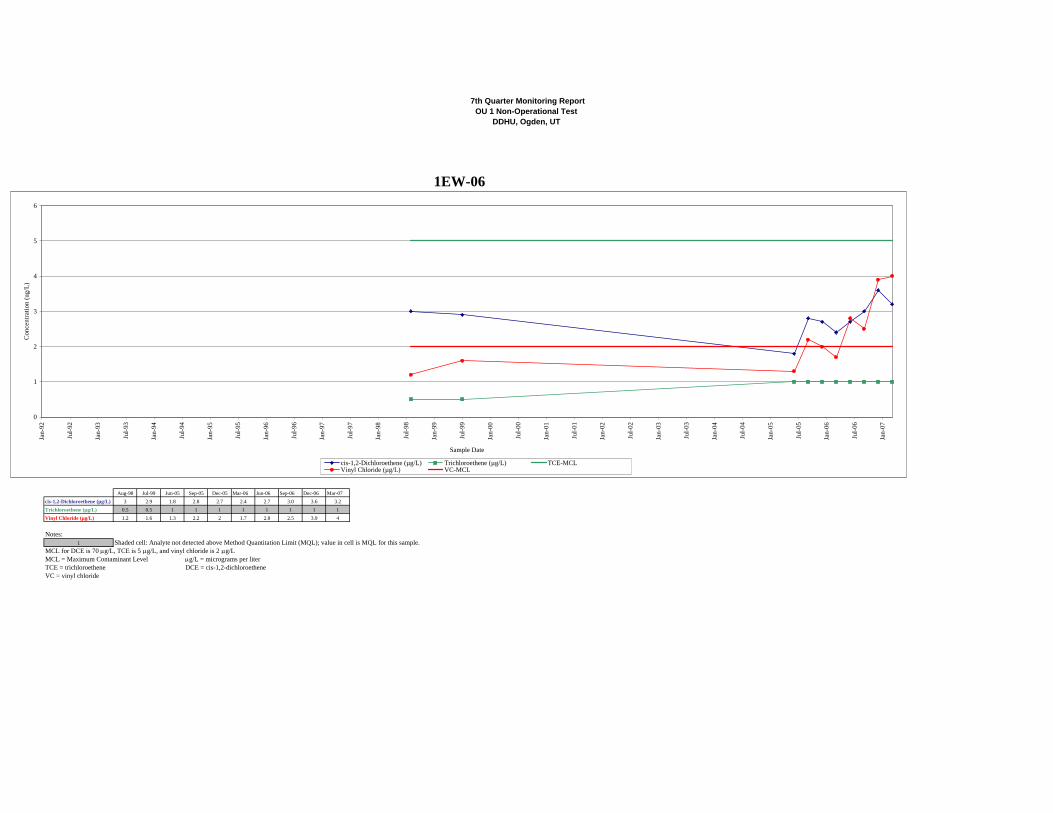
7th Quarter Monitoring ReportOU 1 Non-Operational Test
DDHU, Ogden, UT
Aug-98 Jul-99 Jun-05 Sep-05 Dec-05 Mar-06 Jun-06 Sep-06 Dec-06 Mar-07cis-1,2-Dichloroethene (µg/L) 3 2.9 1.8 2.8 2.7 2.4 2.7 3.0 3.6 3.2Trichloroethene (µg/L) 0.5 0.5 1 1 1 1 1 1 1 1Vinyl Chloride (µg/L) 1.2 1.6 1.3 2.2 2 1.7 2.8 2.5 3.9 4
Notes:1 Shaded cell: Analyte not detected above Method Quantitation Limit (MQL); value in cell is MQL for this sample.
MCL for DCE is 70 μg/L, TCE is 5 μg/L, and vinyl chloride is 2 μg/LMCL = Maximum Contaminant Level μg/L = micrograms per literTCE = trichloroethene DCE = cis-1,2-dichloroetheneVC = vinyl chloride
1EW-06
0
1
2
3
4
5
6
Jan-
92
Jul-9
2
Jan-
93
Jul-9
3
Jan-
94
Jul-9
4
Jan-
95
Jul-9
5
Jan-
96
Jul-9
6
Jan-
97
Jul-9
7
Jan-
98
Jul-9
8
Jan-
99
Jul-9
9
Jan-
00
Jul-0
0
Jan-
01
Jul-0
1
Jan-
02
Jul-0
2
Jan-
03
Jul-0
3
Jan-
04
Jul-0
4
Jan-
05
Jul-0
5
Jan-
06
Jul-0
6
Jan-
07
Sample Date
Con
cent
ratio
n (u
g/L)
cis-1,2-Dichloroethene (µg/L) Trichloroethene (µg/L) TCE-MCLVinyl Chloride (µg/L) VC-MCL
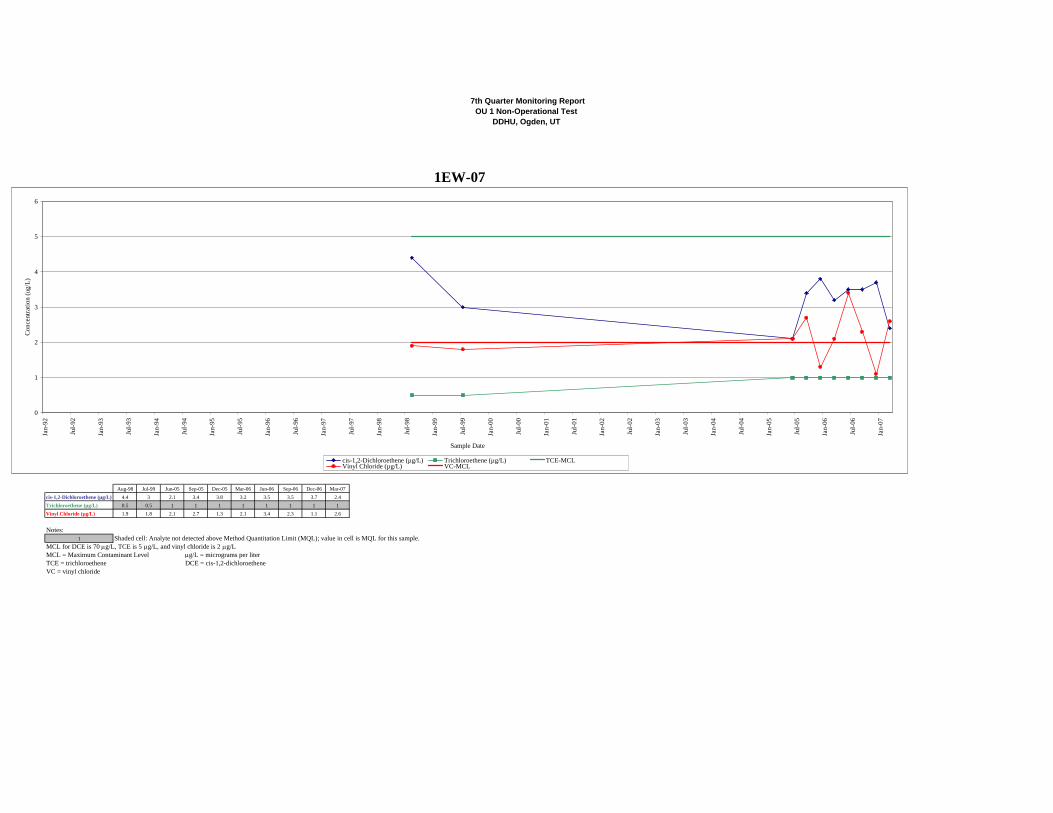
7th Quarter Monitoring ReportOU 1 Non-Operational Test
DDHU, Ogden, UT
Aug-98 Jul-99 Jun-05 Sep-05 Dec-05 Mar-06 Jun-06 Sep-06 Dec-06 Mar-07cis-1,2-Dichloroethene (µg/L) 4.4 3 2.1 3.4 3.8 3.2 3.5 3.5 3.7 2.4Trichloroethene (µg/L) 0.5 0.5 1 1 1 1 1 1 1 1Vinyl Chloride (µg/L) 1.9 1.8 2.1 2.7 1.3 2.1 3.4 2.3 1.1 2.6
Notes:1 Shaded cell: Analyte not detected above Method Quantitation Limit (MQL); value in cell is MQL for this sample.
MCL for DCE is 70 μg/L, TCE is 5 μg/L, and vinyl chloride is 2 μg/LMCL = Maximum Contaminant Level μg/L = micrograms per literTCE = trichloroethene DCE = cis-1,2-dichloroetheneVC = vinyl chloride
1EW-07
0
1
2
3
4
5
6
Jan-
92
Jul-9
2
Jan-
93
Jul-9
3
Jan-
94
Jul-9
4
Jan-
95
Jul-9
5
Jan-
96
Jul-9
6
Jan-
97
Jul-9
7
Jan-
98
Jul-9
8
Jan-
99
Jul-9
9
Jan-
00
Jul-0
0
Jan-
01
Jul-0
1
Jan-
02
Jul-0
2
Jan-
03
Jul-0
3
Jan-
04
Jul-0
4
Jan-
05
Jul-0
5
Jan-
06
Jul-0
6
Jan-
07
Sample Date
Con
cent
ratio
n (u
g/L)
cis-1,2-Dichloroethene (µg/L) Trichloroethene (µg/L) TCE-MCLVinyl Chloride (µg/L) VC-MCL
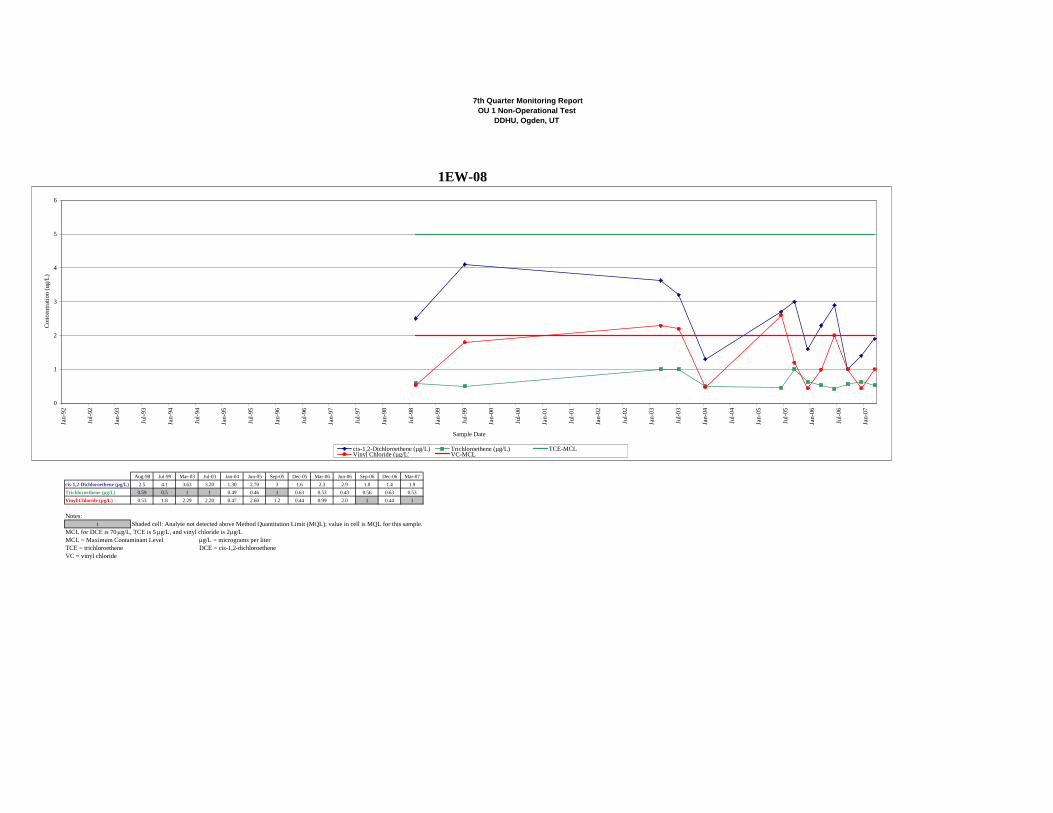
7th Quarter Monitoring ReportOU 1 Non-Operational Test
DDHU, Ogden, UT
Aug-98 Jul-99 Mar-03 Jul-03 Jan-04 Jun-05 Sep-05 Dec-05 Mar-06 Jun-06 Sep-06 Dec-06 Mar-07cis-1,2-Dichloroethene (µg/L) 2.5 4.1 3.63 3.20 1.30 2.70 3 1.6 2.3 2.9 1.0 1.4 1.9Trichloroethene (µg/L) 0.59 0.5 1 1 0.49 0.46 1 0.63 0.53 0.43 0.56 0.63 0.53Vinyl Chloride (µg/L) 0.53 1.8 2.29 2.20 0.47 2.60 1.2 0.44 0.99 2.0 1 0.44 1
Notes:1 Shaded cell: Analyte not detected above Method Quantitation Limit (MQL); value in cell is MQL for this sample.
MCL for DCE is 70 μg/L, TCE is 5 μg/L, and vinyl chloride is 2 μg/LMCL = Maximum Contaminant Level μg/L = micrograms per literTCE = trichloroethene DCE = cis-1,2-dichloroetheneVC = vinyl chloride
1EW-08
0
1
2
3
4
5
6
Jan-
92
Jul-9
2
Jan-
93
Jul-9
3
Jan-
94
Jul-9
4
Jan-
95
Jul-9
5
Jan-
96
Jul-9
6
Jan-
97
Jul-9
7
Jan-
98
Jul-9
8
Jan-
99
Jul-9
9
Jan-
00
Jul-0
0
Jan-
01
Jul-0
1
Jan-
02
Jul-0
2
Jan-
03
Jul-0
3
Jan-
04
Jul-0
4
Jan-
05
Jul-0
5
Jan-
06
Jul-0
6
Jan-
07
Sample Date
Con
cent
ratio
n (u
g/L)
cis-1,2-Dichloroethene (µg/L) Trichloroethene (µg/L) TCE-MCLVinyl Chloride (µg/L) VC-MCL

7th Quarter Monitoring ReportOU 1 Non-Operational Test
DDHU, Ogden, UT
Aug-98 Jul-99 Mar-03 Jul-03 Jan-04 Jun-05 Sep-05 Dec-05 Mar-06 Jun-06 Sep-06 Dec-06 Mar-07cis-1,2-Dichloroethene (µg/L) 7.1 3.1 3.84 2.0 2.4 9.5 4 4.1 4.2 6.5 2.9 4.7 3.4Trichloroethene (µg/L) 0.5 2.1 1 1 0.5 1 1 1 1 1 1 1 1Vinyl Chloride (µg/L) 2.8 0.8 1.57 1.1 0.68 8.1 3 3.2 3 6.4 3.1 4.4 5.0
Notes:1 Shaded cell: Analyte not detected above Method Quantitation Limit (MQL); value in cell is MQL for this sample.
MCL for DCE is 70 μg/L, TCE is 5 μg/L, and vinyl chloride is 2 μg/LMCL = Maximum Contaminant Level μg/L = micrograms per literTCE = trichloroethene DCE = cis-1,2-dichloroetheneVC = vinyl chloride
1EW-09
0
1
2
3
4
5
6
7
8
9
10
Jan-
92
Jul-9
2
Jan-
93
Jul-9
3
Jan-
94
Jul-9
4
Jan-
95
Jul-9
5
Jan-
96
Jul-9
6
Jan-
97
Jul-9
7
Jan-
98
Jul-9
8
Jan-
99
Jul-9
9
Jan-
00
Jul-0
0
Jan-
01
Jul-0
1
Jan-
02
Jul-0
2
Jan-
03
Jul-0
3
Jan-
04
Jul-0
4
Jan-
05
Jul-0
5
Jan-
06
Jul-0
6
Jan-
07
Sample Date
Con
cent
ratio
n (u
g/L)
cis-1,2-Dichloroethene (µg/L) Trichloroethene (µg/L) TCE-MCLVinyl Chloride (µg/L) VC-MCL
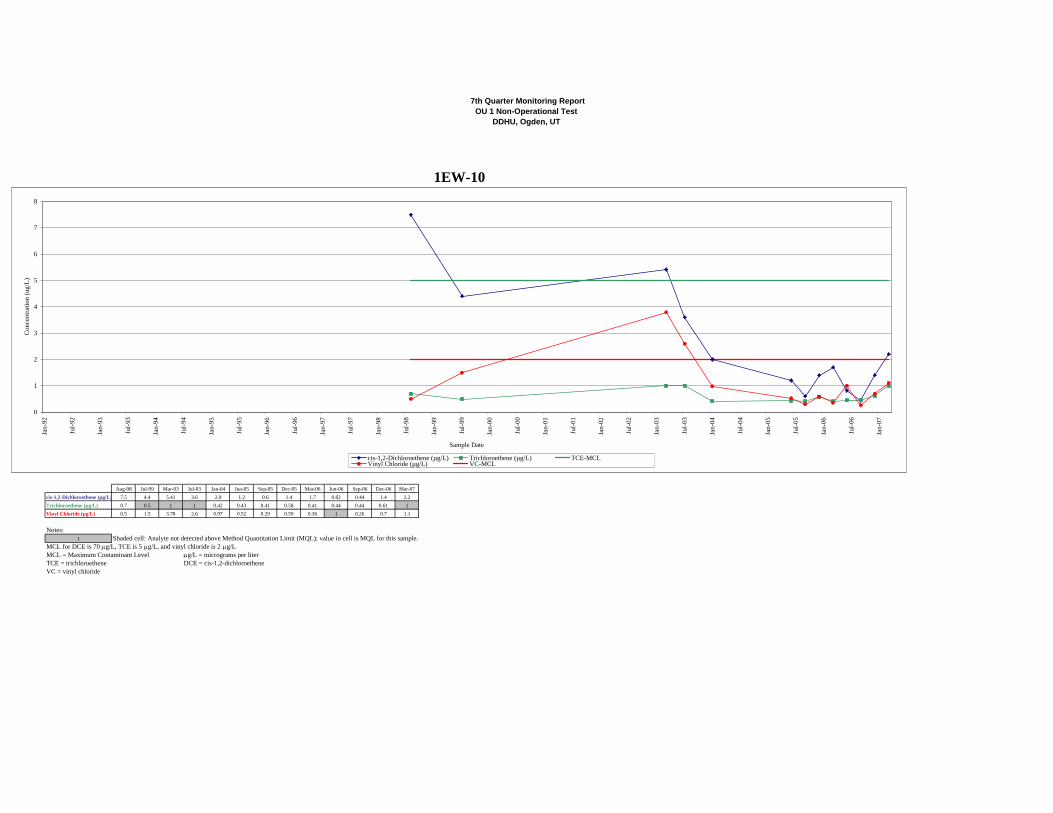
7th Quarter Monitoring ReportOU 1 Non-Operational Test
DDHU, Ogden, UT
Aug-98 Jul-99 Mar-03 Jul-03 Jan-04 Jun-05 Sep-05 Dec-05 Mar-06 Jun-06 Sep-06 Dec-06 Mar-07cis-1,2-Dichloroethene (µg/L) 7.5 4.4 5.41 3.6 2.0 1.2 0.6 1.4 1.7 0.82 0.44 1.4 2.2Trichloroethene (µg/L) 0.7 0.5 1 1 0.42 0.43 0.41 0.58 0.41 0.44 0.44 0.61 1Vinyl Chloride (µg/L) 0.5 1.5 3.78 2.6 0.97 0.52 0.29 0.59 0.36 1 0.26 0.7 1.1
Notes:1 Shaded cell: Analyte not detected above Method Quantitation Limit (MQL); value in cell is MQL for this sample.
MCL for DCE is 70 μg/L, TCE is 5 μg/L, and vinyl chloride is 2 μg/LMCL = Maximum Contaminant Level μg/L = micrograms per literTCE = trichloroethene DCE = cis-1,2-dichloroetheneVC = vinyl chloride
1EW-10
0
1
2
3
4
5
6
7
8
Jan-
92
Jul-9
2
Jan-
93
Jul-9
3
Jan-
94
Jul-9
4
Jan-
95
Jul-9
5
Jan-
96
Jul-9
6
Jan-
97
Jul-9
7
Jan-
98
Jul-9
8
Jan-
99
Jul-9
9
Jan-
00
Jul-0
0
Jan-
01
Jul-0
1
Jan-
02
Jul-0
2
Jan-
03
Jul-0
3
Jan-
04
Jul-0
4
Jan-
05
Jul-0
5
Jan-
06
Jul-0
6
Jan-
07
Sample Date
Con
cent
ratio
n (u
g/L)
cis-1,2-Dichloroethene (µg/L) Trichloroethene (µg/L) TCE-MCLVinyl Chloride (µg/L) VC-MCL
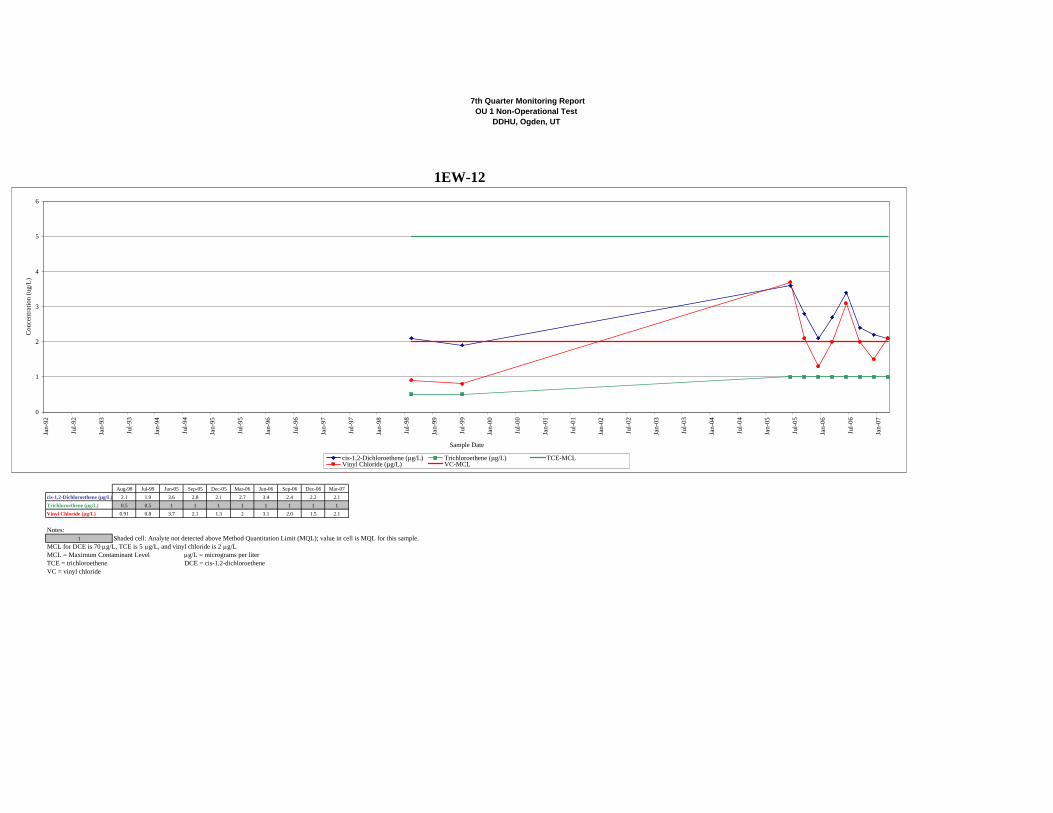
7th Quarter Monitoring ReportOU 1 Non-Operational Test
DDHU, Ogden, UT
Aug-98 Jul-99 Jun-05 Sep-05 Dec-05 Mar-06 Jun-06 Sep-06 Dec-06 Mar-07cis-1,2-Dichloroethene (µg/L) 2.1 1.9 3.6 2.8 2.1 2.7 3.4 2.4 2.2 2.1Trichloroethene (µg/L) 0.5 0.5 1 1 1 1 1 1 1 1Vinyl Chloride (µg/L) 0.91 0.8 3.7 2.1 1.3 2 3.1 2.0 1.5 2.1
Notes:1 Shaded cell: Analyte not detected above Method Quantitation Limit (MQL); value in cell is MQL for this sample.
MCL for DCE is 70 μg/L, TCE is 5 μg/L, and vinyl chloride is 2 μg/LMCL = Maximum Contaminant Level μg/L = micrograms per literTCE = trichloroethene DCE = cis-1,2-dichloroetheneVC = vinyl chloride
1EW-12
0
1
2
3
4
5
6
Jan-
92
Jul-9
2
Jan-
93
Jul-9
3
Jan-
94
Jul-9
4
Jan-
95
Jul-9
5
Jan-
96
Jul-9
6
Jan-
97
Jul-9
7
Jan-
98
Jul-9
8
Jan-
99
Jul-9
9
Jan-
00
Jul-0
0
Jan-
01
Jul-0
1
Jan-
02
Jul-0
2
Jan-
03
Jul-0
3
Jan-
04
Jul-0
4
Jan-
05
Jul-0
5
Jan-
06
Jul-0
6
Jan-
07
Sample Date
Con
cent
ratio
n (u
g/L)
cis-1,2-Dichloroethene (µg/L) Trichloroethene (µg/L) TCE-MCLVinyl Chloride (µg/L) VC-MCL
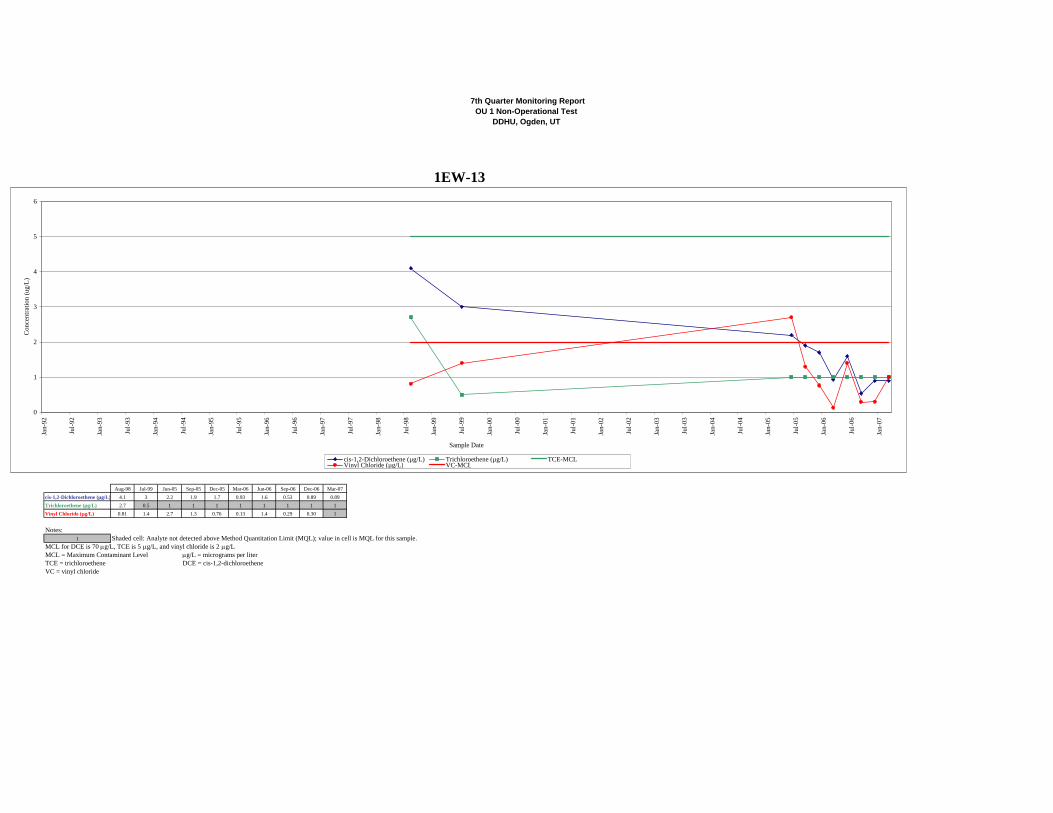
7th Quarter Monitoring ReportOU 1 Non-Operational Test
DDHU, Ogden, UT
Aug-98 Jul-99 Jun-05 Sep-05 Dec-05 Mar-06 Jun-06 Sep-06 Dec-06 Mar-07cis-1,2-Dichloroethene (µg/L) 4.1 3 2.2 1.9 1.7 0.93 1.6 0.53 0.89 0.89Trichloroethene (µg/L) 2.7 0.5 1 1 1 1 1 1 1 1Vinyl Chloride (µg/L) 0.81 1.4 2.7 1.3 0.76 0.13 1.4 0.29 0.30 1
Notes:1 Shaded cell: Analyte not detected above Method Quantitation Limit (MQL); value in cell is MQL for this sample.
MCL for DCE is 70 μg/L, TCE is 5 μg/L, and vinyl chloride is 2 μg/LMCL = Maximum Contaminant Level μg/L = micrograms per literTCE = trichloroethene DCE = cis-1,2-dichloroetheneVC = vinyl chloride
1EW-13
0
1
2
3
4
5
6
Jan-
92
Jul-9
2
Jan-
93
Jul-9
3
Jan-
94
Jul-9
4
Jan-
95
Jul-9
5
Jan-
96
Jul-9
6
Jan-
97
Jul-9
7
Jan-
98
Jul-9
8
Jan-
99
Jul-9
9
Jan-
00
Jul-0
0
Jan-
01
Jul-0
1
Jan-
02
Jul-0
2
Jan-
03
Jul-0
3
Jan-
04
Jul-0
4
Jan-
05
Jul-0
5
Jan-
06
Jul-0
6
Jan-
07
Sample Date
Con
cent
ratio
n (u
g/L)
cis-1,2-Dichloroethene (µg/L) Trichloroethene (µg/L) TCE-MCLVinyl Chloride (µg/L) VC-MCL
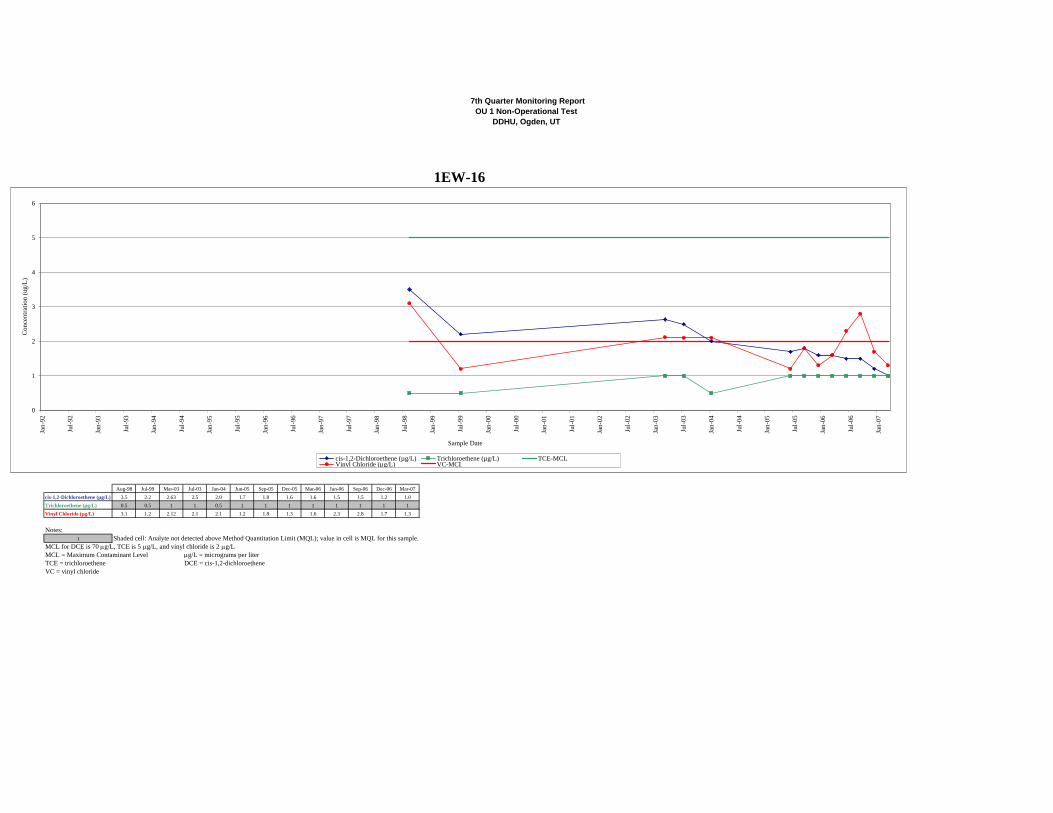
7th Quarter Monitoring ReportOU 1 Non-Operational Test
DDHU, Ogden, UT
Aug-98 Jul-99 Mar-03 Jul-03 Jan-04 Jun-05 Sep-05 Dec-05 Mar-06 Jun-06 Sep-06 Dec-06 Mar-07cis-1,2-Dichloroethene (µg/L) 3.5 2.2 2.63 2.5 2.0 1.7 1.8 1.6 1.6 1.5 1.5 1.2 1.0Trichloroethene (µg/L) 0.5 0.5 1 1 0.5 1 1 1 1 1 1 1 1Vinyl Chloride (µg/L) 3.1 1.2 2.12 2.1 2.1 1.2 1.8 1.3 1.6 2.3 2.8 1.7 1.3
Notes:1 Shaded cell: Analyte not detected above Method Quantitation Limit (MQL); value in cell is MQL for this sample.
MCL for DCE is 70 μg/L, TCE is 5 μg/L, and vinyl chloride is 2 μg/LMCL = Maximum Contaminant Level μg/L = micrograms per literTCE = trichloroethene DCE = cis-1,2-dichloroetheneVC = vinyl chloride
1EW-16
0
1
2
3
4
5
6
Jan-
92
Jul-9
2
Jan-
93
Jul-9
3
Jan-
94
Jul-9
4
Jan-
95
Jul-9
5
Jan-
96
Jul-9
6
Jan-
97
Jul-9
7
Jan-
98
Jul-9
8
Jan-
99
Jul-9
9
Jan-
00
Jul-0
0
Jan-
01
Jul-0
1
Jan-
02
Jul-0
2
Jan-
03
Jul-0
3
Jan-
04
Jul-0
4
Jan-
05
Jul-0
5
Jan-
06
Jul-0
6
Jan-
07
Sample Date
Con
cent
ratio
n (u
g/L)
cis-1,2-Dichloroethene (µg/L) Trichloroethene (µg/L) TCE-MCLVinyl Chloride (µg/L) VC-MCL
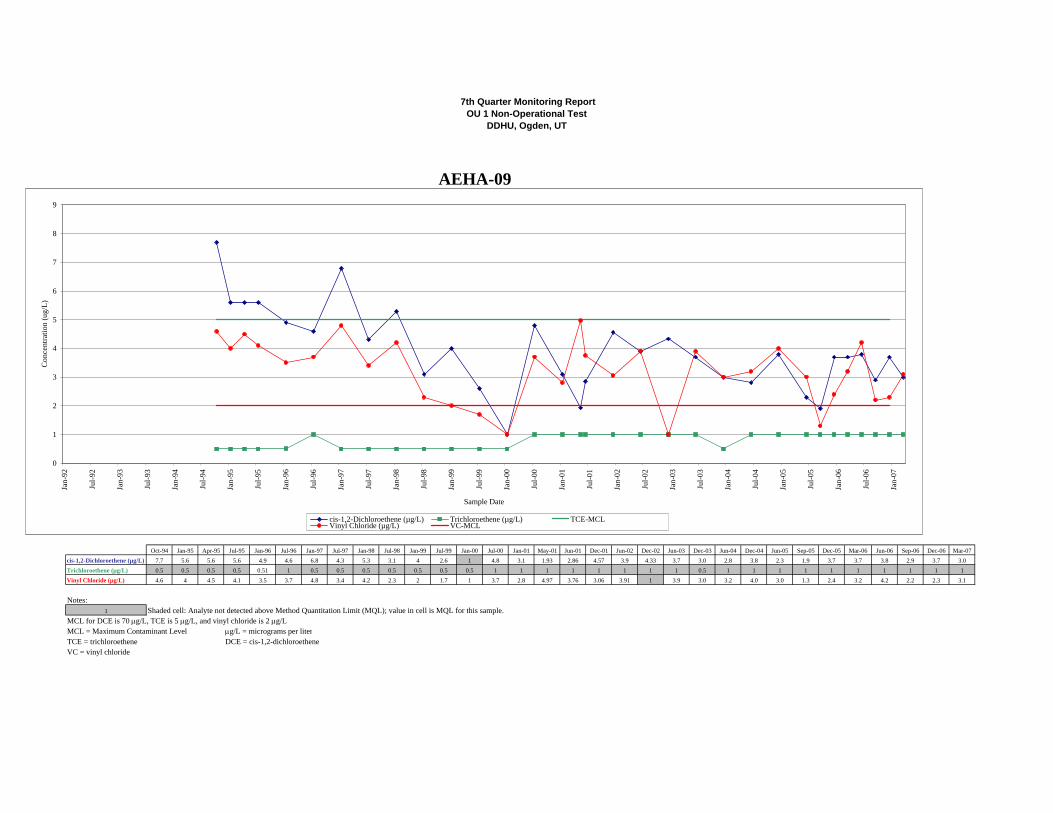
7th Quarter Monitoring ReportOU 1 Non-Operational Test
DDHU, Ogden, UT
Oct-94 Jan-95 Apr-95 Jul-95 Jan-96 Jul-96 Jan-97 Jul-97 Jan-98 Jul-98 Jan-99 Jul-99 Jan-00 Jul-00 Jan-01 May-01 Jun-01 Dec-01 Jun-02 Dec-02 Jun-03 Dec-03 Jun-04 Dec-04 Jun-05 Sep-05 Dec-05 Mar-06 Jun-06 Sep-06 Dec-06 Mar-07cis-1,2-Dichloroethene (µg/L) 7.7 5.6 5.6 5.6 4.9 4.6 6.8 4.3 5.3 3.1 4 2.6 1 4.8 3.1 1.93 2.86 4.57 3.9 4.33 3.7 3.0 2.8 3.8 2.3 1.9 3.7 3.7 3.8 2.9 3.7 3.0Trichloroethene (µg/L) 0.5 0.5 0.5 0.5 0.51 1 0.5 0.5 0.5 0.5 0.5 0.5 0.5 1 1 1 1 1 1 1 1 0.5 1 1 1 1 1 1 1 1 1 1Vinyl Chloride (µg/L) 4.6 4 4.5 4.1 3.5 3.7 4.8 3.4 4.2 2.3 2 1.7 1 3.7 2.8 4.97 3.76 3.06 3.91 1 3.9 3.0 3.2 4.0 3.0 1.3 2.4 3.2 4.2 2.2 2.3 3.1
Notes:1 Shaded cell: Analyte not detected above Method Quantitation Limit (MQL); value in cell is MQL for this sample.
MCL for DCE is 70 μg/L, TCE is 5 μg/L, and vinyl chloride is 2 μg/LMCL = Maximum Contaminant Level μg/L = micrograms per literTCE = trichloroethene DCE = cis-1,2-dichloroetheneVC = vinyl chloride
AEHA-09
0
1
2
3
4
5
6
7
8
9
Jan-
92
Jul-9
2
Jan-
93
Jul-9
3
Jan-
94
Jul-9
4
Jan-
95
Jul-9
5
Jan-
96
Jul-9
6
Jan-
97
Jul-9
7
Jan-
98
Jul-9
8
Jan-
99
Jul-9
9
Jan-
00
Jul-0
0
Jan-
01
Jul-0
1
Jan-
02
Jul-0
2
Jan-
03
Jul-0
3
Jan-
04
Jul-0
4
Jan-
05
Jul-0
5
Jan-
06
Jul-0
6
Jan-
07
Sample Date
Con
cent
ratio
n (u
g/L)
cis-1,2-Dichloroethene (µg/L) Trichloroethene (µg/L) TCE-MCLVinyl Chloride (µg/L) VC-MCL
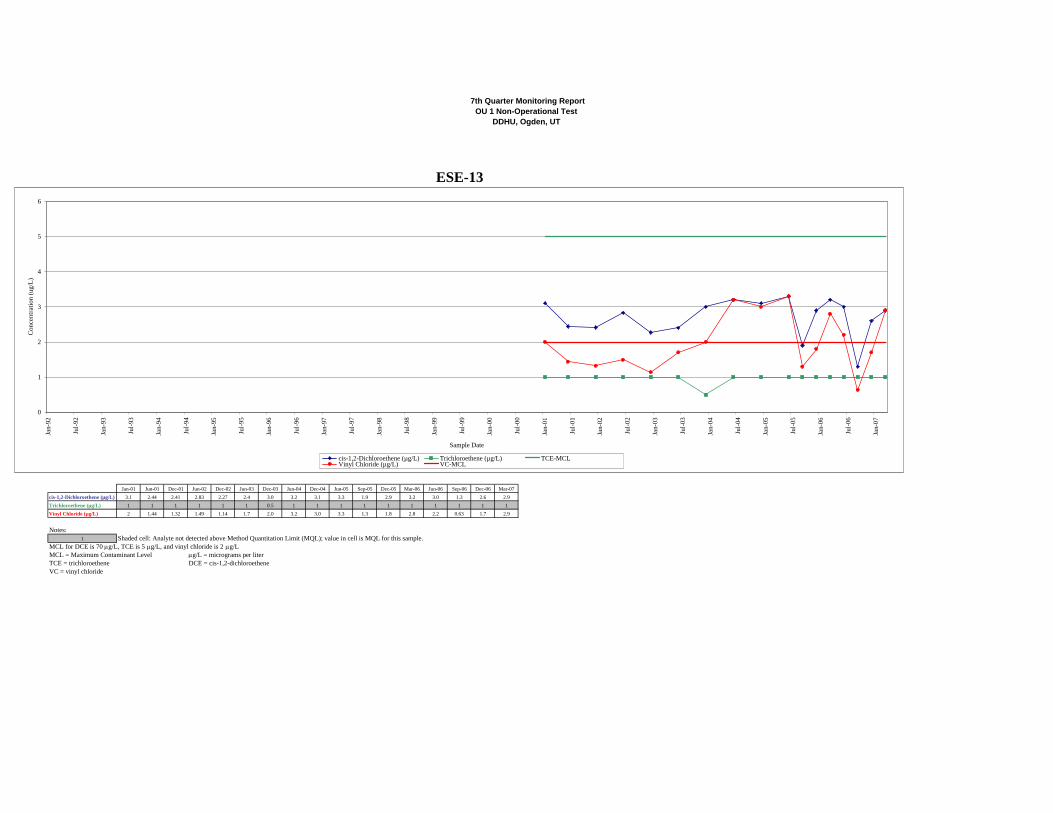
7th Quarter Monitoring ReportOU 1 Non-Operational Test
DDHU, Ogden, UT
Jan-01 Jun-01 Dec-01 Jun-02 Dec-02 Jun-03 Dec-03 Jun-04 Dec-04 Jun-05 Sep-05 Dec-05 Mar-06 Jun-06 Sep-06 Dec-06 Mar-07cis-1,2-Dichloroethene (µg/L) 3.1 2.44 2.41 2.83 2.27 2.4 3.0 3.2 3.1 3.3 1.9 2.9 3.2 3.0 1.3 2.6 2.9Trichloroethene (µg/L) 1 1 1 1 1 1 0.5 1 1 1 1 1 1 1 1 1 1Vinyl Chloride (µg/L) 2 1.44 1.32 1.49 1.14 1.7 2.0 3.2 3.0 3.3 1.3 1.8 2.8 2.2 0.63 1.7 2.9
Notes:1 Shaded cell: Analyte not detected above Method Quantitation Limit (MQL); value in cell is MQL for this sample.
MCL for DCE is 70 μg/L, TCE is 5 μg/L, and vinyl chloride is 2 μg/LMCL = Maximum Contaminant Level μg/L = micrograms per literTCE = trichloroethene DCE = cis-1,2-dichloroetheneVC = vinyl chloride
ESE-13
0
1
2
3
4
5
6
Jan-
92
Jul-9
2
Jan-
93
Jul-9
3
Jan-
94
Jul-9
4
Jan-
95
Jul-9
5
Jan-
96
Jul-9
6
Jan-
97
Jul-9
7
Jan-
98
Jul-9
8
Jan-
99
Jul-9
9
Jan-
00
Jul-0
0
Jan-
01
Jul-0
1
Jan-
02
Jul-0
2
Jan-
03
Jul-0
3
Jan-
04
Jul-0
4
Jan-
05
Jul-0
5
Jan-
06
Jul-0
6
Jan-
07
Sample Date
Con
cent
ratio
n (u
g/L)
cis-1,2-Dichloroethene (µg/L) Trichloroethene (µg/L) TCE-MCLVinyl Chloride (µg/L) VC-MCL
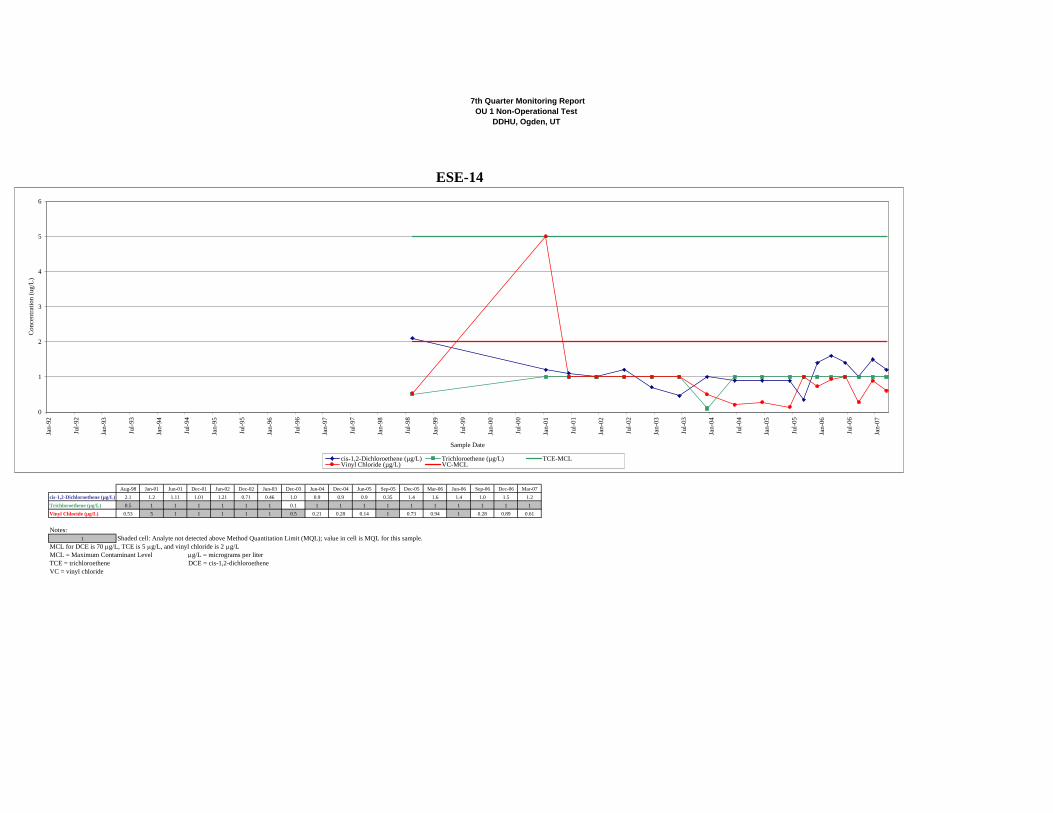
7th Quarter Monitoring ReportOU 1 Non-Operational Test
DDHU, Ogden, UT
Aug-98 Jan-01 Jun-01 Dec-01 Jun-02 Dec-02 Jun-03 Dec-03 Jun-04 Dec-04 Jun-05 Sep-05 Dec-05 Mar-06 Jun-06 Sep-06 Dec-06 Mar-07cis-1,2-Dichloroethene (µg/L) 2.1 1.2 1.11 1.01 1.21 0.71 0.46 1.0 0.9 0.9 0.9 0.35 1.4 1.6 1.4 1.0 1.5 1.2Trichloroethene (µg/L) 0.5 1 1 1 1 1 1 0.1 1 1 1 1 1 1 1 1 1 1Vinyl Chloride (µg/L) 0.53 5 1 1 1 1 1 0.5 0.21 0.28 0.14 1 0.73 0.94 1 0.28 0.89 0.61
Notes:1 Shaded cell: Analyte not detected above Method Quantitation Limit (MQL); value in cell is MQL for this sample.
MCL for DCE is 70 μg/L, TCE is 5 μg/L, and vinyl chloride is 2 μg/LMCL = Maximum Contaminant Level μg/L = micrograms per literTCE = trichloroethene DCE = cis-1,2-dichloroetheneVC = vinyl chloride
ESE-14
0
1
2
3
4
5
6
Jan-
92
Jul-9
2
Jan-
93
Jul-9
3
Jan-
94
Jul-9
4
Jan-
95
Jul-9
5
Jan-
96
Jul-9
6
Jan-
97
Jul-9
7
Jan-
98
Jul-9
8
Jan-
99
Jul-9
9
Jan-
00
Jul-0
0
Jan-
01
Jul-0
1
Jan-
02
Jul-0
2
Jan-
03
Jul-0
3
Jan-
04
Jul-0
4
Jan-
05
Jul-0
5
Jan-
06
Jul-0
6
Jan-
07
Sample Date
Con
cent
ratio
n (u
g/L)
cis-1,2-Dichloroethene (µg/L) Trichloroethene (µg/L) TCE-MCLVinyl Chloride (µg/L) VC-MCL

7th Quarter Monitoring ReportOU 1 Non-Operational Test
DDHU, Ogden, UT
Aug-98 Jan-01 Jun-01 Dec-01 Jun-02 Dec-02 Jun-03 Dec-03 Jun-04 Dec-04 Jun-05 Sep-05 Dec-05 Mar-06 Jun-06 Jun-06 Sep-06 Dec-06 Mar-07cis-1,2-Dichloroethene (µg/L) 1.3 5 1.34 0.55 1.38 1 0.73 0.2 1.1 0.47 0.73 0.38 0.31 0.36 0.66 0.66 0.19 1 1Trichloroethene (µg/L) 0.5 1 1 1 1 1 1 0.5 1 1 1 1 1 1 1 1 1 1 1Vinyl Chloride (µg/L) 0.5 5 1 1 1 1 1 0.5 1 1 1 1 1 1 1 1 1 1 1
Notes:1 Shaded cell: Analyte not detected above Method Quantitation Limit (MQL); value in cell is MQL for this sample.
MCL for DCE is 70 μg/L, TCE is 5 μg/L, and vinyl chloride is 2 μg/LMCL = Maximum Contaminant Level μg/L = micrograms per literTCE = trichloroethene DCE = cis-1,2-dichloroetheneVC = vinyl chloride
JMM-01
0
1
2
3
4
5
6
Jan-
92
Jul-9
2
Jan-
93
Jul-9
3
Jan-
94
Jul-9
4
Jan-
95
Jul-9
5
Jan-
96
Jul-9
6
Jan-
97
Jul-9
7
Jan-
98
Jul-9
8
Jan-
99
Jul-9
9
Jan-
00
Jul-0
0
Jan-
01
Jul-0
1
Jan-
02
Jul-0
2
Jan-
03
Jul-0
3
Jan-
04
Jul-0
4
Jan-
05
Jul-0
5
Jan-
06
Jul-0
6
Jan-
07
Sample Date
Con
cent
ratio
n (u
g/L)
cis-1,2-Dichloroethene (µg/L) Trichloroethene (µg/L) TCE-MCLVinyl Chloride (µg/L) VC-MCL
ND: Elevated MDL (5 µg/L)
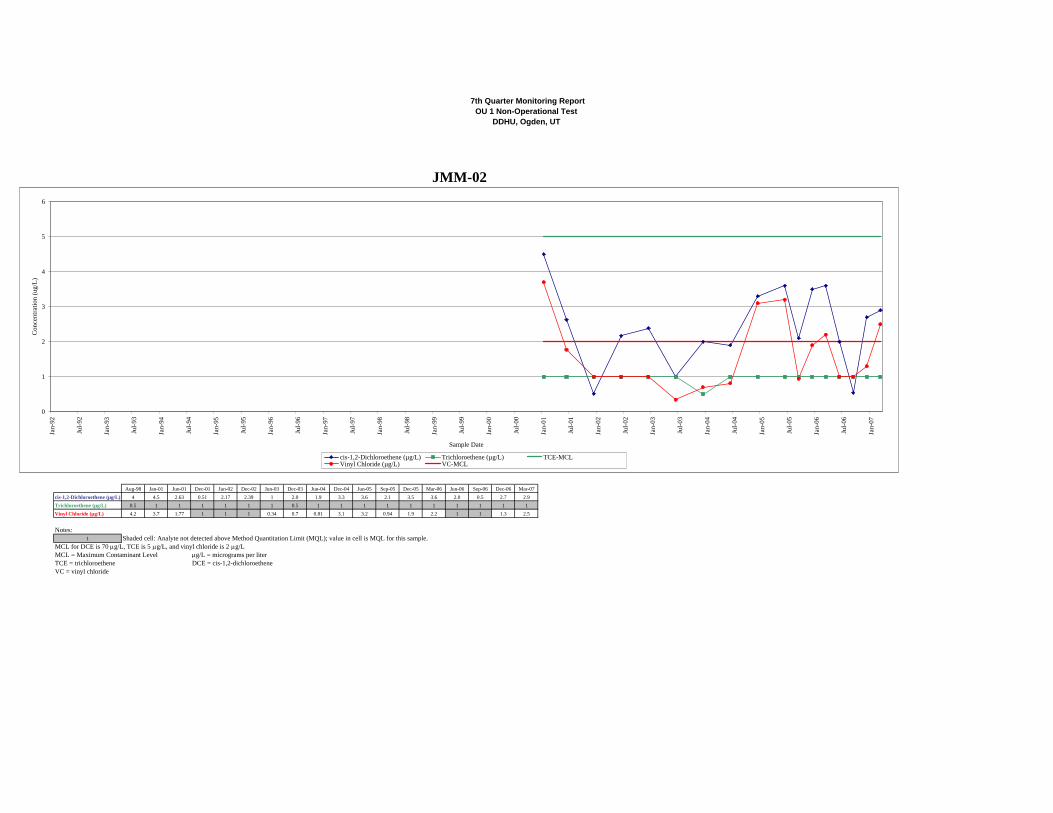
7th Quarter Monitoring ReportOU 1 Non-Operational Test
DDHU, Ogden, UT
Aug-98 Jan-01 Jun-01 Dec-01 Jun-02 Dec-02 Jun-03 Dec-03 Jun-04 Dec-04 Jun-05 Sep-05 Dec-05 Mar-06 Jun-06 Sep-06 Dec-06 Mar-07cis-1,2-Dichloroethene (µg/L) 4 4.5 2.63 0.51 2.17 2.39 1 2.0 1.9 3.3 3.6 2.1 3.5 3.6 2.0 0.5 2.7 2.9Trichloroethene (µg/L) 0.5 1 1 1 1 1 1 0.5 1 1 1 1 1 1 1 1 1 1Vinyl Chloride (µg/L) 4.2 3.7 1.77 1 1 1 0.34 0.7 0.81 3.1 3.2 0.94 1.9 2.2 1 1 1.3 2.5
Notes:1 Shaded cell: Analyte not detected above Method Quantitation Limit (MQL); value in cell is MQL for this sample.
MCL for DCE is 70 μg/L, TCE is 5 μg/L, and vinyl chloride is 2 μg/LMCL = Maximum Contaminant Level μg/L = micrograms per literTCE = trichloroethene DCE = cis-1,2-dichloroetheneVC = vinyl chloride
JMM-02
0
1
2
3
4
5
6
Jan-
92
Jul-9
2
Jan-
93
Jul-9
3
Jan-
94
Jul-9
4
Jan-
95
Jul-9
5
Jan-
96
Jul-9
6
Jan-
97
Jul-9
7
Jan-
98
Jul-9
8
Jan-
99
Jul-9
9
Jan-
00
Jul-0
0
Jan-
01
Jul-0
1
Jan-
02
Jul-0
2
Jan-
03
Jul-0
3
Jan-
04
Jul-0
4
Jan-
05
Jul-0
5
Jan-
06
Jul-0
6
Jan-
07
Sample Date
Con
cent
ratio
n (u
g/L)
cis-1,2-Dichloroethene (µg/L) Trichloroethene (µg/L) TCE-MCLVinyl Chloride (µg/L) VC-MCL

7th Quarter Monitoring ReportOU 1 Non-Operational Test
DDHU, Ogden, UT
Jan-96 Jul-96 Jul-98 Jul-99 Jan-00 Jul-00 Jan-01 Jun-01 Dec-01 Jun-02 Dec-02 Jun-03 Dec-03 Jun-04 Dec-04 Jun-05 Sep-05 Dec-05 Mar-06 Jun-06 Sep-06 Dec-06 Mar-07cis-1,2-Dichloroethene (µg/L) 1 1 0.5 0.5 1 1 5 1 1 1 1 1 0.5 0.5 1 1 1 1 1 1 1 1 1Trichloroethene (µg/L) 1 0.59 0.5 0.5 0.5 1 1 1 1 1 1 1 0.5 0.5 1 1 1 1 1 1 1 1 1Vinyl Chloride (µg/L) 0.5 1 0.5 0.5 0.5 1 5 1 1 1 1 1 0.5 0.5 1 1 1 1 1 1 1 1 1
Notes:1 Shaded cell: Analyte not detected above Method Quantitation Limit (MQL); value in cell is MQL for this sample.
MCL for DCE is 70 μg/L, TCE is 5 μg/L, and vinyl chloride is 2 μg/LMCL = Maximum Contaminant Level μg/L = micrograms per literTCE = trichloroethene DCE = cis-1,2-dichloroetheneVC = vinyl chloride
JMM-03
0
1
2
3
4
5
6
Jan-
92
Jul-9
2
Jan-
93
Jul-9
3
Jan-
94
Jul-9
4
Jan-
95
Jul-9
5
Jan-
96
Jul-9
6
Jan-
97
Jul-9
7
Jan-
98
Jul-9
8
Jan-
99
Jul-9
9
Jan-
00
Jul-0
0
Jan-
01
Jul-0
1
Jan-
02
Jul-0
2
Jan-
03
Jul-0
3
Jan-
04
Jul-0
4
Jan-
05
Jul-0
5
Jan-
06
Jul-0
6
Jan-
07
Sample Date
Con
cent
ratio
n (u
g/L)
cis-1,2-Dichloroethene (µg/L) Trichloroethene (µg/L) TCE-MCLVinyl Chloride (µg/L) VC-MCL
ND: Elevated MDL (5 µg/L)

7th Quarter Monitoring ReportOU 1 Non-Operational Test
DDHU, Ogden, UT
Aug-92 Oct-94 Jan-95 Apr-95 Jul-95 Jan-96 Jul-96 Jan-97 Jul-97 Jan-98 Jul-98 Jan-99 Jul-99 Jan-00 Jul-00 Jan-01 Jun-01 Dec-01 Jun-02 Dec-02 Jun-03 Nov-03 Jun-04 Dec-04 Jun-05 Sep-05 Dec-05 Mar-06 Jun-06 Sep-06 Dec-06 Mar-07
cis-1,2-Dichloroethene (µg/L) 14 15 14 16 7.7 9.4 15 10 16 6.5 15 11 8 6.7 8.3 6.22 9.2 6.87 12.3 7.33 10 5.0 12.0 6.2 5.3 3.8 7.6 8.7 9.2 4.2 6.5 7.2Trichloroethene (µg/L) 0.55 0.5 0.63 0.8 0.5 0.5 1 0.6 0.5 0.5 0.5 0.5 0.5 0.5 1 0.5 1 1 1 1 0.3 1.0 0.41 1 1 0.35 0.38 0.49 0.49 0.40 0.36Vinyl Chloride (µg/L) 3 4.3 3.3 3.6 2.5 4 2.8 3.6 4 2.2 5.1 3.4 1.3 2 2.5 1.9 2.14 2.57 4.68 2.78 3.8 1.0 2.9 2.0 2.2 1.1 2.8 4.2 3.4 1.6 3.3 4.2
Notes:1 Shaded cell: Analyte not detected above Method Quantitation Limit (MQL); value in cell is MQL for this sample.
MCL for DCE is 70 μg/L, TCE is 5 μg/L, and vinyl chloride is 2 μg/LMCL = Maximum Contaminant Level μg/L = micrograms per literTCE = trichloroethene DCE = cis-1,2-dichloroetheneVC = vinyl chloride
JMM-19
0
2
4
6
8
10
12
14
16
18
Jan-
92
Jul-9
2
Jan-
93
Jul-9
3
Jan-
94
Jul-9
4
Jan-
95
Jul-9
5
Jan-
96
Jul-9
6
Jan-
97
Jul-9
7
Jan-
98
Jul-9
8
Jan-
99
Jul-9
9
Jan-
00
Jul-0
0
Jan-
01
Jul-0
1
Jan-
02
Jul-0
2
Jan-
03
Jul-0
3
Jan-
04
Jul-0
4
Jan-
05
Jul-0
5
Jan-
06
Jul-0
6
Jan-
07
Sample Date
Con
cent
ratio
n (u
g/L)
cis-1,2-Dichloroethene (µg/L) Trichloroethene (µg/L) TCE-MCLVinyl Chloride (µg/L) VC-MCL
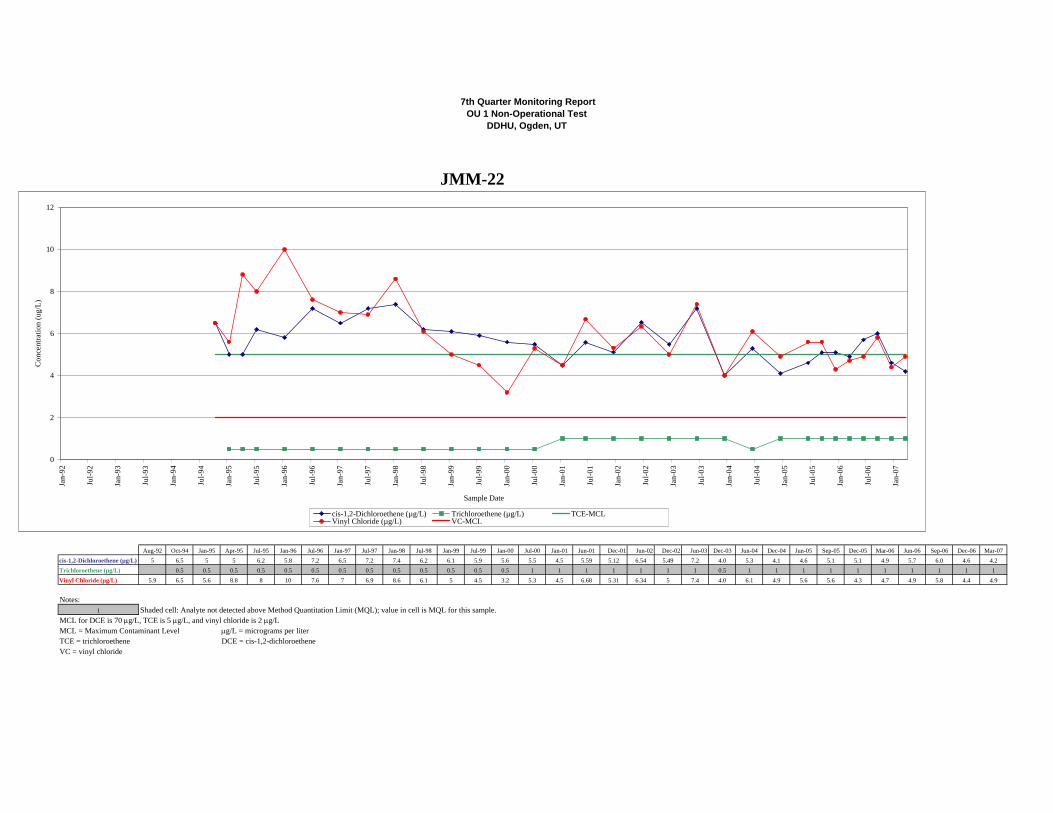
7th Quarter Monitoring ReportOU 1 Non-Operational Test
DDHU, Ogden, UT
Aug-92 Oct-94 Jan-95 Apr-95 Jul-95 Jan-96 Jul-96 Jan-97 Jul-97 Jan-98 Jul-98 Jan-99 Jul-99 Jan-00 Jul-00 Jan-01 Jun-01 Dec-01 Jun-02 Dec-02 Jun-03 Dec-03 Jun-04 Dec-04 Jun-05 Sep-05 Dec-05 Mar-06 Jun-06 Sep-06 Dec-06 Mar-07cis-1,2-Dichloroethene (µg/L) 5 6.5 5 5 6.2 5.8 7.2 6.5 7.2 7.4 6.2 6.1 5.9 5.6 5.5 4.5 5.59 5.12 6.54 5.49 7.2 4.0 5.3 4.1 4.6 5.1 5.1 4.9 5.7 6.0 4.6 4.2Trichloroethene (µg/L) 0.5 0.5 0.5 0.5 0.5 0.5 0.5 0.5 0.5 0.5 0.5 0.5 0.5 1 1 1 1 1 1 1 0.5 1 1 1 1 1 1 1 1 1 1Vinyl Chloride (µg/L) 5.9 6.5 5.6 8.8 8 10 7.6 7 6.9 8.6 6.1 5 4.5 3.2 5.3 4.5 6.68 5.31 6.34 5 7.4 4.0 6.1 4.9 5.6 5.6 4.3 4.7 4.9 5.8 4.4 4.9
Notes:1 Shaded cell: Analyte not detected above Method Quantitation Limit (MQL); value in cell is MQL for this sample.
MCL for DCE is 70 μg/L, TCE is 5 μg/L, and vinyl chloride is 2 μg/LMCL = Maximum Contaminant Level μg/L = micrograms per literTCE = trichloroethene DCE = cis-1,2-dichloroetheneVC = vinyl chloride
JMM-22
0
2
4
6
8
10
12
Jan-
92
Jul-9
2
Jan-
93
Jul-9
3
Jan-
94
Jul-9
4
Jan-
95
Jul-9
5
Jan-
96
Jul-9
6
Jan-
97
Jul-9
7
Jan-
98
Jul-9
8
Jan-
99
Jul-9
9
Jan-
00
Jul-0
0
Jan-
01
Jul-0
1
Jan-
02
Jul-0
2
Jan-
03
Jul-0
3
Jan-
04
Jul-0
4
Jan-
05
Jul-0
5
Jan-
06
Jul-0
6
Jan-
07
Sample Date
Con
cent
ratio
n (u
g/L)
cis-1,2-Dichloroethene (µg/L) Trichloroethene (µg/L) TCE-MCLVinyl Chloride (µg/L) VC-MCL
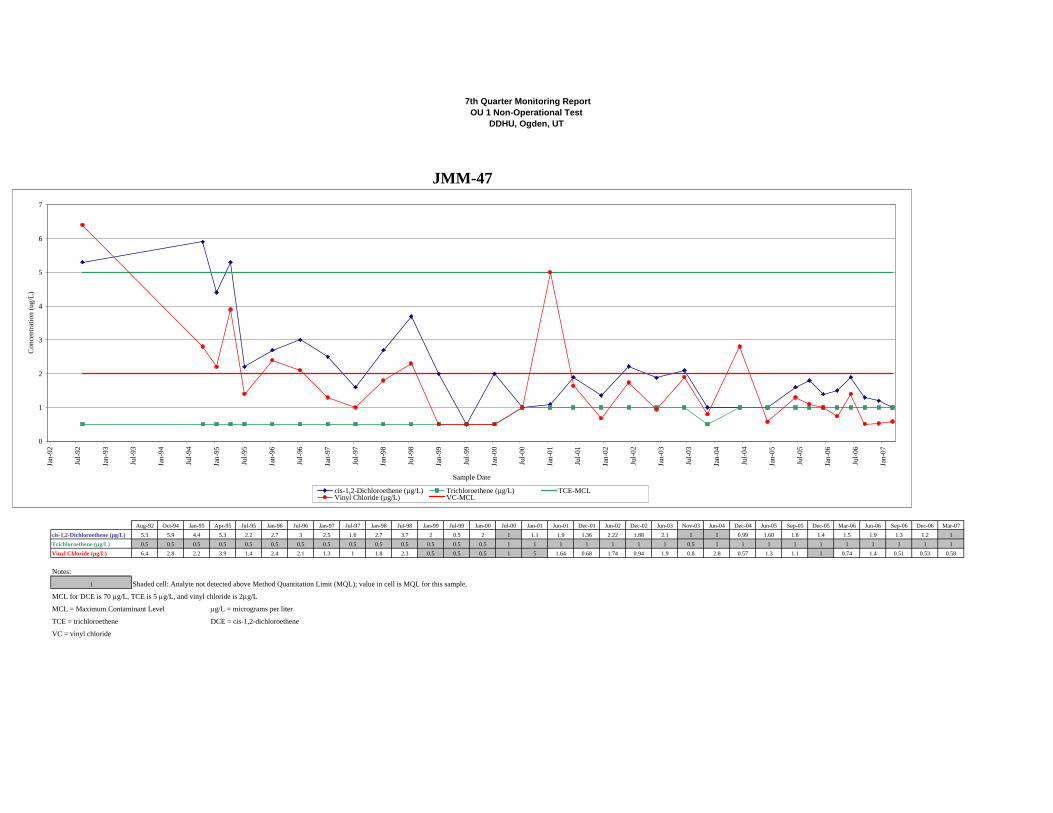
7th Quarter Monitoring ReportOU 1 Non-Operational Test
DDHU, Ogden, UT
Aug-92 Oct-94 Jan-95 Apr-95 Jul-95 Jan-96 Jul-96 Jan-97 Jul-97 Jan-98 Jul-98 Jan-99 Jul-99 Jan-00 Jul-00 Jan-01 Jun-01 Dec-01 Jun-02 Dec-02 Jun-03 Nov-03 Jun-04 Dec-04 Jun-05 Sep-05 Dec-05 Mar-06 Jun-06 Sep-06 Dec-06 Mar-07cis-1,2-Dichloroethene (µg/L) 5.3 5.9 4.4 5.3 2.2 2.7 3 2.5 1.6 2.7 3.7 2 0.5 2 1 1.1 1.9 1.36 2.22 1.88 2.1 1 1 0.99 1.60 1.8 1.4 1.5 1.9 1.3 1.2 1Trichloroethene (µg/L) 0.5 0.5 0.5 0.5 0.5 0.5 0.5 0.5 0.5 0.5 0.5 0.5 0.5 0.5 1 1 1 1 1 1 1 0.5 1 1 1 1 1 1 1 1 1 1Vinyl Chloride (µg/L) 6.4 2.8 2.2 3.9 1.4 2.4 2.1 1.3 1 1.8 2.3 0.5 0.5 0.5 1 5 1.64 0.68 1.74 0.94 1.9 0.8 2.8 0.57 1.3 1.1 1 0.74 1.4 0.51 0.53 0.58
Notes:
1 Shaded cell: Analyte not detected above Method Quantitation Limit (MQL); value in cell is MQL for this sample.
MCL for DCE is 70 μg/L, TCE is 5 μg/L, and vinyl chloride is 2 μg/L
MCL = Maximum Contaminant Level μg/L = micrograms per liter
TCE = trichloroethene DCE = cis-1,2-dichloroethene
VC = vinyl chloride
JMM-47
0
1
2
3
4
5
6
7
Jan-
92
Jul-9
2
Jan-
93
Jul-9
3
Jan-
94
Jul-9
4
Jan-
95
Jul-9
5
Jan-
96
Jul-9
6
Jan-
97
Jul-9
7
Jan-
98
Jul-9
8
Jan-
99
Jul-9
9
Jan-
00
Jul-0
0
Jan-
01
Jul-0
1
Jan-
02
Jul-0
2
Jan-
03
Jul-0
3
Jan-
04
Jul-0
4
Jan-
05
Jul-0
5
Jan-
06
Jul-0
6
Jan-
07
Sample Date
Con
cent
ratio
n (u
g/L)
cis-1,2-Dichloroethene (µg/L) Trichloroethene (µg/L) TCE-MCLVinyl Chloride (µg/L) VC-MCL
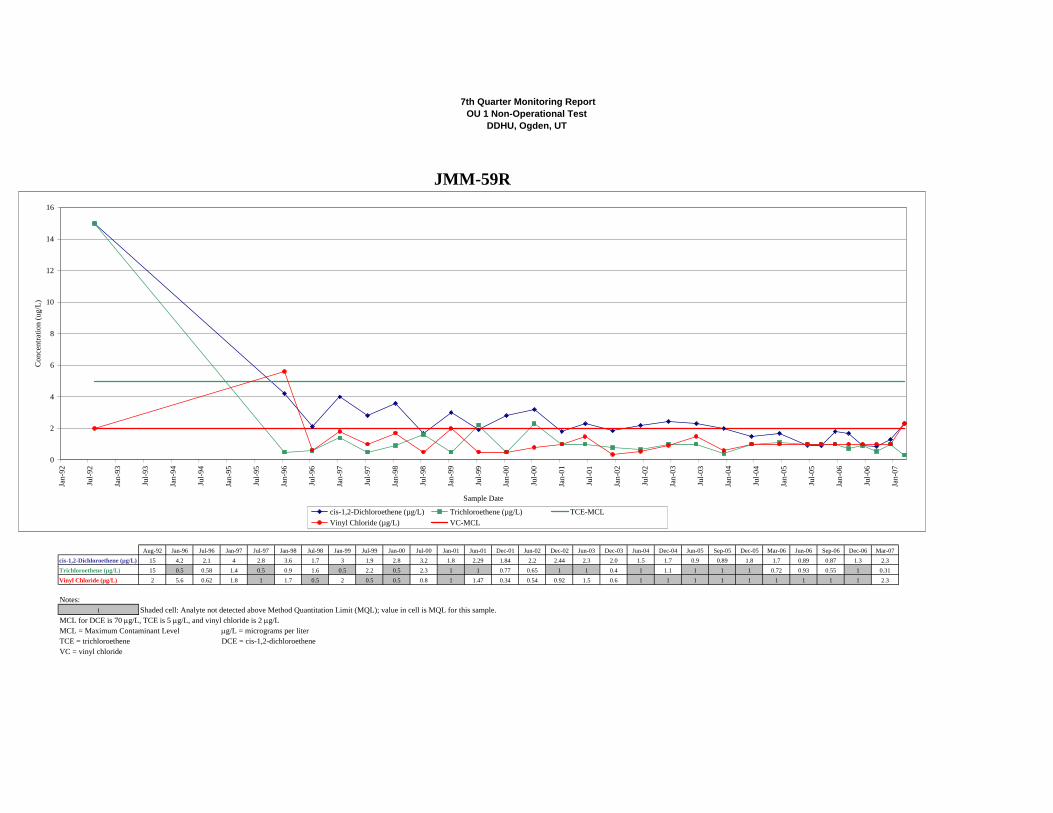
7th Quarter Monitoring ReportOU 1 Non-Operational Test
DDHU, Ogden, UT
Aug-92 Jan-96 Jul-96 Jan-97 Jul-97 Jan-98 Jul-98 Jan-99 Jul-99 Jan-00 Jul-00 Jan-01 Jun-01 Dec-01 Jun-02 Dec-02 Jun-03 Dec-03 Jun-04 Dec-04 Jun-05 Sep-05 Dec-05 Mar-06 Jun-06 Sep-06 Dec-06 Mar-07cis-1,2-Dichloroethene (µg/L) 15 4.2 2.1 4 2.8 3.6 1.7 3 1.9 2.8 3.2 1.8 2.29 1.84 2.2 2.44 2.3 2.0 1.5 1.7 0.9 0.89 1.8 1.7 0.89 0.87 1.3 2.3Trichloroethene (µg/L) 15 0.5 0.58 1.4 0.5 0.9 1.6 0.5 2.2 0.5 2.3 1 1 0.77 0.65 1 1 0.4 1 1.1 1 1 1 0.72 0.93 0.55 1 0.31Vinyl Chloride (µg/L) 2 5.6 0.62 1.8 1 1.7 0.5 2 0.5 0.5 0.8 1 1.47 0.34 0.54 0.92 1.5 0.6 1 1 1 1 1 1 1 1 1 2.3
Notes:1 Shaded cell: Analyte not detected above Method Quantitation Limit (MQL); value in cell is MQL for this sample.
MCL for DCE is 70 μg/L, TCE is 5 μg/L, and vinyl chloride is 2 μg/LMCL = Maximum Contaminant Level μg/L = micrograms per literTCE = trichloroethene DCE = cis-1,2-dichloroetheneVC = vinyl chloride
JMM-59R
0
2
4
6
8
10
12
14
16
Jan-
92
Jul-9
2
Jan-
93
Jul-9
3
Jan-
94
Jul-9
4
Jan-
95
Jul-9
5
Jan-
96
Jul-9
6
Jan-
97
Jul-9
7
Jan-
98
Jul-9
8
Jan-
99
Jul-9
9
Jan-
00
Jul-0
0
Jan-
01
Jul-0
1
Jan-
02
Jul-0
2
Jan-
03
Jul-0
3
Jan-
04
Jul-0
4
Jan-
05
Jul-0
5
Jan-
06
Jul-0
6
Jan-
07
Sample Date
Con
cent
ratio
n (u
g/L)
cis-1,2-Dichloroethene (µg/L) Trichloroethene (µg/L) TCE-MCLVinyl Chloride (µg/L) VC-MCL
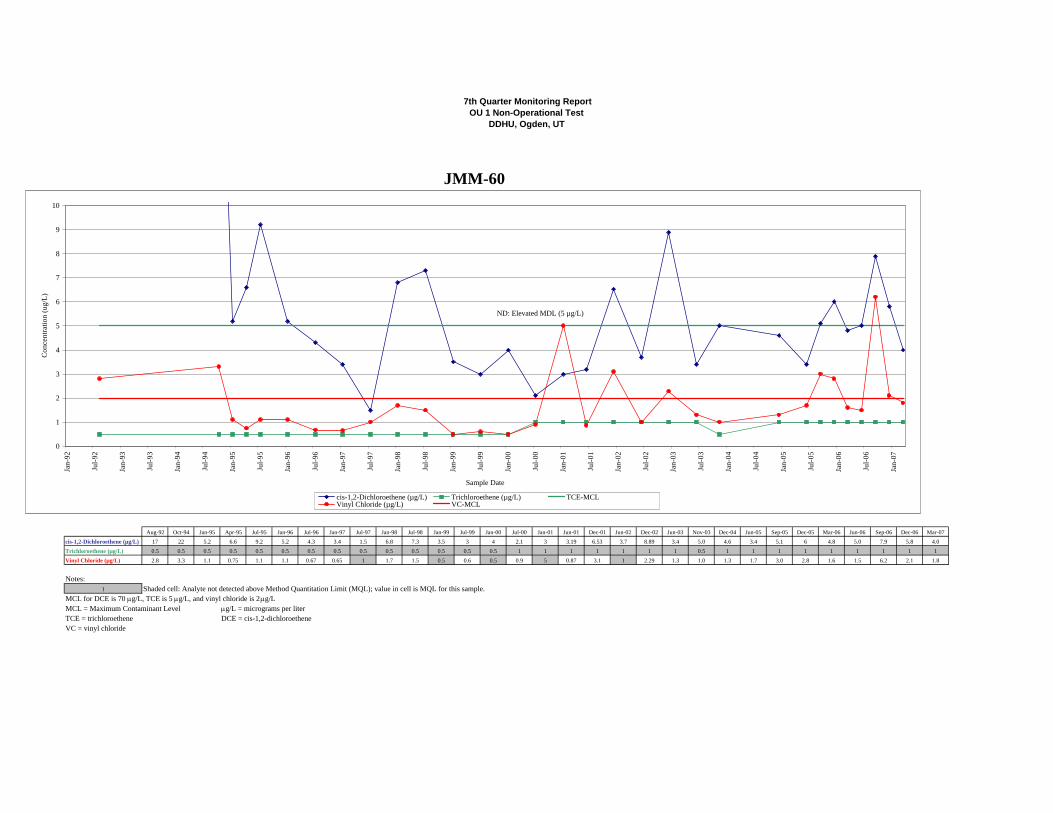
7th Quarter Monitoring ReportOU 1 Non-Operational Test
DDHU, Ogden, UT
Aug-92 Oct-94 Jan-95 Apr-95 Jul-95 Jan-96 Jul-96 Jan-97 Jul-97 Jan-98 Jul-98 Jan-99 Jul-99 Jan-00 Jul-00 Jan-01 Jun-01 Dec-01 Jun-02 Dec-02 Jun-03 Nov-03 Dec-04 Jun-05 Sep-05 Dec-05 Mar-06 Jun-06 Sep-06 Dec-06 Mar-07cis-1,2-Dichloroethene (µg/L) 17 22 5.2 6.6 9.2 5.2 4.3 3.4 1.5 6.8 7.3 3.5 3 4 2.1 3 3.19 6.53 3.7 8.89 3.4 5.0 4.6 3.4 5.1 6 4.8 5.0 7.9 5.8 4.0Trichloroethene (µg/L) 0.5 0.5 0.5 0.5 0.5 0.5 0.5 0.5 0.5 0.5 0.5 0.5 0.5 0.5 1 1 1 1 1 1 1 0.5 1 1 1 1 1 1 1 1 1Vinyl Chloride (µg/L) 2.8 3.3 1.1 0.75 1.1 1.1 0.67 0.65 1 1.7 1.5 0.5 0.6 0.5 0.9 5 0.87 3.1 1 2.29 1.3 1.0 1.3 1.7 3.0 2.8 1.6 1.5 6.2 2.1 1.8
Notes:1 Shaded cell: Analyte not detected above Method Quantitation Limit (MQL); value in cell is MQL for this sample.
MCL for DCE is 70 μg/L, TCE is 5 μg/L, and vinyl chloride is 2 μg/LMCL = Maximum Contaminant Level μg/L = micrograms per literTCE = trichloroethene DCE = cis-1,2-dichloroetheneVC = vinyl chloride
JMM-60
0
1
2
3
4
5
6
7
8
9
10
Jan-
92
Jul-9
2
Jan-
93
Jul-9
3
Jan-
94
Jul-9
4
Jan-
95
Jul-9
5
Jan-
96
Jul-9
6
Jan-
97
Jul-9
7
Jan-
98
Jul-9
8
Jan-
99
Jul-9
9
Jan-
00
Jul-0
0
Jan-
01
Jul-0
1
Jan-
02
Jul-0
2
Jan-
03
Jul-0
3
Jan-
04
Jul-0
4
Jan-
05
Jul-0
5
Jan-
06
Jul-0
6
Jan-
07
Sample Date
Con
cent
ratio
n (u
g/L)
cis-1,2-Dichloroethene (µg/L) Trichloroethene (µg/L) TCE-MCLVinyl Chloride (µg/L) VC-MCL
ND: Elevated MDL (5 µg/L)
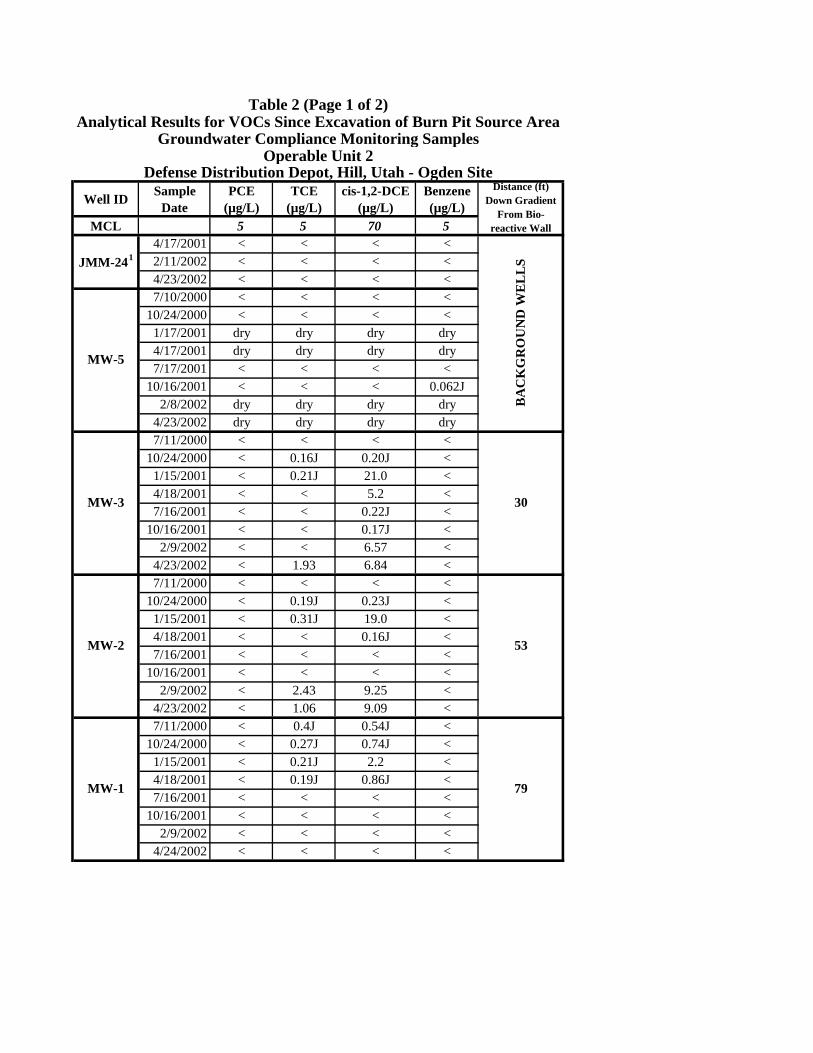
Table 2 (Page 1 of 2)Analytical Results for VOCs Since Excavation of Burn Pit Source Area
Groundwater Compliance Monitoring SamplesOperable Unit 2
Defense Distribution Depot, Hill, Utah - Ogden Site
Well ID Sample Date
PCE (µg/L)
TCE (µg/L)
cis-1,2-DCE (µg/L)
Benzene (µg/L)
Distance (ft) Down Gradient
From Bio-reactive WallMCL 5 5 70 5
JMM-2414/17/2001 < < < <
BA
CK
GR
OU
ND
WE
LL
S2/11/2002 < < < <4/23/2002 < < < <
MW-5
7/10/2000 < < < <10/24/2000 < < < <
1/17/2001 dry dry dry dry4/17/2001 dry dry dry dry7/17/2001 < < < <
10/16/2001 < < < 0.062J2/8/2002 dry dry dry dry
4/23/2002 dry dry dry dry
MW-3
7/11/2000 < < < <
30
10/24/2000 < 0.16J 0.20J <1/15/2001 < 0.21J 21.0 <4/18/2001 < < 5.2 <7/16/2001 < < 0.22J <
10/16/2001 < < 0.17J <2/9/2002 < < 6.57 <
4/23/2002 < 1.93 6.84 <
MW-2
7/11/2000 < < < <
53
10/24/2000 < 0.19J 0.23J <1/15/2001 < 0.31J 19.0 <4/18/2001 < < 0.16J <7/16/2001 < < < <
10/16/2001 < < < <2/9/2002 < 2.43 9.25 <
4/23/2002 < 1.06 9.09 <
MW-1
7/11/2000 < 0.4J 0.54J <
79
10/24/2000 < 0.27J 0.74J <1/15/2001 < 0.21J 2.2 <4/18/2001 < 0.19J 0.86J <7/16/2001 < < < <
10/16/2001 < < < <2/9/2002 < < < <
4/24/2002 < < < <
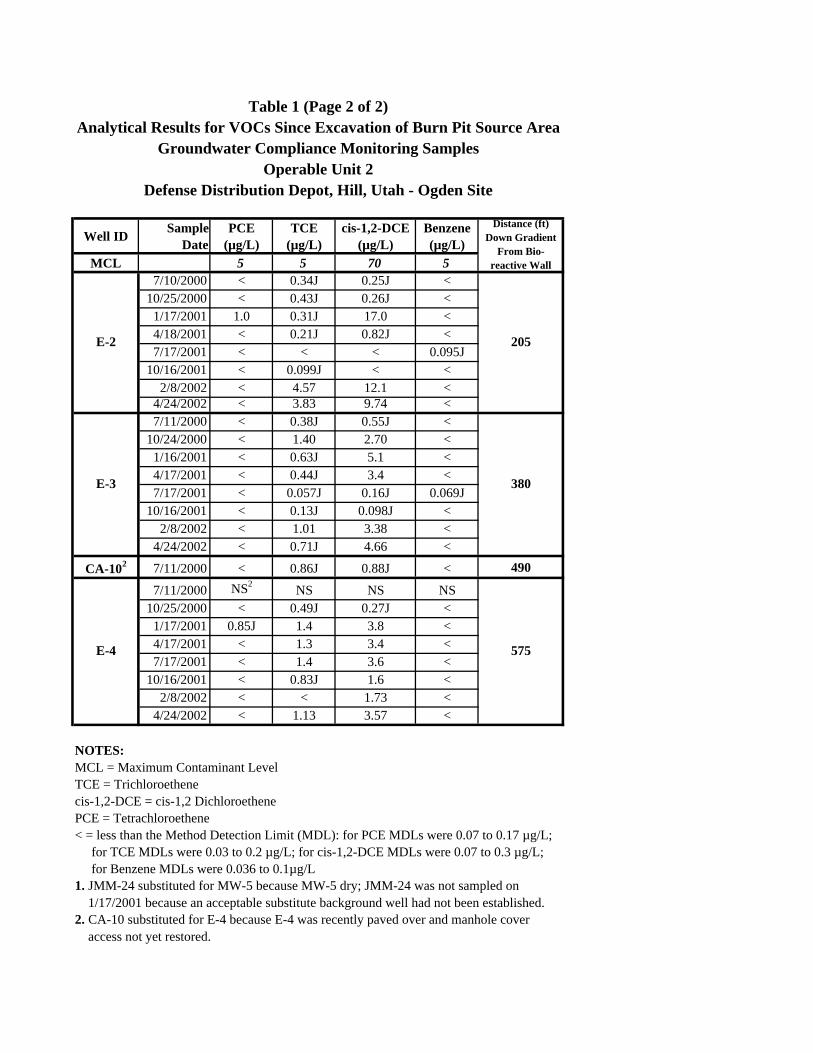
Table 1 (Page 2 of 2)Analytical Results for VOCs Since Excavation of Burn Pit Source Area
Groundwater Compliance Monitoring SamplesOperable Unit 2
Defense Distribution Depot, Hill, Utah - Ogden Site
Well ID SampleDate
PCE (µg/L)
TCE (µg/L)
cis-1,2-DCE (µg/L)
Benzene (µg/L)
Distance (ft) Down Gradient
From Bio-reactive WallMCL 5 5 70 5
E-2
7/10/2000 < 0.34J 0.25J <
205
10/25/2000 < 0.43J 0.26J <1/17/2001 1.0 0.31J 17.0 <4/18/2001 < 0.21J 0.82J <7/17/2001 < < < 0.095J
10/16/2001 < 0.099J < <2/8/2002 < 4.57 12.1 <
4/24/2002 < 3.83 9.74 <
E-3
7/11/2000 < 0.38J 0.55J <
380
10/24/2000 < 1.40 2.70 <1/16/2001 < 0.63J 5.1 <4/17/2001 < 0.44J 3.4 <7/17/2001 < 0.057J 0.16J 0.069J
10/16/2001 < 0.13J 0.098J <2/8/2002 < 1.01 3.38 <
4/24/2002 < 0.71J 4.66 <
CA-102 7/11/2000 < 0.86J 0.88J < 490
E-4
7/11/2000 NS2 NS NS NS
575
10/25/2000 < 0.49J 0.27J <1/17/2001 0.85J 1.4 3.8 <4/17/2001 < 1.3 3.4 <7/17/2001 < 1.4 3.6 <
10/16/2001 < 0.83J 1.6 <2/8/2002 < < 1.73 <
4/24/2002 < 1.13 3.57 <
NOTES:MCL = Maximum Contaminant Level TCE = Trichloroethenecis-1,2-DCE = cis-1,2 DichloroethenePCE = Tetrachloroethene< = less than the Method Detection Limit (MDL): for PCE MDLs were 0.07 to 0.17 µg/L; for TCE MDLs were 0.03 to 0.2 µg/L; for cis-1,2-DCE MDLs were 0.07 to 0.3 µg/L; for Benzene MDLs were 0.036 to 0.1µg/L1. JMM-24 substituted for MW-5 because MW-5 dry; JMM-24 was not sampled on 1/17/2001 because an acceptable substitute background well had not been established.2. CA-10 substituted for E-4 because E-4 was recently paved over and manhole cover access not yet restored.
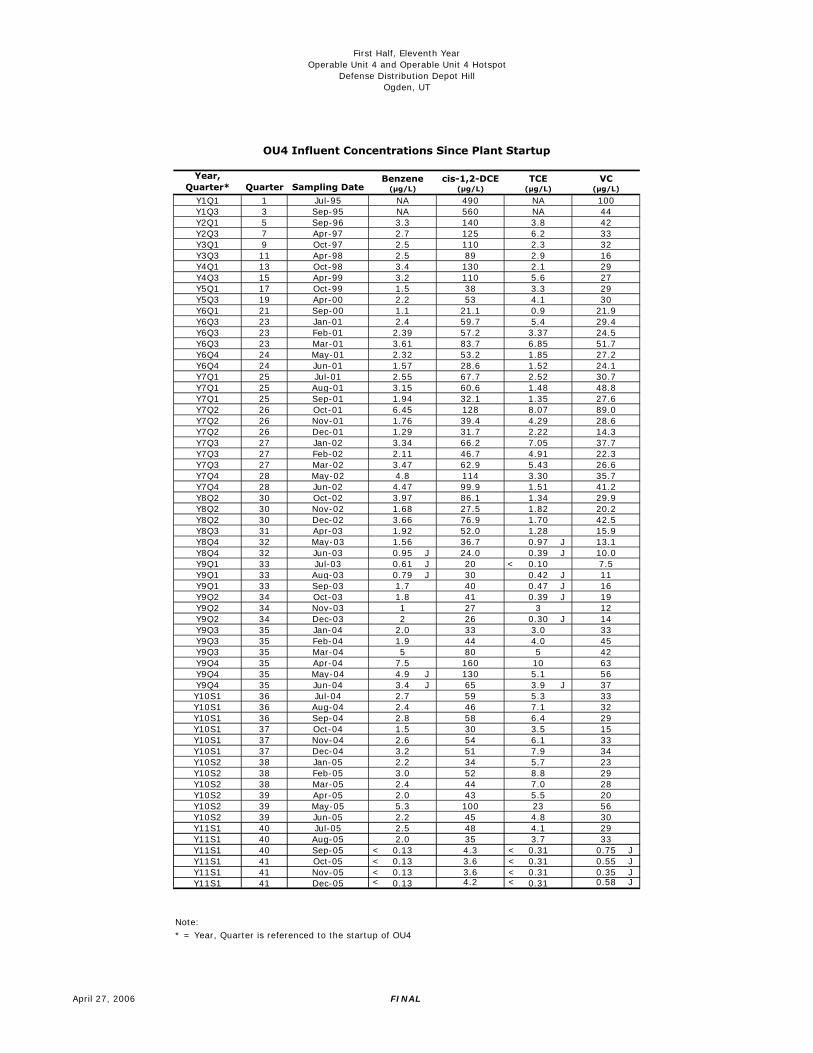
First Half, Eleventh YearOperable Unit 4 and Operable Unit 4 Hotspot
Defense Distribution Depot HillOgden, UT
Year, Quarter* Quarter Sampling Date
Y1Q1 1 Jul-95 NA 490 NA 100Y1Q3 3 Sep-95 NA 560 NA 44Y2Q1 5 Sep-96 3.3 140 3.8 42Y2Q3 7 Apr-97 2.7 125 6.2 33Y3Q1 9 Oct-97 2.5 110 2.3 32Y3Q3 11 Apr-98 2.5 89 2.9 16Y4Q1 13 Oct-98 3.4 130 2.1 29Y4Q3 15 Apr-99 3.2 110 5.6 27Y5Q1 17 Oct-99 1.5 38 3.3 29Y5Q3 19 Apr-00 2.2 53 4.1 30Y6Q1 21 Sep-00 1.1 21.1 0.9 21.9Y6Q3 23 Jan-01 2.4 59.7 5.4 29.4Y6Q3 23 Feb-01 2.39 57.2 3.37 24.5Y6Q3 23 Mar-01 3.61 83.7 6.85 51.7Y6Q4 24 May-01 2.32 53.2 1.85 27.2Y6Q4 24 Jun-01 1.57 28.6 1.52 24.1Y7Q1 25 Jul-01 2.55 67.7 2.52 30.7Y7Q1 25 Aug-01 3.15 60.6 1.48 48.8Y7Q1 25 Sep-01 1.94 32.1 1.35 27.6Y7Q2 26 Oct-01 6.45 128 8.07 89.0Y7Q2 26 Nov-01 1.76 39.4 4.29 28.6Y7Q2 26 Dec-01 1.29 31.7 2.22 14.3Y7Q3 27 Jan-02 3.34 66.2 7.05 37.7Y7Q3 27 Feb-02 2.11 46.7 4.91 22.3Y7Q3 27 Mar-02 3.47 62.9 5.43 26.6Y7Q4 28 May-02 4.8 114 3.30 35.7Y7Q4 28 Jun-02 4.47 99.9 1.51 41.2Y8Q2 30 Oct-02 3.97 86.1 1.34 29.9Y8Q2 30 Nov-02 1.68 27.5 1.82 20.2Y8Q2 30 Dec-02 3.66 76.9 1.70 42.5Y8Q3 31 Apr-03 1.92 52.0 1.28 15.9Y8Q4 32 May-03 1.56 36.7 0.97 J 13.1Y8Q4 32 Jun-03 0.95 J 24.0 0.39 J 10.0Y9Q1 33 Jul-03 0.61 J 20 < 0.10 7.5Y9Q1 33 Aug-03 0.79 J 30 0.42 J 11Y9Q1 33 Sep-03 1.7 40 0.47 J 16Y9Q2 34 Oct-03 1.8 41 0.39 J 19Y9Q2 34 Nov-03 1 27 3 12Y9Q2 34 Dec-03 2 26 0.30 J 14Y9Q3 35 Jan-04 2.0 33 3.0 33Y9Q3 35 Feb-04 1.9 44 4.0 45Y9Q3 35 Mar-04 5 80 5 42Y9Q4 35 Apr-04 7.5 160 10 63Y9Q4 35 May-04 4.9 J 130 5.1 56Y9Q4 35 Jun-04 3.4 J 65 3.9 J 37Y10S1 36 Jul-04 2.7 59 5.3 33Y10S1 36 Aug-04 2.4 46 7.1 32Y10S1 36 Sep-04 2.8 58 6.4 29Y10S1 37 Oct-04 1.5 30 3.5 15Y10S1 37 Nov-04 2.6 54 6.1 33Y10S1 37 Dec-04 3.2 51 7.9 34Y10S2 38 Jan-05 2.2 34 5.7 23Y10S2 38 Feb-05 3.0 52 8.8 29Y10S2 38 Mar-05 2.4 44 7.0 28Y10S2 39 Apr-05 2.0 43 5.5 20Y10S2 39 May-05 5.3 100 23 56Y10S2 39 Jun-05 2.2 45 4.8 30Y11S1 40 Jul-05 2.5 48 4.1 29Y11S1 40 Aug-05 2.0 35 3.7 33Y11S1 40 Sep-05 < 0.13 4.3 < 0.31 0.75 JY11S1 41 Oct-05 < 0.13 3.6 < 0.31 0.55 JY11S1 41 Nov-05 < 0.13 3.6 < 0.31 0.35 JY11S1 41 Dec-05 < 0.13 4.2 < 0.31 0.58 J
Note:* = Year, Quarter is referenced to the startup of OU4
OU4 Influent Concentrations Since Plant Startup
TCE (μg/L)
Benzene (μg/L)
VC (μg/L)
cis-1,2-DCE (μg/L)
April 27, 2006 FINAL
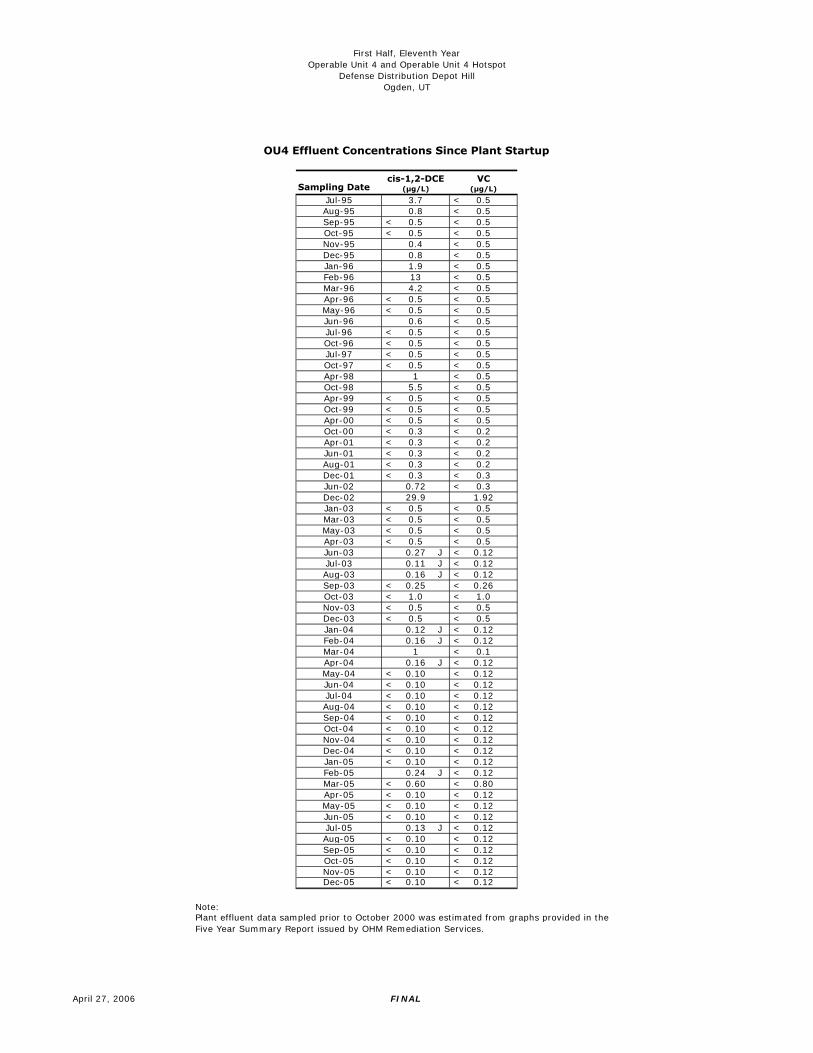
First Half, Eleventh YearOperable Unit 4 and Operable Unit 4 Hotspot
Defense Distribution Depot HillOgden, UT
Sampling DateJul-95 3.7 < 0.5Aug-95 0.8 < 0.5Sep-95 < 0.5 < 0.5Oct-95 < 0.5 < 0.5Nov-95 0.4 < 0.5Dec-95 0.8 < 0.5Jan-96 1.9 < 0.5Feb-96 13 < 0.5Mar-96 4.2 < 0.5Apr-96 < 0.5 < 0.5May-96 < 0.5 < 0.5Jun-96 0.6 < 0.5Jul-96 < 0.5 < 0.5Oct-96 < 0.5 < 0.5Jul-97 < 0.5 < 0.5Oct-97 < 0.5 < 0.5Apr-98 1 < 0.5Oct-98 5.5 < 0.5Apr-99 < 0.5 < 0.5Oct-99 < 0.5 < 0.5Apr-00 < 0.5 < 0.5Oct-00 < 0.3 < 0.2Apr-01 < 0.3 < 0.2Jun-01 < 0.3 < 0.2Aug-01 < 0.3 < 0.2Dec-01 < 0.3 < 0.3Jun-02 0.72 < 0.3Dec-02 29.9 1.92Jan-03 < 0.5 < 0.5Mar-03 < 0.5 < 0.5May-03 < 0.5 < 0.5Apr-03 < 0.5 < 0.5Jun-03 0.27 J < 0.12Jul-03 0.11 J < 0.12Aug-03 0.16 J < 0.12Sep-03 < 0.25 < 0.26Oct-03 < 1.0 < 1.0Nov-03 < 0.5 < 0.5Dec-03 < 0.5 < 0.5Jan-04 0.12 J < 0.12Feb-04 0.16 J < 0.12Mar-04 1 < 0.1Apr-04 0.16 J < 0.12May-04 < 0.10 < 0.12Jun-04 < 0.10 < 0.12Jul-04 < 0.10 < 0.12Aug-04 < 0.10 < 0.12Sep-04 < 0.10 < 0.12Oct-04 < 0.10 < 0.12Nov-04 < 0.10 < 0.12Dec-04 < 0.10 < 0.12Jan-05 < 0.10 < 0.12Feb-05 0.24 J < 0.12Mar-05 < 0.60 < 0.80Apr-05 < 0.10 < 0.12May-05 < 0.10 < 0.12Jun-05 < 0.10 < 0.12Jul-05 0.13 J < 0.12Aug-05 < 0.10 < 0.12Sep-05 < 0.10 < 0.12Oct-05 < 0.10 < 0.12Nov-05 < 0.10 < 0.12Dec-05 < 0.10 < 0.12
Note:
OU4 Effluent Concentrations Since Plant Startup
cis-1,2-DCE (μg/L)
VC (μg/L)
Plant effluent data sampled prior to October 2000 was estimated from graphs provided in the Five Year Summary Report issued by OHM Remediation Services.
April 27, 2006 FINAL
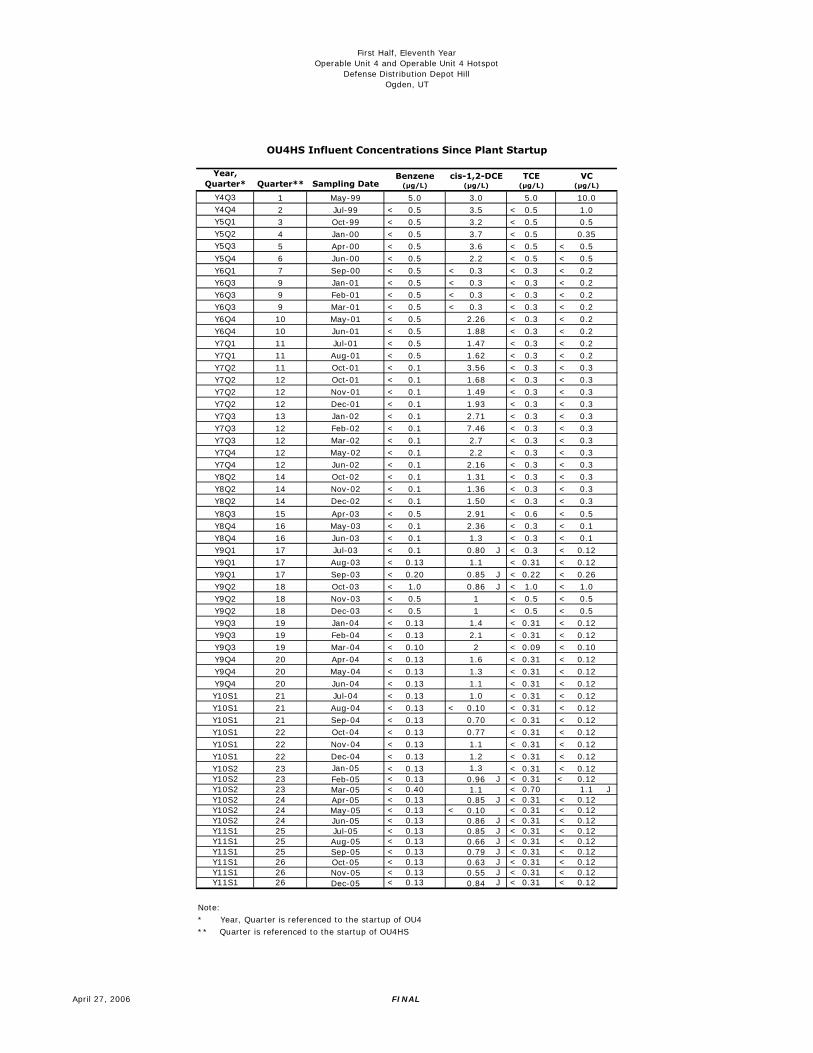
First Half, Eleventh YearOperable Unit 4 and Operable Unit 4 Hotspot
Defense Distribution Depot HillOgden, UT
Year, Quarter* Quarter** Sampling Date
Y4Q3 1 May-99 5.0 3.0 5.0 10.0Y4Q4 2 Jul-99 < 0.5 3.5 < 0.5 1.0Y5Q1 3 Oct-99 < 0.5 3.2 < 0.5 0.5Y5Q2 4 Jan-00 < 0.5 3.7 < 0.5 0.35Y5Q3 5 Apr-00 < 0.5 3.6 < 0.5 < 0.5Y5Q4 6 Jun-00 < 0.5 2.2 < 0.5 < 0.5Y6Q1 7 Sep-00 < 0.5 < 0.3 < 0.3 < 0.2Y6Q3 9 Jan-01 < 0.5 < 0.3 < 0.3 < 0.2Y6Q3 9 Feb-01 < 0.5 < 0.3 < 0.3 < 0.2Y6Q3 9 Mar-01 < 0.5 < 0.3 < 0.3 < 0.2Y6Q4 10 May-01 < 0.5 2.26 < 0.3 < 0.2Y6Q4 10 Jun-01 < 0.5 1.88 < 0.3 < 0.2Y7Q1 11 Jul-01 < 0.5 1.47 < 0.3 < 0.2Y7Q1 11 Aug-01 < 0.5 1.62 < 0.3 < 0.2Y7Q2 11 Oct-01 < 0.1 3.56 < 0.3 < 0.3Y7Q2 12 Oct-01 < 0.1 1.68 < 0.3 < 0.3Y7Q2 12 Nov-01 < 0.1 1.49 < 0.3 < 0.3Y7Q2 12 Dec-01 < 0.1 1.93 < 0.3 < 0.3Y7Q3 13 Jan-02 < 0.1 2.71 < 0.3 < 0.3Y7Q3 12 Feb-02 < 0.1 7.46 < 0.3 < 0.3Y7Q3 12 Mar-02 < 0.1 2.7 < 0.3 < 0.3Y7Q4 12 May-02 < 0.1 2.2 < 0.3 < 0.3Y7Q4 12 Jun-02 < 0.1 2.16 < 0.3 < 0.3Y8Q2 14 Oct-02 < 0.1 1.31 < 0.3 < 0.3Y8Q2 14 Nov-02 < 0.1 1.36 < 0.3 < 0.3Y8Q2 14 Dec-02 < 0.1 1.50 < 0.3 < 0.3
Y8Q3 15 Apr-03 < 0.5 2.91 < 0.6 < 0.5Y8Q4 16 May-03 < 0.1 2.36 < 0.3 < 0.1Y8Q4 16 Jun-03 < 0.1 1.3 < 0.3 < 0.1Y9Q1 17 Jul-03 < 0.1 0.80 J < 0.3 < 0.12Y9Q1 17 Aug-03 < 0.13 1.1 < 0.31 < 0.12Y9Q1 17 Sep-03 < 0.20 0.85 J < 0.22 < 0.26Y9Q2 18 Oct-03 < 1.0 0.86 J < 1.0 < 1.0Y9Q2 18 Nov-03 < 0.5 1 < 0.5 < 0.5Y9Q2 18 Dec-03 < 0.5 1 < 0.5 < 0.5Y9Q3 19 Jan-04 < 0.13 1.4 < 0.31 < 0.12Y9Q3 19 Feb-04 < 0.13 2.1 < 0.31 < 0.12Y9Q3 19 Mar-04 < 0.10 2 < 0.09 < 0.10Y9Q4 20 Apr-04 < 0.13 1.6 < 0.31 < 0.12Y9Q4 20 May-04 < 0.13 1.3 < 0.31 < 0.12Y9Q4 20 Jun-04 < 0.13 1.1 < 0.31 < 0.12Y10S1 21 Jul-04 < 0.13 1.0 < 0.31 < 0.12Y10S1 21 Aug-04 < 0.13 < 0.10 < 0.31 < 0.12Y10S1 21 Sep-04 < 0.13 0.70 < 0.31 < 0.12Y10S1 22 Oct-04 < 0.13 0.77 < 0.31 < 0.12Y10S1 22 Nov-04 < 0.13 1.1 < 0.31 < 0.12Y10S1 22 Dec-04 < 0.13 1.2 < 0.31 < 0.12Y10S2 23 Jan-05 < 0.13 1.3 < 0.31 < 0.12Y10S2 23 Feb-05 < 0.13 0.96 J < 0.31 < 0.12Y10S2 23 Mar-05 < 0.40 1.1 < 0.70 1.1 JY10S2 24 Apr-05 < 0.13 0.85 J < 0.31 < 0.12Y10S2 24 May-05 < 0.13 < 0.10 < 0.31 < 0.12Y10S2 24 Jun-05 < 0.13 0.86 J < 0.31 < 0.12Y11S1 25 Jul-05 < 0.13 0.85 J < 0.31 < 0.12Y11S1 25 Aug-05 < 0.13 0.66 J < 0.31 < 0.12Y11S1 25 Sep-05 < 0.13 0.79 J < 0.31 < 0.12Y11S1 26 Oct-05 < 0.13 0.63 J < 0.31 < 0.12Y11S1 26 Nov-05 < 0.13 0.55 J < 0.31 < 0.12Y11S1 26 Dec-05 < 0.13 0.84 J < 0.31 < 0.12
Note:* Year, Quarter is referenced to the startup of OU4** Quarter is referenced to the startup of OU4HS
OU4HS Influent Concentrations Since Plant Startup
Benzene (μg/L)
cis-1,2-DCE (μg/L)
TCE (μg/L)
VC (μg/L)
April 27, 2006 FINAL
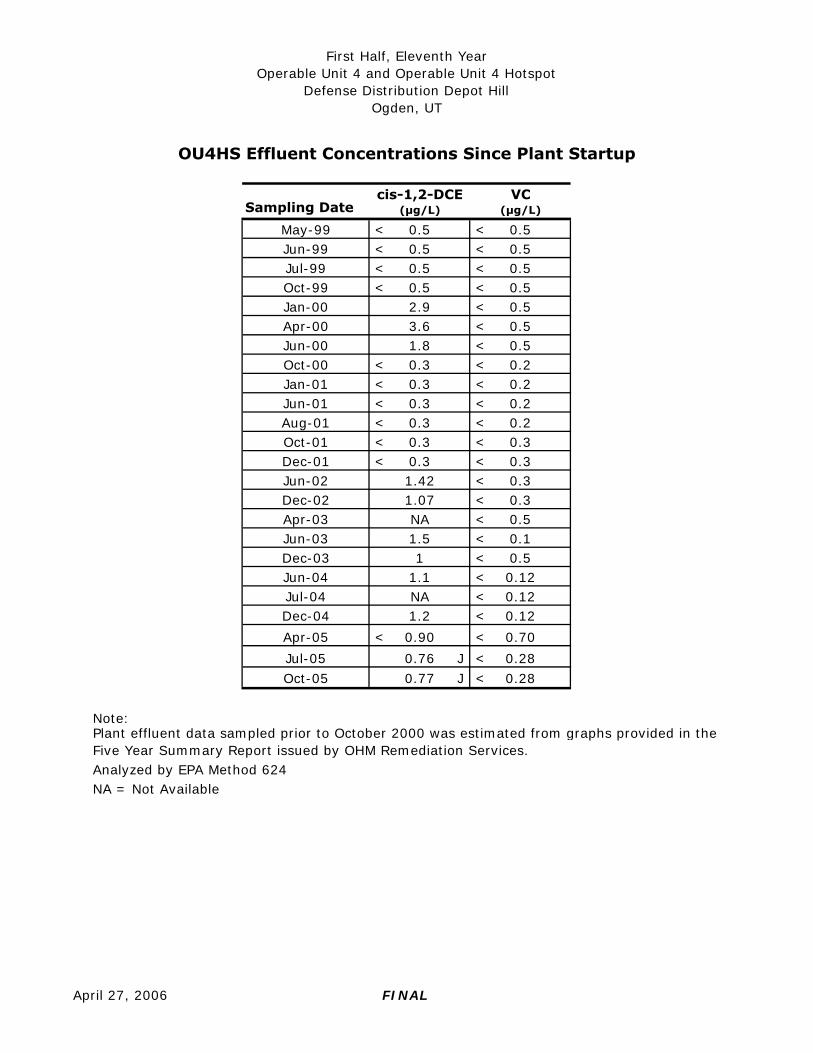
First Half, Eleventh YearOperable Unit 4 and Operable Unit 4 Hotspot
Defense Distribution Depot HillOgden, UT
Sampling Date
May-99 < 0.5 < 0.5Jun-99 < 0.5 < 0.5Jul-99 < 0.5 < 0.5Oct-99 < 0.5 < 0.5Jan-00 2.9 < 0.5Apr-00 3.6 < 0.5Jun-00 1.8 < 0.5Oct-00 < 0.3 < 0.2Jan-01 < 0.3 < 0.2Jun-01 < 0.3 < 0.2Aug-01 < 0.3 < 0.2Oct-01 < 0.3 < 0.3Dec-01 < 0.3 < 0.3Jun-02 1.42 < 0.3Dec-02 1.07 < 0.3Apr-03 NA < 0.5Jun-03 1.5 < 0.1Dec-03 1 < 0.5Jun-04 1.1 < 0.12Jul-04 NA < 0.12Dec-04 1.2 < 0.12
Apr-05 < 0.90 < 0.70
Jul-05 0.76 J < 0.28Oct-05 0.77 J < 0.28
Note:
Analyzed by EPA Method 624NA = Not Available
OU4HS Effluent Concentrations Since Plant Startup
cis-1,2-DCE (μg/L)
VC (μg/L)
Plant effluent data sampled prior to October 2000 was estimated from graphs provided in the Five Year Summary Report issued by OHM Remediation Services.
April 27, 2006 FINAL

First Half, Eleventh YearOperable Unit 4 and Operable Unit 4 Hotspot
Defense Distribution Depot HillOgden, UT
Date
Oct-98 < 0.5 1.6
Apr-99 NA NA
Oct-99 0.2 1.9
Jan-00 4 2.4
Mar-00 2 1.5
Mar-00 3.1 2.2
Apr-00 2.5 1.9
May-00 1.9 1.3
Jun-00 1.8 1.2
Oct-00 1.6 < 0.2
Jan-01 1.6 < 0.2
Jun-01 < 0.3 0.43
Dec-01 1.16 < 0.3
Jun-02 0.82 J < 0.3
Dec-02 1.6 < 0.3
Jun-03 0.75 J 0.3 JDec-03 2 0.2 JJun-04 0.47 J < 0.12Dec-04 0.43 < 0.12Jul-05 0.53 J < 0.12Jan-06 < 0.10 < 0.12
HS-05 Concentrations
VC (μg/L)
cis-1,2-DCE (μg/L)
April 27, 2006 FINAL
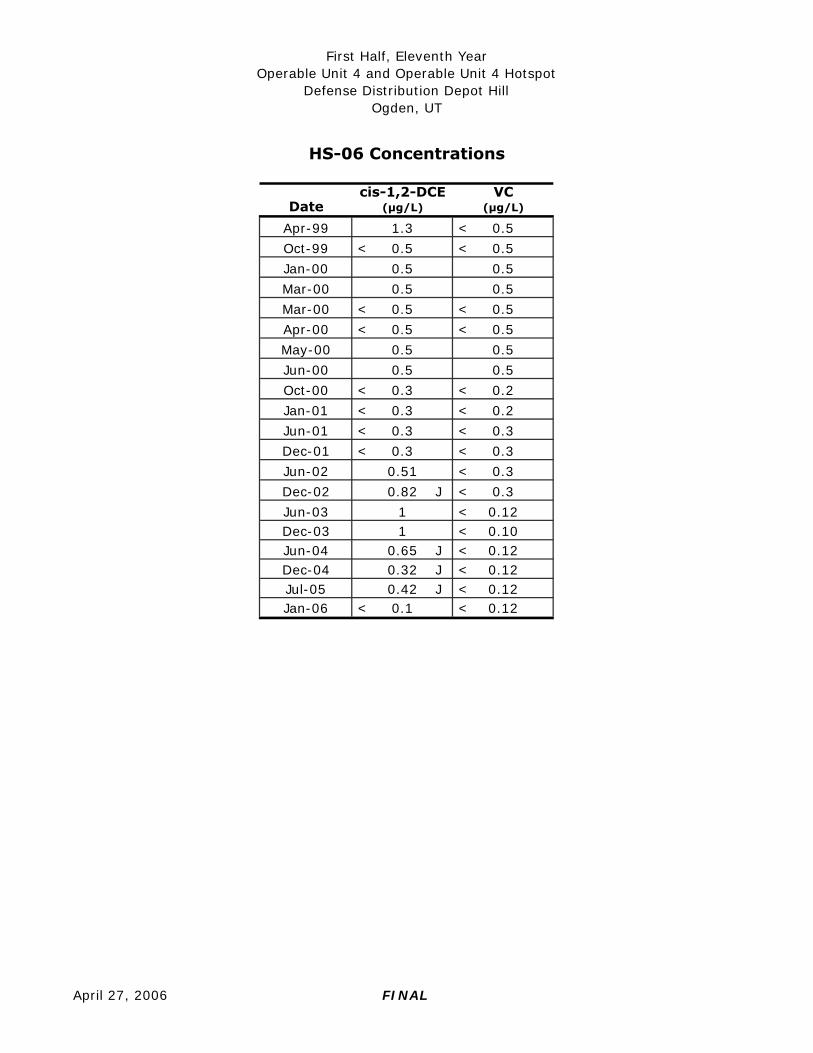
First Half, Eleventh YearOperable Unit 4 and Operable Unit 4 Hotspot
Defense Distribution Depot HillOgden, UT
Date
Apr-99 1.3 < 0.5
Oct-99 < 0.5 < 0.5
Jan-00 0.5 0.5
Mar-00 0.5 0.5
Mar-00 < 0.5 < 0.5
Apr-00 < 0.5 < 0.5
May-00 0.5 0.5
Jun-00 0.5 0.5
Oct-00 < 0.3 < 0.2
Jan-01 < 0.3 < 0.2
Jun-01 < 0.3 < 0.3
Dec-01 < 0.3 < 0.3
Jun-02 0.51 < 0.3
Dec-02 0.82 J < 0.3
Jun-03 1 < 0.12Dec-03 1 < 0.10Jun-04 0.65 J < 0.12Dec-04 0.32 J < 0.12Jul-05 0.42 J < 0.12Jan-06 < 0.1 < 0.12
HS-06 Concentrations
cis-1,2-DCE (μg/L)
VC (μg/L)
April 27, 2006 FINAL
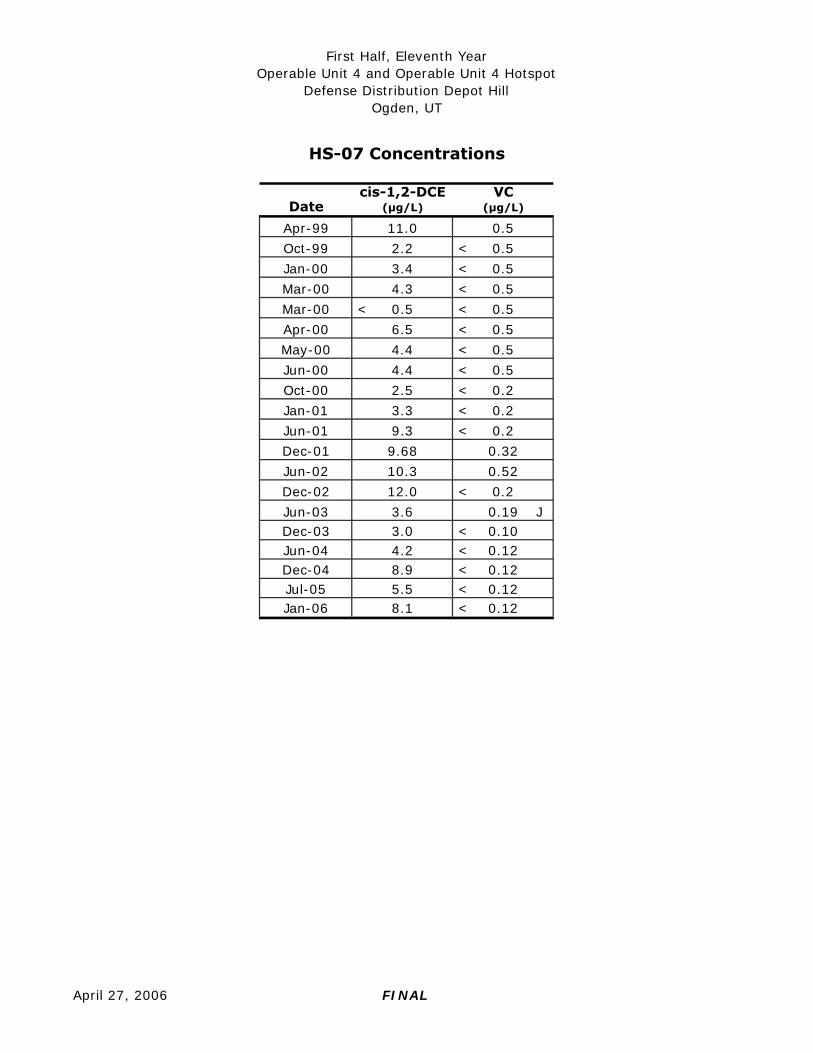
First Half, Eleventh YearOperable Unit 4 and Operable Unit 4 Hotspot
Defense Distribution Depot HillOgden, UT
Date
Apr-99 11.0 0.5
Oct-99 2.2 < 0.5
Jan-00 3.4 < 0.5
Mar-00 4.3 < 0.5
Mar-00 < 0.5 < 0.5
Apr-00 6.5 < 0.5
May-00 4.4 < 0.5
Jun-00 4.4 < 0.5
Oct-00 2.5 < 0.2
Jan-01 3.3 < 0.2
Jun-01 9.3 < 0.2
Dec-01 9.68 0.32
Jun-02 10.3 0.52
Dec-02 12.0 < 0.2
Jun-03 3.6 0.19 JDec-03 3.0 < 0.10Jun-04 4.2 < 0.12Dec-04 8.9 < 0.12Jul-05 5.5 < 0.12Jan-06 8.1 < 0.12
HS-07 Concentrations
VC (μg/L)
cis-1,2-DCE (μg/L)
April 27, 2006 FINAL

First Half, Eleventh YearOperable Unit 4 and Operable Unit 4 Hotspot
Defense Distribution Depot HillOgden, UT
Date
Apr-99 3.2 9.6
Oct-99 1.8 3.8
Jan-00 2.8 3.8
Mar-00 1.9 2.5
Mar-00 2 3.4
Apr-00 1.6 1.6
May-00 1.2 1
Jun-00 1.5 1.7
Oct-00 2.5 3.3
Jan-01 2.1 5.2
Jun-01 1.59 3.71
Dec-01 4.13 4.82
Jun-02 3.23 4.45
Dec-02 5.51 4.56
Jun-03 4.8 2.8Dec-03 6 3Jun-04 3.2 3.4Dec-04 4.7 3.7Jul-05 2.9 3.0Jan-06 3.0 3.4
HS-08 Concentrations
cis-1,2-DCE (μg/L)
VC (μg/L)
April 27, 2006 FINAL
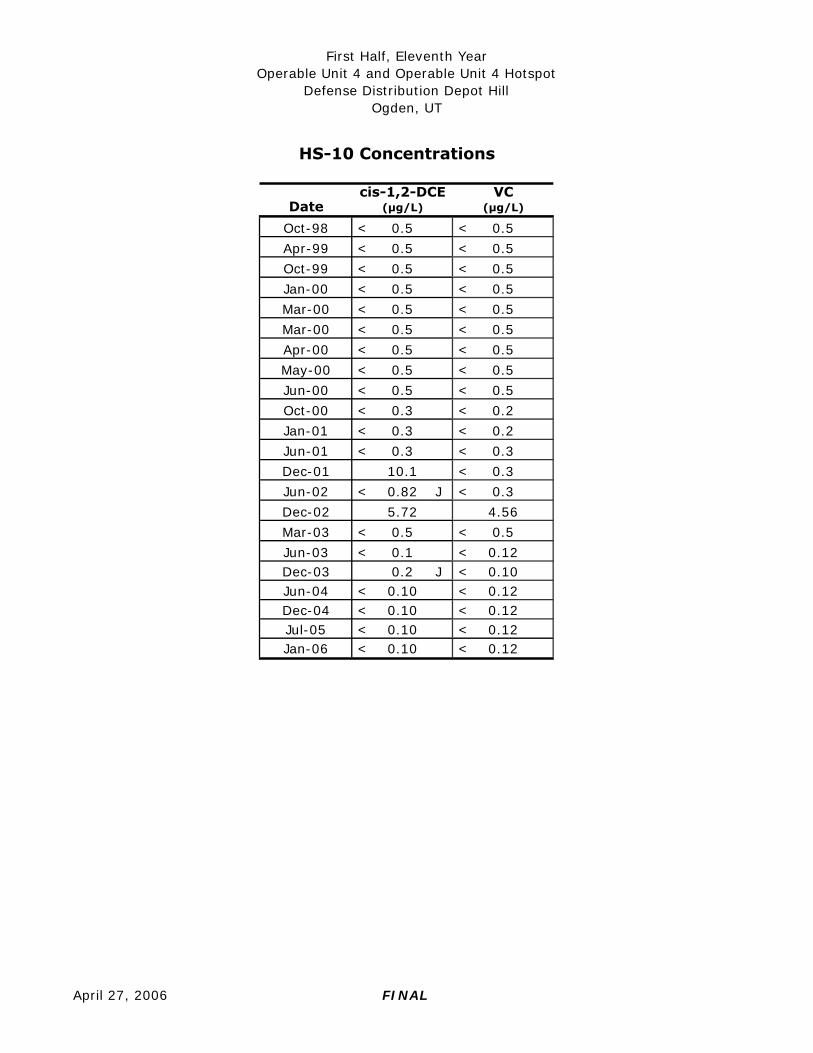
First Half, Eleventh YearOperable Unit 4 and Operable Unit 4 Hotspot
Defense Distribution Depot HillOgden, UT
Date
Oct-98 < 0.5 < 0.5
Apr-99 < 0.5 < 0.5
Oct-99 < 0.5 < 0.5
Jan-00 < 0.5 < 0.5
Mar-00 < 0.5 < 0.5
Mar-00 < 0.5 < 0.5
Apr-00 < 0.5 < 0.5
May-00 < 0.5 < 0.5
Jun-00 < 0.5 < 0.5
Oct-00 < 0.3 < 0.2
Jan-01 < 0.3 < 0.2
Jun-01 < 0.3 < 0.3
Dec-01 10.1 < 0.3
Jun-02 < 0.82 J < 0.3
Dec-02 5.72 4.56
Mar-03 < 0.5 < 0.5
Jun-03 < 0.1 < 0.12Dec-03 0.2 J < 0.10Jun-04 < 0.10 < 0.12Dec-04 < 0.10 < 0.12Jul-05 < 0.10 < 0.12Jan-06 < 0.10 < 0.12
HS-10 Concentrations
cis-1,2-DCE (μg/L)
VC (μg/L)
April 27, 2006 FINAL

First Half, Eleventh YearOperable Unit 4 and Operable Unit 4 Hotspot
Defense Distribution Depot HillOgden, UT
Date
Oct-98 < 0.5 1.7
Apr-99 < 0.5 1.0
Oct-99 < 0.5 0.81
Apr-00 < 0.5 0.98
Oct-00 < 0.3 < 0.2
Jan-01 < 0.3 < 0.2
Jun-01 0.64 < 0.3
Dec-01 < 0.3 < 0.3
Jun-02 < 0.3 < 0.3
Dec-02 < 0.3 < 0.3
Jun-03 < 0.1 < 0.12Dec-03 0.3 J < 0.10Jun-04 0.57 J < 0.12Dec-04 0.50 < 0.12Jun-05 0.38 J < 0.12Jan-06 0.63 J < 0.12
JMM-07R Concentrations
VC (μg/L)
cis-1,2-DCE (μg/L)
April 27, 2006 FINAL
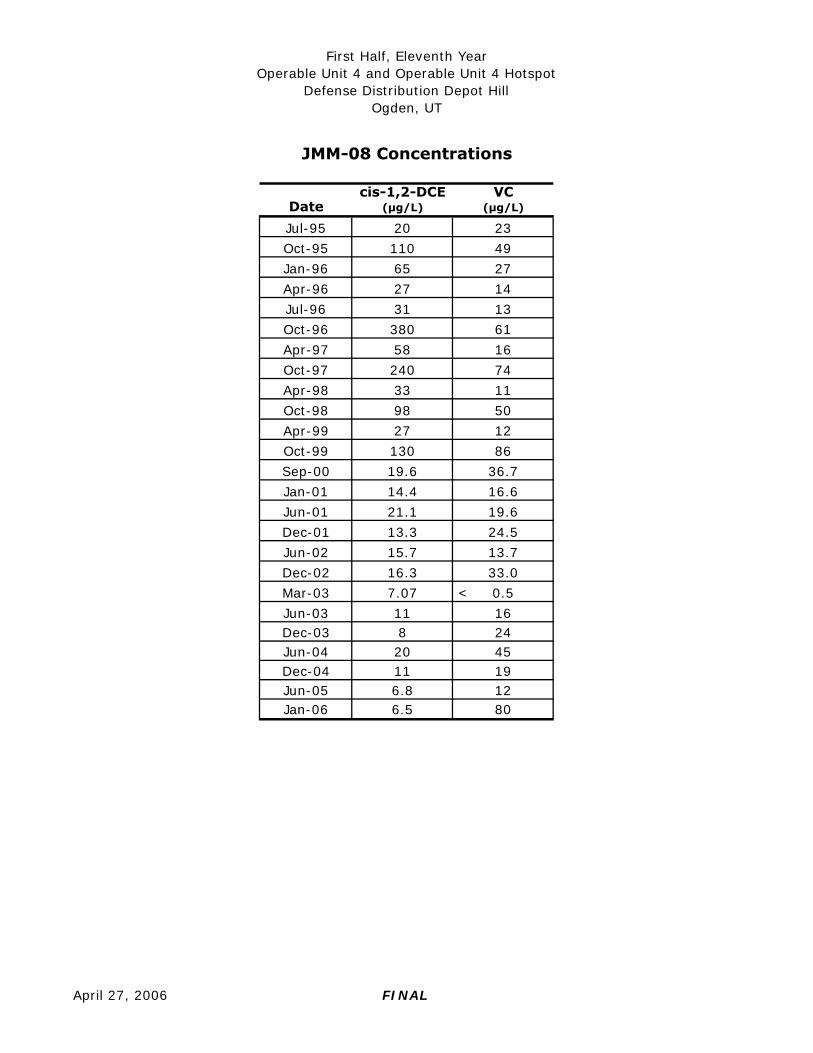
First Half, Eleventh YearOperable Unit 4 and Operable Unit 4 Hotspot
Defense Distribution Depot HillOgden, UT
Date
Jul-95 20 23
Oct-95 110 49
Jan-96 65 27
Apr-96 27 14
Jul-96 31 13
Oct-96 380 61
Apr-97 58 16
Oct-97 240 74
Apr-98 33 11
Oct-98 98 50
Apr-99 27 12
Oct-99 130 86
Sep-00 19.6 36.7
Jan-01 14.4 16.6
Jun-01 21.1 19.6
Dec-01 13.3 24.5
Jun-02 15.7 13.7
Dec-02 16.3 33.0
Mar-03 7.07 < 0.5
Jun-03 11 16Dec-03 8 24Jun-04 20 45Dec-04 11 19Jun-05 6.8 12Jan-06 6.5 80
VC (μg/L)
JMM-08 Concentrations
cis-1,2-DCE (μg/L)
April 27, 2006 FINAL

First Half, Eleventh YearOperable Unit 4 and Operable Unit 4 Hotspot
Defense Distribution Depot HillOgden, UT
Date
Jul-95 2,000 NA
Oct-95 55 130
Jan-96 86 140
Apr-96 57 90
Jul-96 30 28
Oct-96 22 19
Apr-97 14 20
Oct-97 7.7 13
Apr-98 8.8 7.8
Oct-98 6.4 5.9
Apr-99 5.2 6.8
Oct-99 5.5 5
Sep-00 5.02 4.8 J
Jan-01 2.8 < 0.2
Jun-01 3.59 3.66
Dec-01 2.94 2.41
Jun-02 2.78 2.45
Dec-02 3.29 2.43
Jun-03 3.1 2.2Dec-03 2 2Jun-04 1.9 1.5Dec-04 1.8 1.8Jun-05 2.2 2.4Jan-06 1.6 2.9
VC (μg/L)
JMM-09 Concentrations
cis-1,2-DCE (μg/L)
April 27, 2006 FINAL
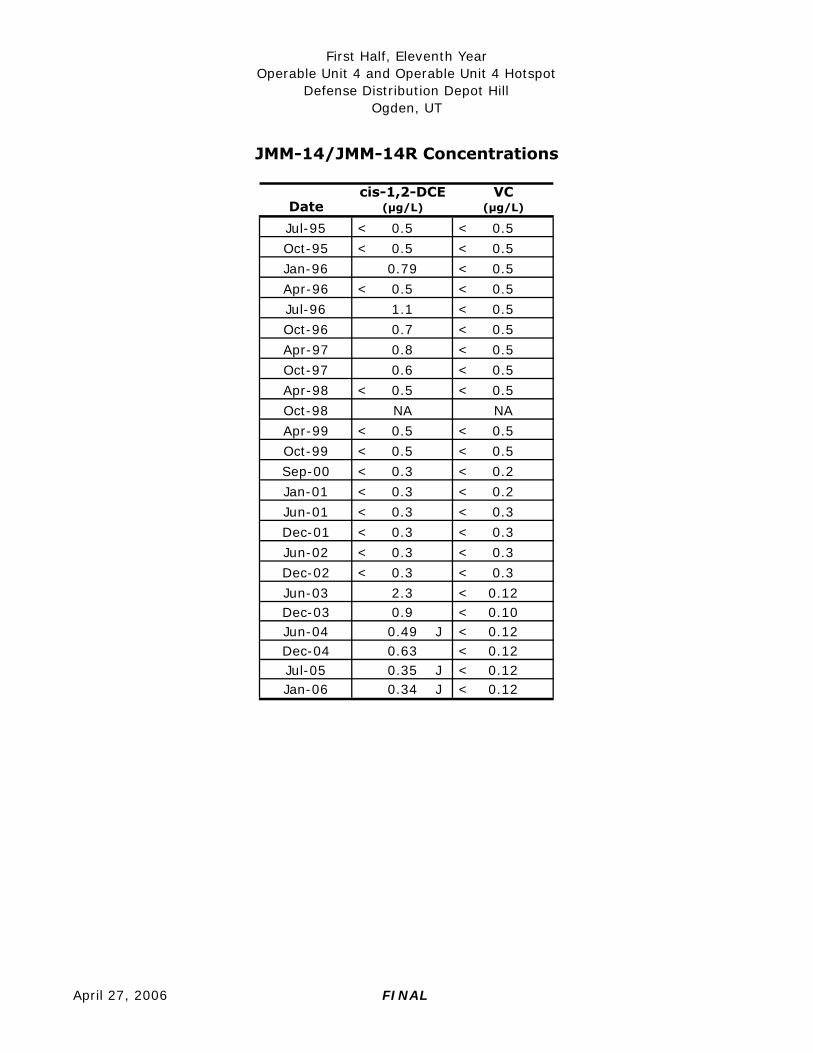
First Half, Eleventh YearOperable Unit 4 and Operable Unit 4 Hotspot
Defense Distribution Depot HillOgden, UT
Date
Jul-95 < 0.5 < 0.5
Oct-95 < 0.5 < 0.5
Jan-96 0.79 < 0.5
Apr-96 < 0.5 < 0.5
Jul-96 1.1 < 0.5
Oct-96 0.7 < 0.5
Apr-97 0.8 < 0.5
Oct-97 0.6 < 0.5
Apr-98 < 0.5 < 0.5
Oct-98 NA NA
Apr-99 < 0.5 < 0.5
Oct-99 < 0.5 < 0.5
Sep-00 < 0.3 < 0.2
Jan-01 < 0.3 < 0.2
Jun-01 < 0.3 < 0.3
Dec-01 < 0.3 < 0.3
Jun-02 < 0.3 < 0.3
Dec-02 < 0.3 < 0.3
Jun-03 2.3 < 0.12Dec-03 0.9 < 0.10Jun-04 0.49 J < 0.12Dec-04 0.63 < 0.12Jul-05 0.35 J < 0.12Jan-06 0.34 J < 0.12
JMM-14/JMM-14R Concentrations
cis-1,2-DCE (μg/L)
VC (μg/L)
April 27, 2006 FINAL
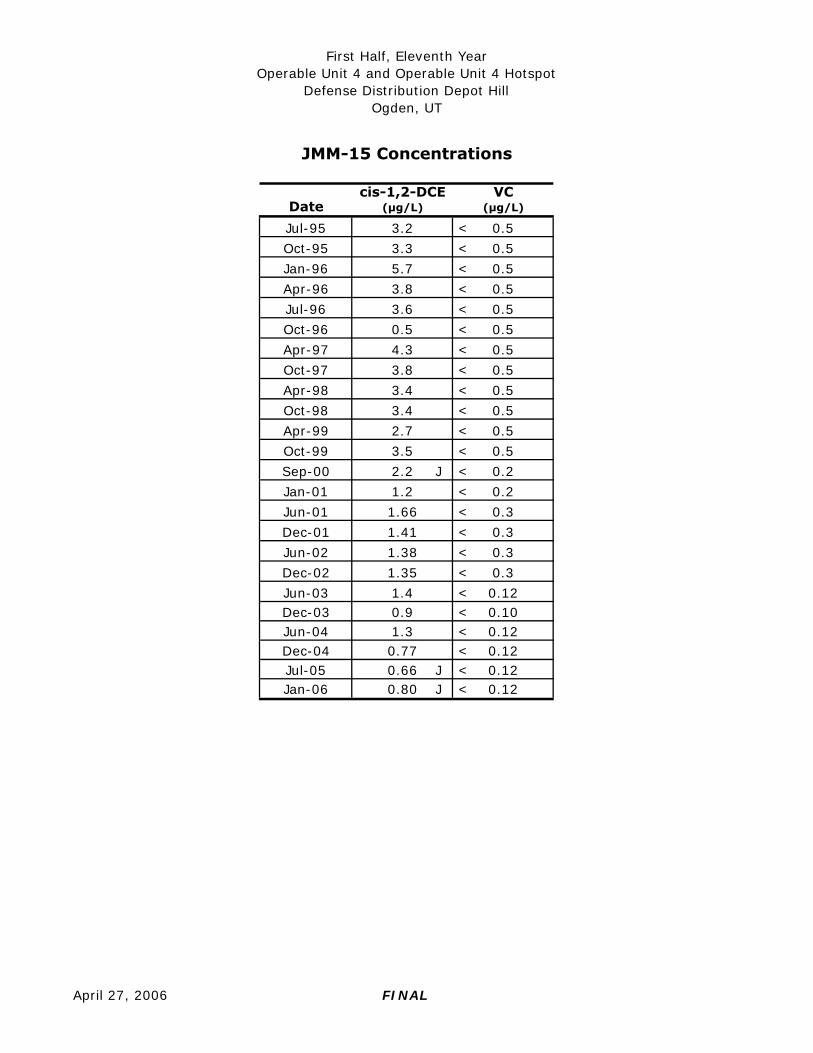
First Half, Eleventh YearOperable Unit 4 and Operable Unit 4 Hotspot
Defense Distribution Depot HillOgden, UT
Date
Jul-95 3.2 < 0.5
Oct-95 3.3 < 0.5
Jan-96 5.7 < 0.5
Apr-96 3.8 < 0.5
Jul-96 3.6 < 0.5
Oct-96 0.5 < 0.5
Apr-97 4.3 < 0.5
Oct-97 3.8 < 0.5
Apr-98 3.4 < 0.5
Oct-98 3.4 < 0.5
Apr-99 2.7 < 0.5
Oct-99 3.5 < 0.5
Sep-00 2.2 J < 0.2
Jan-01 1.2 < 0.2
Jun-01 1.66 < 0.3
Dec-01 1.41 < 0.3
Jun-02 1.38 < 0.3
Dec-02 1.35 < 0.3
Jun-03 1.4 < 0.12Dec-03 0.9 < 0.10Jun-04 1.3 < 0.12Dec-04 0.77 < 0.12Jul-05 0.66 J < 0.12Jan-06 0.80 J < 0.12
JMM-15 Concentrations
VC (μg/L)
cis-1,2-DCE (μg/L)
April 27, 2006 FINAL
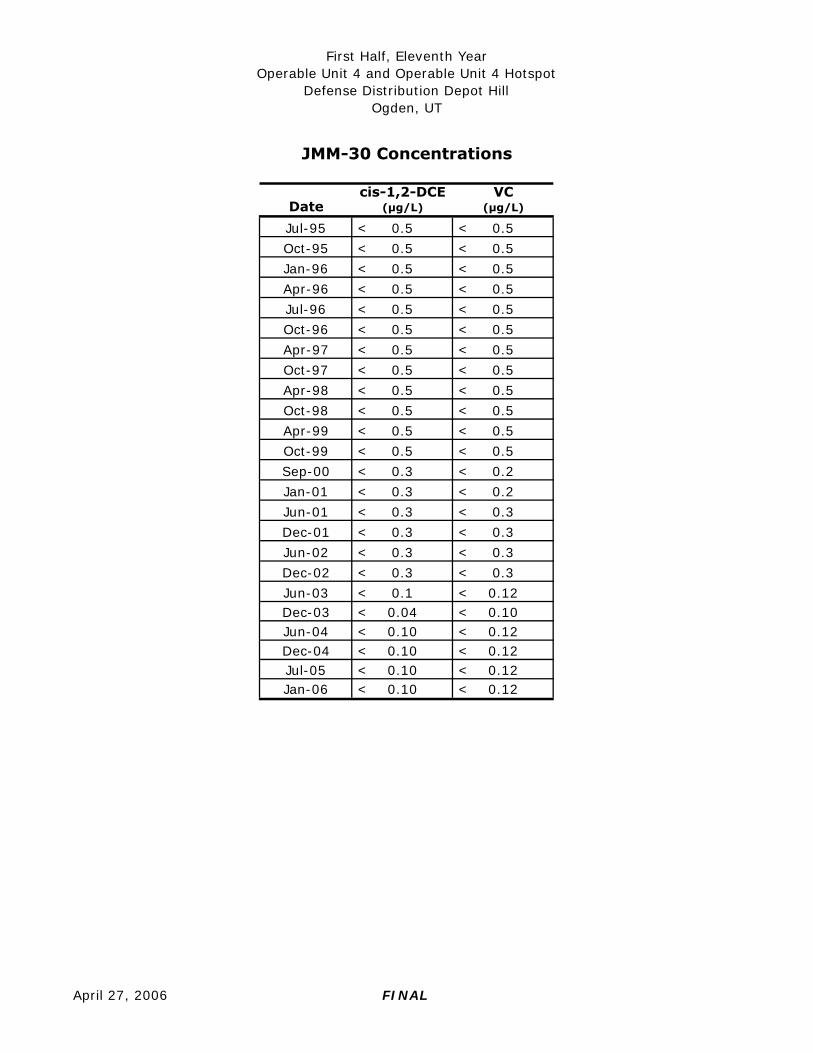
First Half, Eleventh YearOperable Unit 4 and Operable Unit 4 Hotspot
Defense Distribution Depot HillOgden, UT
Date
Jul-95 < 0.5 < 0.5
Oct-95 < 0.5 < 0.5
Jan-96 < 0.5 < 0.5
Apr-96 < 0.5 < 0.5
Jul-96 < 0.5 < 0.5
Oct-96 < 0.5 < 0.5
Apr-97 < 0.5 < 0.5
Oct-97 < 0.5 < 0.5
Apr-98 < 0.5 < 0.5
Oct-98 < 0.5 < 0.5
Apr-99 < 0.5 < 0.5
Oct-99 < 0.5 < 0.5
Sep-00 < 0.3 < 0.2
Jan-01 < 0.3 < 0.2
Jun-01 < 0.3 < 0.3
Dec-01 < 0.3 < 0.3
Jun-02 < 0.3 < 0.3
Dec-02 < 0.3 < 0.3
Jun-03 < 0.1 < 0.12Dec-03 < 0.04 < 0.10Jun-04 < 0.10 < 0.12Dec-04 < 0.10 < 0.12Jul-05 < 0.10 < 0.12Jan-06 < 0.10 < 0.12
JMM-30 Concentrations
VC (μg/L)
cis-1,2-DCE (μg/L)
April 27, 2006 FINAL
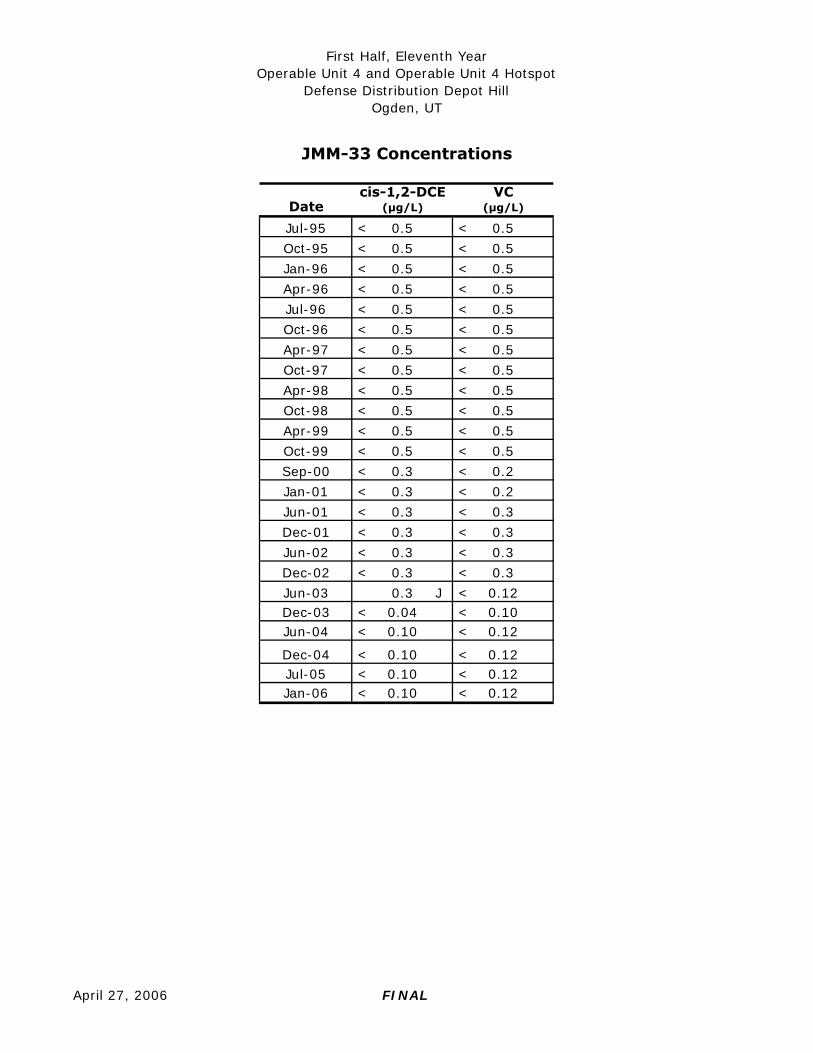
First Half, Eleventh YearOperable Unit 4 and Operable Unit 4 Hotspot
Defense Distribution Depot HillOgden, UT
Date
Jul-95 < 0.5 < 0.5
Oct-95 < 0.5 < 0.5
Jan-96 < 0.5 < 0.5
Apr-96 < 0.5 < 0.5
Jul-96 < 0.5 < 0.5
Oct-96 < 0.5 < 0.5
Apr-97 < 0.5 < 0.5
Oct-97 < 0.5 < 0.5
Apr-98 < 0.5 < 0.5
Oct-98 < 0.5 < 0.5
Apr-99 < 0.5 < 0.5
Oct-99 < 0.5 < 0.5
Sep-00 < 0.3 < 0.2
Jan-01 < 0.3 < 0.2
Jun-01 < 0.3 < 0.3
Dec-01 < 0.3 < 0.3
Jun-02 < 0.3 < 0.3
Dec-02 < 0.3 < 0.3
Jun-03 0.3 J < 0.12Dec-03 < 0.04 < 0.10Jun-04 < 0.10 < 0.12
Dec-04 < 0.10 < 0.12Jul-05 < 0.10 < 0.12Jan-06 < 0.10 < 0.12
JMM-33 Concentrations
VC (μg/L)
cis-1,2-DCE (μg/L)
April 27, 2006 FINAL
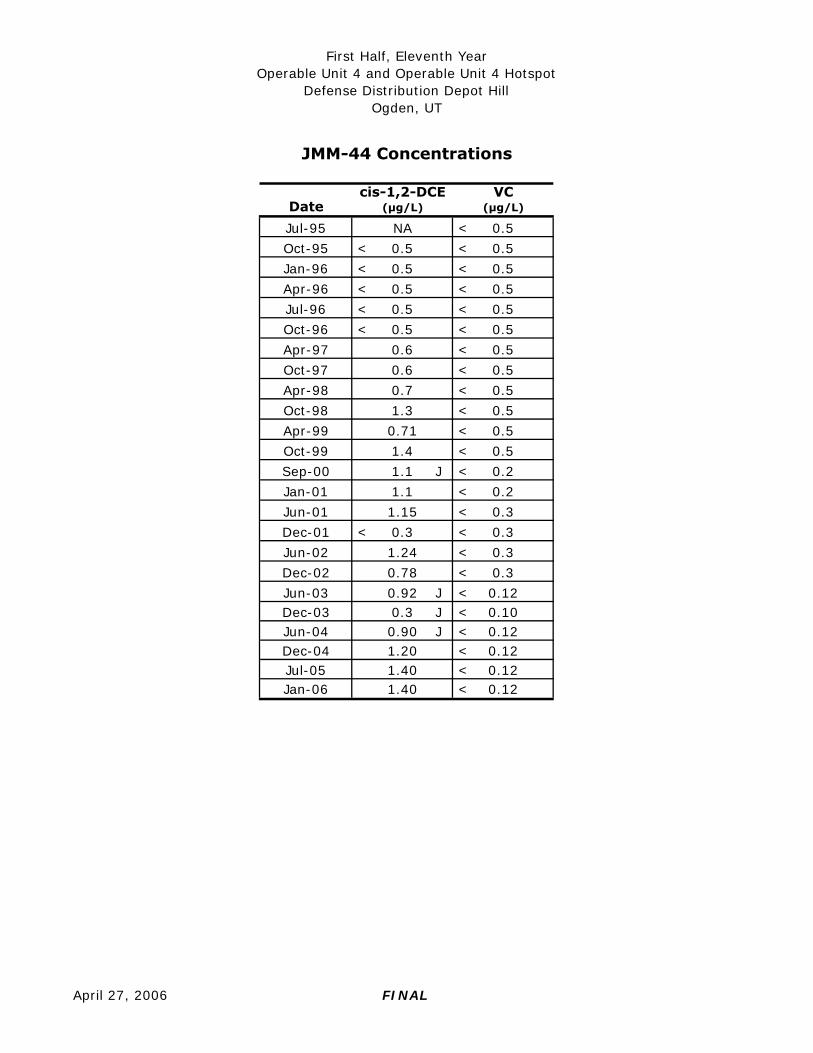
First Half, Eleventh YearOperable Unit 4 and Operable Unit 4 Hotspot
Defense Distribution Depot HillOgden, UT
Date
Jul-95 NA < 0.5
Oct-95 < 0.5 < 0.5
Jan-96 < 0.5 < 0.5
Apr-96 < 0.5 < 0.5
Jul-96 < 0.5 < 0.5
Oct-96 < 0.5 < 0.5
Apr-97 0.6 < 0.5
Oct-97 0.6 < 0.5
Apr-98 0.7 < 0.5
Oct-98 1.3 < 0.5
Apr-99 0.71 < 0.5
Oct-99 1.4 < 0.5
Sep-00 1.1 J < 0.2
Jan-01 1.1 < 0.2
Jun-01 1.15 < 0.3
Dec-01 < 0.3 < 0.3
Jun-02 1.24 < 0.3
Dec-02 0.78 < 0.3
Jun-03 0.92 J < 0.12Dec-03 0.3 J < 0.10Jun-04 0.90 J < 0.12Dec-04 1.20 < 0.12Jul-05 1.40 < 0.12Jan-06 1.40 < 0.12
JMM-44 Concentrations
VC (μg/L)
cis-1,2-DCE (μg/L)
April 27, 2006 FINAL
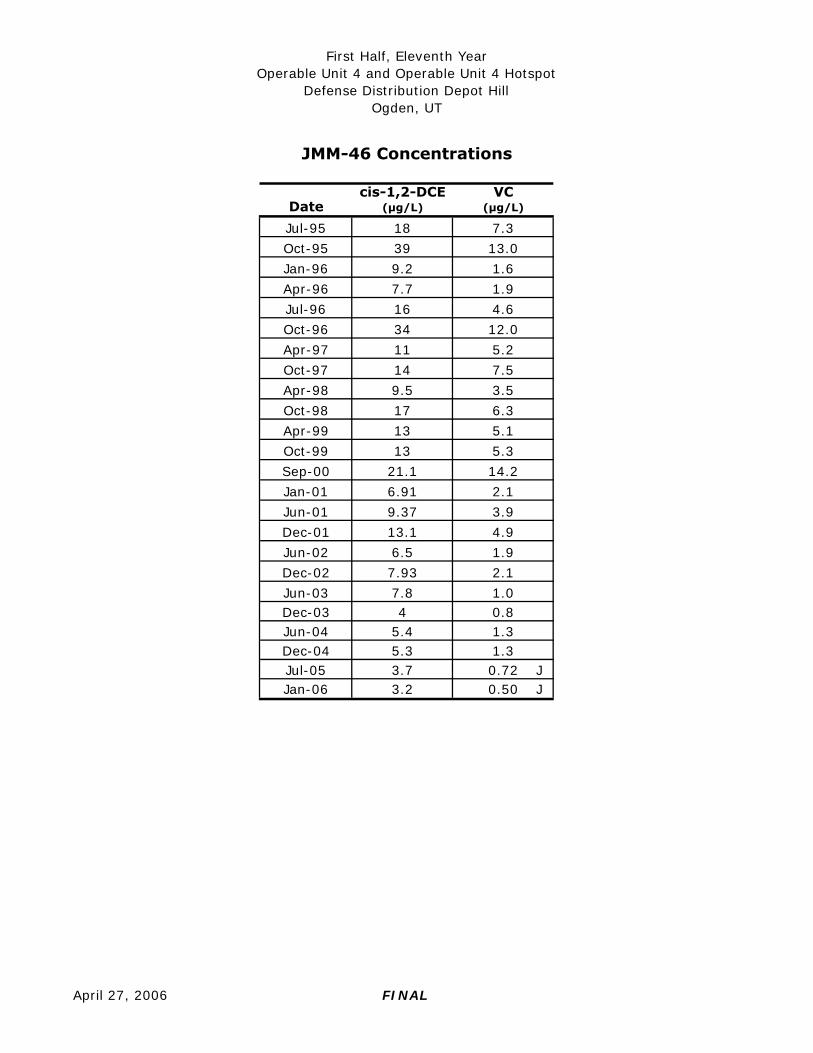
First Half, Eleventh YearOperable Unit 4 and Operable Unit 4 Hotspot
Defense Distribution Depot HillOgden, UT
Date
Jul-95 18 7.3
Oct-95 39 13.0
Jan-96 9.2 1.6
Apr-96 7.7 1.9
Jul-96 16 4.6
Oct-96 34 12.0
Apr-97 11 5.2
Oct-97 14 7.5
Apr-98 9.5 3.5
Oct-98 17 6.3
Apr-99 13 5.1
Oct-99 13 5.3
Sep-00 21.1 14.2
Jan-01 6.91 2.1
Jun-01 9.37 3.9
Dec-01 13.1 4.9
Jun-02 6.5 1.9
Dec-02 7.93 2.1
Jun-03 7.8 1.0Dec-03 4 0.8Jun-04 5.4 1.3Dec-04 5.3 1.3Jul-05 3.7 0.72 JJan-06 3.2 0.50 J
JMM-46 Concentrations
cis-1,2-DCE (μg/L)
VC (μg/L)
April 27, 2006 FINAL

First Half, Eleventh YearOperable Unit 4 and Operable Unit 4 Hotspot
Defense Distribution Depot HillOgden, UT
Date
Jul-95 16.2 0.2
Oct-95 6.5 3.5
Jan-96 37 7.1
Apr-96 33 9.4
Jul-96 11 3.9
Oct-96 5.8 0.2
Apr-97 3.1 1.4
Oct-97 2.4 0.8
Apr-98 8.2 7.7
Oct-98 3 0.8
Apr-99 3 2
Oct-99 3.1 1.8
Sep-00 0.99 J < 0.2
Jan-01 2.1 < 0.2
Jun-01 0.65 < 0.3
Dec-01 1.6 0.5
Jun-02 0.62 < 0.3
Dec-02 0.55 < 0.3
Jun-03 0.52 J < 0.12Dec-03 0.3 J < 0.10Jun-04 0.24 J < 0.12Dec-04 0.54 < 0.12Jul-05 3.4 0.69 JJan-06 0.67 J < 0.12
JMM-56 Concentrations
VC (μg/L)
cis-1,2-DCE (μg/L)
April 27, 2006 FINAL
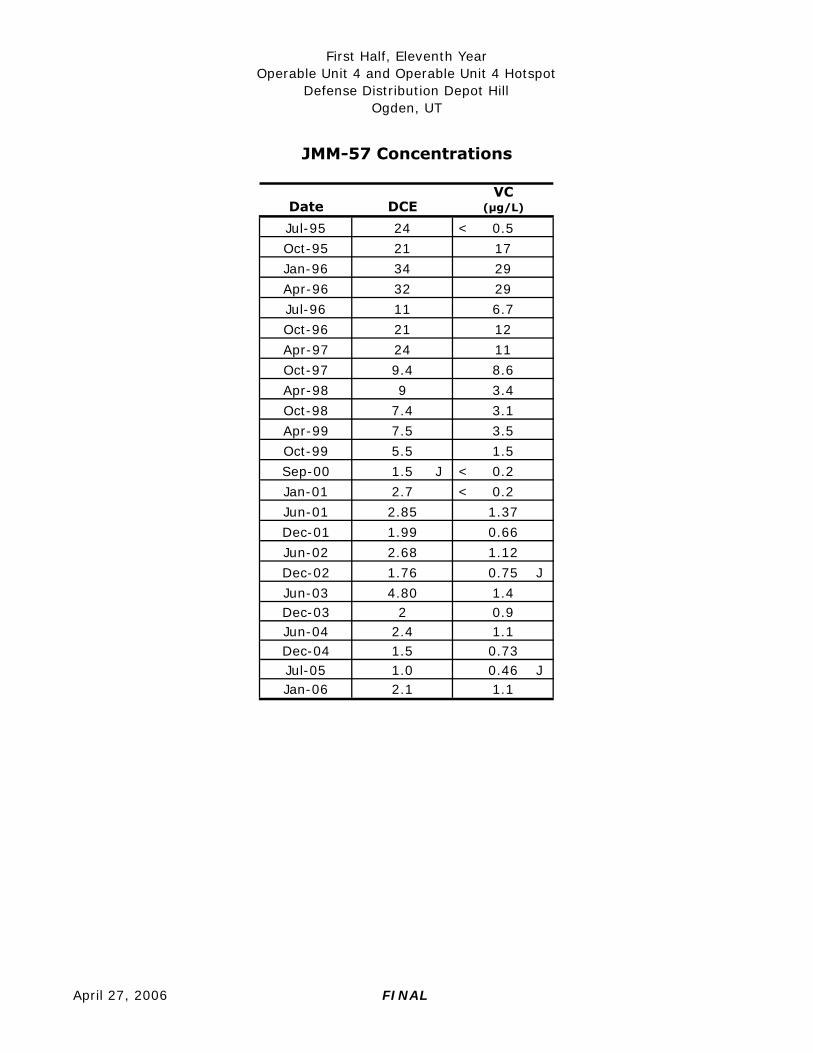
First Half, Eleventh YearOperable Unit 4 and Operable Unit 4 Hotspot
Defense Distribution Depot HillOgden, UT
Date
Jul-95 24 < 0.5
Oct-95 21 17
Jan-96 34 29
Apr-96 32 29
Jul-96 11 6.7
Oct-96 21 12
Apr-97 24 11
Oct-97 9.4 8.6
Apr-98 9 3.4
Oct-98 7.4 3.1
Apr-99 7.5 3.5
Oct-99 5.5 1.5
Sep-00 1.5 J < 0.2
Jan-01 2.7 < 0.2
Jun-01 2.85 1.37
Dec-01 1.99 0.66
Jun-02 2.68 1.12
Dec-02 1.76 0.75 J
Jun-03 4.80 1.4Dec-03 2 0.9Jun-04 2.4 1.1Dec-04 1.5 0.73Jul-05 1.0 0.46 JJan-06 2.1 1.1
JMM-57 Concentrations
DCEVC
(μg/L)
April 27, 2006 FINAL
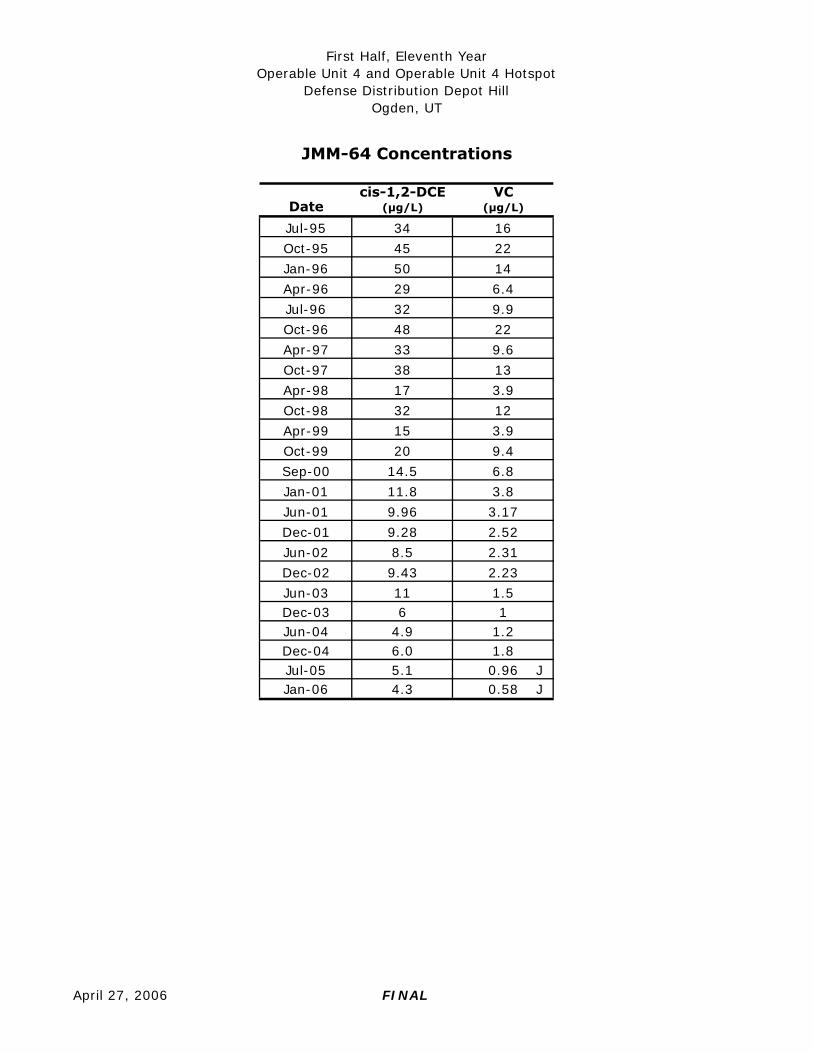
First Half, Eleventh YearOperable Unit 4 and Operable Unit 4 Hotspot
Defense Distribution Depot HillOgden, UT
Date
Jul-95 34 16
Oct-95 45 22
Jan-96 50 14
Apr-96 29 6.4
Jul-96 32 9.9
Oct-96 48 22
Apr-97 33 9.6
Oct-97 38 13
Apr-98 17 3.9
Oct-98 32 12
Apr-99 15 3.9
Oct-99 20 9.4
Sep-00 14.5 6.8
Jan-01 11.8 3.8
Jun-01 9.96 3.17
Dec-01 9.28 2.52
Jun-02 8.5 2.31
Dec-02 9.43 2.23
Jun-03 11 1.5Dec-03 6 1Jun-04 4.9 1.2Dec-04 6.0 1.8Jul-05 5.1 0.96 JJan-06 4.3 0.58 J
JMM-64 Concentrations
cis-1,2-DCE (μg/L)
VC (μg/L)
April 27, 2006 FINAL
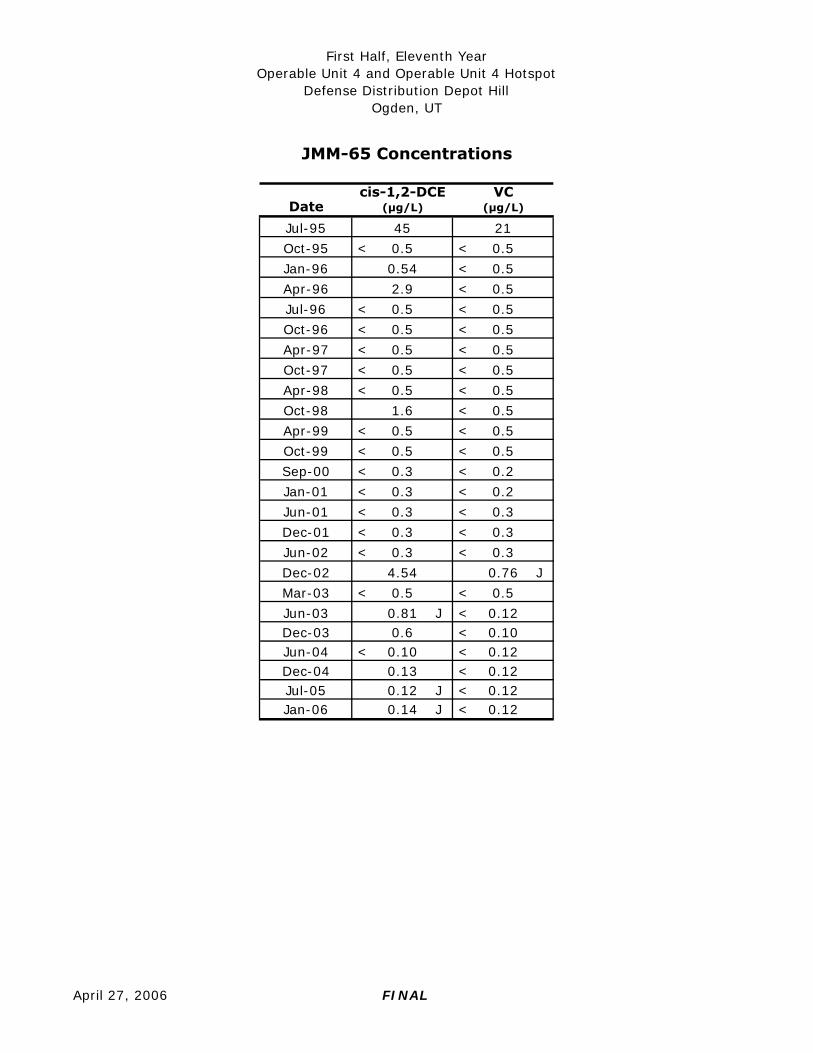
First Half, Eleventh YearOperable Unit 4 and Operable Unit 4 Hotspot
Defense Distribution Depot HillOgden, UT
Date
Jul-95 45 21
Oct-95 < 0.5 < 0.5
Jan-96 0.54 < 0.5
Apr-96 2.9 < 0.5
Jul-96 < 0.5 < 0.5
Oct-96 < 0.5 < 0.5
Apr-97 < 0.5 < 0.5
Oct-97 < 0.5 < 0.5
Apr-98 < 0.5 < 0.5
Oct-98 1.6 < 0.5
Apr-99 < 0.5 < 0.5
Oct-99 < 0.5 < 0.5
Sep-00 < 0.3 < 0.2
Jan-01 < 0.3 < 0.2
Jun-01 < 0.3 < 0.3
Dec-01 < 0.3 < 0.3
Jun-02 < 0.3 < 0.3
Dec-02 4.54 0.76 J
Mar-03 < 0.5 < 0.5
Jun-03 0.81 J < 0.12Dec-03 0.6 < 0.10Jun-04 < 0.10 < 0.12Dec-04 0.13 < 0.12Jul-05 0.12 J < 0.12Jan-06 0.14 J < 0.12
JMM-65 Concentrations
VC (μg/L)
cis-1,2-DCE (μg/L)
April 27, 2006 FINAL
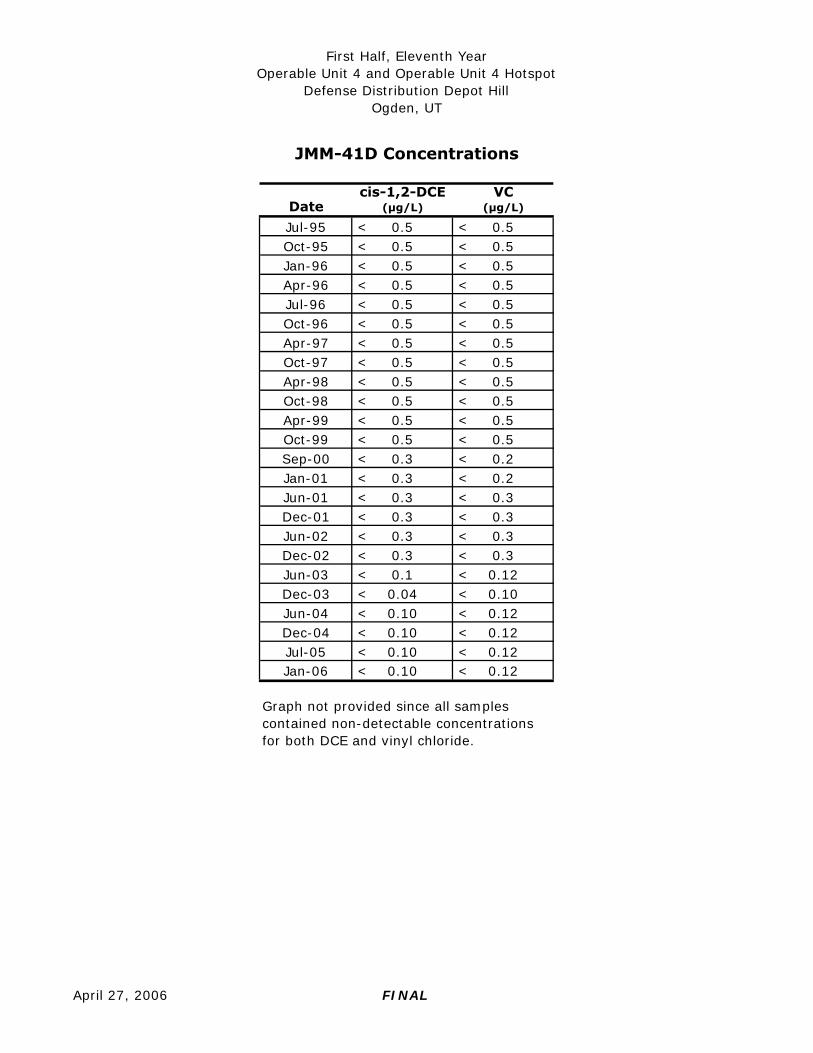
First Half, Eleventh YearOperable Unit 4 and Operable Unit 4 Hotspot
Defense Distribution Depot HillOgden, UT
Date
Jul-95 < 0.5 < 0.5Oct-95 < 0.5 < 0.5Jan-96 < 0.5 < 0.5Apr-96 < 0.5 < 0.5Jul-96 < 0.5 < 0.5Oct-96 < 0.5 < 0.5Apr-97 < 0.5 < 0.5Oct-97 < 0.5 < 0.5Apr-98 < 0.5 < 0.5Oct-98 < 0.5 < 0.5Apr-99 < 0.5 < 0.5Oct-99 < 0.5 < 0.5Sep-00 < 0.3 < 0.2Jan-01 < 0.3 < 0.2Jun-01 < 0.3 < 0.3Dec-01 < 0.3 < 0.3Jun-02 < 0.3 < 0.3Dec-02 < 0.3 < 0.3Jun-03 < 0.1 < 0.12Dec-03 < 0.04 < 0.10Jun-04 < 0.10 < 0.12Dec-04 < 0.10 < 0.12Jul-05 < 0.10 < 0.12Jan-06 < 0.10 < 0.12
VC (μg/L)
Graph not provided since all samples contained non-detectable concentrations for both DCE and vinyl chloride.
JMM-41D Concentrations
cis-1,2-DCE (μg/L)
April 27, 2006 FINAL

First Half, Eleventh YearOperable Unit 4 and Operable Unit 4 Hotspot
Defense Distribution Depot HillOgden, UT
Date
Jul-95 < 0.5 < 0.5
Oct-95 < 0.5 < 0.5
Jan-96 < 0.5 < 0.5
Apr-96 < 0.5 < 0.5
Jul-96 < 0.5 < 0.5
Oct-96 < 0.5 < 0.5
Apr-97 < 0.5 < 0.5
Oct-97 < 0.5 < 0.5
Apr-98 < 0.5 < 0.5
Oct-98 < 0.5 < 0.5
Apr-99 < 0.5 < 0.5
Oct-99 < 0.5 < 0.5
Sep-00 < 0.3 < 0.2
Jan-01 < 0.3 < 0.2
Jun-01 < 0.3 < 0.3
Dec-01 < 0.3 < 0.3
Jun-02 < 0.3 < 0.3
Dec-02 < 0.3 < 0.3
Jun-03 < 0.1 < 0.12
Dec-03 < 0.04 < 0.10Jun-04 < 0.10 < 0.12Dec-04 < 0.10 < 0.12Jul-05 < 0.10 < 0.12Jan-06 < 0.10 < 0.12
VC (μg/L)
Graph not provided since all samples contained non-detectable concentrations for both DCE and vinyl chloride.
JMM-42D Concentrations
cis-1,2-DCE (μg/L)
April 27, 2006 FINAL
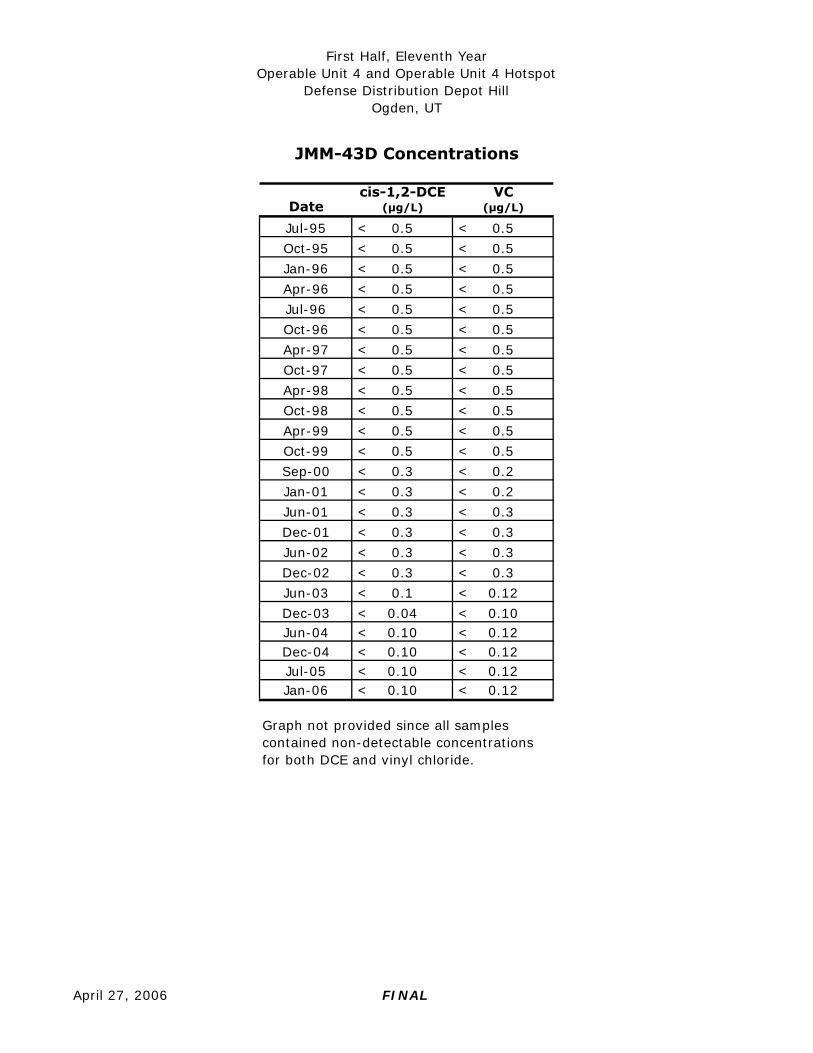
First Half, Eleventh YearOperable Unit 4 and Operable Unit 4 Hotspot
Defense Distribution Depot HillOgden, UT
Date
Jul-95 < 0.5 < 0.5
Oct-95 < 0.5 < 0.5
Jan-96 < 0.5 < 0.5
Apr-96 < 0.5 < 0.5
Jul-96 < 0.5 < 0.5
Oct-96 < 0.5 < 0.5
Apr-97 < 0.5 < 0.5
Oct-97 < 0.5 < 0.5
Apr-98 < 0.5 < 0.5
Oct-98 < 0.5 < 0.5
Apr-99 < 0.5 < 0.5
Oct-99 < 0.5 < 0.5
Sep-00 < 0.3 < 0.2
Jan-01 < 0.3 < 0.2
Jun-01 < 0.3 < 0.3
Dec-01 < 0.3 < 0.3
Jun-02 < 0.3 < 0.3
Dec-02 < 0.3 < 0.3
Jun-03 < 0.1 < 0.12
Dec-03 < 0.04 < 0.10Jun-04 < 0.10 < 0.12Dec-04 < 0.10 < 0.12Jul-05 < 0.10 < 0.12Jan-06 < 0.10 < 0.12
VC (μg/L)
Graph not provided since all samples contained non-detectable concentrations for both DCE and vinyl chloride.
JMM-43D Concentrations
cis-1,2-DCE (μg/L)
April 27, 2006 FINAL
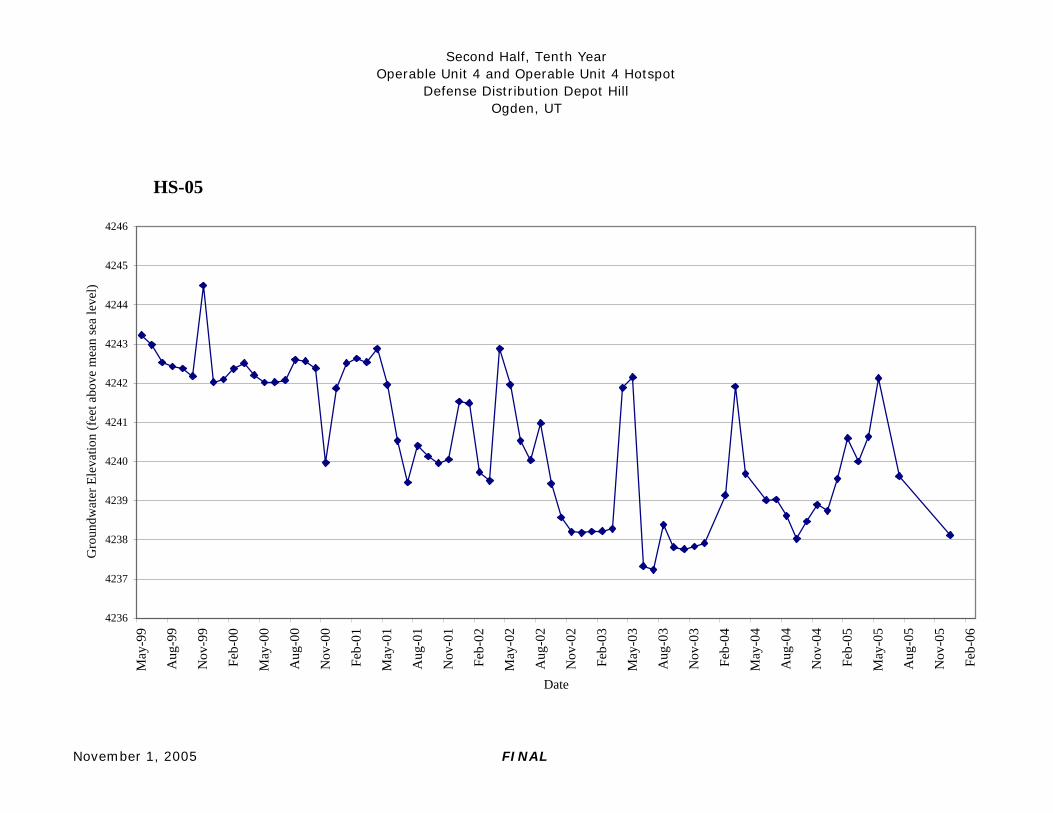
Second Half, Tenth YearOperable Unit 4 and Operable Unit 4 Hotspot
Defense Distribution Depot HillOgden, UT
November 1, 2005 FINAL
HS-05
4236
4237
4238
4239
4240
4241
4242
4243
4244
4245
4246
May
-99
Aug
-99
Nov
-99
Feb-
00
May
-00
Aug
-00
Nov
-00
Feb-
01
May
-01
Aug
-01
Nov
-01
Feb-
02
May
-02
Aug
-02
Nov
-02
Feb-
03
May
-03
Aug
-03
Nov
-03
Feb-
04
May
-04
Aug
-04
Nov
-04
Feb-
05
May
-05
Aug
-05
Nov
-05
Feb-
06
Date
Gro
undw
ater
Ele
vatio
n (f
eet a
bove
mea
n se
a le
vel)
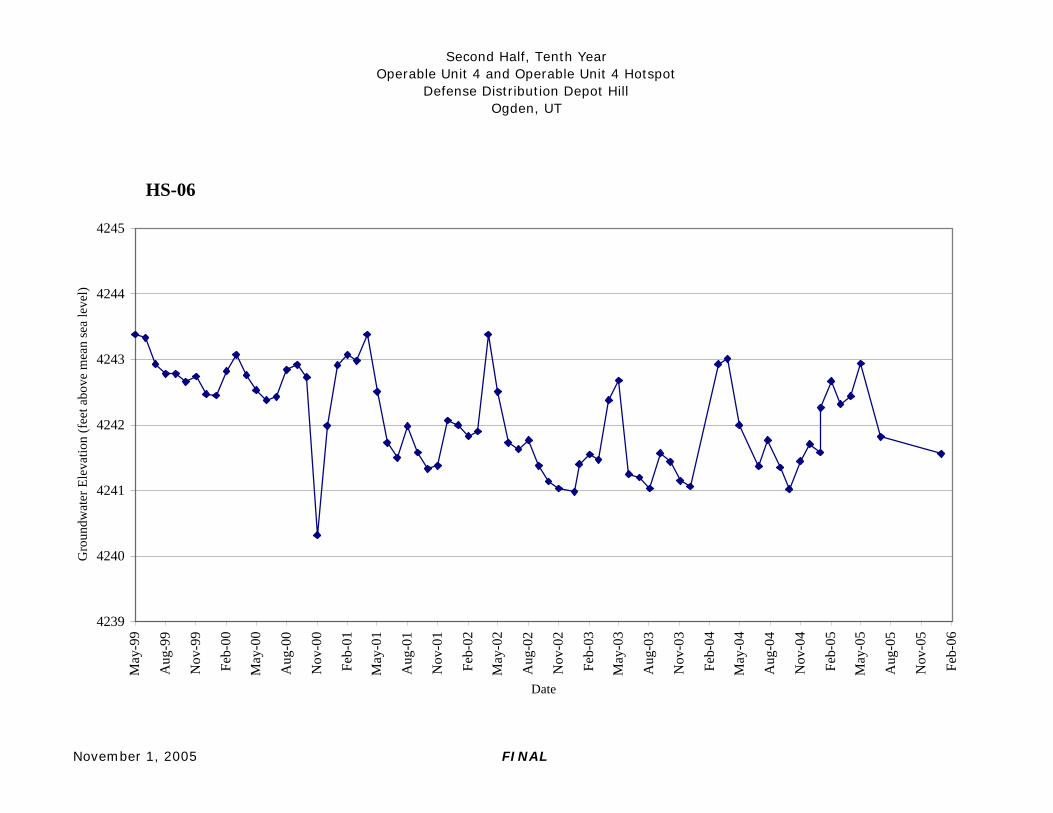
Second Half, Tenth YearOperable Unit 4 and Operable Unit 4 Hotspot
Defense Distribution Depot HillOgden, UT
November 1, 2005 FINAL
HS-06
4239
4240
4241
4242
4243
4244
4245
May
-99
Aug
-99
Nov
-99
Feb-
00
May
-00
Aug
-00
Nov
-00
Feb-
01
May
-01
Aug
-01
Nov
-01
Feb-
02
May
-02
Aug
-02
Nov
-02
Feb-
03
May
-03
Aug
-03
Nov
-03
Feb-
04
May
-04
Aug
-04
Nov
-04
Feb-
05
May
-05
Aug
-05
Nov
-05
Feb-
06
Date
Gro
undw
ater
Ele
vatio
n (f
eet a
bove
mea
n se
a le
vel)
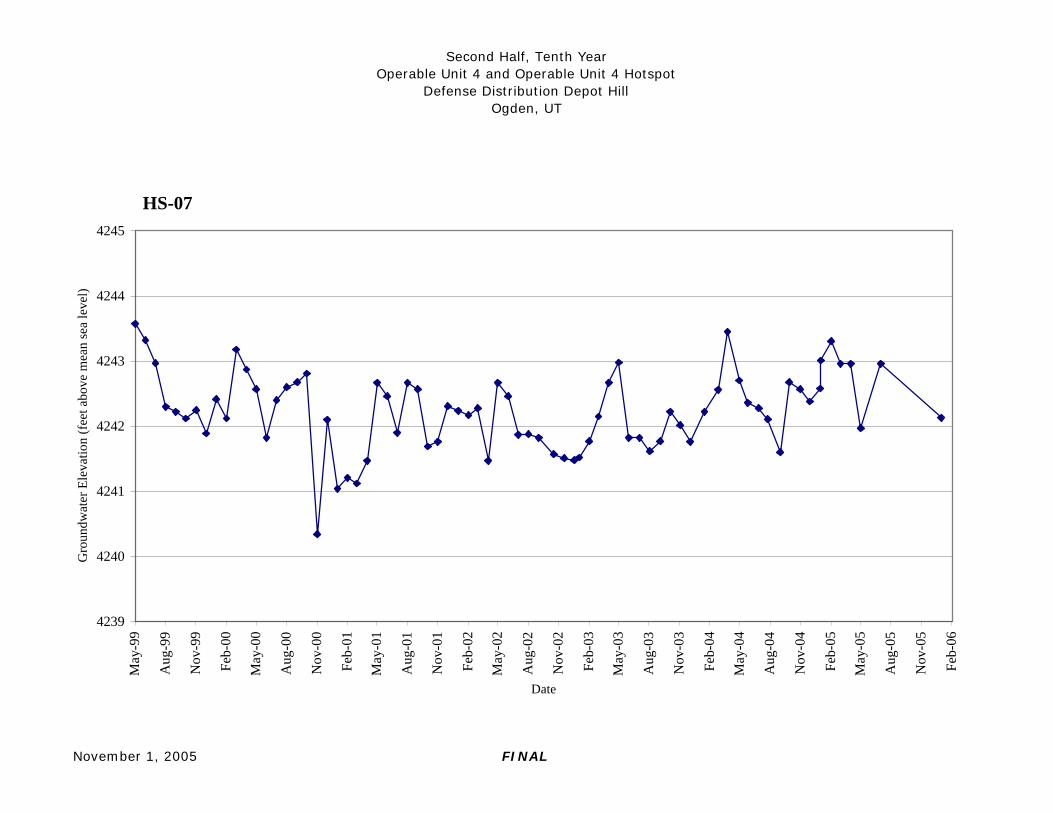
Second Half, Tenth YearOperable Unit 4 and Operable Unit 4 Hotspot
Defense Distribution Depot HillOgden, UT
November 1, 2005 FINAL
HS-07
4239
4240
4241
4242
4243
4244
4245
May
-99
Aug
-99
Nov
-99
Feb-
00
May
-00
Aug
-00
Nov
-00
Feb-
01
May
-01
Aug
-01
Nov
-01
Feb-
02
May
-02
Aug
-02
Nov
-02
Feb-
03
May
-03
Aug
-03
Nov
-03
Feb-
04
May
-04
Aug
-04
Nov
-04
Feb-
05
May
-05
Aug
-05
Nov
-05
Feb-
06
Date
Gro
undw
ater
Ele
vatio
n (f
eet a
bove
mea
n se
a le
vel)

Second Half, Tenth YearOperable Unit 4 and Operable Unit 4 Hotspot
Defense Distribution Depot HillOgden, UT
November 1, 2005 FINAL
HS-08
4239
4240
4241
4242
4243
4244
4245
4246
May
-99
Aug
-99
Nov
-99
Feb-
00
May
-00
Aug
-00
Nov
-00
Feb-
01
May
-01
Aug
-01
Nov
-01
Feb-
02
May
-02
Aug
-02
Nov
-02
Feb-
03
May
-03
Aug
-03
Nov
-03
Feb-
04
May
-04
Aug
-04
Nov
-04
Feb-
05
May
-05
Aug
-05
Nov
-05
Feb-
06
Date
Gro
undw
ater
Ele
vatio
n (f
eet a
bove
mea
n se
a le
vel)
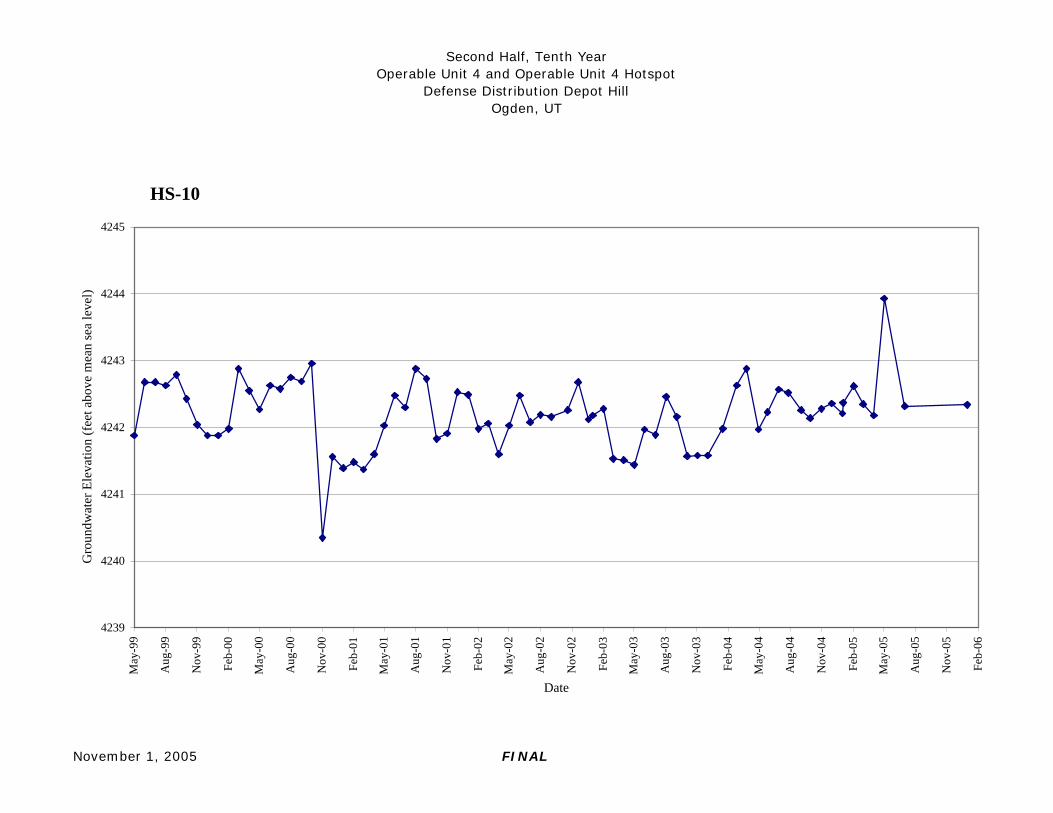
Second Half, Tenth YearOperable Unit 4 and Operable Unit 4 Hotspot
Defense Distribution Depot HillOgden, UT
November 1, 2005 FINAL
HS-10
4239
4240
4241
4242
4243
4244
4245
May
-99
Aug
-99
Nov
-99
Feb-
00
May
-00
Aug
-00
Nov
-00
Feb-
01
May
-01
Aug
-01
Nov
-01
Feb-
02
May
-02
Aug
-02
Nov
-02
Feb-
03
May
-03
Aug
-03
Nov
-03
Feb-
04
May
-04
Aug
-04
Nov
-04
Feb-
05
May
-05
Aug
-05
Nov
-05
Feb-
06
Date
Gro
undw
ater
Ele
vatio
n (f
eet a
bove
mea
n se
a le
vel)
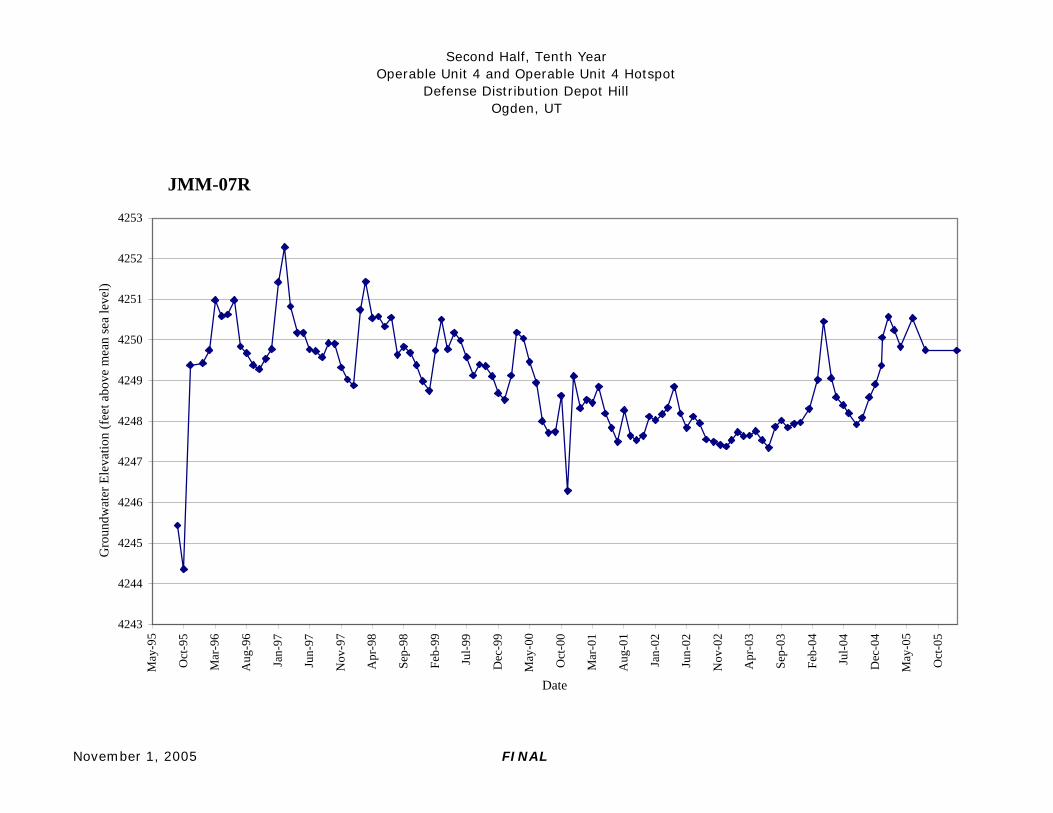
Second Half, Tenth YearOperable Unit 4 and Operable Unit 4 Hotspot
Defense Distribution Depot HillOgden, UT
November 1, 2005 FINAL
JMM-07R
4243
4244
4245
4246
4247
4248
4249
4250
4251
4252
4253
May
-95
Oct
-95
Mar
-96
Aug
-96
Jan-
97
Jun-
97
Nov
-97
Apr
-98
Sep-
98
Feb-
99
Jul-9
9
Dec
-99
May
-00
Oct
-00
Mar
-01
Aug
-01
Jan-
02
Jun-
02
Nov
-02
Apr
-03
Sep-
03
Feb-
04
Jul-0
4
Dec
-04
May
-05
Oct
-05
Date
Gro
undw
ater
Ele
vatio
n (f
eet a
bove
mea
n se
a le
vel)
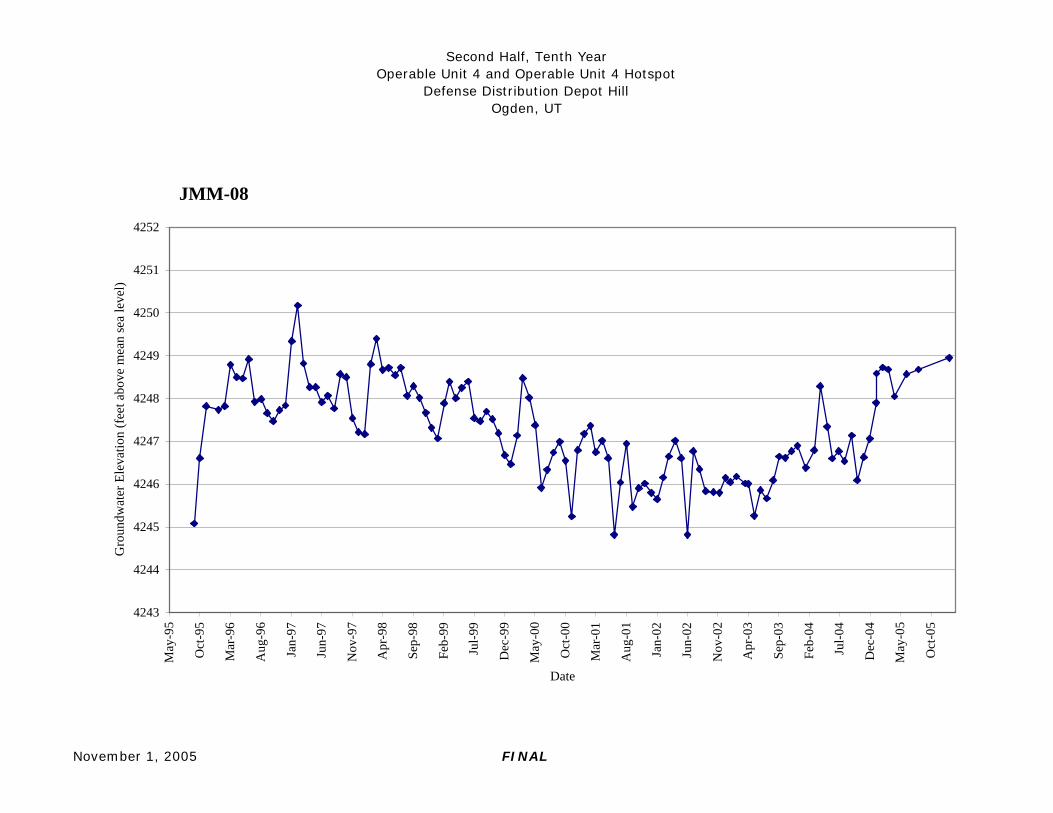
Second Half, Tenth YearOperable Unit 4 and Operable Unit 4 Hotspot
Defense Distribution Depot HillOgden, UT
November 1, 2005 FINAL
JMM-08
4243
4244
4245
4246
4247
4248
4249
4250
4251
4252
May
-95
Oct
-95
Mar
-96
Aug
-96
Jan-
97
Jun-
97
Nov
-97
Apr
-98
Sep-
98
Feb-
99
Jul-9
9
Dec
-99
May
-00
Oct
-00
Mar
-01
Aug
-01
Jan-
02
Jun-
02
Nov
-02
Apr
-03
Sep-
03
Feb-
04
Jul-0
4
Dec
-04
May
-05
Oct
-05
Date
Gro
undw
ater
Ele
vatio
n (f
eet a
bove
mea
n se
a le
vel)
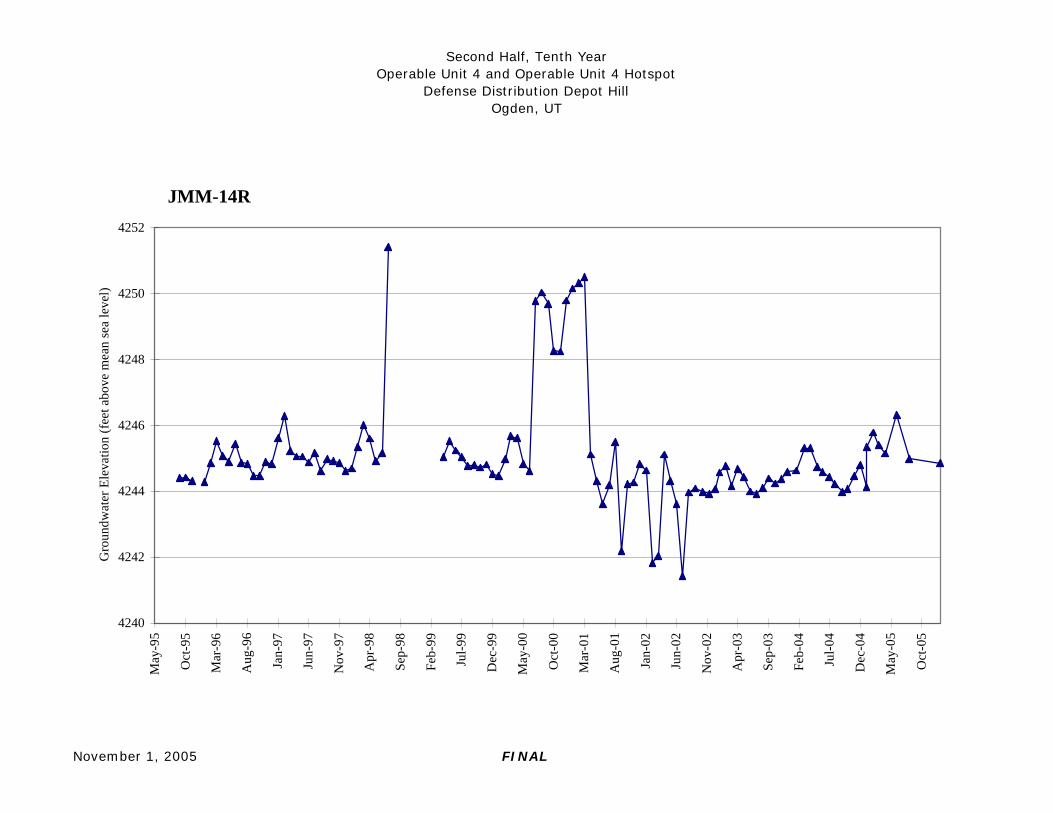
Second Half, Tenth YearOperable Unit 4 and Operable Unit 4 Hotspot
Defense Distribution Depot HillOgden, UT
November 1, 2005 FINAL
JMM-14R
4240
4242
4244
4246
4248
4250
4252
May
-95
Oct
-95
Mar
-96
Aug
-96
Jan-
97
Jun-
97
Nov
-97
Apr
-98
Sep-
98
Feb-
99
Jul-9
9
Dec
-99
May
-00
Oct
-00
Mar
-01
Aug
-01
Jan-
02
Jun-
02
Nov
-02
Apr
-03
Sep-
03
Feb-
04
Jul-0
4
Dec
-04
May
-05
Oct
-05
Gro
undw
ater
Ele
vatio
n (f
eet a
bove
mea
n se
a le
vel)
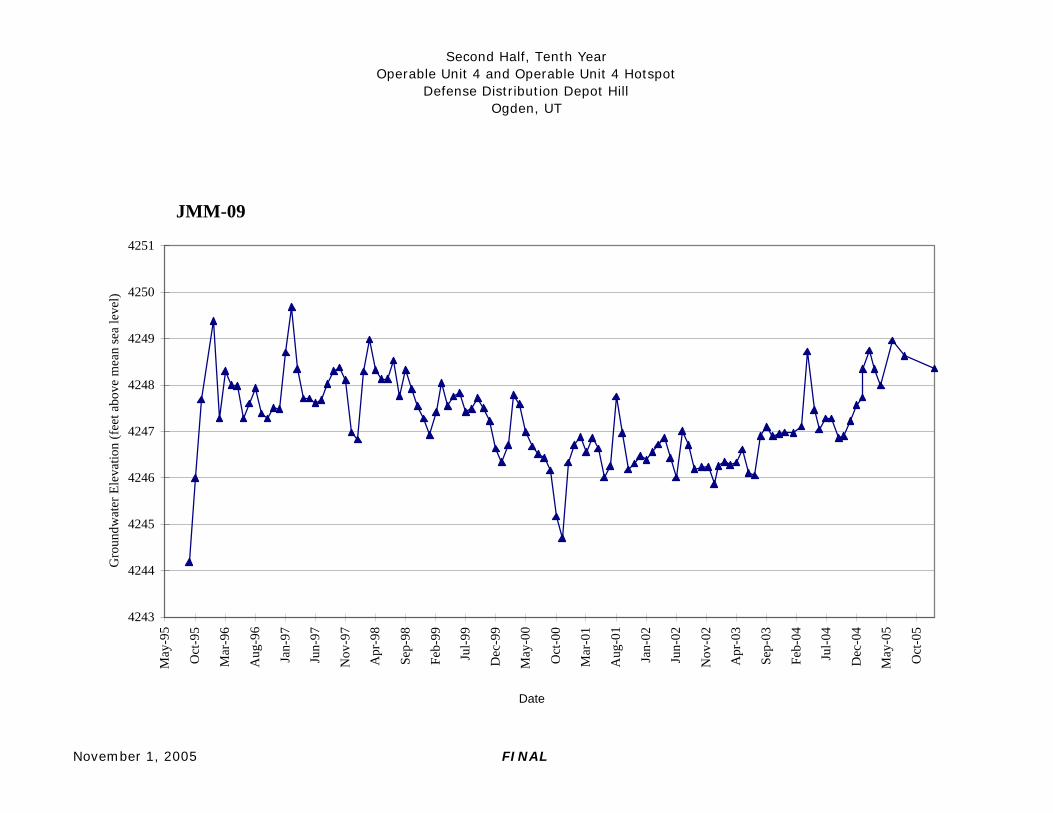
Second Half, Tenth YearOperable Unit 4 and Operable Unit 4 Hotspot
Defense Distribution Depot HillOgden, UT
November 1, 2005 FINAL
JMM-09
4243
4244
4245
4246
4247
4248
4249
4250
4251
May
-95
Oct
-95
Mar
-96
Aug
-96
Jan-
97
Jun-
97
Nov
-97
Apr
-98
Sep-
98
Feb-
99
Jul-9
9
Dec
-99
May
-00
Oct
-00
Mar
-01
Aug
-01
Jan-
02
Jun-
02
Nov
-02
Apr
-03
Sep-
03
Feb-
04
Jul-0
4
Dec
-04
May
-05
Oct
-05
Gro
undw
ater
Ele
vatio
n (f
eet a
bove
mea
n se
a le
vel)
Date

Second Half, Tenth YearOperable Unit 4 and Operable Unit 4 Hotspot
Defense Distribution Depot HillOgden, UT
November 1, 2005 FINAL
JMM-15
4240
4241
4242
4243
4244
4245
4246
4247
4248
4249
4250
May
-95
Oct
-95
Mar
-96
Aug
-96
Jan-
97
Jun-
97
Nov
-97
Apr
-98
Sep-
98
Feb-
99
Jul-9
9
Dec
-99
May
-00
Oct
-00
Mar
-01
Aug
-01
Jan-
02
Jun-
02
Nov
-02
Apr
-03
Sep-
03
Feb-
04
Jul-0
4
Dec
-04
May
-05
Oct
-05
Gro
undw
ater
Ele
vatio
n (f
eet a
bove
mea
n se
a le
vel)
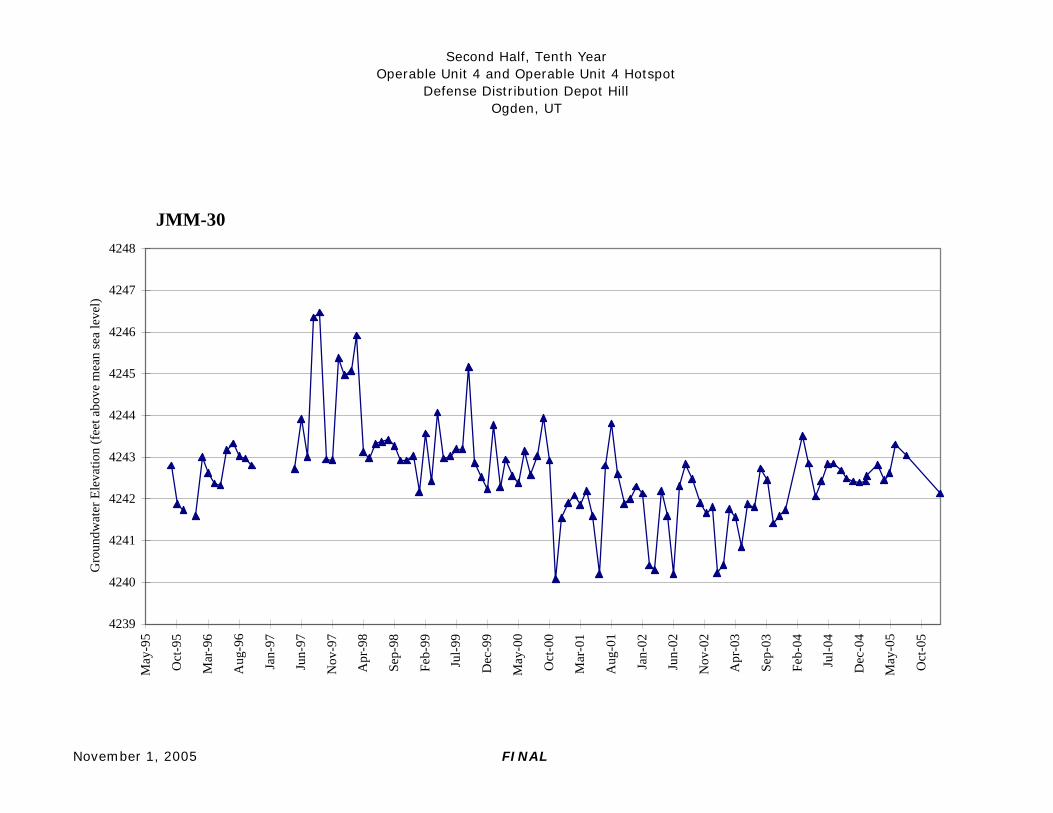
Second Half, Tenth YearOperable Unit 4 and Operable Unit 4 Hotspot
Defense Distribution Depot HillOgden, UT
November 1, 2005 FINAL
JMM-30
4239
4240
4241
4242
4243
4244
4245
4246
4247
4248
May
-95
Oct
-95
Mar
-96
Aug
-96
Jan-
97
Jun-
97
Nov
-97
Apr
-98
Sep-
98
Feb-
99
Jul-9
9
Dec
-99
May
-00
Oct
-00
Mar
-01
Aug
-01
Jan-
02
Jun-
02
Nov
-02
Apr
-03
Sep-
03
Feb-
04
Jul-0
4
Dec
-04
May
-05
Oct
-05
Gro
undw
ater
Ele
vatio
n (f
eet a
bove
mea
n se
a le
vel)
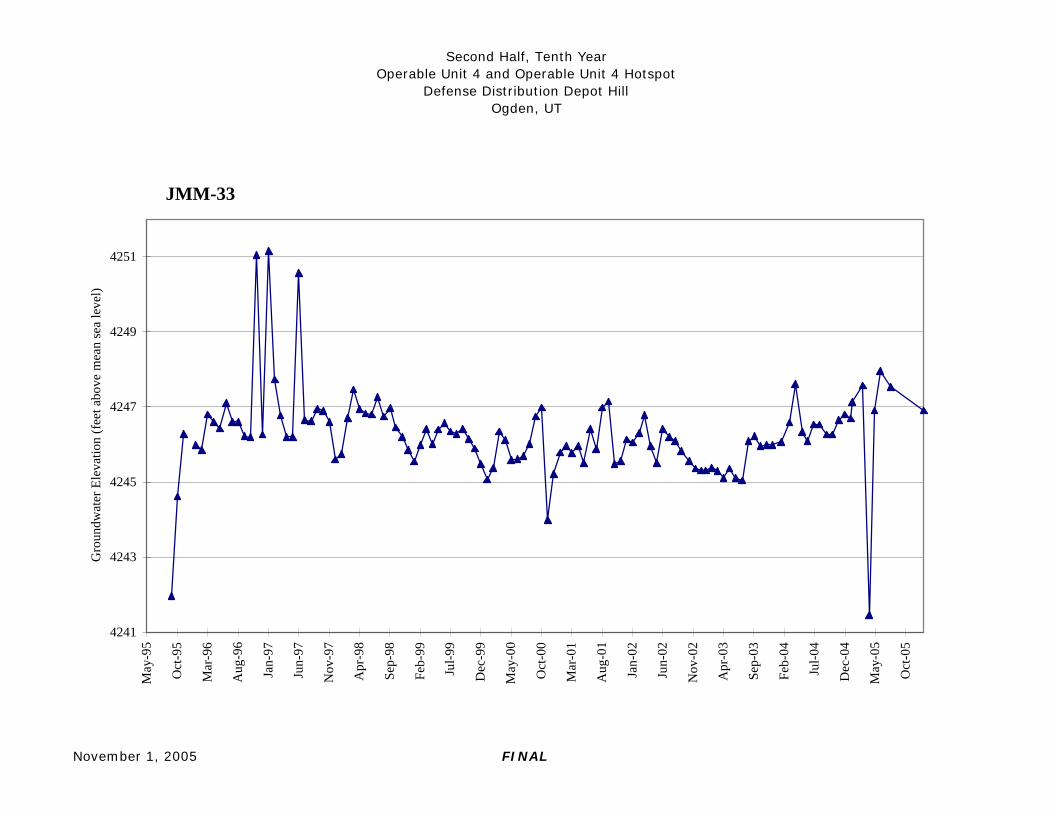
Second Half, Tenth YearOperable Unit 4 and Operable Unit 4 Hotspot
Defense Distribution Depot HillOgden, UT
November 1, 2005 FINAL
JMM-33
4241
4243
4245
4247
4249
4251
May
-95
Oct
-95
Mar
-96
Aug
-96
Jan-
97
Jun-
97
Nov
-97
Apr
-98
Sep-
98
Feb-
99
Jul-9
9
Dec
-99
May
-00
Oct
-00
Mar
-01
Aug
-01
Jan-
02
Jun-
02
Nov
-02
Apr
-03
Sep-
03
Feb-
04
Jul-0
4
Dec
-04
May
-05
Oct
-05
Gro
undw
ater
Ele
vatio
n (f
eet a
bove
mea
n se
a le
vel)
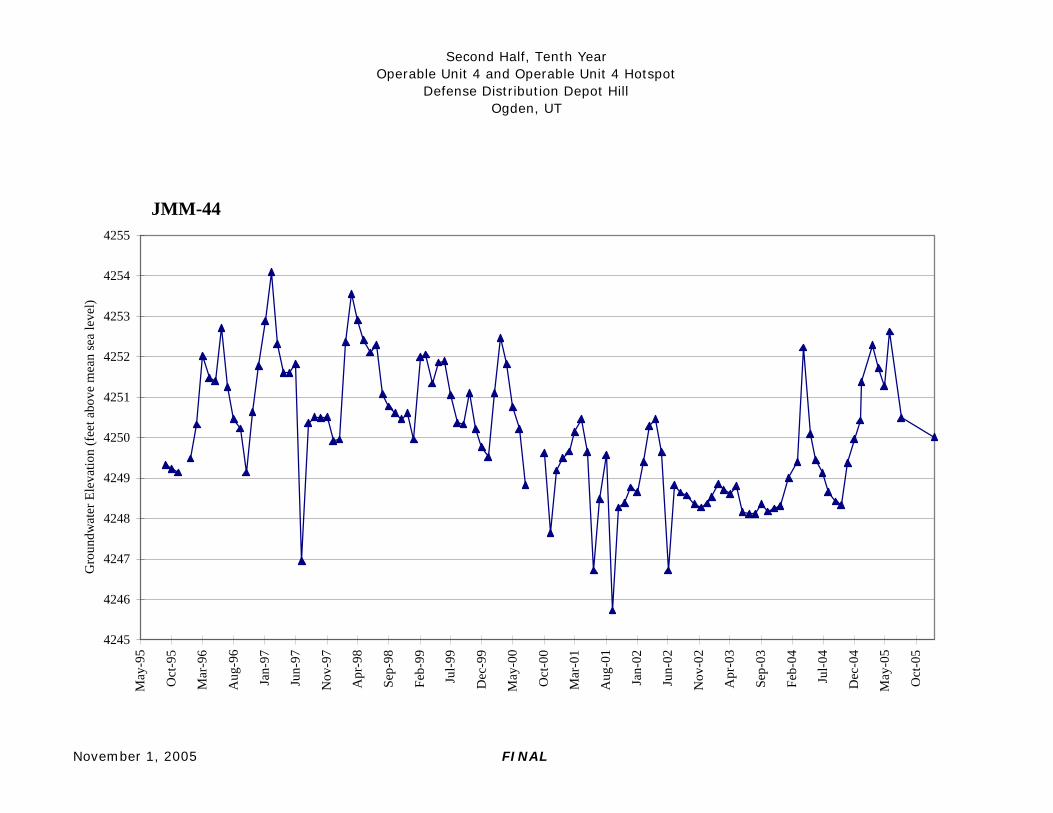
Second Half, Tenth YearOperable Unit 4 and Operable Unit 4 Hotspot
Defense Distribution Depot HillOgden, UT
November 1, 2005 FINAL
JMM-44
4245
4246
4247
4248
4249
4250
4251
4252
4253
4254
4255
May
-95
Oct
-95
Mar
-96
Aug
-96
Jan-
97
Jun-
97
Nov
-97
Apr
-98
Sep-
98
Feb-
99
Jul-9
9
Dec
-99
May
-00
Oct
-00
Mar
-01
Aug
-01
Jan-
02
Jun-
02
Nov
-02
Apr
-03
Sep-
03
Feb-
04
Jul-0
4
Dec
-04
May
-05
Oct
-05
Gro
undw
ater
Ele
vatio
n (f
eet a
bove
mea
n se
a le
vel)
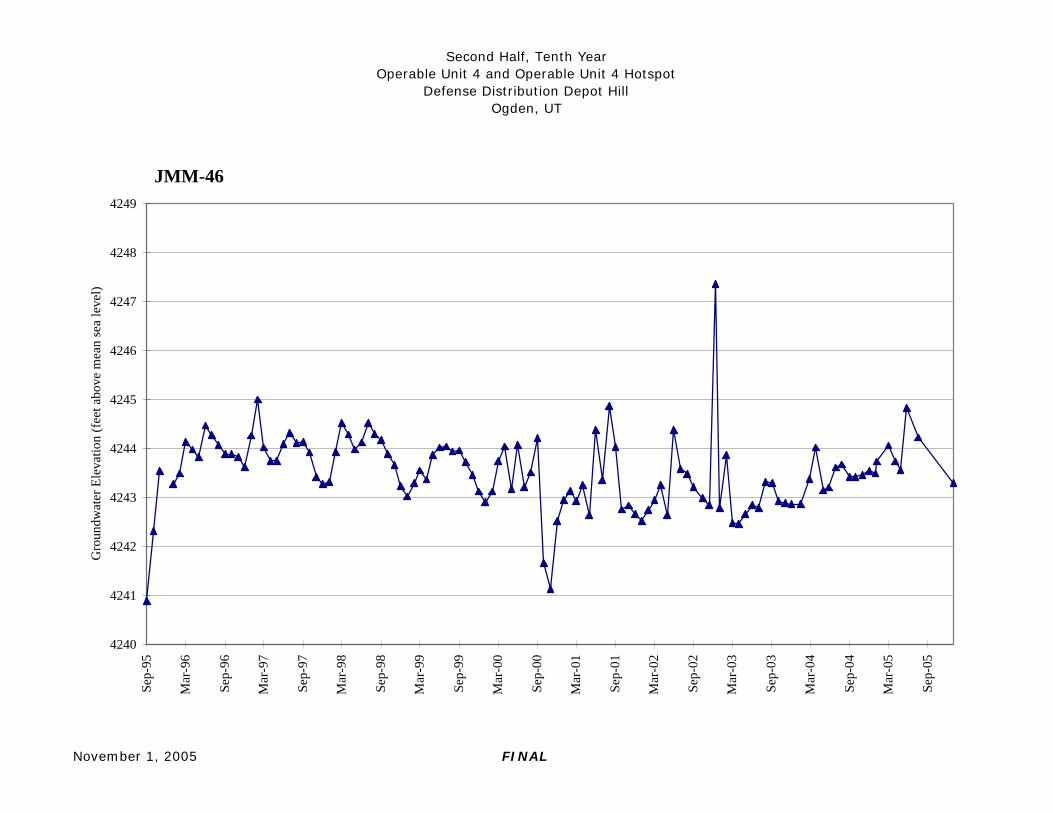
Second Half, Tenth YearOperable Unit 4 and Operable Unit 4 Hotspot
Defense Distribution Depot HillOgden, UT
November 1, 2005 FINAL
JMM-46
4240
4241
4242
4243
4244
4245
4246
4247
4248
4249
Sep-
95
Mar
-96
Sep-
96
Mar
-97
Sep-
97
Mar
-98
Sep-
98
Mar
-99
Sep-
99
Mar
-00
Sep-
00
Mar
-01
Sep-
01
Mar
-02
Sep-
02
Mar
-03
Sep-
03
Mar
-04
Sep-
04
Mar
-05
Sep-
05
Gro
undw
ater
Ele
vatio
n (f
eet a
bove
mea
n se
a le
vel)
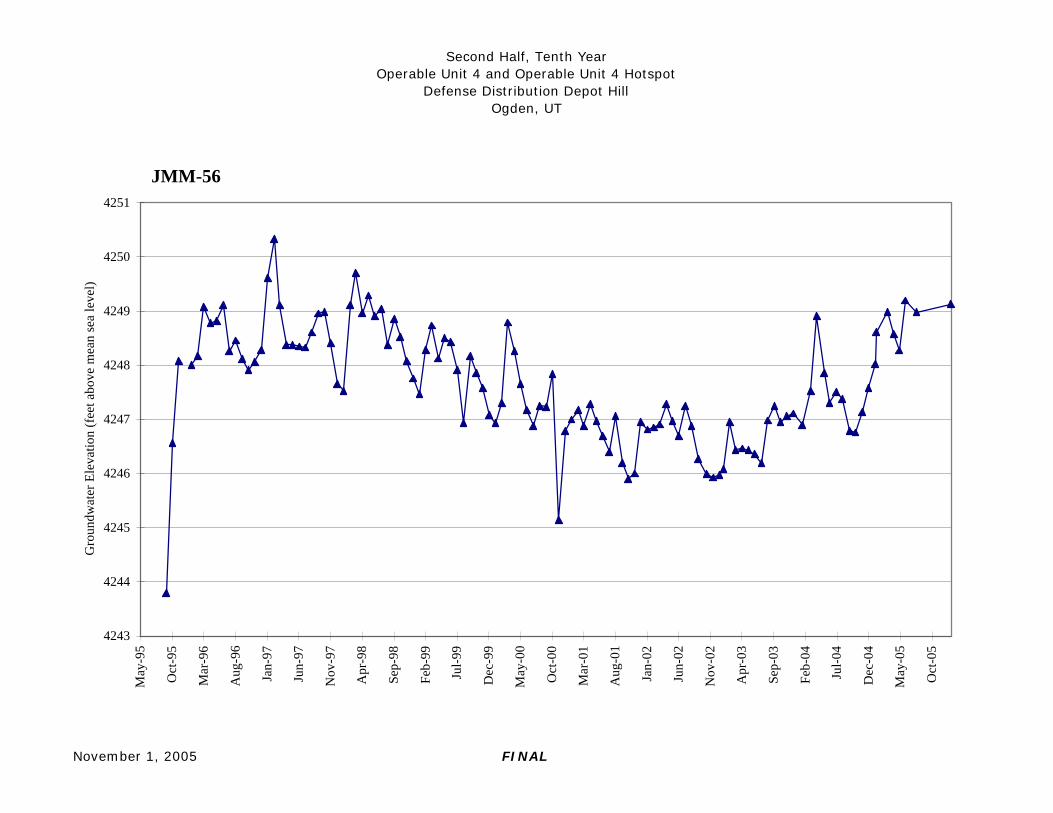
Second Half, Tenth YearOperable Unit 4 and Operable Unit 4 Hotspot
Defense Distribution Depot HillOgden, UT
November 1, 2005 FINAL
JMM-56
4243
4244
4245
4246
4247
4248
4249
4250
4251
May
-95
Oct
-95
Mar
-96
Aug
-96
Jan-
97
Jun-
97
Nov
-97
Apr
-98
Sep-
98
Feb-
99
Jul-9
9
Dec
-99
May
-00
Oct
-00
Mar
-01
Aug
-01
Jan-
02
Jun-
02
Nov
-02
Apr
-03
Sep-
03
Feb-
04
Jul-0
4
Dec
-04
May
-05
Oct
-05
Gro
undw
ater
Ele
vatio
n (f
eet a
bove
mea
n se
a le
vel)
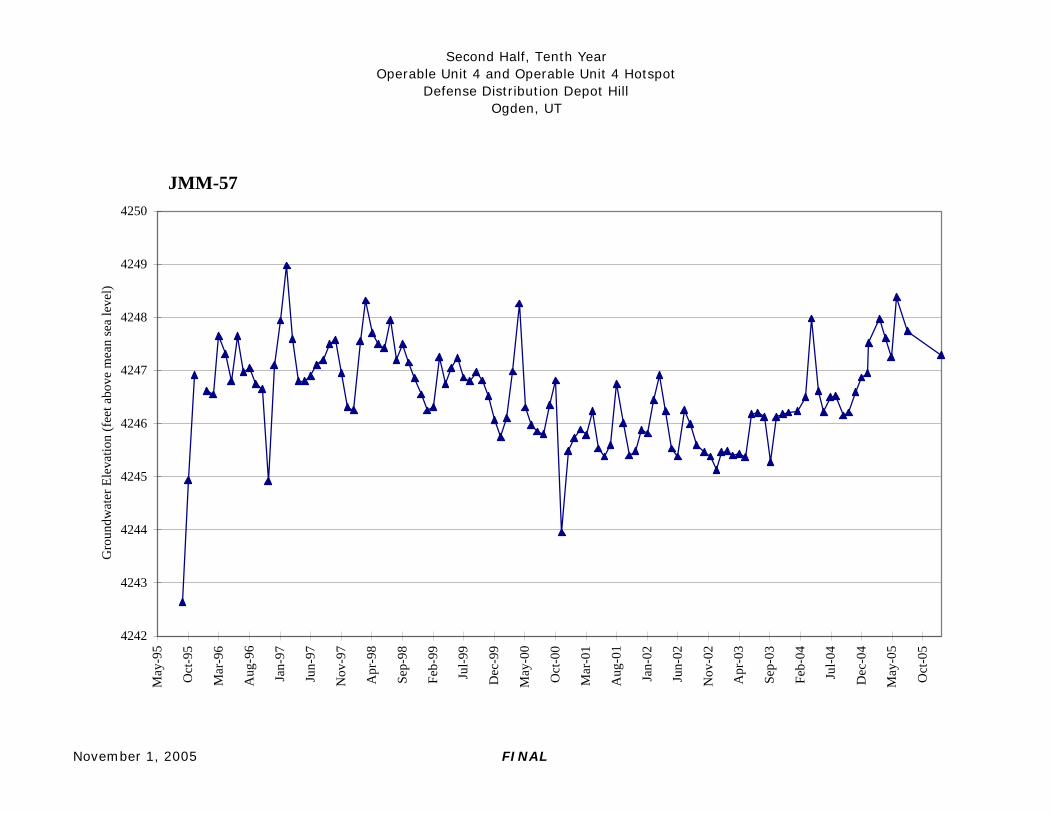
Second Half, Tenth YearOperable Unit 4 and Operable Unit 4 Hotspot
Defense Distribution Depot HillOgden, UT
November 1, 2005 FINAL
JMM-57
4242
4243
4244
4245
4246
4247
4248
4249
4250
May
-95
Oct
-95
Mar
-96
Aug
-96
Jan-
97
Jun-
97
Nov
-97
Apr
-98
Sep-
98
Feb-
99
Jul-9
9
Dec
-99
May
-00
Oct
-00
Mar
-01
Aug
-01
Jan-
02
Jun-
02
Nov
-02
Apr
-03
Sep-
03
Feb-
04
Jul-0
4
Dec
-04
May
-05
Oct
-05
Gro
undw
ater
Ele
vatio
n (f
eet a
bove
mea
n se
a le
vel)
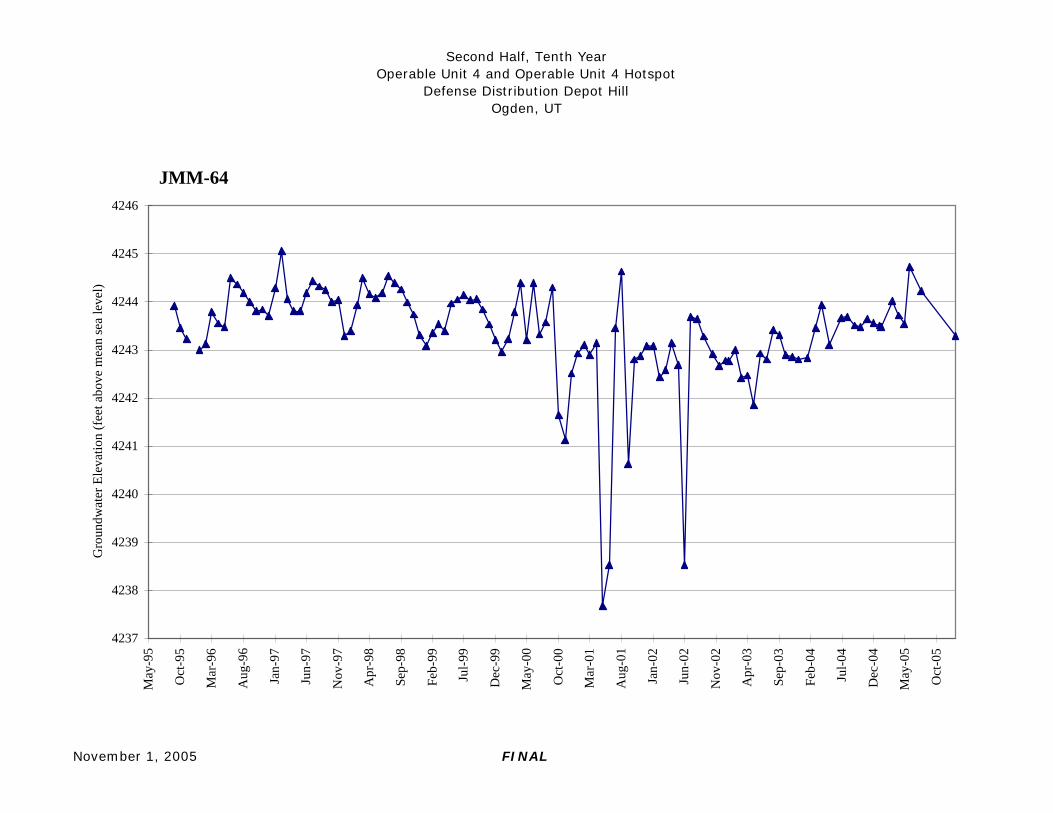
Second Half, Tenth YearOperable Unit 4 and Operable Unit 4 Hotspot
Defense Distribution Depot HillOgden, UT
November 1, 2005 FINAL
JMM-64
4237
4238
4239
4240
4241
4242
4243
4244
4245
4246
May
-95
Oct
-95
Mar
-96
Aug
-96
Jan-
97
Jun-
97
Nov
-97
Apr
-98
Sep-
98
Feb-
99
Jul-9
9
Dec
-99
May
-00
Oct
-00
Mar
-01
Aug
-01
Jan-
02
Jun-
02
Nov
-02
Apr
-03
Sep-
03
Feb-
04
Jul-0
4
Dec
-04
May
-05
Oct
-05
Gro
undw
ater
Ele
vatio
n (f
eet a
bove
mea
n se
a le
vel)
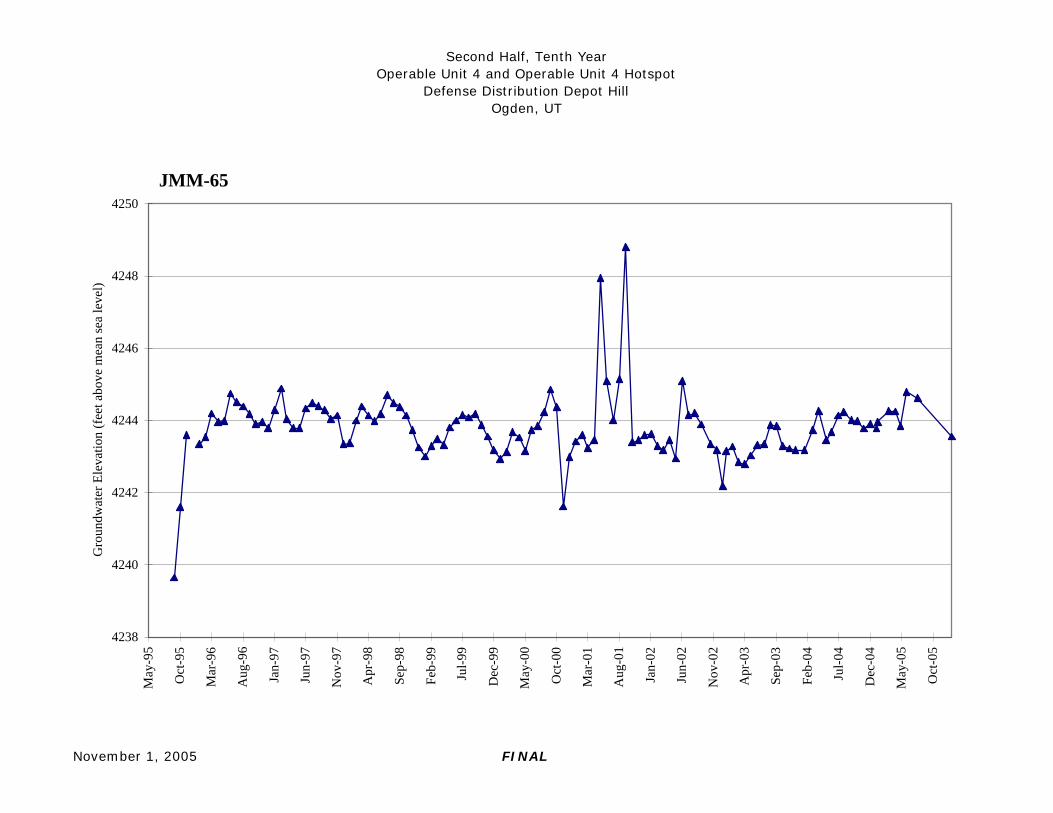
Second Half, Tenth YearOperable Unit 4 and Operable Unit 4 Hotspot
Defense Distribution Depot HillOgden, UT
November 1, 2005 FINAL
JMM-65
4238
4240
4242
4244
4246
4248
4250
May
-95
Oct
-95
Mar
-96
Aug
-96
Jan-
97
Jun-
97
Nov
-97
Apr
-98
Sep-
98
Feb-
99
Jul-9
9
Dec
-99
May
-00
Oct
-00
Mar
-01
Aug
-01
Jan-
02
Jun-
02
Nov
-02
Apr
-03
Sep-
03
Feb-
04
Jul-0
4
Dec
-04
May
-05
Oct
-05
Gro
undw
ater
Ele
vatio
n (f
eet a
bove
mea
n se
a le
vel)
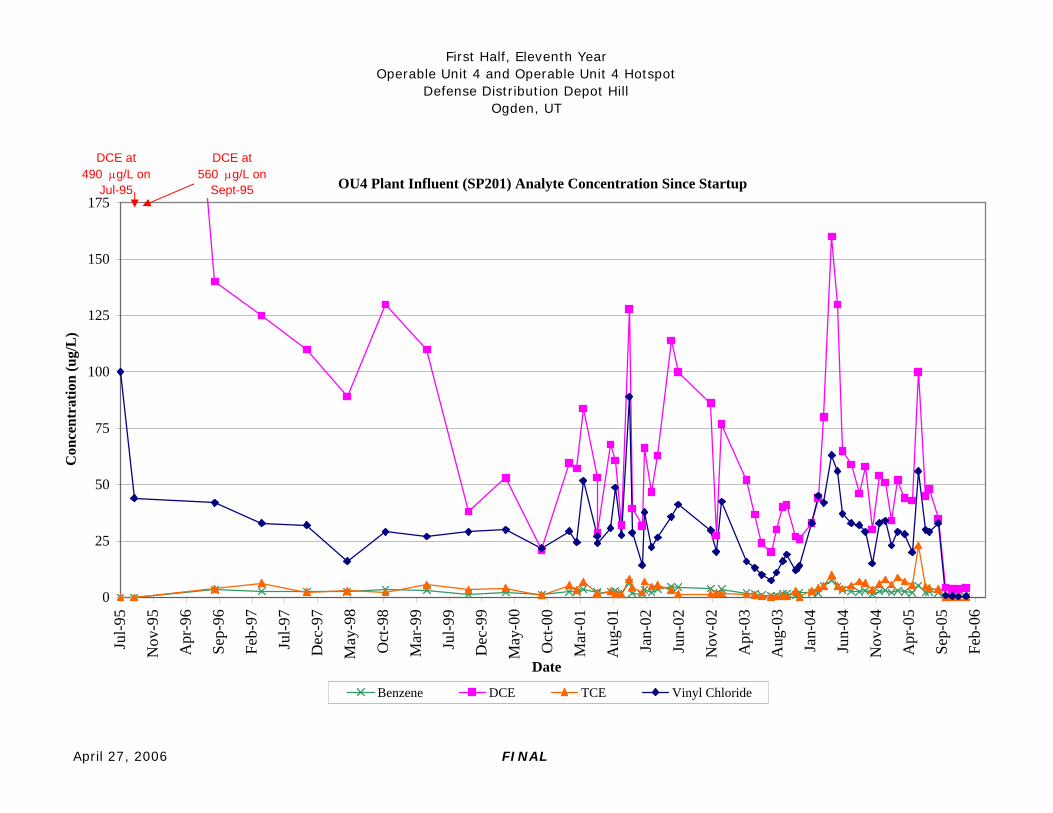
First Half, Eleventh YearOperable Unit 4 and Operable Unit 4 Hotspot
Defense Distribution Depot HillOgden, UT
April 27, 2006 FINAL
OU4 Plant Influent (SP201) Analyte Concentration Since Startup
0
25
50
75
100
125
150
175
Jul-9
5
Nov
-95
Apr
-96
Sep-
96
Feb-
97
Jul-9
7
Dec
-97
May
-98
Oct
-98
Mar
-99
Jul-9
9
Dec
-99
May
-00
Oct
-00
Mar
-01
Aug
-01
Jan-
02
Jun-
02
Nov
-02
Apr
-03
Aug
-03
Jan-
04
Jun-
04
Nov
-04
Apr
-05
Sep-
05
Feb-
06
Date
Con
cent
ratio
n (u
g/L
)
Benzene DCE TCE Vinyl Chloride
DCE at 560 μg/L on
Sept-95
DCE at 490 μg/L on
Jul-95
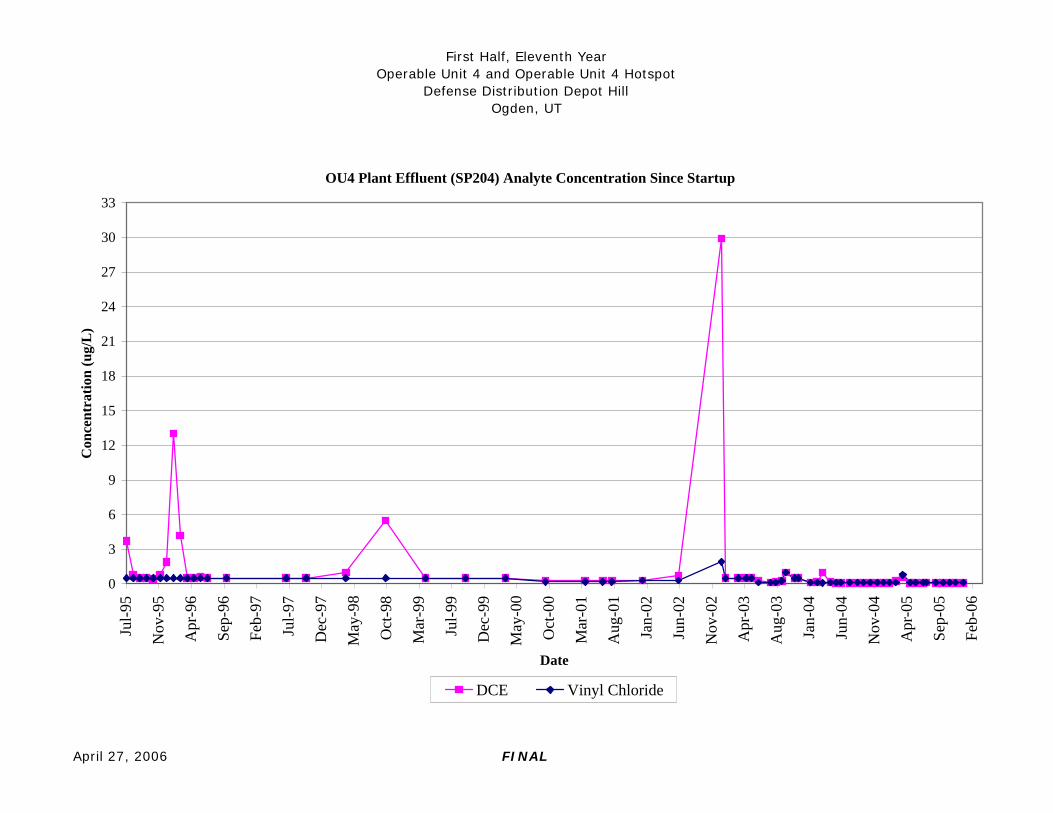
First Half, Eleventh YearOperable Unit 4 and Operable Unit 4 Hotspot
Defense Distribution Depot HillOgden, UT
April 27, 2006 FINAL
OU4 Plant Effluent (SP204) Analyte Concentration Since Startup
0
3
6
9
12
15
18
21
24
27
30
33
Jul-9
5
Nov
-95
Apr
-96
Sep-
96
Feb-
97
Jul-9
7
Dec
-97
May
-98
Oct
-98
Mar
-99
Jul-9
9
Dec
-99
May
-00
Oct
-00
Mar
-01
Aug
-01
Jan-
02
Jun-
02
Nov
-02
Apr
-03
Aug
-03
Jan-
04
Jun-
04
Nov
-04
Apr
-05
Sep-
05
Feb-
06
Date
Con
cent
ratio
n (u
g/L
)
DCE Vinyl Chloride

First Half, Eleventh YearOperable Unit 4 and Operable Unit 4 Hotspot
Defense Distribution Depot HillOgden, UT
April 27, 2006 FINAL
OU4HS Plant Influent Analyte Concentrations Since Startup
0.0
2.0
4.0
6.0
8.0
10.0
May
-99
Aug
-99
Nov
-99
Feb-
00
May
-00
Sep-
00
Dec
-00
Mar
-01
Jul-0
1
Oct
-01
Jan-
02
Apr
-02
Aug
-02
Nov
-02
Feb-
03
May
-03
Sep-
03
Dec
-03
Mar
-04
Jun-
04
Oct
-04
Jan-
05
Apr
-05
Jul-0
5
Nov
-05
Feb-
06
Date
Con
cent
ratio
n (u
g/L
)
Benzene DCE TCE Vinyl Chloride
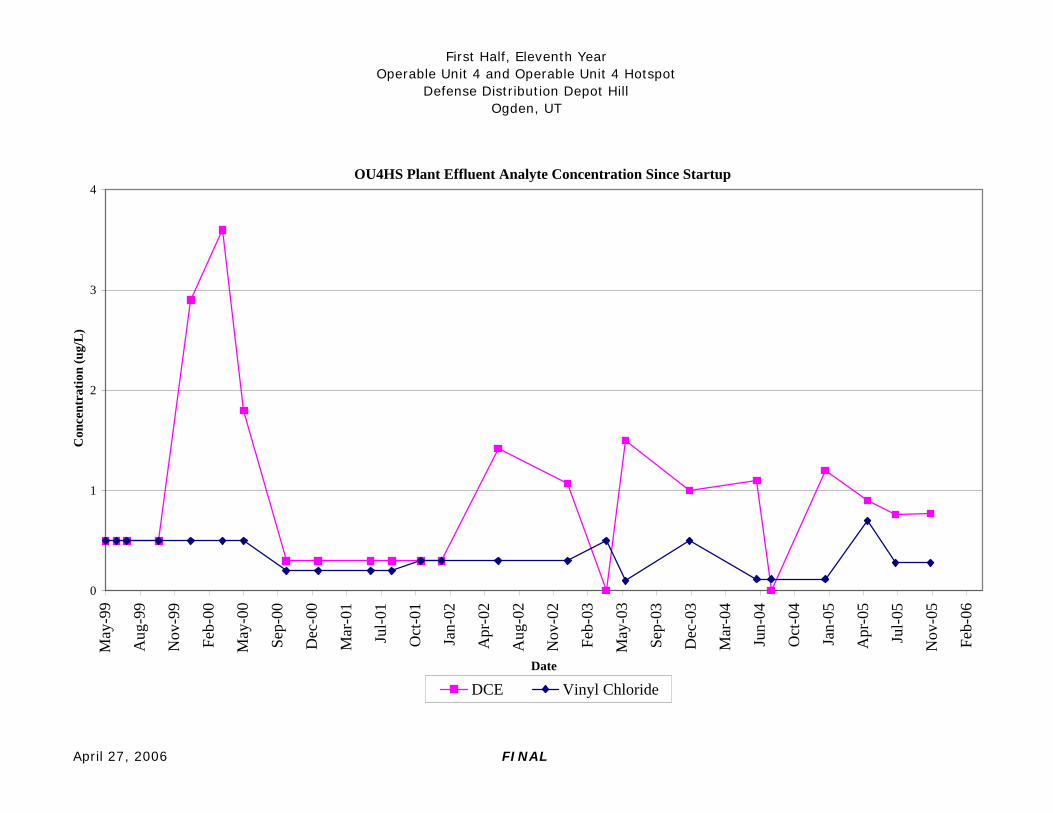
First Half, Eleventh YearOperable Unit 4 and Operable Unit 4 Hotspot
Defense Distribution Depot HillOgden, UT
April 27, 2006 FINAL
OU4HS Plant Effluent Analyte Concentration Since Startup
0
1
2
3
4
May
-99
Aug
-99
Nov
-99
Feb-
00
May
-00
Sep-
00
Dec
-00
Mar
-01
Jul-0
1
Oct
-01
Jan-
02
Apr
-02
Aug
-02
Nov
-02
Feb-
03
May
-03
Sep-
03
Dec
-03
Mar
-04
Jun-
04
Oct
-04
Jan-
05
Apr
-05
Jul-0
5
Nov
-05
Feb-
06
Date
Con
cent
ratio
n (u
g/L
)
DCE Vinyl Chloride
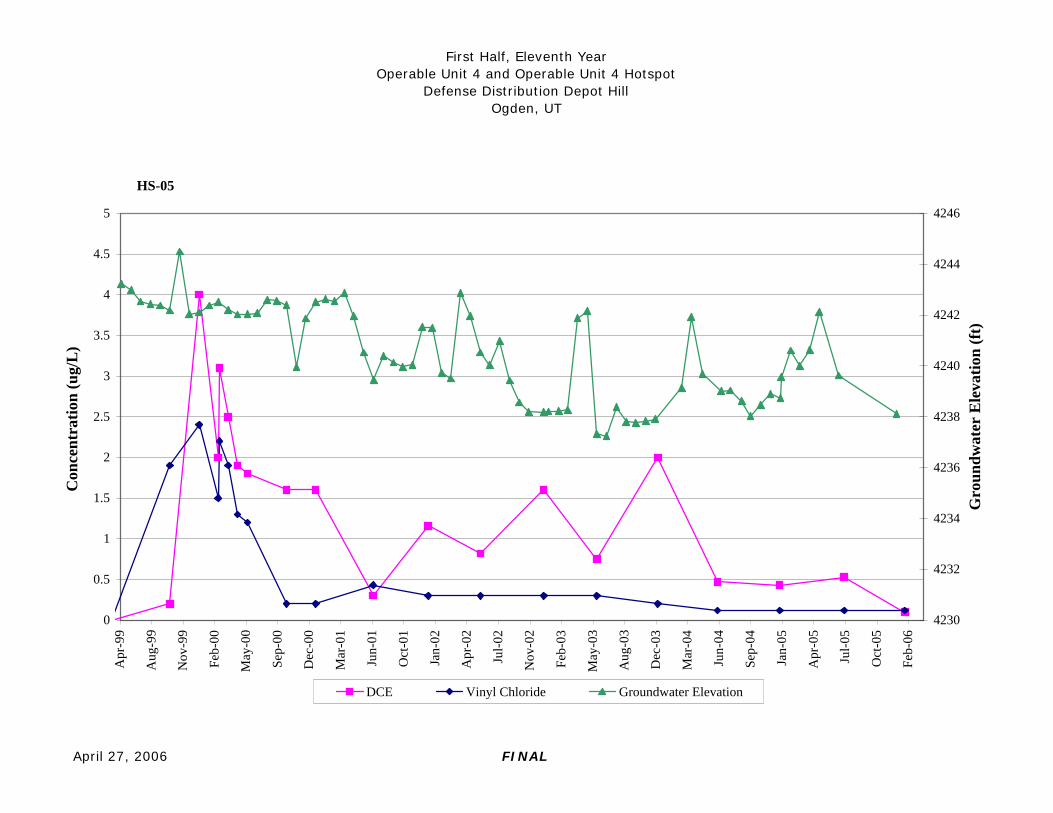
First Half, Eleventh YearOperable Unit 4 and Operable Unit 4 Hotspot
Defense Distribution Depot HillOgden, UT
April 27, 2006 FINAL
0
0.5
1
1.5
2
2.5
3
3.5
4
4.5
5
Apr
-99
Aug
-99
Nov
-99
Feb-
00
May
-00
Sep-
00
Dec
-00
Mar
-01
Jun-
01
Oct
-01
Jan-
02
Apr
-02
Jul-0
2
Nov
-02
Feb-
03
May
-03
Aug
-03
Dec
-03
Mar
-04
Jun-
04
Sep-
04
Jan-
05
Apr
-05
Jul-0
5
Oct
-05
Feb-
06
Con
cent
ratio
n (u
g/L
)
4230
4232
4234
4236
4238
4240
4242
4244
4246
Gro
undw
ater
Ele
vatio
n (f
t)
DCE Vinyl Chloride Groundwater Elevation
HS-05
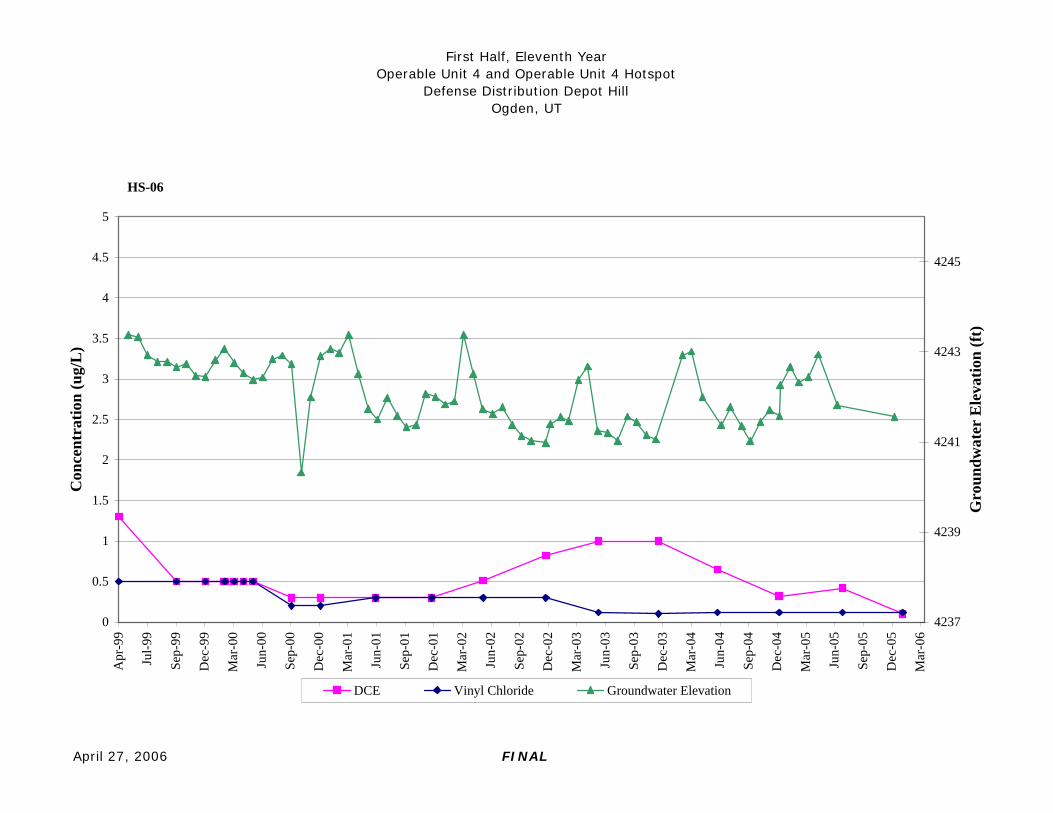
First Half, Eleventh YearOperable Unit 4 and Operable Unit 4 Hotspot
Defense Distribution Depot HillOgden, UT
April 27, 2006 FINAL
0
0.5
1
1.5
2
2.5
3
3.5
4
4.5
5
Apr
-99
Jul-9
9
Sep-
99
Dec
-99
Mar
-00
Jun-
00
Sep-
00
Dec
-00
Mar
-01
Jun-
01
Sep-
01
Dec
-01
Mar
-02
Jun-
02
Sep-
02
Dec
-02
Mar
-03
Jun-
03
Sep-
03
Dec
-03
Mar
-04
Jun-
04
Sep-
04
Dec
-04
Mar
-05
Jun-
05
Sep-
05
Dec
-05
Mar
-06
Con
cent
ratio
n (u
g/L
)
4237
4239
4241
4243
4245
Gro
undw
ater
Ele
vatio
n (f
t)
DCE Vinyl Chloride Groundwater Elevation
HS-06
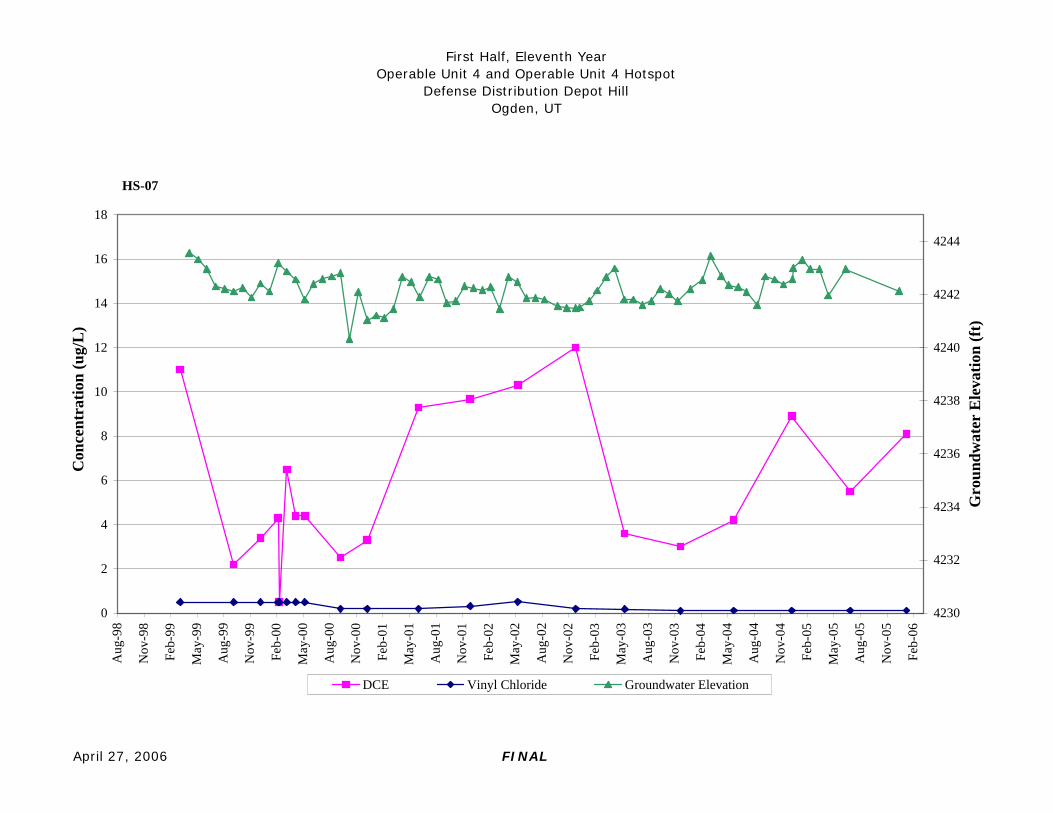
First Half, Eleventh YearOperable Unit 4 and Operable Unit 4 Hotspot
Defense Distribution Depot HillOgden, UT
April 27, 2006 FINAL
0
2
4
6
8
10
12
14
16
18
Aug
-98
Nov
-98
Feb-
99
May
-99
Aug
-99
Nov
-99
Feb-
00
May
-00
Aug
-00
Nov
-00
Feb-
01
May
-01
Aug
-01
Nov
-01
Feb-
02
May
-02
Aug
-02
Nov
-02
Feb-
03
May
-03
Aug
-03
Nov
-03
Feb-
04
May
-04
Aug
-04
Nov
-04
Feb-
05
May
-05
Aug
-05
Nov
-05
Feb-
06
Con
cent
ratio
n (u
g/L
)
4230
4232
4234
4236
4238
4240
4242
4244
Gro
undw
ater
Ele
vatio
n (f
t)
DCE Vinyl Chloride Groundwater Elevation
HS-07
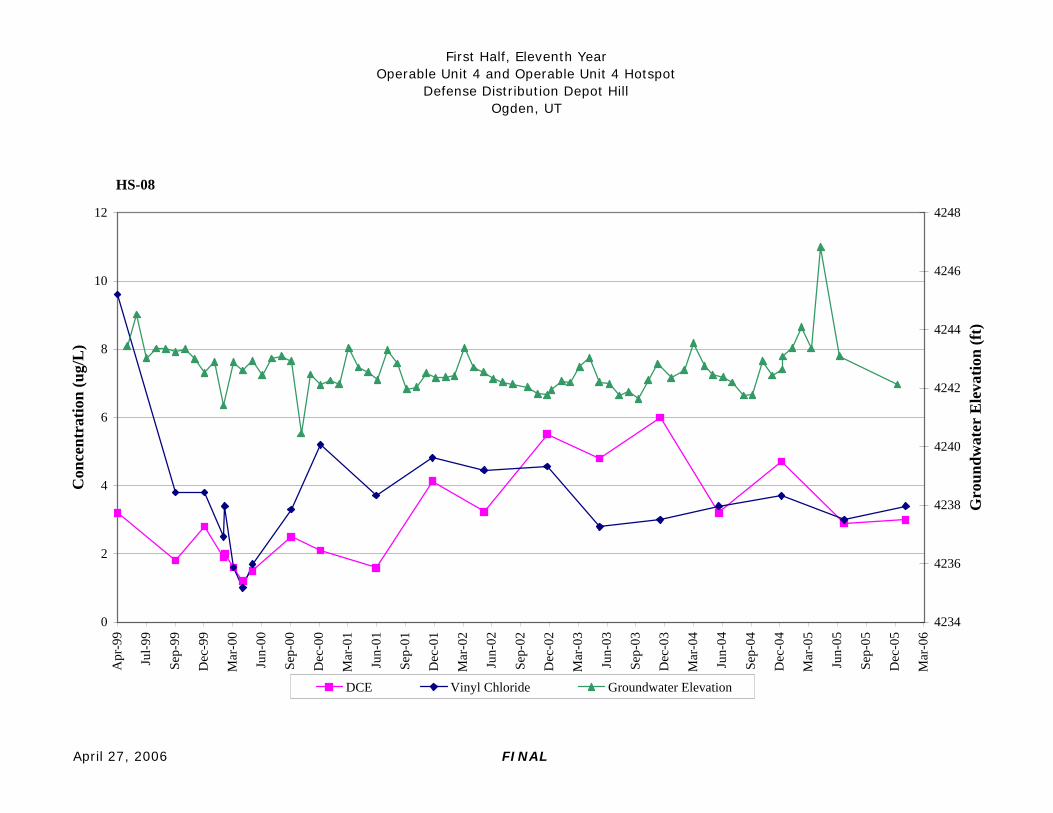
First Half, Eleventh YearOperable Unit 4 and Operable Unit 4 Hotspot
Defense Distribution Depot HillOgden, UT
April 27, 2006 FINAL
0
2
4
6
8
10
12
Apr
-99
Jul-9
9
Sep-
99
Dec
-99
Mar
-00
Jun-
00
Sep-
00
Dec
-00
Mar
-01
Jun-
01
Sep-
01
Dec
-01
Mar
-02
Jun-
02
Sep-
02
Dec
-02
Mar
-03
Jun-
03
Sep-
03
Dec
-03
Mar
-04
Jun-
04
Sep-
04
Dec
-04
Mar
-05
Jun-
05
Sep-
05
Dec
-05
Mar
-06
Con
cent
ratio
n (u
g/L
)
4234
4236
4238
4240
4242
4244
4246
4248
Gro
undw
ater
Ele
vatio
n (f
t)
DCE Vinyl Chloride Groundwater Elevation
HS-08
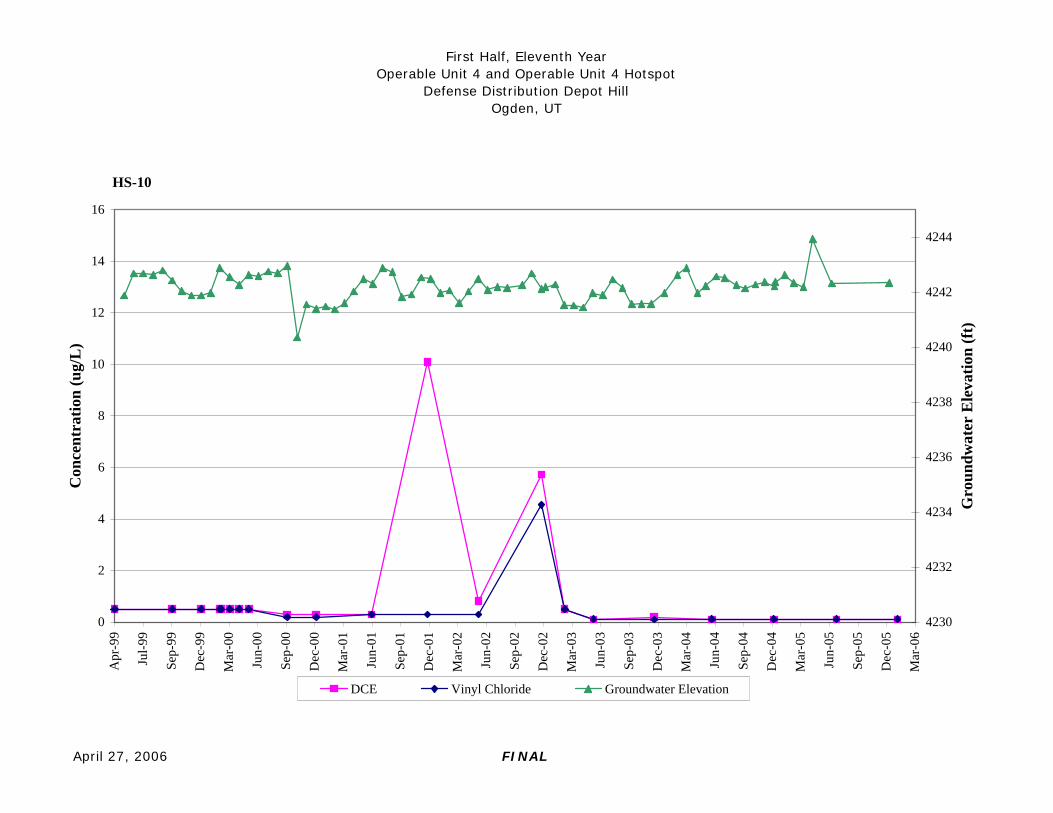
First Half, Eleventh YearOperable Unit 4 and Operable Unit 4 Hotspot
Defense Distribution Depot HillOgden, UT
April 27, 2006 FINAL
0
2
4
6
8
10
12
14
16
Apr
-99
Jul-9
9
Sep-
99
Dec
-99
Mar
-00
Jun-
00
Sep-
00
Dec
-00
Mar
-01
Jun-
01
Sep-
01
Dec
-01
Mar
-02
Jun-
02
Sep-
02
Dec
-02
Mar
-03
Jun-
03
Sep-
03
Dec
-03
Mar
-04
Jun-
04
Sep-
04
Dec
-04
Mar
-05
Jun-
05
Sep-
05
Dec
-05
Mar
-06
Con
cent
ratio
n (u
g/L
)
4230
4232
4234
4236
4238
4240
4242
4244
Gro
undw
ater
Ele
vatio
n (f
t)
DCE Vinyl Chloride Groundwater Elevation
HS-10
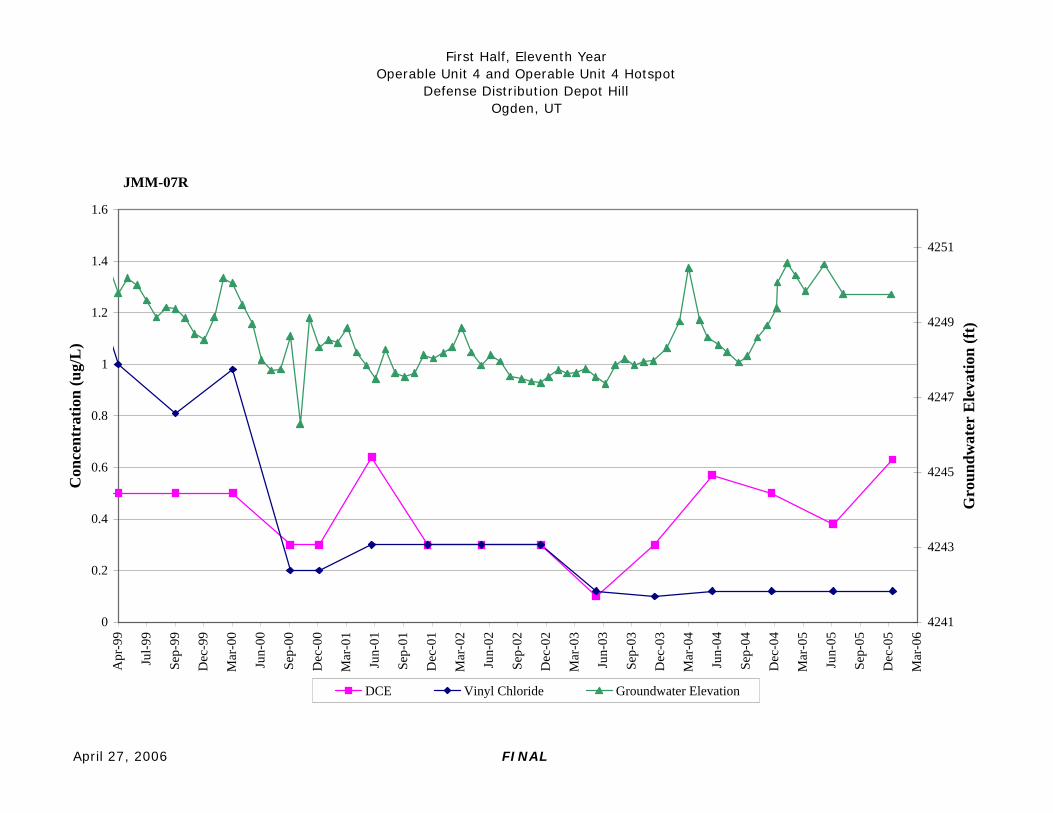
First Half, Eleventh YearOperable Unit 4 and Operable Unit 4 Hotspot
Defense Distribution Depot HillOgden, UT
April 27, 2006 FINAL
0
0.2
0.4
0.6
0.8
1
1.2
1.4
1.6
Apr
-99
Jul-9
9
Sep-
99
Dec
-99
Mar
-00
Jun-
00
Sep-
00
Dec
-00
Mar
-01
Jun-
01
Sep-
01
Dec
-01
Mar
-02
Jun-
02
Sep-
02
Dec
-02
Mar
-03
Jun-
03
Sep-
03
Dec
-03
Mar
-04
Jun-
04
Sep-
04
Dec
-04
Mar
-05
Jun-
05
Sep-
05
Dec
-05
Mar
-06
Con
cent
ratio
n (u
g/L
)
4241
4243
4245
4247
4249
4251
Gro
undw
ater
Ele
vatio
n (f
t)
DCE Vinyl Chloride Groundwater Elevation
JMM-07R
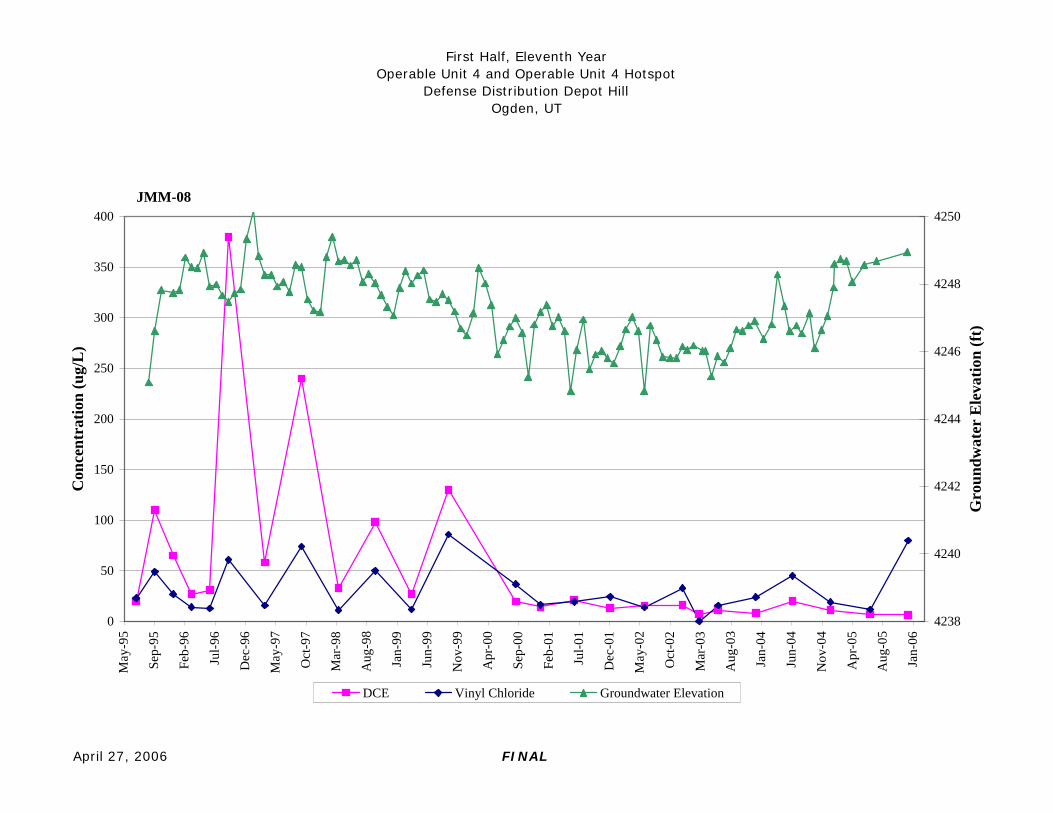
First Half, Eleventh YearOperable Unit 4 and Operable Unit 4 Hotspot
Defense Distribution Depot HillOgden, UT
April 27, 2006 FINAL
0
50
100
150
200
250
300
350
400
May
-95
Sep-
95
Feb-
96
Jul-9
6
Dec
-96
May
-97
Oct
-97
Mar
-98
Aug
-98
Jan-
99
Jun-
99
Nov
-99
Apr
-00
Sep-
00
Feb-
01
Jul-0
1
Dec
-01
May
-02
Oct
-02
Mar
-03
Aug
-03
Jan-
04
Jun-
04
Nov
-04
Apr
-05
Aug
-05
Jan-
06
Con
cent
ratio
n (u
g/L
)
4238
4240
4242
4244
4246
4248
4250
Gro
undw
ater
Ele
vatio
n (f
t)
DCE Vinyl Chloride Groundwater Elevation
JMM-08

First Half, Eleventh YearOperable Unit 4 and Operable Unit 4 Hotspot
Defense Distribution Depot HillOgden, UT
April 27, 2006 FINAL
0
20
40
60
80
100
120
140
Sep-
95
Feb-
96
Jul-9
6
Dec
-96
May
-97
Oct
-97
Mar
-98
Aug
-98
Jan-
99
Jun-
99
Nov
-99
Apr
-00
Sep-
00
Feb-
01
Jul-0
1
Dec
-01
May
-02
Oct
-02
Mar
-03
Aug
-03
Jan-
04
Jun-
04
Nov
-04
Apr
-05
Sep-
05
Feb-
06
Con
cent
ratio
n (u
g/L
)
4240
4241
4242
4243
4244
4245
4246
4247
4248
4249
4250
Gro
undw
ater
Ele
vatio
n (f
t)
DCE Vinyl Chloride Groundwater Elevation
JMM-09July 1995
concentration 2,000 μg/L
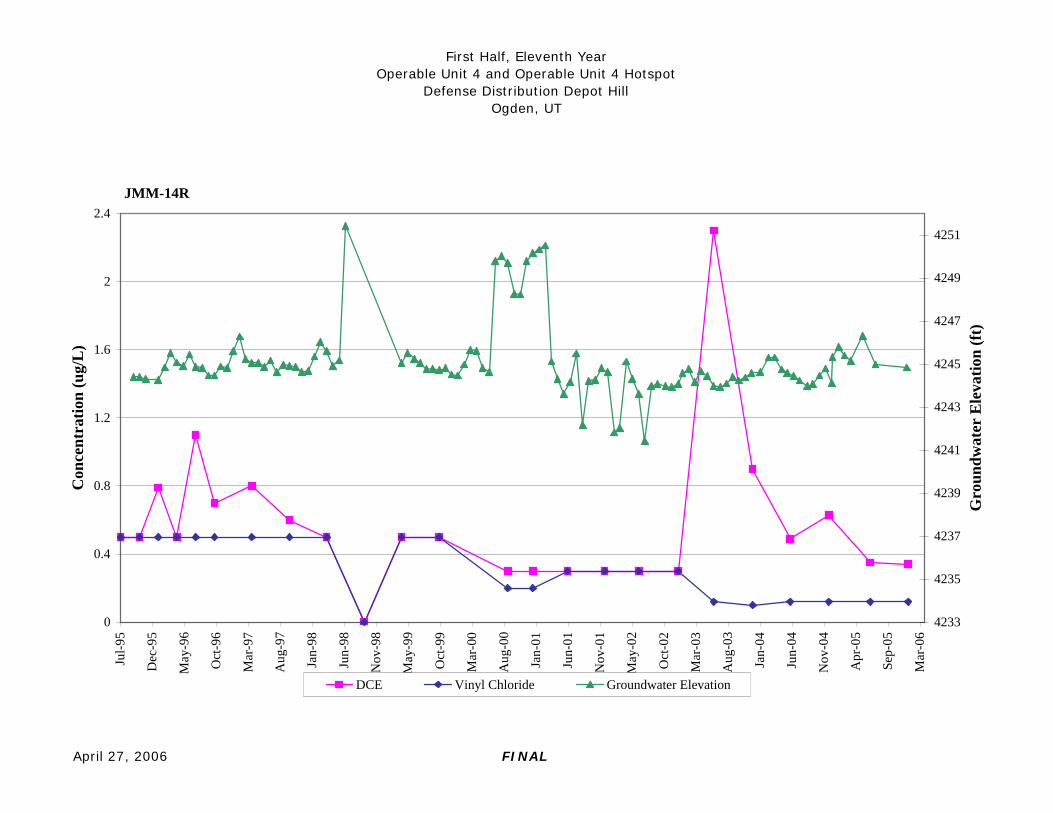
First Half, Eleventh YearOperable Unit 4 and Operable Unit 4 Hotspot
Defense Distribution Depot HillOgden, UT
April 27, 2006 FINAL
0
0.4
0.8
1.2
1.6
2
2.4
Jul-9
5
Dec
-95
May
-96
Oct
-96
Mar
-97
Aug
-97
Jan-
98
Jun-
98
Nov
-98
May
-99
Oct
-99
Mar
-00
Aug
-00
Jan-
01
Jun-
01
Nov
-01
May
-02
Oct
-02
Mar
-03
Aug
-03
Jan-
04
Jun-
04
Nov
-04
Apr
-05
Sep-
05
Mar
-06
Con
cent
ratio
n (u
g/L
)
4233
4235
4237
4239
4241
4243
4245
4247
4249
4251
Gro
undw
ater
Ele
vatio
n (f
t)
DCE Vinyl Chloride Groundwater Elevation
JMM-14R
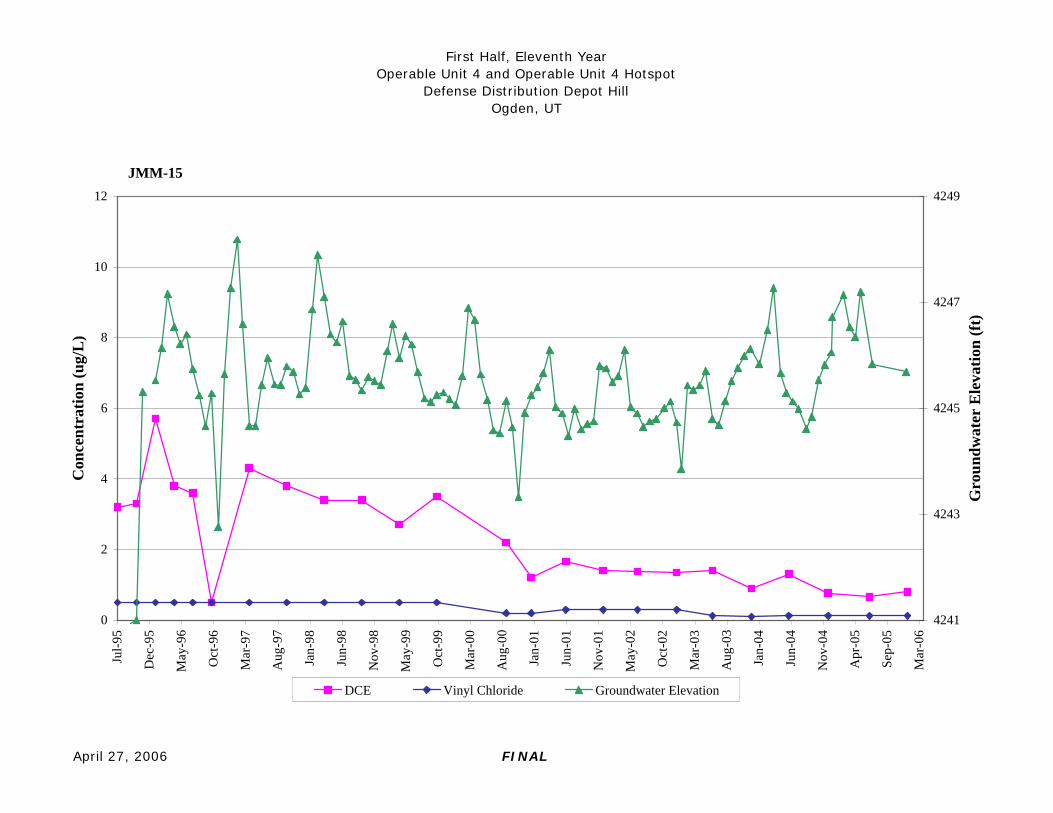
First Half, Eleventh YearOperable Unit 4 and Operable Unit 4 Hotspot
Defense Distribution Depot HillOgden, UT
April 27, 2006 FINAL
0
2
4
6
8
10
12
Jul-9
5
Dec
-95
May
-96
Oct
-96
Mar
-97
Aug
-97
Jan-
98
Jun-
98
Nov
-98
May
-99
Oct
-99
Mar
-00
Aug
-00
Jan-
01
Jun-
01
Nov
-01
May
-02
Oct
-02
Mar
-03
Aug
-03
Jan-
04
Jun-
04
Nov
-04
Apr
-05
Sep-
05
Mar
-06
Con
cent
ratio
n (u
g/L
)
4241
4243
4245
4247
4249
Gro
undw
ater
Ele
vatio
n (f
t)
DCE Vinyl Chloride Groundwater Elevation
JMM-15

First Half, Eleventh YearOperable Unit 4 and Operable Unit 4 Hotspot
Defense Distribution Depot HillOgden, UT
April 27, 2006 FINAL
0
0.5
1
1.5
2
Jul-9
5
Dec
-95
May
-96
Oct
-96
Mar
-97
Aug
-97
Jan-
98
Jun-
98
Nov
-98
May
-99
Oct
-99
Mar
-00
Aug
-00
Jan-
01
Jun-
01
Nov
-01
May
-02
Oct
-02
Mar
-03
Aug
-03
Jan-
04
Jun-
04
Nov
-04
Apr
-05
Sep-
05
Mar
-06
Con
cent
ratio
n (u
g/L
)
4235
4237
4239
4241
4243
4245
4247
Gro
undw
ater
Ele
vatio
n (f
t)
DCE Vinyl Chloride Groundwater Elevation
JMM-30
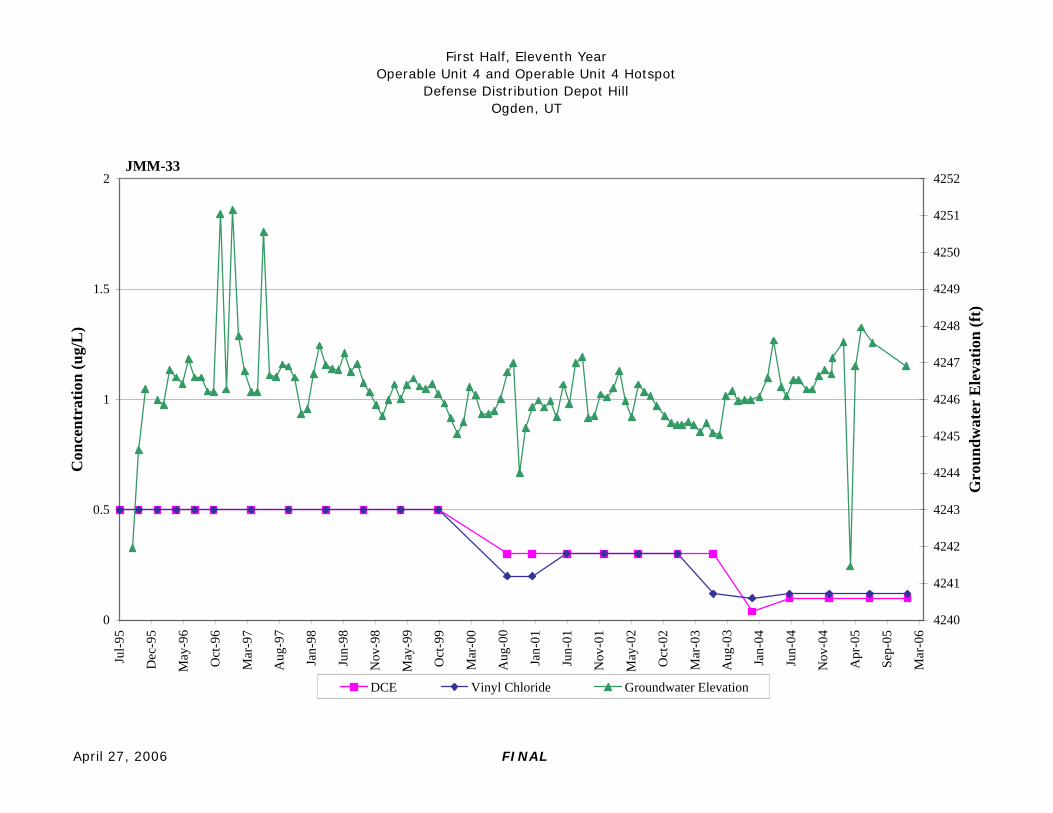
First Half, Eleventh YearOperable Unit 4 and Operable Unit 4 Hotspot
Defense Distribution Depot HillOgden, UT
April 27, 2006 FINAL
0
0.5
1
1.5
2
Jul-9
5
Dec
-95
May
-96
Oct
-96
Mar
-97
Aug
-97
Jan-
98
Jun-
98
Nov
-98
May
-99
Oct
-99
Mar
-00
Aug
-00
Jan-
01
Jun-
01
Nov
-01
May
-02
Oct
-02
Mar
-03
Aug
-03
Jan-
04
Jun-
04
Nov
-04
Apr
-05
Sep-
05
Mar
-06
Con
cent
ratio
n (u
g/L
)
4240
4241
4242
4243
4244
4245
4246
4247
4248
4249
4250
4251
4252
Gro
undw
ater
Ele
vatio
n (f
t)
DCE Vinyl Chloride Groundwater Elevation
JMM-33

First Half, Eleventh YearOperable Unit 4 and Operable Unit 4 Hotspot
Defense Distribution Depot HillOgden, UT
April 27, 2006 FINAL
0
0.5
1
1.5
2
2.5
Jul-9
5
Dec
-95
May
-96
Oct
-96
Mar
-97
Aug
-97
Jan-
98
Jun-
98
Nov
-98
May
-99
Oct
-99
Mar
-00
Aug
-00
Jan-
01
Jun-
01
Nov
-01
May
-02
Oct
-02
Mar
-03
Aug
-03
Jan-
04
Jun-
04
Nov
-04
Apr
-05
Sep-
05
Mar
-06
Con
cent
ratio
n (u
g/L
)
4236
4238
4240
4242
4244
4246
4248
4250
4252
4254
Gro
undw
ater
Ele
vatio
n (f
t)
DCE Vinyl Chloride Groundwater Elevation
JMM-44
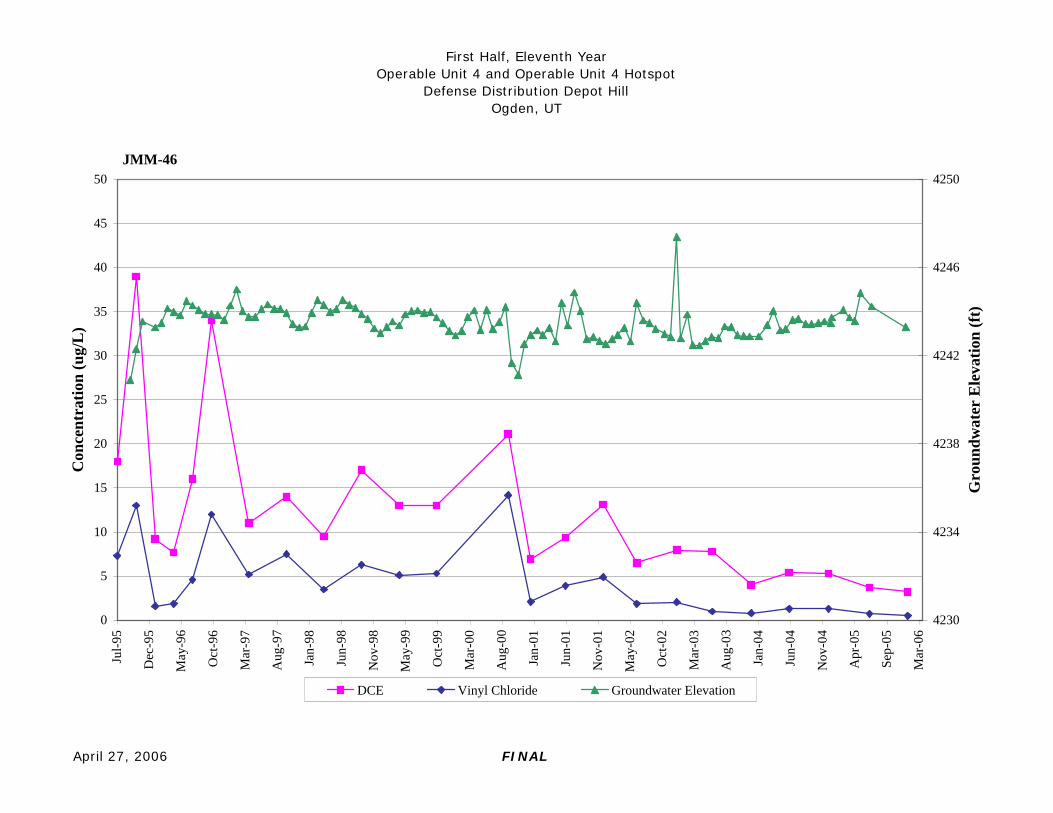
First Half, Eleventh YearOperable Unit 4 and Operable Unit 4 Hotspot
Defense Distribution Depot HillOgden, UT
April 27, 2006 FINAL
0
5
10
15
20
25
30
35
40
45
50
Jul-9
5
Dec
-95
May
-96
Oct
-96
Mar
-97
Aug
-97
Jan-
98
Jun-
98
Nov
-98
May
-99
Oct
-99
Mar
-00
Aug
-00
Jan-
01
Jun-
01
Nov
-01
May
-02
Oct
-02
Mar
-03
Aug
-03
Jan-
04
Jun-
04
Nov
-04
Apr
-05
Sep-
05
Mar
-06
Con
cent
ratio
n (u
g/L
)
4230
4234
4238
4242
4246
4250
Gro
undw
ater
Ele
vatio
n (f
t)
DCE Vinyl Chloride Groundwater Elevation
JMM-46
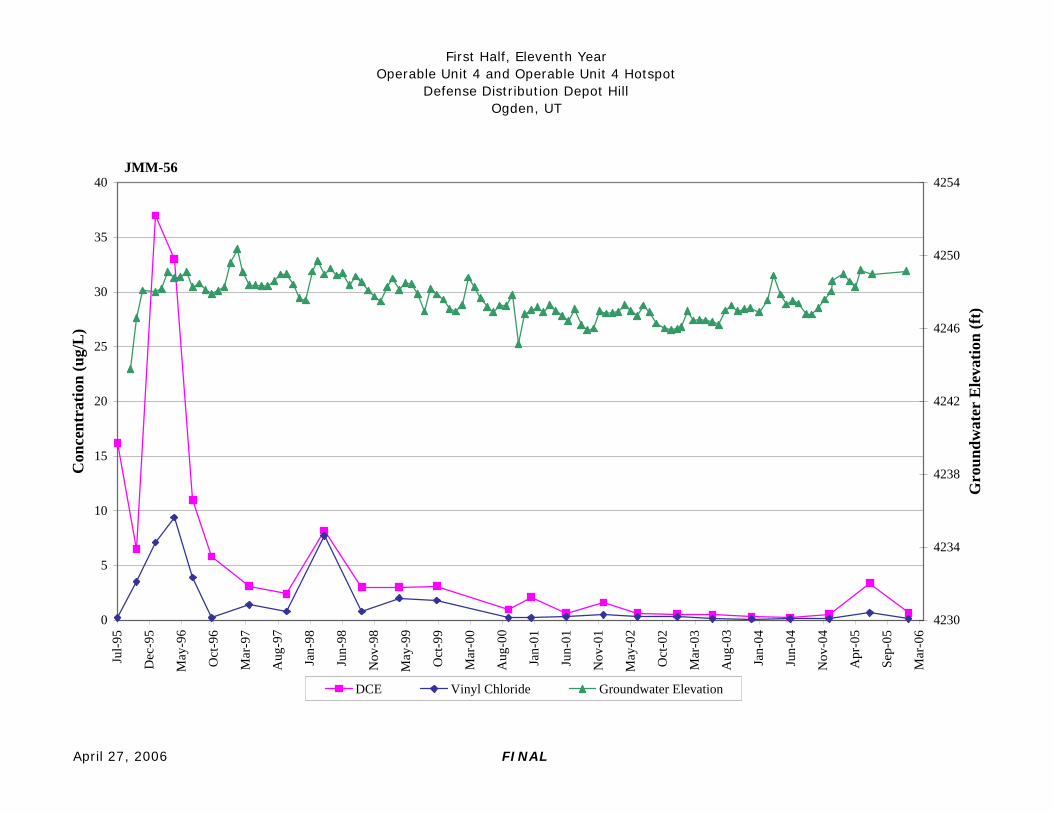
First Half, Eleventh YearOperable Unit 4 and Operable Unit 4 Hotspot
Defense Distribution Depot HillOgden, UT
April 27, 2006 FINAL
0
5
10
15
20
25
30
35
40
Jul-9
5
Dec
-95
May
-96
Oct
-96
Mar
-97
Aug
-97
Jan-
98
Jun-
98
Nov
-98
May
-99
Oct
-99
Mar
-00
Aug
-00
Jan-
01
Jun-
01
Nov
-01
May
-02
Oct
-02
Mar
-03
Aug
-03
Jan-
04
Jun-
04
Nov
-04
Apr
-05
Sep-
05
Mar
-06
Con
cent
ratio
n (u
g/L
)
4230
4234
4238
4242
4246
4250
4254
Gro
undw
ater
Ele
vatio
n (f
t)
DCE Vinyl Chloride Groundwater Elevation
JMM-56
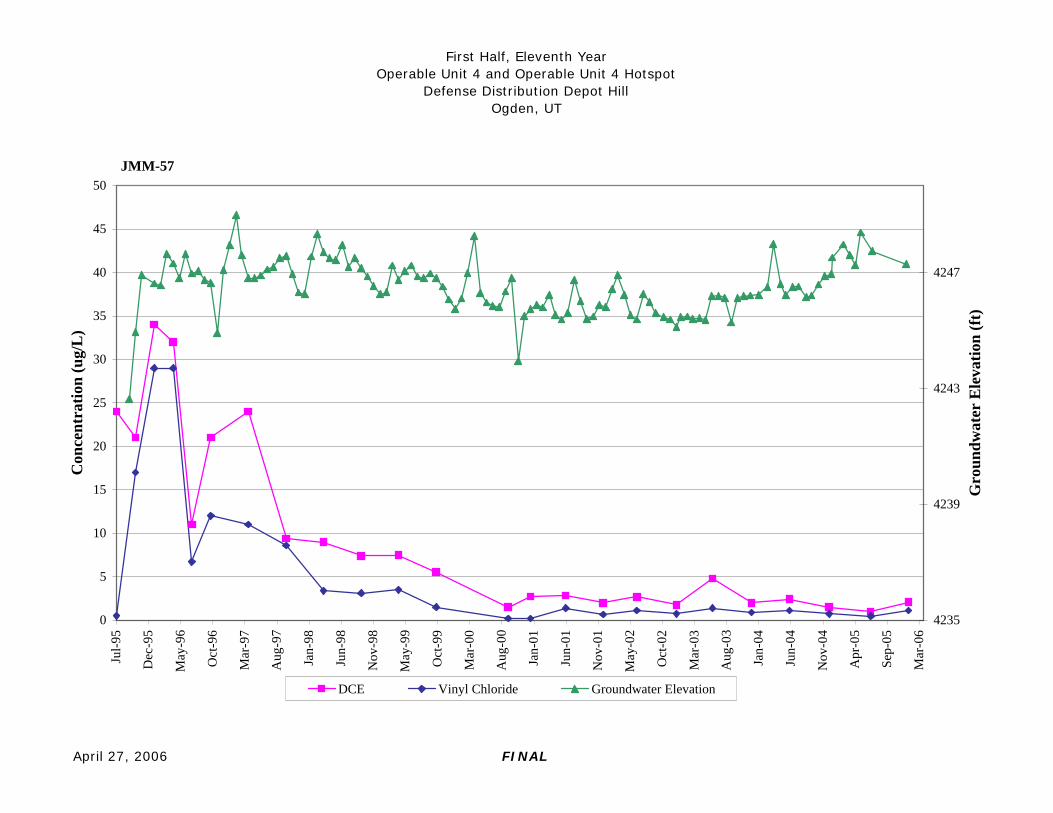
First Half, Eleventh YearOperable Unit 4 and Operable Unit 4 Hotspot
Defense Distribution Depot HillOgden, UT
April 27, 2006 FINAL
0
5
10
15
20
25
30
35
40
45
50
Jul-9
5
Dec
-95
May
-96
Oct
-96
Mar
-97
Aug
-97
Jan-
98
Jun-
98
Nov
-98
May
-99
Oct
-99
Mar
-00
Aug
-00
Jan-
01
Jun-
01
Nov
-01
May
-02
Oct
-02
Mar
-03
Aug
-03
Jan-
04
Jun-
04
Nov
-04
Apr
-05
Sep-
05
Mar
-06
Con
cent
ratio
n (u
g/L
)
4235
4239
4243
4247
Gro
undw
ater
Ele
vatio
n (f
t)
DCE Vinyl Chloride Groundwater Elevation
JMM-57
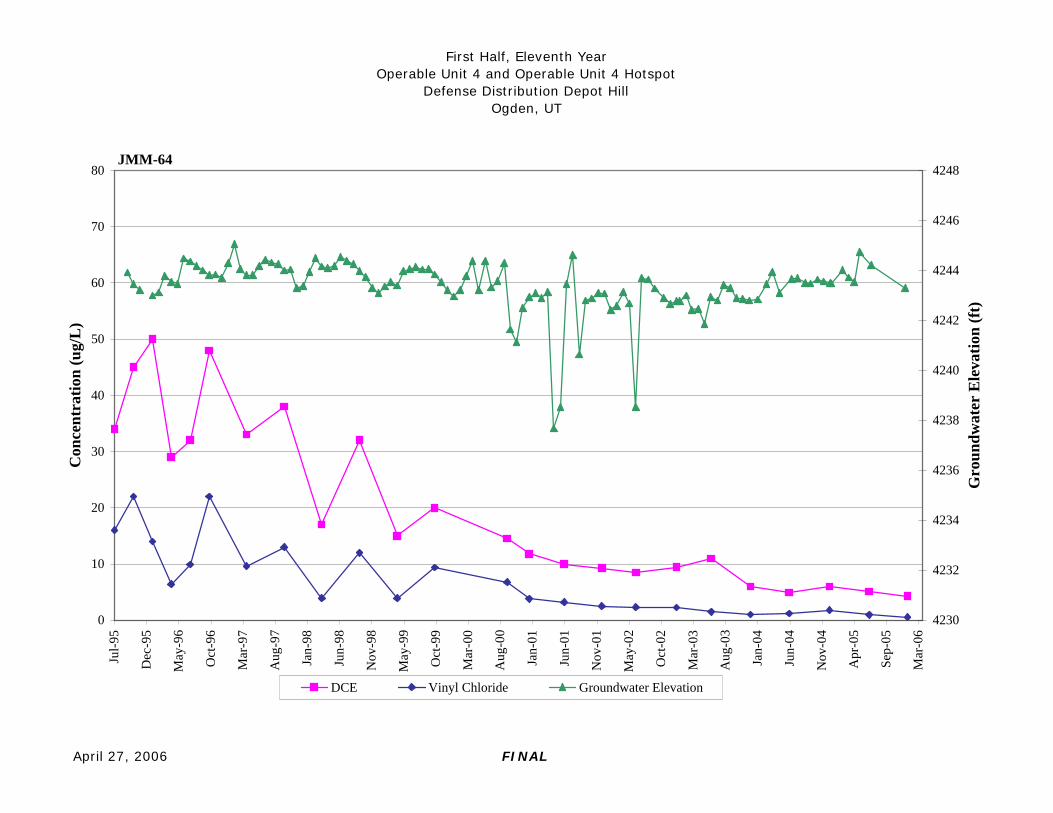
First Half, Eleventh YearOperable Unit 4 and Operable Unit 4 Hotspot
Defense Distribution Depot HillOgden, UT
April 27, 2006 FINAL
0
10
20
30
40
50
60
70
80
Jul-9
5
Dec
-95
May
-96
Oct
-96
Mar
-97
Aug
-97
Jan-
98
Jun-
98
Nov
-98
May
-99
Oct
-99
Mar
-00
Aug
-00
Jan-
01
Jun-
01
Nov
-01
May
-02
Oct
-02
Mar
-03
Aug
-03
Jan-
04
Jun-
04
Nov
-04
Apr
-05
Sep-
05
Mar
-06
Con
cent
ratio
n (u
g/L
)
4230
4232
4234
4236
4238
4240
4242
4244
4246
4248
Gro
undw
ater
Ele
vatio
n (f
t)
DCE Vinyl Chloride Groundwater Elevation
JMM-64
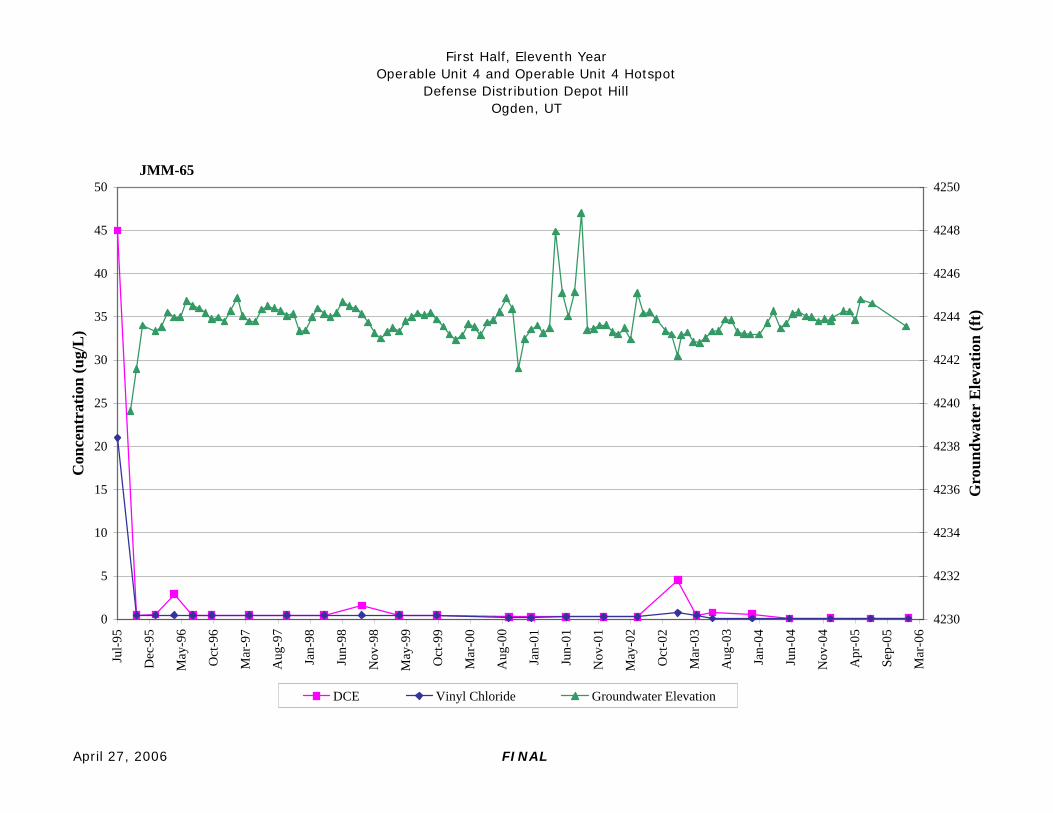
First Half, Eleventh YearOperable Unit 4 and Operable Unit 4 Hotspot
Defense Distribution Depot HillOgden, UT
April 27, 2006 FINAL
0
5
10
15
20
25
30
35
40
45
50
Jul-9
5
Dec
-95
May
-96
Oct
-96
Mar
-97
Aug
-97
Jan-
98
Jun-
98
Nov
-98
May
-99
Oct
-99
Mar
-00
Aug
-00
Jan-
01
Jun-
01
Nov
-01
May
-02
Oct
-02
Mar
-03
Aug
-03
Jan-
04
Jun-
04
Nov
-04
Apr
-05
Sep-
05
Mar
-06
Con
cent
ratio
n (u
g/L
)
4230
4232
4234
4236
4238
4240
4242
4244
4246
4248
4250
Gro
undw
ater
Ele
vatio
n (f
t)
DCE Vinyl Chloride Groundwater Elevation
JMM-65

Interview Report
INTERVIEW DOCUMENTATION FORM
The following is a list of individuals interviewed for this five-year review. See the attached contact record(s) for a detailed summary of the interviews.
Jim Kiefer
Name
Env. Scientist Title/Position
EPA Region VIII
Organization
4/19/06
Date
Muhammad Slam Name
Engineer
Title/Position
Utah, DEQ
Organization
_4/19/06
Date
Larry McFarland
Name
TEAD and DDHU Env. Coordinator
Title/Position
Army, TEAD Organization
4/19/06
Date
Ross Sollars Name
Project Manager
Title/Position
AEEC
Organization
4/19/06
Date
Ed Larrat Name
O&M Manager Title/Position
AEEC
Organization
4/19/06
Date
Marc Sydow Name
Geologist
Title/Position
USACE
Organization
4/19/06
Date
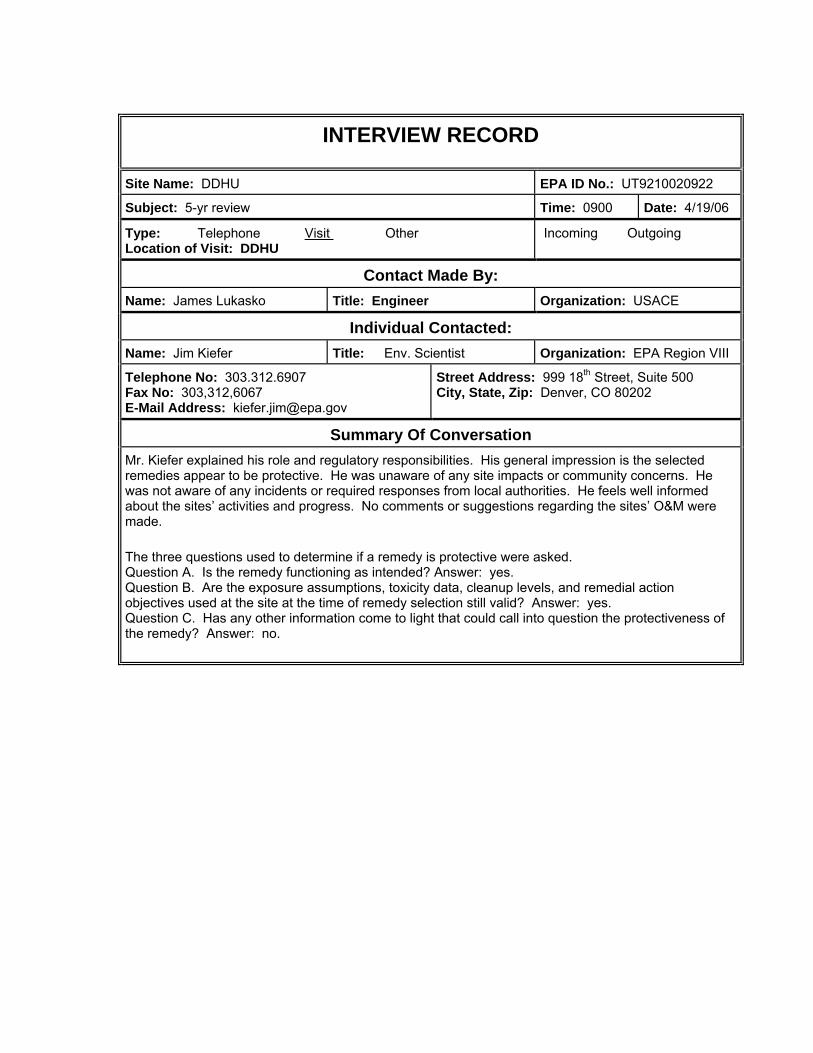
INTERVIEW RECORD
Site Name: DDHU EPA ID No.: UT9210020922 Subject: 5-yr review Time: 0900 Date: 4/19/06
Incoming Outgoing Type: Telephone Visit Other Location of Visit: DDHU
Contact Made By: Name: James Lukasko Organization: USACE Title: Engineer
Individual Contacted: Name: Jim Kiefer Title: Env. Scientist Organization: EPA Region VIII
Telephone No: 303.312.6907 Fax No: 303,312,6067 E-Mail Address: [email protected]
Street Address: 999 18th Street, Suite 500 City, State, Zip: Denver, CO 80202
Summary Of Conversation
Mr. Kiefer explained his role and regulatory responsibilities. His general impression is the selected remedies appear to be protective. He was unaware of any site impacts or community concerns. He was not aware of any incidents or required responses from local authorities. He feels well informed about the sites’ activities and progress. No comments or suggestions regarding the sites’ O&M were made. The three questions used to determine if a remedy is protective were asked. Question A. Is the remedy functioning as intended? Answer: yes. Question B. Are the exposure assumptions, toxicity data, cleanup levels, and remedial action objectives used at the site at the time of remedy selection still valid? Answer: yes. Question C. Has any other information come to light that could call into question the protectiveness of the remedy? Answer: no.
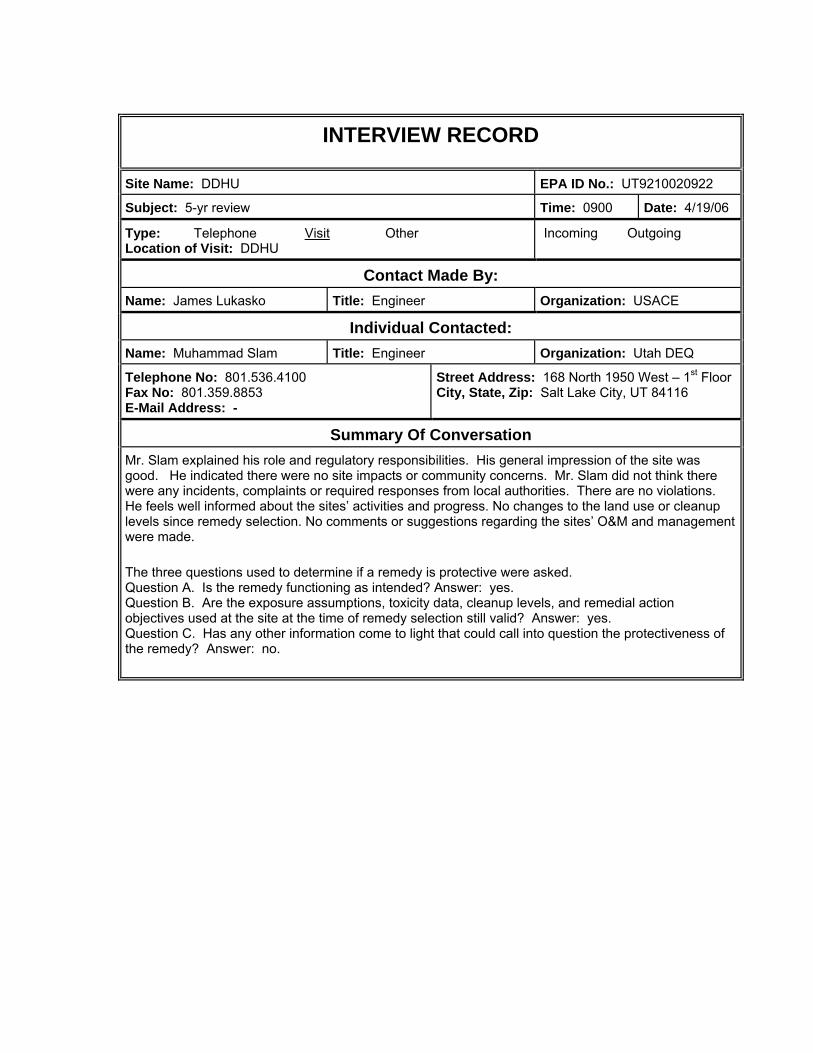
INTERVIEW RECORD
Site Name: DDHU EPA ID No.: UT9210020922 Subject: 5-yr review Time: 0900 Date: 4/19/06
Incoming Outgoing Type: Telephone Visit Other Location of Visit: DDHU
Contact Made By: Name: James Lukasko Title: Engineer Organization: USACE
Individual Contacted: Name: Muhammad Slam Title: Engineer Organization: Utah DEQ
Telephone No: 801.536.4100 Fax No: 801.359.8853 E-Mail Address: -
Street Address: 168 North 1950 West – 1st Floor City, State, Zip: Salt Lake City, UT 84116
Summary Of Conversation
Mr. Slam explained his role and regulatory responsibilities. His general impression of the site was good. He indicated there were no site impacts or community concerns. Mr. Slam did not think there were any incidents, complaints or required responses from local authorities. There are no violations. He feels well informed about the sites’ activities and progress. No changes to the land use or cleanup levels since remedy selection. No comments or suggestions regarding the sites’ O&M and management were made. The three questions used to determine if a remedy is protective were asked. Question A. Is the remedy functioning as intended? Answer: yes. Question B. Are the exposure assumptions, toxicity data, cleanup levels, and remedial action objectives used at the site at the time of remedy selection still valid? Answer: yes. Question C. Has any other information come to light that could call into question the protectiveness of the remedy? Answer: no.

INTERVIEW RECORD
Site Name: DDHU EPA ID No.: UT9210020922 Subject: 5-year review Time: 0900 Date: 4/19/06
Incoming Outgoing Type: Telephone Visit Other Location of Visit: DDHU
Contact Made By: Name: James Lukasko Title: Engineer Organization: USACE
Individual Contacted: Name: Larry McFarland Title: TEAD POC Organization: Army TEAD
Telephone No: 435.833.3235 Fax No: 435.833.2839 E-Mail Address: [email protected]
Street Address: SMATE-CS-EO Building 8, TEAD City, State, Zip: Toole Army Depot, UT 84074-5033
Summary Of Conversation
Mr. McFarland explained his role and responsibilities. His general impression is the existing operating systems are expensive, and not cleaning up the sites as quickly as hoped. He was unaware of any offsite impacts or property owner concerns. He was not aware of any incidents or required responses from local authorities. He feels well informed about the sites’ activities and progress. He indicated that land use controls exist for impacted parcels. The site has been in compliance with permitting and reporting requirements. No comments or suggestions regarding the sites’ O&M were made. The three questions used to determine if a remedy is protective were asked. Question A. Is the remedy functioning as intended? Answer: yes. Question B. Are the exposure assumptions, toxicity data, cleanup levels, and remedial action objectives used at the site at the time of remedy selection still valid? Answer: yes. Question C. Has any other information come to light that could call into question the protectiveness of the remedy? Answer: no.

INTERVIEW RECORD
Site Name: DDHU EPA ID No.: UT9210020922 Subject: 5-year review Time: 1100 Date: 4/19/06
Incoming Outgoing Type: Telephone Visit Other Location of Visit: DDHU
Contact Made By: Name: James Lukasko Title: Engineer Organization: USACE
Individual Contacted: Name: Ross Sollars Title: Project Manager Organization: AEEC
Telephone No: 801.947.1322, ext. 206 Fax No: 801.942.8040 E-Mail Address: [email protected]
Street Address: 2540 E. Bengal Blvd. City, State, Zip: Salt Lake City, UT 84121
Summary Of Conversation
The role of AEEC in providing operation and maintenance for the remediation systems was discussed. Identification of O&M staff and duties was provided. O&M manuals, SSHP, reports and other documentation were provided for examination. No problems noted with the remedial design other than bacteria fouling. The continuous need to monitor wells and protective structures (bollards and vaults) was stated. Overall impression of the project was good.
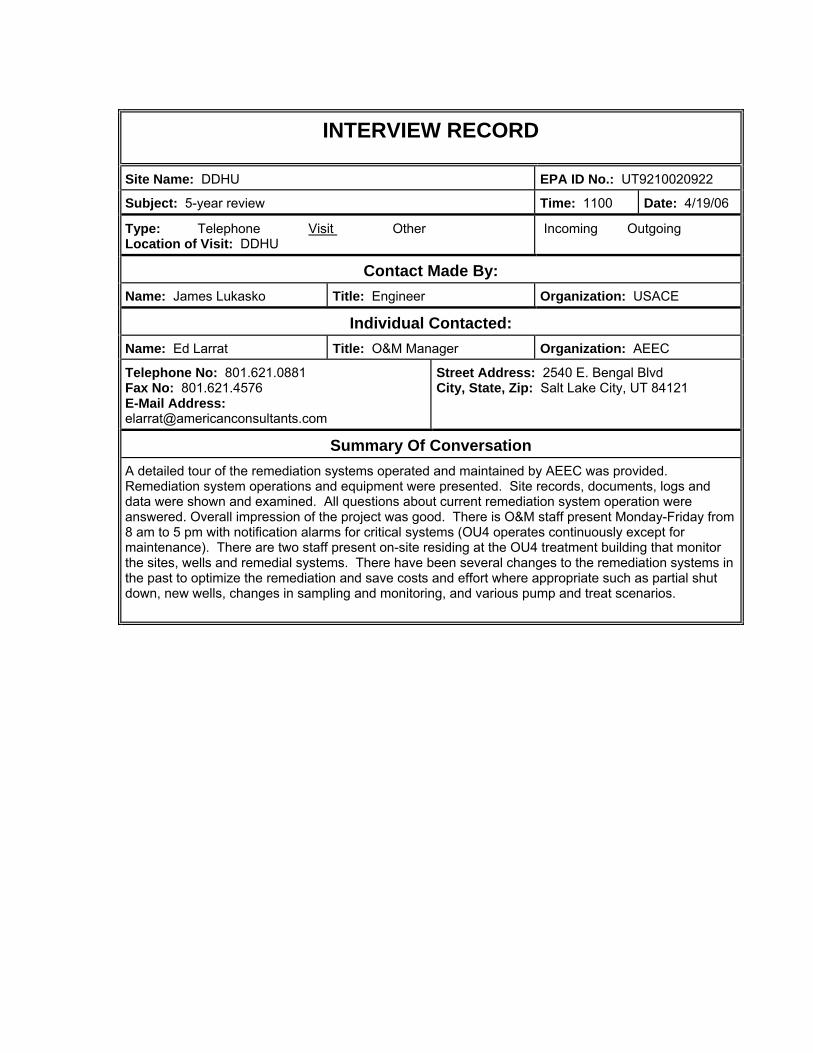
INTERVIEW RECORD
Site Name: DDHU EPA ID No.: UT9210020922 Subject: 5-year review Time: 1100 Date: 4/19/06
Incoming Outgoing Type: Telephone Visit Other Location of Visit: DDHU
Contact Made By: Name: James Lukasko Title: Engineer Organization: USACE
Individual Contacted: Name: Ed Larrat Title: O&M Manager Organization: AEEC
Telephone No: 801.621.0881 Fax No: 801.621.4576 E-Mail Address: [email protected]
Street Address: 2540 E. Bengal Blvd City, State, Zip: Salt Lake City, UT 84121
Summary Of Conversation
A detailed tour of the remediation systems operated and maintained by AEEC was provided. Remediation system operations and equipment were presented. Site records, documents, logs and data were shown and examined. All questions about current remediation system operation were answered. Overall impression of the project was good. There is O&M staff present Monday-Friday from 8 am to 5 pm with notification alarms for critical systems (OU4 operates continuously except for maintenance). There are two staff present on-site residing at the OU4 treatment building that monitor the sites, wells and remedial systems. There have been several changes to the remediation systems in the past to optimize the remediation and save costs and effort where appropriate such as partial shut down, new wells, changes in sampling and monitoring, and various pump and treat scenarios.
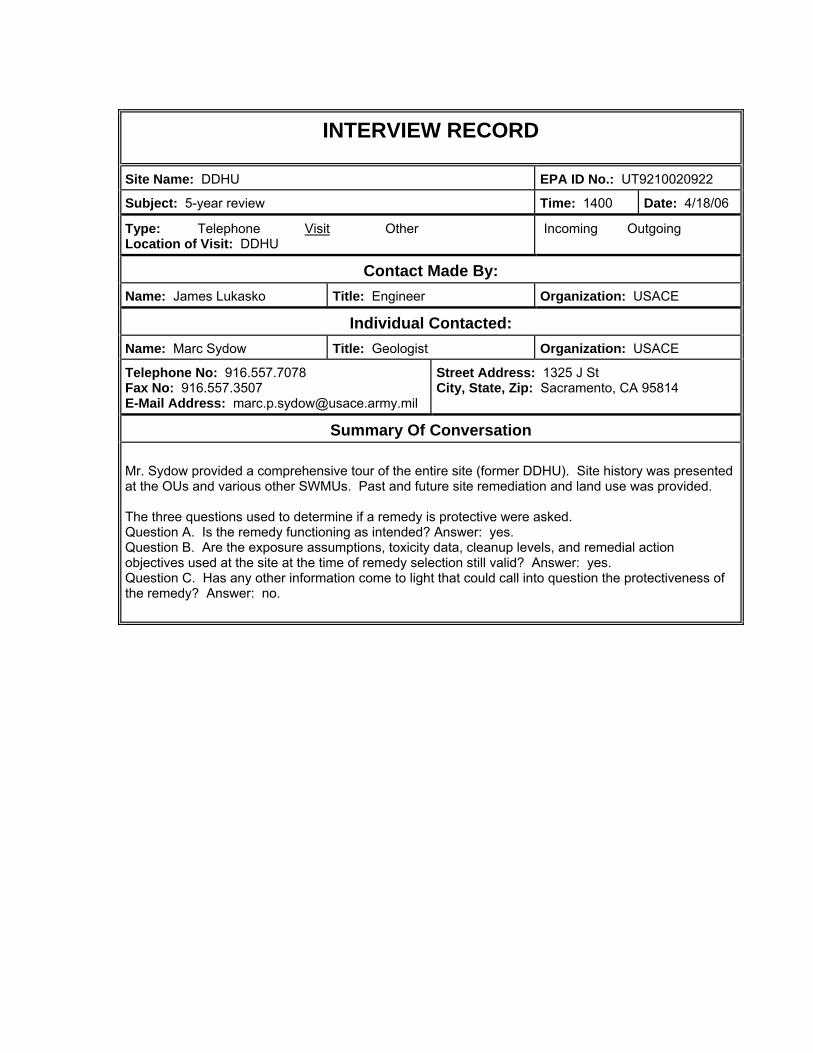
INTERVIEW RECORD
Site Name: DDHU EPA ID No.: UT9210020922 Subject: 5-year review Time: 1400 Date: 4/18/06
Incoming Outgoing Type: Telephone Visit Other Location of Visit: DDHU
Contact Made By: Name: James Lukasko Title: Engineer Organization: USACE
Individual Contacted: Name: Marc Sydow Title: Geologist Organization: USACE
Telephone No: 916.557.7078 Fax No: 916.557.3507 E-Mail Address: [email protected]
Street Address: 1325 J St City, State, Zip: Sacramento, CA 95814
Summary Of Conversation
Mr. Sydow provided a comprehensive tour of the entire site (former DDHU). Site history was presented at the OUs and various other SWMUs. Past and future site remediation and land use was provided. The three questions used to determine if a remedy is protective were asked. Question A. Is the remedy functioning as intended? Answer: yes. Question B. Are the exposure assumptions, toxicity data, cleanup levels, and remedial action objectives used at the site at the time of remedy selection still valid? Answer: yes. Question C. Has any other information come to light that could call into question the protectiveness of the remedy? Answer: no.
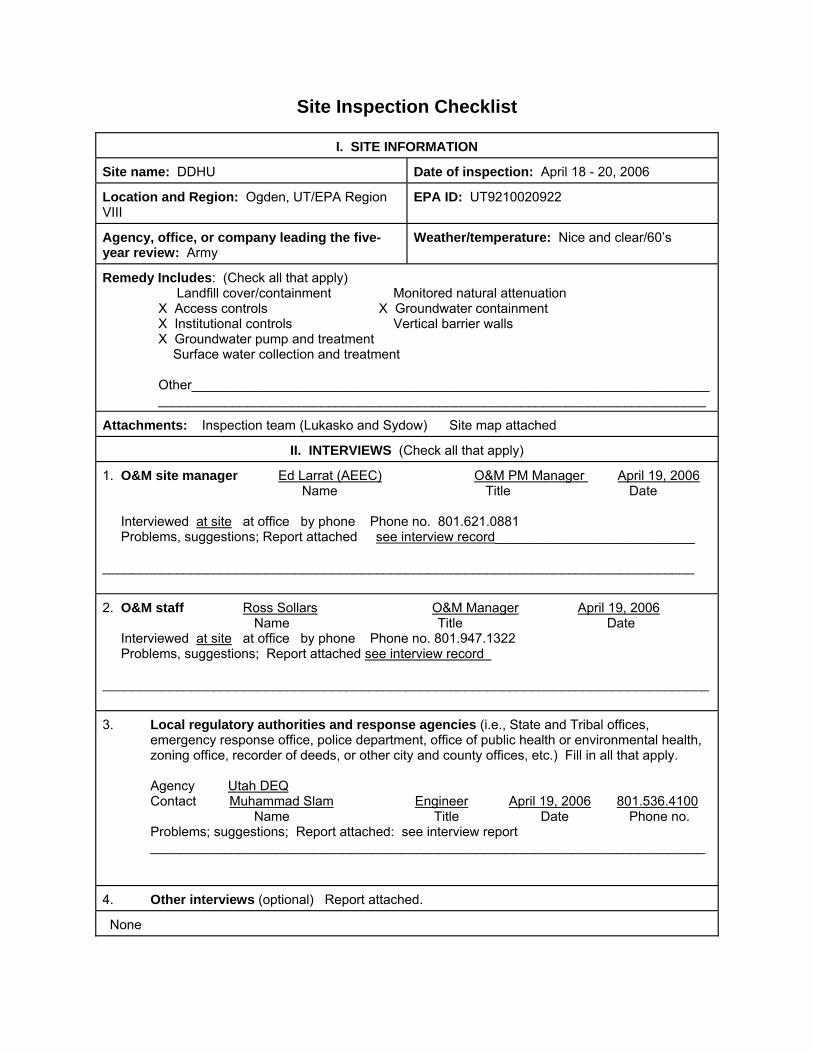
Site Inspection Checklist
I. SITE INFORMATION
Site name: DDHU Date of inspection: April 18 - 20, 2006
Location and Region: Ogden, UT/EPA Region VIII
EPA ID: UT9210020922
Agency, office, or company leading the five-year review: Army
Weather/temperature: Nice and clear/60’s
Remedy Includes: (Check all that apply) Landfill cover/containment Monitored natural attenuation X Access controls X Groundwater containment X Institutional controls Vertical barrier walls X Groundwater pump and treatment Surface water collection and treatment Other______________________________________________________________________ __________________________________________________________________________
Attachments: Inspection team (Lukasko and Sydow) Site map attached
II. INTERVIEWS (Check all that apply)
1. O&M site manager Ed Larrat (AEEC) O&M PM Manager April 19, 2006Name Title Date
Interviewed at site at office by phone Phone no. 801.621.0881 Problems, suggestions; Report attached see interview record___________________________ ________________________________________________________________________________
2. O&M staff Ross Sollars O&M Manager April 19, 2006Name Title Date
Interviewed at site at office by phone Phone no. 801.947.1322 Problems, suggestions; Report attached see interview record __________________________________________________________________________________
3. Local regulatory authorities and response agencies (i.e., State and Tribal offices, emergency response office, police department, office of public health or environmental health, zoning office, recorder of deeds, or other city and county offices, etc.) Fill in all that apply.
Agency Utah DEQContact Muhammad Slam Engineer April 19, 2006 801.536.4100
Name Title Date Phone no. Problems; suggestions; Report attached: see interview report ___________________________________________________________________________
4. Other interviews (optional) Report attached.
None
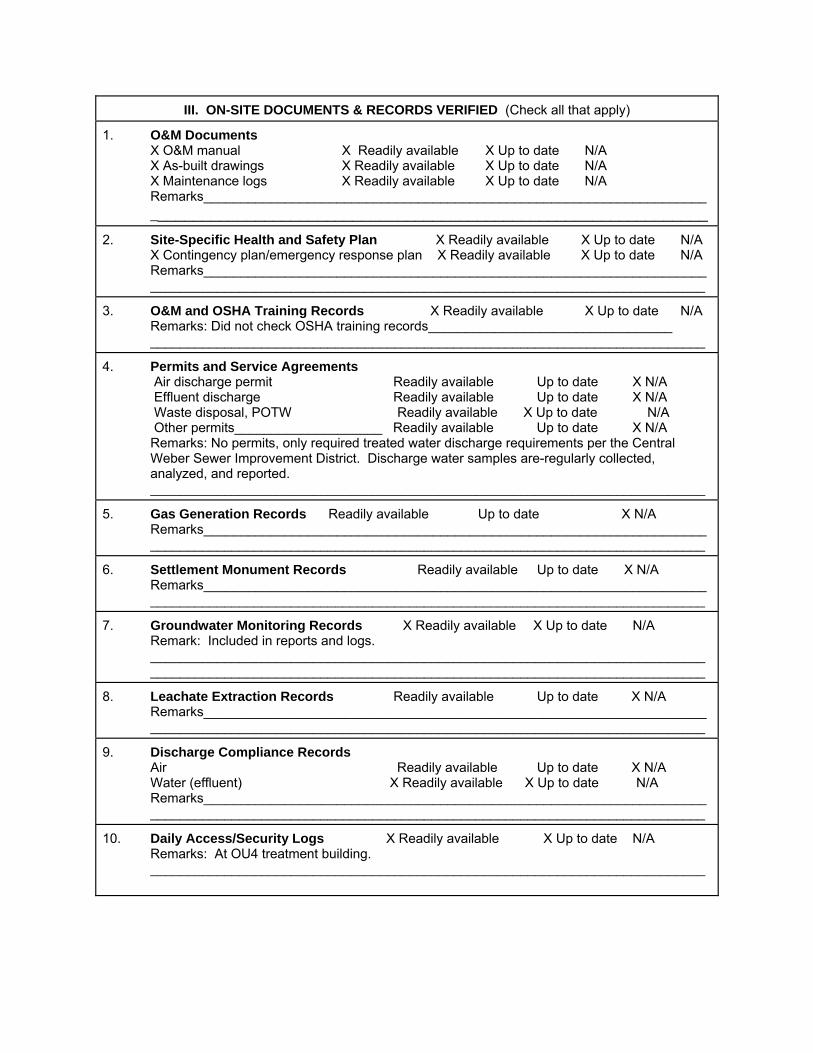
III. ON-SITE DOCUMENTS & RECORDS VERIFIED (Check all that apply)
1. O&M Documents X O&M manual X Readily available X Up to date N/A X As-built drawings X Readily available X Up to date N/A X Maintenance logs X Readily available X Up to date N/A Remarks____________________________________________________________________ _______________________________________________________________
2. Site-Specific Health and Safety Plan X Readily available X Up to date N/A X Contingency plan/emergency response plan X Readily available X Up to date N/A Remarks____________________________________________________________________ ___________________________________________________________________________
3. O&M and OSHA Training Records X Readily available X Up to date N/A Remarks: Did not check OSHA training records_________________________________ ___________________________________________________________________________
4. Permits and Service Agreements Air discharge permit Readily available Up to date X N/A Effluent discharge Readily available Up to date X N/A Waste disposal, POTW Readily available X Up to date N/A Other permits____________________ Readily available Up to date X N/A Remarks: No permits, only required treated water discharge requirements per the Central Weber Sewer Improvement District. Discharge water samples are-regularly collected, analyzed, and reported. ___________________________________________________________________________
5. Gas Generation Records Readily available Up to date X N/A Remarks____________________________________________________________________ ___________________________________________________________________________
6. Settlement Monument Records Readily available Up to date X N/A Remarks____________________________________________________________________ ___________________________________________________________________________
7. Groundwater Monitoring Records X Readily available X Up to date N/A Remark: Included in reports and logs. ___________________________________________________________________________ ___________________________________________________________________________
8. Leachate Extraction Records Readily available Up to date X N/A Remarks____________________________________________________________________ ___________________________________________________________________________
9. Discharge Compliance Records Air Readily available Up to date X N/A Water (effluent) X Readily available X Up to date N/A Remarks____________________________________________________________________ ___________________________________________________________________________
10. Daily Access/Security Logs X Readily available X Up to date N/A Remarks: At OU4 treatment building. ___________________________________________________________________________

IV. O&M COSTS
1. O&M Organization State in-house Contractor for State PRP in-house Contractor for PRP Federal Facility in-house X Contractor for Federal Facility Other_______________________________________________________________________
__________________________________________________________________________
2. O&M Cost Records X Readily available X Up to date X Funding mechanism/agreement in place Original O&M cost estimate included in respective OU ROD
Total annual cost by year for review period
For FY01 $2,821,000
Date Total cost
For FY02 $2,987,000 Date Total cost
For FY03 $1,193,000
Date Total cost
For FY04 $1,223,000Date Total cost
For FY05 $977,000
Date Total cost
3. Unanticipated or Unusually High O&M Costs During Review Period Describe costs and reasons: None noted during site inspection. Discussed in detail in report._____________________________________________________________________ ___________________________________________________________________________ ___________________________________________________________________________
V. ACCESS AND INSTITUTIONAL CONTROLS X Applicable N/A
A. Fencing
1. Fencing X Location shown on site maps X Gates secured N/A Remarks: Fencing intact except for one minor break at OU4 treatment building (temporally secured with chain and locks)____________________________________________________________________ ___________________________________________________________________________
B. Other Access Restrictions

1. Signs and other security measures X Location shown on site map N/A Remarks: Treatment buildings were identified (OU1 and OU4 have perimeter fencing), all wells and vaults were identified and securely locked. ___________________________________________________________________________ __________________________________________________________________________
C. Institutional Controls (ICs)
1. Implementation and enforcement Site conditions imply ICs not properly implemented X Yes No N/A Site conditions imply ICs not being fully enforced X Yes No N/A
Type of monitoring :Deeds, Self-reporting Frequency Property transfer__________________________________________________________ Responsible party/agency City of Ogden Contact Larry Davis Engineer 801.629.8937
Name Title Phone no.
Reporting is up-to-date X Yes No N/A Reports are verified by the lead agency X Yes No N/A
Specific requirements in deed/decision docs have been met X Yes No N/A Violations have been reported Yes X No N/A Other problems or suggestions: Continue to monitor land use controls ___________________________________________________________________________ ___________________________________________________________________________
2. Adequacy X ICs are adequate ICs are inadequate N/A Remarks: land use controls are recorded with deeds for restricted use as appropriate for impacted parcels_________________________________________________________________________________________________________________________________________________
D. General
1. Vandalism/trespassing Location shown on site map X No vandalism evident Remarks____________________________________________________________________ ___________________________________________________________________________
2. Land use changes on site N/A Remarks: Zoning and reuse have not changed, continued development of warehousing, new buildings and site improvements_______________________________________________________________ ___________________________________________________________________________
3. Land use changes off site N/A Remarks: No changes, rural residences ___________________________________________________________________________
VI. GENERAL SITE CONDITIONS
A. Roads X Applicable N/A
1. Roads damaged X Location shown on site map X Roads adequate N/A Remarks____________________________________________________________________ ___________________________________________________________________________
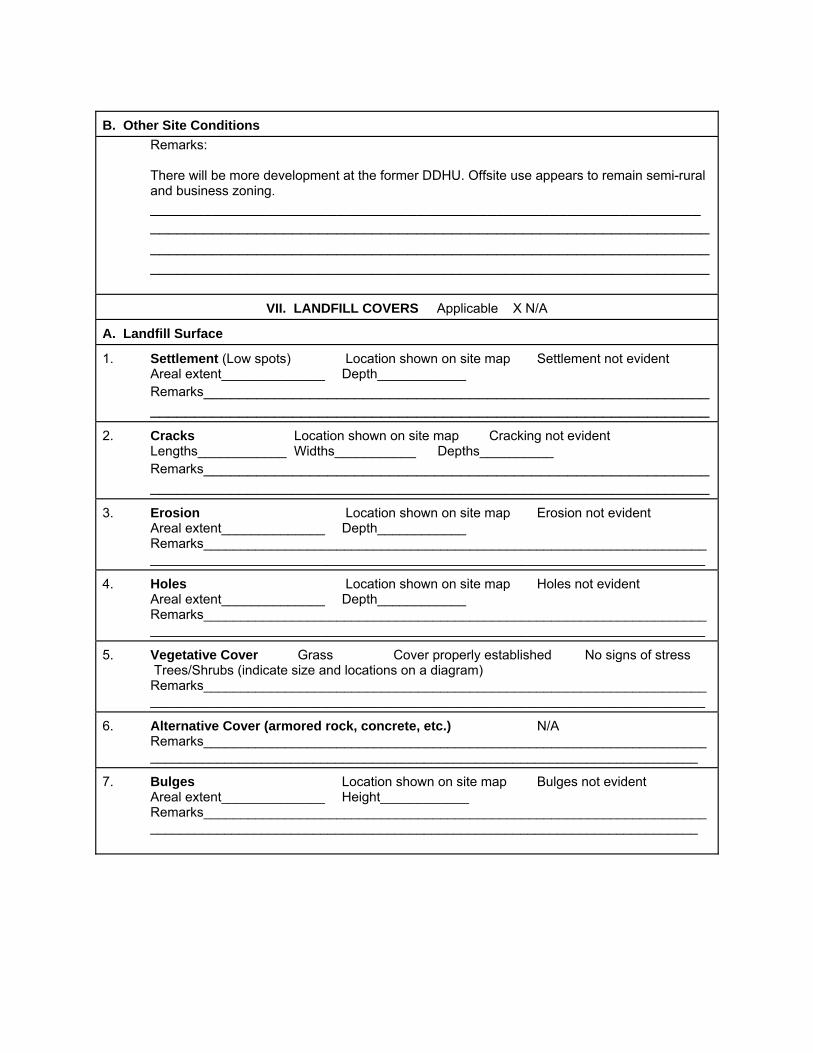
B. Other Site Conditions
Remarks: There will be more development at the former DDHU. Offsite use appears to remain semi-rural and business zoning. ______________________________________________________________ _______________________________________________________________ _______________________________________________________________ _______________________________________________________________
VII. LANDFILL COVERS Applicable X N/A
A. Landfill Surface
1. Settlement (Low spots) Location shown on site map Settlement not evident Areal extent______________ Depth____________ Remarks________________________________________________________________________________________________________________________
2. Cracks Location shown on site map Cracking not evident Lengths____________ Widths___________ Depths__________ Remarks________________________________________________________________________________________________________________________
3. Erosion Location shown on site map Erosion not evident Areal extent______________ Depth____________ Remarks____________________________________________________________________ ___________________________________________________________________________
4. Holes Location shown on site map Holes not evident Areal extent______________ Depth____________ Remarks____________________________________________________________________ ___________________________________________________________________________
5. Vegetative Cover Grass Cover properly established No signs of stress Trees/Shrubs (indicate size and locations on a diagram) Remarks____________________________________________________________________ ___________________________________________________________________________
6. Alternative Cover (armored rock, concrete, etc.) N/A Remarks____________________________________________________________________ __________________________________________________________________________
7. Bulges Location shown on site map Bulges not evident Areal extent______________ Height____________ Remarks____________________________________________________________________ __________________________________________________________________________
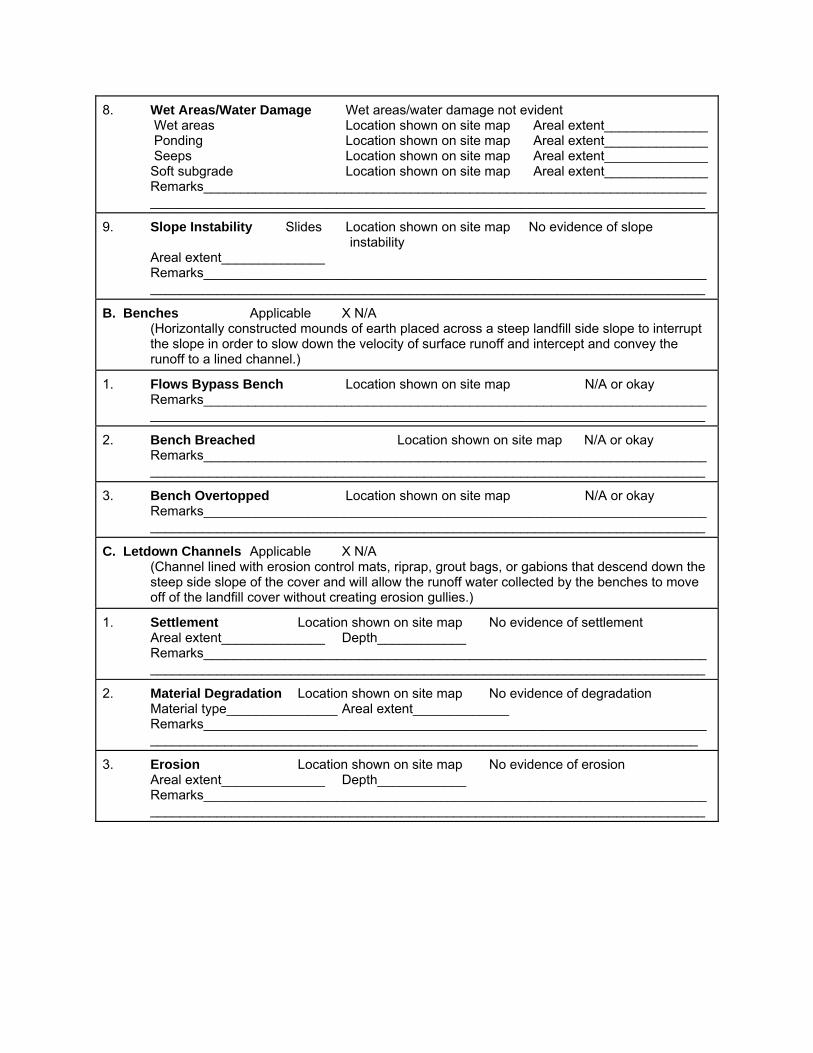
8. Wet Areas/Water Damage Wet areas/water damage not evident Wet areas Location shown on site map Areal extent______________ Ponding Location shown on site map Areal extent______________ Seeps Location shown on site map Areal extent______________ Soft subgrade Location shown on site map Areal extent______________ Remarks____________________________________________________________________ ___________________________________________________________________________
9. Slope Instability Slides Location shown on site map No evidence of slope instability
Areal extent______________ Remarks____________________________________________________________________ ___________________________________________________________________________
B. Benches Applicable X N/A (Horizontally constructed mounds of earth placed across a steep landfill side slope to interrupt the slope in order to slow down the velocity of surface runoff and intercept and convey the runoff to a lined channel.)
1. Flows Bypass Bench Location shown on site map N/A or okay Remarks____________________________________________________________________ ___________________________________________________________________________
2. Bench Breached Location shown on site map N/A or okay Remarks____________________________________________________________________ ___________________________________________________________________________
3. Bench Overtopped Location shown on site map N/A or okay Remarks____________________________________________________________________ ___________________________________________________________________________
C. Letdown Channels Applicable X N/A (Channel lined with erosion control mats, riprap, grout bags, or gabions that descend down the steep side slope of the cover and will allow the runoff water collected by the benches to move off of the landfill cover without creating erosion gullies.)
1. Settlement Location shown on site map No evidence of settlement Areal extent______________ Depth____________ Remarks____________________________________________________________________ ___________________________________________________________________________
2. Material Degradation Location shown on site map No evidence of degradation Material type_______________ Areal extent_____________ Remarks____________________________________________________________________ __________________________________________________________________________
3. Erosion Location shown on site map No evidence of erosion Areal extent______________ Depth____________ Remarks____________________________________________________________________ ___________________________________________________________________________
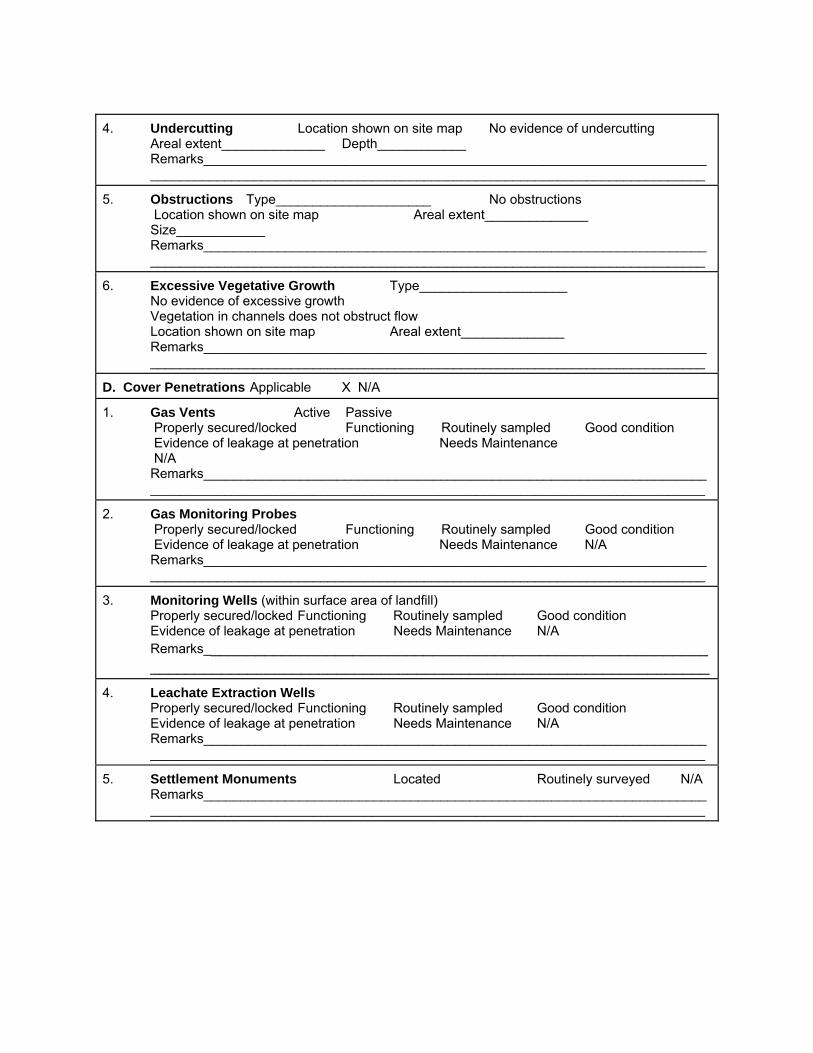
4. Undercutting Location shown on site map No evidence of undercutting
Areal extent______________ Depth____________ Remarks____________________________________________________________________ ___________________________________________________________________________
5. Obstructions Type_____________________ No obstructions Location shown on site map Areal extent______________ Size____________ Remarks____________________________________________________________________ ___________________________________________________________________________
6. Excessive Vegetative Growth Type____________________ No evidence of excessive growth Vegetation in channels does not obstruct flow Location shown on site map Areal extent______________ Remarks____________________________________________________________________ ___________________________________________________________________________
D. Cover Penetrations Applicable X N/A
1. Gas Vents Active Passive Properly secured/locked Functioning Routinely sampled Good condition Evidence of leakage at penetration Needs Maintenance N/A Remarks____________________________________________________________________ ___________________________________________________________________________
2. Gas Monitoring Probes Properly secured/locked Functioning Routinely sampled Good condition Evidence of leakage at penetration Needs Maintenance N/A Remarks____________________________________________________________________ ___________________________________________________________________________
3. Monitoring Wells (within surface area of landfill) Properly secured/locked Functioning Routinely sampled Good condition Evidence of leakage at penetration Needs Maintenance N/A Remarks_________________________________________________________ _______________________________________________________________
4. Leachate Extraction Wells Properly secured/locked Functioning Routinely sampled Good condition Evidence of leakage at penetration Needs Maintenance N/A Remarks____________________________________________________________________ ___________________________________________________________________________
5. Settlement Monuments Located Routinely surveyed N/A Remarks____________________________________________________________________ ___________________________________________________________________________
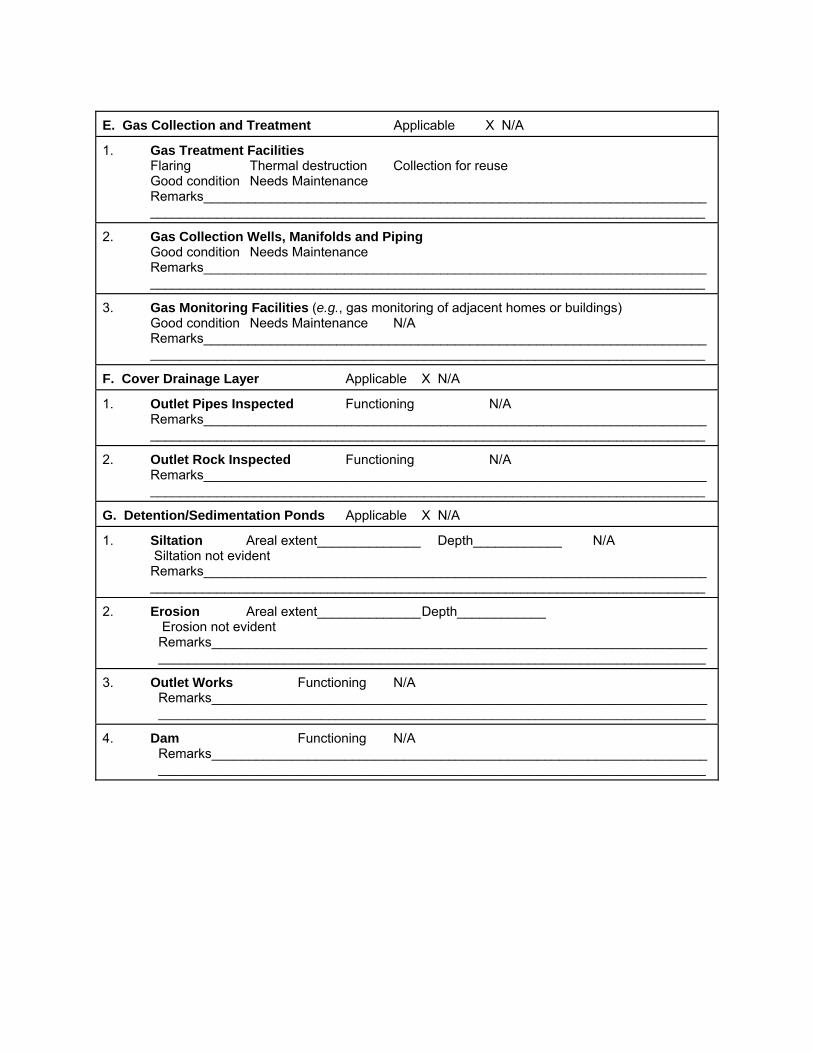
E. Gas Collection and Treatment Applicable X N/A
1. Gas Treatment Facilities Flaring Thermal destruction Collection for reuse Good condition Needs Maintenance Remarks____________________________________________________________________ ___________________________________________________________________________
2. Gas Collection Wells, Manifolds and Piping Good condition Needs Maintenance Remarks____________________________________________________________________ ___________________________________________________________________________
3. Gas Monitoring Facilities (e.g., gas monitoring of adjacent homes or buildings) Good condition Needs Maintenance N/A Remarks____________________________________________________________________ ___________________________________________________________________________
F. Cover Drainage Layer Applicable X N/A
1. Outlet Pipes Inspected Functioning N/A Remarks____________________________________________________________________ ___________________________________________________________________________
2. Outlet Rock Inspected Functioning N/A Remarks____________________________________________________________________ ___________________________________________________________________________
G. Detention/Sedimentation Ponds Applicable X N/A
1. Siltation Areal extent______________ Depth____________ N/A Siltation not evident Remarks____________________________________________________________________ ___________________________________________________________________________
2. Erosion Areal extent______________ Depth____________ Erosion not evident Remarks___________________________________________________________________ __________________________________________________________________________
3. Outlet Works Functioning N/A Remarks___________________________________________________________________ __________________________________________________________________________
4. Dam Functioning N/A Remarks___________________________________________________________________ __________________________________________________________________________
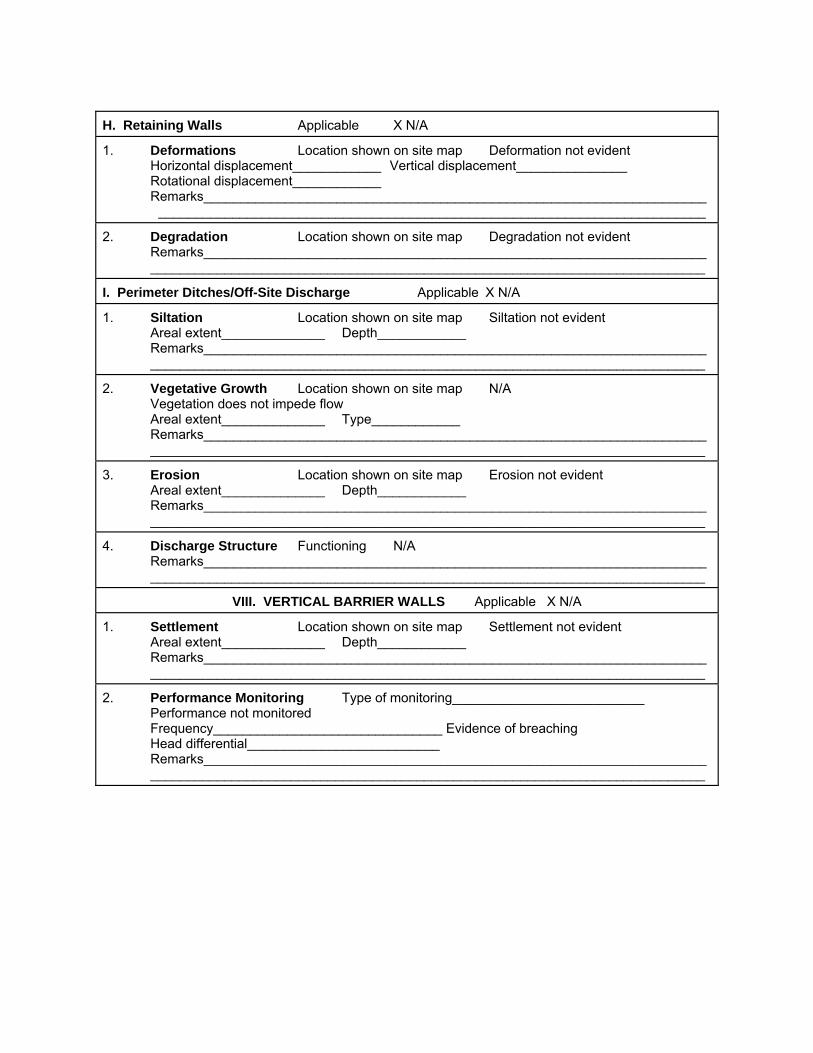
H. Retaining Walls Applicable X N/A
1. Deformations Location shown on site map Deformation not evident Horizontal displacement____________ Vertical displacement_______________ Rotational displacement____________ Remarks____________________________________________________________________
__________________________________________________________________________
2. Degradation Location shown on site map Degradation not evident Remarks____________________________________________________________________ ___________________________________________________________________________
I. Perimeter Ditches/Off-Site Discharge Applicable X N/A
1. Siltation Location shown on site map Siltation not evident Areal extent______________ Depth____________ Remarks____________________________________________________________________ ___________________________________________________________________________
2. Vegetative Growth Location shown on site map N/A Vegetation does not impede flow Areal extent______________ Type____________ Remarks____________________________________________________________________ ___________________________________________________________________________
3. Erosion Location shown on site map Erosion not evident Areal extent______________ Depth____________ Remarks____________________________________________________________________ ___________________________________________________________________________
4. Discharge Structure Functioning N/A Remarks____________________________________________________________________ ___________________________________________________________________________
VIII. VERTICAL BARRIER WALLS Applicable X N/A
1. Settlement Location shown on site map Settlement not evident Areal extent______________ Depth____________ Remarks____________________________________________________________________ ___________________________________________________________________________
2. Performance Monitoring Type of monitoring__________________________ Performance not monitored Frequency_______________________________ Evidence of breaching Head differential__________________________ Remarks____________________________________________________________________ ___________________________________________________________________________
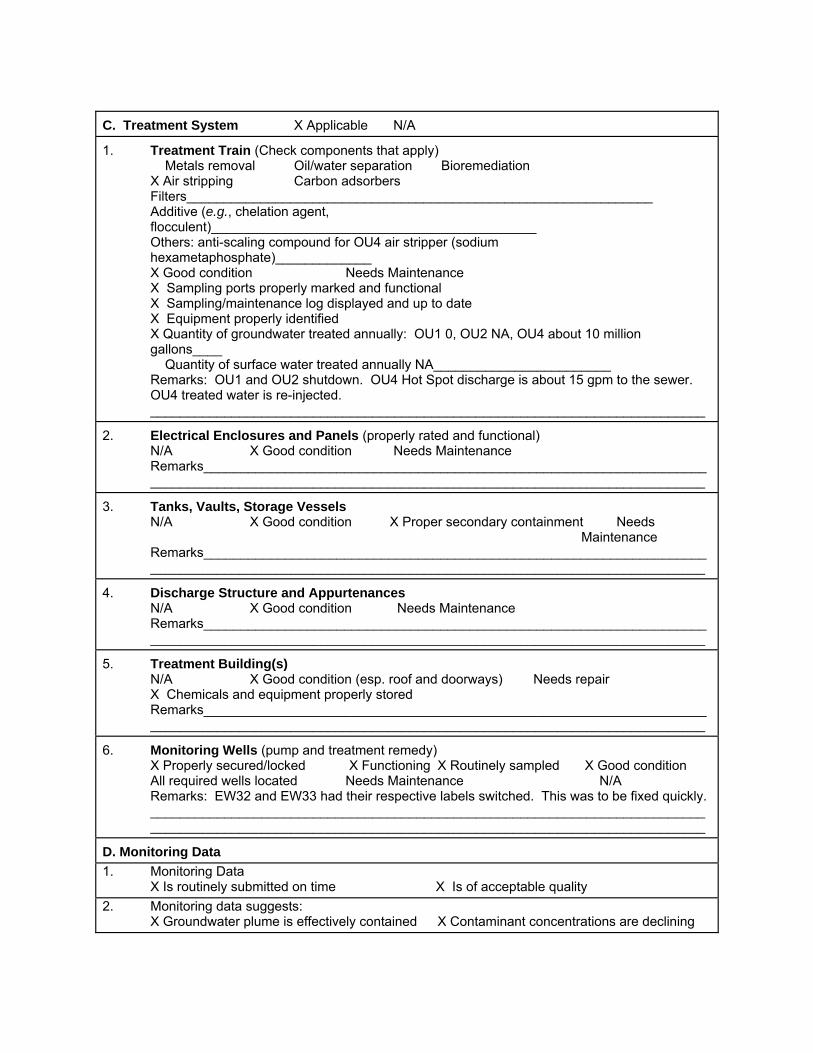
C. Treatment System X Applicable N/A
1. Treatment Train (Check components that apply) Metals removal Oil/water separation Bioremediation X Air stripping Carbon adsorbers Filters_______________________________________________________________ Additive (e.g., chelation agent, flocculent)____________________________________________ Others: anti-scaling compound for OU4 air stripper (sodium hexametaphosphate)_____________ X Good condition Needs Maintenance X Sampling ports properly marked and functional X Sampling/maintenance log displayed and up to date X Equipment properly identified X Quantity of groundwater treated annually: OU1 0, OU2 NA, OU4 about 10 million gallons____ Quantity of surface water treated annually NA________________________ Remarks: OU1 and OU2 shutdown. OU4 Hot Spot discharge is about 15 gpm to the sewer. OU4 treated water is re-injected. ___________________________________________________________________________
2. Electrical Enclosures and Panels (properly rated and functional) N/A X Good condition Needs Maintenance Remarks____________________________________________________________________ ___________________________________________________________________________
3. Tanks, Vaults, Storage Vessels N/A X Good condition X Proper secondary containment Needs
Maintenance Remarks____________________________________________________________________ ___________________________________________________________________________
4. Discharge Structure and Appurtenances N/A X Good condition Needs Maintenance Remarks____________________________________________________________________ ___________________________________________________________________________
5. Treatment Building(s) N/A X Good condition (esp. roof and doorways) Needs repair X Chemicals and equipment properly stored Remarks____________________________________________________________________ ___________________________________________________________________________
6. Monitoring Wells (pump and treatment remedy) X Properly secured/locked X Functioning X Routinely sampled X Good condition All required wells located Needs Maintenance N/A Remarks: EW32 and EW33 had their respective labels switched. This was to be fixed quickly. ___________________________________________________________________________ ___________________________________________________________________________
D. Monitoring Data 1. Monitoring Data
X Is routinely submitted on time X Is of acceptable quality 2. Monitoring data suggests:
X Groundwater plume is effectively contained X Contaminant concentrations are declining
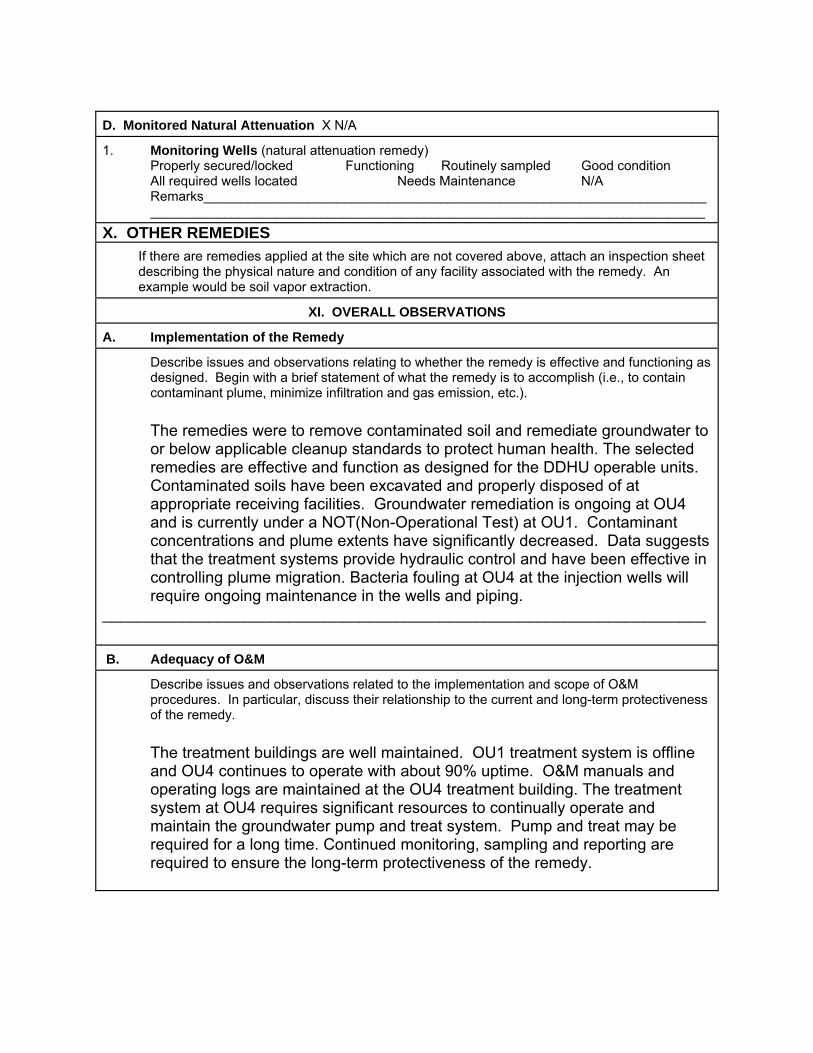
D. Monitored Natural Attenuation X N/A
1. Monitoring Wells (natural attenuation remedy) Properly secured/locked Functioning Routinely sampled Good condition All required wells located Needs Maintenance N/A Remarks____________________________________________________________________ ___________________________________________________________________________
X. OTHER REMEDIES If there are remedies applied at the site which are not covered above, attach an inspection sheet describing the physical nature and condition of any facility associated with the remedy. An example would be soil vapor extraction.
XI. OVERALL OBSERVATIONS
A. Implementation of the Remedy
Describe issues and observations relating to whether the remedy is effective and functioning as designed. Begin with a brief statement of what the remedy is to accomplish (i.e., to contain contaminant plume, minimize infiltration and gas emission, etc.). The remedies were to remove contaminated soil and remediate groundwater to or below applicable cleanup standards to protect human health. The selected remedies are effective and function as designed for the DDHU operable units. Contaminated soils have been excavated and properly disposed of at appropriate receiving facilities. Groundwater remediation is ongoing at OU4 and is currently under a NOT(Non-Operational Test) at OU1. Contaminant concentrations and plume extents have significantly decreased. Data suggests that the treatment systems provide hydraulic control and have been effective in controlling plume migration. Bacteria fouling at OU4 at the injection wells will require ongoing maintenance in the wells and piping.
____________________________________________________________________
B. Adequacy of O&M
Describe issues and observations related to the implementation and scope of O&M procedures. In particular, discuss their relationship to the current and long-term protectiveness of the remedy. The treatment buildings are well maintained. OU1 treatment system is offline and OU4 continues to operate with about 90% uptime. O&M manuals and operating logs are maintained at the OU4 treatment building. The treatment system at OU4 requires significant resources to continually operate and maintain the groundwater pump and treat system. Pump and treat may be required for a long time. Continued monitoring, sampling and reporting are required to ensure the long-term protectiveness of the remedy.
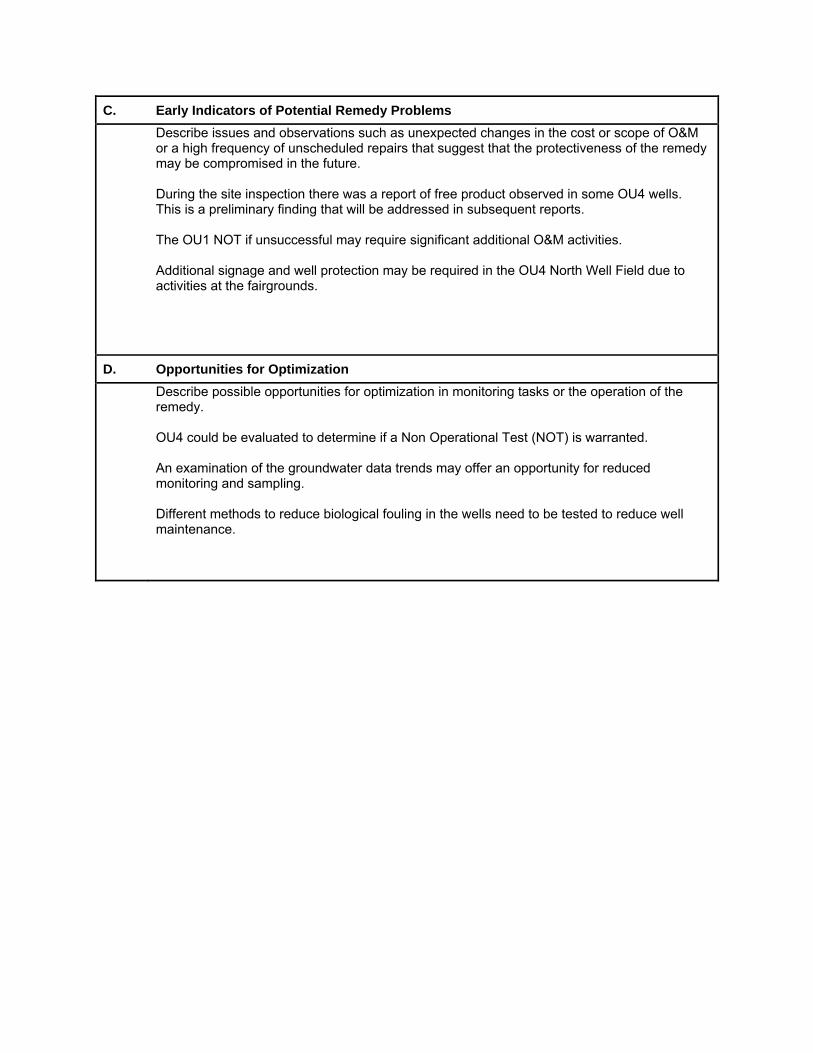
C. Early Indicators of Potential Remedy Problems
Describe issues and observations such as unexpected changes in the cost or scope of O&M or a high frequency of unscheduled repairs that suggest that the protectiveness of the remedy may be compromised in the future. During the site inspection there was a report of free product observed in some OU4 wells. This is a preliminary finding that will be addressed in subsequent reports. The OU1 NOT if unsuccessful may require significant additional O&M activities. Additional signage and well protection may be required in the OU4 North Well Field due to activities at the fairgrounds.
D. Opportunities for Optimization
Describe possible opportunities for optimization in monitoring tasks or the operation of the remedy. OU4 could be evaluated to determine if a Non Operational Test (NOT) is warranted. An examination of the groundwater data trends may offer an opportunity for reduced monitoring and sampling. Different methods to reduce biological fouling in the wells need to be tested to reduce well maintenance.
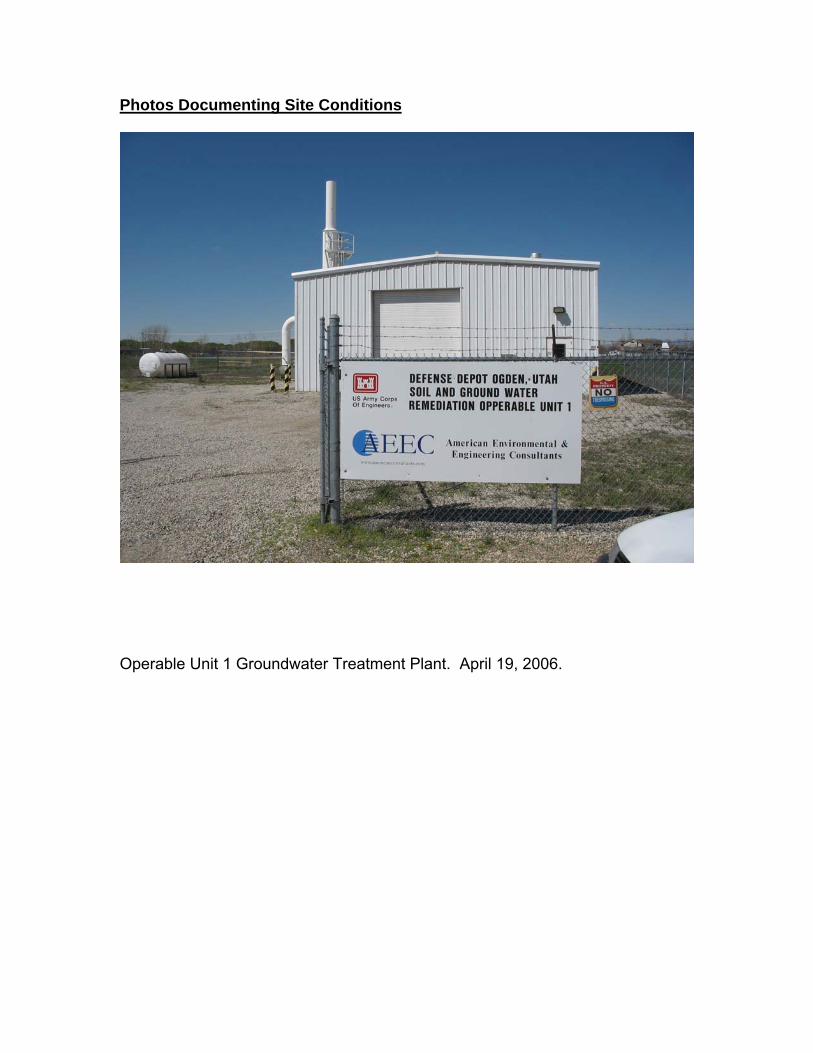
Photos Documenting Site Conditions
Operable Unit 1 Groundwater Treatment Plant. April 19, 2006.

DDHU Operable Unit 4, Treatment Plant. April 19, 2006.
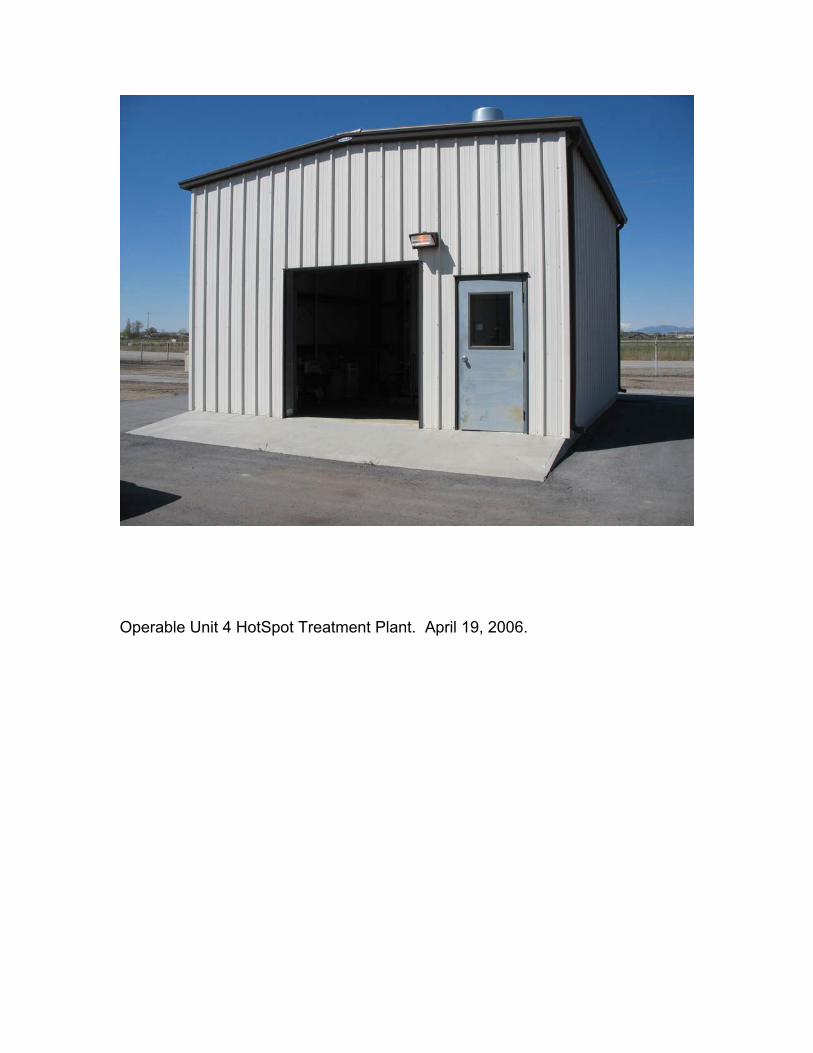
Operable Unit 4 HotSpot Treatment Plant. April 19, 2006.
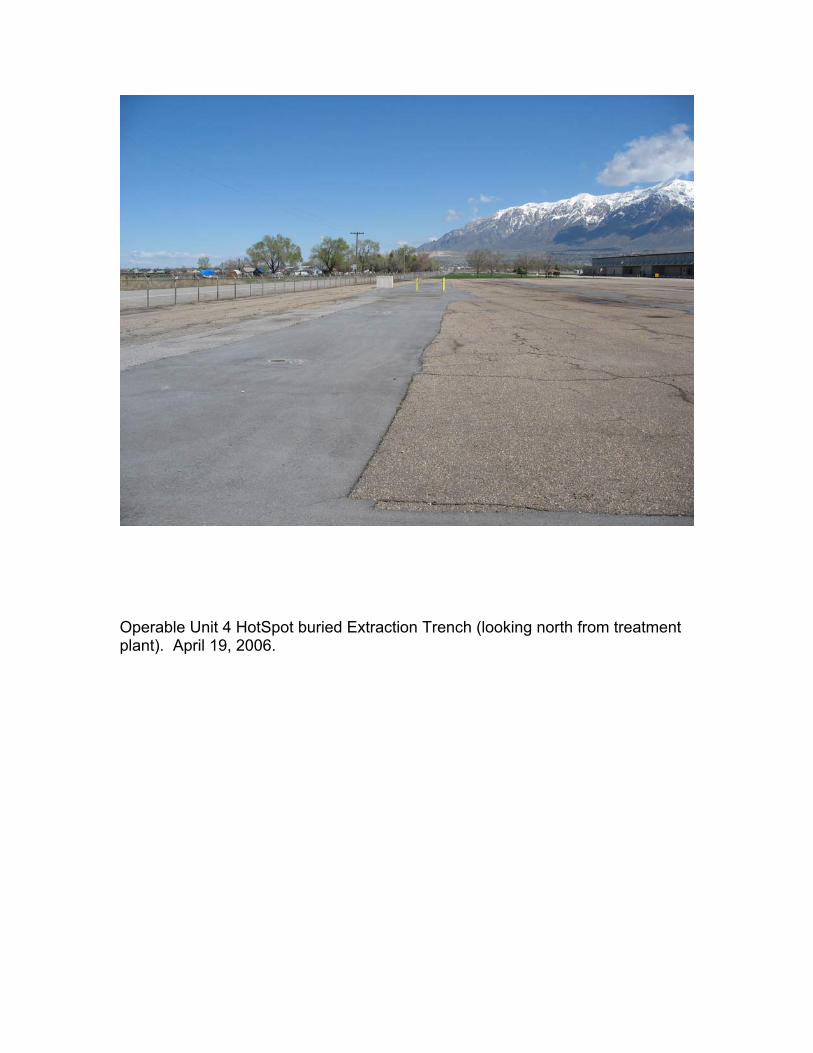
Operable Unit 4 HotSpot buried Extraction Trench (looking north from treatment plant). April 19, 2006.
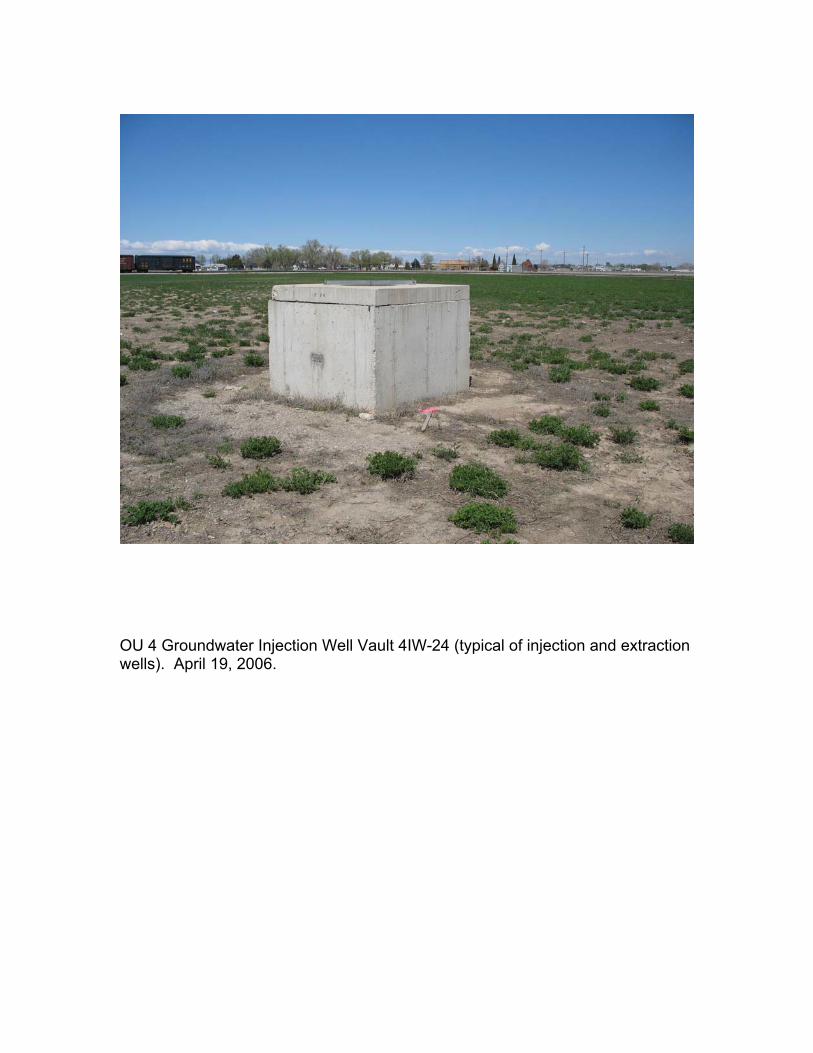
OU 4 Groundwater Injection Well Vault 4IW-24 (typical of injection and extraction wells). April 19, 2006.

OU 4 JMM-15 Groundwater Monitoring Well (typical). April 19, 2006.
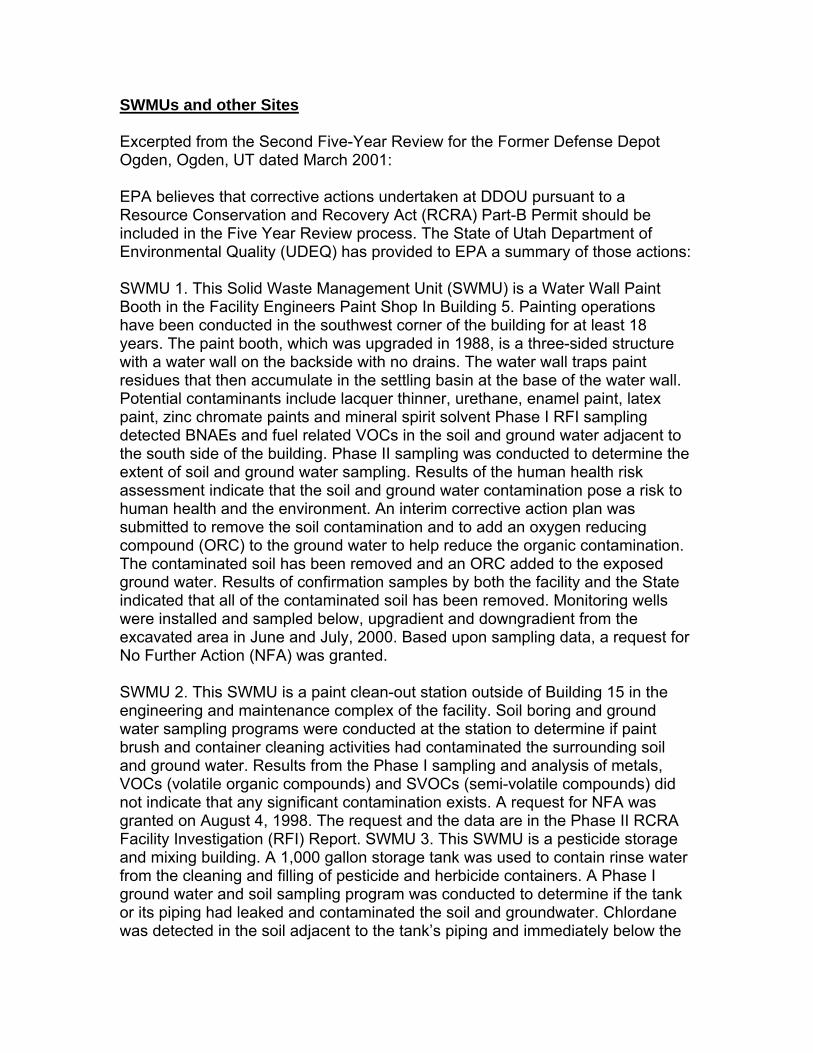
SWMUs and other Sites Excerpted from the Second Five-Year Review for the Former Defense Depot Ogden, Ogden, UT dated March 2001: EPA believes that corrective actions undertaken at DDOU pursuant to a Resource Conservation and Recovery Act (RCRA) Part-B Permit should be included in the Five Year Review process. The State of Utah Department of Environmental Quality (UDEQ) has provided to EPA a summary of those actions: SWMU 1. This Solid Waste Management Unit (SWMU) is a Water Wall Paint Booth in the Facility Engineers Paint Shop In Building 5. Painting operations have been conducted in the southwest corner of the building for at least 18 years. The paint booth, which was upgraded in 1988, is a three-sided structure with a water wall on the backside with no drains. The water wall traps paint residues that then accumulate in the settling basin at the base of the water wall. Potential contaminants include lacquer thinner, urethane, enamel paint, latex paint, zinc chromate paints and mineral spirit solvent Phase I RFI sampling detected BNAEs and fuel related VOCs in the soil and ground water adjacent to the south side of the building. Phase II sampling was conducted to determine the extent of soil and ground water sampling. Results of the human health risk assessment indicate that the soil and ground water contamination pose a risk to human health and the environment. An interim corrective action plan was submitted to remove the soil contamination and to add an oxygen reducing compound (ORC) to the ground water to help reduce the organic contamination. The contaminated soil has been removed and an ORC added to the exposed ground water. Results of confirmation samples by both the facility and the State indicated that all of the contaminated soil has been removed. Monitoring wells were installed and sampled below, upgradient and downgradient from the excavated area in June and July, 2000. Based upon sampling data, a request for No Further Action (NFA) was granted. SWMU 2. This SWMU is a paint clean-out station outside of Building 15 in the engineering and maintenance complex of the facility. Soil boring and ground water sampling programs were conducted at the station to determine if paint brush and container cleaning activities had contaminated the surrounding soil and ground water. Results from the Phase I sampling and analysis of metals, VOCs (volatile organic compounds) and SVOCs (semi-volatile compounds) did not indicate that any significant contamination exists. A request for NFA was granted on August 4, 1998. The request and the data are in the Phase II RCRA Facility Investigation (RFI) Report. SWMU 3. This SWMU is a pesticide storage and mixing building. A 1,000 gallon storage tank was used to contain rinse water from the cleaning and filling of pesticide and herbicide containers. A Phase I ground water and soil sampling program was conducted to determine if the tank or its piping had leaked and contaminated the soil and groundwater. Chlordane was detected in the soil adjacent to the tank’s piping and immediately below the
tank. The tank, associated piping and contaminated soil were removed as an interim 2measure. Confirmation samples were collected and indicated that all of the contaminated soil was removed. Ground water samples were collected and no contamination was detected. A request for NFA was granted on August 4, 1998. The results and the request for NFA are in the Phase II RFI Report. SWMU 4. This SWMU is a roundhouse (Building S17) that is used to clean and maintain the locomotives at the facility. The engines sit atop of two large concrete lined pits during maintenance. Previously, the concrete pits were unlined. A hydro-punch, soil boring and ground water sampling program was conducted to determine if the maintenance activities and an oil-water separator had contaminated the soil or the groundwater. Samples were analyzed for VOCs, SVOCs, TPH, metals and pH. No concentrations of contaminants were detected above background or above concentrations that pose a risk to the public or the environment. A request for NFA at the SWMU was granted on August 4, 1998. The results and the request for NFA are in the Phase II RFI Report. SWMU 5. Bay 2 of building 5A was previously used as a 90-day storage area for hazardous waste including PCBs. The area was closed for use in July 1995. A Closure Plan was approved by the Division on May 16, 1995, and the Certificate of Closure was approved by the Division on November 28, 1995. The floors of the bay were cleaned and the final rinse water analyzed for various contaminants. Significant concentrations of contaminants are not present on the floor of the building. A request for NFA was granted on November 28, 1995. SWMU 7. The northeast corner of building 269 was constructed in 1950 and previously used for heavy machinery repair and maintenance and contained a dip tank for rinsing drained batteries. In the Phase I RFI a soil and groundwater sampling program was conducted to determine if the vehicle and battery maintenance activities had contaminated the soil and ground water under and adjacent to the building. The Phase I samples were analyzed for TPH, VOCs, SVOCs and metals. One of the ground water samples collected under the north side of the building contained elevated concentrations of TePH, identified as jet fuel or diesel fuel. No other contaminants were detected in the soil or the ground water. Previously, aboveground fuel storage tanks and a fueling station were located outside the northeast side of the building. In the Phase II investigation, a hydro-punch sampling program was initiated to determine the extent of the TePH contamination. Results from the hydro-punch sampling program did not detect any TPH contamination above regulatory or risk based concentrations. The TePH detected in the one sample from the Phase I study was determined to be an anomaly as the concentration could not be duplicated by further sampling. NFA for the battery maintenance area was granted on August 4, 1998. SWMU 8. This SWMU is a truck-wash facility in the northwest corner of Building 269. The wash water is collected in floor drains, which are connected, to the sanitary sewer. The floor drains were connected only recently (around 1980) to
the sewer. In addition, an old construction drawing indicates that acid storage tanks, acid dip tanks and a paint spray booth were once located where the truck wash facility is currently located. Samples were collected of the soil and ground water in the Phase I RFI and analyzed for VOCs, BNAE, TPH, metals and pH. No organic contaminants were detected and no metals were detected in concentrations above background in the soil. Some fuel related VOCs (ethylbenzene, toluene and xylenes) and arsenic and barium were detected in trace concentrations in the ground water significantly below Maximum Concentration Levels (MCLs). A request for NFA was requested for the truck-wash facility and granted on February 19, 1997. SWMU 9. This SWMU is a 2,000 gallon, above ground, used oil, storage tank on the west side of Building 269. The tank and the concrete, secondary containment structure were installed in 1962. In 1988, less than 55 gallons of used oil was spilled onto the pavement adjacent to the tank when it was being emptied by the recycling vendor. The facility response team cleaned the spill area. Soil and groundwater samples collected adjacent to the tank and below the concrete in the Phase I RFI were analyzed for VOCs, BNAEs, TePH, total and dissolved metals and pH to determine if the used oil had contaminated the soil or the ground water. No significant concentrations of contaminants were detected in the soil or the ground water. A request for NFA was granted on February 19, 1997. SWMU 10. This SWMU is on the northeast side of Building 259. Beginning in the late 1950s, five dip tanks were used to strip paint from metal parts. The process was replaced with a Wheelobrator in 1991. Samples of the soil and groundwater were analyzed for VOCs, BNAEs, metals and pH in the Phase I RFI to determine if the paint stripping operations had impacted the underlying soil and ground water. No organic contaminants were detected in the soil samples. Selenium was the only metal contaminant detected in the soil above background concentrations. No organic or metal analytes were present in the ground water samples above their MCLs. During the Environmental Baseline Survey conducted in 1996, as a requirement for facility closure under the Base Realignment and Closure Act (BRAC), a 1950s photograph of the building was found which showed the presence of paint stripping dip tanks not only on the northeast side of the building but also on the east and north side of the building. As a result, in the Phase II RCRA investigation, a hydro-punch program was initiated to collect soil and ground water samples on the north and east sides of the building and down gradient from the building operations. Samples were analyzed for VOCs, SVOCs and metals. No significant contaminant concentrations were detected in the soil samples. TCE was detected at a concentration of 6 ug/l, in one ground water sample, which is above its MCL of 5 ug/l. Between February 1997 and November 1998, several rounds of ground water samples were collected to confirm the TCE concentration in the ground water and to delineate the extent of the ground water contamination as well as to examine seasonal variations in the TCE concentration with seasonal ground water surface levels. Ground water contamination of TCE above the MCL could

not be replicated. TCE was detected but at concentrations below its MCL. A NFA for soil was granted in August 4, 1998. A NFA for ground water 4was granted in October 1998. SWMU 11. This Shot Blast Facility consisted of a conveyor belt and blast chamber, which used steel shot to remove paint and/or rust from, compressed gas cylinders. The steel shot was used and reused until it was ineffective. Shot-blast dust was collected in a bag house with three hoppers and 55-gallon drums outside the west wall of the building. Potential contaminants are paint constituents. Rust and paint stained soil were found near the front roll-up doors and along a path towards Building 259. Shallow soil samples collected and analyzed during the Phase I investigation detected significant concentrations of lead and chromium. Ground water samples did not contain detectable contaminant concentrations. An Interim Corrective Measures Plan was approved on July 28, 1997, to place an asphalt overlay on the contaminated soil to reduce exposure to the soil. The overlay was placed in October 1977, and included a geo-textile fabric to minimize the potential for cracking of the surface. A Corrective Measures Study and Corrective Measures Plan for removal of Building 270 and all contaminated soil and debris, including the asphalt overlay, was approved on February 22, 1999. A NFA for the SWMU was approved on March 24, 2000 with approval of the Corrective Measures Implementation Report. SWMU 12. This SWMU involves the battery storage area at Building 251. The area was used to store drained and rinsed damaged batteries and undrained, undamaged sealed batteries. The batteries are then reused or sold by the DRMO. Battery acids and metals are potential contaminants. Based on a review of historical records and a site visit, which did not reveal any evidence of spills, this SWMU was removed from the list with the Class 3 permit modification approved SWMU 13. This SWMU is a water wall paint booth against the south wall of Bay 12 of Building 5D. Potential contaminants include lacquers, thinners, enamel paints and red-oxide primers. The Phase I investigation collected soil and ground water samples adjacent to the paint booth in and outside of the building. BNAE and VOC compounds as well as cadmium, chromium, lead and mercury were detected above background concentrations in the surface soil and TCE was detected in the ground water above its MCL. Expanded investigation was conducted and subsequent rounds of sampling indicated no further action required. Request for NFA was approved. SWMU 14. This SWMU is two water wall paint booths located along the south wall of Building 246. Potential contaminants are paint constituents. Arsenic, chromium and lead were detected above background concentrations but below risk based concentrations in the soil and TCE was detected in the ground water above its MCL. Additional samples were collected during the Phase II
investigation to try to locate the source of the TCE contamination. All necessary remedial actions are now complete. Request for NFA was approved. SWMU 17. This storm water discharge area is located approximately two miles west of DDOU and discharges into Mill Creek. NFA request was approved. SWMU 19. Building 260 is a drive-through vehicle paint booth. Soil and ground water samples were collected and analyzed for VOCs, SVOCs and metals to determine if the painting operations had contaminated the surrounding environment. Lead and arsenic were detected in near surface soils surrounding the building but the concentrations are not above a residential exposure scenario screening levels. A request for an NFA was granted on August 4, 1998. SWMU 23. This SWMU is the sanitary and storm water sewer systems at the facility. A video survey of the systems was conducted in 1995 and detected some damaged sections. A soil boring and groundwater sampling program was initiated to determine if damaged sections of the systems had released any contaminates to the soil and groundwater. It was reported that historically some drains in the industrial area of the facility were connected to the sanitary and storm water system. Soil samples were collected from the soil and the groundwater surrounding the damaged areas and analyzed for VOCs, SVOCs, chlorinated herbicides, chlorinated pesticides and metals. No VOCs, SVOCs, pesticides, herbicides or metals were detected in the soil or groundwater at concentrations that pose a risk to the public or the environment. A NFA was granted on August 4, 1998. End of excerpted text.

Other sites with action since Second Five-Year Review for Former Defense Depot Ogden BRAC 246 Site Reference: BRAC 246 Soil Remediation, Final Remediation Closure Report, DDHU. January 2000. IT Corporation. Remediation at BRAC Site 246 was performed in accordance with requirements specified in the Remedial Work Plan. Preliminary site activities, including, railroad track removal, were performed. Excavation of contaminated soil, ballast and debris began 8/24/99. Approximately 300 tons were excavated. Confirmatory soil samples were collected and analyzed at an offsite laboratory. The site was backfilled and restoration was completed 10/12/99. Contaminated material was sent offsite for disposal in accordance with the results of the waste characterization. The analytical results of confirmation samples verified that cleanup levels had not been exceeded. No further action was required. The site was closed in 2001. BRAC 51 Site Reference: Final Report Groundwater Monitoring of Reactive Blanket at BRAC 51 June 2000 through July 2001. 27 November 2000. Parsons Engineering Science. The excavation/biological treatment commenced on 31 May 2000 (March 2000 Final Report for BRAC 51). Approximately 40 cubic yards of vadose zone soil was excavated and disposed of at a Subtitle C landfill. Four hundred gallons of vegetable oil was applied to the excavation on 1 June 2000. Selected wells were sampled to evaluate remedy effectiveness. VOC concentrations were below MCLs during the following 12-month monitoring period. The Final Report Groundwater Monitoring of Reactive Blanket at BRAC 51 June 2000 through July 2001, 27 November 2000, was submitted for regulatory evaluation. A NFA letter was issued on 10/25/01. Burial Site 1 – Ogden Nature Center Reference: DDHU-Ogden Site; Final Burial Site 1 Remedial Action Report, April 2002, MWH. This was a FUDS (Formerly Used Defense Site) as the property was disposed of in 1975 to the City of Ogden. Burial Site 1, located within the Ogden Nature Center, consisted of a disposal trench formerly used by DDHU. Investigations indicated that chemical warfare materiel (CWM) could be present with the trench, thus approval of an extensive Safety Submission was required prior to remedial actions. Most of the remedial action activities were conducted between Jan and
Oct 2001 and included the excavation and offsite disposal of 1,286 tons (~857 cy) of material including two CWM-related items (chemical agent identification sets (CAIS)). The majority of the waste was non-CWM soil and debris; approximately 758 tons were disposed of as hazardous waste, and approximately 528 tons as non-hazardous waste. The two CWM-related items were transported to Aberdeen Proving Grounds for testing and disposal. The average dimensions of the excavation were 275 feet long, 18 feet wide, and 4 feet deep. A Remedial Action Report was submitted. The site was remediated by December 2001. Site 358 (Facility ID# 1200042, Release Site EKUC) Reference: Corrective Action Report for Groundwater Remediation and Site Closure Recommendation, Site 358, DDHU, Ogden, UT. August 2001. Kleinfelder/Chung and Associates. Site 358 at the DDHU facility contained a 100,000 gallon above –ground storage tank for fuel oil storage. Past investigations at this site indicated soil and groundwater had been impacted by petroleum hydrocarbons that exceeded regulatory standards. The Corrective Action Plan was approved on July 23, 1999 by Utah DERR. Approximately 17,111 tons of impacted soil was excavated and disposed of at a nearby receiving facility in Willard, Utah. The majority of contaminated material was removed except in a few small areas to include beneath Loffredo Street, along the north side border, soils adjacent to injection well HIW-17-R2, and beneath a sewer line that transects the excavation area. All remaining TPH-D soil concentrations are below the RBCA Tier I level of 5,000 mg/kg. Approximately 471,000 gallons of water were removed from the excavation area and treated . A portable water treatment system was used to treat prior to disposal to the Central Weber Sewer Improvement District facility in Ogden. The site was backfilled to original grade with clean, imported soils. A Fall and Spring sampling event indicated groundwater data from selected wells met State and Federal RCL and MCLs, respectively. The Corrective Action Report was forwarded for review and a NFA letter was issued in January 2002. Building 321 Reference: Final Summary of Corrective Actions Report for Building 321, DDHU, Ogden, UT. 22 February 1999. Geofon. The Building 321 site was located in the central portion of the former DDHU. The site consisted of a fueling island with a 12,500 gallon UST, three fuel pumps, two attendant buildings, and underground pipelines from four ASTs located north of the attendant buildings. The surrounding areas consist of light industrial use facilities including warehouse buildings and vacant lots, which were historically used for storage of semitractor trailers, military vehicles, and boxed cargo. The Building 321 site was demolished and 1,120 cubic yards of contaminated soil
was excavated and transported offsite for nonhazardous disposal. About 240 pounds of ORC was applied to the excavation bottom and groundwater wells. A closure letter was issued on 29 March 2001.
ARARs for OU1, OU2 and OU4
"DDHU OU1 ARAR.pdf"
"DDHU OU2 ARAR.pdf"
"DDHU OU4 ARAR.pdf"
DDHU ROD Remediation Criteria.p Quitclaim Deed: Former DDOU
Quitclaim Deed Former DDOU
Defense Depot Ogden, Utah
Final
Record of Decision and Responsiveness Summary for Operable Unit f
June 10, 1992
APPENDIX C
FEDERAL AND STATE CHEMICAL AND ACTION-SPECIFIC ARAR.
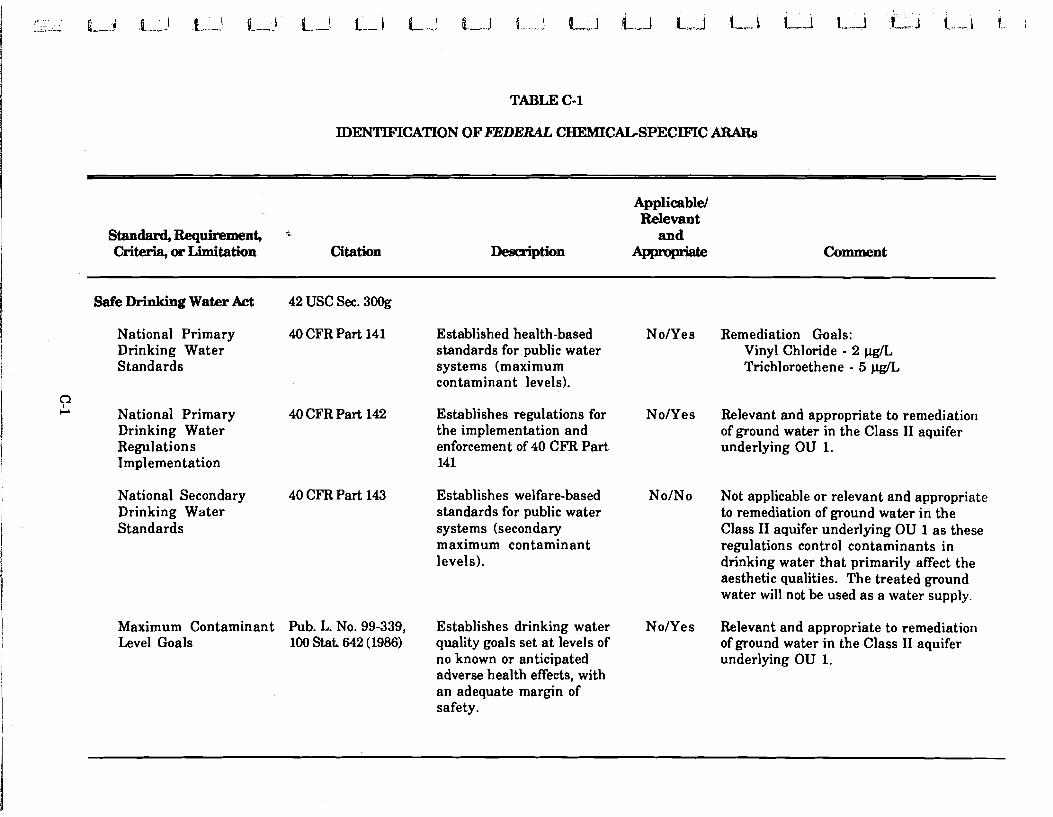
TABLE C-1
IDENTIFICATION OF FEDERAL CHEMICAL-SPECIFIC ARARs
Standard, Requirement, v,
Criteria, utr Limitation Citation
Applicable/ Relevant
and Description Comment
Safe Drinking Water Act 42 USC Sec. 300g
National Primary Drinking Water Standards
CL National Primary Drinking Water Regulations Implementation
40 CFR Part 141 Established health-based No/Yes Remediation Goals: standards for public water Vinyl Chloride - 2 pg/L systems (maximum Trichloroethene - 5 pglL contaminant levels).
40 CFR Part 142 Establishes regulations for No/Yes Relevant and appropriate to remediation the implementation and of ground water in the Class I1 aquifer enforcement of 40 CFR Part underlying OU 1. 141
National Secondary 40 CFR Part 143 Establishes welfare-based No/No Not applicable or relevant and appropriate Drinking Water standards for public water to remediation of ground water in the Standards systems (secondary Class I1 aquifer underlying OU 1 a s these
maximum contaminant regulations control contaminants in levels). drinking water that primarily affect the
aesthetic qualities. The treated ground water will not be used a s a water supply.
Maximum Contaminant Pub. L. No. 99-339, Establishes drinking water No/Yes Relevant and appropriate to remediation Level Goals 100 Stat. 642 (1986) quality goals set a t levels of of ground water in the Class I1 aquifer
no known or anticipated underlying OU 1. adverse health effects, with an adequate margin of safety.
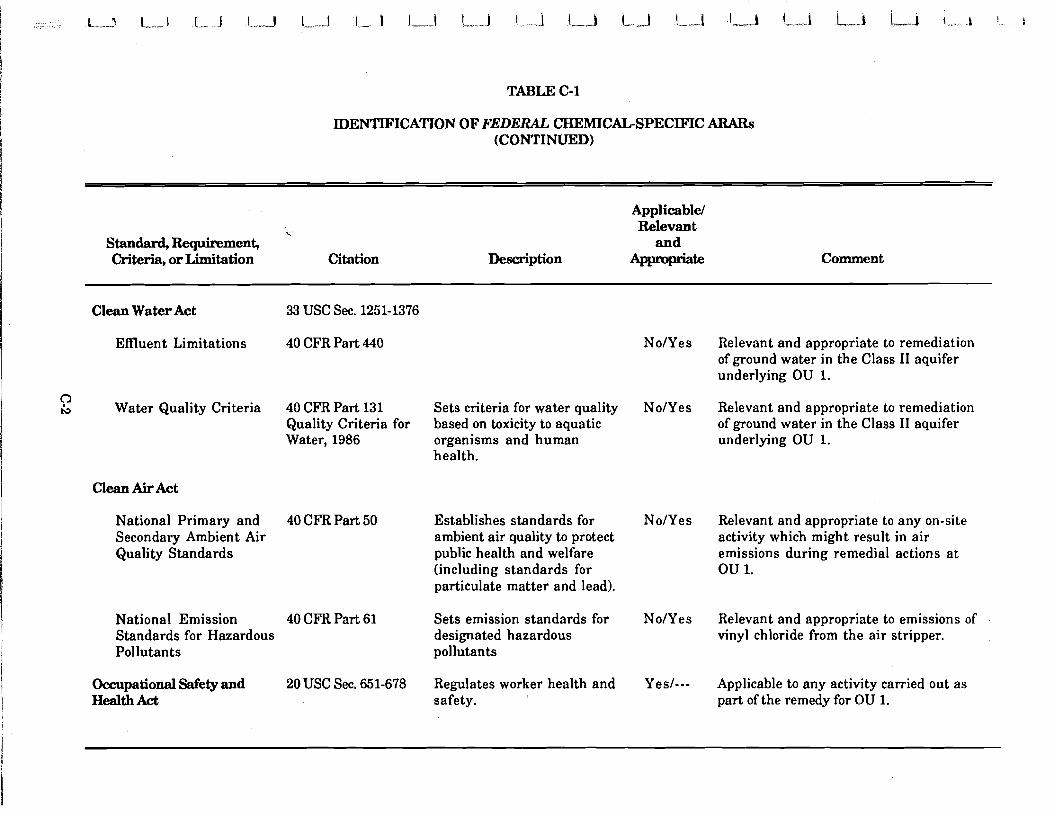
TABLE C-1
IDENTIFICATION O F FlCDERAL CHEMICALSPECIFIC ARARs (CONTINUED)
<
Standard, Requirement, Criteria, o r Limitation Citation
Applicable/ Relevant and
Description Comment
Clean Water Act 33 USC SW. 1251-1376
Effluent Limitations 40 CFR Part 440 NoIYes Relevant and appropriate to remediation of ground water in the Class I1 aquifer underlying OU 1.
Water Quality Criteria 40 CFR Part 131 Sets criteria for water quality NoIYes Relevant and appropriate to remediation Quality Criteria for based on toxicity to aquatic of ground water in the Class I1 aquifer Water, 1986 organisms and human underlying OU 1.
health.
National Primary and 40 CFR Part 50 Secondary Ambient Air Quality Standards
National Emission 40 CFR Part 61 Standards for Hazardous Pollutants
Occupational Safety and 20 USC SW. 651-678 Health Act
Establishes standards for ambient air quality to protect public health and welfare (including standards for particulate matter and lead).
Sets emission standards for designated hazardous pollutants
Regulates worker health and safety.
NoIYes Relevant and appropriate to any on-site activity which might result in air emissions during remedial actions a t ou 1.
NoIYes Relevant and appropriate to emissions of vinyl chloride from the air stripper.
Yes/--- Applicable to any activity carried out as part of the remedy for OU 1.

TABLE C-1
lDENTlFICATION O F FEDERAL CHEMICAGSPECIFIC ARARs (CONTINUED)
.b
Stan- Rquimment, Criteria, or Limitation Citation
Applicable/ Relevant
and Description Comment
D.O.T. Hazardous Material 49 CFR Parts 107, Regulates transportation of Thansportation Regulations 171-177 hazardous materials
Remume C o M o n and Section 3004(m) Waives prohibition of land -Act disposal of a particular
hazardous waste if levels or methods of treatment substantially reduce toxicity or likelihood of migration of hazardous constituents to minimize short- and long- term threats to human health and the environment.
GeneralAppmachUsedby the Dioxin Disposal Advisory Group (DDAG) Regarding Pentachlow phenol Waste (also PCBs), des Roeiers (1988)
Recommends a site evaluation method, cleanup levels, and treatment standards for sites known to be PCB, copper wirdcore reclamation, or PCP wood treating sites.
Yes/--- Applicable to remedial actions involving off-Depot movement of hazardous materials during remediation.
NoIYes Appropriate for remedial alternatives involving landfilling of contaminated soil.
No/No To be considered. Site evaluation method, cleanup levels, and treatment standards for dioxins and furans.
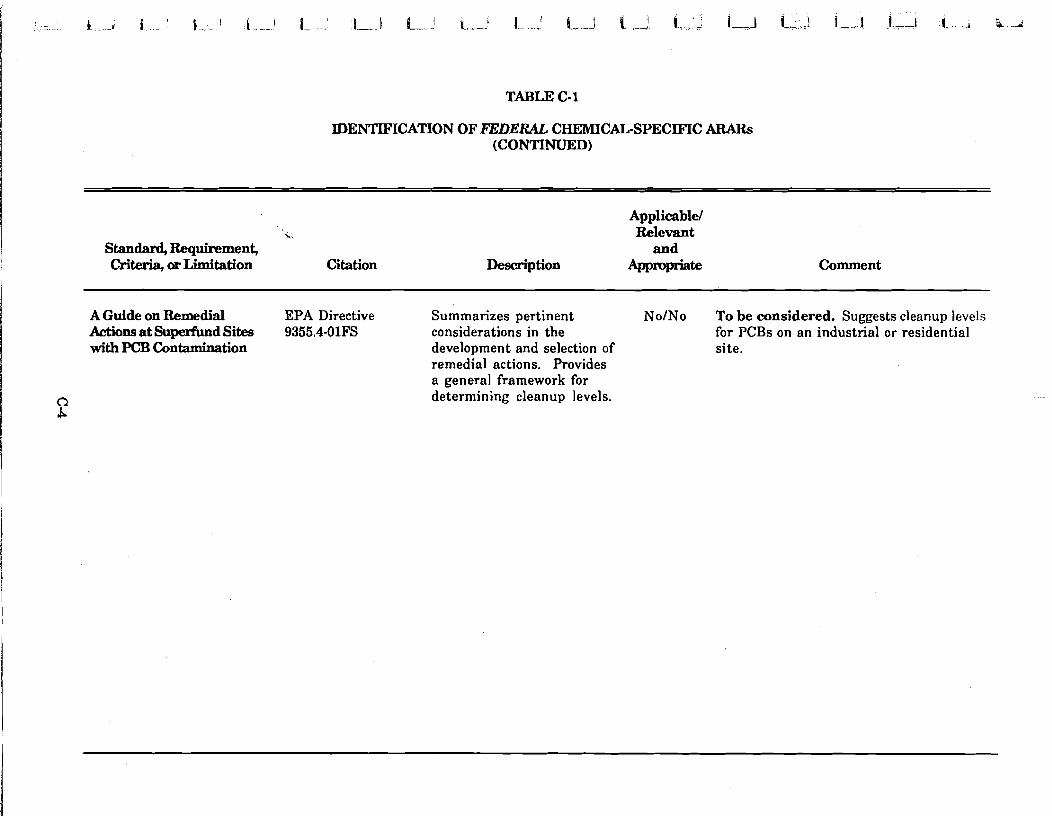
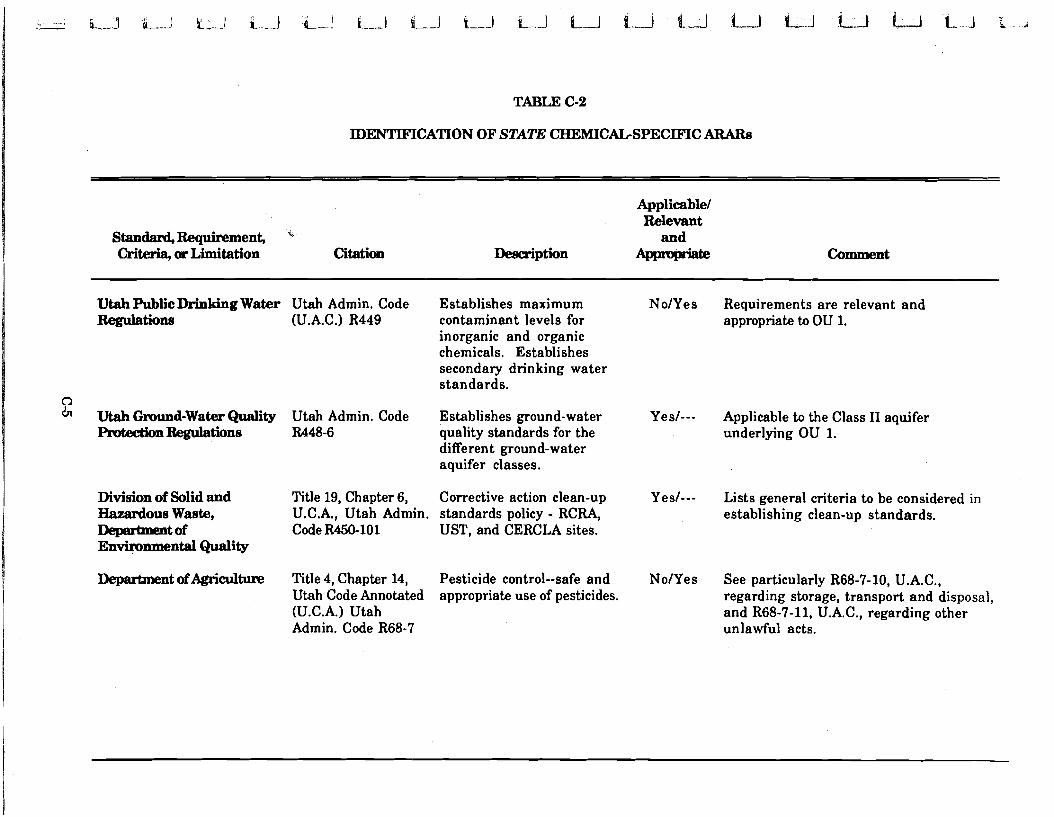
TABLJ3 C-2
IDENTIFICATION OF STATE CHEMICACSPECIFIC ARARs
Standard, Requirement, " Criteria, or Limitation Citation
Applicable/ Relevant
and Deacription Comment
Utah PublicDrinking Water Utah Admin. Code Establishes maximum NoIYes Requirements are relevant and Regulations (U.A.C.) R449 contaminant levels for appropriate to OU 1.
inorganic and organic chemicals. Establishes secondary drinking water standards.
d Ln Utah Gmund-Water Quality Utah Admin. Code Establishes ground-water Yes/--- Applicable to the Class I1 aquifer
I?&mtbn Regulations R448-6 quality standards for the underlying OU 1. different ground-water aquifer classes.
Division of Solid and Title 19, Chapter 6, Corrective action clean-up Yes/--- Lists general criteria to be considered in Hazardous Waste, U.C.A., Utah Admin. standards policy - RCRA, establishing clean-up standards. -tQf Code R450-101 UST, and CERCLA sites. Environmental Quality
Department afAgriculm Title 4, Chapter 14, Pesticide control--safe and NoIYes See particularly R68-7-10, U.A.C., Utah Code Annotated appropriate use of pesticides. regarding storage, transport and disposal, (U.C.A.) Utah and R68-7-11, U.A.C., regarding other Admin. Code R68-7 unlawful acts.

TABLE C-2
IDENTIFICATION OF STATE CBEMICACSPECIFIC ARARs (CONTINUED)
\. Standard, Requirement, Criteria, ar Limitation Citation
Applicable/ Relevant
and Iha-iption
Division of Water Quality Title 19, Chapter 5, Definitions for Water Yes/--- Applicable to remediation of ground water -tof U.C.A., Utah Admin. Pollution Rules and General a t OU 1. Environmental Quality Code R448-1 U.A.C. Requirements.
Title 19, Chapter 5, Standards of Quality for U.C.A., Utah Admin. Waters of the State. Code R448-2
Yes/--- These rules are specific to Utah waters, though they are derived in part by using Federal criteria. See particularly the anti-degradation policy in Utah Admin. Code R448-2-3.
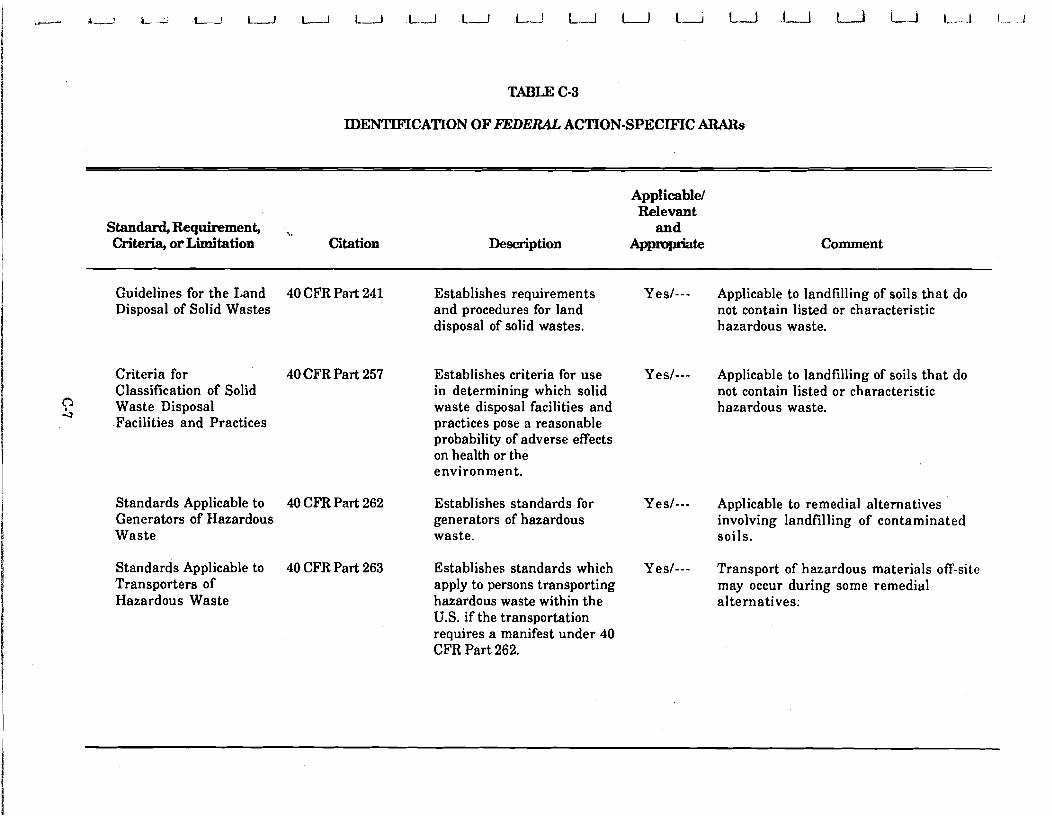
TABLE C-3
IDENTIFICATION O F Z?EDERAL ACTION-SPECIFIC ARARs
Standard, Requirement, \-
Criteria, or Limitation Citation
Applicable/ Relevant
and Description APPmpriak Comment
Guidelines for the Land 40 CFR Part 241 Disposal of Solid Wastes
Criteria for 40 CFR Part 257 Classification of Solid
'? 4
Waste Disposal Facilities and Practices
Standards Applicable to 40 CFR Part 262 Generators of Hazardous Waste
Standards Applicable to 40 CFR Part 263 Transporters of Hazardous Waste
Establishes requirements Yes/--- Applicable to landfilling of soils that do and procedures for land not contain listed or characteristic disposal of solid wastes. hazardous waste.
Establishes criteria for use Yes/--- Applicable to landfilling of soils that do in determining which solid not contain listed or characteristic waste disposal facilities and hazardous waste. practices pose a reasonable probability of adverse effects on health or the environment.
Establishes standards for Yes/--- Applicable to remedial alternatives generators of hazardous involving landfilling of contaminated waste. soils.
Establishes standards which Yes/--- Transport of hazardous materials off-site apply to persons transporting may occur during some remedial hazardous waste within the alternatives. U.S. if the transportation requires a manifest under 40 CFR Part 262.
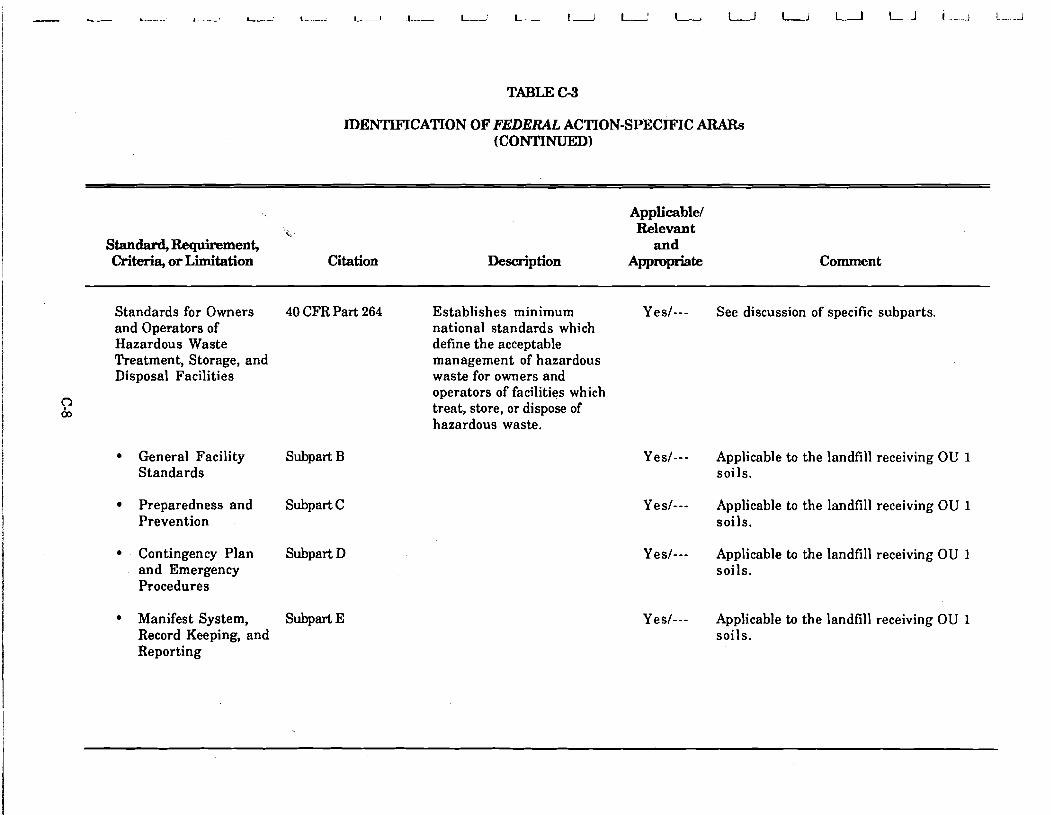
IDENTIFICATION OF FEDERAL ACTION-SPECIFIC ARARs (CONTINUED)
-. Standard, Requirement, Criteria, o r Limitation Citation
Applicable/ Relevant
and Description APPmpriate Comment
Standards for Owners 40 CFR Part 264 and Operators of Hazardous Waste Treatment, Storage, and Disposal Facilities
General Facility Subpart B Standards
Preparedness and Subpart C Prevention
Contingency Plan SubpartD and Emergency Procedures
Manifest System, Subpart E Record Keeping, and Reporting
Establishes minimum national standards which define the acceptable management of hazardous waste for owners and operators of facilities which treat, store, or dispose of hazardous waste.
- -
Yes/--- See discussion of specific subparts.
Yes/--- Applicable to the landfill receiving OU 1 soils.
Yes/--- Applicable to the landfill receiving OU 1 soils.
Yes/--- Applicable to the landfill receiving OU 1 soils.
Y es/--- Applicable to the landfill receiving OU 1 soils.
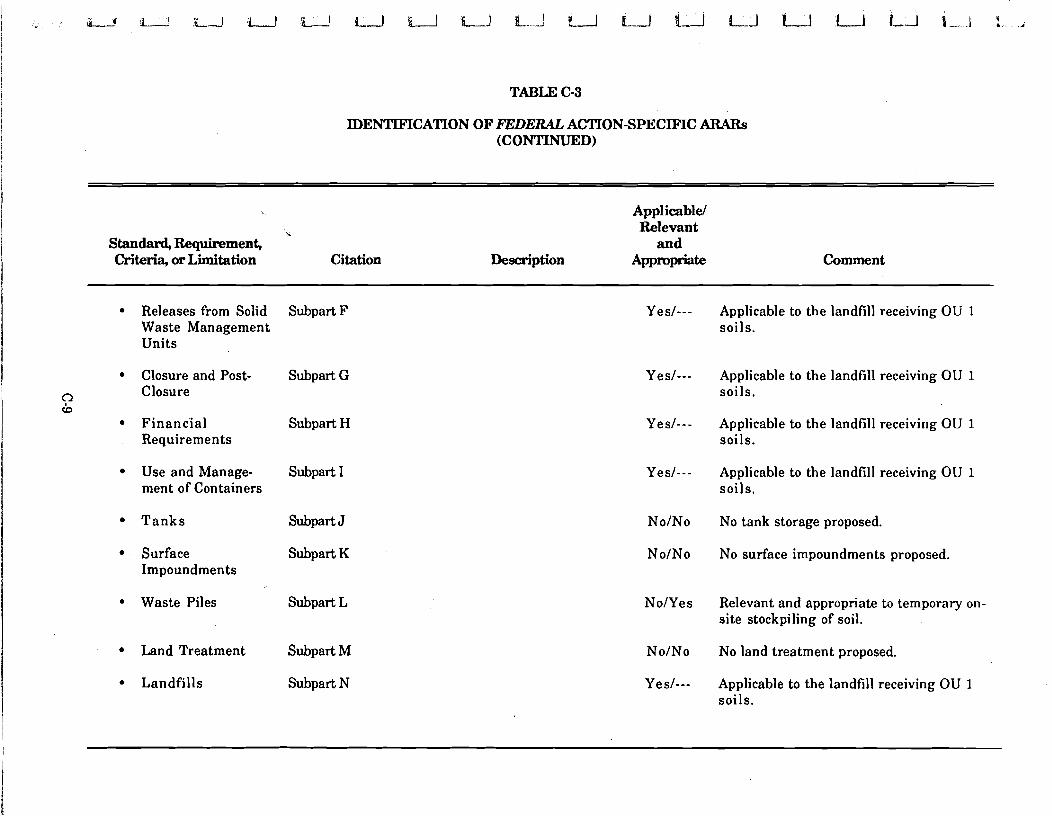
TABLE C-3
IDENTIFICATION O F FEDERAL ACTION-SPECIFIC ARARs (CONTINUED)
\I
Standard, Requirement, Criteria, o r Limitation Citation
Applicable1 Relevant
and D e d p t i o n Appmpriate Comment
Releases from Solid Subpart F Waste Management Units
Closure and Post- Subpart G
'? Closure CD
Financial Subpart H Requirements
Use and Manage- Subpart I ment of Containers
T a n k s Subpart J
Surface Subpart K Impoundments
Waste Piles Subpart L
Land Treatment Subpart M
Landfills Subpart N
Yes/--- Applicable to the landfill receiving OU 1 soils.
Yes/--- Applicable to the landfill receiving OU 1 soils.
Y es/--- Applicable to the landfill receiving OU 1 soils.
Yes/--- Applicable to the landfill receiving OU 1 soils.
No/No No tank storage proposed.
No/No No surface impoundments proposed.
NoIYes Relevant and appropriate to temporary on- site stockpiling of soil.
No/No No land treatment proposed.
Yes/--- Applicable to the landfill receiving OU 1 soils.
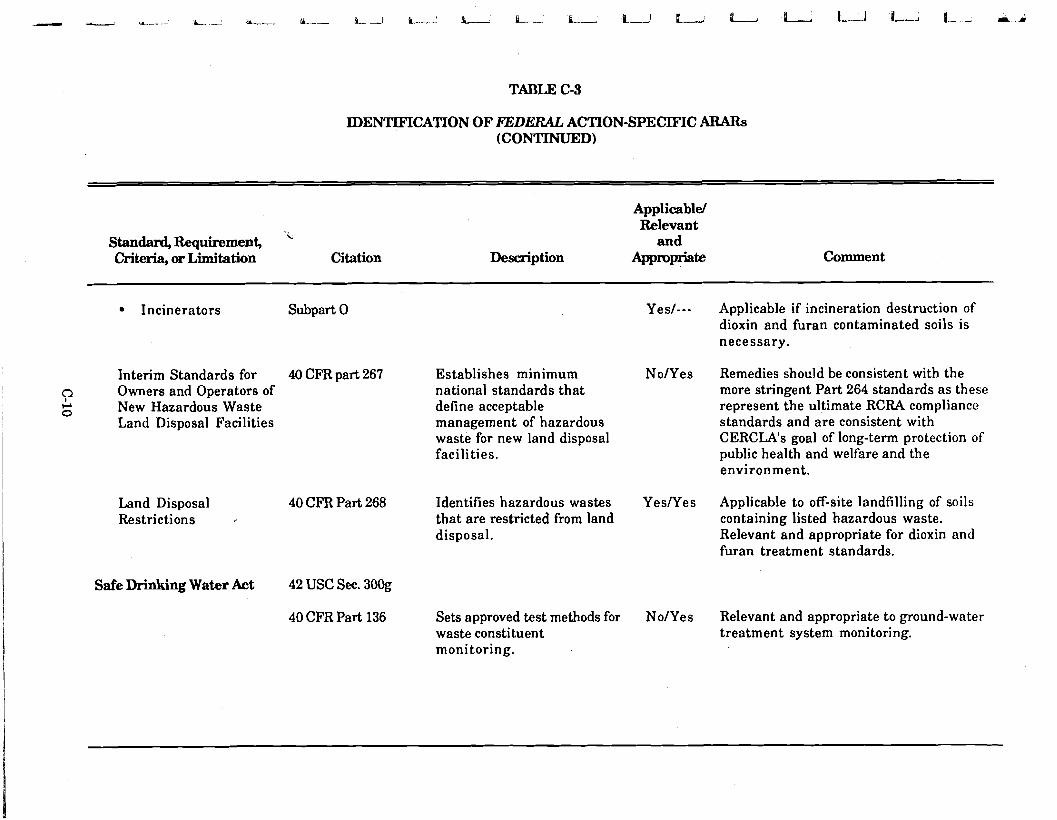
TABLE: C-3
IDENTlFICATION O F JZi'DERAL ACTION-SPECIFIC ARARs (CONTINUED)
Standard, Requirement, Criteria, or Limitation Citation
Applicable/ Relevant
and Description APPmmte Comment
Incinerators Subpart 0 Yes/--- Applicable if incineration destruction of dioxin and furan contaminated soils is necessary.
Interim Standards for 40 CFR part 267 Establishes minimum No/Yes Remedies should be consistent with the Owners and Operators of national standards that more stringent Part 264 standards as these New Hazardous Waste define acceptable represent the ultimate RCRA compliance Land Disposal Facilities management of hazardous standards and are consistent with
waste for new land disposal CERCLA's goal of long-term protection of facilities. public health and welfare and the
environment.
Land Disposal Restrictions
40 CFR Part 268 Identifies hazardous wastes YesNes Applicable to off-site landfilling of soils that are restricted from land containing listed hazardous waste. disposal. Relevant and appropriate for dioxin and
furan treatment standards.
Safe Drinking Water Act 42 USC See. 300g
40 CFR Part 136 Sets approved test methods for No/Yes Relevant and appropriate to ground-water waste constituent treatment system monitoring. monitoring.
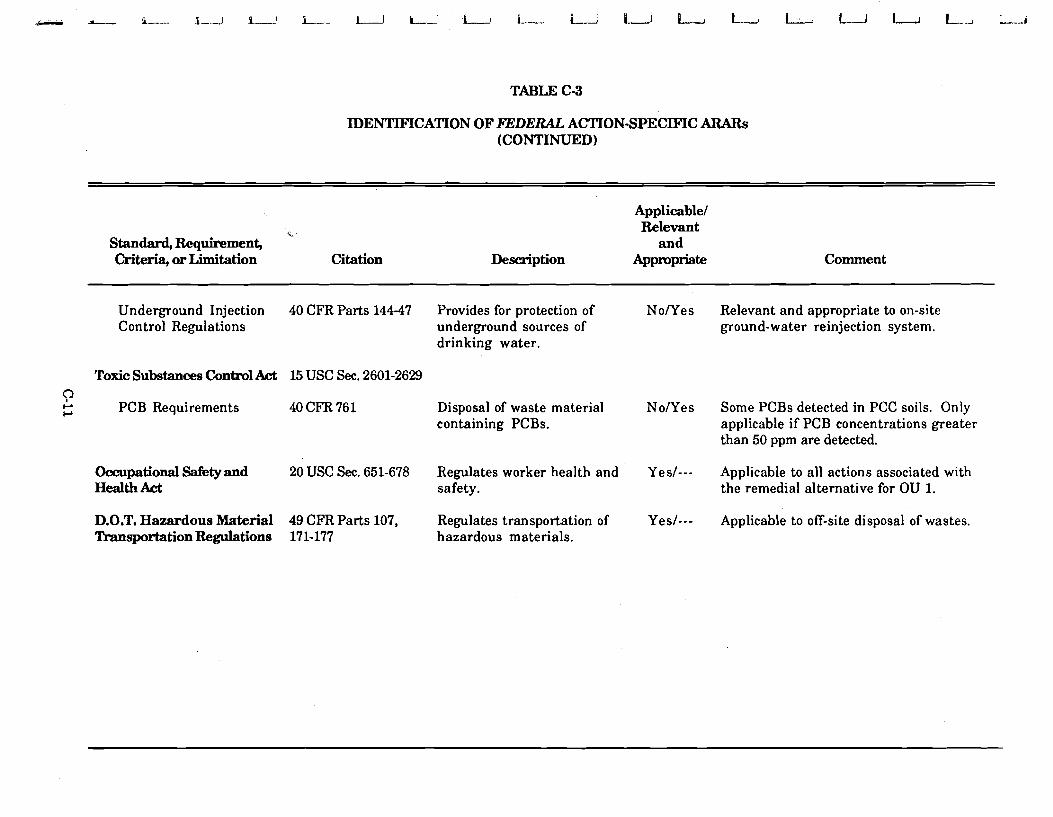
TABLE C-3
1DENTlFICATION O F FEDERAL ACTION-SPECIFIC ARARs (CONTINUED)
\"
Standard, Requirement, Criteria, o r Limitation Citation
Applicable1 Relevant
and Description Comment
Underground Injection 40 CFR Parts 144-47 Provides for protection of Control Regulations underground sources of
drinking water.
Toxic Substances Contro1 Act 15 USC Sec. 2601-2629
0 I-' I-' PCB Requirements 40 CFR 761 Disposal of waste material
containing PCBs.
Occupational Safety and 20 USC Sec. 651-678 Regulates worker health and Health Act safety.
D.O.T. Hazardous Material 49 CFR Parts 107, Regulates transportation of 'I'ransportation Regulations 171-177 hazardous materials.
NolYes Relevant and appropriate to on-site ground-water reinjection system.
'es Some PCBs detected in PCC soils. Only applicable if PCB concentrations greater than 50 ppm are detected.
Yes/--- Applicable to all actions associated with the remedial alternative for OU 1.
Yes/--- Applicable to off-site disposal of wastes.
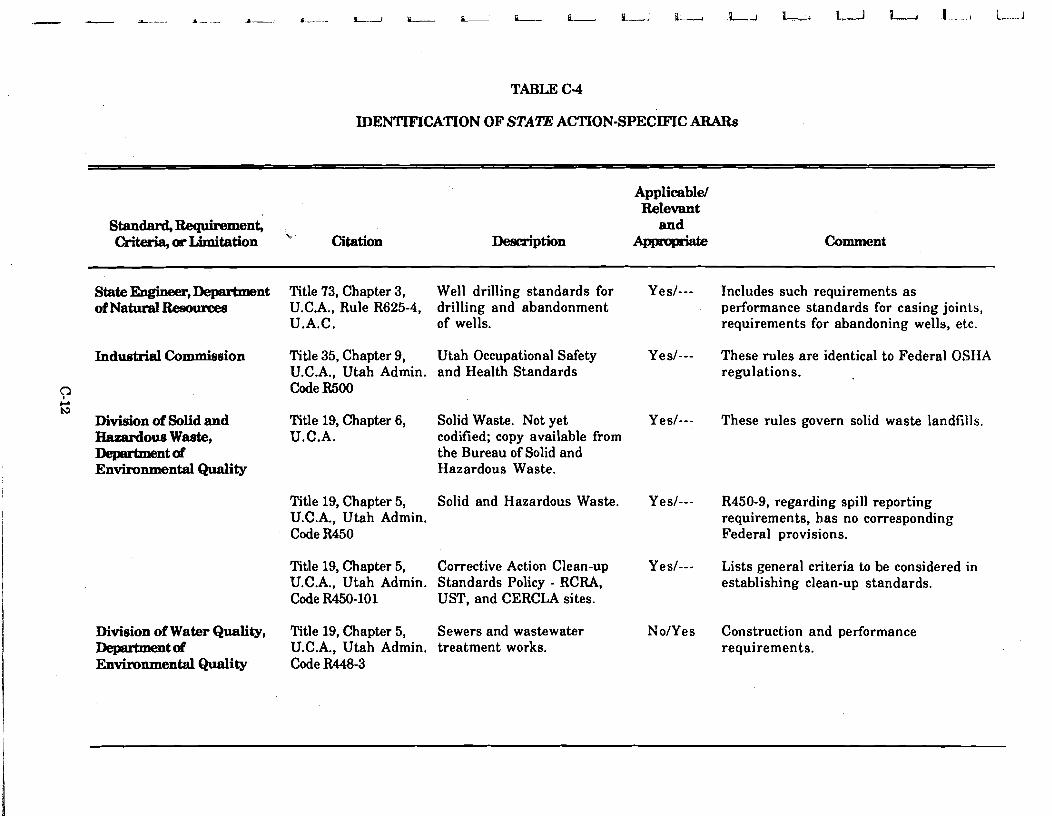
TABLE C-4
IDENTIFICATION OF STATE ACTION-SPECIFIC ARARs
Standard, Requirement, Criteria, or Limitation Citation
Applicable/ Relevant
and Description Comment
Industrial Comminsion
Division of Solid and Hnlnlvlous Waste, -tof' Environmental Quality
Division of Water Quality, Deparbnentd Environmental Quality
Title 73, Chapter 3, Well drilling standards for U.C.A., Rule R625-4, drilling and abandonment U.A.C. of wells.
Title 35, Chapter 9, Utah Occupational Safety U.C.A., Utah Admin. and Health Standards Code R500
Title 19, Chapter 6, Solid Waste. Not yet U.C.A. codified; copy available from
the Bureau of Solid and Hazardous Waste.
Title 19, Chapter 5, Solid and Hazardous Waste. U.C.A., Utah Admin. Code R450
Title 19, Chapter 5, Corrective Action Clean-up U.C.A., Utah Admin. Standards Policy - RCRA, Code R450- 10 1 UST, and CERCLA sites.
Title 19, Chapter 5, Sewers and wastewater U.C.A., Utah Admin. treatment works. Code R.448-3
Yes/--- Includes such requirements as performance standards for casing joints, requirements for abandoning wells, etc.
Yes/--- These rules are identical to Federal OSHA regulations.
Yes/--- These rules govern solid waste landfills.
Yes/--- R450-9, regarding spill reporting requirements, has no corresponding Federal provisions.
Yes/--- Lists general criteria to be considered in establishing clean-up standards.
NoIYes Construction and performance requirements.
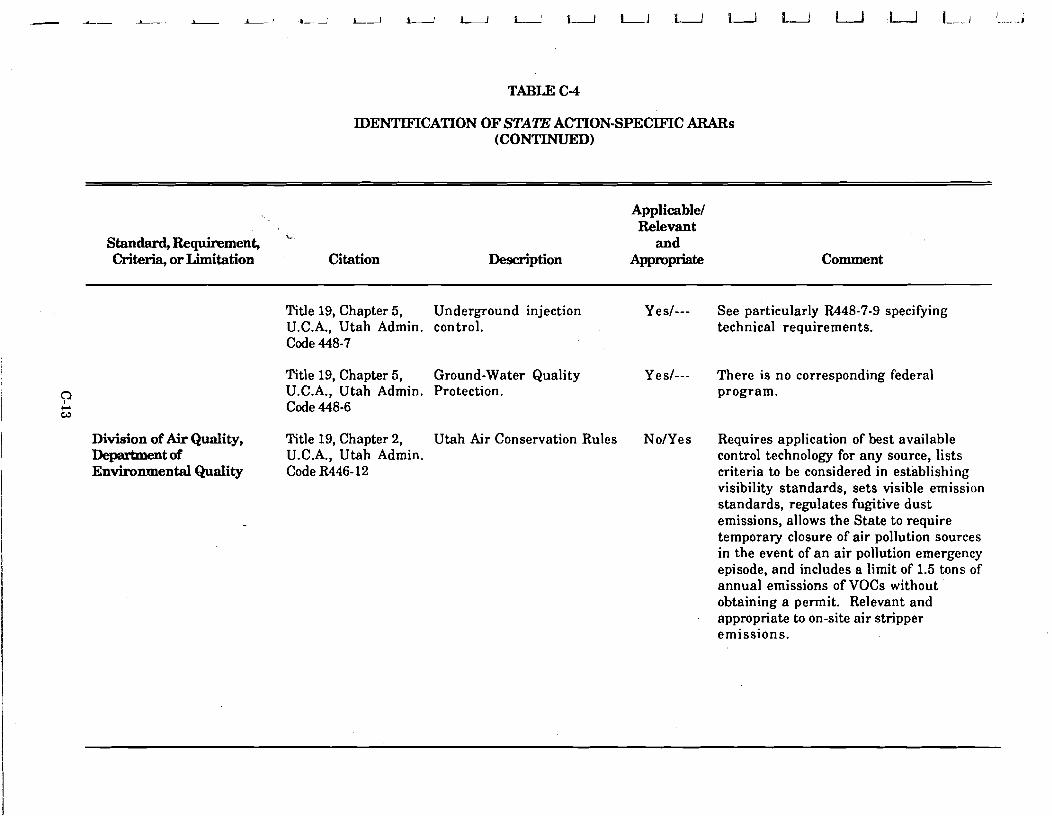
IDENTIFICATION OF STATE ACTION-SPECIFIC ARARs (CONTINUED)
Standard, Requirement, -..
Criteria, or Limitation Citation
Applicable/ Relevant
and Description Appmpliate Comment
Title 19, Chapter 5, Underground injection U.C.A., Utah Admin. control. Code 448-7
Title 19, Chapter 5, Ground-Water Quality U.C.A., Utah Admin. Protection. Code 448-6
Division of Air Quality, Title 19, Chapter 2, Utah Air Conservation Rules Department of U.C.A., Utah Admin. Environmental Quality Code R446-12
Yes/--- See particularly R448-7-9 specifying technical requirements.
Yes/--- There is no corresponding federal program.
No/Yes Requires application of best available control technology for any source, lists criteria to be considered in establishing visibility standards, sets visible emission standards, regulates fugitive dust emissions, allows the State to require temporary closure of air pollution sources in the event of an air pollution emergency episode, and includes a limit of 1.5 tons of annual emissions of VOCs without obtaining a permit. Relevant and appropriate to on-site air stripper emissions.

Excavation and incineration of all soil containing a t least 1 m g k g of bromacil or chlordane from the French Drain;
Extraction and t rea tment of all ground water until contaminant concentrations are below their MCLs, or the potential health risks are less than 1 x for contaminants without MCLs.
Removal and incineration of the soil a t OU 2 will eliminate the source of pesticide and herbicide contamination in the ground water as well as removing the potential for contact with these contaminants in soil, s a d thus this will no longer be a complete pathway. Treatment of contaminated ground water a t OU 2 to a level below the MCLs will result in less than a 1 x cancer risk to potential future ground-water users. Currently, the contaminants in the ground water do not pose a risk to anyone because there is no complete pathway to a ground-water user. However, there is a potential for a cancer risk of 3 x 10⁻⁴ and a hazard index of 200 if someone were to become a ground-water user a t a later date. The remedy will not eliminate the potential for a ground-water pathway, but it will reduce contaminant~concentrations to levels which would not present a significant risk. The selected remedy for soil and ground water a t OU 2 will not pose an unacceptable short-term risk and will have the effect of minimizing cross-media impacts.
Section 121(d)(l) of CERCLA as amended by SARA, requires that remedial actions must attain a degree of cleanup which assures protection of human health and the environment. In addition, remedial action tha t leaves any hazardous substances, pollutants, or contaminants on site must, upon their completion, meet a level or standard which a t least attains legally applicable or relevant and appropriate standards, requirements, limitations, or criteria tha t are "applicable or relevant and appropriate requirements" (ARARs) under the circumstances of the release. ARARs include federal standards, requirements, criteria, and limitations and any promulgated standards, requirements, criteria or limitations under State environmental or facility siting regulations and that are more stringent than federal standards.
"Applicable" requirements are those cleanup standards, standards of control, and other substantive environmental protection requirements, criteria, or limitations promulgated under Federal or State law that specifically address a hazardous substance, pollutant or contaminant, remedial action, location, or other circumstance a t a remedial action site. "Relevant and appropriate" requirements are cleanup standards, standards of control, and other substantive environmental protection requirements, criteria; or limitations promulgated under Federal or State law that, while not "applicable" to a hazardous substance, pollutant or contaminant, remedial action, location, or other circumstance a t a ' remedial action site, address problems or situations sufficiently similar to those 1
encountered at the site that their use is well-suited to the particular site.
In determining which requirements are relevant and appropriate, the criteria differ depending on the type of requirement under consideration, i.e., chemical-specific, location-specific, or action-specific. According to the NCP, chemical-specific ARARs are usually health or risk-based numerical values which establish the acceptable amount or concentration of a chemical tha t may remain in, or be discharged to, the ambient environment. Location-specific ARARs generally are restrictions placed upon the concentration of hazardous substances or the conduct of activities solely because they are in special locations. Some examples of special locations include floodplains, wetlands, historic places, and sensitive ecosystems or habitats. Action-specific ARARs are usually
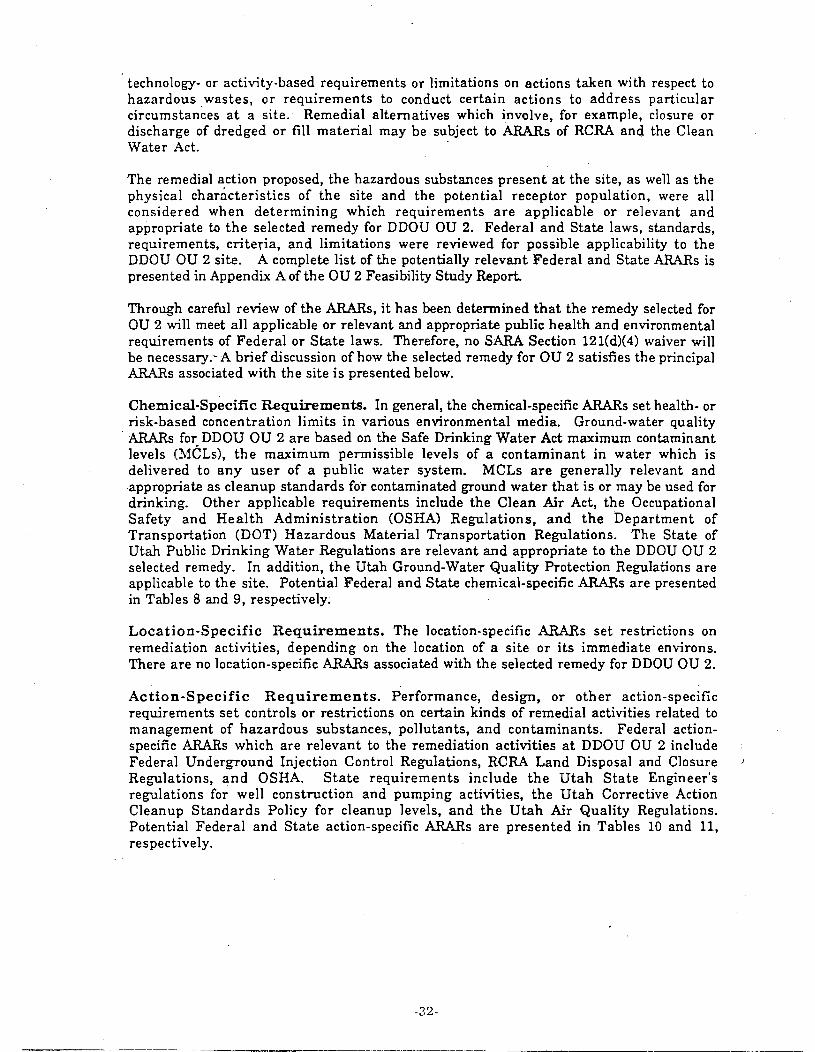
technology- or activity-based requirements or limitations on actions taken with respect to hazardous ,wastes, or requirements to conduct certain actions to address particular circumstances a t a site. Remedial alternatives which involve, for example, closure or discharge of dredged or fill material may be subject to ARARs of RCFW and the Clean Water Act.
The remedial action proposed, the hazardous substances present a t the site, a s well as the physical charicterist ics of the site and the potential receptor population, were all considered when determining which requirements a r e applicable or relevant and appropriate to t h e selected remedy for DDOU OU 2. Federal and State laws, standards, requirements, criteria, and limitations were reviewed for possible applicability to the DDOU OU 2 site. A complete list of the potentially relevant Federal and State ARARs is presented in Appendix A of the OU 2 Feasibility Study Report.
Through careful review of the ARARs, i t has been determined t h a t the remedy selected for OU 2 will meet all applicable or relevant and appropriate public health and environmental requirements of Federal or Sta te laws. Therefore, no SARA Section 121(d)(4) waiver will be necessary.- A brief discussion of how the selected remedy for OU 2 satisfies the principal ARARs associated with the site i s presented below.
Chemical-Specific Requi rements . In general, the chemical-specific ARARs set health- or risk-based concentration limits in various environmental media. Ground-water quality ARARs for DDOU OU 2 are based on the Safe Drinking Water Act maximum contaminant levels (MCLS), t h e maximum permissible levels of a contaminant in water which is delivered to a n y use r of a public water system. MCLs a r e generally relevant and appropriate as cleanup standards for contaminated ground water tha t i s or may be used for drinking. Other applicable requirements include the Clean Air Act, the Occupational Safety and Heal th Administration (OSHA) Regulations, and t h e Department of Transportation (DOT) Hazardous Material Transportation Regulations. The State of Utah Public Drinking Water Regulations are relevant and appropriate to the DDOU OU 2 selected remedy. In addition, the Utah Ground-Water Quality Protection Regulations are applicable to the site. Potential Federal and State chemical-specific ARARs are presented in Tables 8 and 9, respectively.
L o c a t i o n - S p e c i f i c R e q u i r e m e n t s . The location-specific ARARs set restrictions on remediation activities, depending on the location of a site or i t s immediate environs. There a re no location-specific ARARs associated with the selected remedy for DDOU OU 2.
A c t i o n - S p e c i f i c R e q u i r e m e n t s . Performance, design, or o ther action-specific requirements se t controls or restrictions on certain kinds of remedial activities related to management of hazardous substances, pollutants, and contaminants. Federal action- specific ARARs which are relevant to the remediation activities at DDOU OU 2 include Federal Underground Injection Control Regulations, RCFW Land Disposal and Closure I
Regulations, a n d OSHA. S t a t e requirements include t h e Utah S ta te Engineer's regulations for well construction and pumping activities, the Utah Corrective Action Cleanup Standards Policy for cleanup levels, and t h e Utah Air Quality Regulations. Potential Federal and Sta te action-specific ARARs are presented in Tables 10 and 11, respectively.
To Be Considered Requirements. In implementing the selected remedy for OU 2, DDOU has agreed to consider a number'of requirements that are not legally binding. TBC requirements include the following proposed MCLs: chlordane ( 2 pgll); cis-1,2- dichloroethene (70 p d ) ; trans-1.2-dichlorethene (100 pg/l); and tetrachloroethene (5 pgA).
5 3 COST EFFECI'IVENESS
Overall cost-effectiveness can be defined a s the reduction in threat to public health and the environment per dollars expended on a remedy. The selected remedy for DDOU OU 2 is the most cost-effective alternative because i t provides the maximum effectiveness proportional to cost of any of the alternati~es 'anal~zed.
5.4 UTILIZATION OF PERMANENT SOLUTIONS
This section briefly describes the rationale for the selected remedy and explains how the remedy provides the best balance of tradeoffs among all the alternatives with respect to the five summary balancing criteria, which include: - -
1. Long-term effectiveness and permanence
2. Reduction of toxicity, mobility, or volume through treatment
3. Short-term effectiveness
4. Implementability
5. Cost.
4
Other criteria include state and community acceptance. A detailed comparative analysis of all the alternatives is presented in the worksheets provided in Appendix B of the OU 2 FS Report.
Of the six alternatives selected for detailed analysis (Alternatives 1, 2, 4, 6, 7, and 12), alternatives 6, 7, and 12 rate comparably with respect to the five piimary balancing criteria and are superior to Alternatives 1, 2, and 4. However, Alternative 7 (off-site ground-water treatment and soil incineration) rated slightly lower than Alternative 6 (on-site ground- water and off-site soil incineration) and Alternative 12 (enhanced on-site ground-water t reatment and off-site soil incineration) with respect to implementability and cost. Because Alternative 7 would require consumptive use of ground water, i t was not considered acceptable by the State of Utah. Alternative 6 was chosen over Alternative 12 because i t has a lower cost, and rated higher with respect t o implementability. !
I
The selected remedy for DDOU OU 2 utilizes permanent solutions and treatment technologies to the maximum extent practicable. I t is estimated that remediation of soil and ground water will be complete when the 5-year review is conducted by DDOU. In order to ensure the effectiveness of the remedy, monitoring and management of the site will be required for a t least two years on a quarterly basis after remediation is completed or until five years after the s ta r t of remediation, whichever is later. The contaminant volume in the ground water will be reduced through air stripping approximately 50 million gallons of contaminated ground water for removal of organics. Contaminated soils will be incinerated and sent to a landfill to reduce mobility.
5.5 PREFERENCE FOR TREA-NT AS A PRINCIPAL EZEMENT
The selected reinedy uses treatment t o the maximum extent practical. Contaminated soils will be incinerated, eliminating the potential for contact with contaminants in the soils and eliminating the source of pesticide contamination in the ground water. The other potential threat i s ingestion and inhalation of contaminants in ground water. The selected remedy treats the ground water through an air stripping system that may include liquid phase carbori adsorption.
5.6 DOCUMENTATION OF NO SIGNIFICANT CHANGES
The Proposed Plan for DDOU OU 2 was released for public comment in June 1990. The Proposed Plan identified Alternative 6, On-Site Ground-Water Treatment and Off-Site Soil Incineration, a s the preferred alternative. All written and verbal comments submitted during the comment period were reviewed. The conclusion of this review was t h a t no significant changes to the remedy, as identified in the Proposed Plan, were necessary.

T h
ALTERNATIVE G - GROUND-WATER TREATMXNT & SOIL DISPOSAL
Eliminnte exposure pathways through remedintion Eliminate exposure pnthways by removing contaminated soil
Extrnction - Extraction Wells Exlmclion - Excnvntion
System of 10 wells, each 40-feet deep, 4-inch diameter Individual well flow rates = 10 gpm 432,000 gallon storage pond
Trcntment - Air Stripping
Flow rnte =I00 gpm Surge Tank = 5,000 gallons Influent water temperature = 50' F
w Influent TCE concentration = 25 pgA 5> Effluent TCE concentration c 5 pgA
Influent cis-1,2-DCE concentration = 200 pgA Emuent cis-1,2-DCE concentration c 70 pgA Vnpor phase controls = None Aqueous phnse carbon tn control chlordnne
Disposal - Reinjection into Aquifer
System of 10 injection wells, each 40-feet deep, 4-inch diameter Individunl well flow rntes 2 10 gpm
Excnvnte 40 cubic ynrds of contnminated soil Transport contnminnted soil off-site to commercinl incinerator Refill excavation with clean soil Regrade and revegatate excavation site
Treatment - Commercial Incineration
Deep Rock, Texas Incinerntion
Disposal - Off-site
Soil DisposnVI'reatment Costs - Commercial Incineration
Indirect = $25,000 Capital = $123,000 Annunl O&M = $5,000
Indirect costs include soil nnnlysis necessnry for landfili ilisposol
Cnpitnl costs include excnvntion/trnnsport/dispasnl
O&M costs cover site restorntion for two years
Ground-Water Tren tment Costs ( Inc ludes Air S t r ipp ing n n d Cnrbon Adsorption)
Indirect = $38,000 Capital = $182,000 Annual O&M = $75,000
Indirect costs include administration, engineering, design nnd permitting
O&M costs include monitoring program costs
Total Costs: Indirect = $63,@ Capital = $305,000 Annua l O&M = $103,000 Prcsent Worth Cost = $676,000
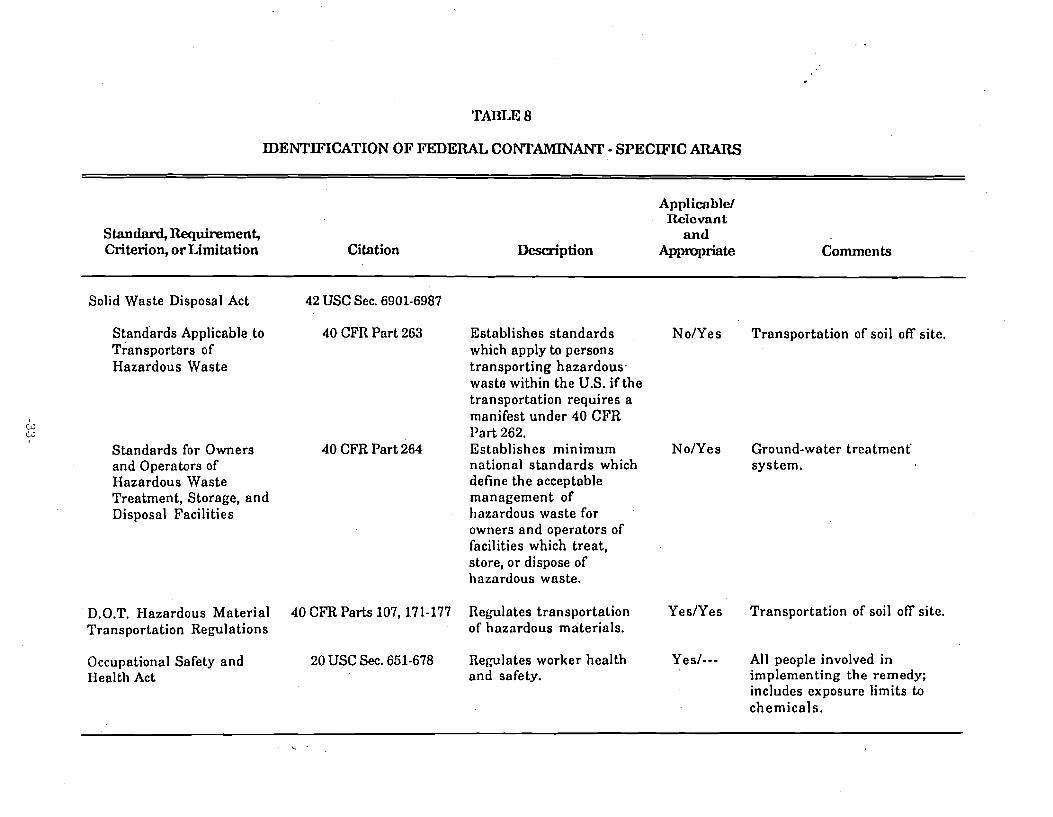
TABU 8
IDENTIFICATION OF m E R A L CONTAMINANT - SPECIFIC AItARS
Standard, Requirement, Criterion, or Limitation Citntion
Appl iab lc l Rclcvcln t
and Description Appropriate
Solid Waste Disposal Act
Standards Applicable t o Transporters of Hazardous Waste
Standards for Owners and Operators of Hazardous Waste Treatment, Storage, and Disposnl Facilities
D.O.T. Hazardous Material Transportation Re y l a t i o n s
Occupational Safety and Health Act
42 USC Sec. 6901-6987
40 CFR Part 263 Establishes standards which apply to persons transporting hazardous. waste within the U.S. if the transportation requires a manifest under 40 CFR Part 262.
40 CFR Part 264 Establishes minimum national standards which define the acceptable management of hazardous waste for owners and operators of facilities which treat, store, or dispose of hazardous waste.
40 CFR Parts 107,171-177 Regulates transportation of hazardous materials.
20 USC Sec. 651-678 Regulates worker health and safety.
NoIYes Transportation of soil off site.
NoIYes Ground-water treatment' system.
YesIYes Transportation of soil off site.
Yes/--- All people involved in implementing the remedy; includes exposure limits to chemicals.


TAI3L.E 9
LDENTIFICATION O F STATE CONTAMINANT - SPECIFIC ARARs
Stmdnrd, Requirement, Criterion, o r Limitation Citation Description
~ p ~ l i c a b l e / Relevant
and A P P P ~ ~ Comments
Utah Public Drinking Water Sections 3.1.1. and 3.1.2. Establishes maximum NoIYes Values identical to Regulations contaminant levels for Federal MCLs for all
inorganic and organic compounds present a t chemicals. site.
Utah Public Drinking Water Section 3.2 Establishes secondary No/Yes Requirements are
w Regulations, Pesticides drinking water relevant and appropriate ?' standards. to the DDOU Site.
Utah Groundwater Quality Utah Adm. Code R448-6 Establishes ground-water Y es/Yes Contributes to the Protection Re y l a t i ons quality standards for the National Primary
different ground-water Drinking Water aquifer classes. Standards (MCLs) being
remedial action objectives.
Bureau of Solid and Title 26, Chapter 11, Corrective Action Clean- YesIYes Lists general criteria to Hazardous Waste, Division U.C.A, U.AC. 450-101 up Standards Policy - be considered in of Environmental Health, RCRA, UST, nnd establishing clean-up Department of Health CERCLA sites. standards.
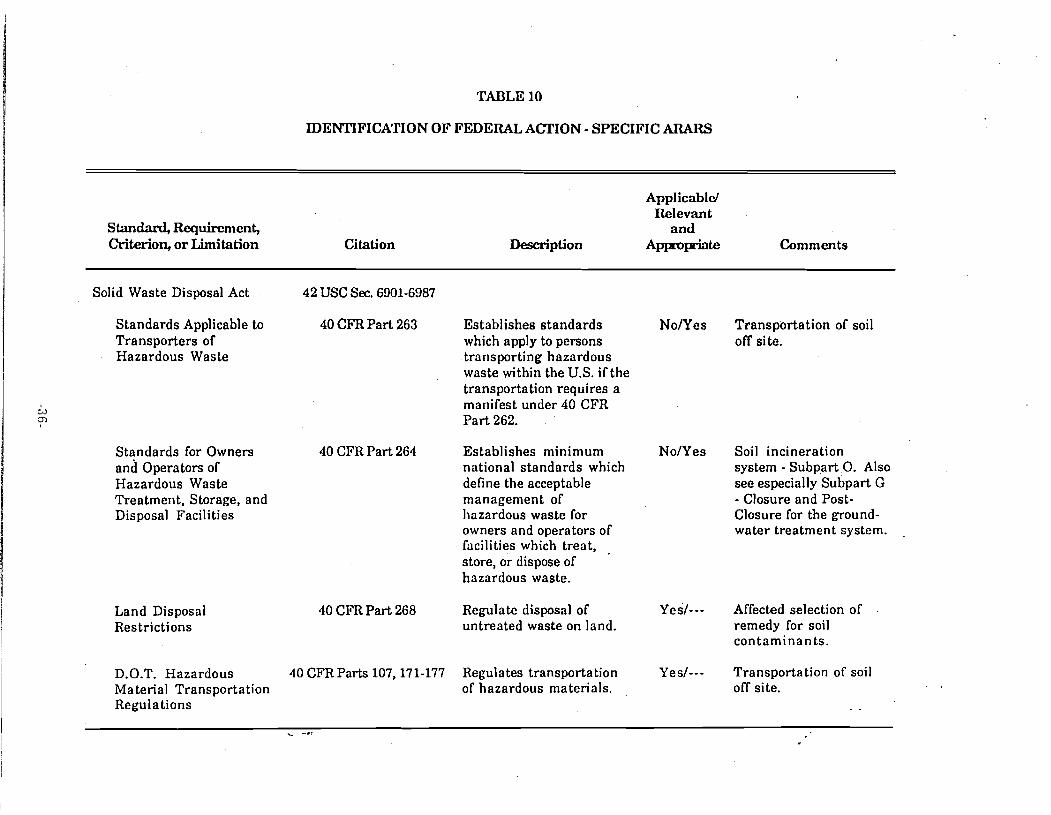
TABLE 10
IDENTIFICATION O F FEDERAL ACTION - SPECIFIC ARAW
S tandad, Requirement, Criterion, o r Limitation Citation
Applicablcl Relevant
a n d Description A p p r ~ e t e Comments
Solid Waste Disposal Act 42 USC Sec. 6901-6987
Standards Applicable to 40 CFR Part 263 Establishes standards N o N e s Transportation of soil Transporters of which apply to persons off site. Hazardous Waste transporting hazardous
waste within the U.S. if the transportation requires a
W manifest under 40 CFR
? Part 262.
Standards for Owners 40 CFR Part 264 Establishes minimum No/Yes Soil incineration and Operators of national standards which system - Subpart 0. Also Hazardous Waste define the acceptable see especially Subpart G Treatment, Storage, and management of - Closure and Post- Disposal Facilities hazardous waste for Closure for the ground-
owners and operators of water treatment system. facilities which treat, store, or dispose of hazardous waste.
Land Disposal Restrictions
40 CFR Part 268 Regulate disposal of Yes/--- Affected selection of untreated waste on land. remedy for soil
contaminants .
D.O.T. Hazardous 40 CFR Parts 107,171-177 Regulates transporta tion Yes/--- Transportation of soil Material Transportation of hazardous materials. off site. Regulations . -

TABLE 10
IDENTIFICATION OF FEDERAL ACTION - SPECIFIC Al?ARS (CONTINUED)
S tandad, Requirement, Criterion, or Limitation Citation
~ p p l i c ~ b l d Relevant and
Description A ~ e t e Comments
Occupational Safety and 20 USC Sec. 651-678 Regulates worker health Yes/--- Defines training for Health Act and safety. workers involved in
implementing the remedy.
Underground Injection 40 CFR Part 146 Subpart F Standards for Class V Yes/--- Applicable to reinjection t3 Control Program underground injection of treated ground water. ;-I wells.
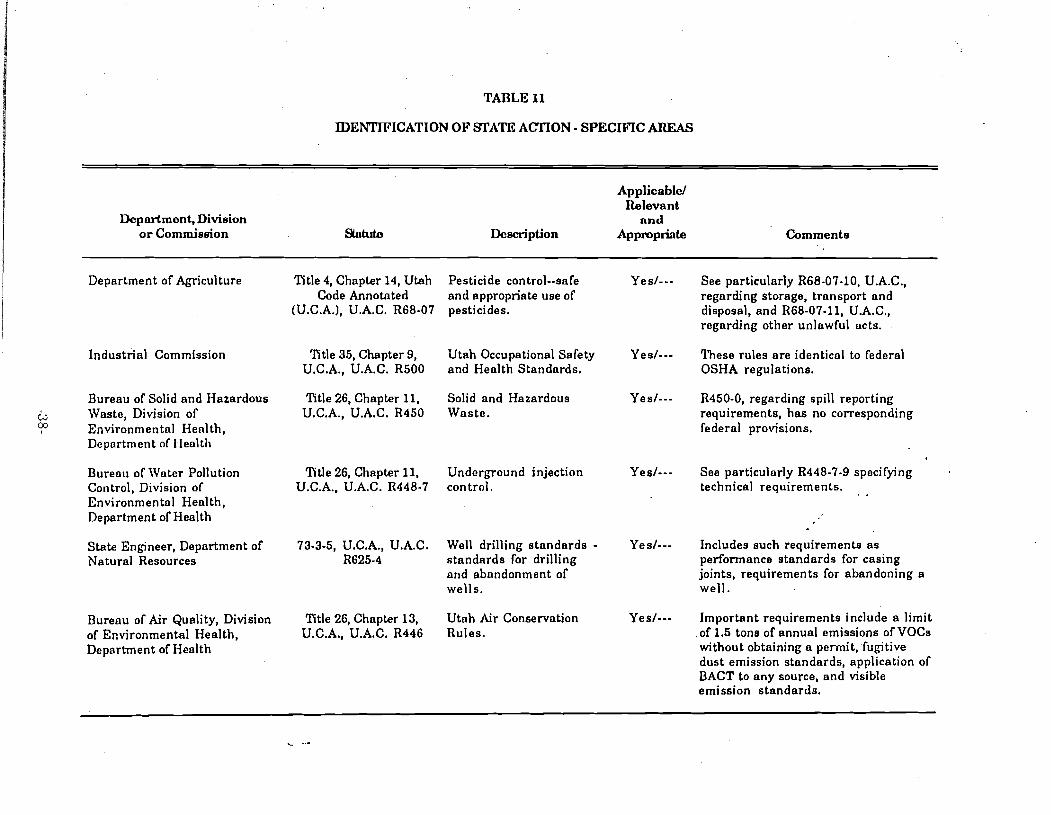
TABLE 11
IDErnICATION OF STATI;', ACTION - SPECrnC AREAS
Departmont, Division o r Commission
Applicable/ Relevant
a n d Doscription k ~ m ~ h h Commente
Department of Agriculture Title 4, Chapter 14, Utah Pesticide control--safe Code Annotnted nnd appropriate use of
(U.C.A.), U.A.C. R68-07 pesticides.
Industrial Commission Title 35, Chapter 9, Utah Occupational Safety U.C.A., U.A.C. R500 and Health Standards.
Bureau of Solid and Hazardous Title 26, Chapter 11, Solid and Hazardous w Waste, Division of U.C.A., U.A.C. R450 Waste. ?' Environmental Henlth,
Department of IIealth
Burenu of Water Pollution Control, Division of Environmentnl Health, Department of Health
State Engineer, Department of Natural Resources
Bureau of Air Quality, Division of Environmental Health, Department of Health
Title 26, C h ~ p t e r 11, Underground injection U.C.A.. U.A.C. R448-7 control.
73-3-5, U.C.A., U.A.C. Well drilling s tandards - R625-4 standards for drilling
nnd abandonment of wells.
Title 26, Chapter 13, Utah Air Conservation U.C.A., U.A.C. R446 Rules.
Yes/--- See particularly R68-07-10, U.A.C., regarding storage, transport and disposal, and R68-07-11, U.A.C., regarding other unlawful acts.
Yes/--- These rules are identical to federal OSHA regulations.
Yes/--- R450-0, regarding spill reporting requirements, has no corresponding federal provisions.
Yes/--- See particularly R448-7-9 specifying technical requirements. . -
Yes/--- Includes such requirements a s performance standards for casing joints, requirements for abandoning a well.
Yes/--- Important requirements include a limit .of 1.5 tons of annual emissions of VOCs without obtaining a permit, fugitive dust emission standards, application of BACT to any source, and visible emission standards.
Defense Distribution Ogden, Utah
Final
Record of Decision and Responsiveness Summary for Operable Unit 4
August 3 , 1992
APPENDIX C
FEDERAL AND STATE CHEMICAL AND ACTION-SPECIFIC ARARs

TABLE C-1
IDENTIFICATION OF FEDERAL CHEMlCACSPECIFIC ARARs
StandawLRequirement, Criteria, or Limitation Citation
Applicable/ Relevant
and Description Comment
Solid Waste Dispod Act
Identification and Listing of Hazardous Waste
Safe Drinking Water Act
National Primary Drinking Water Standards
42 USC SCX. 6901-6987
40 CFR Part 261 Defines those solid wastes NoIYes Identifies wastes that are subject to which are subject to land disposal restrictions under 40 regulation as hazardous CFR 268. wastes under 40 CFR Parts 262-265,268, and Parts 270, 271, 124.
42 USC Sec. 300g
40 CFR Part 141 Establishes health-based standards for public water systems (maximum contaminant levels).
National Primary 40 CFR Part 142 Establishes regulations for Drinking Water the implementation and Regulations enforcement of 40 CFR Part Implementation 14 1.
NoIYes Remedial Action Objectives: Vinyl Chloride - 2 pgL, Benzene - 5 CylJL cis-1,2-DCE - 70 pg/L PCBs - 0.5 CylJL T C E - 5 W
NoIYes Provides regulatory requirements for exemptions and variance from MCLs for synthetic organic chemicals (40 CFR Part 142.62)

TABLE C-1
IDENTIFICATION OF FEDERAL CHEMICAL-SPECIFIC ARARs (CONTINUED)
\,
Standard, Requirement, Criteria, ur Limitation Citation
Applicable! Relevant
and Des&ption Comment
National Secondary 40 CF'R Part 143 Drinking Water Standards
9 Maximum Contaminant Pub. L. No. 99-339,100 t4 Level Goals , Stat. 642 (1986)
Clean Water Act 33 USC SIX. 125 1-1376
Water Quality Criteria 40 CFR Part 131 Quality Criteria for Water, 1986
CleanAirAct 42 USC SIX. 7401-7642
Establishes welfare-based standards for public water systems (secondary maximum contaminant levels),
Establishes drinking water quality goals set at levels of no known or anticipated adverse health effects, with an adequate margin of safety.
Sets criteria for water quality based on toxicity to aquatic organisms and human health.
NoINo Ground water will not be used as a public water system. These criteria are set primarily for aesthetic and taste purposes.
NolYes Relevant and appropriate for contaminants in ground water a t ou 4.
NolYes Relevant and appropriate to ground- water treatment a t OU 4.
National Primary and 40 CFR Part 50 Establishes standards for NolYes Relevant and appropriate to any on- Secondary Ambient Air ambient air quality to protect site activity which might result in air Quality Standards public health and welfare emissions during remedial actions a t
(including standards for OU 4. particulate matter and lead).
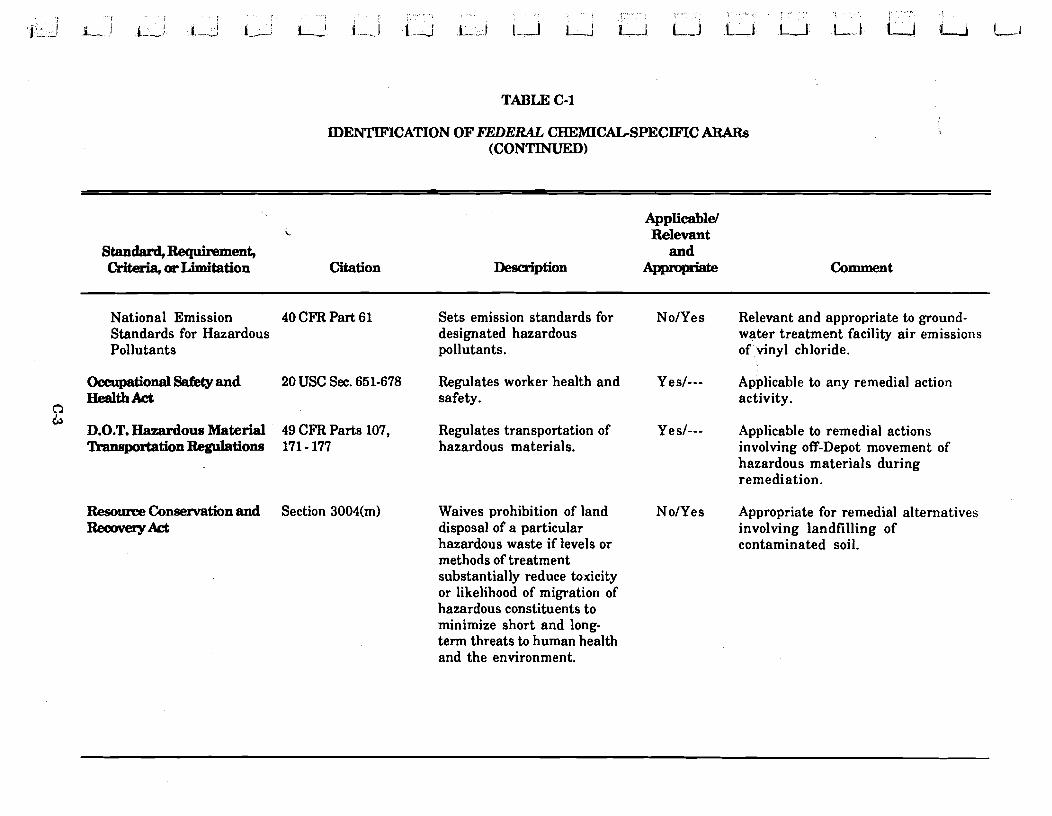
TABLE C-1
IDENTIFICATION OF FEDERAL CHEMICAL-SPECIFLC ARARs (CONTINUED)
Standard, Requimment, Criteria, ur Limitation Citation
Applicable4 Relevant
and Description Comment
National Emission 40 CFR Part 61 Standards for Hazardous Pollutants
Ckmpationd Safety and 20 USC SW. 65 1-678 H d t h Act
n &
D.O.T. Hazardous Material 49 CFR Parts 107, 'mansportation Regulations 171 - 177
Resoume Conservation and Section 3004(m)
Sets emission standards for designated hazardous pollutants.
Regulates worker health and safety.
Regulates transportation of hazardous materials.
Waives prohibition of land disposal of a particular hazardous waste if levels or methods of treatment substantially reduce toxicity or likelihood of migration of hazardous constituents to minimize short and long- term threats to human health and the environment.
NoIYes Relevant and appropriate to ground- water treatment facility air emissions of vinyl chloride.
Yes/--- Applicable to any remedial action activity.
Ye sl--- Applicable to remedial actions involving off-Depot movement of hazardous materials during remediation,
NoIYes Appropriate for remedial alternatives involving landfilling of contaminated soil.
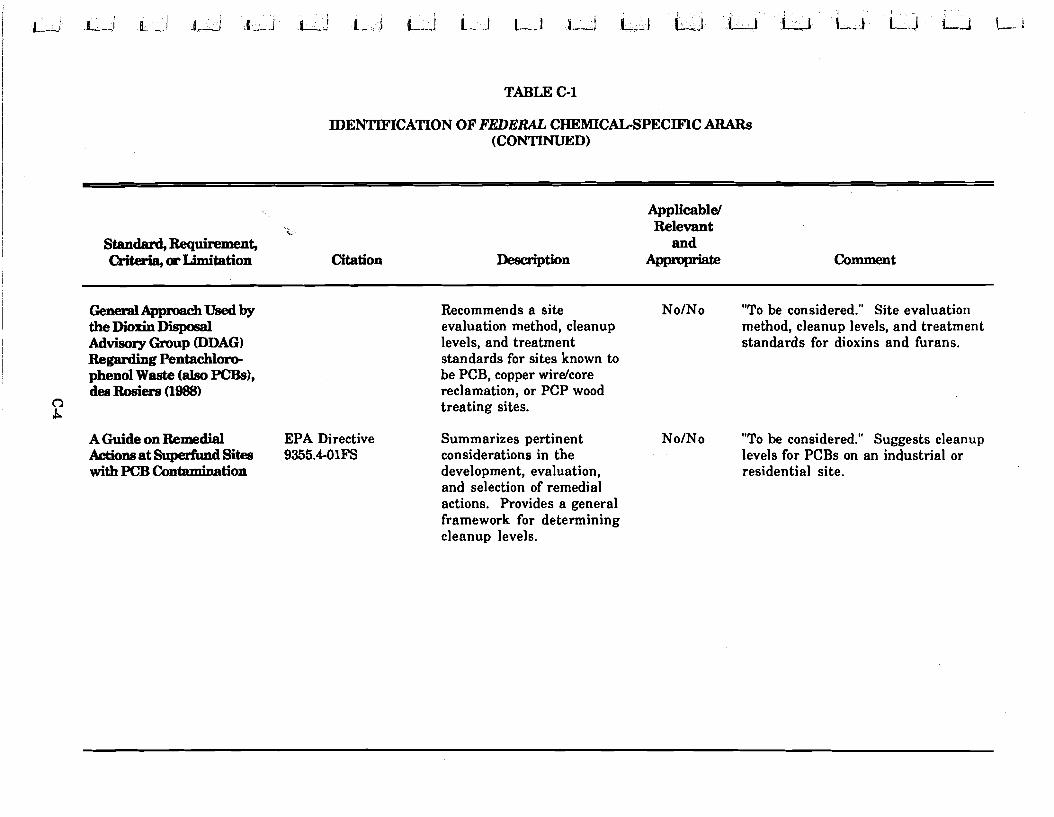
TABLE C-1
IDENTIFICATION OF FEDERAL CHEMICAL-SPECIFIC ARARs (CONTINUED)
\r
Standard, Requirement, OP Limitation Citation
Applicable/ Relevant
and Description Comment
General A p p d Used by the Dioxin Dbposal Advisory Group DDAG) Regarding Pentaddom phenol Waste (also PCBs), dee Rosiere (1988)
n b
Recommends a site NoINo "To be considered." Site evaluation evaluation method, cleanup method, cleanup levels, and treatment levels, and treatment standards for dioxins and furans. standards for sites known to be PCB, copper wirelcore reclamation, or PCP wood treating sites.
A Guide on Remedial EPA Directive Summarizes pertinent NoINo "To be considered." Suggests cleanup Actiom at Superfund Sites 9355.4-01FS considerations in the levels for PCBs on an industrial or with PCB Contamination development, evaluation, residential site.
and selection of remedial actions. Provides a general framework for determining cleanup levels.

TABLE C-2
IDENTIFICATION OF STATE CHEMICAL-SPECIFIC ARARS
Standard, Requjrement, \,
Cri- or Limitation Citation
Applicable/ Relevant
and Description Comment
Utah Public Drinking Water Regulations
Utah Gmund-Water Quality mtection Regulation8
Division of Solid and Hazardous Waste, Deparbnentof Environmental Quality
Utah Admin. Code Establishes maximum (U.A.C.) R449 contaminant levels for
inorganic and organic chemicals.
Utah Admin. Code Establishes groundwater (U.A.C.) R448-6 quality standards for the
different groundwater aquifer classes.
U.A.C. R450-101 Corrective action clean-up standards policy - RCRA, UST, and CERCLA sites.
U.A.C. Rule R68-07 Pesticide control--safe and appropriate use of pesticides.
NoIYes Requirements are relevant and appropriate to OU 4. Some MCLs established for contaminants not Federally regulated (i.e. Sulphates and total dissolved solids).
Yes/--- Standards are identical to Utah Public Drinking Water Regulations but contain MCLs for volatile organics.
Yes/--- Lists general criteria to be considered in establishing clean-up standards. Refer to Safe Drinking Water Act and Clean Air Act. Requires removal or control of the source.
NoIYes See particularly R68-07-10, U.A.C., regarding storage, transport and disposal, and R68- 07-11, U.A.C., regarding other unlawful acts.

TABLE C-2
IDENTIFICATION OF STATE CHEMICAL-SPECIFIC ARARS (CONTINUED)
\
Standard, Requhment, Criteria, or Limitation Citation
Applicable/ Relevant
and Dewription Comment
Division of Water Quality, Rule R448-1 U.A.C. Definitions for Water Yes/--- Deparbnentd ' Pollution Rules and General Environmental Quality Requirements.
Rule R448-2 U.A.C. Standards of Quality for Waters of the State.
Yes/--- These rules are specific to Utah waters, though they are derived in part by using Federal criteria. See particularly the anti- degradation policy in U.A.C. R448-2-3.
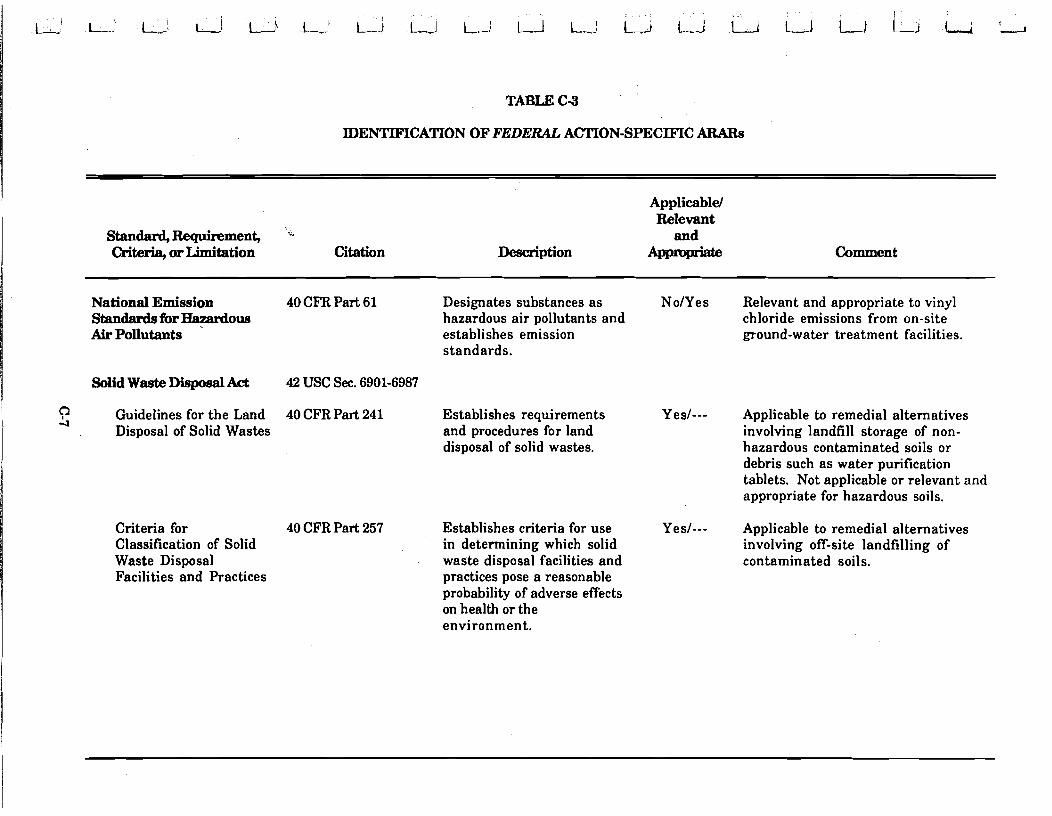
TABLE C-3
IDENTIFICATION OF FEDERAL ACITON-SPECIFIC ARARs
Standard,-ment, Criteria, ar Limitation Citation
Applicable/ Relevant and
Description
National Emission 40 CFR Part 61 Designates substances as No/Yes Relevant and appropriate to vinyl Standards for H&pdous hazardous air pollutants and chloride emissions from on-site Air Pollutants establishes emission ground-water treatment facilities.
standards.
Solid Waste Disposal Act 42 USC Sec. 6901-6987
? 4
Guidelines for the Land 40 CFR Part 241 Establishes requirements Yes/--- Applicable to remedial alternatives Disposal of Solid Wastes and procedures for land involving landfill storage of non-
disposal of solid wastes. hazardous contaminated soils or debris such as water purification tablets. Not applicable or relevant and appropriate for hazardous soils.
Criteria for 40 CFR Part 257 Establishes criteria for use Yes/--- Applicable to remedial alternatives Classification of Solid in determining which solid involving off-site landfilling of Waste Disposal waste disposal facilities and contaminated soils. Facilities and Practices practices pose a reasonable
probability of adverse effects on health or the environment.
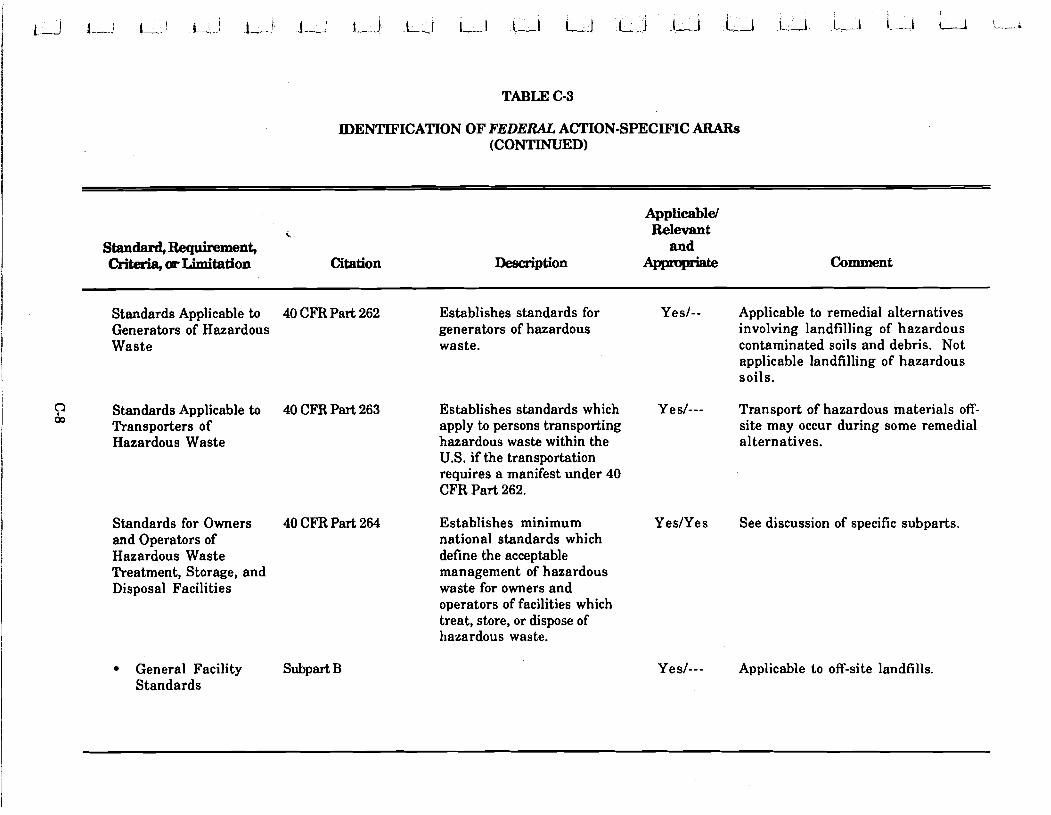
TABLE C-3
IDENTIFICATION OF FEDERAL ACTION-SPECIFIC ARARs (CONTINUED)
\,
Standad, -men& Criteria, ar Limitation Citation
Applicable/ Relevant
and DesQiption Comment
Standards Applicable to 40 CFR Part 262 Establishes standards for Yes/-- Applicable to remedial alternatives Generators of Hazardous generators of hazardous involving landfilling of hazardous Waste waste. contaminated soils and debris. Not
applicable landfilling of hazardous soils.
'? Standards Applicable to 40 CFR Part 263 Establishes standards which Yes/--- Transport of hazardous materials off- m Transporters of apply to persons transporting site may occur during some remedial
Hazardous Waste hazardous waste within the alternatives. U.S. if the transportation requires a manifest under 40 CFR Part 262.
Standards for Owners 40 CFR Part 264 Establishes minimum YeslYes See discussion of specific subparts. and Operators of national standards which Hazardous Waste define the acceptable Treatment, Storage, and management of hazardous Disposal Facilities waste for owners and
operators of facilities which treat, store, or dispose of hazardous waste.
General Facility Subpart B Standards
Yes/--- Applicable to off-site landfills.
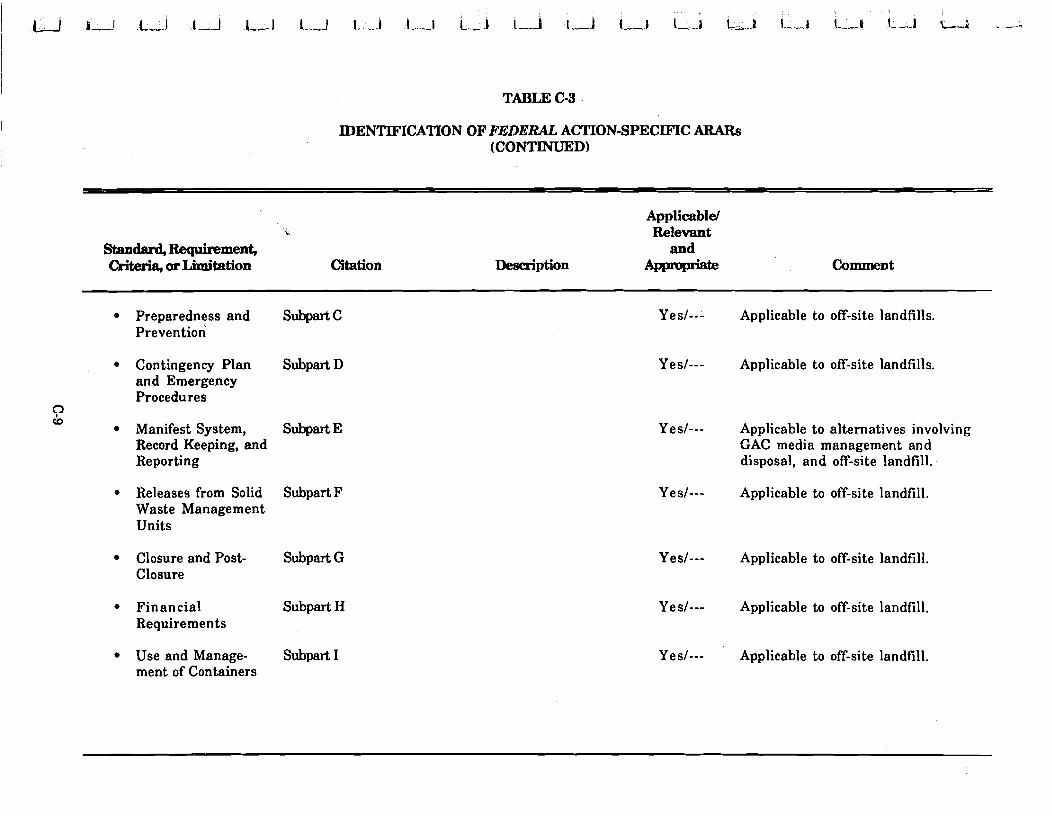
TABLE C-3
IDENTIFICATION OF FEDERAL ACTION-SPECIFIC ARARs (CONTINUED)
Standard, Requirement, Criteria, or Limitation Citation
Applicable/ Relevant
and Desmiption Comment
Preparedness and SubpartC prevention
- - - -
Yes/--- Applicable to off-site landfills.
Contingency Plan SubpartD and Emergency Procedures
CI w
Manifest System, Subpart E Record Keeping, and Reporting
Releases from Solid Subpart F Waste Management Units
Closure and Post- Subpart G Closure
Financial Subpart H Requirements
Use and Manage- Subpart I ment of Containers
Yes/--- Applicable to off-site landfills.
Yes/--- Applicable to alternatives involving GAC media management and disposal, and off-site landfill.
Yes/--- Applicable to off-si te landfill.
Yes/--- Applicable to off-site landfill.
Yes/--- Applicable to off-site landfill.
Yes/--- Applicable to off-site landfill.
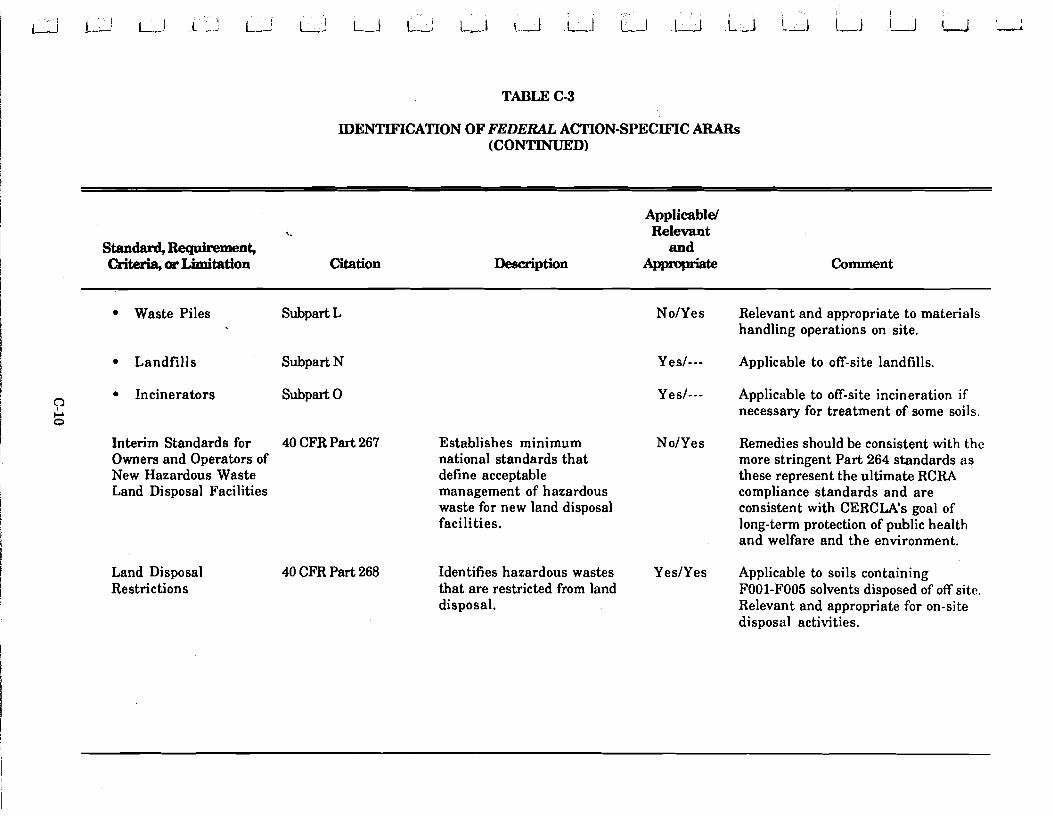
TABLE C-3
IDENTIFICATION OF FEDERAL ACTION-SPECIFIC ARARs (CONTINUED)
x.
Standard, Requirement, Criteria, ap Limitation Citation
Applicable/ Relevant
and Description Comment
Waste Piles Subpart L No/Yes Relevant and appropriate to materials handling operations on site.
Landfills Subpart N Yes/--- Applicable to off-site landfills.
Incinerators Subpart 0 Yes/--- Applicable to off-site incineration if necessary for treatment of some soils.
Interim Standards for 40 CFR Part 267 Establishes minimum No/Yes Remedies should be consistent with the Owners and Operators of national standards that more stringent Part 264 standards a s New Hazardous Waste define acceptable these represent the ultimate RCRA Land Disposal Facilities management of hazardous compliance standards and are
waste for new land disposal consistent with CERCLA's goal of facilities. long-term protection of public health
and welfare and the environment.
Land Disposal 40 CFR Part 268 Identifies hazardous wastes YesIYes Applicable to soils containing Restrictions that are restricted from land F001-F005 solvents disposed of off site.
disposal. Relevant and appropriate for on-site disposal activities.
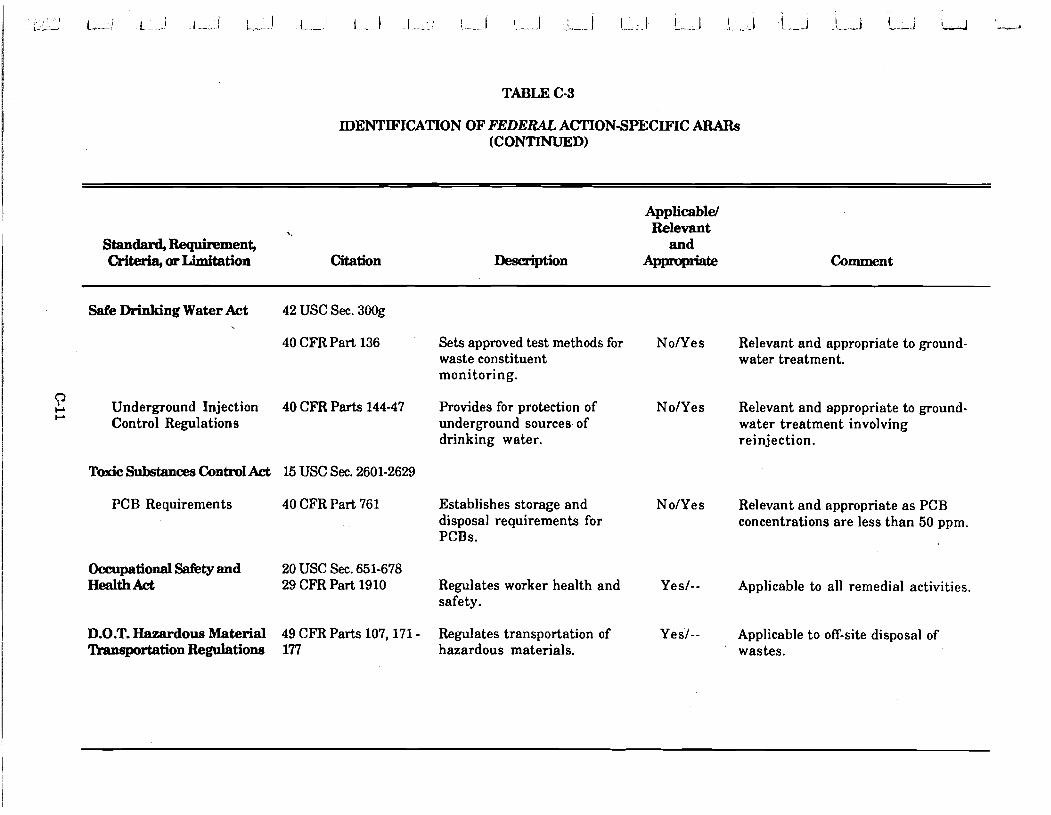
TABLE C-3
IDENTIFICATION OF FEDERAL ACTION-SPECIFIC ARARs (CONTINUED)
Standard, Requirement, Criteria, ar Limitation Citation
Applicable/ Relevant
and Description Comment
Safe Drinking Water Act 42 USC Sec. 300g
40 CFR Part 136
'? F F
Underground Injection 40 CFR Parts 144-47 Control Regulations
Toxic S-~e8 Conbrol Act 15 USC SW. 2601-2629
PCB Requirements 40 CFR Part 761
Occupational Safety and 20 USC Sec. 651-678 HfAthAct 29 CF'R Part 1910
D.O.T. Hazardous Material 49 CFR Parts 107,171 - Transportation Regulations 177
Sets approved test methods for NoIYes Relevant and appropriate to ground- waste constituent water treatment. monitoring.
Provides for protection of NoIYes Relevant and appropriate to ground- underground sources of water treatment involving drinking water. reinjection.
Establishes storage and disposal requirements for PCBs.
NoIYes Relevant and appropriate a s PCB concentrations are less than 50 ppm.
Regulates worker health and Yes/-- Applicable to all remedial activities. safety.
Regulates transportation of Yes/-- Applicable to off-site disposal of hazardous materials. wastes.
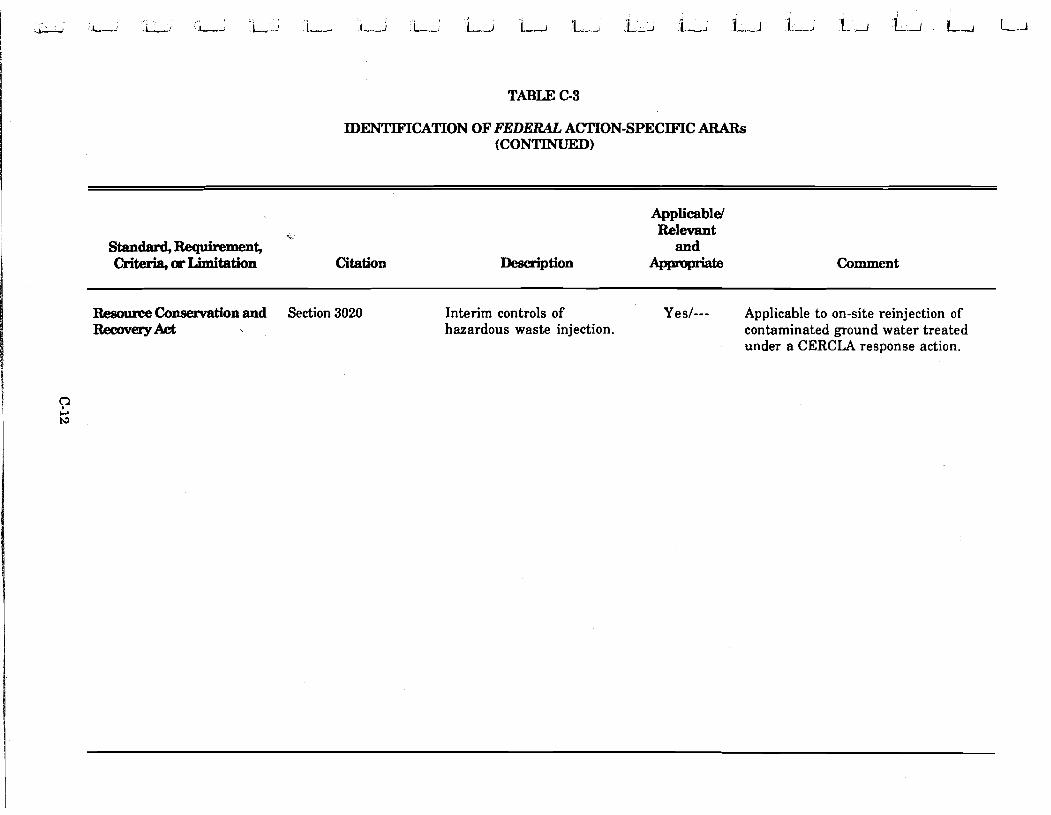
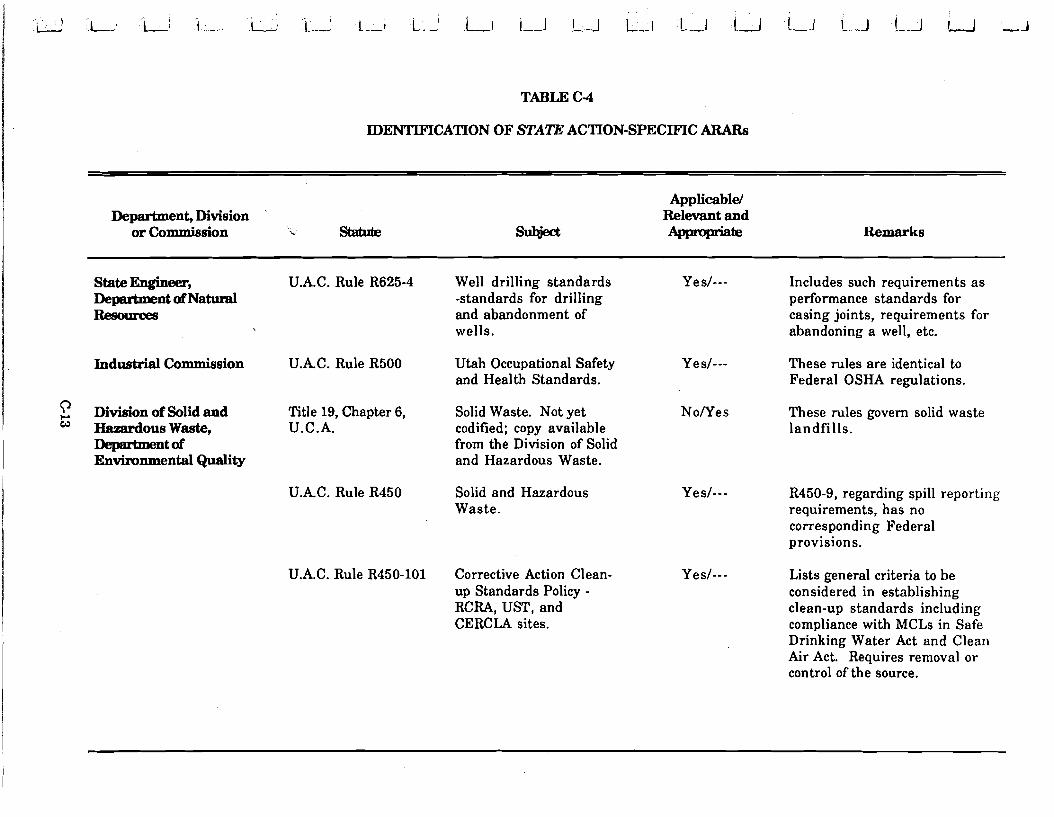
I d 1 r i L.-.~ I 1-J 1-1 L 1--1 L-J L-J !.A U U J J u (2
TABLE C-4
IDENTIFICATION OF STATE ACTION-SPECIFIC ARARs
Department, Division or Commission .,
Applicablel Relevant and
s* -t- Remarks
State Ehgheer, U.AC. Rule R625-4 Department &Natural Resources
Industrial Commission U.AC. Rule R500
Division of Solid and Title 19, Chapter 6, " HazardousWaste, U.C.A.
-tof Envhnmental Quality
U.AC. Rule R450
U.AC. Rule R450-101
Well drilling standards -standards for drilling and abandonment of wells.
Utah Occupational Safety and Health Standards.
Solid Waste. Not yet codified; copy available from the Division of Solid and Hazardous Waste.
Solid and Hazardous Waste.
Corrective Action Clean- up Standards Policy - RCRA, UST, and CERCLA sites.
Yes/--- Includes such requirements a s performance standards for casing joints, requirements for abandoning a well, etc.
Yes/--- These rules are identical to Federal OSHA regulations.
N o n e s These rules govern solid waste landfil ls .
Yes/--- R450-9, regarding spill reporting requirements, has no corresponding Federal provisions.
Yes/--- Lists general criteria to be considered in establishing clean-up standards including compliance with MCLs in Safe Drinking Water Act and Clean Air Act. Requires removal or control of the source.
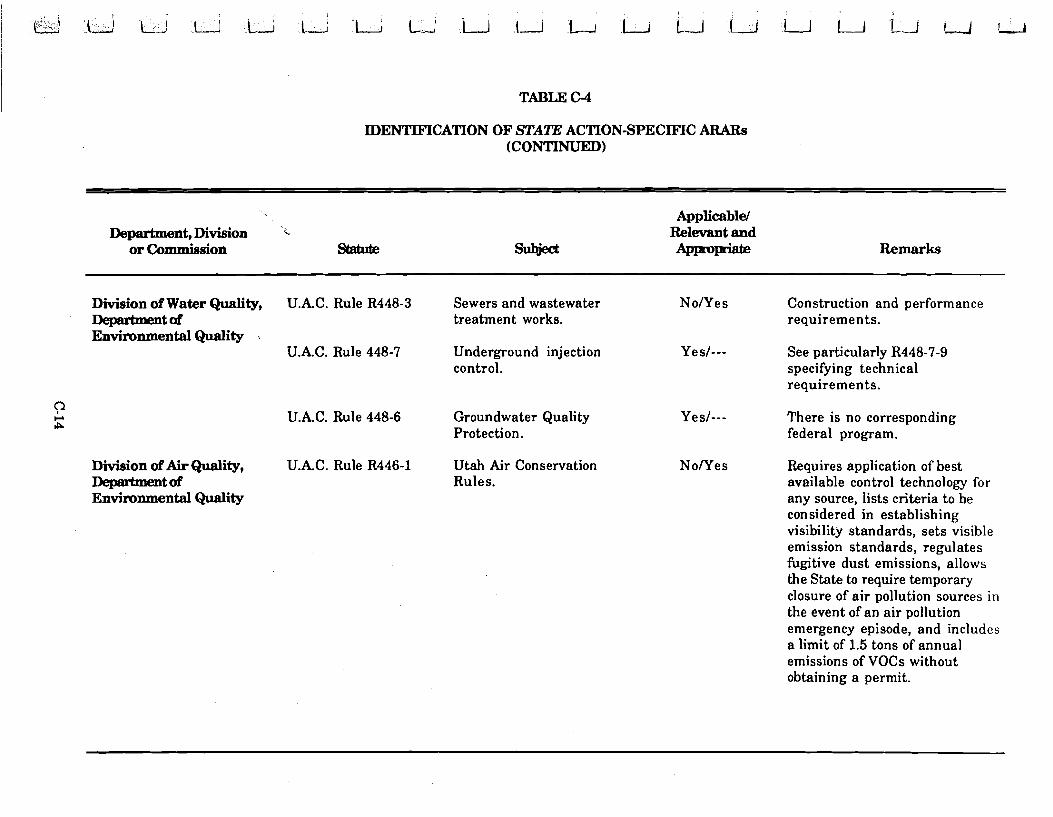
TABLE C 4
IDENTIFICATION OF STATE ACTION-SPECIFIC ARAR. (CONTINUED)
Department, Division or Commission Stat&
Applicable/ Relevant and
s* 4PQm Remarks
Division of Water Quality, U.A.C. Rule R448-3 -tof EnvironmentalQuality \
U.AC. Rule 448-7
U.A.C. Rule 448-6
Division of Air Quality, U.A.C. Rule R446-1 Deparhnentof Environmental Quality
Sewers and wastewater treatment works.
Underground injection control.
Groundwater Quality Protection.
Utah Air Conservation Rules.
NoNes Construction and performance requirements.
Yes/--- See particularly R448-7-9 specifying technical requirements.
Yes/--- There is no corresponding federal program.
NoNes Requires application of best available control technology for any source, lists criteria to be considered in establishing visibility standards, sets visible emission standards, regulates fugitive dust emissions, allows the State to require temporary closure of air pollution sources in the event of an air pollution emergency episode, and includes a limit of 1.5 tons of annual emissions of VOCs without obtaining a permit.
Defense Depot Ogden, Utah
Final
Record of Decision and Responsiveness Summary for Operable Unit 1
June 10, 1992
APPENDIX A
SOIL AND GROUND-WATER REMEDIATION CRITERIA
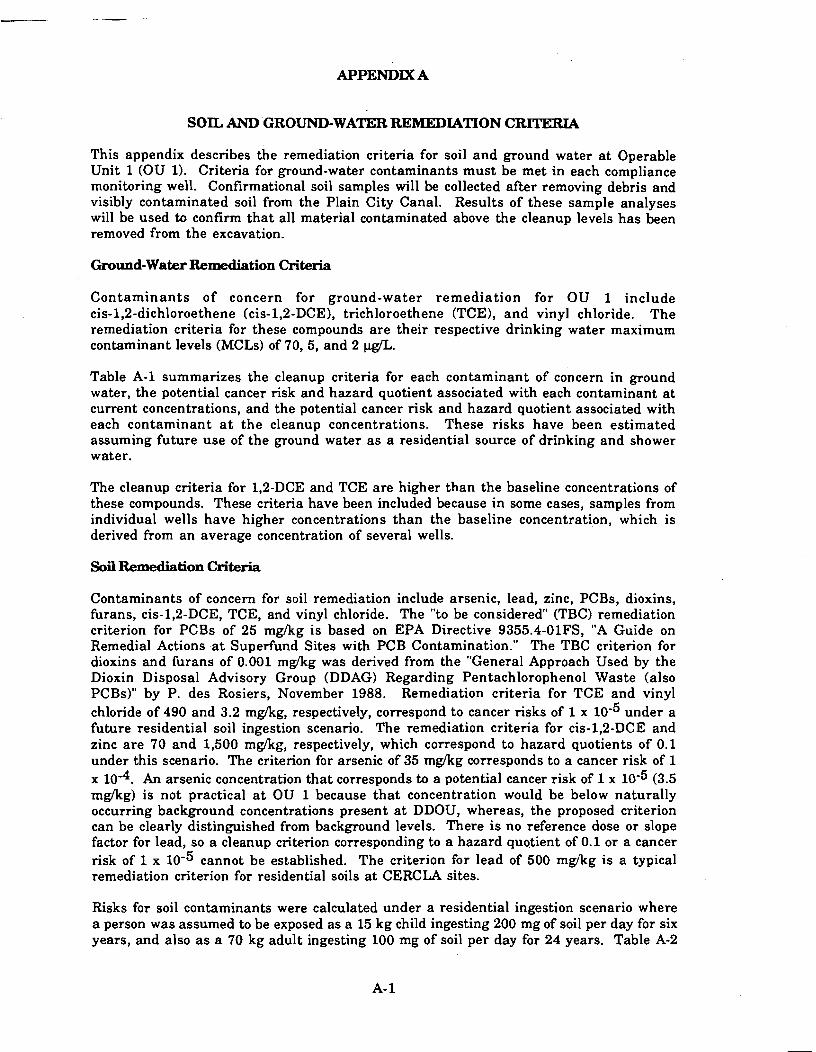
APPENDIX A
SOIL AND GROUND-WATER RJ3MEDIATION CRITERIA
This appendix describes the remediation criteria for soil and ground water at Operable Unit 1 (OU 1). Criteria for ground-water contaminants must be met in each compliance monitoring well. Confirmational soil samples will be collected after removing debris and visibly contaminated soil from the Plain City Canal. Results of these sample analyses will be used to confirm tha t all material contaminated above the cleanup levels has been removed from the excavation.
Ground-Water Remediation Criteria
Contaminan ts of concern for ground-water remediat ion for OU 1 include cis-1,2-dichloroethene (cis-1,2-DCE), trichloroethene (TCE), and vinyl chloride. The remediation criteria for these compounds a re their respective drinking water maximum contaminant levels (MCLs) of 70, 5, and 2 pg/L.
Table A-1 summarizes the cleanup criteria for each contaminant of concern in ground water, the potential cancer risk and hazard quotient associated with each contaminant at current concentrations, and the potential cancer risk and hazard quotient associated with each contaminant a t t he cleanup concentrations. These risks have been estimated assuming future use of the ground water a s a residential source of drinking and shower water.
The cleanup criteria for 1,2-DCE and TCE are higher than the baseline concentrations of these compounds. These criteria have been included because in some cases, samples from individual wells have higher concentrations than the baseline concentration, which is derived from an average concentration of several wells.
Soil Remediation Criteria
Contaminants of concern for soil remediation include arsenic, lead, zinc, PCBs, dioxins, furans, cis-l,2-DCE, TCE, and vinyl chloride. The "to be considered" (TBC) remediation criterion for PCBs of 25 m g k g i s based on EPA Directive 9355.4-OlFS, "A Guide on Remedial Actions a t Superfund Sites with PCB Contamination." The TBC criterion for dioxins and furans of 0.001 mgkg was derived from the "General Approach Used by the Dioxin Disposal Advisory Group (DDAG) Regarding Pentachlorophenol Waste (also PCBs)" by P. des Rosiers, November 1988. Remediation criteria for TCE and vinyl chloride of 490 and 3.2 m&g, respectively, correspond to cancer risks of 1 x under a future residential soil ingestion scenario. The remediation criteria for cis-1,2-DCE and zinc a re 70 and 1,500 m&g, respectively, which correspond to hazard quotients of 0.1 under this scenario. The criterion for arsenic of 35 m&g corresponds to a cancer risk of 1 x An arsenic concentration that corresponds to a potential cancer risk of 1 x 10⁻⁵ (3.5 m&g) is not practical at OU 1 because tha t concentration would be below naturally occurring background concentrations present at DDOU, whereas, the proposed criterion can be clearly distinguished from background levels. There i s no reference dose or slope factor for lead, so a cleanup criterion corresponding to a hazard quotient of 0.1 or a cancer risk of 1 x 10⁻⁵ cannot be established. The criterion for lead of 500 m g k g is a typical remediation criterion for residential soils a t CERCLA sites.
Risks for soil contaminants were calculated under a residential ingestion scenario ,where a person was assumed to be exposed as a 15 kg child ingesting 200 mg of soil per day for six years, and also a s a 70 kg adult ingesting 100 mg of soil per day for 24 years. Table A-2

TABLE A-1
GROUND-WATER REMEDIATION CRITERIA BASED ON A FUTURE RESIDENTIAL EXPOSURE SCENARIO
Commtmtion Clean-Up in Level(a) Clean-Up
Chemical pg/WBasis Base RisWHQ (p@) RisWHQ
cis-1,2-Dichloroethene 5.3/RME NC/0.03 70 NC/0.4
Trichloroethene O.5/RME 3 x l0-7/--(~) 5 3 10-6/-_(b)
Vinyl chloride 2.3/RME 1 x 10-%'2 2 1 x 10⁴/2
(a) All cleanup levels are MCLs (b) No reference dose available to calculate the hazard quotient
HQ Hazard quotient NC Noncarcinogen RME Reasonable maximum exposure concentration corresponding to the 95 percent
confidence interval of the mean
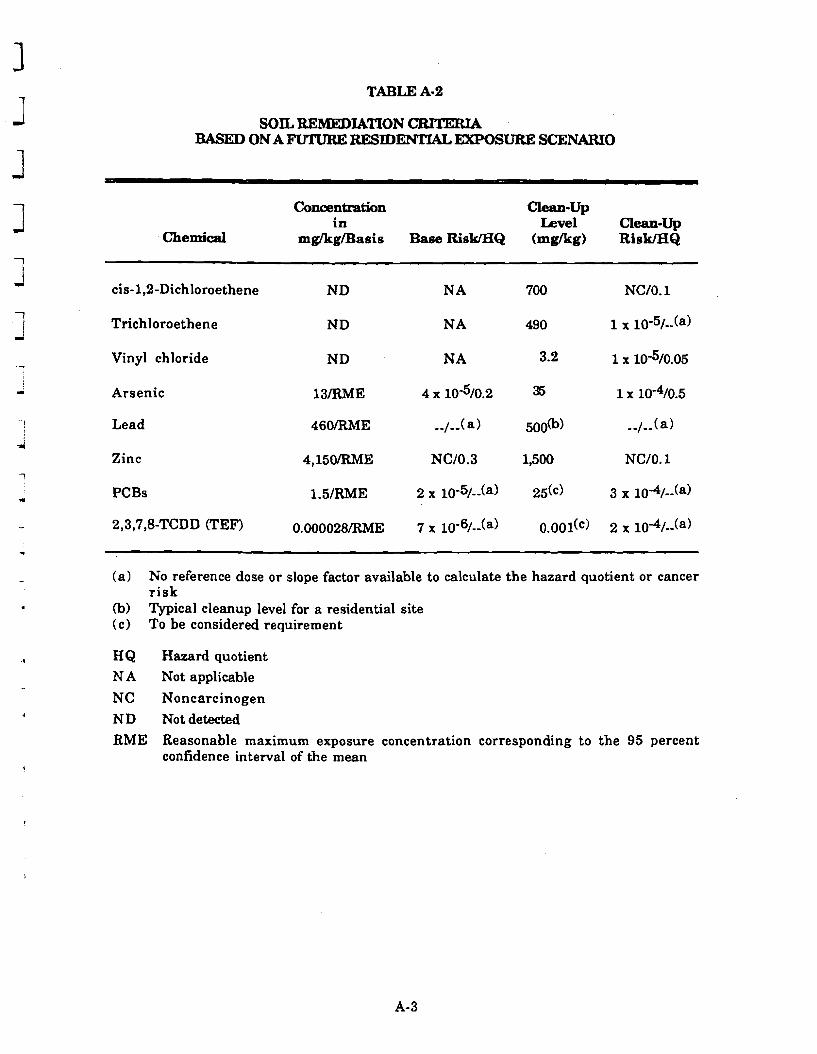
TABLE A-2
SOIL REMEDIATION CRITERLA BASED ON A FUTURE RESIDENTIAL E2POSUR.E SCENARIO
Conoentration Clean-Up in bve l Clean-Up
Chemical mg/kg/Basis Base RiskIHQ (mgkg) RiskJHQ
cis-1,2-Dichloroethene
Trichloroethene
Vinyl chloride
Arsenic
Lead
Zinc
PCBs
2,3,7,8-TCDD (TEF)
(a) No reference dose or slope factor available to calculate the hazard quotient or cancer r i sk
(b) Typical cleanup level for a residential site (c) To be considered requirement
HQ Hazard quotient N A Not applicable
NC Noncarcinogen N D Not detected
RME Reasonable maximum exposure concentration corresponding to the 95 percent confidence interval of the mean
summarizes the remediation criteria, baseline risks, and post-remediation risks for soil contaminants.
It should be noted that the criteria for most of the contaminants of concern for soil exceed the baseline concentrations detected in soil samples collected from the Plain City Canal. While there is no risk-based reason for remediating the soil a t OU 1 for contaminants other than zinc, remediation criteria are necessary should hot spots be encountered where contaminant concentrations exceed previously detected concentrations.
Defense Depot Ogden, Utah
Draft Final .
Record of Decision and R e s p o n s i v e n e s s Summary for Operable Unit 2
September 7, 1990
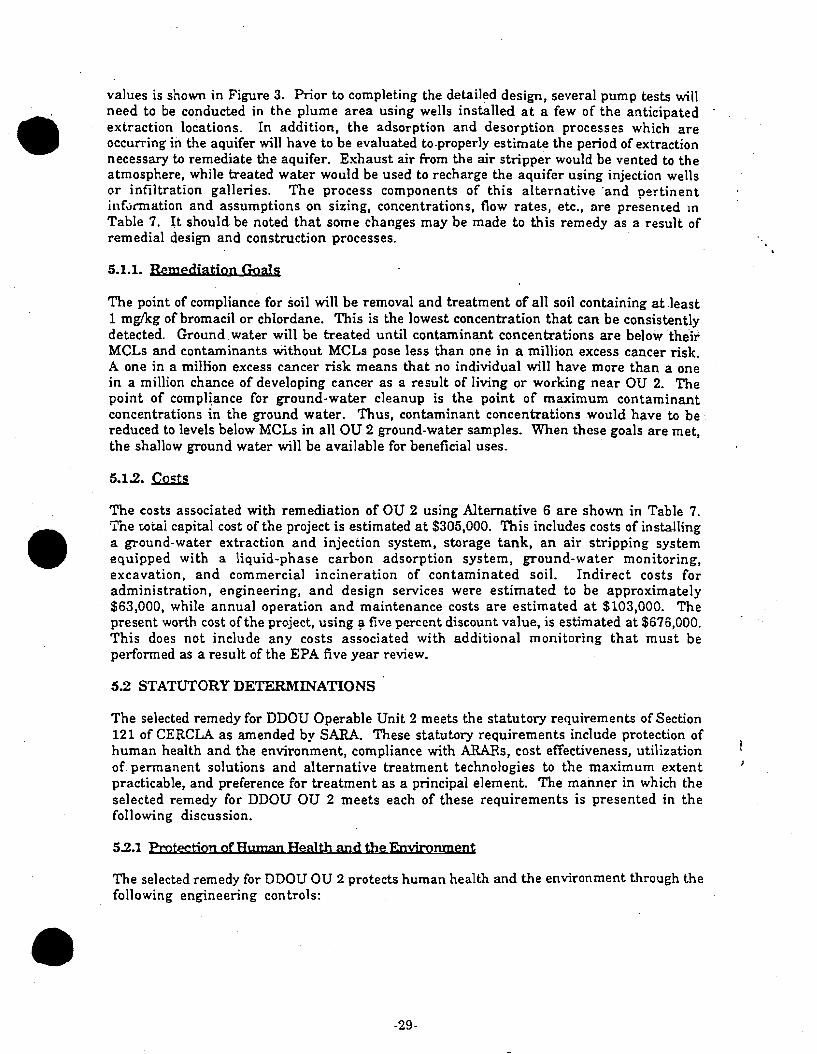
values is shown in Figure 3. Prior to completing the detailed design, several pump tests will need to be conducted in the plume area using wells installed a t a few of the anticipated - extraction locations. In addition, the adsorption and desorption processes which are occurring in the aquifer will have to be evaluated to.properly estimate the period of extraction necessary to remediate the aquifer. Exhaust air from the air stripper would be vented to the atmosphere, while treated water would be used to recharge the aquifer using injection wells or infiltration galleries. The process components of this alternative 'and pertinent inf\innation and assumptions on sizing, concentrations, flow rates, etc., are presenred in Table 7. It should be noted that some changes may be made to this remedy as a result of remedial design and construction processes.
The point of compliance for soil will be removal and treatment of all soil containing at least 1 mgkg of bromacil or chlordane. This is the lowest concentration that can be consistently detected. Ground water will be treated until contaminant concentrations are below their MCLs and contaminants without MCLs pose less than one in a million excess cancer risk. A one in a million excess cancer risk means that no individual will have more than a one in a million chance of developing cancer as a result of living or working near OU 2. The point of compli,ance for ground-water cleanup is the point of maximum contaminant concentrations in the ground water. Thus, contaminant concentrations would have to be reduced to levels below MCLs in all OU 2 ground-water samples. When these goals are met, the shallow ground water will be available for beneficial uses.
The costs associated with remediation of OU 2 using Alternative 6 are shown in Table 7. 'ine t ok i capitai cost of the project is estimated at $305,000. This includes costs of installing a ground-water extraction and injection system, storage tank, a n air stripping system equipped with a liquid-phase carbon adsorption system, ground-water monitoring, excavation, and commercial incineration of contaminated soil. Indirect costs for administration, engineering, and design services were estimated to be approximately $63,000, while annual operation and maintenance costs are estimated a t $103,000. The present worth cost of the project, using a five percent discount value, is estimated a t $676,000. This does not include any costs associated with additional monitoring tha t must be performed as a result of the EPA five year review.
5 2 STATUTORY DETERMINATIONS
The selected remedy for DDOU Operable Unit 2 meets the statutory requirements of Section 121 of CERCLA as amended by SARA. These statutory requirements include protection of human health and the environment, compliance with ARARs, cost effectiveness, utilization 1 of permanent solutions and alternative treatment technologies to the maximum extent I
practicable, and preference for treatment as a principal element. The manner in which the selected remedy for DDOU OU 2 meets each of these requirements is presented in the following discussion.
tection of Human Health and the Environment
The selected remedy for DDOU OU 2 protects human health and the environment through the following engineering controls:
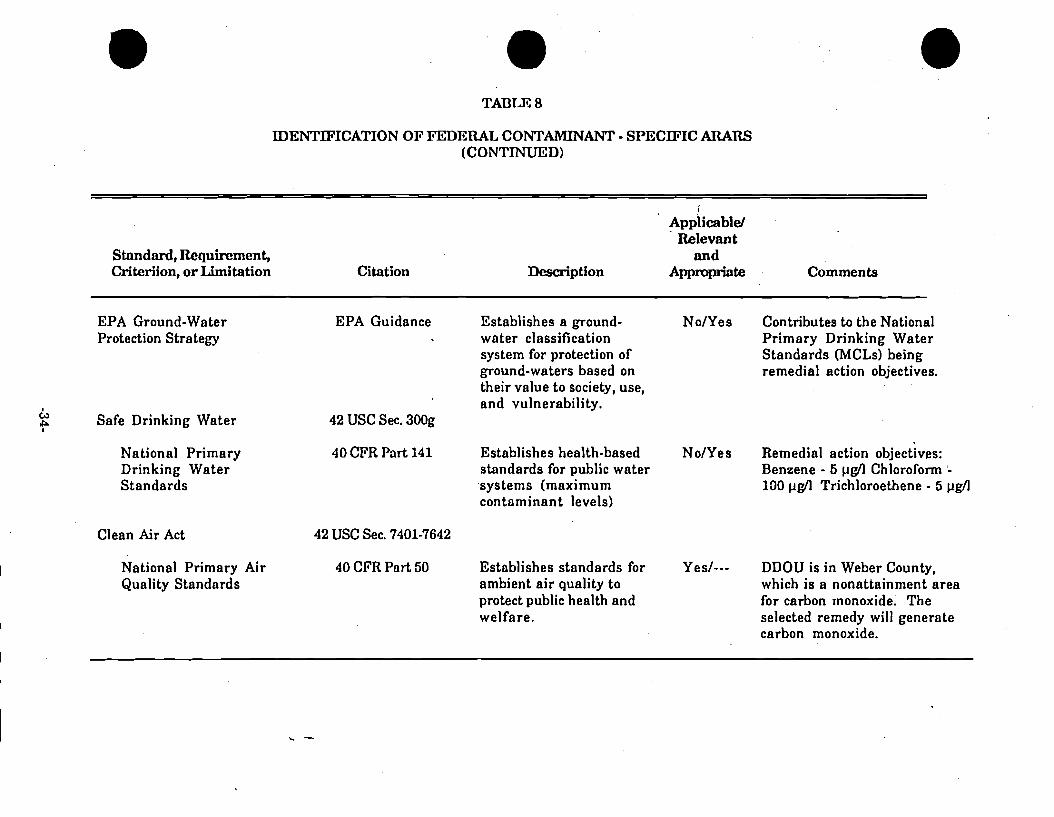
IDENTXF'ICATION OF FEDERAL CONTAMINANT - SPECIFIC ARARS (CONTINUED)
Standard, Requirement, Crikriion, or Limitation Citation
1
Applicable1 Relevant
m d Description Appmprinte Comments
EPA Ground-Water Protection Strategy
G Ip Safe Drinking Water
National Primary Drinking Water Standards
Clean Air Act
National Primary Air Quality Standards
EPA Guidance Establishes a ground- water classification system for protection of ground-waters based on their value to society, use, and vulnerability.
42 USC Sec. 300g
40 CPR Part 141 Establishes health-based standards for public water systems (maximum contaminant levels)
42 USC Sec. 7401-7642
40 CFR Part 50 Establishes standards for ambient a i r quality to protect public health and welfare.
NoIYes Contributes to the National Primary Drinking Water Standards (MCLs) being remedial action objectives.
NolYes Remedial action objectives: Benzene - 6 p d Chloroform - 130 p d Trichloroethene - 5 pgA
Yes/--- DDOU is in Weber County, which is a nonattainment area for carbon monoxide. The selected remedy will generate carbon monoxide.

IDENTIFICATION OF EXDERAL CONTAMINANT - SPECIFIC ARARS
Standard, Requirement, Criterion, or Limitation Citation
Appl i ab l e / . rtelcvant
and Description APPrnPriate
Solid Waste Disposal Act 42 USC Sec. 6901-6987
Standards Applicable to Transporters of Hazardous Waste
dl f"
Standards for Owners and Operators of Hazardous Waste Treatment, Storage, and Disposal Facilities
D.O.T. Hazardous Material Transportation Regulations
Occupational Safety and Health Act
40 CFR Part 263 Establishes standards which apply to persons transporting hazardous. waste within the U.S. if the transportation requires a manifest under 40 CFR Part 262.
40 CFR Part 264 Establishes minimum national standards which define the acceptable management of hazardous waste for owners and operators of facilities which treat, store, or dispose of hazardous waste.
40 CF'R Parts 107,171-177 Regulates transportation of hazardous materials.
20 USC Sec. 651-678 Remlates worker health and safety.
No/Yes Transportation of soil off site.
No/Yes Ground-water treatment' system.
Yes/Yes Transportation of soil off site.
Yes/--- All people involved in implementing the remedy; includes exposure limits to chemicals.
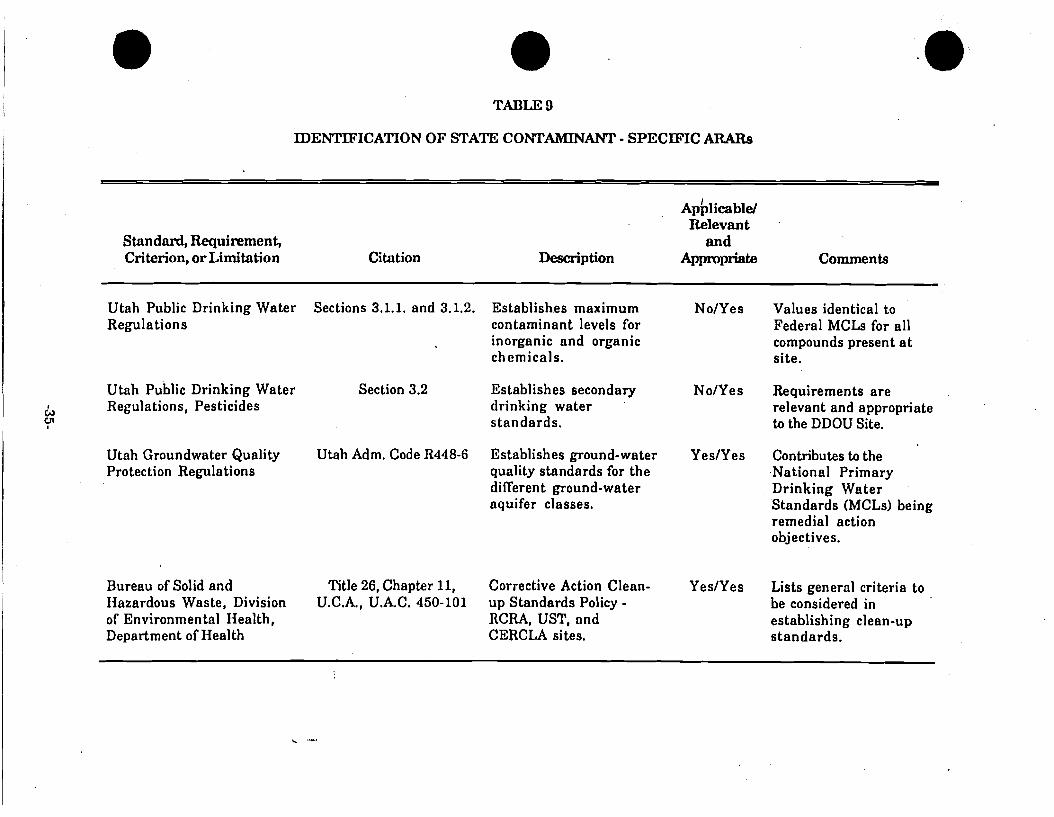
TABLE 9
IDENTIFICATION OF STATE CONTAMINANT - SPECIFIC ARARs
Standard, Requirement, Criterion, or Limitation Citation Description
~ ~ ~ l i c a b l e t Relevant
and &m~liab Comments
Utah Public Drinking Water Sections 3.1.1, and 3.1.2. Establishes maximum NoIYes Values identical to Regulations contaminant levels for Federal MCLs for all
inorganic and organic compounds present a t chemicals. site.
Utah Public Drinking Water Section 3.2 Establishes secondary NoIYes Requirements are t3 Regulations, Pesticides drinking water relevant and appropriate Y standards. to the DDOU Site.
Utah Groundwater Quality Utah Adm. Code R448-6 Establishes ground-water YeslYes Contributes to the Protection Re y l a t i ons quality standards for the National Primary
different ground-water Drinking Water aquifer classes. Standards (MCLs) being
remedial action objectives.
Bureau of Solid and Title 26, Chapter 11, Corrective Action Clean- YeslYes Lists general criteria to Hazardous Waste, Division U.C.A, U.AC. 450-101 up Standards Policy - be considered in of Environmental Health, RCRA, UST, and establishing clean-up Department of Health CERCLA sites. standards.

Defense Distribution Ogden, Utah . - - - - - - - - . --- - -- -- .--
Final
Record of Decision and Responsiveness Summary for Operable Unit 4
August 3, 1992
APPENDIX A -- - SOIL AND GROUND-WATER -. REMEDIATION CRITERIA
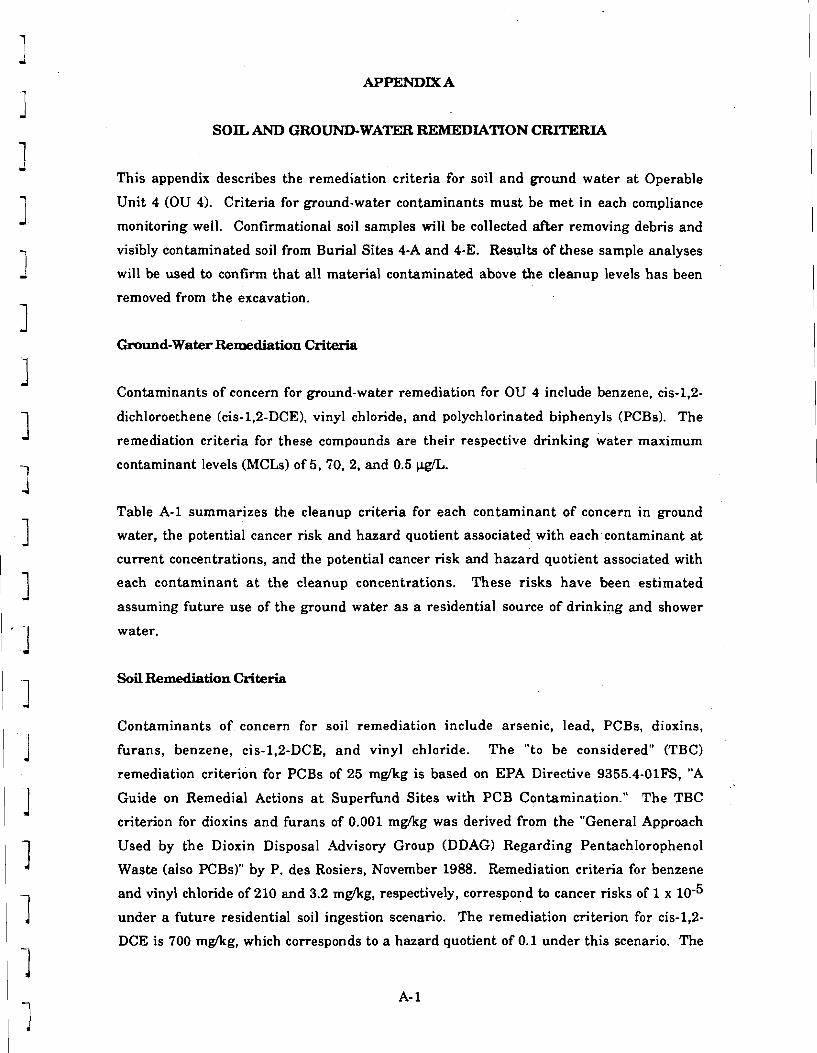
APPENDIX A
SOIL AND GROUND-WATER REMEDIATION CRI'IERIA
This appendix describes the remediation criteria for soil and ground water a t Operable
Unit 4 (OU 4). Criteria for ground-water contaminants must be met in each compliance
monitoring well. Confinnational soil samples will be collected after removing debris and
visibly contaminated soil from Burial Sites 4-A and 4-E. Results of these sample analyses
will be used to confirm that all material contaminated above the cleanup levels has been
removed from the excavation.
Ground-Water Remediation Criteria
Contaminants of concern for ground-water remediation for OU 4 include benzene, cis-l,2-
dichloroethene (cis-l,2-DCE), vinyl chloride, and polychlorinated biphenyls (PCBs). The
remediation criteria for these compounds are their respective drinking water maximum
contaminant levels (MCLs) of 5,70, 2, and 0.5 CLg/L.
Table A-1 summarizes the cleanup criteria for each contaminant of concern in ground
water, the potential cancer risk and hazard quotient associated with each contaminant a t
current concentrations, and the potential cancer risk and hazard quotient associated with
each contaminant a t the cleanup concentrations. These risks have been estimated
assuming future use of the ground water a s a residential source of drinking and shower
water.
Soil Remediation Criteria
Contaminants of concern for soil remediation include arsenic, lead, PCBs, dioxins,
furans, benzene, cis-l,2-DCE, and vinyl chloride. The "to be considered" (TBC)
remediation criterion for PCBs of 25 mgkg is based on EPA Directive 9355.4-OlFS, "A
Guide on Remedial Actions a t Superfund Sites with PCB Contamination." The TBC
criterion for dioxins and furans of 0.001 mgkg was derived from the "General Approach
Used by the Dioxin Disposal Advisory Group (DDAG) Regarding Pentachlorophenol
Waste (also PCBs)" by P. des Rosiers, November 1988. Remediation criteria for benzene
and vinyl chloride of 210 and 3.2 mg/kg, respectively, correspond to cancer risks of 1 x
under a future residential soil ingestion scenario. The remediation criterion for cis-1,2-
DCE is 700 mg/kg, which corresponds to a hazard quotient of 0.1 under this scenario. The
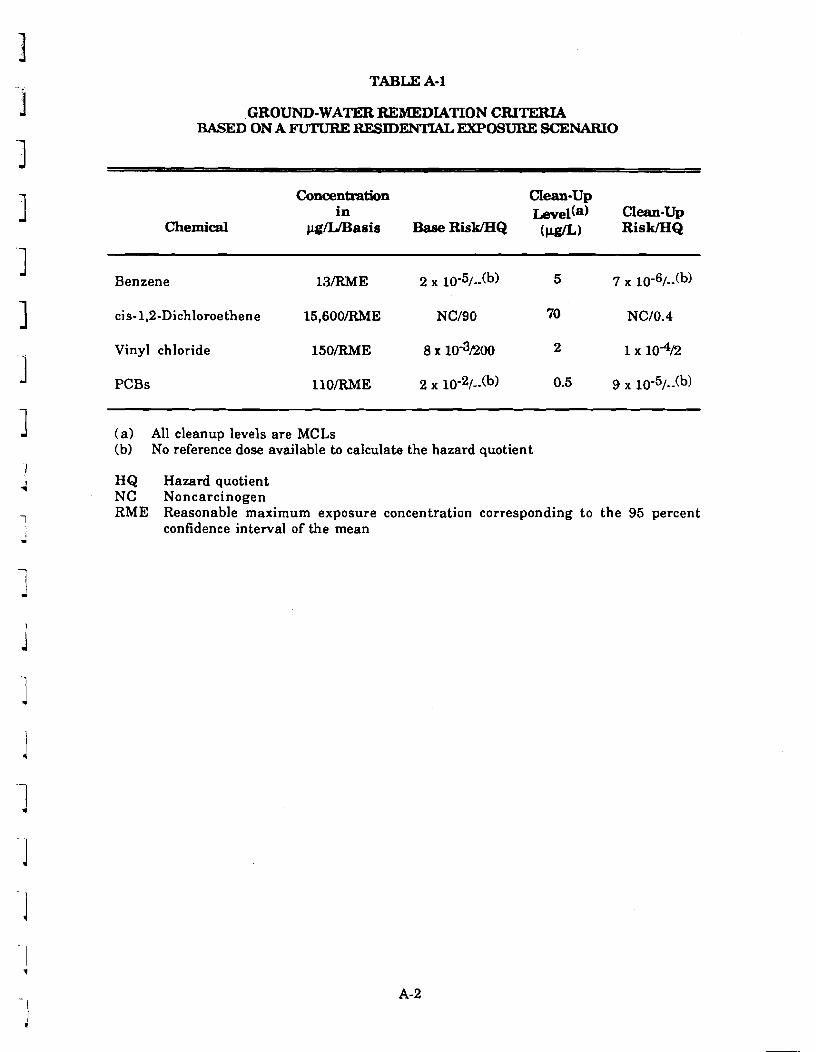
TABLE A-1
GROUND-WATER REMEDIATION CRTTERIA BASED ON A FUTURE R E s r n m r u EXPOSURE SCEWO
Concentration CIean-Up in bvel(a) Clean-Up
Chemical pg/WBasis Base Risk/HQ ( P ~ / L ) RisWHQ
Benzene
cis- 1.2-Dichloroethene 15,60O/RME NC190 70 NClO.4
Vinyl chloride 150/RME 8 10-~1200 2 1 1 0 ~ ~ 2
PCBs 1 lO/RME 2 10-2/,-(b) 0.5 9 x 10⁻⁵/--(b)
( a ) All cleanup levels are MCLs (b) No reference dose available to calculate the hazard quotient
HQ Hazard quotient NC Noncarcinogen RME Reasonable maximum exposure concentration corresponding to the 95 percent
confidence interval of the mean
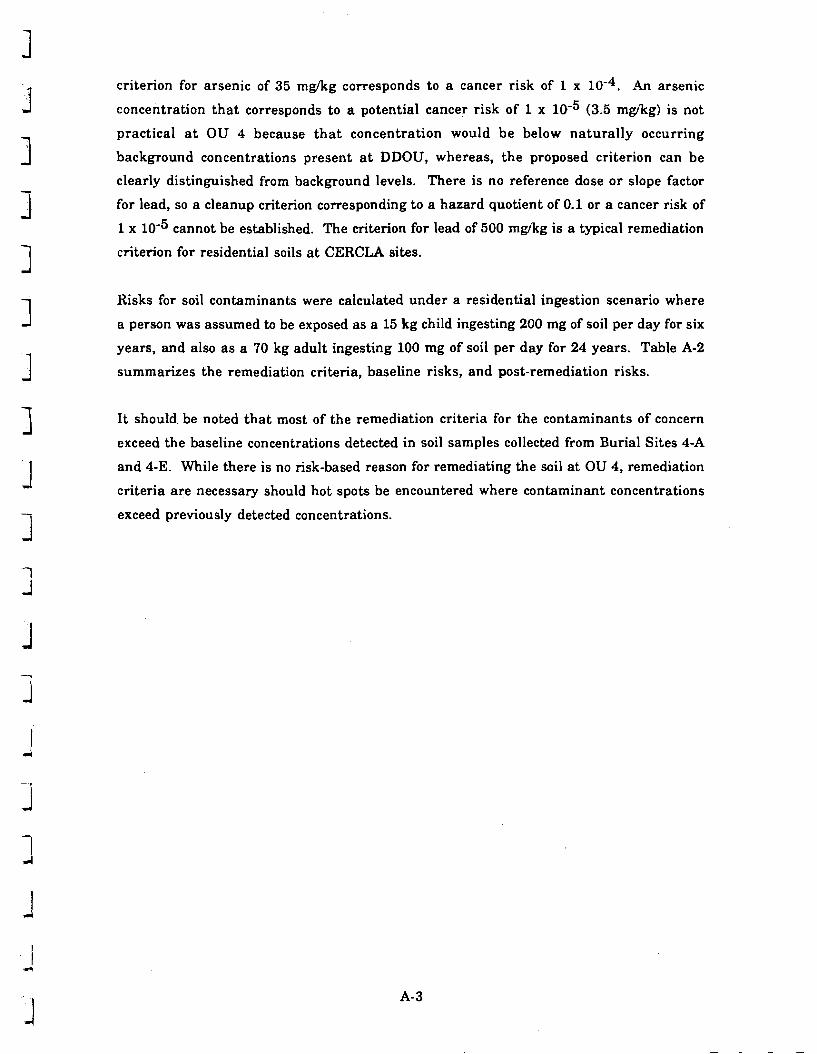
criterion for arsenic of 35 m g k g corresponds to a cancer risk of 1 x lo-*. An arsenic
concentration tha t corresponds to a potential cancer risk of 1 x 1W5 (3.5 mgkg) is not
practical at OU 4 because t ha t concentration would be below naturally occurring
background concentrations present at DDOU, whereas, the proposed criterion can be
clearly distinguished from background levels. There is no reference dose or slope factor
for lead, so a cleanup criterion corresponding to a hazard quotient of 0.1 or a cancer risk of
1 x cannot be established. The criterion for lead of 500 mgkg is a typical remediation
criterion for residential soils a t CERCLA sites.
Risks for soil contaminants were calculated under a residential ingestion scenario where
a person was assumed to be exposed as a 15 kg child ingesting 200 mg of soil per day for six
years, and also as a 70 kg adult ingesting 100 mg of soil per day for 24 years. Table A-2
summarizes the remediation criteria, baseline risks, and post-remediation risks.
I t should be noted tha t most of the remediation criteria for the contaminants of concern
exceed the baseline concentrations detected in soil samples collected from Burial Sites 4-A
and 4-E. While there is no risk-based reason for remediating the soil at OU 4, remediation
criteria are necessary should hot spots be encountered where contaminant concentrations
exceed previously detected concentrations.
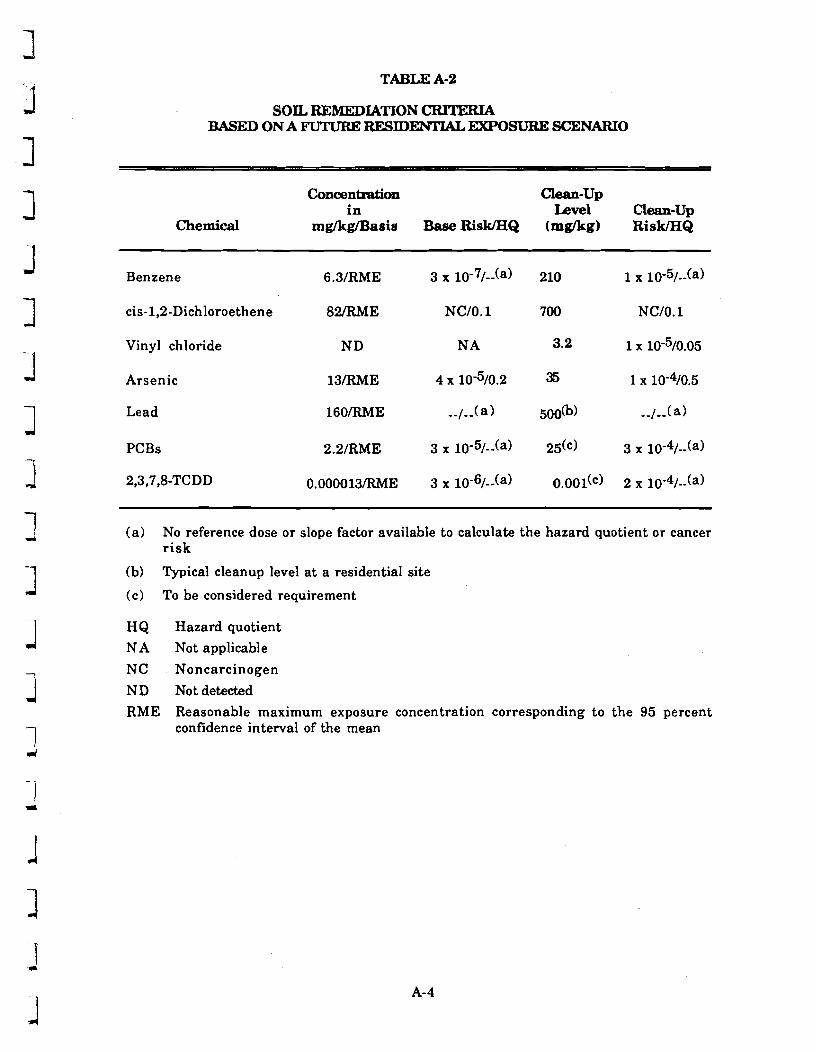
TABLE A-2
SOIL REMEDIATION ClUTERU BASED ON A FUTLTRE RESIDENTIAL EXPOSURE SCENARIO
Concentration Clean-Up in bvel Clean-Up
Chemical mgfAcgfBasis Base RisWHQ (mg/kg) RisMHQ
Benzene 6.3lRME 3 l ~ - ~ l - - ( a ) 210 1 10-5/--(a)
cis-1,2-Dichloroethene 82/RME NCIO. 1 700 NCIO. 1
Vinyl chloride ND NA 3.2 1 x 10-~10.05
Arsenic 13/RME 4 x 10-510.2 35 1 x 10-~/0.5
Lead 16O/RME --I--( a 1 500(~) --/--(a)
PCBs 2.2lRME 3 10-5/--(a) 25(c) 3 10-4/--(a)
2,3,7,8-TCDD 0.000013/RME 3 x 10-~1-- (~) 0.001(~) 2 x l ~ - ~ / - - ( a )
(a ) No reference dose or slope factor available to calculate the hazard quotient or cancer r isk
(b) Typical cleanup level a t a residential site
(c) To be considered requirement
HQ Hazard quotient
N A Not applicable
NC Noncarcinogen
ND Not detected
RME Reasonable maximum exposure concentration corresponding to the 95 percent confidence interval of the mean
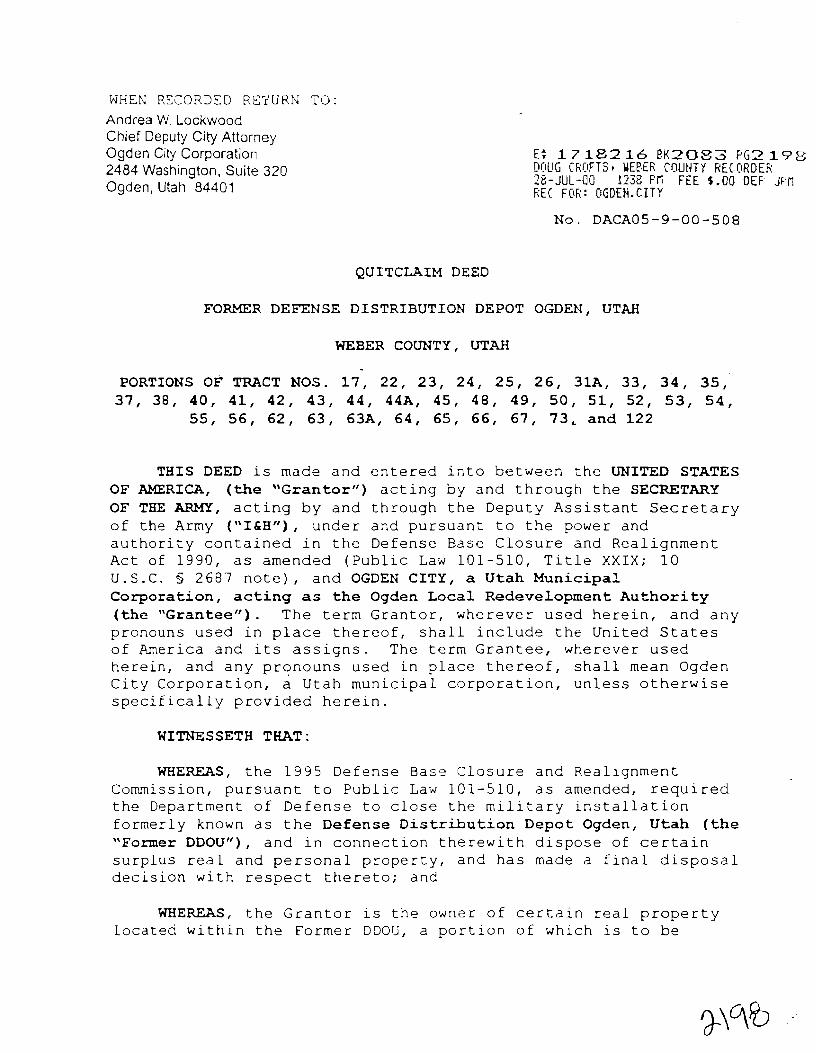
WZEN RSCORDED RETURN TO Andrea W. Lockwood Chief Deputy City Attorney Ogden City Corporation 2484 Washington, Suite 320 Ogden, Utah 84401
QUITCLAIM DEED
E+ 17 182 16 8K20Z3 P G 2 1 9 E DOUG CFiOFTSr UEBER COUtjTY RECnRDEf? 2-JUL-00 1238 F'ri FEE Q.00 OEF' JPli EEC FOR: OGDEN.CITY
N O . DACA05-9-00-508
FORMER DEFENSE DISTRIBUTION DEPOT OGDEN, UTAH
WEBER COUNTY, UTAH
PORTIONS OF TRACT NOS. 1 7 , 2 2 , 23, 2 4 , 25, 2 6 , 31A, 33, 3 4 , 35, 3 7 , 3 8 , 4 0 , 4 1 , 4 2 , 4 3 , 4 4 , 44A, 4 5 , 4 8 , 4 9 , 5 0 , 51, 5 2 , 53, 5 4 ,
55, 5 6 , 6 2 , 63, 63A, 6 4 , 6 5 , 6 6 , 6 7 , 73, a n d 1 2 2
THIS DEED i s m a d e a n d e n t e r e d i n t o b e t w e e n t h e UNITED STATES OF AMERICA, (the " G r a n t o r " ) a c t i n g b y a n d t h r o u g h t h e SECRETARY OF THE ARMY, a c t i n g b y a n d t h r o u g h t h e D e p u t y A s s i s t a n t S e c r e t a r y o f t h e Army ("ILH") , u n d e r a n d p u r s u a n t t o t h e p o w e r a n d a u t h o r i t y c o n t a i n e d i n t h e D e f e n s e B a s e C l o s u r e a n d R e a l i g n m e n t A c t o f 1 9 9 0 , a s a m e n d e d ( P u b l i c Law 1 0 1 - 5 1 0 , T i t l e X X I X ; 1 0 U . S . C . 5 2687 n o t e ) , a n d OGDEN CITY, a U t a h M u n i c i p a l C o r p o r a t i o n , a c t i n g as t h e O g d e n L o c a l R e d e v e l o p m e n t A u t h o r i t y ( t h e " G r a n t e e " ) . T h e t e r m G r a n t o r , w h e r e v e r u s e d h e r e i n , a n d a n y p r o n o u n s u s e d i n p l a c e t h e r e o f , s h a l l i n c l u d e t h e U n i t e d S t a t e s o f A m e r i c a a n d i t s a s s i g n s . T h e t e r m G r a n t e e , w h e r e v e r u s e d h e r e i n , a n d a n y p r o n o u n s u s e d i n p l a c e t h e r e o f , s h a l l m e a n O g d e n C i t y C o r p o r a t i o n , a U t a h m u n i c i p a l c o r p o r a t i o n , u n l e s s o t h e r w i s e s p e c i f i c a l l y p r o v i d e d h e r e i n .
WITNESSETH THAT:
WHEREAS, t h e 1 9 9 5 D e f e n s e Base C l o s u r e a n d R e a l i g n m e n t C o m m i s s i o n , p u r s u a n t t o P u b l i c Law 1 0 1 - 5 1 0 , a s a m e n d e d , r e q u i r e d t h e D e p a r t m e n t o f D e f e n s e t o c l o s e t h e m i l i t a r y i n s t a l l a t i o n f o r m e r l y known a s t h e D e f e n s e D i s t r i b u t i o n D e p o t O g d e n , U t a h ( t h e "Fo rmer DDOU"), a n d i n c o n n e c t i o n t h e r e w i t h d i s p o s e o f c e r t a i n s u r p l u s r e a l a n d p e r s o n a l p r o p e r t y , a n d h a s made a f i n a l d i s p o s a l d e c i s i o n w i t h r e s p e c t t h e r e t o ; a n d
WHEREAS, t h e G r a n t o r i s t h e o w n e r o f c e r t a i n r e a l p r o p e r t y l o c a t e d w i t h i n t h e F o r m e r DDOU, a p o r t i o n o f w h i c h i s t o be


Appendix
Comments received from Support Agencies.
Comments on DDHU 3rd 5-Yr Review by J
Comments on DDHU 3rd 5-Yr Review from
----- Forwarded by Jim Kiefer/EPR/R8/USEPA/US on 06/11/2007 09:50 AM ----- Monica McEaddy/DC/USEPA /US To Jim Kiefer/EPR/R8/USEPA/US@EPA 06/11/2007 09:41 cc AM Aimee Storm/DC/USEPA/US@EPA, Emily Johnson/DC/USEPA/US@EPA, Charles Sands/DC/USEPA/US@EPA Subject Re: DDOU 5-yr review(Document link: Jim Kiefer) Jim, I have read the report and have a few comments. Like you, I thought the report was written well. The report followed the 2001 Comprehensive Guidance. My overall concern is the protective statement written for OU 4 groundwater treatment. Based on the report, it appears that the remedy will not meet the remedial action objective. I do agree that the remedy is protective in the short term is the correct protectiveness statement but I think there is a need for more explanation based on the examples that appear in the 2001 Comprehensive Five-Year Review Guidance. Please refer to page 4-16 through pages 4-18. Some of the milestone dates that appear on pages 47 and 48 are in the past, last January. These dates should be updated if the follow-up action has not occurred. Please ensure that the follow-up actions are included in CERCLIS once the report is finalized. The cost data for O & M activities and the cleanup activities is very helpful. Somehow, I think this information needs to be captured. Monica L. McEaddy Chemical Engineer Federal Facilities Restoration and Reuse Office, OSWER Environmental Protection Agency (703)603-0044 Fax: (703) 603-0043 Classification: UNCLASSIFIED Caveats: NONE