sixth five year review report
TRANSCRIPT
SIXTH FIVE-YEAR REVIEW REPORT FOR
HAVERTOWN PCP SUPERFUND SITE DELAWARE COUNTY, PENNSYLVANIA
SEPTEMBER 2020
Prepared by
U.S. Environmental Protection Agency Region 3
Philadelphia, Pennsylvania
--------------------------------- ----------------------------------- Paul Leonard, Director Date Superfund and Emergency Management Division U.S. EPA, Region 3
1
Table of Contents LIST OF ABBREVIATIONS AND ACRONYMS ...................................................................................................2 I. INTRODUCTION...................................................................................................................................................4
Site Background .....................................................................................................................................................4 FIVE-YEAR REVIEW SUMMARY FORM ........................................................................................................5
II. RESPONSE ACTION SUMMARY ......................................................................................................................7 Basis for Taking Action .........................................................................................................................................7 Response Actions ...................................................................................................................................................7 Status of Implementation .....................................................................................................................................14 Systems Operations/Operation and Maintenance (O&M) ...................................................................................23
III. PROGRESS SINCE THE PREVIOUS REVIEW ..............................................................................................23 IV. FIVE-YEAR REVIEW PROCESS ....................................................................................................................25
Community Notification, Community Involvement and Site Interviews ............................................................25 Data Review .........................................................................................................................................................27 Site Inspection ......................................................................................................................................................29
V. TECHNICAL ASSESSMENT ............................................................................................................................29 QUESTION A: Is the remedy functioning as intended by the decision documents? .........................................29 QUESTION B: Are the exposure assumptions, toxicity data, cleanup levels and RAOs used at the time of the remedy selection still valid? .................................................................................................................................31 QUESTION C: Has any other information come to light that could call into question the protectiveness of the remedy? ................................................................................................................................................................31
VI. ISSUES/RECOMMENDATIONS .....................................................................................................................32 OTHER FINDING ...............................................................................................................................................33
VII. PROTECTIVENESS STATEMENT ................................................................................................................33 VIII. NEXT REVIEW ..............................................................................................................................................34 APPENDIX A – REFERENCE LIST ................................................................................................................... A-1 APPENDIX B – SITE CHRONOLOGY ...............................................................................................................B-1 APPENDIX C – ENVIRONMENTAL COVENANT ...........................................................................................C-1 APPENDIX D – PRESS NOTICE ........................................................................................................................ D-1 APPENDIX E – SITE INSPECTION CHECKLIST ............................................................................................. E-1 APPENDIX F – SITE INSPECTION PHOTOS .................................................................................................... F-1 APPENDIX G – DETAILED DATA REVIEW ................................................................................................... G-1 APPENDIX H – DATA REVIEW TABLES AND FIGURES............................................................................. H-1 APPENDIX I – DETAILED ARAR REVIEW TABLES ....................................................................................... I-1 APPENDIX J – SCREENING-LEVEL RISK REVIEW ........................................................................................ J-1
2
LIST OF ABBREVIATIONS AND ACRONYMS AM Action Memorandum AOC Administrative Order for Access and Removal ARAR Applicable or Relevant and Appropriate Requirement BMI Benthic Macroinvertebrate BTAG Biological Technical Assistance Group CERCLA Comprehensive Environmental Response, Compensation, and Liability Act CFR Code of Federal Regulations CIC Community Involvement Coordinator COC Contaminant of Concern CTR Collection Trench EAC Environmental Advisory Committee EPA United States Environmental Protection Agency FS Feasibility Study FYR Five-Year Review GAC Granular Activated Carbon GWTP Groundwater Treatment Plant HI Hazard Index HQ Hazard Quotient IC Institutional Control ICIAP Institutional Control Implementation and Assurance Plan ISCO In Situ Chemical Oxidizers IW Injection Well LNAPL Light Non-Aqueous Phase Liquid MCL Maximum Contaminant Level µg/kg Micrograms per Kilogram µg/L Micrograms per Liter mg/kg Milligrams per Kilogram mg/L Milligrams per Liter MIS Multi-Increment® Sample NCP National Contingency Plan NPDES National Pollutant Discharge Elimination System NPL National Priorities List NWP National Wood Preservers O&M Operation and Maintenance OU Operable Unit OSC On-Scene Coordinator PAH Polynuclear Aromatic Hydrocarbon PADEP Pennsylvania Department of Environmental Protection PADER Pennsylvania Department of Environmental Resources PCG Philadelphia Chewing Gum, Inc. PCP Pentachlorophenol pg/L Picogram per Liter RAO Remedial Action Objective RI Remedial Investigation RGO Remedial Goal Objective RML Removal Management Levels ROD Record of Decision ROS Recreation and Open Space RPM Remedial Project Manager RSE Removal Site Evaluation RSL Regional Screening Level
3
RW Recovery Well SAP Sampling and Analysis Plan SMCL Secondary Maximum Contaminant Level SVOC Semi-Volatile Organic Compound TAL Target Analyte List TCDD Tetrachlorodibenzo-p-dioxin TCE Trichloroethylene TCL Target Compound List TCRA Time-Critical Removal Action TEQ Toxicity Equivalent Quotient USACE U.S. Army Corps of Engineers UU/UE Unlimited Use and Unrestricted Exposure UV/OX Ultraviolet Oxidation VOC Volatile Organic Compound
4
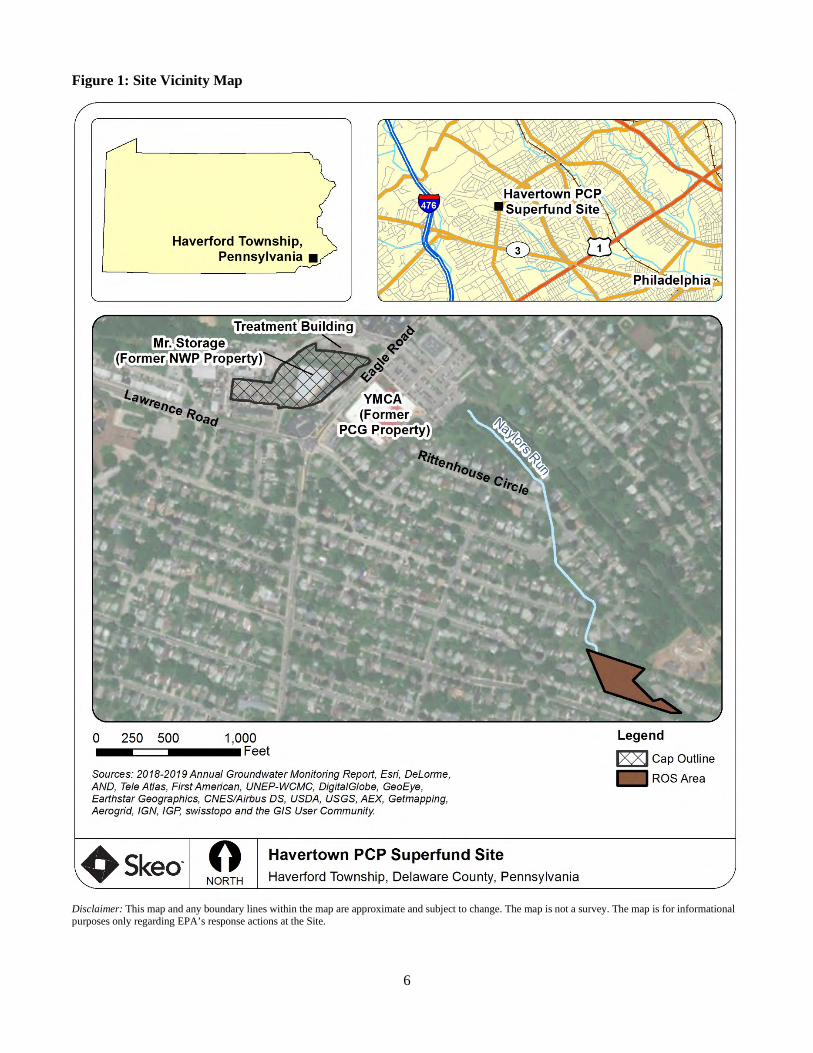
I. INTRODUCTION The purpose of a five-year review (FYR) is to evaluate the implementation and performance of a remedy to determine if the remedy is and will continue to be protective of human health and the environment. The methods, findings and conclusions of reviews are documented in FYR reports such as this one. In addition, FYR reports identify issues found during the review, if any, and document recommendations to address them. The U.S. Environmental Protection Agency (EPA) is preparing this FYR pursuant to the Comprehensive Environmental Response, Compensation, and Liability Act (CERCLA) Section 121, consistent with the National Contingency Plan (NCP) (40 Code of Federal Regulations (CFR) Section 300.430(f)(4)(ii)), and considering EPA policy. This is the sixth FYR for the Havertown PCP Superfund site (the Site). The triggering action for this statutory review is the completion date of the previous FYR. The FYR has been prepared because hazardous substances, pollutants or contaminants remain at the Site above levels that allow for unlimited use and unrestricted exposure (UU/UE). The Site consists of three operable units (OUs), all of which are addressed in this FYR. OU1 is the interim remedial action for on-site soils, storm sewer effluent and drummed waste. OU2 is the interim action for shallow groundwater contamination. OU3 addresses sitewide contaminated groundwater (shallow and deep) and contaminated soils found in the Recreation and Open Space (ROS) area of the Site.1 The EPA remedial project manager (RPM) led the FYR. Additional participants included human health and ecological risk assessors and a hydrogeologist from EPA and Pennsylvania Department of Environmental Protection (PADEP) representatives. Skeo provided EPA contractor support for this FYR. The review began on August 2, 2019. Site Background The approximately 13-acre Site is in Haverford Township, Delaware County, Pennsylvania, about 10 miles west of Philadelphia (Figure 1).2 National Wood Preservers (NWP) operated a wood-treatment facility on the Site from 1947 to 1963. NWP reportedly disposed of waste materials such as diesel-type oil and pentachlorophenol (PCP) into a well located near the corner of Lawrence and Eagle Roads (Figure 1). The exact location of the well has not been identified. Contamination that was released from the NWP property impacted groundwater beneath the adjacent chewing gum manufacturing plant owned by Philadelphia Chewing Gum Company (PCG) and neighboring residential and commercial areas. The Site is located in a mixed-use area with homes, schools, businesses, industry and parks in the immediate area. The Site consists of the former NWP property, the former PCG property, neighboring businesses and homes, the unused ROS area and the associated groundwater contamination. The 3-acre NWP property has been capped and is surrounded on three sides by a fence. In 2015, Mr. Storage constructed a storage facility on a portion of the capped area. Additional construction is planned on the cap. The former PCG facility buildings were demolished in 2012, and a YMCA was constructed on the existing foundation in 2013. Naylors Run flows southeast through the Site and flows into a series of larger streams that drain into the Delaware River about 9 miles southeast of the Site. Groundwater at the Site flows in a southeasterly direction and occurs in two major zones. The upper zone consists
1 EPA intended the OU2 remedy as an interim remedy for shallow groundwater. In 2008, EPA incorporated the OU2 remedy into the OU3 remedy to address all contaminated groundwater (shallow and deep) as well as soil in the (then) newly discovered ROS area. 2 The Site covers approximately 12 to 15 acres and is roughly delineated by Lawrence Road and Rittenhouse Circle to the south, the former Penn Central Railroad tracks to the north, the fence on the Continental Motors property to the west, and Naylors Run to the east.
5
of surficial soils and saprolite (heavily weathered rock). The lower zone consists of fractured schist bedrock, with water movement occurring along interconnected fractures. Upward flow occurs within the saturated upper zone and presumably provides seepage/base flow to Naylors Run. These two permeable zones are closely interconnected and form one aquifer. Semi-confining layers may locally reduce aquifer interconnection but are not widespread. Potable water in the vicinity of the Site is supplied by the public water supply. There are no groundwater wells within a 1‐mile radius of the Site. The nearest known groundwater supply well is located more than a mile north and west of the Site, which is upgradient of the source area. Refer to Appendix A for additional resources and to Appendix B for the Site’s chronology of events. FIVE-YEAR REVIEW SUMMARY FORM
SITE IDENTIFICATION
Site Name: Havertown PCP
EPA ID: PAD002338010
Region: 3 State: PA City/County: Haverford/ Delaware
SITE STATUS
NPL Status: Final
Multiple OUs? Yes
Has the Site achieved construction completion? Yes
REVIEW STATUS
Lead agency: EPA
Author name: Josh Barber, with additional support provided by Skeo
Author affiliation: EPA Region 3
Review period: 8/2/2019 – 9/28/2020
Date of site inspection: 10/29/2019
Type of review: Statutory
Review number: 6
Triggering action date: 9/28/2015
Due date (five years after triggering action date): 9/28/2020
6
Figure 1: Site Vicinity Map
Disclaimer: This map and any boundary lines within the map are approximate and subject to change. The map is not a survey. The map is for informational purposes only regarding EPA’s response actions at the Site.
7
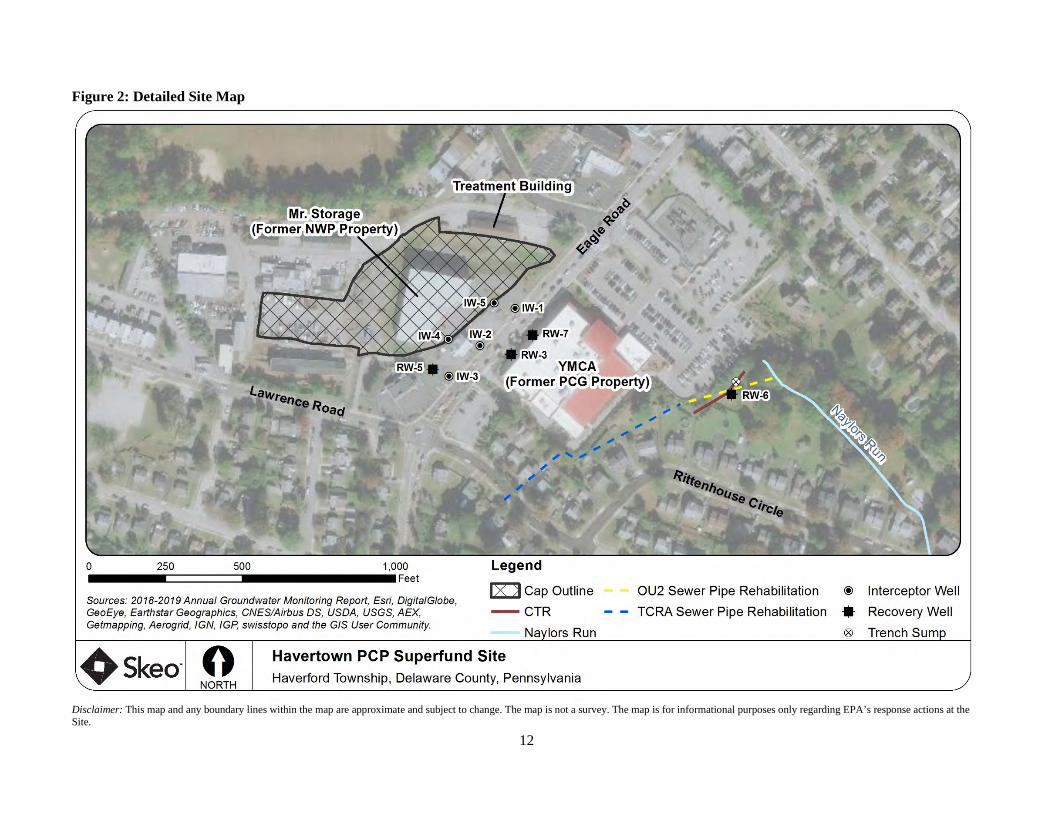
II. RESPONSE ACTION SUMMARY Basis for Taking Action In 1962, the Pennsylvania Department of Health discovered contamination in Naylors Run and attributed it to NWP waste disposal practices. In the early 1970s, the Pennsylvania Department of Environmental Resources (PADER, now PADEP), received complaints from local residents concerning an oily substance discharging into Naylors Run. PADER investigated and identified contaminated groundwater discharging from a 24-inch storm sewer into Naylors Run, just east of the former PCG property (Figure 2). In 1972, PADER and the Pennsylvania Department of Transportation detected PCP and fuel oil in groundwater samples collected from a well on the NWP facility. In September 1983, EPA listed the Site on the Superfund program’s National Priorities List (NPL). The OU1 remedial investigation/feasibility study (RI/FS) identified elevated current cancer risks associated with ingestion of on-site soils and sediments and liquid from the storm sewer outfall drain. The OU2 RI/FS identified elevated cancer and non-cancer risks under hypothetical future residential use of groundwater scenarios due to polynuclear aromatic hydrocarbons (PAHs), PCP and dioxin.3 The OU3 RI/FS identified elevated cancer and non-cancer risks associated with hypothetical future exposure to groundwater and current exposure to soil, dust and vapor in the ROS area. No contaminants of concern (COCs) were identified in surface water or sediment during the OU3 RI/FS. The primary COCs at the Site are volatile organic compounds (VOCs), PCP, PAHs and dioxins/furans. Response Actions In 1972, PADER directed NWP and the property owner to conduct a cleanup; however, it was never done. EPA and PADER performed multiple remedial and response actions in 1976. EPA subsequently performed a removal action under Section 311 of the Clean Water Act. Cleanup activities occurred in two phases. Phase 1 established containment operations at Naylors Run. EPA installed filter fences downstream of the outfall of the 24-inch storm sewer pipe to remove PCP-contaminated oil from the surface water. During phase 2, EPA sealed a 12-inch sanitary sewer; however, contaminated groundwater was still discharging from the 24-inch storm sewer pipe. In 1982, EPA ended containment operations in Naylors Run, when NWP agreed to maintain in-stream treatment measures pursuant to a consent agreement with EPA. However, subsequent inspections found NWP was not properly maintaining the filter fences. In 1988, EPA’s Emergency Response Team installed a catch basin in Naylors Run to trap the discharge from the 24-inch storm pipe. During the OU3 RI/FS, EPA was informed by a resident that an abandoned sewer line manhole was located in his yard. EPA investigated and discovered a previously unknown abandoned sanitary sewer line, which traveled from the source area of the Site to the ROS area. EPA determined that the abandoned sewer line transported contaminated groundwater from the source area to the ROS area. In May 2004, EPA sealed the abandoned sanitary sewer line, which eliminated the flow of contaminated groundwater to the ROS area. EPA has issued three Records of Decision (RODs) for the Site. The 1989 OU1 ROD and the 1991 OU2 ROD were interim remedial actions. In 2008, EPA incorporated the OU2 remedy into the OU3 remedy in the 2008 OU3 ROD to address all contaminated groundwater as well as contaminated soil in the ROS area. The specific details for each ROD and the components for each remedial action are provided below.
3 The OU2 RI/FS also identified four contaminants (benzene, flouranthene, trichloroethylene and vinyl chloride) that were found in monitoring wells at the Site but are known to not have been used during the wood-treatment process at the NWP facility. These contaminants are thought to originate from sources upgradient of the Site.
8
OU1 EPA issued the first ROD for the Site in September 1989. It identified interim remedies for on-site soil, storm sewer effluent and drummed waste and the continued release of contaminants to Naylors Run. The ROD selected the following remedial action objectives (RAOs):
• On-site soils o Prevent wind entrainment of, and access to, the contaminated on-site soils in excess of safe levels.
• Catch basin in Naylors Run o Reduce PCP oil discharge to Naylors Run from the storm sewer to less than 5 milligrams per liter
(mg/L). o Reduce the concentration of benzene and other VOCs measured in Naylors Run by 17%.
• Drummed waste materials o Dispose of all contaminated waste materials properly off site.
The OU1 interim selected remedy consisted of the following elements:
• No action for on‐site soils with a five‐year program for monitoring soils to determine the appropriateness of doing further cleanup actions.
• Installation and operation of an oil/water separator for the storm drain effluent to Naylors Run with continued monitoring.
• Off-site disposal of staged waste material and off-site treatment and disposal of aqueous waste. OU2 In September 1991, EPA signed the OU2 ROD. It selected an interim remedy for shallow aquifer contamination migrating from the Site. The RAOs for shallow groundwater are as follows:
• Design and implement an interim remedial action to protect human health and the environment by removing free product and contaminated groundwater from the shallow groundwater aquifer.
• Collect data on the aquifer and contaminant response to remedial measures. The OU2 interim selected remedy consisted of the following elements:
• Installation of free product recovery wells on the NWP property. • Rehabilitation of the existing storm sewer line to reduce infiltration of contaminants from the
groundwater to the storm sewer. • Installation of a groundwater collection trench (CTR) adjacent to the existing storm sewer line under the
backyards of residential properties to collect groundwater for treatment at a treatment plant. • Installation of a groundwater treatment plant (GWTP) at NWP to fully treat the groundwater prior to
discharge back to Naylors Run. OU3 EPA signed the ROD for OU3 in April 2008. OU3 was subdivided into OU3A (groundwater contamination) and OU3B (ROS area). EPA incorporated the OU2 remedy into the OU3 remedy to address all contaminated groundwater as well as soil in the ROS area. The RAOs for the 2008 OU3 ROD are as follows: Groundwater
• Mitigate contamination to Applicable or Relevant and Appropriate Requirements (ARARs) and/or risk‐based cleanup levels to protect human health and the environment.
• Discharge treated groundwater to the surface water (Naylors Run) in concentrations that meet National Pollutant Discharge Elimination System (NPDES) requirements.
• Prevent exposure to contaminated groundwater in the future.
9
• Prevent discharge of groundwater to surface water at concentrations of contaminants that would result in exceedances of water quality criteria.
• Contain the contamination plume in the source area and the ROS area to prevent further off‐site migration and to ensure that downgradient groundwater is not impacted.
• Restore groundwater quality at the Site. ROS Area Soil
• Eliminate current exposure of human and ecological receptors to contaminated soils. • Prevent further migration of contaminants in soil to groundwater. • Prevent transport of contaminants in surface soils via surface water runoff. • Prevent potential future exposure to contaminants through ingestion and dermal contact by human and
ecological receptors. The remedial action chosen to meet these RAOs consisted of the following elements:
• Installation of a deep groundwater recovery well and associated piping to enhance performance of the groundwater remediation system.
• Continued operation and maintenance of the existing groundwater treatment facility with upgrades to increase the capacity of the facility to process 60 to 70 gallons of contaminated water per minute.
• Treatment of collected groundwater as necessary to meet discharge requirements. • In situ flushing in the source area, with treated water from the groundwater treatment facility mixed with
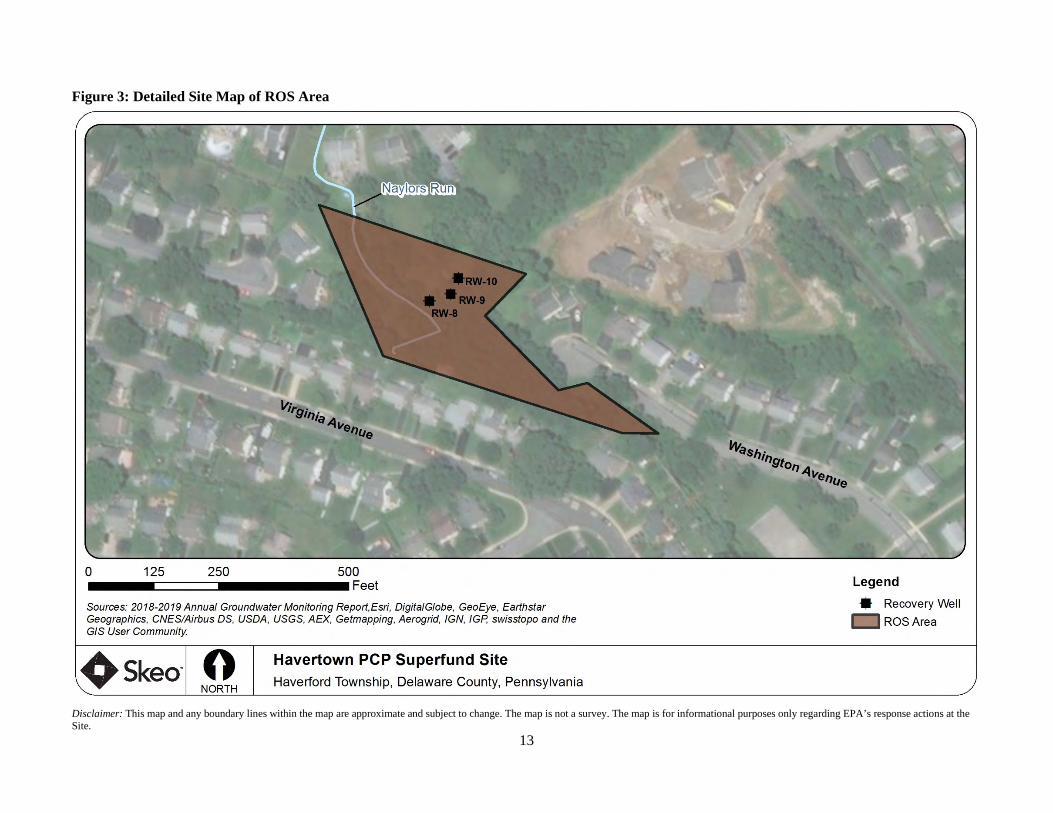
an emulsifier to enhance mobilization of the principal threat waste. • Excavation and restoration of an area approximately 50 feet by 50 feet around wells RW‐8 and RW‐9 in
the ROS area (Figure 3) and a narrow zone along the abandoned sewer line about 200 feet long and 20 feet wide. Disposal of material off site.
• Installation of three groundwater recovery wells and associated piping in the ROS area to extract groundwater and transport it to the Site’s groundwater treatment facility for remediation.
• Demonstration of the recovery of benthic macroinvertebrate and fish communities via an ecological monitoring program.
• Groundwater monitoring. • Implementation of institutional controls (ICs) to protect the integrity of the remedy and to prevent the
installation of groundwater wells, through groundwater use restrictions and notices for the Site and surrounding area (as appropriate). An IC Implementation and Assurance Plan (ICIAP) will be developed for the Site during the remedial design to ensure appropriate ICs are drafted, implemented and monitored.
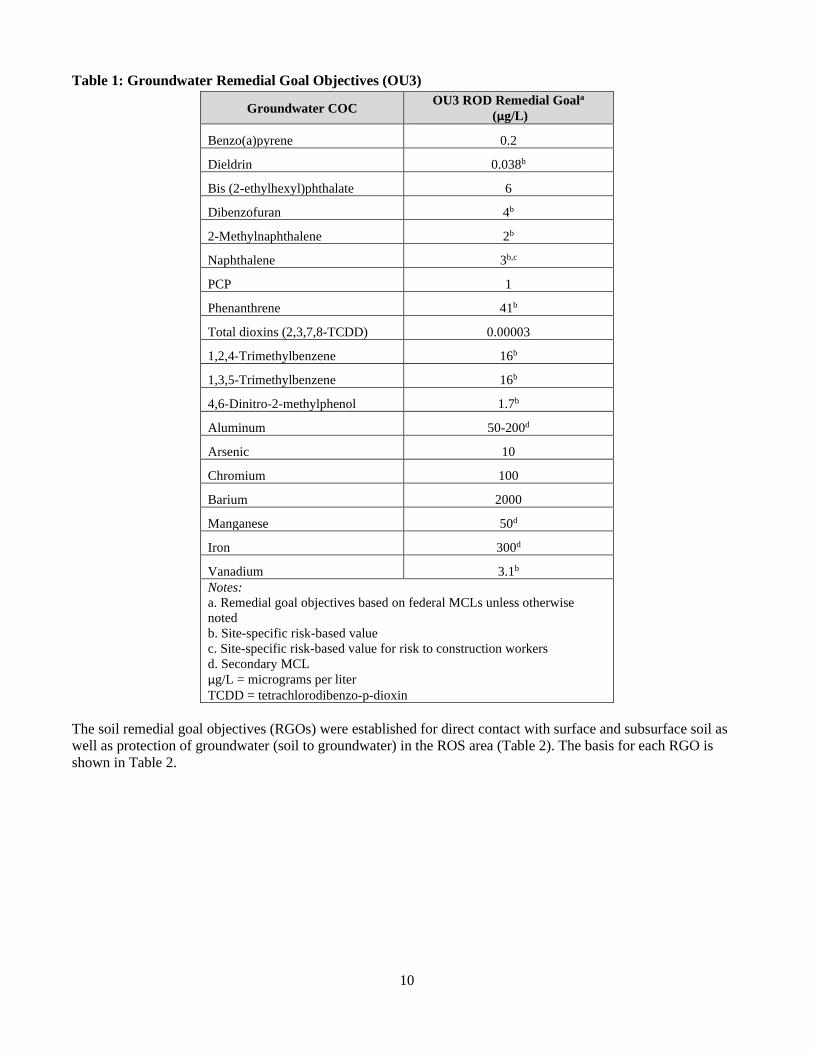
The OU3 ROD stated that remediation of the groundwater at the Site will continue until the maximum contaminant levels (MCLs) or site-specific risk-based criteria are attained. Because groundwater that meets the MCLs or site-specific risk-based levels for individual contaminants may not meet the cumulative risk standards specified by EPA if multiple contaminants are present, EPA’s determination regarding the attainment of treatment objectives will be based on an assessment of the cumulative risk following the achievement of the preliminary standards. Table 1 presents the Site’s groundwater cleanup goals.
10
Table 1: Groundwater Remedial Goal Objectives (OU3)
Groundwater COC OU3 ROD Remedial Goala
(µg/L)
Benzo(a)pyrene 0.2
Dieldrin 0.038b
Bis (2-ethylhexyl)phthalate 6
Dibenzofuran 4b
2-Methylnaphthalene 2b
Naphthalene 3b,c
PCP 1
Phenanthrene 41b
Total dioxins (2,3,7,8-TCDD) 0.00003
1,2,4-Trimethylbenzene 16b
1,3,5-Trimethylbenzene 16b
4,6-Dinitro-2-methylphenol 1.7b
Aluminum 50-200d
Arsenic 10
Chromium 100
Barium 2000
Manganese 50d
Iron 300d
Vanadium 3.1b
Notes: a. Remedial goal objectives based on federal MCLs unless otherwise noted b. Site-specific risk-based value c. Site-specific risk-based value for risk to construction workers d. Secondary MCL µg/L = micrograms per liter TCDD = tetrachlorodibenzo-p-dioxin
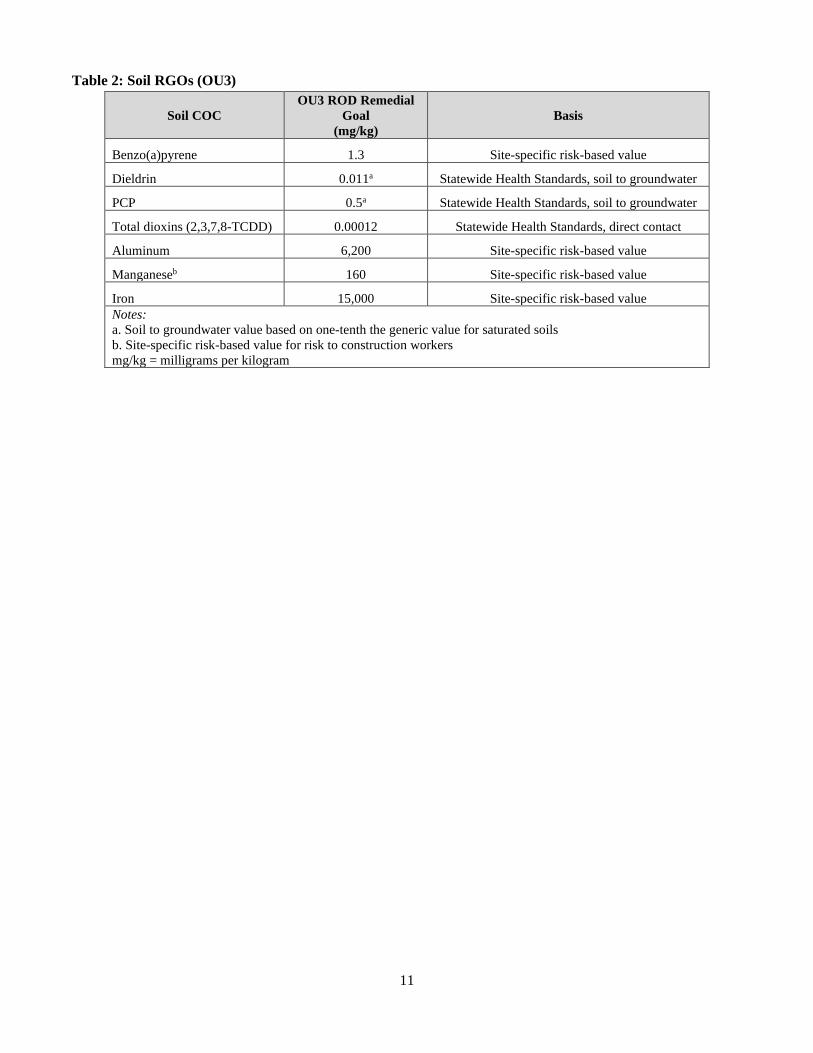
The soil remedial goal objectives (RGOs) were established for direct contact with surface and subsurface soil as well as protection of groundwater (soil to groundwater) in the ROS area (Table 2). The basis for each RGO is shown in Table 2.
11
Table 2: Soil RGOs (OU3)
Soil COC OU3 ROD Remedial
Goal (mg/kg)
Basis
Benzo(a)pyrene 1.3 Site-specific risk-based value
Dieldrin 0.011a Statewide Health Standards, soil to groundwater
PCP 0.5a Statewide Health Standards, soil to groundwater
Total dioxins (2,3,7,8-TCDD) 0.00012 Statewide Health Standards, direct contact
Aluminum 6,200 Site-specific risk-based value
Manganeseb 160 Site-specific risk-based value
Iron 15,000 Site-specific risk-based value Notes: a. Soil to groundwater value based on one-tenth the generic value for saturated soils b. Site-specific risk-based value for risk to construction workers mg/kg = milligrams per kilogram
12
Figure 2: Detailed Site Map
Disclaimer: This map and any boundary lines within the map are approximate and subject to change. The map is not a survey. The map is for informational purposes only regarding EPA’s response actions at the Site.
13
Figure 3: Detailed Site Map of ROS Area
Disclaimer: This map and any boundary lines within the map are approximate and subject to change. The map is not a survey. The map is for informational purposes only regarding EPA’s response actions at the Site.
14
Status of Implementation OU1 The OU1 ROD identified interim remedies for three areas of contamination: on‐site soil, contaminated drums and surface water. The No‐Action alternative for on‐site soils was chosen because at that time the potential threat to the public’s health associated with contaminated dust and infiltration of contaminants into the environment was believed to pose no significant risk to human health. A five‐year monitoring program for the soils was implemented and results were reviewed annually. The soil contamination consisted of arsenic, PCP, PAHs and dioxins. The sampling program was designed to determine if the soils, in their exposed condition, presented a direct contact threat to people working on or crossing the Site. During the monitoring program for soils, EPA identified that the contamination was more extensive than originally determined. Therefore, EPA performed a removal action beginning in 1997 to address the soil contamination. The removal action consisted primarily of the installation of a synthetic geomembrane cap on 3 acres of the former NWP facility. The installation of the cap removed the potential for exposure to soils contaminated with arsenic and dioxins by providing a synthetic geomembrane barrier and a minimum of 18 inches of soil cover over the areas of contamination. In the fall of 1997, EPA covered the capped area with an additional 4 to 10 feet of fill and planted the fill with a mixture of seed, mulch and fertilizer. A self-storage facility as well as vegetated grassy areas currently cover the capped area. A PADEP contractor conducts periodic inspections of the cap to ensure its integrity. In 1991, EPA installed an oil/water separator at the point where contamination was discharging into Naylors Run. During installation of the oil/water separator, EPA disposed of about 12,000 pounds of solid waste and 400 gallons of liquid waste off-site. After installation, the separator was maintained and sampled on a regular basis to ensure that it continued to be effective in reducing the discharge of oil from the storm drain. The unit was removed in 2002, after construction and operation of the OU2 remedy. The selected remedy for cleaning up the contaminated waste staged on site was to landfill the soil and oily debris, as well as off‐site treatment of aqueous waste. In 1993, EPA removed and disposed of about 275 55‐gallon drums of waste, over 4,700 gallons of liquid waste and 100 gallons of sludge. OU2 Phased construction for the OU2 remedy began in 1997, with the treatment building construction and installation of both the free product wells and CTR. The GWTP was fully online in August 2001, with the discharge going to Naylors Run and sampling in accordance with PADEP’s NPDES permit equivalency. At that time, the groundwater extraction and treatment system consisted of free product recovery wells, oil water separator, CTR and an on‐site treatment system. The treatment system consisted of a pre‐treatment system and an organics removal/treatment system. OU3 In November 2008, EPA redesigned the pre‐treatment portion of the groundwater extraction and treatment system to increase the amount of water treated by the facility. This portion of the remedial action was completed in February 2009. The facility can now treat 70 gallons of contaminated groundwater per minute. The remainder of the OU3 remedy was implemented from March 2010 through August 2010. Construction involved converting an existing monitoring well (CW-31D) to a deep recovery well (RW-7), the addition of three new shallow recovery wells (RW-8, RW-9 and RW-10) and three new monitoring wells (CW-32, CW-33 and CW-34) in the ROS area, and the conversion of three existing shallow recovery wells (RW-1, RW-2 and RW-4) into injection wells (IW-1, IW-2 and IW-3) with an associated pumping system as part of the in situ flushing system. Since IW-1, IW-2, and IW-3 started clogging, two additional wells, IW-4 (formerly monitoring well CW-29D) and IW-5 (formerly monitoring well CW-30D) were placed online in July and October 2011, respectively. Injection wells IW-1, IW-2 and IW-3 have not operated since 2013. Injection wells IW-4 and IW-5 operated from 2011 until 2019 when they were shut down in response to recent investigations described below. The GWTP remained operational during the
15
construction and conversion of wells into recovery and injection wells. The current extent of the groundwater contamination as represented by the main contaminant, PCP, is shown in Figure 4. Excavation of contaminated soil and the abandoned sanitary sewer line in the ROS area of the Site began in January 2010, with completion in March 2010. EPA excavated about 3,000 cubic yards of contaminated soil in the ROS area and disposed it off-site. The ROS area is bordered by two creeks, and excavation continued to the creek banks. The water extracted during the excavation was pumped to the collection trench and treated at the groundwater treatment facility. Restoration of the ROS area included placing riprap on the banks of Naylors Run, installing a drainage swale, placing topsoil and seeding. The restoration of the residential area included replacing a driveway, grading and seeding the yards and landscaping the area. During the ROS area excavation, EPA discovered a second pipe directly below the abandoned sanitary sewer line. An additional investigation was conducted to determine if the second pipe followed the abandoned sanitary sewer to the CTR. The second pipe was also found at the CTR and was plugged to ensure contaminated groundwater could not flow through the pipe. The excavated soil was disposed of off-site in May and June 2010. A total of 4,421 tons of contaminated soil were shipped off site for disposal. A PADEP contractor initiated an ecological monitoring program for OU3 in May 2009 and continued through 2019. PADEP implemented the program to demonstrate recovery of benthic macroinvertebrate and fish communities, and to examine the efficacy of the ROS area excavation and groundwater treatment. Based on the results, several ecological monitoring endpoints clearly indicate improvement in the quality of Naylors Run since remedial activities were implemented at the Site. Results of the monitoring conducted during this FYR period are included in the Data Review section of this report. Recent Investigations PADEP implements the operation and maintenance (O&M) program at the Site. In January 2019, a resident contacted EPA and PADEP complaining of water with an oily sheen seeping from the ground surface in the resident’s backyard, as well as a large volume of water seeping into the crawlspace beneath their house. The affected property is partially located over the groundwater contamination plume at the Site and contains two shallow monitoring wells that have historically had high concentrations of COCs. A 36-inch stormwater sewer line also passes beneath the affected property and discharges to Naylors Run. An inspection of the affected property and adjacent properties identified saturated soil conditions, water seepage, and subsequent surface water drainage flow paths across multiple residential properties. In the same period, several additional residential properties also experienced water seepage into basements and crawl spaces at an increased rate. PADEP conducted initial sump water and yard seep water sampling in February 2019. Results showed multiple Site COCs above OU3 groundwater RGOs. Additional soil, sump water and seep water sampling conducted in February indicated several Site COCs above RGOs and Removal Management Levels (RMLs), including PCP (soil), benzo(a)pyrene (soil and seep water) and total dioxins (soil). EPA conducted a third round of sampling in July 2019 as part of a Removal Site Evaluation (RSE) to further define the extent of contamination. The RSE included extensive soil sampling in residential yards and additional sampling of basements and crawl spaces as well as surface water drains and conveyance features. During the RSE, EPA collected multi-increment® samples (MIS) from soil within identified potential exposure areas on several properties. The MIS samples provide a representative average concentration of contaminants throughout an exposure area and targeted the 0-2 centimeter and 0-12-inch soil depths. Maximum detected concentrations of COCs in soil included PCP at 14,000 milligrams per kilogram (mg/kg) (RML for PCP is 100 mg/kg), total dioxins (2,3,7,8-TCDD toxicity equivalent quotient [TEQ]) at 1,100 µg/kg (micrograms per kilogram) (RML is 0.15 µg/kg), chromium at 109 mg/kg (RML is 30 mg/kg), benzo(a)pyrene at 2,400 mg/kg (RGO is 1,300 mg/kg) and manganese at 1,310 mg/kg (RGO is 160 mg/kg). Surface water and groundwater drains at residential properties also exhibited several site-related COCs above RGOs, including manganese, lead, total dioxins and dieldrin.
16
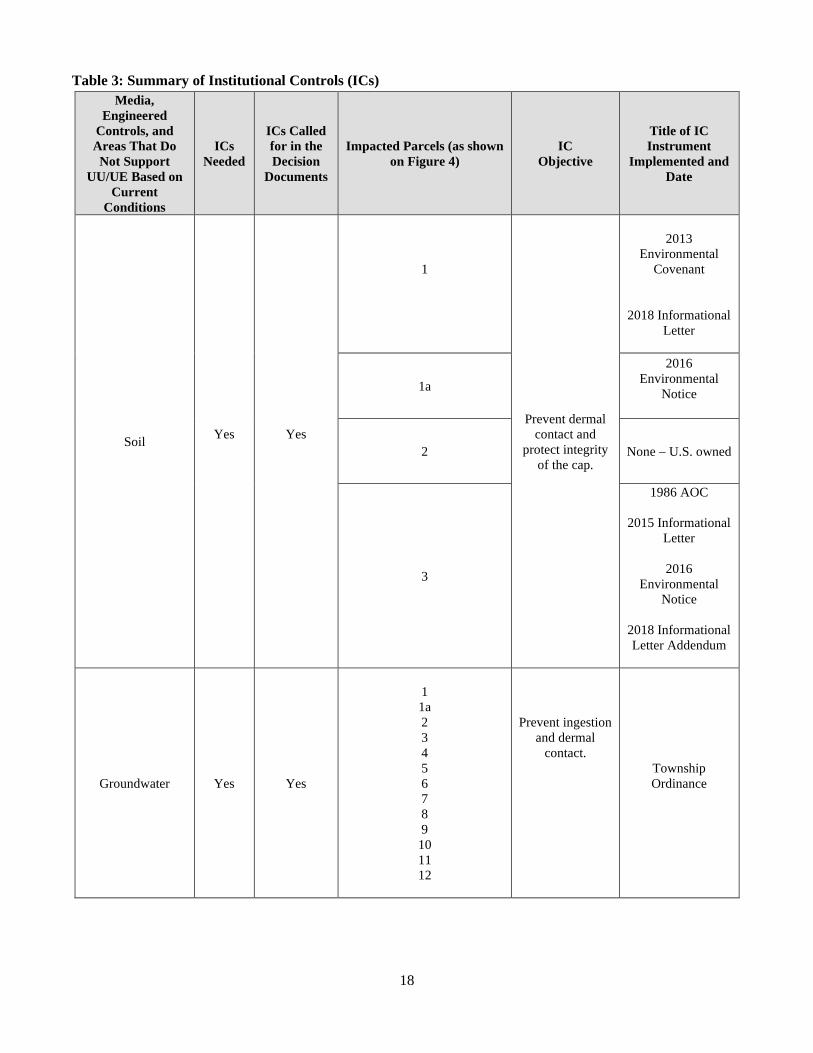
The sampling results indicate high levels of PCP, total dioxins and benzo(a)pyrene in the surface and shallow subsurface soils above RGOs within several residential properties impacted by the Site. Portions of the yards are poorly vegetated and are regularly saturated during rain events. This ponding leads to transport of contaminated soil, groundwater and seep water onto other properties and eventually into Naylors Run. As a result of the PADEP sampling and RSE, it was determined that elevated water table conditions as a result of substantially higher-than-normal precipitation levels in 2018 were the cause of the saturated conditions and contamination identified in residential areas on Rittenhouse Circle. Based on the RSE results, EPA finalized an Action Memorandum (AM) on September 19, 2019, authorizing a time-critical removal action (TCRA) to address contaminated soil and groundwater in excess of RGOs or cumulative potential cancer risk in excess of 1x10⁻⁴ or a hazard index (HI) greater than 3. EPA initiated the TCRA in November 2019. Since that time, additional sampling activities have been conducted to further delineate soil and groundwater contamination within the impacted residential area as well as install six (6) new pairs of shallow and deep bedrock monitoring wells to further refine the larger plume boundary. Additionally, EPA installed additional lining of the 36” storm sewer pipe that runs from Lawrence Road to Naylors Run to ensure site contaminants do not discharge to the creek via that pathway. Eight (8) residential properties are in the process of being addressed by the TCRA as well. Waterproofing of basements and crawl spaces has been completed. Water from these sumps is being conveyed to the GWTP via a new header line installed in the rear yards of homes on Rittenhouse Circle. This header line discharges into a new outdoor sump installed over a spring/seep on one of the residential properties which had elevated levels of Site contaminants. This sump conveys water to the existing CTR and then on to the GWTP. A new larger CTR-1 sump will be installed adjacent to the existing CTR. All collected water from this area of the Site including from the original CTR and the new residential sumps will be conveyed into this CTR-1 Sump. The CTR-1 Sump will also address capacity issues with the original CTR through backup pumps and power and other upgrades. A new 3” force main has been installed that will convey a higher volume of water from CTR-1 to the GWTP. One of the residential properties on Rittenhouse Circle has elevated concentrations of site contaminants in groundwater and soil, including light non-aqueous phase liquids (LNAPL). Notwithstanding wells with LNAPL present, the maximum detected concentration of PCP in several temporary piezometers on the property was 11,000 µg/L in May 2020. As part of the TCRA, contaminated soils and source materials in soil and groundwater will be removed to the extent practical via excavation and surfactant flushing. This is currently planned for fall 2020. A pilot study utilizing surfactant was successful in removing LNAPL. However, there was limited ability to inject the surfactant due to the low conductivity of the soils. The deployment of additional surfactant treatments and/or the mixing or injection of in situ chemical oxidizers (ISCO) are also being evaluated for implementation to further reduce contaminant concentrations in the subsurface. Hydraulic control of contaminated groundwater on this residential property is also necessary to contain a portion of the shallow groundwater plume. EPA is considering options to achieve this, including phytoremediation and an additional trench or large french drain. The current GWTP is running near maximum capacity and was undersized prior to the initiation of the TCRA with a flow of approximately 75 gallons per minute. With the addition of the water from the residential and outdoor sumps and drains, the GWTP requires expansion to adequately handle the increased volume. EPA initiated a remedial design to update and expand the GWTP in November 2019. The remedial design is expected to be finalized in 2020. The TCRA AM was updated on September 11, 2020, to increase authorized funding to implement the majority of the GWTP expansion. Construction of the expanded plant will begin in late 2020 and is expected to last 12 to 18 months. Once completed, the GWTP will have the capacity to treat approximately 150 gallons per minute. Institutional Control (IC) Review EPA finalized the ICIAP in 2011 in accordance with requirements of the OU3 ROD. The ICIAP was updated in September 2013. EPA anticipates updating it again in 2020. ICs are required to prevent exposure to contaminated groundwater and to protect the integrity of the engineered remedy including the cap and the groundwater extraction and treatment system. The ICs for groundwater and soil are provided in Table 3. There are 13 parcels
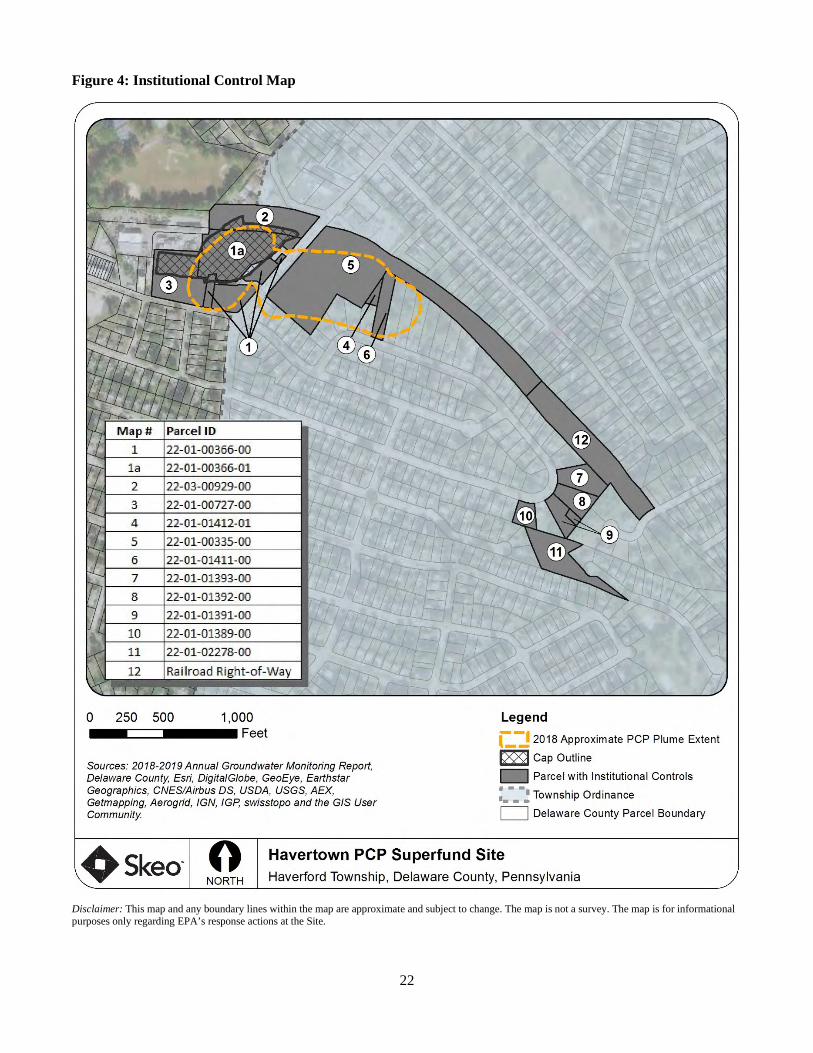
17
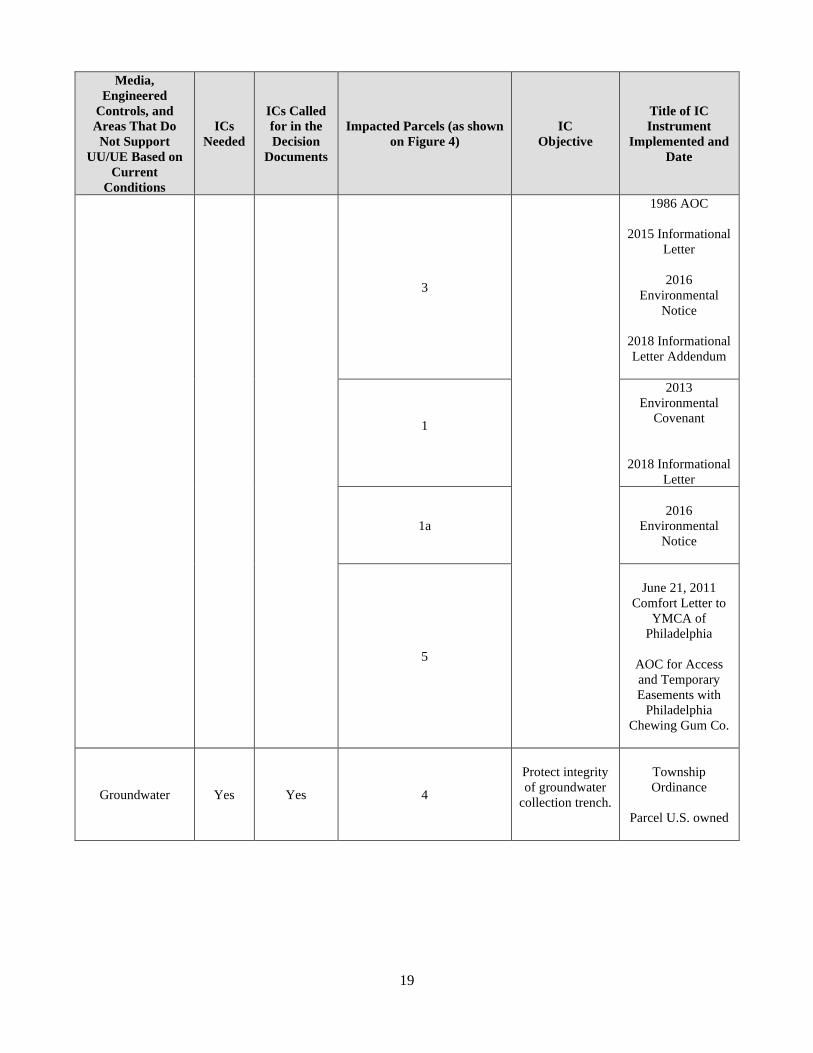
(including a railroad right of way) with institutional controls in place (Figure 4). Institutional controls in place including a combination of easements, environmental covenants, an Administrative Order for Access and Removal (AOC), and a township ordinance. Soil Institutional Controls A 2013 environmental covenant (2013 Environmental Covenant) placed on the capped area instituted use restrictions to protect the integrity of the OU1 remedy. The 2013 Environmental Covenant was recorded on one parcel (22-01-00366-00, labeled Parcel 1 in Figure 4). A series of acquisitions and subdivisions from 2015 to 2019 between 22-01-00366-00 (Parcel 1) and 22-01-00727-00 (Parcel 3) created 22-01-00366-01 (Parcel 1a in Figure 4). Parcel 1a (22-01-00366-01) is currently owned by Mr. Storage and encompasses a majority of the cap. Parcel 1 is currently owned by Robert Ford and Coulter Building Company, which leases the property to two businesses: Swiss Farms and Toni Roni’s Pizza. The Parcel 1a deed incorporates the applicable cap and property use restrictions in an environmental notice, originally recorded on Parcel 3 at Record Book 05761, page 0050 (2016 Environmental Notice). The Environmental Notice includes a copy of the ICIAP, and a 2015 comfort letter issued by EPA to Direct Collision prior to its purchase of a Parcel 3 and a portion of Parcel 1 (2015 Informational Letter). The property records for Parcel 1 still include the 2013 Environmental Covenant, which is provided in Appendix C. In addition, EPA issued a comfort letter (2018 Informational Letter) and follow-up addendum (2018 Informational Letter Addendum) to Robert Ford and Coulter Building Company in 2018 prior to its purchases of Parcel 1 and a driveway located on portion of Parcel 3, which included a copy of the ICIAP and the applicable cap and property use restrictions. The ICIAP should be updated accordingly to reflect these changes. Parcel 2 contains a small portion of the cap. Parcel 2 is currently owned by the U.S. Army Corps of Engineers (USACE) and consists of an active treatment system operated by EPA. United States’ ownership ensures activity and use restrictions on Parcel 2 will be enforced; there are no future plans to sell or develop Parcel 2. The ICIAP lists Parcel 2 as including several parcels that no longer exist. The only parcel associated with Parcel 2 is 22-03-00929-00. The ICIAP should be updated to reflect this change. Parcel 3, which is currently owned by 1315 Lawrence Road Holdings, LP, an entity related to several businesses on Site, including Direct Collision – also contains a portion of the cap. The soil IC listed in the ICIAP for this parcel is a 1986 Administrative Order for Access and Removal, Docket No. III-96-85-DC (AOC) with two former property owners. The 1986 AOC prohibits interference with the remedy and runs with the land. It does not refer to the cap since the 1986 AOC predates the installation of the cap. However, the 2016 Environmental Notice and the 2015 Informational Letter include a detailed discussion of the cap and property use restrictions for Parcel 3. Groundwater ICs The Township Ordinance prohibits the installation of groundwater wells sitewide for Parcels 1 through 12. The 2013 Environmental Covenant, the 2015 Informational Letter and the 2016 Environmental Notice also prohibit groundwater use and extraction other than for environmental testing or remediation unless EPA provides prior written approval. Easements signed with the owners of Parcels 7-12 also prevent groundwater use, which are identified in Table 3. Remedial Components Easements and access agreements are in place to ensure access to and allow maintenance of the engineered remedy including the capped area and the groundwater extraction and treatment system infrastructure. Some parcels (7 through 12) only contain remedial components and have access agreements and easements in place as explained in the ICIAP. These parcels are shown in Table 3 and in Figure 4. Additional easements are in the process of being secured for the infrastructure and associated response actions that were taken as part of the TCRA on Rittenhouse Circle. USACE is obtaining these easements for EPA and they will allow for access to operate and maintain features including the new header line, sumps, french drains and other areas. The ICIAP will be updated to reflect these additional easements once they are secured.
18
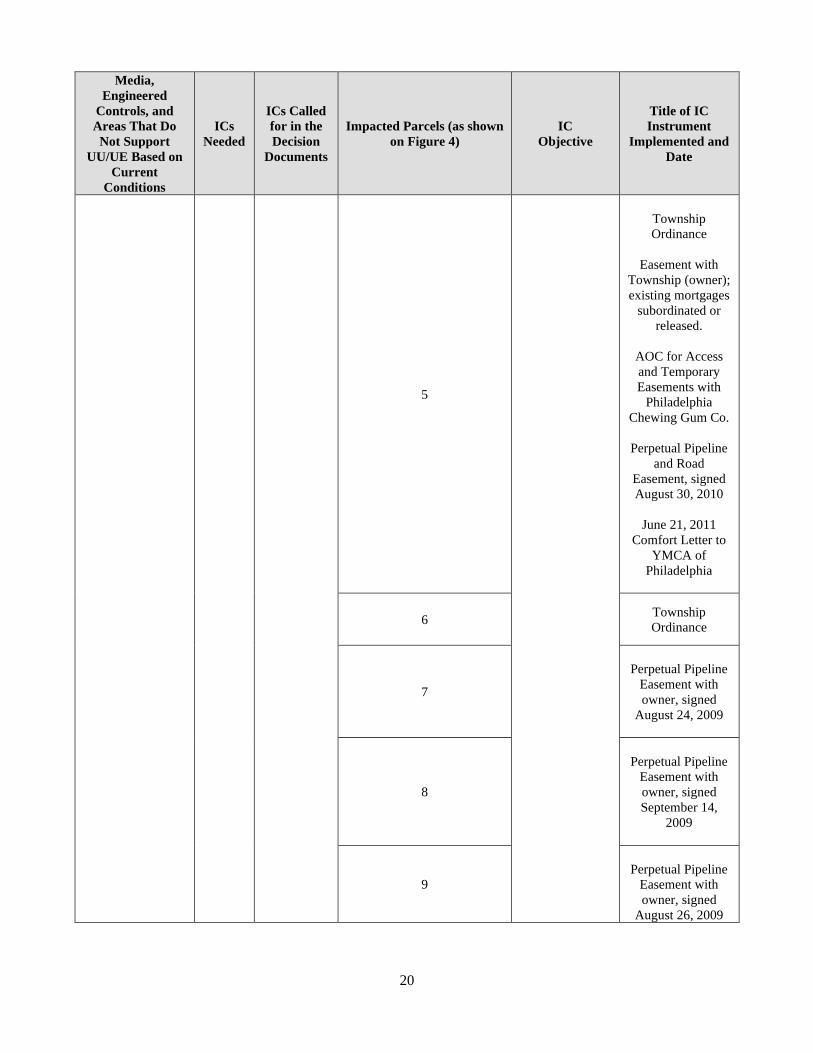
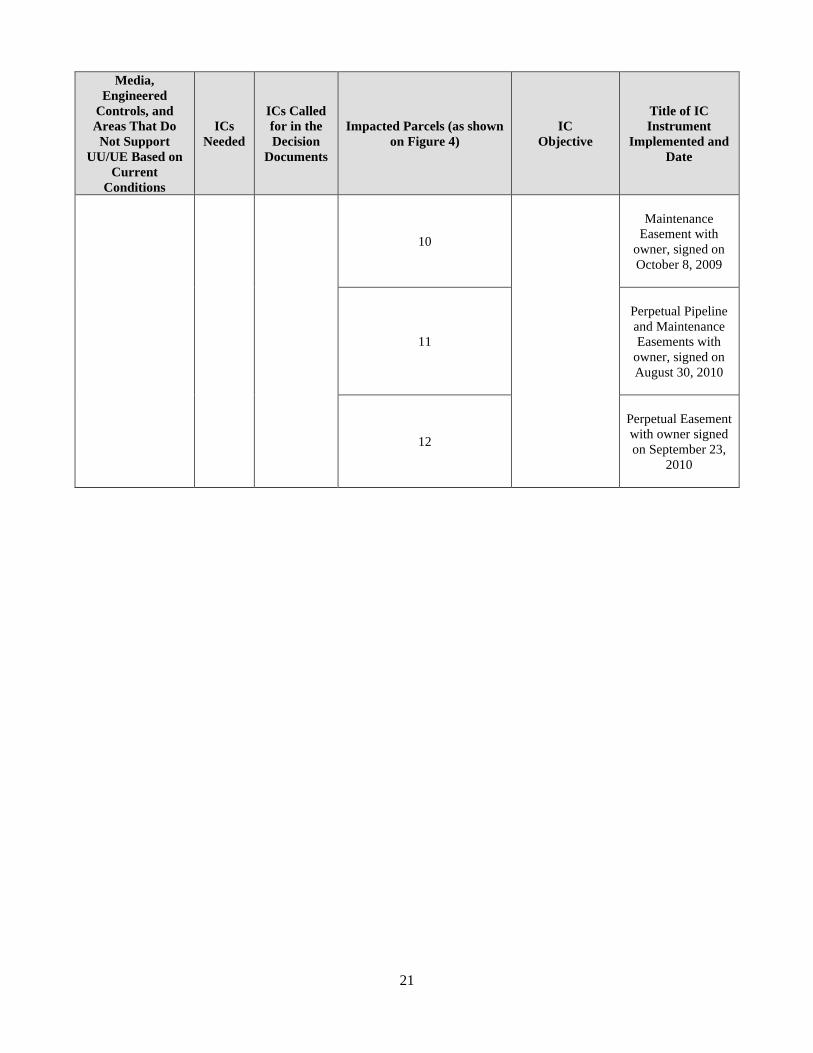
Table 3: Summary of Institutional Controls (ICs) Media,
Engineered Controls, and Areas That Do Not Support
UU/UE Based on Current
Conditions
ICs Needed
ICs Called for in the Decision
Documents
Impacted Parcels (as shown on Figure 4)
IC Objective
Title of IC Instrument
Implemented and Date
Soil Yes
Yes
1
Prevent dermal contact and
protect integrity of the cap.
2013
Environmental Covenant
2018 Informational Letter
1a
2016 Environmental
Notice
2 None – U.S. owned
3
1986 AOC
2015 Informational Letter
2016
Environmental Notice
2018 Informational Letter Addendum
Groundwater Yes Yes
1 1a 2 3 4 5 6 7 8 9 10 11 12
Prevent ingestion and dermal
contact.
Township Ordinance
19
Media, Engineered
Controls, and Areas That Do Not Support
UU/UE Based on Current
Conditions
ICs Needed
ICs Called for in the Decision
Documents
Impacted Parcels (as shown on Figure 4)
IC Objective
Title of IC Instrument
Implemented and Date
3
1986 AOC
2015 Informational Letter
2016
Environmental Notice
2018 Informational Letter Addendum
1
2013 Environmental
Covenant
2018 Informational Letter
1a
2016
Environmental Notice
5
June 21, 2011
Comfort Letter to YMCA of
Philadelphia
AOC for Access and Temporary Easements with
Philadelphia Chewing Gum Co.
Groundwater Yes Yes 4
Protect integrity of groundwater
collection trench.
Township Ordinance
Parcel U.S. owned
20
Media, Engineered
Controls, and Areas That Do Not Support
UU/UE Based on Current
Conditions
ICs Needed
ICs Called for in the Decision
Documents
Impacted Parcels (as shown on Figure 4)
IC Objective
Title of IC Instrument
Implemented and Date
5
Township Ordinance
Easement with
Township (owner); existing mortgages
subordinated or released.
AOC for Access and Temporary Easements with
Philadelphia Chewing Gum Co.
Perpetual Pipeline
and Road Easement, signed August 30, 2010
June 21, 2011
Comfort Letter to YMCA of
Philadelphia
6 Township Ordinance
7
Perpetual Pipeline
Easement with owner, signed
August 24, 2009
8
Perpetual Pipeline
Easement with owner, signed September 14,
2009
9
Perpetual Pipeline
Easement with owner, signed
August 26, 2009
21
Media, Engineered
Controls, and Areas That Do Not Support
UU/UE Based on Current
Conditions
ICs Needed
ICs Called for in the Decision
Documents
Impacted Parcels (as shown on Figure 4)
IC Objective
Title of IC Instrument
Implemented and Date
10
Maintenance
Easement with owner, signed on October 8, 2009
11
Perpetual Pipeline and Maintenance Easements with
owner, signed on August 30, 2010
12
Perpetual Easement with owner signed on September 23,
2010
22
Figure 4: Institutional Control Map
Disclaimer: This map and any boundary lines within the map are approximate and subject to change. The map is not a survey. The map is for informational purposes only regarding EPA’s response actions at the Site.
23
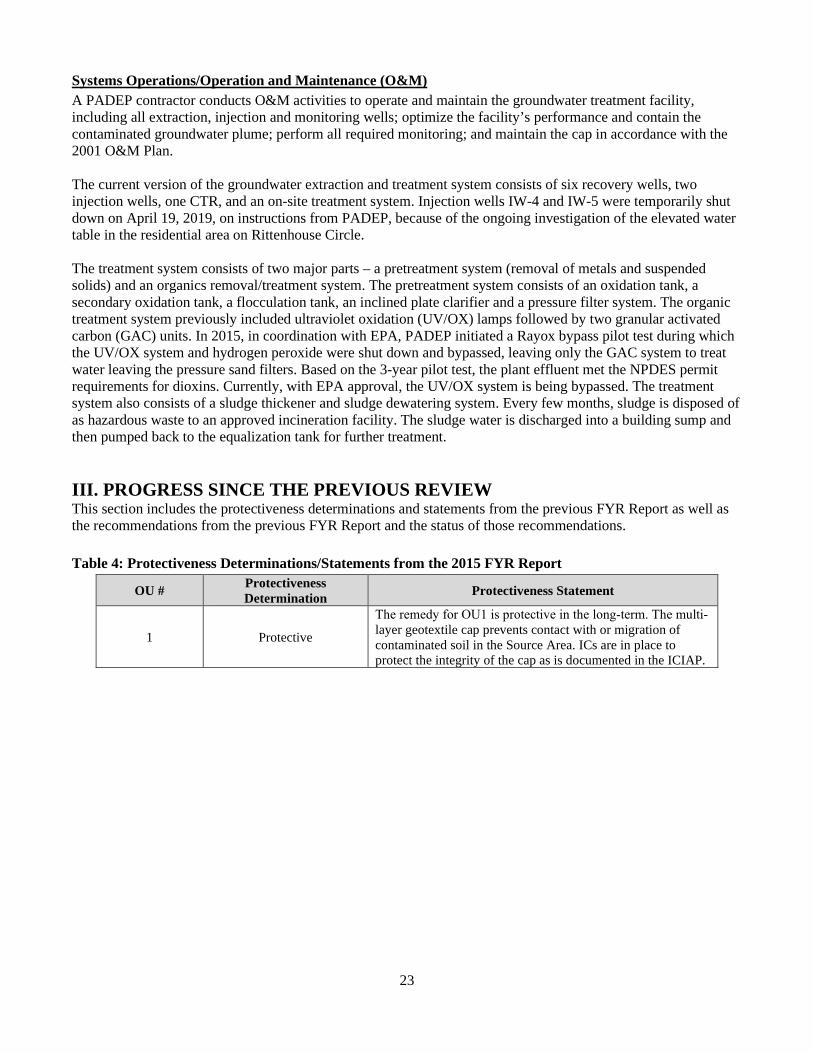
Systems Operations/Operation and Maintenance (O&M) A PADEP contractor conducts O&M activities to operate and maintain the groundwater treatment facility, including all extraction, injection and monitoring wells; optimize the facility’s performance and contain the contaminated groundwater plume; perform all required monitoring; and maintain the cap in accordance with the 2001 O&M Plan. The current version of the groundwater extraction and treatment system consists of six recovery wells, two injection wells, one CTR, and an on-site treatment system. Injection wells IW-4 and IW-5 were temporarily shut down on April 19, 2019, on instructions from PADEP, because of the ongoing investigation of the elevated water table in the residential area on Rittenhouse Circle. The treatment system consists of two major parts – a pretreatment system (removal of metals and suspended solids) and an organics removal/treatment system. The pretreatment system consists of an oxidation tank, a secondary oxidation tank, a flocculation tank, an inclined plate clarifier and a pressure filter system. The organic treatment system previously included ultraviolet oxidation (UV/OX) lamps followed by two granular activated carbon (GAC) units. In 2015, in coordination with EPA, PADEP initiated a Rayox bypass pilot test during which the UV/OX system and hydrogen peroxide were shut down and bypassed, leaving only the GAC system to treat water leaving the pressure sand filters. Based on the 3-year pilot test, the plant effluent met the NPDES permit requirements for dioxins. Currently, with EPA approval, the UV/OX system is being bypassed. The treatment system also consists of a sludge thickener and sludge dewatering system. Every few months, sludge is disposed of as hazardous waste to an approved incineration facility. The sludge water is discharged into a building sump and then pumped back to the equalization tank for further treatment. III. PROGRESS SINCE THE PREVIOUS REVIEW This section includes the protectiveness determinations and statements from the previous FYR Report as well as the recommendations from the previous FYR Report and the status of those recommendations.
Table 4: Protectiveness Determinations/Statements from the 2015 FYR Report
OU # Protectiveness Determination Protectiveness Statement
1 Protective
The remedy for OU1 is protective in the long‐term. The multi-layer geotextile cap prevents contact with or migration of contaminated soil in the Source Area. ICs are in place to protect the integrity of the cap as is documented in the ICIAP.
24
OU # Protectiveness Determination Protectiveness Statement
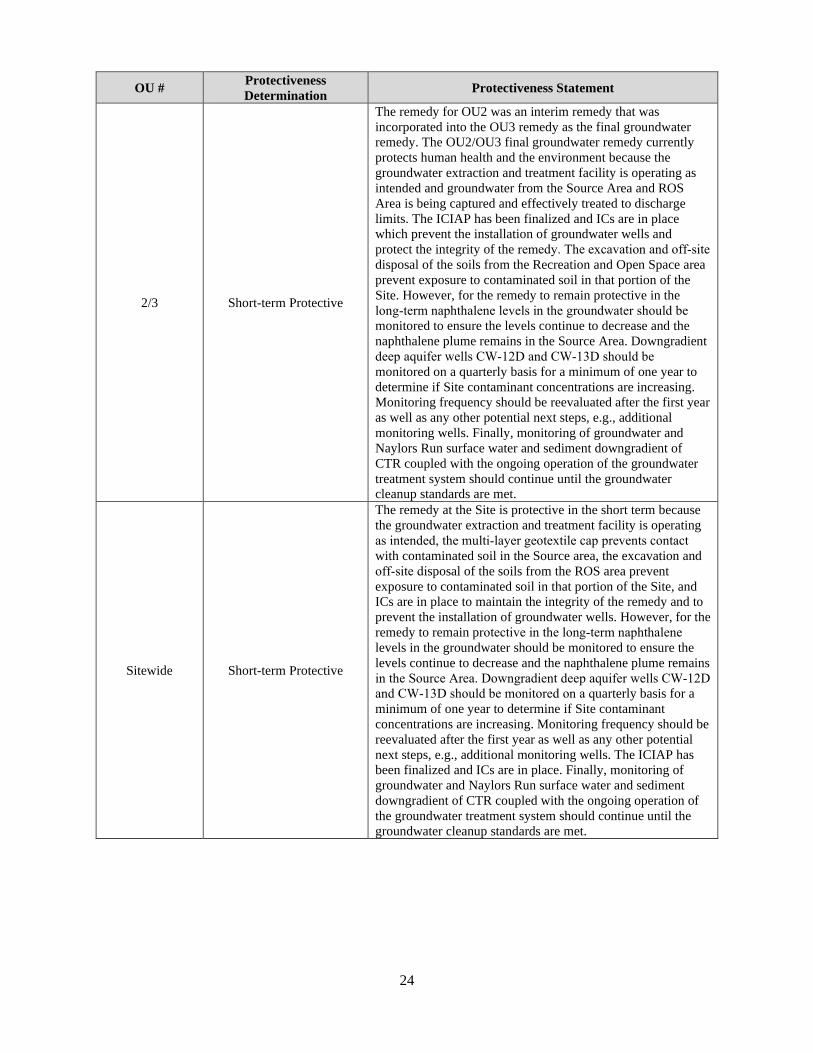
2/3 Short-term Protective
The remedy for OU2 was an interim remedy that was incorporated into the OU3 remedy as the final groundwater remedy. The OU2/OU3 final groundwater remedy currently protects human health and the environment because the groundwater extraction and treatment facility is operating as intended and groundwater from the Source Area and ROS Area is being captured and effectively treated to discharge limits. The ICIAP has been finalized and ICs are in place which prevent the installation of groundwater wells and protect the integrity of the remedy. The excavation and off‐site disposal of the soils from the Recreation and Open Space area prevent exposure to contaminated soil in that portion of the Site. However, for the remedy to remain protective in the long‐term naphthalene levels in the groundwater should be monitored to ensure the levels continue to decrease and the naphthalene plume remains in the Source Area. Downgradient deep aquifer wells CW‐12D and CW‐13D should be monitored on a quarterly basis for a minimum of one year to determine if Site contaminant concentrations are increasing. Monitoring frequency should be reevaluated after the first year as well as any other potential next steps, e.g., additional monitoring wells. Finally, monitoring of groundwater and Naylors Run surface water and sediment downgradient of CTR coupled with the ongoing operation of the groundwater treatment system should continue until the groundwater cleanup standards are met.
Sitewide Short-term Protective
The remedy at the Site is protective in the short term because the groundwater extraction and treatment facility is operating as intended, the multi‐layer geotextile cap prevents contact with contaminated soil in the Source area, the excavation and off‐site disposal of the soils from the ROS area prevent exposure to contaminated soil in that portion of the Site, and ICs are in place to maintain the integrity of the remedy and to prevent the installation of groundwater wells. However, for the remedy to remain protective in the long‐term naphthalene levels in the groundwater should be monitored to ensure the levels continue to decrease and the naphthalene plume remains in the Source Area. Downgradient deep aquifer wells CW‐12D and CW‐13D should be monitored on a quarterly basis for a minimum of one year to determine if Site contaminant concentrations are increasing. Monitoring frequency should be reevaluated after the first year as well as any other potential next steps, e.g., additional monitoring wells. The ICIAP has been finalized and ICs are in place. Finally, monitoring of groundwater and Naylors Run surface water and sediment downgradient of CTR coupled with the ongoing operation of the groundwater treatment system should continue until the groundwater cleanup standards are met.
25
Table 5: Status of Recommendations from the 2015 FYR Report
OU # Issue Recommendation Current Status
Current Implementation Status Description
Completion Date (if
applicable)
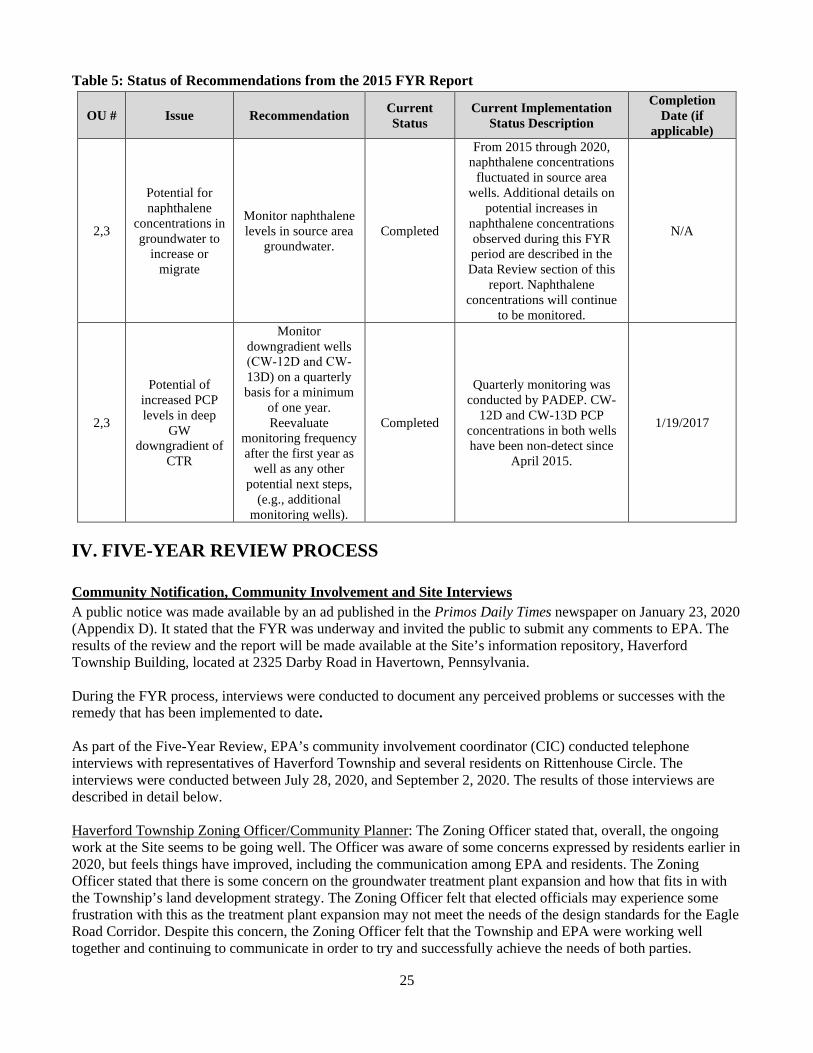
2,3
Potential for naphthalene
concentrations in groundwater to
increase or migrate
Monitor naphthalene levels in source area
groundwater. Completed
From 2015 through 2020, naphthalene concentrations
fluctuated in source area wells. Additional details on
potential increases in naphthalene concentrations observed during this FYR period are described in the Data Review section of this
report. Naphthalene concentrations will continue
to be monitored.
N/A
2,3
Potential of increased PCP levels in deep
GW downgradient of
CTR
Monitor downgradient wells (CW‐12D and CW‐13D) on a quarterly basis for a minimum
of one year. Reevaluate
monitoring frequency after the first year as
well as any other potential next steps,
(e.g., additional monitoring wells).
Completed
Quarterly monitoring was conducted by PADEP. CW-
12D and CW-13D PCP concentrations in both wells have been non-detect since
April 2015.
1/19/2017
IV. FIVE-YEAR REVIEW PROCESS Community Notification, Community Involvement and Site Interviews A public notice was made available by an ad published in the Primos Daily Times newspaper on January 23, 2020 (Appendix D). It stated that the FYR was underway and invited the public to submit any comments to EPA. The results of the review and the report will be made available at the Site’s information repository, Haverford Township Building, located at 2325 Darby Road in Havertown, Pennsylvania. During the FYR process, interviews were conducted to document any perceived problems or successes with the remedy that has been implemented to date. As part of the Five-Year Review, EPA’s community involvement coordinator (CIC) conducted telephone interviews with representatives of Haverford Township and several residents on Rittenhouse Circle. The interviews were conducted between July 28, 2020, and September 2, 2020. The results of those interviews are described in detail below. Haverford Township Zoning Officer/Community Planner: The Zoning Officer stated that, overall, the ongoing work at the Site seems to be going well. The Officer was aware of some concerns expressed by residents earlier in 2020, but feels things have improved, including the communication among EPA and residents. The Zoning Officer stated that there is some concern on the groundwater treatment plant expansion and how that fits in with the Township’s land development strategy. The Zoning Officer felt that elected officials may experience some frustration with this as the treatment plant expansion may not meet the needs of the design standards for the Eagle Road Corridor. Despite this concern, the Zoning Officer felt that the Township and EPA were working well together and continuing to communicate in order to try and successfully achieve the needs of both parties.
26
Haverford Township 7th Ward Commissioner: The Ward Commissioner began his four-year term with Haverford Township earlier in 2020, although he has been familiar with the Site for some time. He was initially contacted by residents on Rittenhouse Circle in March 2020 with complaints about the lack of communication on the project and timeframes. He also stated that initially residents had some concern with risk communication from EPA. Residents were being told that the contaminants found on their property did not pose a risk, but they were also being encouraged to wash their pets’ paws and have their children exercise caution while playing outside. That led to some confusion among residents. The Ward Commissioner stated that communication from EPA has greatly improved and he has received few complaints recently related to the Site. He also stated that some type of meeting among the residents that officially “wraps up” the removal action and goes over future O&M requirements, would be a good idea. Resident No. 1: Resident No. 1 understands the need for continued work in relation to the Site, as well as the fact that many of the initial timetables discussed were thrown off. The resident expressed his understanding on the need for planning an extensive project like this. Resident No. 1 stated the weekly updates from the EPA On-Scene Coordinator (OSC) have helped to keep communication flowing. One concern the resident expressed is in relation to the sump pumps that were installed. The resident asked if the sump pumps were to fail, what would be the procedure moving forward on how to fix it? He asked for better clarification on who to contact in this instance. The resident also stated that there may be other issues the impacted residents on Rittenhouse Circle may have in the future, such as whether or not seed in restored yards takes well. He believes it is a good idea for them to be informed how to handle issues like this with EPA in the future. Resident No. 2: Resident No. 2 did not become familiar with the Site until after purchasing his home about six years ago. The resident stated that, initially when the removal project began, plans were not being communicated frequently to residents on Rittenhouse Circle. He says that has improved and feels both EPA and PADEP have been much more communicative. The resident did express concern over many of the sampling results letters that have been sent. He stated that they have been difficult to understand and that one “needs a science degree to interpret the letters.” The resident stated that some type of monthly check-in with the residents – whether an in-person or virtual meeting might have been beneficial to keeping complaints and/or concerns from residents to a minimum. The resident suggested that it would be helpful for EPA to provide some type of final highlights on the work completed and how that work has fared and ultimately benefited the Site. Resident No. 3: Resident No. 3 was not aware of the Site until work under the removal action became necessary. Overall, he is understanding of the need for the work and recognizes that EPA is working to clean up the Site that has been there for many years. The resident stated that initially there was a lack of communication from EPA, but that has improved over time with the OSC’s weekly emails. The resident did express concern over property values and whether or not the Site and work would have an impact on the sale of his home in the next five to 10 years. All of the residents the CIC spoke with recognized the challenge of holding an in-person meeting on Rittenhouse Circle during the COVID-19 pandemic. The residents did state that virtual meetings could be beneficial, but that other residents on Rittenhouse Circle might not feel comfortable with the technology or format of such a meeting. The residents interviewed felt if there was a way for residents and EPA to social distance and wear masks, that EPA should consider holding in-person town halls every other month or so, to give updates and hear from residents. Most of the people the CIC spoke with also felt a meeting such as this would be beneficial to wrap up the removal action once completed and explain long-term O&M requirements that would be in place. Residents also seem eager to know how/when EPA would need to access their properties in the future and what that might look like. The CIC contacted the Haverford Township Environmental Advisory Committee (EAC) but was unable to arrange an interview due to schedules. The EAC did inform the CIC that it met with EPA earlier in the year to discuss aspects of the removal action and the groundwater treatment plant expansion. The EAC stated that at that meeting they had the ability to express concerns and have their questions answered by EPA’s RPM. The EAC stated it would welcome EPA’s participation in future meetings to provide updates on the Site.
27
Data Review During this FYR period, PADEP’s contractor collected groundwater, surface water, sediment and fish tissue data from the Site. Data for these media are summarized below and discussed in greater detail in Appendix G. Additional data tables and figures are provided in Appendix H. Soil, sump and surface water sampling was also conducted in 2019 as part of the RSE and is described in this FYR report in the Status of Implementation section. Groundwater Monitoring The groundwater monitoring program consists of 49 monitoring wells, six recovery wells, a CTR sump and five injection wells (Figure H-1 and H-2 in Appendix H). The monitoring wells are classified as shallow wells above bedrock (about 5 feet to 30 feet below ground surface) and deep wells screened in the bedrock. Groundwater monitoring is conducted to monitor treatment system performance and the migration of the PCP plume. Sampling, performed in accordance with the 2016 Sampling and Analysis Plan (SAP), consists of quarterly, semi-annual, biennial and annual sampling. Sampling is conducted to determine the recovery system effectiveness, monitor the edge of the shallow contaminant capture zone and update the historical database (Table H-1, Appendix H). This FYR utilized the annual groundwater reports dated June 2015 through June 2019. The groundwater extraction and treatment system continue to contain most of the groundwater contamination within the groundwater extraction capture zone (Appendix H, Figure H-1 and H-2). PCP concentrations continue to decrease in many source-area wells and the overall plume area decreased in size over this FYR period (Figure H-3). PCP, the most prevalent COC in groundwater, was detected above its RGO in deep source area recovery wells, shallow and deep monitoring wells and the shallow CTR (Appendix G, Table G-1). PCP concentrations in the recovery wells and the CTR were consistent with historical results showing variability, up to an order of magnitude, over time (Table G-1 in Appendix G and Figures H-4 through H-8 in Appendix H). However, PCP, naphthalene and dioxins increased in some downgradient source area monitoring wells, indicating the remedy may not be performing effectively in these areas (Appendix G, Tables G-2 through G-4). PCP concentrations at monitoring wells NW-01 and CW-26D increased from less than the detection limit to 1,230 µg/L and 3,750 µg/L, respectively. Naphthalene concentrations at monitoring wells CW-4I and 4D increased from less than the detection limit to 69.8 µg/L and 121 µg/L, respectively. Dioxin concentrations increased from 35 picograms per liter (pg/L) to 2,000 pg/L at NW-1, 0.026 pg/L to 266 pg/L in R-2, and 0.00147 pg/L to 40 pg/L in CW-24D. It is suspected that the recent high water-table conditions were the primary cause of these contaminant increases. EPA is working with PADEP to further investigate the current extent of groundwater contamination and strategies to optimize the groundwater remedy at the Site. Substantially higher than average precipitation rates in 2018 resulted in an elevated water table throughout the region, including the area where the Site is located. The water table was found to be 3 to 5 feet higher than average in many areas of the Site. This not only was the likely main contributor to the residential issues that are currently being addressed by the TCRA, but likely contributed to the increased concentrations in these wells. Other potential contributors to the increase water table include the long-running injection wells and/or stormwater from recent developments on the surrounding properties. One hypothesis is that site contaminants that typically were above the saturated zone in soil were inundated when the water table increased in 2018-2019 and this resulted in the dissolution of the contaminants into the groundwater. As part of the TCRA, six pairs of additional overburden and bedrock monitoring wells were installed throughout areas of the Site in the spring of 2020 to further delineate the plume boundaries. LNAPL, sheen and/or heavy odors were noted in several of the shallow monitoring wells. While the shallow wells have been completed, the deep wells are undergoing geophysical testing to determine the optimal screen placement. Pending the findings from sampling of these new monitoring wells, one or more may be converted into new recovery wells. As noted above, naphthalene concentrations did increase in several monitoring wells, including CW-4I and 4D. While these concentrations did increase markedly in certain instances, several were in line with or below
28
concentrations in prior recent years. Further downgradient wells have not seen a substantial or consistent increase in naphthalene concentrations, suggesting that the source area is not expanding further. While regular sampling of Site monitoring wells will continue, including the Source Area, the issue regarding the potential migration of naphthalene specifically has been addressed. Water Treatment Plant Influent and Discharge Monitoring In total, over 250 million gallons of influent have been treated in the groundwater treatment plant since 2002 (Table H-2, Appendix H). The average groundwater treatment plant influent and effluent data are shown in Table H-3 and H-4, respectively, in Appendix H. Average influent contaminant concentrations in 2018-2019 are higher than in the previous year; however, the concentrations are generally within the historical range (Table H-3, Appendix H). The water treatment plant effluent was within the NPDES permit limits during this FYR period with the exception of carbon tetrachloride in June 2015. Carbon tetrachloride is not a COC and not typically present in the influent but is a by-product of the Rayox treatment process. The PADEP contractor changed the GAC carbon vessels to address this issue. In 2015, the PADEP contractor shutdown the Rayox UV/OX system as part of a pilot study due to the low levels of dioxins in the GWTP influent and optimizations made to the treatment plant. Since the start of the pilot study dioxins have not been detected above NPDES equivalent discharge limits in the GWTP effluent. Ecological Monitoring PADEP’s contractor has conducted the ecological monitoring program at the Site since 2009, in accordance with the 2009 Ecological Sampling Work Plan for OU3. This FYR reviewed ecological monitoring results collected during this FYR period through April 2019 as well as historical results from 2009 through April 2019 as appropriate. During this FYR period, surface water sampling detected semi-volatile organic compounds (SVOCs), including PCP, several PAHs and metals in surface water, sediment and fish tissue. Surface water analytical results for all samples, including reference locations, exhibited low levels of SVOCs and PAHs. Several PAHs and SVOCs (including PCP) and metals were detected above their respective Biological Technical Assistance Group (BTAG) screening values in downstream or tributary locations during one or more sampling rounds. Concentrations of PCP have remained fairly consistent since 2009 with occasional spikes observed at Station 2. Total PAHs have generally decreased, and most metals have remained fairly consistent since 2009, with increases observed in 2019. See Figure H-9 and H-10 in Appendix H for surface water sample locations. Trend charts for select metals and PCP and total PAHs are provided in Appendix H, Figure H-11. In sediment, PCP concentrations remain well below the BTAG screening level and have remained stable during this FYR period. The maximum concentrations of 10 metals exceeded BTAG screening values in one or more sampling rounds. Concentrations of some metals appear to have increased in 2018 and 2019 (Appendix H, Figure H-12). The Dioxin TEQ mean concentration was higher in downstream samples versus upstream and exceeded the BTAG screening value at all locations. In 2019, concentrations increased in downstream sampling locations SD04 and SD06. In 2014, 2016 and 2018, the PADEP contractor conducted fish community sampling at five stations on Naylors Run (2, 3, 4, 5 and 6). Station 1 was not sampled due to low water levels at all sampling events. During this FYR period and consistent with historical observations, only two species were commonly collected at Naylors Run, creek chub and Eastern blacknose dace. Fish tissue samples were analyzed for SVOCs, including PAHs, metals and lipids. PCP has been detected in all fish tissue samples from Naylors Run from 2009 to 2018. Starting in 2014, concentrations increased from 8.2 µg/kg to 390 µg/kg at Station 5 in 2018. PCP concentrations in fish tissue samples from Stations 3, 4 and 6 also increased. The PADEP contractor collected benthic macroinvertebrates during the spring sampling events in 2014, 2015, 2017 and 2019 and scored the results against six metrics: Total Taxa; Number of Ephemeroptera Taxa; Number of Trichoptera Taxa; Number of Ephemeroptera; Plecoptera; Trichoptera Taxa; Beck’s Biotic Index; and Shannon-Weiner Index. Based on the results, Naylors Run was rated as biologically degraded with Index of Biotic Integrity
29
scores below PADEP’s reference threshold of 55. The scores ranged from 14.1 to 40.6 in 2019. In 2015 and 2017, the index scores were consistent with little change apparent. In 2019, some scores were slightly lower indicating a reduction in aquatic life in some stretches of Naylors Run. Despite the reduction in scores in 2019, conditions have improved overall since the remedy was implemented. However, Naylors Run remains a biologically degraded stream system. The increase in COC concentrations in surface water, sediment and fish tissue as well as the reduction in biotic integrity index scores is likely the result of the high water-table conditions currently being addressed by the TCRA. Contaminated groundwater was entering the stormwater sewer and discharging to Naylors Run. Surface runoff was also likely contributing to this increase in COCs in surface and sediment. There are also likely groundwater points of discharge to the creek. It is expected that the TCRA efforts will address these issues and concentrations in the surface water, sediment and fish tissue will decrease and the biotic index will increase. Ecological monitoring will continue. Site Inspection The Site inspection took place on October 29, 2019. Participants included the EPA RPM, EPA human health and ecological risk assessors, and EPA hydrogeologist. PADEP, Skeo (EPA FYR contractor support) and Tetra Tech (PADEP contractor) also participated in the site inspection. The purpose of the inspection was to assess the protectiveness of the remedy. Site inspection participants met in the treatment building and reviewed the site history and the current status of site conditions. During the site inspection, PADEP contractors were present and performing maintenance on the treatment system. Generally, the treatment facility was in working order and appeared to be well maintained. Site inspection participants observed the capped area, which consisted of some grassy areas as well as the Mr. Storage facility. The vegetation appeared to be in good condition and the capped area was partially fenced. The operation of the Mr. Storage and YMCA facilities do not appear to impede the functionality of the remedy. Participants observed the monitoring wells, recovery wells and injection wells to be in working order. There have been no major changes in land use on site or immediately adjacent to the Site, although development in the area is continuing. The proposed addition to the Mr. Storage facility is still in the planning phase and construction has not begun; EPA and PADEP have been involved in plans for the new building construction and will be notified prior to any construction activities. Site inspection participants observed Naylors Run as well as the residential properties that border the creek and are part of the planned EPA removal action. Naylors Run was flowing; however, the water level was low. The residential yards were wet due to a recent rain event; however, no major ponding was observed. The ROS area was also observed, with no issues noted. The site inspection checklist is included in Appendix E and the photos are in Appendix F. During the site inspection, an EPA contractor visited the document repository at the Haverford Township Building, located at 2325 Darby Road in Havertown, Pennsylvania. Township representatives could not locate any site documents. V. TECHNICAL ASSESSMENT QUESTION A: Is the remedy functioning as intended by the decision documents? Yes, the remedies are functioning as intended by the decision documents. However, complete containment of contaminated groundwater during high water-table conditions is currently being addressed by a TCRA. Contaminated soils in the Rittenhouse Circle residential area are also in the process of being addressed by the TCRA. The cap protects against direct contact with contaminated soil and is maintained in good condition. Contaminated soil in the ROS area was excavated and disposed of off-site. ICs are in place on the capped parcels
30
to protect the remedy and limit land use on the parcels. Property owners are aware of the use restrictions and will receive an updated copy of the ICIAP. Under normal water table conditions, the groundwater plume is contained by the groundwater extraction and recovery system as demonstrated by the capture zone analysis. During high water-table conditions as occurred in 2018-2019, contaminated groundwater can discharge to the ground surface and/or enter residential crawl spaces. The TCRA has addressed the residential structure exposure pathway and additional actions to treat and hydraulically contain groundwater in residential yards are ongoing and largely complete. Groundwater use and well installation are prohibited in the vicinity of the site. OU1 In 2019, Parcel 1 the main parcel associated with the cap was subdivided, acquired a portion of Parcel 3, and was consolidated into Parcel 1a. The ICIAP has Parcel 2 listed as several parcels that no longer exist. The ICIAP should be updated to reflect this change and other changes in ownership. The ICIAP should also be updated to include references to the 2016 Environmental Notice and the 2015 Informational Letter, which serve as ICs for Parcels 1a and 3, and to update the parcel number for Parcel 2. An updated copy of the ICIAP should be provided to all current property owners. OU2/OU3 The groundwater treatment plant is operating as designed. However, the plant is operating at its maximum capacity. The recovery wells and CTR generally contain the shallow and deep plumes within the capture zone. COC concentrations are decreasing in most wells, and the PCP plume area is getting smaller. However, some COC concentrations are increasing just downgradient of the source area. In addition, in early 2019, EPA and PADEP identified elevated concentrations of Site contaminants in seep water and soil in residential yards and crawl spaces near the Site. EPA is currently implementing a TCRA to address the soil and groundwater contamination in these yards as well as conduct additional work to prevent future contamination in these areas. EPA is working with PADEP to further investigate the current extent of groundwater contamination and evaluate strategies to optimize the groundwater remedy at the Site. Additional monitoring wells have been installed to refine the groundwater contaminant plumes. These new wells can be converted to recovery wells, if necessary, to achieve additional capture of the plume. The additional water that is being collected as a result of the TCRA will exceed the current treatment capacity of the plant. EPA and PADEP are updating the design of the groundwater treatment system to expand the plant capacity and address the groundwater contamination. Construction of the expanded plant will begin in late 2020. Once completed, the GWTP will have the capacity to treat approximately 150 gallons per minute. The Township Ordinance prohibits the installation of groundwater wells in the vicinity of the Site which is effective in preventing any new outside influences of the plume or capture zone as well as preventing ingestion of impacted groundwater. The ecological monitoring indicates some improvement since the OU2/OU3 remedy was implemented. The overall trend in concentrations for most Site COCs, particularly organics, is down over time. However, more recent sampling events have observed increased concentrations in certain sampling locations. These increases are attributed to the same conditions that prompted the wet conditions and TCRA in the residential area. The high water table was found to be creating a situation where contaminated groundwater was entering the stormwater sewer through cracks in upstream portions. Hence, as part of the TCRA, the entirety of the stormwater sewer was lined. Not only does this storm sewer discharge directly to Naylors Run, but also surface runoff from contaminated residential properties typically will reach Naylors Run via overland flow if it does not first infiltrate into the ground surface. This represents a second pathway for increased contaminant discharge. Additionally, it is likely that natural points where groundwater discharges to the creek could also contain increased concentrations of site COCs. It is expected that the efforts of the TCRA will address these issues and the long-term downtrend in concentrations within the creek with resume. Ecological monitoring should continue to evaluate potential impacts from the Site on the recovery of Naylors Run.
31
QUESTION B: Are the exposure assumptions, toxicity data, cleanup levels and RAOs used at the time of the remedy selection still valid? Yes. The OU3 ROD states that the remediation of the groundwater will continue until MCLs or risk-based criteria are attained, the excess cancer risk associated with potential residential use of the groundwater is reduced to 1x10-
4, and the HI is reduced to 1. This remediation goal is still protective. The MCLs and risk-based standards were compared to the current MCLs and EPA tapwater regional screening levels (RSLs) (Appendix I, Table I-1, and Appendix J, Table J-1, respectively). There have been no changes that impact the validity of the groundwater remedial goals. The OU3 ROD developed remedial goals for the ROS soils. The cleanup goals are a combination of site‐specific risk‐based cleanup levels for individual contaminants based on the direct contact pathway and Pennsylvania’s Land Recycling and Environmental Remediation Standards Act, which promulgated statewide health standards for soil. This FYR evaluated the soil RGOs using the current statewide health standards and EPA residential soil RSLs (Appendix I, Table I-2, and Appendix J, Table J-2, respectively). Based on the current ARARs and toxicity data (as incorporated in EPA RSLs and the current statewide health standards), the soil RGOs remain valid. The OU3 ROD-based cleanup goals included potential residential exposure. The OU3 selected remedy also addressed contaminated soils on other residential properties adjacent to the ROS area. However, the entry of contaminated groundwater into residential structures had not previously occurred. While the remedial goals for soil and groundwater are still applicable and appropriate, the TCRA has addressed the potential exposure pathway of groundwater entering residential structures. Further, the potential exposure pathway to contaminated soils is in the process of being addressed by the excavation of soils on several properties. Those properties not yet addressed by the TCRA have been provided with documentation which provides recommendations on how to minimize potential exposure to contaminants until the response actions are completed. Commercial development continues near and on the Site. One on-site business, Mr. Storage, is currently expanding its current storage business and has been in contact with PADEP and EPA to obtain the necessary approvals prior to the start of construction to ensure the continued protectiveness of the remedy. As discussed in the previous FYR Report, due to the presence of a shallow groundwater plume in the vicinity of residences and businesses, vapor intrusion risk has been evaluated at the Site. In 2011, EPA conducted a residential vapor intrusion investigation for residences near the Site focused on trichloroethylene (TCE). TCE is not currently a COC; however, it has historically been present in the groundwater above its MCL. EPA conducted indoor air sampling at 10 properties. TCE was not detected in any samples. Indoor air sampling was also conducted at the YMCA in 2014 and 2015. There is a vapor mitigation system in place beneath the YMCA building foundation. Based on the results of the YMCA sampling, EPA concluded that vapor intrusion does not appear to be occurring. A possible indoor air source may be present, which resulted in detected concentrations of naphthalene. EPA conducted a risk assessment based on the maximum concentrations and all risks were below or within EPA’s acceptable threshold and criteria. During the 2019 RSE, PADEP evaluated vapor intrusion in the residence that initially experienced water seeping into their crawlspace and determined vapor intrusion was not occurring. QUESTION C: Has any other information come to light that could call into question the protectiveness of the remedy? No other information has come to light that could call into question the protectiveness of the remedy. Findings of the RSE and TCRA implemented to address those findings are discussed in detail above.
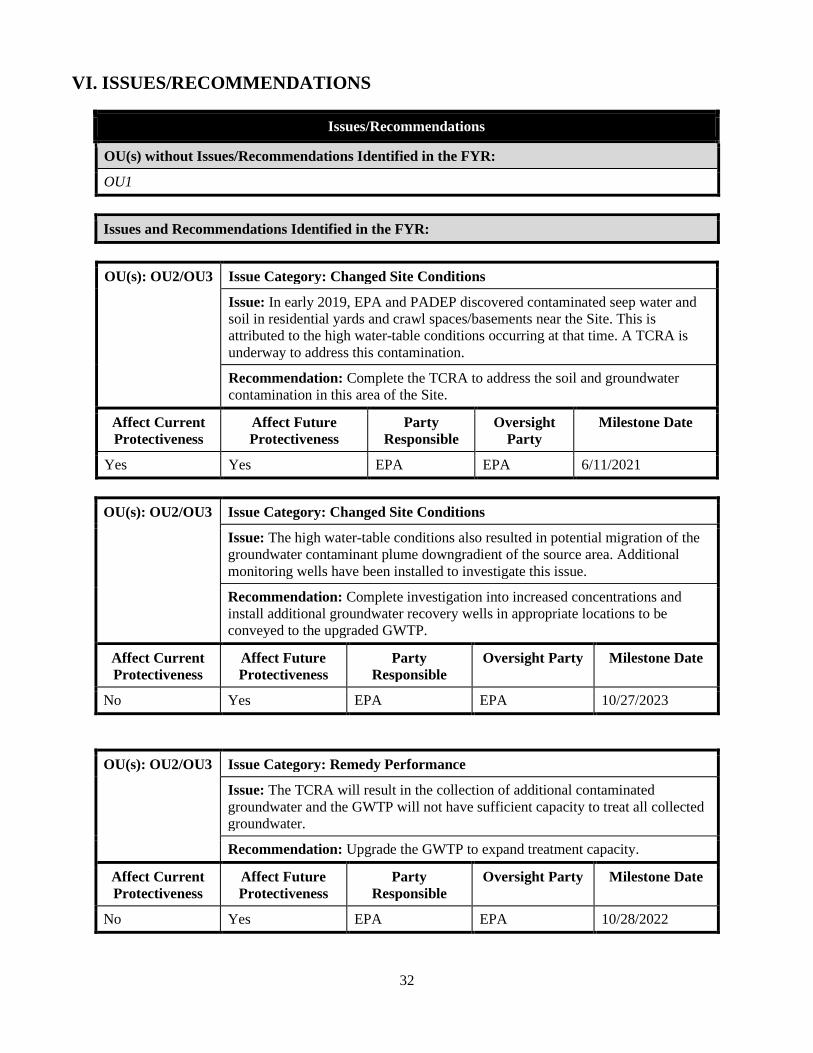
32
VI. ISSUES/RECOMMENDATIONS
Issues/Recommendations
OU(s) without Issues/Recommendations Identified in the FYR:
OU1
Issues and Recommendations Identified in the FYR:
OU(s): OU2/OU3 Issue Category: Changed Site Conditions
Issue: In early 2019, EPA and PADEP discovered contaminated seep water and soil in residential yards and crawl spaces/basements near the Site. This is attributed to the high water-table conditions occurring at that time. A TCRA is underway to address this contamination.
Recommendation: Complete the TCRA to address the soil and groundwater contamination in this area of the Site.
Affect Current Protectiveness
Affect Future Protectiveness
Party Responsible
Oversight Party
Milestone Date
Yes Yes EPA EPA 6/11/2021
OU(s): OU2/OU3 Issue Category: Changed Site Conditions
Issue: The high water-table conditions also resulted in potential migration of the groundwater contaminant plume downgradient of the source area. Additional monitoring wells have been installed to investigate this issue.
Recommendation: Complete investigation into increased concentrations and install additional groundwater recovery wells in appropriate locations to be conveyed to the upgraded GWTP.
Affect Current Protectiveness
Affect Future Protectiveness
Party Responsible
Oversight Party Milestone Date
No Yes EPA EPA 10/27/2023
OU(s): OU2/OU3 Issue Category: Remedy Performance
Issue: The TCRA will result in the collection of additional contaminated groundwater and the GWTP will not have sufficient capacity to treat all collected groundwater.
Recommendation: Upgrade the GWTP to expand treatment capacity.
Affect Current Protectiveness
Affect Future Protectiveness
Party Responsible
Oversight Party Milestone Date
No Yes EPA EPA 10/28/2022
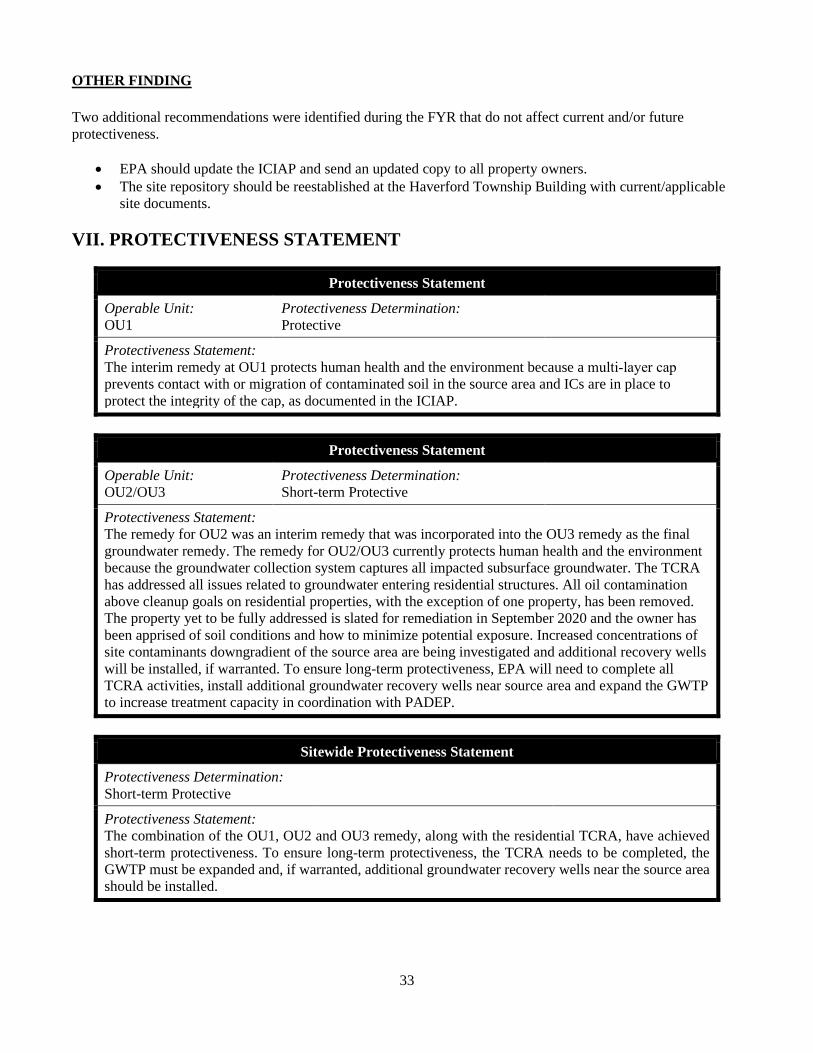
33
OTHER FINDING Two additional recommendations were identified during the FYR that do not affect current and/or future protectiveness.
• EPA should update the ICIAP and send an updated copy to all property owners. • The site repository should be reestablished at the Haverford Township Building with current/applicable
site documents. VII. PROTECTIVENESS STATEMENT
Protectiveness Statement
Operable Unit: OU1
Protectiveness Determination: Protective
Protectiveness Statement: The interim remedy at OU1 protects human health and the environment because a multi‐layer cap prevents contact with or migration of contaminated soil in the source area and ICs are in place to protect the integrity of the cap, as documented in the ICIAP.
Protectiveness Statement
Operable Unit: OU2/OU3
Protectiveness Determination: Short-term Protective
Protectiveness Statement: The remedy for OU2 was an interim remedy that was incorporated into the OU3 remedy as the final groundwater remedy. The remedy for OU2/OU3 currently protects human health and the environment because the groundwater collection system captures all impacted subsurface groundwater. The TCRA has addressed all issues related to groundwater entering residential structures. All oil contamination above cleanup goals on residential properties, with the exception of one property, has been removed. The property yet to be fully addressed is slated for remediation in September 2020 and the owner has been apprised of soil conditions and how to minimize potential exposure. Increased concentrations of site contaminants downgradient of the source area are being investigated and additional recovery wells will be installed, if warranted. To ensure long-term protectiveness, EPA will need to complete all TCRA activities, install additional groundwater recovery wells near source area and expand the GWTP to increase treatment capacity in coordination with PADEP.
Sitewide Protectiveness Statement
Protectiveness Determination: Short-term Protective
Protectiveness Statement: The combination of the OU1, OU2 and OU3 remedy, along with the residential TCRA, have achieved short-term protectiveness. To ensure long-term protectiveness, the TCRA needs to be completed, the GWTP must be expanded and, if warranted, additional groundwater recovery wells near the source area should be installed.

34
VIII. NEXT REVIEW The next FYR Report for the Havertown PCP Superfund site is required five years from the completion date of this review.
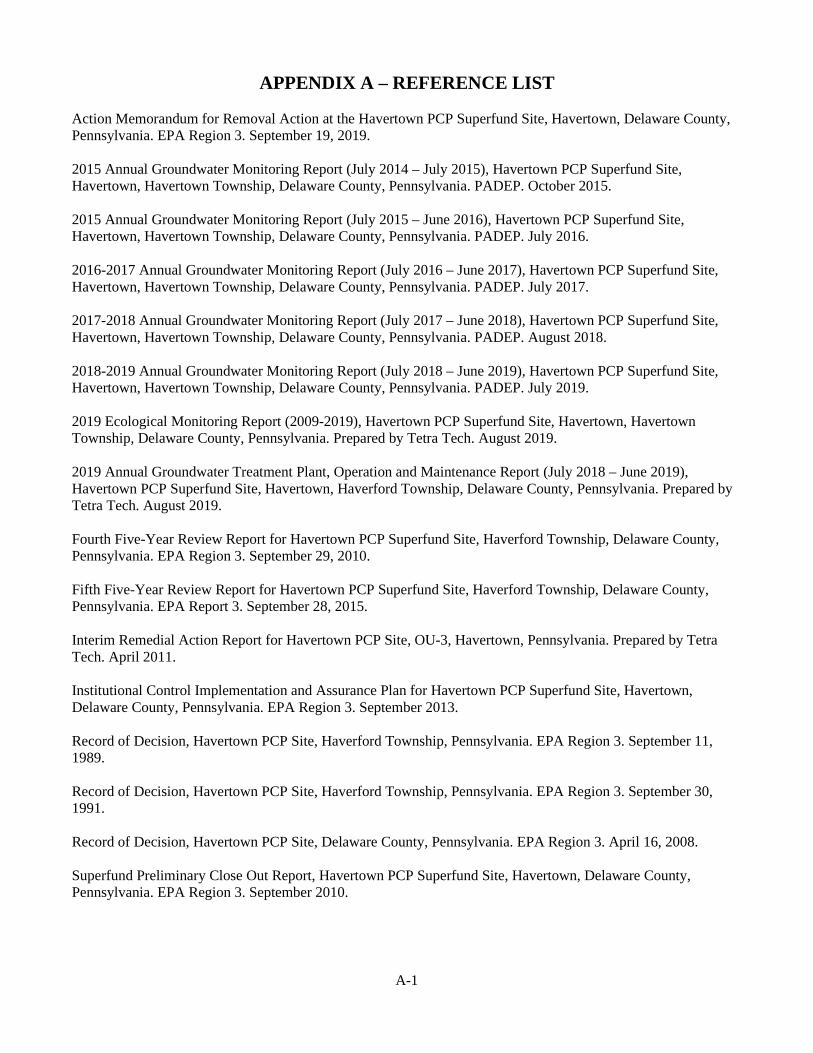
A-1
APPENDIX A – REFERENCE LIST
Action Memorandum for Removal Action at the Havertown PCP Superfund Site, Havertown, Delaware County, Pennsylvania. EPA Region 3. September 19, 2019. 2015 Annual Groundwater Monitoring Report (July 2014 – July 2015), Havertown PCP Superfund Site, Havertown, Havertown Township, Delaware County, Pennsylvania. PADEP. October 2015. 2015 Annual Groundwater Monitoring Report (July 2015 – June 2016), Havertown PCP Superfund Site, Havertown, Havertown Township, Delaware County, Pennsylvania. PADEP. July 2016. 2016-2017 Annual Groundwater Monitoring Report (July 2016 – June 2017), Havertown PCP Superfund Site, Havertown, Havertown Township, Delaware County, Pennsylvania. PADEP. July 2017. 2017-2018 Annual Groundwater Monitoring Report (July 2017 – June 2018), Havertown PCP Superfund Site, Havertown, Havertown Township, Delaware County, Pennsylvania. PADEP. August 2018. 2018-2019 Annual Groundwater Monitoring Report (July 2018 – June 2019), Havertown PCP Superfund Site, Havertown, Havertown Township, Delaware County, Pennsylvania. PADEP. July 2019. 2019 Ecological Monitoring Report (2009-2019), Havertown PCP Superfund Site, Havertown, Havertown Township, Delaware County, Pennsylvania. Prepared by Tetra Tech. August 2019. 2019 Annual Groundwater Treatment Plant, Operation and Maintenance Report (July 2018 – June 2019), Havertown PCP Superfund Site, Havertown, Haverford Township, Delaware County, Pennsylvania. Prepared by Tetra Tech. August 2019. Fourth Five-Year Review Report for Havertown PCP Superfund Site, Haverford Township, Delaware County, Pennsylvania. EPA Region 3. September 29, 2010. Fifth Five-Year Review Report for Havertown PCP Superfund Site, Haverford Township, Delaware County, Pennsylvania. EPA Report 3. September 28, 2015. Interim Remedial Action Report for Havertown PCP Site, OU-3, Havertown, Pennsylvania. Prepared by Tetra Tech. April 2011. Institutional Control Implementation and Assurance Plan for Havertown PCP Superfund Site, Havertown, Delaware County, Pennsylvania. EPA Region 3. September 2013. Record of Decision, Havertown PCP Site, Haverford Township, Pennsylvania. EPA Region 3. September 11, 1989. Record of Decision, Havertown PCP Site, Haverford Township, Pennsylvania. EPA Region 3. September 30, 1991. Record of Decision, Havertown PCP Site, Delaware County, Pennsylvania. EPA Region 3. April 16, 2008. Superfund Preliminary Close Out Report, Havertown PCP Superfund Site, Havertown, Delaware County, Pennsylvania. EPA Region 3. September 2010.
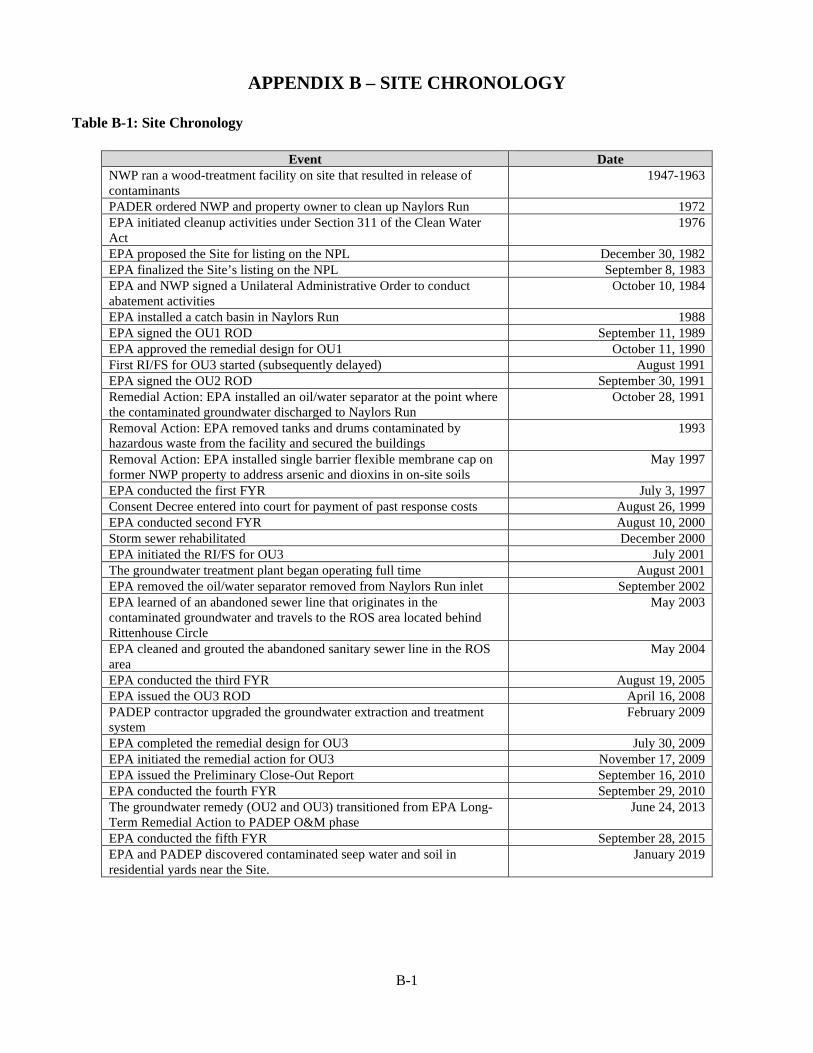
B-1
APPENDIX B – SITE CHRONOLOGY
Table B-1: Site Chronology
Event Date NWP ran a wood-treatment facility on site that resulted in release of contaminants
1947-1963
PADER ordered NWP and property owner to clean up Naylors Run 1972 EPA initiated cleanup activities under Section 311 of the Clean Water Act
1976
EPA proposed the Site for listing on the NPL December 30, 1982 EPA finalized the Site’s listing on the NPL September 8, 1983 EPA and NWP signed a Unilateral Administrative Order to conduct abatement activities
October 10, 1984
EPA installed a catch basin in Naylors Run 1988 EPA signed the OU1 ROD September 11, 1989 EPA approved the remedial design for OU1 October 11, 1990 First RI/FS for OU3 started (subsequently delayed) August 1991 EPA signed the OU2 ROD September 30, 1991 Remedial Action: EPA installed an oil/water separator at the point where the contaminated groundwater discharged to Naylors Run
October 28, 1991
Removal Action: EPA removed tanks and drums contaminated by hazardous waste from the facility and secured the buildings
1993
Removal Action: EPA installed single barrier flexible membrane cap on former NWP property to address arsenic and dioxins in on-site soils
May 1997
EPA conducted the first FYR July 3, 1997 Consent Decree entered into court for payment of past response costs August 26, 1999 EPA conducted second FYR August 10, 2000 Storm sewer rehabilitated December 2000 EPA initiated the RI/FS for OU3 July 2001 The groundwater treatment plant began operating full time August 2001 EPA removed the oil/water separator removed from Naylors Run inlet September 2002 EPA learned of an abandoned sewer line that originates in the contaminated groundwater and travels to the ROS area located behind Rittenhouse Circle
May 2003
EPA cleaned and grouted the abandoned sanitary sewer line in the ROS area
May 2004
EPA conducted the third FYR August 19, 2005 EPA issued the OU3 ROD April 16, 2008 PADEP contractor upgraded the groundwater extraction and treatment system
February 2009
EPA completed the remedial design for OU3 July 30, 2009 EPA initiated the remedial action for OU3 November 17, 2009 EPA issued the Preliminary Close-Out Report September 16, 2010 EPA conducted the fourth FYR September 29, 2010 The groundwater remedy (OU2 and OU3) transitioned from EPA Long- Term Remedial Action to PADEP O&M phase
June 24, 2013
EPA conducted the fifth FYR September 28, 2015 EPA and PADEP discovered contaminated seep water and soil in residential yards near the Site.
January 2019
C-1
APPENDIX C – ENVIRONMENTAL COVENANT
C-2
C-3
C-4
C-5
C-6
C-7
C-8
C-9
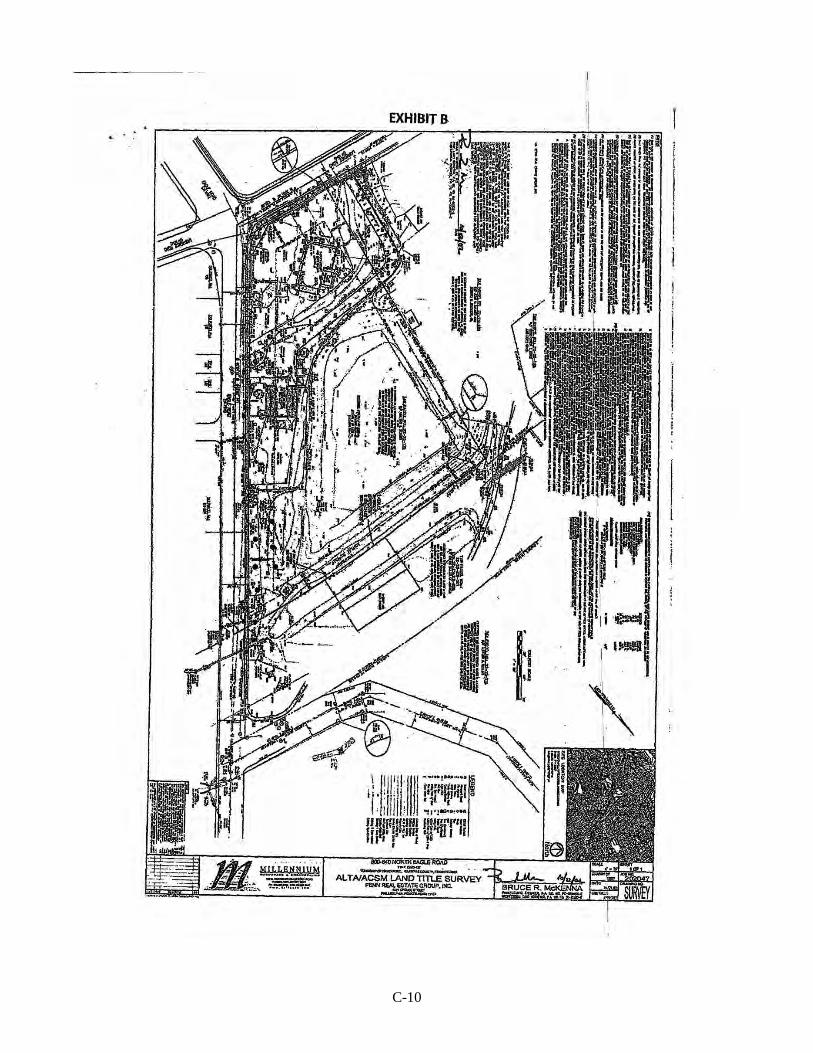
C-10
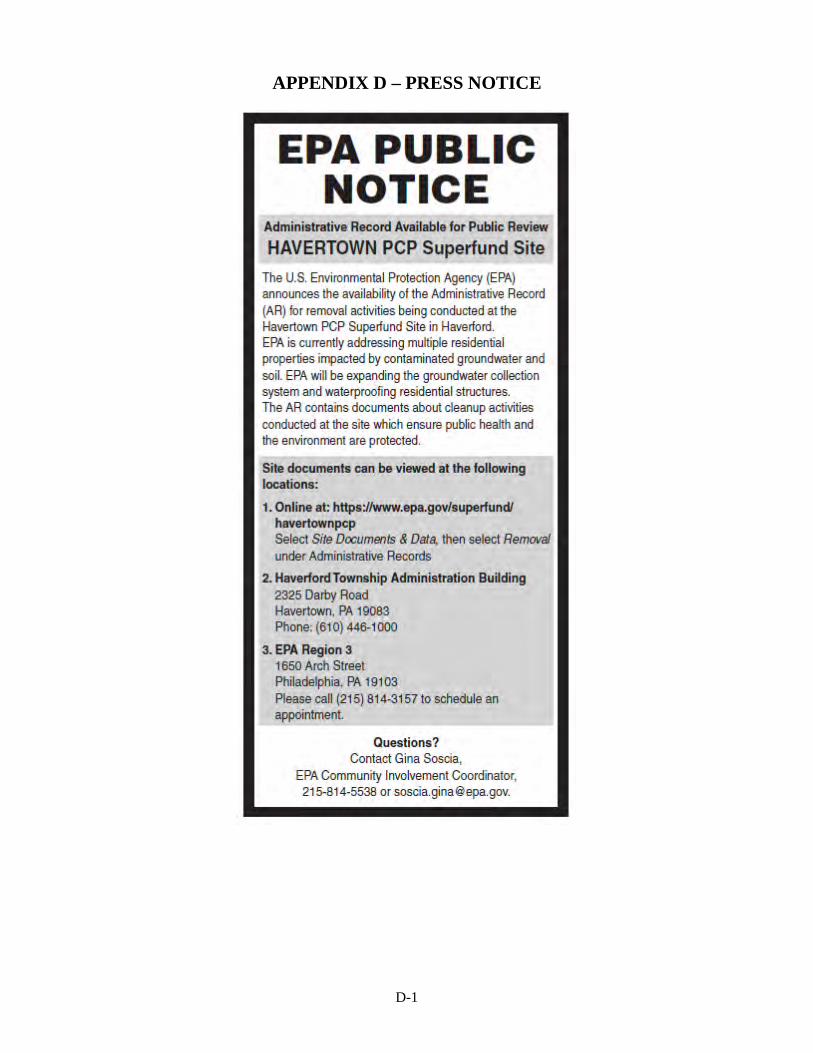
D-1
APPENDIX D – PRESS NOTICE
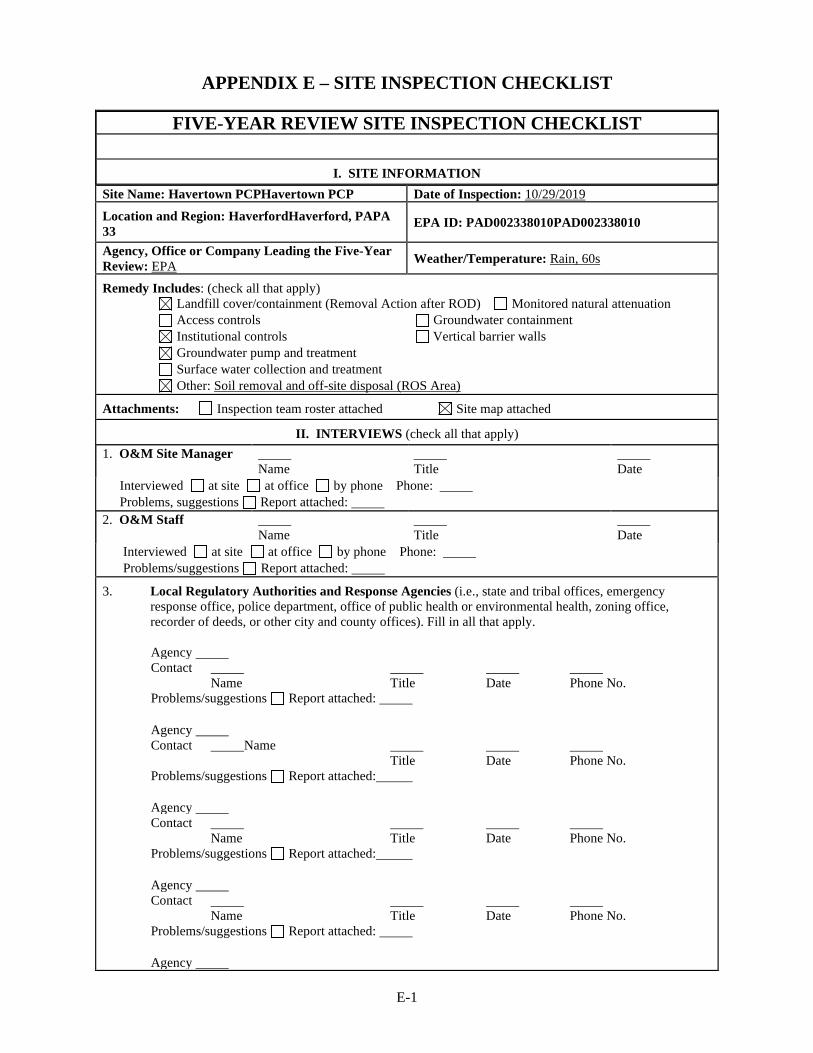
E-1
APPENDIX E – SITE INSPECTION CHECKLIST
FIVE-YEAR REVIEW SITE INSPECTION CHECKLIST
I. SITE INFORMATION
Site Name: Havertown PCPHavertown PCP Date of Inspection: 10/29/2019
Location and Region: HaverfordHaverford, PAPA 33
EPA ID: PAD002338010PAD002338010
Agency, Office or Company Leading the Five-Year Review: EPA Weather/Temperature: Rain, 60s
Remedy Includes: (check all that apply) Landfill cover/containment (Removal Action after ROD) Monitored natural attenuation Access controls Groundwater containment Institutional controls Vertical barrier walls Groundwater pump and treatment Surface water collection and treatment Other: Soil removal and off-site disposal (ROS Area)
Attachments: Inspection team roster attached Site map attached
II. INTERVIEWS (check all that apply) 1. O&M Site Manager
Name Title
Date
Interviewed at site at office by phone Phone: Problems, suggestions Report attached:
2. O&M Staff Name
Title
Date
Interviewed at site at office by phone Phone: Problems/suggestions Report attached:
3. Local Regulatory Authorities and Response Agencies (i.e., state and tribal offices, emergency response office, police department, office of public health or environmental health, zoning office, recorder of deeds, or other city and county offices). Fill in all that apply.
Agency Contact
Name Title
Date
Phone No.
Problems/suggestions Report attached: Agency Contact Name
Title Date
Phone No.
Problems/suggestions Report attached: Agency Contact
Name Title
Date
Phone No.
Problems/suggestions Report attached: Agency Contact
Name Title
Date
Phone No.
Problems/suggestions Report attached: Agency
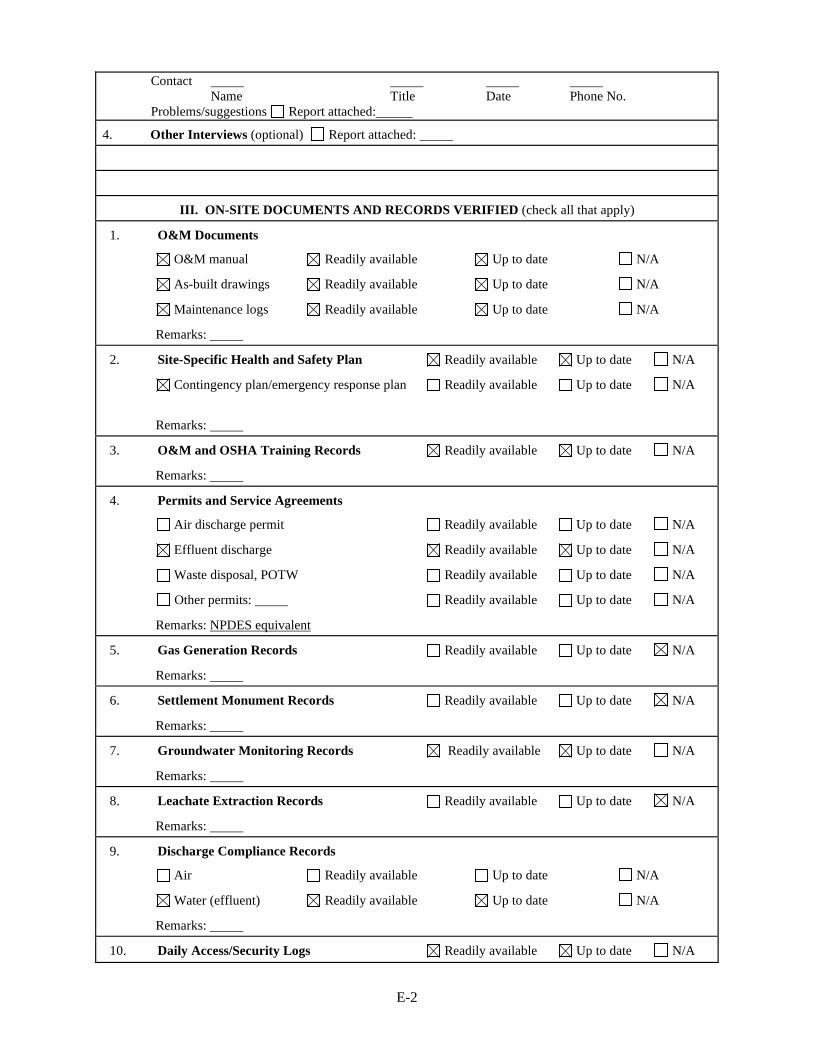
E-2
Contact Name
Title
Date
Phone No.
Problems/suggestions Report attached:
4. Other Interviews (optional) Report attached:
III. ON-SITE DOCUMENTS AND RECORDS VERIFIED (check all that apply)
1. O&M Documents
O&M manual Readily available Up to date N/A
As-built drawings Readily available Up to date N/A
Maintenance logs Readily available Up to date N/A
Remarks:
2. Site-Specific Health and Safety Plan Readily available Up to date N/A
Contingency plan/emergency response plan
Readily available Up to date N/A
Remarks:
3. O&M and OSHA Training Records Readily available Up to date N/A
Remarks:
4. Permits and Service Agreements
Air discharge permit Readily available Up to date N/A
Effluent discharge Readily available Up to date N/A
Waste disposal, POTW Readily available Up to date N/A
Other permits: Readily available Up to date N/A
Remarks: NPDES equivalent
5. Gas Generation Records Readily available Up to date N/A
Remarks:
6. Settlement Monument Records Readily available Up to date N/A
Remarks:
7. Groundwater Monitoring Records Readily available Up to date N/A
Remarks:
8. Leachate Extraction Records Readily available Up to date N/A
Remarks:
9. Discharge Compliance Records
Air Readily available Up to date N/A
Water (effluent) Readily available Up to date N/A
Remarks:
10. Daily Access/Security Logs Readily available Up to date N/A
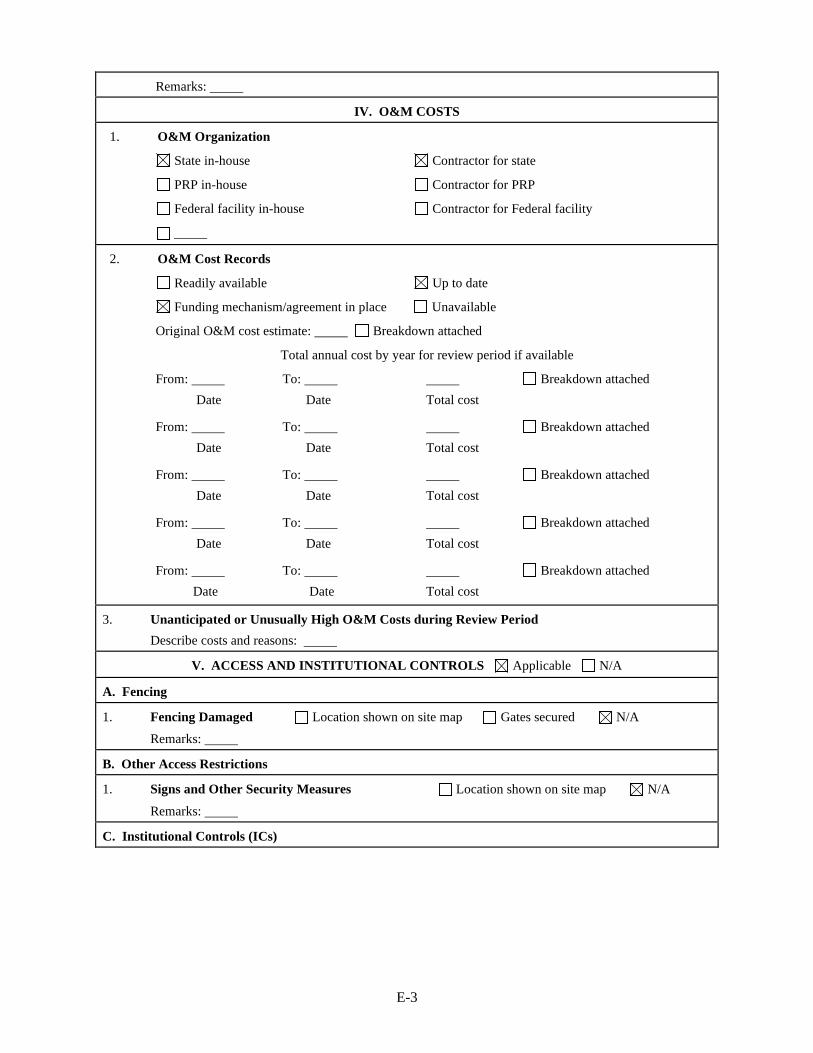
E-3
Remarks:
IV. O&M COSTS
1. O&M Organization
State in-house Contractor for state
PRP in-house Contractor for PRP
Federal facility in-house Contractor for Federal facility
2. O&M Cost Records
Readily available Up to date
Funding mechanism/agreement in place Unavailable
Original O&M cost estimate: Breakdown attached
Total annual cost by year for review period if available
From: Date
To: Date
Total cost
Breakdown attached
From: Date
To: Date
Total cost
Breakdown attached
From: Date
To: Date
Total cost
Breakdown attached
From: Date
To: Date
Total cost
Breakdown attached
From: Date
To: Date
Total cost
Breakdown attached
3. Unanticipated or Unusually High O&M Costs during Review Period Describe costs and reasons:
V. ACCESS AND INSTITUTIONAL CONTROLS Applicable N/A
A. Fencing
1. Fencing Damaged Location shown on site map Gates secured N/A Remarks:
B. Other Access Restrictions
1. Signs and Other Security Measures Location shown on site map N/A
Remarks:
C. Institutional Controls (ICs)
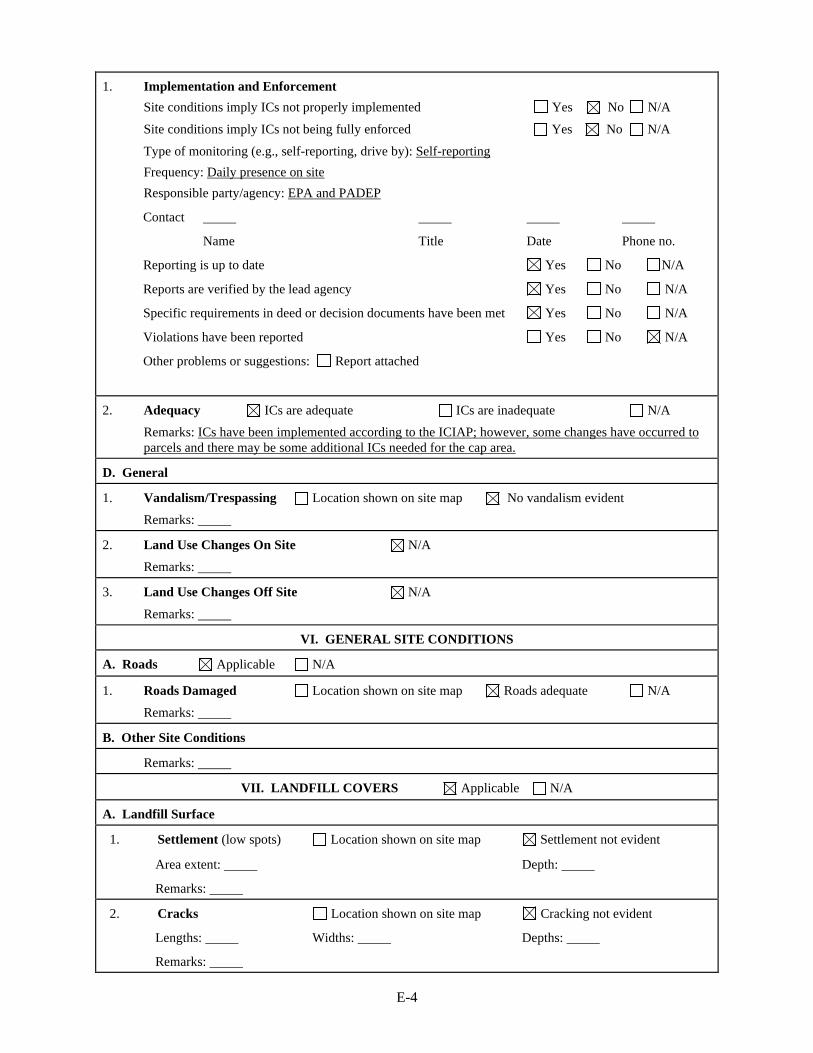
E-4
1. Implementation and Enforcement Site conditions imply ICs not properly implemented Yes No N/A
Site conditions imply ICs not being fully enforced Yes No N/A
Type of monitoring (e.g., self-reporting, drive by): Self-reporting Frequency: Daily presence on site Responsible party/agency: EPA and PADEP
Contact
Name Title Date Phone no.
Reporting is up to date Yes No N/A
Reports are verified by the lead agency Yes No N/A
Specific requirements in deed or decision documents have been met Yes No N/A
Violations have been reported Yes No N/A
Other problems or suggestions: Report attached
2. Adequacy ICs are adequate ICs are inadequate N/A Remarks: ICs have been implemented according to the ICIAP; however, some changes have occurred to parcels and there may be some additional ICs needed for the cap area.
D. General
1. Vandalism/Trespassing Location shown on site map No vandalism evident Remarks:
2. Land Use Changes On Site N/A Remarks:
3. Land Use Changes Off Site N/A
Remarks:
VI. GENERAL SITE CONDITIONS
A. Roads Applicable N/A
1. Roads Damaged Location shown on site map Roads adequate N/A Remarks:
B. Other Site Conditions
Remarks:
VII. LANDFILL COVERS Applicable N/A
A. Landfill Surface
1. Settlement (low spots) Location shown on site map Settlement not evident
Area extent: Depth:
Remarks:
2. Cracks Location shown on site map Cracking not evident
Lengths: Widths: Depths:
Remarks:

E-5
3. Erosion Location shown on site map Erosion not evident
Area extent: Depth:
Remarks:
4. Holes Location shown on site map Holes not evident
Area extent: Depth:
Remarks:
5. Vegetative Cover Grass Cover properly established
No signs of stress Trees/shrubs (indicate size and locations on a diagram)
Remarks:
6. Alternative Cover (e.g., armored rock, concrete) N/A
Remarks:
7. Bulges Location shown on site map Bulges not evident
Area extent: Height:
Remarks:
8. Wet Areas/Water Damage
Wet areas/water damage not evident
Wet areas Location shown on site map Area extent:
Ponding Location shown on site map Area extent:
Seeps Location shown on site map Area extent:
Soft subgrade Location shown on site map Area extent:
Remarks:
9. Slope Instability Slides Location shown on site map
No evidence of slope instability
Area extent:
Remarks:
B. Benches Applicable N/A
(Horizontally constructed mounds of earth placed across a steep landfill side slope to interrupt the slope in order to slow down the velocity of surface runoff and intercept and convey the runoff to a lined channel.)
1. Flows Bypass Bench Location shown on site map N/A or okay
Remarks:
2. Bench Breached Location shown on site map N/A or okay
Remarks:
3. Bench Overtopped Location shown on site map N/A or okay
Remarks:
C. Letdown Channels Applicable N/A
(Channel lined with erosion control mats, riprap, grout bags or gabions that descend down the steep side slope of the cover and will allow the runoff water collected by the benches to move off of the landfill cover without creating erosion gullies.)

E-6
1. Settlement (Low spots) Location shown on site map No evidence of settlement
Area extent: Depth:
Remarks:
2. Material Degradation Location shown on site map No evidence of degradation
Material type: Area extent:
Remarks:
3. Erosion Location shown on site map No evidence of erosion
Area extent: Depth:
Remarks:
4. Undercutting Location shown on site map No evidence of undercutting
Area extent: Depth:
Remarks:
5. Obstructions Type: No obstructions
Location shown on site map Area extent:
Size:
Remarks:
6. Excessive Vegetative Growth Type:
No evidence of excessive growth
Vegetation in channels does not obstruct flow
Location shown on site map Area extent:
Remarks:
D. Cover Penetrations Applicable N/A
1. Gas Vents Active Passive
Properly secured/locked Functioning Routinely sampled Good condition
Evidence of leakage at penetration Needs maintenance N/A
Remarks:
2. Gas Monitoring Probes
Properly secured/locked Functioning Routinely sampled Good condition
Evidence of leakage at penetration Needs maintenance N/A
Remarks:
3. Monitoring Wells (within surface area of landfill)
Properly secured/locked Functioning Routinely sampled Good condition
Evidence of leakage at penetration Needs maintenance N/A
Remarks:
4. Extraction Wells Leachate
Properly secured/locked Functioning Routinely sampled Good condition

E-7
Evidence of leakage at penetration Needs maintenance N/A
Remarks:
5. Settlement Monuments Located Routinely surveyed N/A
Remarks:
E. Gas Collection and Treatment Applicable N/A
1. Gas Treatment Facilities
Flaring Thermal destruction Collection for reuse
Good condition Needs maintenance
Remarks:
2. Gas Collection Wells, Manifolds and Piping
Good condition Needs maintenance
Remarks:
3. Gas Monitoring Facilities (e.g., gas monitoring of adjacent homes or buildings)
Good condition Needs maintenance N/A
Remarks:
F. Cover Drainage Layer Applicable N/A
1. Outlet Pipes Inspected Functioning N/A
Remarks:
2. Outlet Rock Inspected Functioning N/A
Remarks:
G. Detention/Sedimentation Ponds Applicable N/A
1. Siltation Area extent: Depth: N/A
Siltation not evident
Remarks:
2. Erosion Area extent: Depth:
Erosion not evident
Remarks:
3. Outlet Works Functioning N/A
Remarks:
4. Dam Functioning N/A
Remarks:
H. Retaining Walls Applicable N/A
1. Deformations Location shown on site map Deformation not evident
Horizontal displacement: Vertical displacement:
Rotational displacement:
Remarks:

E-8
2. Degradation Location shown on site map Degradation not evident
Remarks:
I. Perimeter Ditches/Off-Site Discharge Applicable N/A
1. Siltation Location shown on site map Siltation not evident
Area extent: Depth:
Remarks:
2. Vegetative Growth Location shown on site map N/A
Vegetation does not impede flow
Area extent: Type:
Remarks:
3. Erosion Location shown on site map Erosion not evident
Area extent: Depth:
Remarks:
4. Discharge Structure Functioning N/A
Remarks:
VIII. VERTICAL BARRIER WALLS Applicable N/A
1. Settlement Location shown on site map Settlement not evident
Area extent: Depth:
Remarks:
2. Performance Monitoring Type of monitoring:
Performance not monitored
Frequency: Evidence of breaching
Head differential:
Remarks:
IX. GROUNDWATER/SURFACE WATER REMEDIES Applicable N/A
A. Groundwater Extraction Wells, Pumps and Pipelines Applicable N/A
1. Pumps, Wellhead Plumbing and Electrical
Good condition All required wells properly operating Needs maintenance N/A
Remarks:
2. Extraction System Pipelines, Valves, Valve Boxes and Other Appurtenances
Good condition Needs maintenance
Remarks:
3. Spare Parts and Equipment
Readily available Good condition Requires upgrade Needs to be provided
Remarks:
B. Surface Water Collection Structures, Pumps and Pipelines Applicable N/A

E-9
1. Collection Structures, Pumps and Electrical
Good condition Needs maintenance
Remarks:
2. Surface Water Collection System Pipelines, Valves, Valve Boxes and Other Appurtenances
Good condition Needs maintenance
Remarks:
3. Spare Parts and Equipment
Readily available Good condition Requires upgrade Needs to be provided
Remarks:
C. Treatment System Applicable N/A
1. Treatment Train (check components that apply)
Metals removal Oil/water separation Bioremediation
Air stripping Carbon adsorbers
Filters: GAC
Additive (e.g., chelation agent, flocculent): Hydrogen peroxide, polymer, anti-scalent, hypochlorite, Sodium Hydroxide
Others:
Good condition Needs maintenance
Sampling ports properly marked and functional
Sampling/maintenance log displayed and up to date
Equipment properly identified
Quantity of groundwater treated annually: See report
Quantity of surface water treated annually:
Remarks:
2. Electrical Enclosures and Panels (properly rated and functional)
N/A Good condition Needs maintenance
Remarks:
3. Tanks, Vaults, Storage Vessels
N/A Good condition Proper secondary containment Needs maintenance
Remarks:
4. Discharge Structure and Appurtenances
N/A Good condition Needs maintenance
Remarks:
5. Treatment Building(s)
N/A Good condition (esp. roof and doorways) Needs repair
Chemicals and equipment properly stored
Remarks:
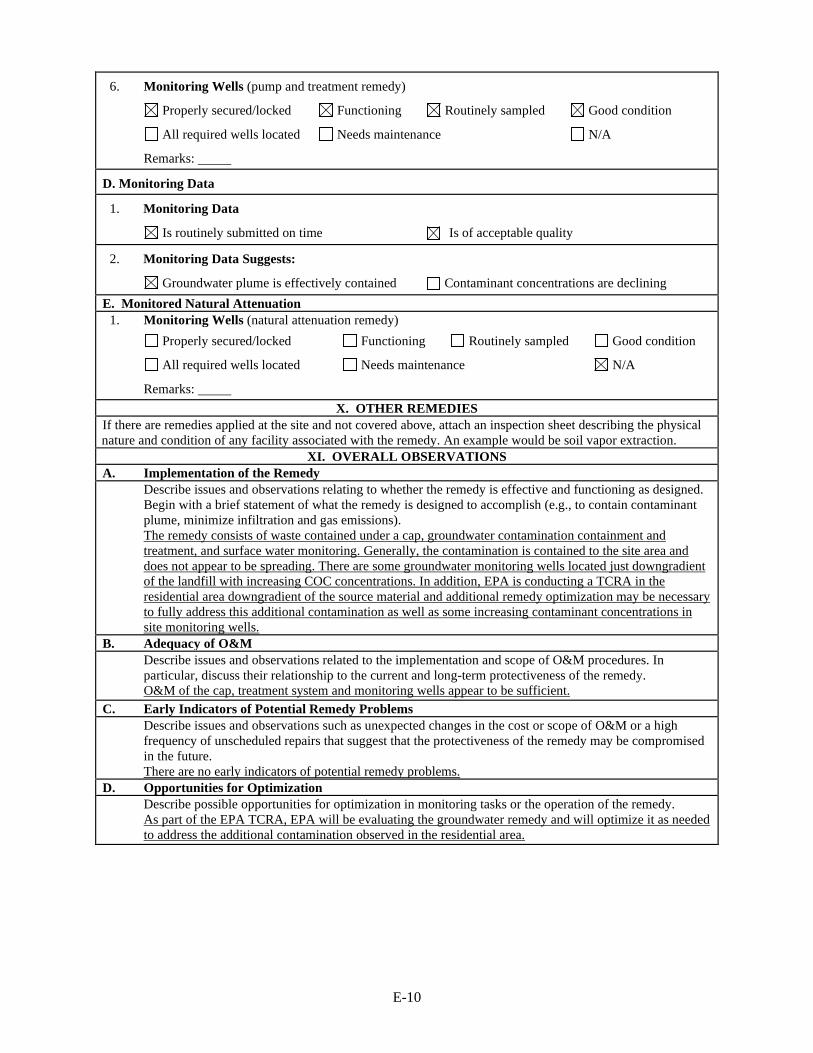
E-10
6. Monitoring Wells (pump and treatment remedy)
Properly secured/locked Functioning Routinely sampled Good condition
All required wells located Needs maintenance N/A
Remarks:
D. Monitoring Data
1. Monitoring Data
Is routinely submitted on time Is of acceptable quality
2. Monitoring Data Suggests:
Groundwater plume is effectively contained Contaminant concentrations are declining
E. Monitored Natural Attenuation 1. Monitoring Wells (natural attenuation remedy)
Properly secured/locked Functioning Routinely sampled Good condition
All required wells located Needs maintenance N/A
Remarks:
X. OTHER REMEDIES If there are remedies applied at the site and not covered above, attach an inspection sheet describing the physical nature and condition of any facility associated with the remedy. An example would be soil vapor extraction.
XI. OVERALL OBSERVATIONS A. Implementation of the Remedy
Describe issues and observations relating to whether the remedy is effective and functioning as designed. Begin with a brief statement of what the remedy is designed to accomplish (e.g., to contain contaminant plume, minimize infiltration and gas emissions). The remedy consists of waste contained under a cap, groundwater contamination containment and treatment, and surface water monitoring. Generally, the contamination is contained to the site area and does not appear to be spreading. There are some groundwater monitoring wells located just downgradient of the landfill with increasing COC concentrations. In addition, EPA is conducting a TCRA in the residential area downgradient of the source material and additional remedy optimization may be necessary to fully address this additional contamination as well as some increasing contaminant concentrations in site monitoring wells.
B. Adequacy of O&M Describe issues and observations related to the implementation and scope of O&M procedures. In particular, discuss their relationship to the current and long-term protectiveness of the remedy. O&M of the cap, treatment system and monitoring wells appear to be sufficient.
C. Early Indicators of Potential Remedy Problems Describe issues and observations such as unexpected changes in the cost or scope of O&M or a high frequency of unscheduled repairs that suggest that the protectiveness of the remedy may be compromised in the future. There are no early indicators of potential remedy problems.
D. Opportunities for Optimization Describe possible opportunities for optimization in monitoring tasks or the operation of the remedy. As part of the EPA TCRA, EPA will be evaluating the groundwater remedy and will optimize it as needed to address the additional contamination observed in the residential area.
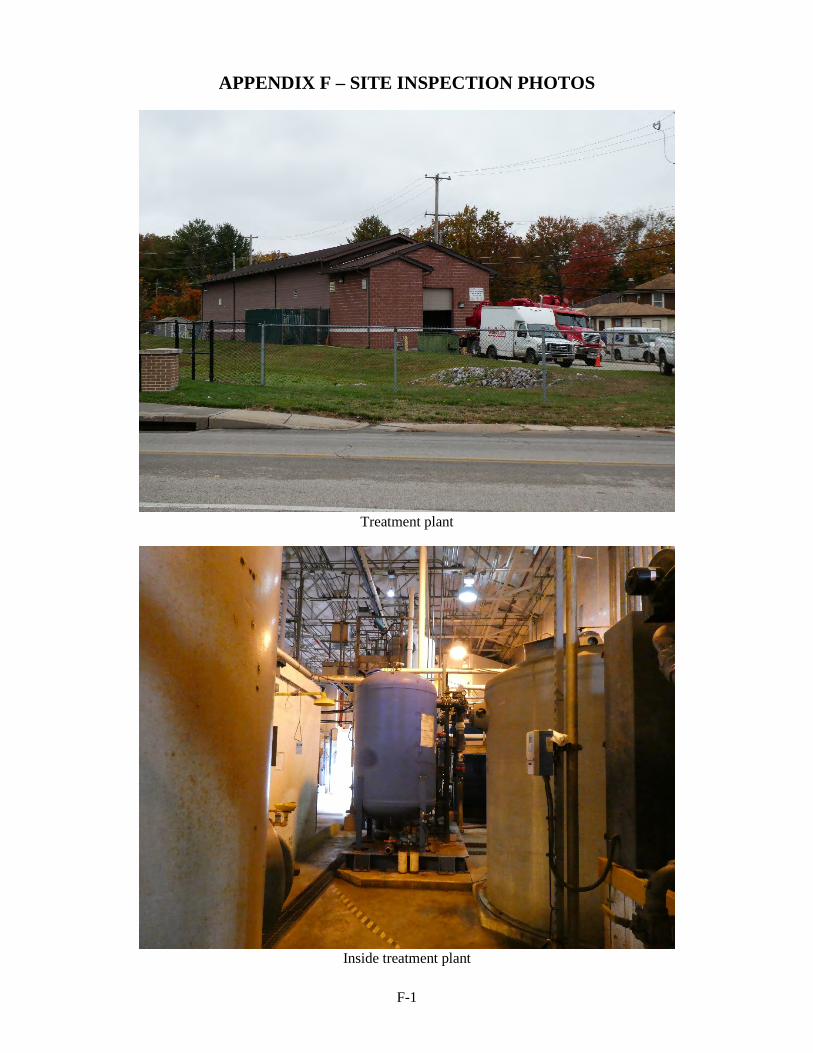
F-1
APPENDIX F – SITE INSPECTION PHOTOS
Treatment plant
Inside treatment plant
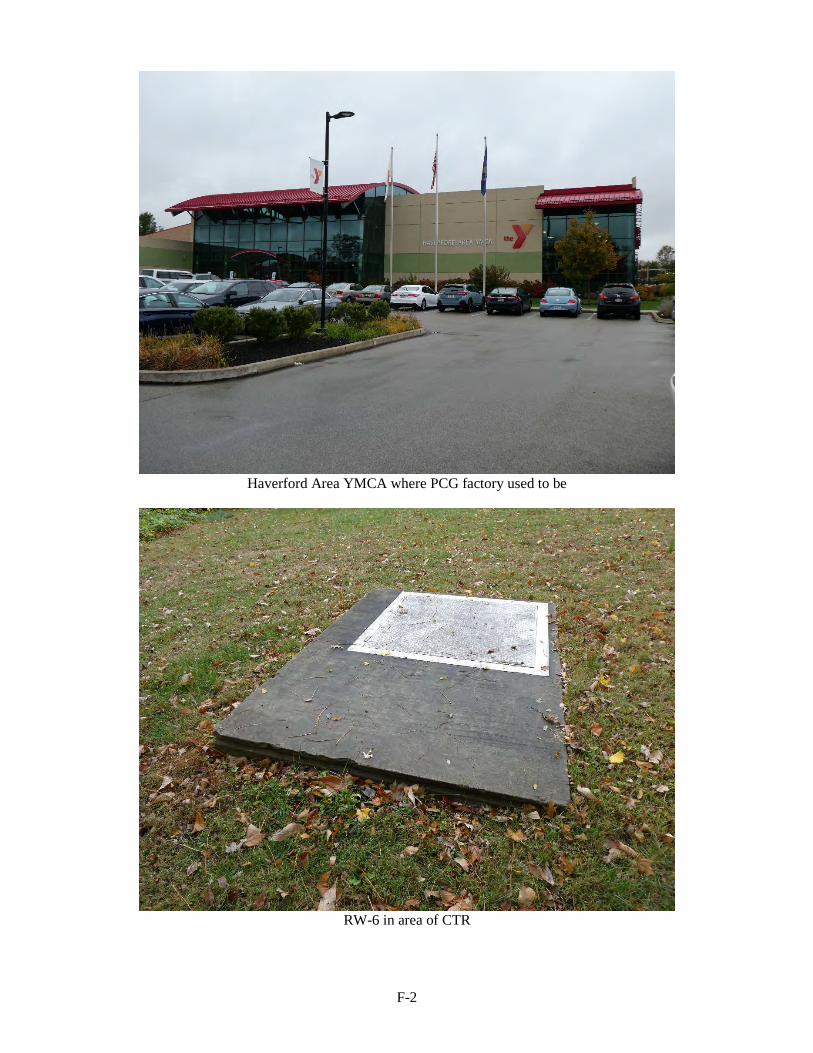
F-2
Haverford Area YMCA where PCG factory used to be
RW-6 in area of CTR
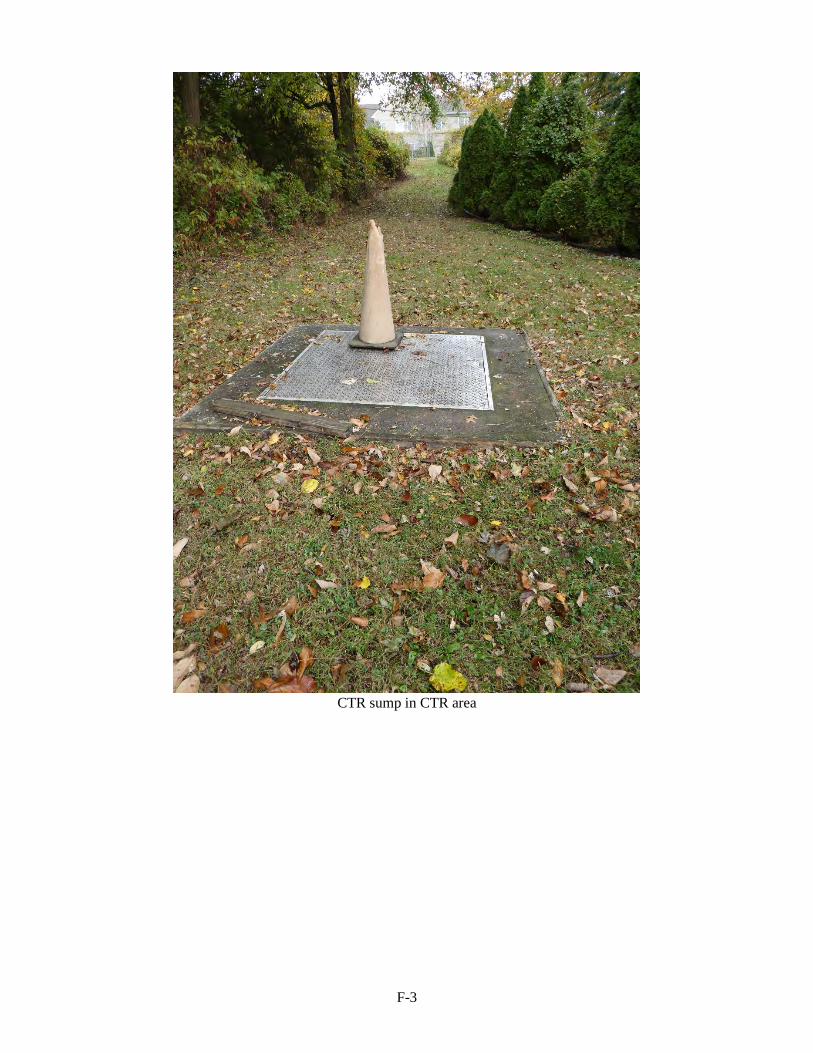
F-3
CTR sump in CTR area
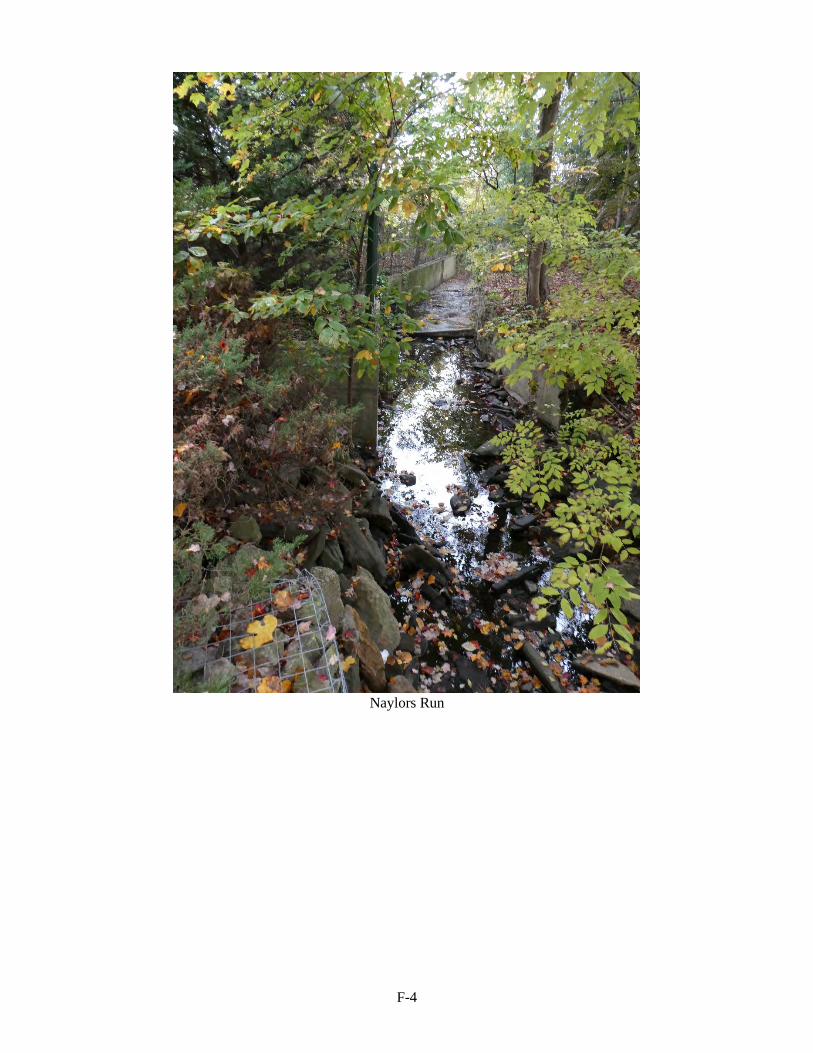
F-4
Naylors Run
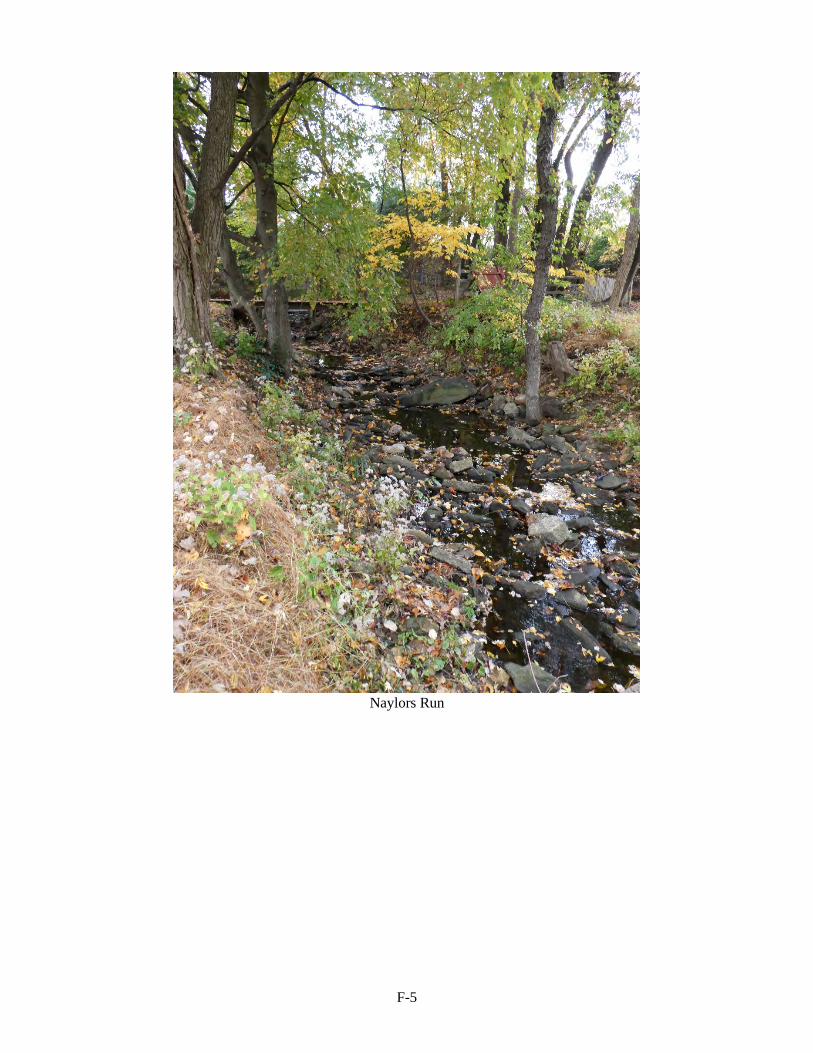
F-5
Naylors Run
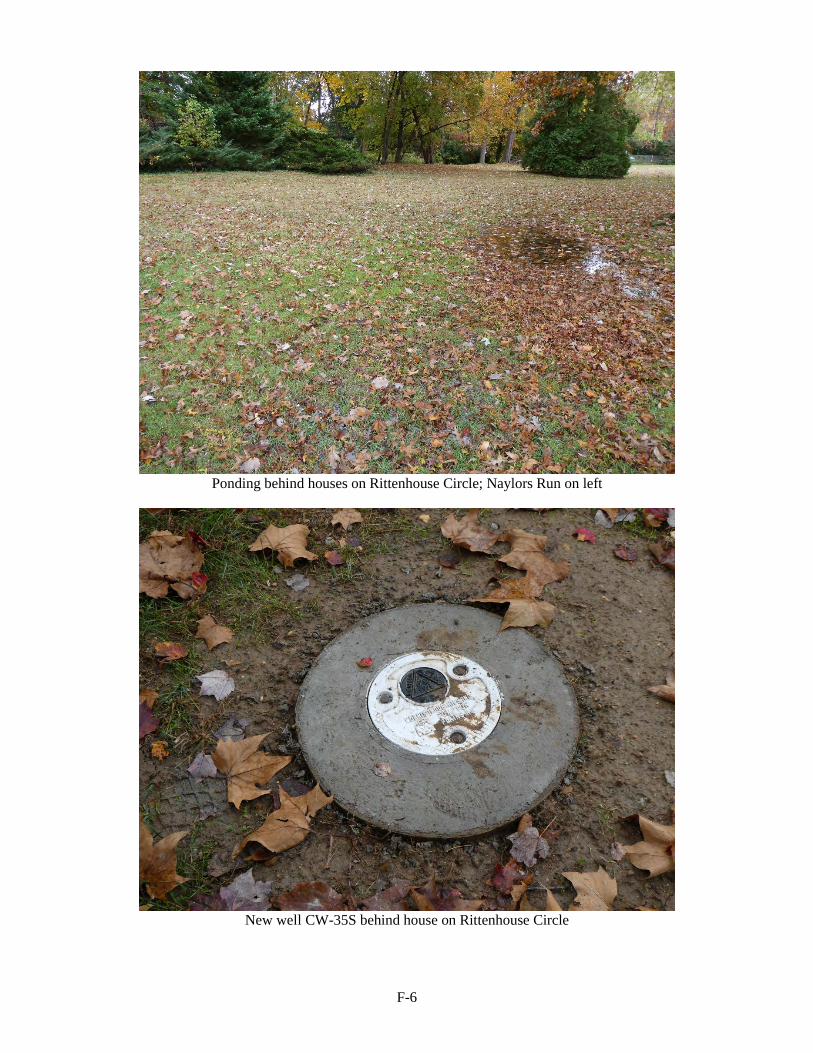
F-6
Ponding behind houses on Rittenhouse Circle; Naylors Run on left
New well CW-35S behind house on Rittenhouse Circle
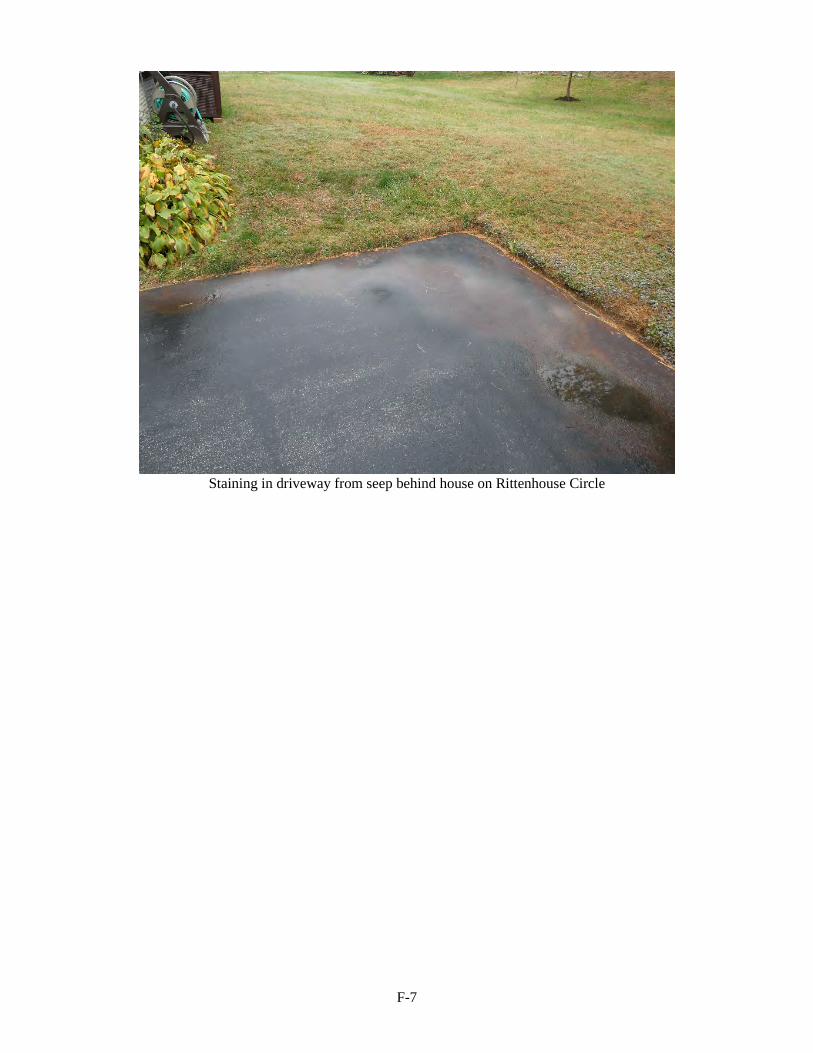
F-7
Staining in driveway from seep behind house on Rittenhouse Circle
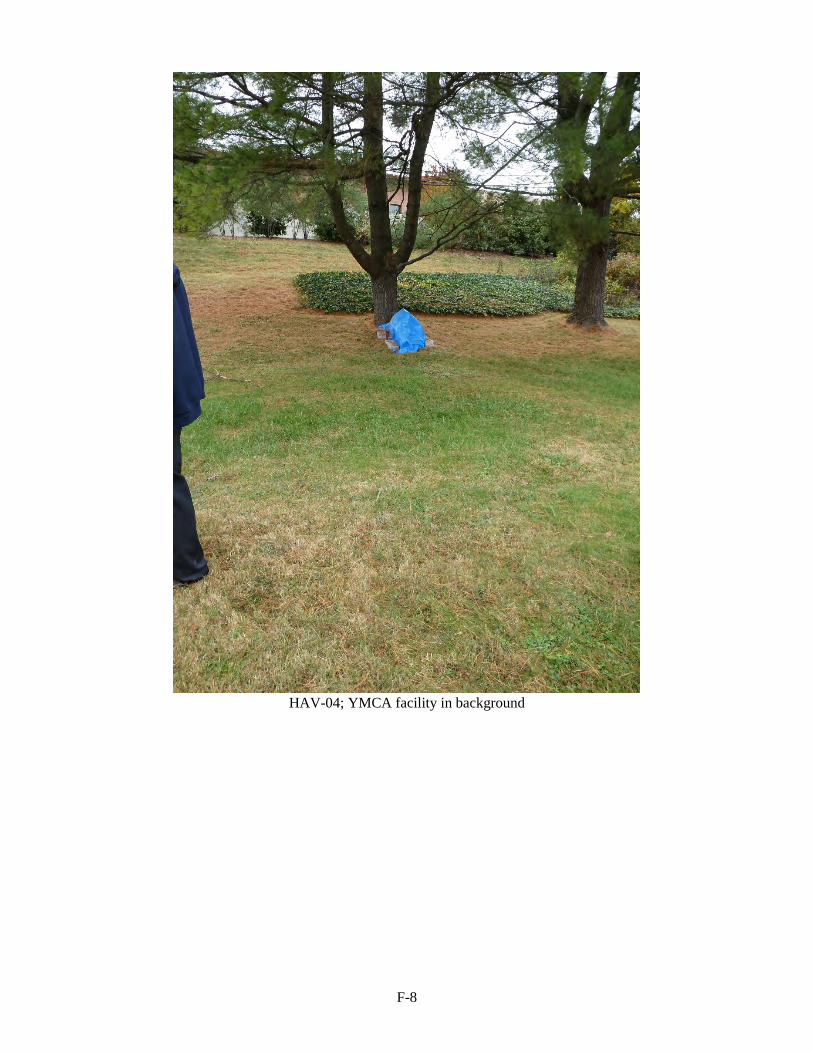
F-8
HAV-04; YMCA facility in background
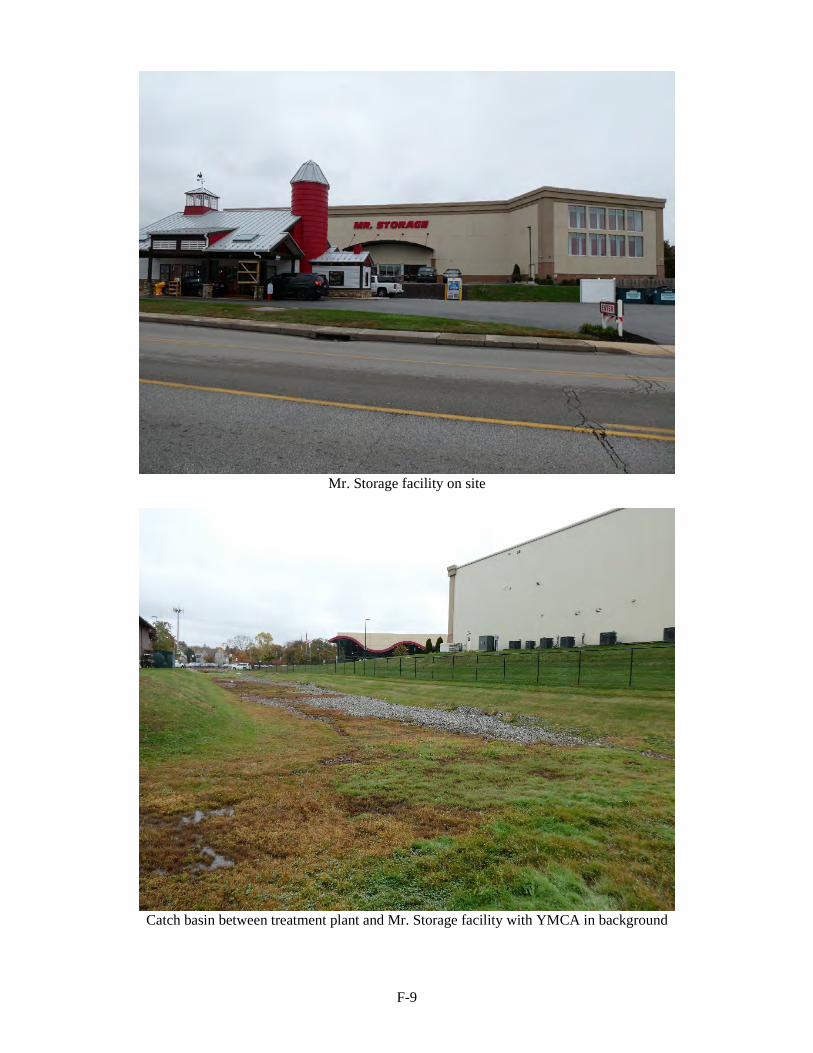
F-9
Mr. Storage facility on site
Catch basin between treatment plant and Mr. Storage facility with YMCA in background
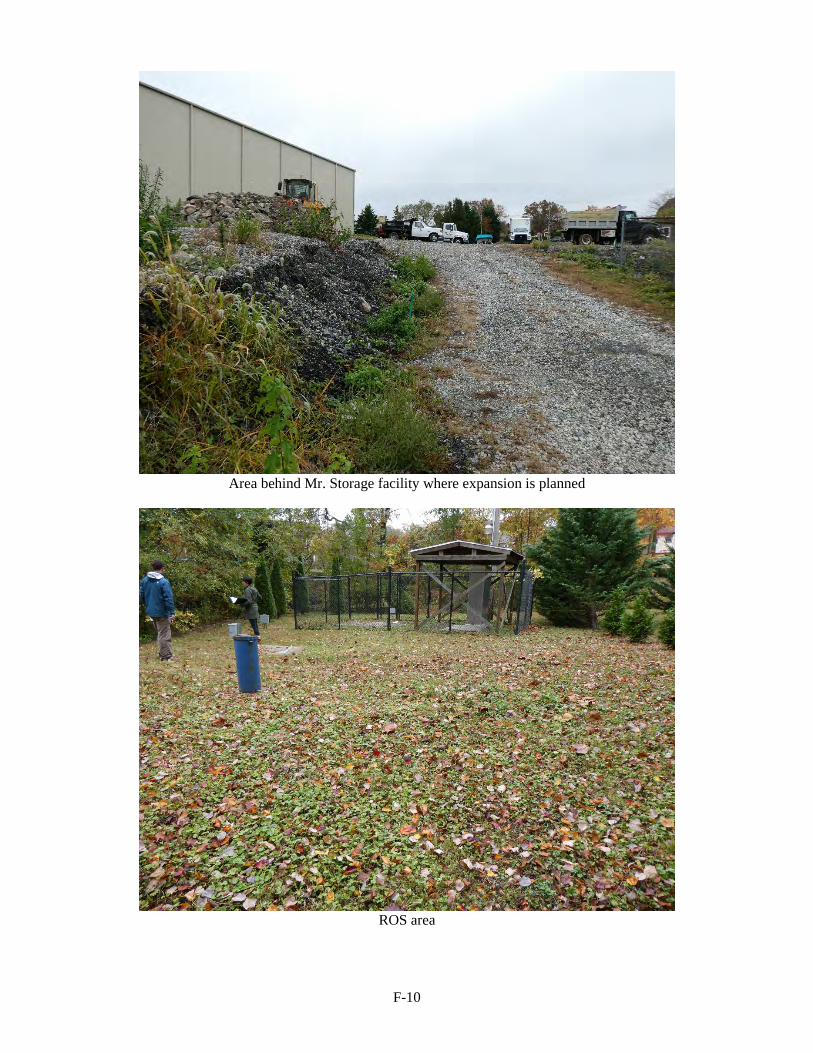
F-10
Area behind Mr. Storage facility where expansion is planned
ROS area
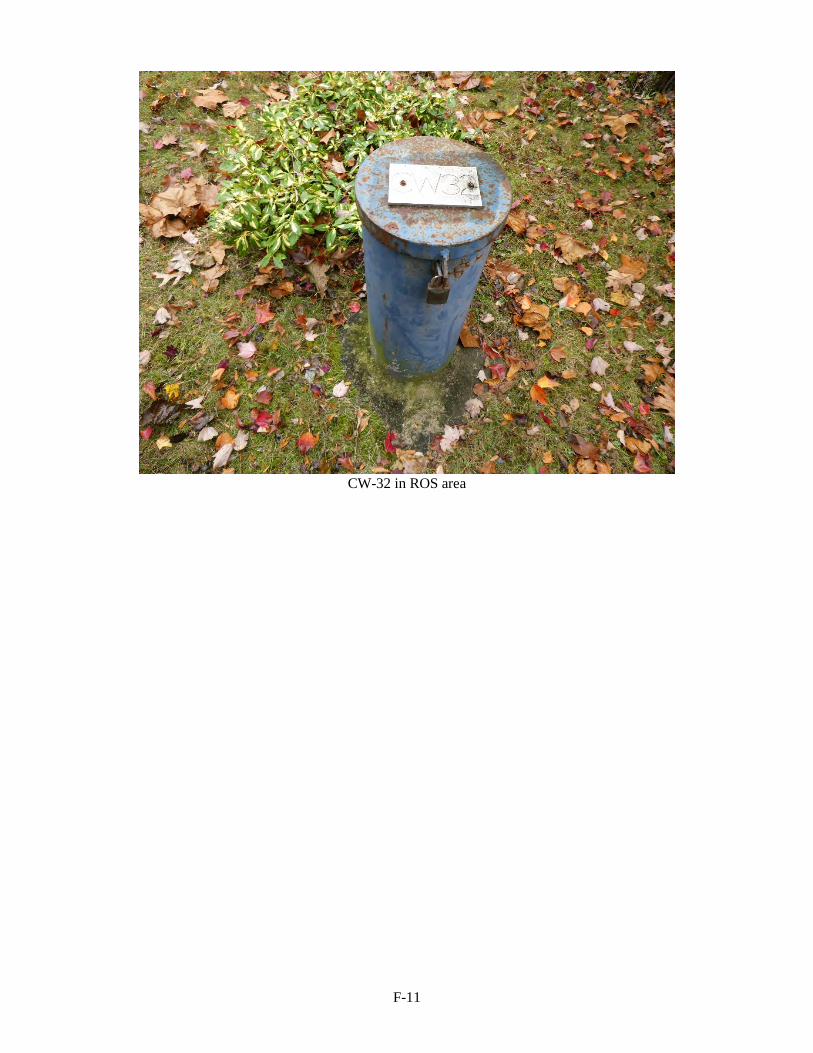
F-11
CW-32 in ROS area
G-1
APPENDIX G – DETAILED DATA REVIEW Groundwater Monitoring Data The groundwater monitoring program consists of 49 monitoring wells, six recovery wells, a CTR sump and five injection wells. The monitoring wells are classified as shallow above bedrock (about 5 feet to 30 feet below ground surface) and deep wells screened in the bedrock. The PADEP contractor conducts groundwater monitoring to monitor treatment system performance and the migration of the PCP plume. Other COCs are co-located with the PCP plume at the Site. Sampling is performed in accordance with the 2016 SAP and consists of quarterly, semi-annual, biennial and annual sampling. Sampling is conducted to determine the recovery system effectiveness, to monitor the edge of the shallow contaminant capture zone and to update the historical database (Table H-1, Appendix H). The PADEP contractor conducted the most recent monitoring event in September 2019. Groundwater Contaminant Concentrations and Trends - PCP The shallow aquifer source area is located in the vicinity of wells CW-1S, CW-2S, R-2, CW-4S, CW-5S, HAV-02 (now B-1), CW-16S and HAV-04. The deep aquifer source area encompasses wells CW-17D, RW-5, CW-2I, CW-2D and RW-7. The March 2019 shallow and deep PCP isocontour maps are provided as Figures I-1 and I-2. PCP concentrations continue to decrease in many source area wells, and the overall plume area decreased in size over this FYR period (Figure I-3). Appendix H provides graphs showing concentration trends in source area injection wells, recovery wells, CTR, perimeter monitoring wells and injection wells (Figures H-4 through H-8). During this FYR period, PCP was detected in deep source area recovery wells RW-5, RW-6 and RW-7 and the shallow CTR above the remedial goal of 1 µg/L. Concentrations fluctuated as shown in Table G-1. Table G-1: Maximum Annual PCP Concentrations in RW-5, RW-6, RW-7 and the CTR, 2015 to 2019
Well 2015 2016 2017 2018 2019
RW-5 3,820 3,410 650a 3,070 4,760a
RW-6 498 436 200 572 373 RW-7 2,110 2,740 320 2,900 2,420a
CTR 287 575 73 194 261 Notes: All concentrations shown in micrograms per liter (µg/L) PCP remedial goal = 1 µg/L a. Duplicate sample collected; higher of the two results shown here
PCP concentrations in ROS area recovery wells RW-8, RW-9 and RW-10 have continued to be non-detect or below the groundwater RGO since April 2015. During this FYR period, PCP concentrations in several site monitoring wells fluctuated, with some PCP concentrations decreasing in 2016 and 2017 and then increasing to previously observed concentrations in 2018 and 2019 (Figure H-4 and H-5 in Appendix H). Several wells, most located along Eagle Road, demonstrated an increase in PCP concentrations over this FYR period (Table G-2). Monitoring wells located downgradient of the CTR remain non-detect for PCP. Table G-2: Maximum Annual PCP Concentrations in Select Monitoring Wells 2015 to 2019
Well 2015 2016 2017 2018 2019
NW-01 ND ND ND ND 1,230 NW-06 471 504 1,400 1,200 5,330 CW-26D 4.1 3.7 J ND ND 3,750 CW-3S ND ND Dry NS 269 CW-3D 209 215 59a 170 608
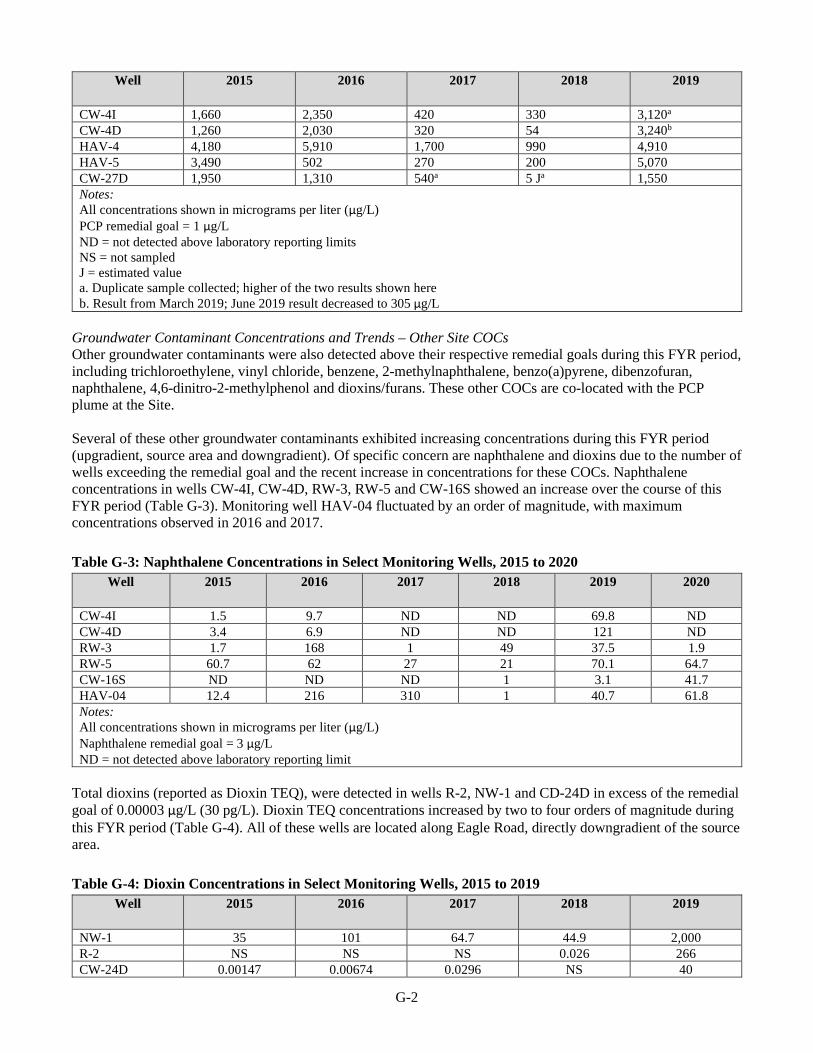
G-2
Well 2015 2016 2017 2018 2019
CW-4I 1,660 2,350 420 330 3,120a
CW-4D 1,260 2,030 320 54 3,240b
HAV-4 4,180 5,910 1,700 990 4,910 HAV-5 3,490 502 270 200 5,070 CW-27D 1,950 1,310 540a 5 Ja 1,550 Notes: All concentrations shown in micrograms per liter (µg/L) PCP remedial goal = 1 µg/L ND = not detected above laboratory reporting limits NS = not sampled J = estimated value a. Duplicate sample collected; higher of the two results shown here b. Result from March 2019; June 2019 result decreased to 305 µg/L
Groundwater Contaminant Concentrations and Trends – Other Site COCs Other groundwater contaminants were also detected above their respective remedial goals during this FYR period, including trichloroethylene, vinyl chloride, benzene, 2-methylnaphthalene, benzo(a)pyrene, dibenzofuran, naphthalene, 4,6-dinitro-2-methylphenol and dioxins/furans. These other COCs are co-located with the PCP plume at the Site. Several of these other groundwater contaminants exhibited increasing concentrations during this FYR period (upgradient, source area and downgradient). Of specific concern are naphthalene and dioxins due to the number of wells exceeding the remedial goal and the recent increase in concentrations for these COCs. Naphthalene concentrations in wells CW-4I, CW-4D, RW-3, RW-5 and CW-16S showed an increase over the course of this FYR period (Table G-3). Monitoring well HAV-04 fluctuated by an order of magnitude, with maximum concentrations observed in 2016 and 2017. Table G-3: Naphthalene Concentrations in Select Monitoring Wells, 2015 to 2020
Well 2015 2016 2017 2018 2019 2020
CW-4I 1.5 9.7 ND ND 69.8 ND CW-4D 3.4 6.9 ND ND 121 ND RW-3 1.7 168 1 49 37.5 1.9 RW-5 60.7 62 27 21 70.1 64.7 CW-16S ND ND ND 1 3.1 41.7 HAV-04 12.4 216 310 1 40.7 61.8 Notes: All concentrations shown in micrograms per liter (µg/L) Naphthalene remedial goal = 3 µg/L ND = not detected above laboratory reporting limit
Total dioxins (reported as Dioxin TEQ), were detected in wells R-2, NW-1 and CD-24D in excess of the remedial goal of 0.00003 µg/L (30 pg/L). Dioxin TEQ concentrations increased by two to four orders of magnitude during this FYR period (Table G-4). All of these wells are located along Eagle Road, directly downgradient of the source area. Table G-4: Dioxin Concentrations in Select Monitoring Wells, 2015 to 2019
Well 2015 2016 2017 2018 2019
NW-1 35 101 64.7 44.9 2,000 R-2 NS NS NS 0.026 266 CW-24D 0.00147 0.00674 0.0296 NS 40
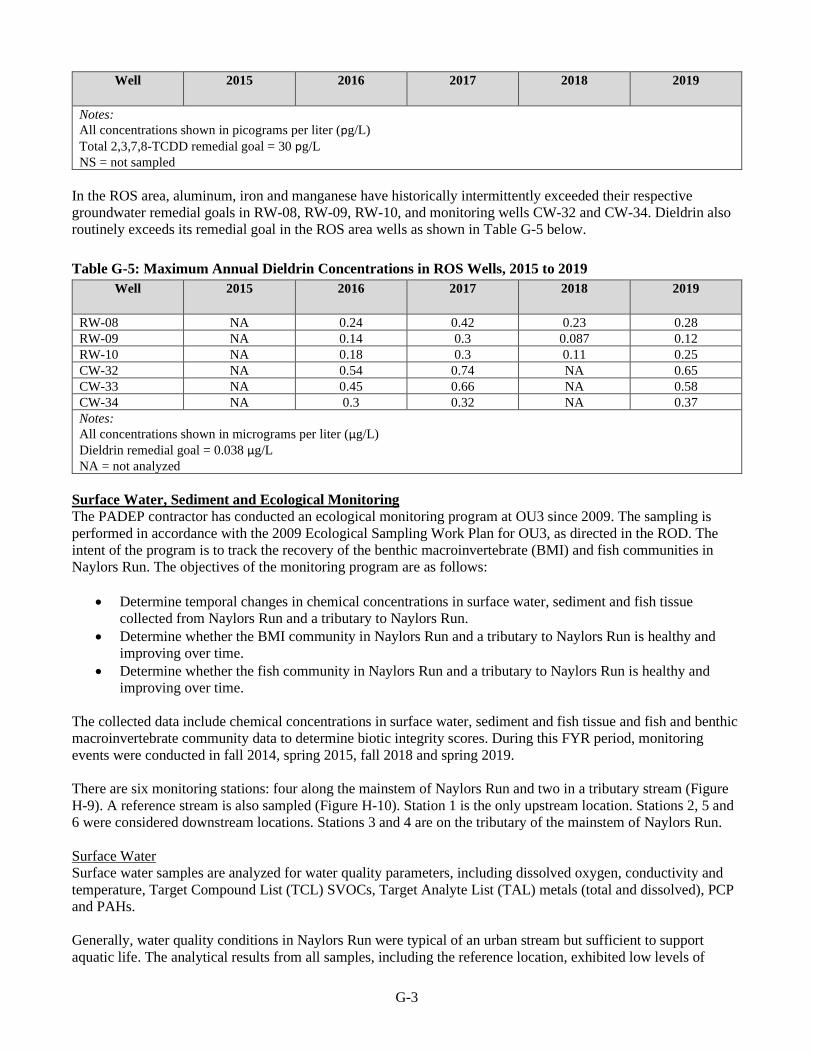
G-3
Well 2015 2016 2017 2018 2019
Notes: All concentrations shown in picograms per liter (pg/L) Total 2,3,7,8-TCDD remedial goal = 30 pg/L NS = not sampled
In the ROS area, aluminum, iron and manganese have historically intermittently exceeded their respective groundwater remedial goals in RW-08, RW-09, RW-10, and monitoring wells CW-32 and CW-34. Dieldrin also routinely exceeds its remedial goal in the ROS area wells as shown in Table G-5 below. Table G-5: Maximum Annual Dieldrin Concentrations in ROS Wells, 2015 to 2019
Well 2015 2016 2017 2018 2019
RW-08 NA 0.24 0.42 0.23 0.28 RW-09 NA 0.14 0.3 0.087 0.12 RW-10 NA 0.18 0.3 0.11 0.25 CW-32 NA 0.54 0.74 NA 0.65 CW-33 NA 0.45 0.66 NA 0.58 CW-34 NA 0.3 0.32 NA 0.37 Notes: All concentrations shown in micrograms per liter (µg/L) Dieldrin remedial goal = 0.038 µg/L NA = not analyzed
Surface Water, Sediment and Ecological Monitoring The PADEP contractor has conducted an ecological monitoring program at OU3 since 2009. The sampling is performed in accordance with the 2009 Ecological Sampling Work Plan for OU3, as directed in the ROD. The intent of the program is to track the recovery of the benthic macroinvertebrate (BMI) and fish communities in Naylors Run. The objectives of the monitoring program are as follows:
• Determine temporal changes in chemical concentrations in surface water, sediment and fish tissue collected from Naylors Run and a tributary to Naylors Run.
• Determine whether the BMI community in Naylors Run and a tributary to Naylors Run is healthy and improving over time.
• Determine whether the fish community in Naylors Run and a tributary to Naylors Run is healthy and improving over time.
The collected data include chemical concentrations in surface water, sediment and fish tissue and fish and benthic macroinvertebrate community data to determine biotic integrity scores. During this FYR period, monitoring events were conducted in fall 2014, spring 2015, fall 2018 and spring 2019. There are six monitoring stations: four along the mainstem of Naylors Run and two in a tributary stream (Figure H-9). A reference stream is also sampled (Figure H-10). Station 1 is the only upstream location. Stations 2, 5 and 6 were considered downstream locations. Stations 3 and 4 are on the tributary of the mainstem of Naylors Run. Surface Water Surface water samples are analyzed for water quality parameters, including dissolved oxygen, conductivity and temperature, Target Compound List (TCL) SVOCs, Target Analyte List (TAL) metals (total and dissolved), PCP and PAHs. Generally, water quality conditions in Naylors Run were typical of an urban stream but sufficient to support aquatic life. The analytical results from all samples, including the reference location, exhibited low levels of
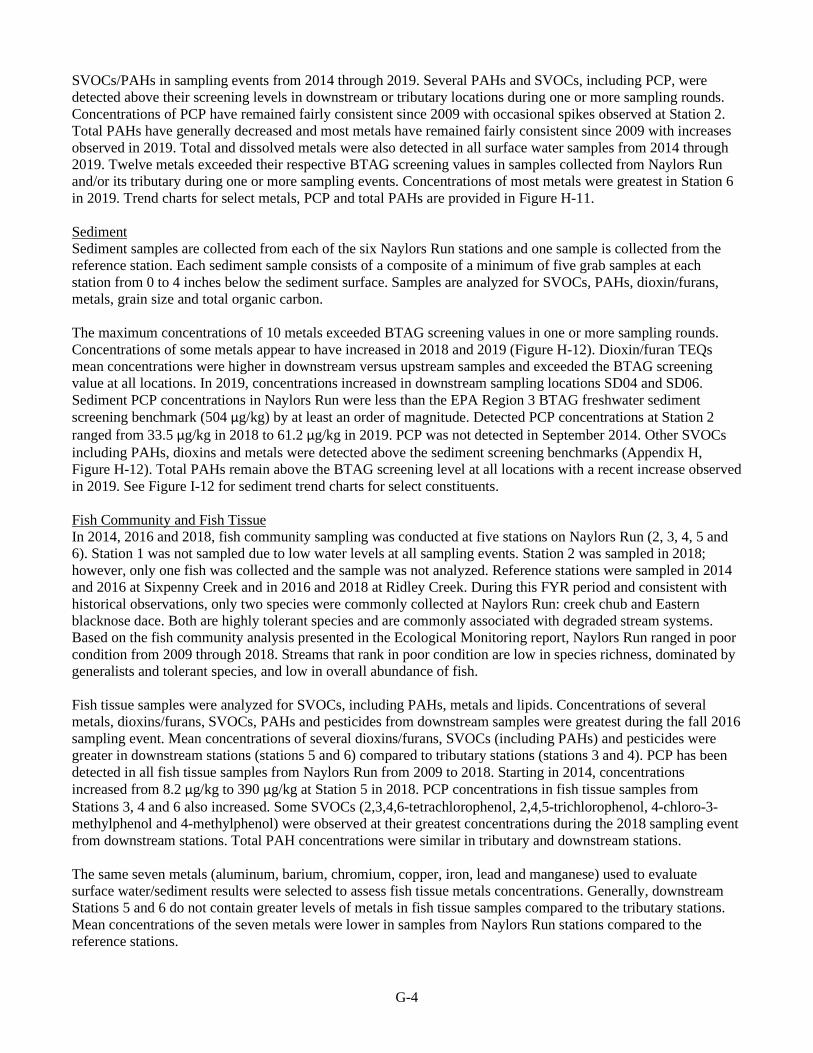
G-4
SVOCs/PAHs in sampling events from 2014 through 2019. Several PAHs and SVOCs, including PCP, were detected above their screening levels in downstream or tributary locations during one or more sampling rounds. Concentrations of PCP have remained fairly consistent since 2009 with occasional spikes observed at Station 2. Total PAHs have generally decreased and most metals have remained fairly consistent since 2009 with increases observed in 2019. Total and dissolved metals were also detected in all surface water samples from 2014 through 2019. Twelve metals exceeded their respective BTAG screening values in samples collected from Naylors Run and/or its tributary during one or more sampling events. Concentrations of most metals were greatest in Station 6 in 2019. Trend charts for select metals, PCP and total PAHs are provided in Figure H-11. Sediment Sediment samples are collected from each of the six Naylors Run stations and one sample is collected from the reference station. Each sediment sample consists of a composite of a minimum of five grab samples at each station from 0 to 4 inches below the sediment surface. Samples are analyzed for SVOCs, PAHs, dioxin/furans, metals, grain size and total organic carbon. The maximum concentrations of 10 metals exceeded BTAG screening values in one or more sampling rounds. Concentrations of some metals appear to have increased in 2018 and 2019 (Figure H-12). Dioxin/furan TEQs mean concentrations were higher in downstream versus upstream samples and exceeded the BTAG screening value at all locations. In 2019, concentrations increased in downstream sampling locations SD04 and SD06. Sediment PCP concentrations in Naylors Run were less than the EPA Region 3 BTAG freshwater sediment screening benchmark (504 µg/kg) by at least an order of magnitude. Detected PCP concentrations at Station 2 ranged from 33.5 µg/kg in 2018 to 61.2 µg/kg in 2019. PCP was not detected in September 2014. Other SVOCs including PAHs, dioxins and metals were detected above the sediment screening benchmarks (Appendix H, Figure H-12). Total PAHs remain above the BTAG screening level at all locations with a recent increase observed in 2019. See Figure I-12 for sediment trend charts for select constituents. Fish Community and Fish Tissue In 2014, 2016 and 2018, fish community sampling was conducted at five stations on Naylors Run (2, 3, 4, 5 and 6). Station 1 was not sampled due to low water levels at all sampling events. Station 2 was sampled in 2018; however, only one fish was collected and the sample was not analyzed. Reference stations were sampled in 2014 and 2016 at Sixpenny Creek and in 2016 and 2018 at Ridley Creek. During this FYR period and consistent with historical observations, only two species were commonly collected at Naylors Run: creek chub and Eastern blacknose dace. Both are highly tolerant species and are commonly associated with degraded stream systems. Based on the fish community analysis presented in the Ecological Monitoring report, Naylors Run ranged in poor condition from 2009 through 2018. Streams that rank in poor condition are low in species richness, dominated by generalists and tolerant species, and low in overall abundance of fish. Fish tissue samples were analyzed for SVOCs, including PAHs, metals and lipids. Concentrations of several metals, dioxins/furans, SVOCs, PAHs and pesticides from downstream samples were greatest during the fall 2016 sampling event. Mean concentrations of several dioxins/furans, SVOCs (including PAHs) and pesticides were greater in downstream stations (stations 5 and 6) compared to tributary stations (stations 3 and 4). PCP has been detected in all fish tissue samples from Naylors Run from 2009 to 2018. Starting in 2014, concentrations increased from 8.2 µg/kg to 390 µg/kg at Station 5 in 2018. PCP concentrations in fish tissue samples from Stations 3, 4 and 6 also increased. Some SVOCs (2,3,4,6-tetrachlorophenol, 2,4,5-trichlorophenol, 4-chloro-3-methylphenol and 4-methylphenol) were observed at their greatest concentrations during the 2018 sampling event from downstream stations. Total PAH concentrations were similar in tributary and downstream stations. The same seven metals (aluminum, barium, chromium, copper, iron, lead and manganese) used to evaluate surface water/sediment results were selected to assess fish tissue metals concentrations. Generally, downstream Stations 5 and 6 do not contain greater levels of metals in fish tissue samples compared to the tributary stations. Mean concentrations of the seven metals were lower in samples from Naylors Run stations compared to the reference stations.
G-5
Benthic Macroinvertebrate Community and Physical Habitat Analysis Benthic macroinvertebrates were collected during the spring sampling events in 2014, 2015, 2017 and 2019. Six metrics, including Total Taxa; Number of Ephemeroptera Taxa; Number of Trichoptera Taxa; Number of Ephemeroptera; Plecoptera; Trichoptera Taxa; Beck’s Biotic Index; and Shannon-Weiner Index were scored against reference conditions and adjusted to a 100-point scale. Based on the results, Naylors Run was rated as biologically degraded with scores ranging from 14.1 to 40.6 in 2018. Historically, the scores were slightly lower in 2018 when compared to 2015 and 2017; however, the overall rating as biologically degraded has not changed. Habitat is assessed visually using a riffle/run assessment sheet and includes measuring instream habitat, riparian habitat, flow status, channel alteration and bank stability. The method is based on a scoring of 12 metrics on a scale of 20-0, resulting in narrative ratings of optimal to poor. The ratings are grouped as optimal (16 or greater), suboptimal (11-15), marginal (6-10) and poor (<6). Based on information from 2009 through 2018, physical habitat scores in Naylors Run ranged from 58 to 110 of a possible 200 points, yielding overall ratings of “marginal.” Overall scores were most often limited by pool variability, channel alteration, and stream bank and riparian zone metrics.
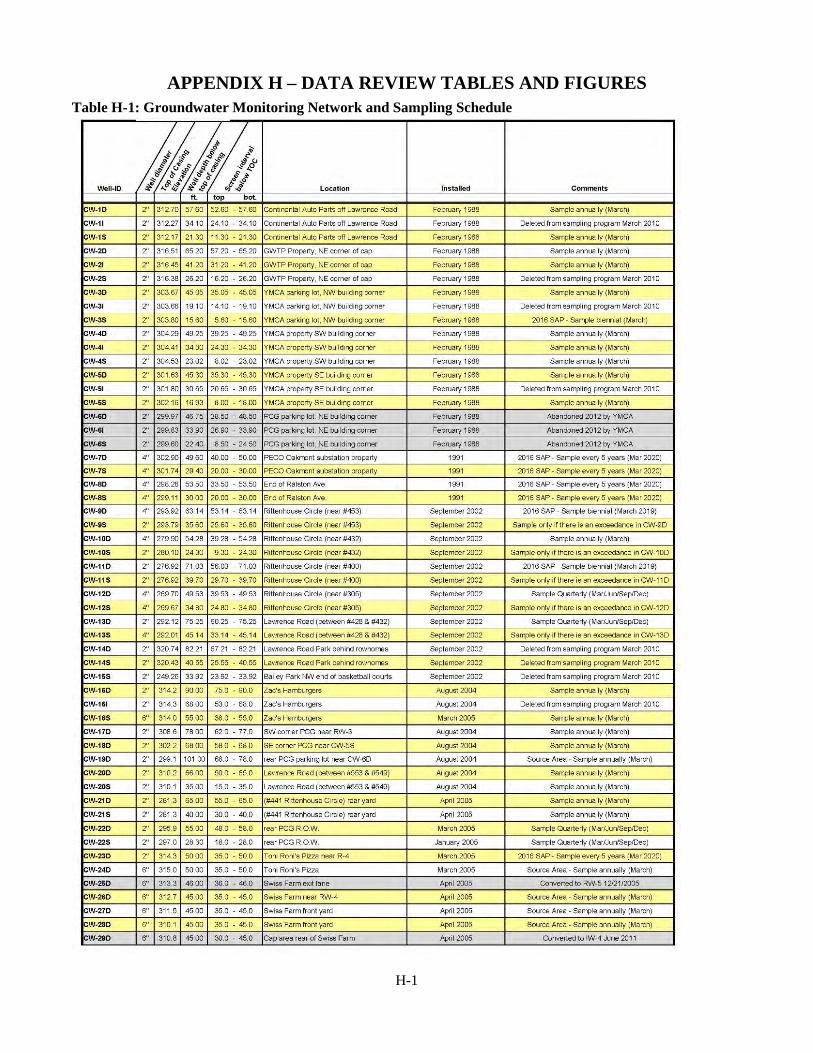
H-1
APPENDIX H – DATA REVIEW TABLES AND FIGURES Table H-1: Groundwater Monitoring Network and Sampling Schedule
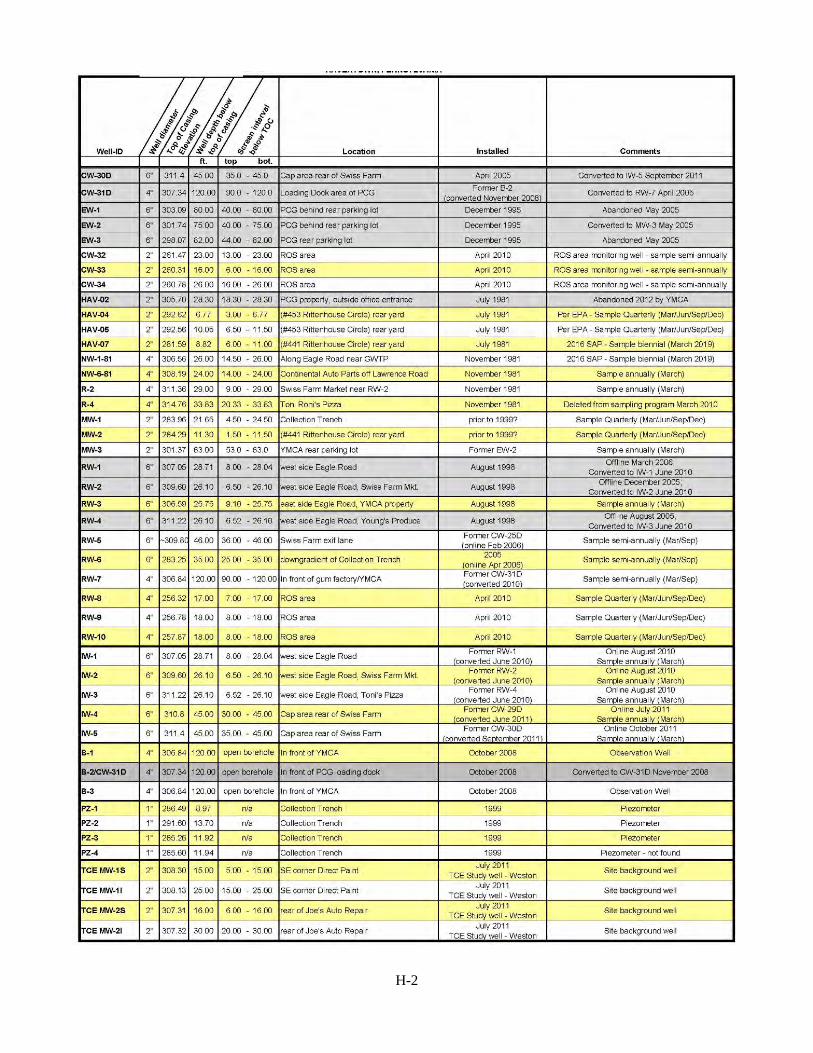
H-2
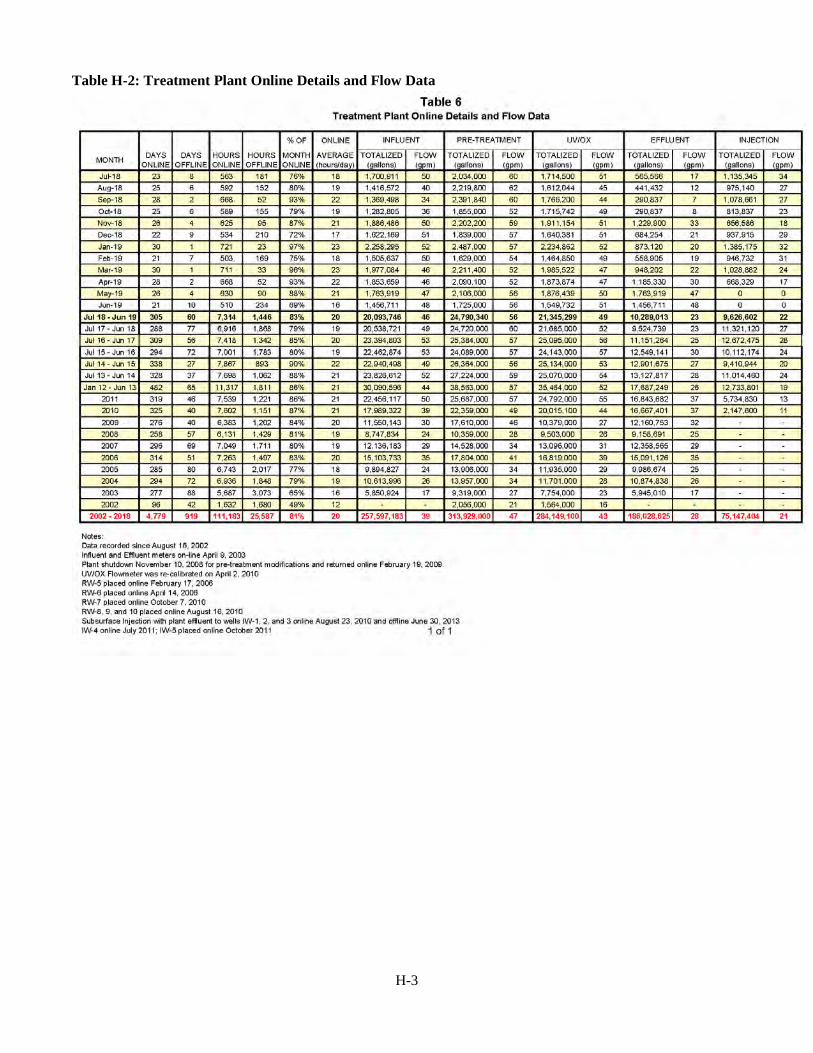
H-3
Table H-2: Treatment Plant Online Details and Flow Data
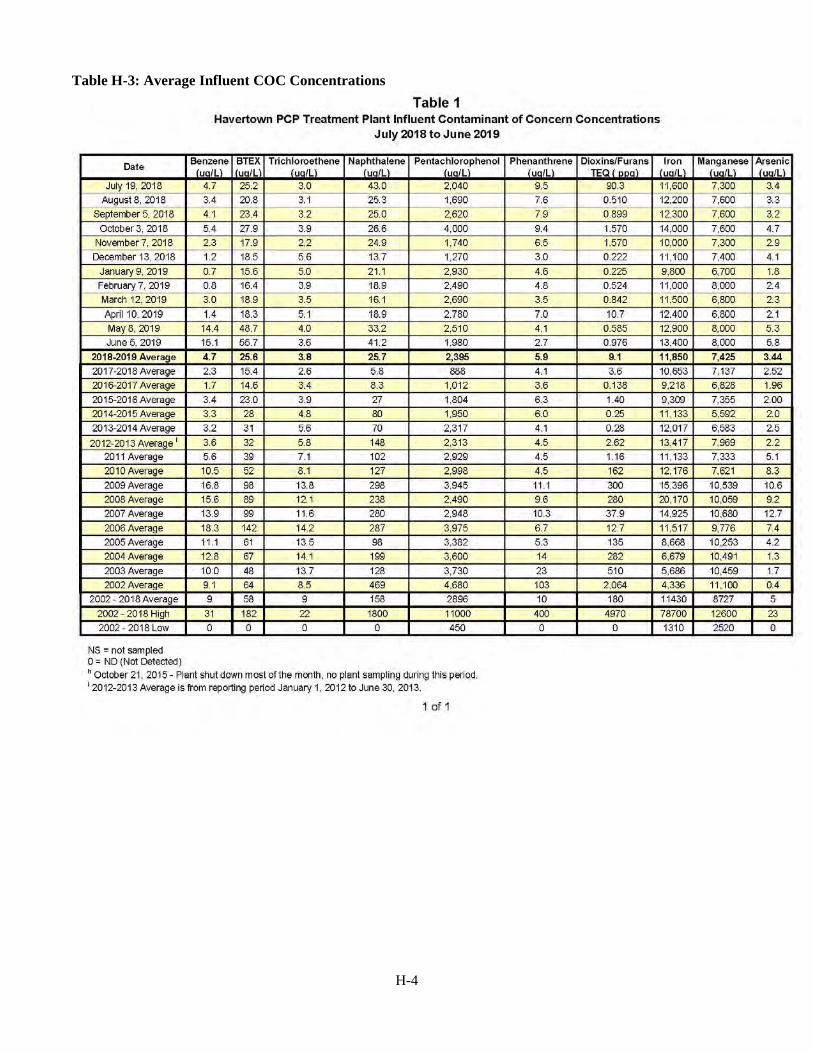
H-4
Table H-3: Average Influent COC Concentrations
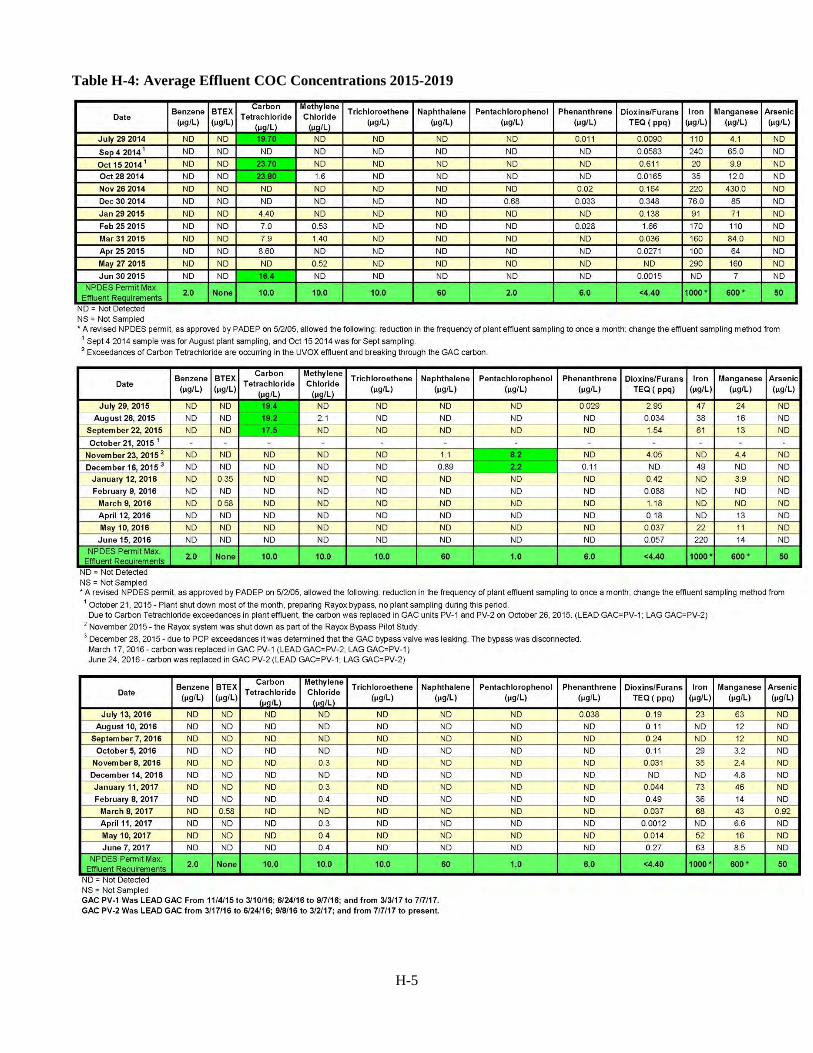
H-5
Table H-4: Average Effluent COC Concentrations 2015-2019
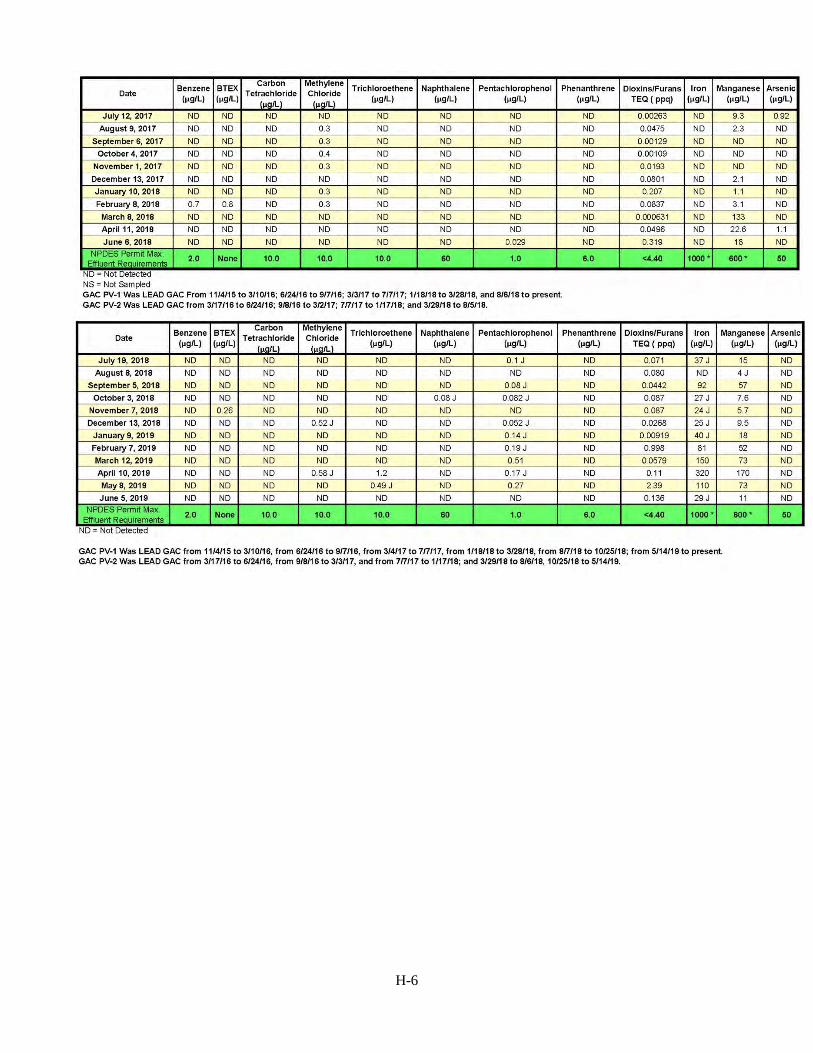
H-6
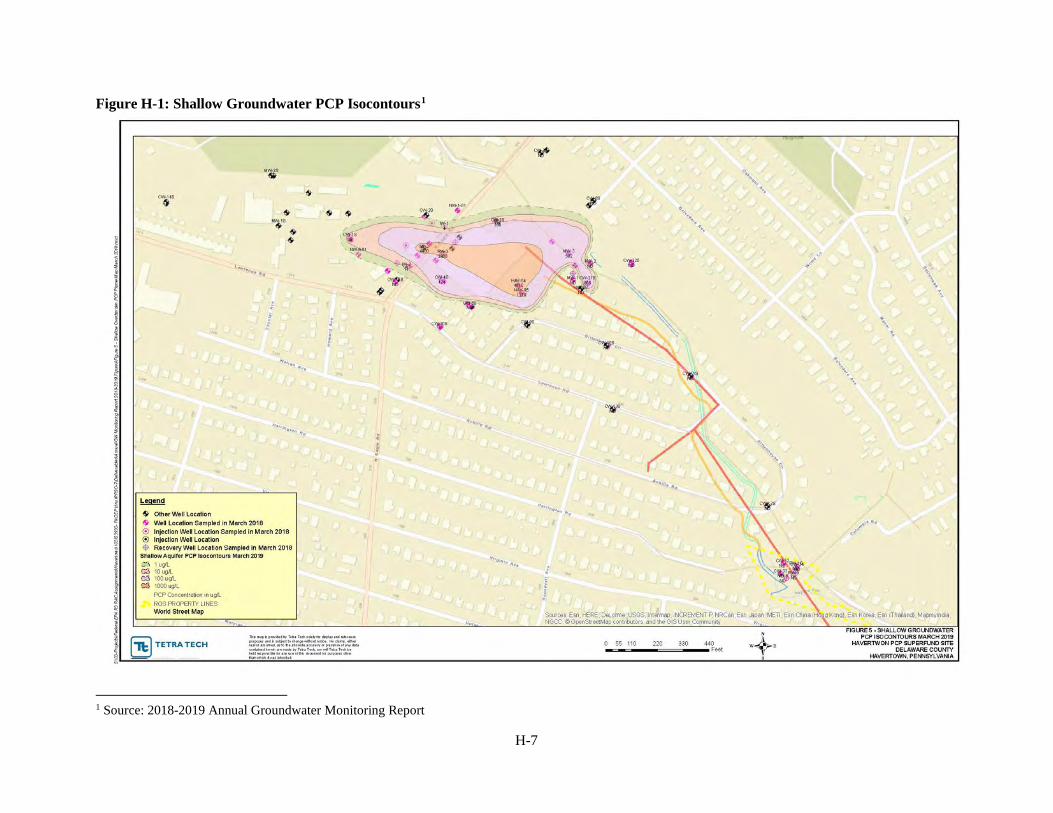
H-7
Figure H-1: Shallow Groundwater PCP Isocontours1
1 Source: 2018-2019 Annual Groundwater Monitoring Report
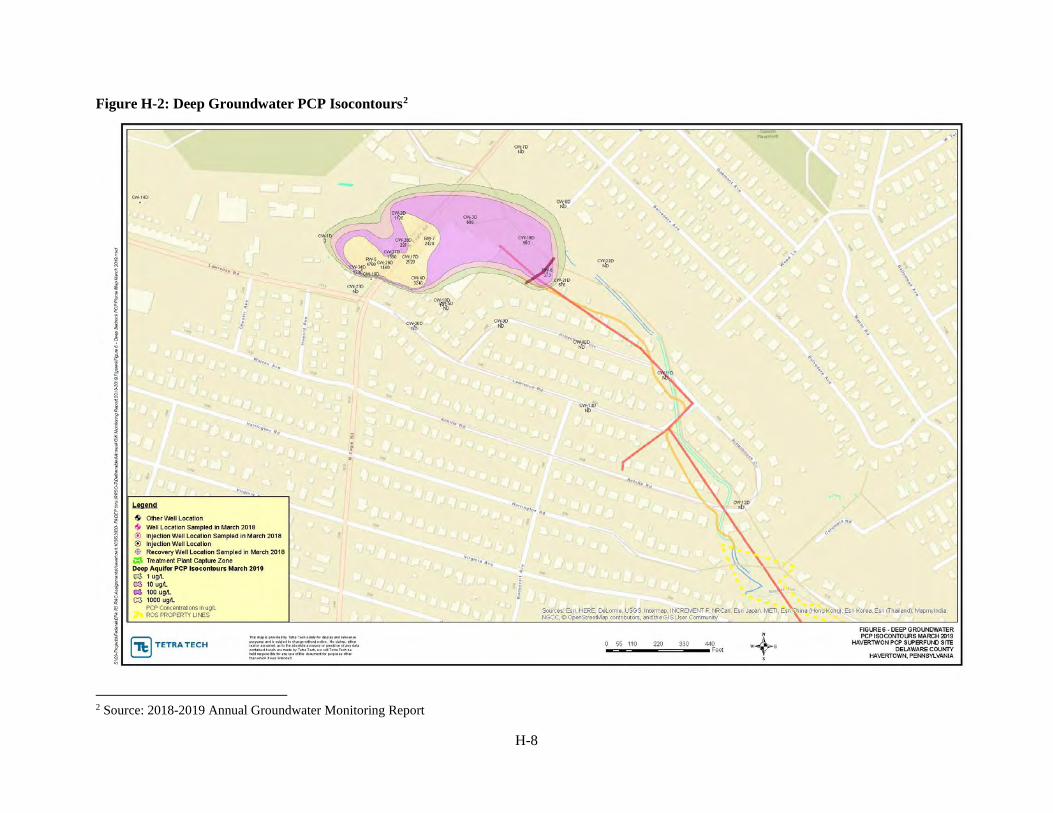
H-8
Figure H-2: Deep Groundwater PCP Isocontours2
2 Source: 2018-2019 Annual Groundwater Monitoring Report
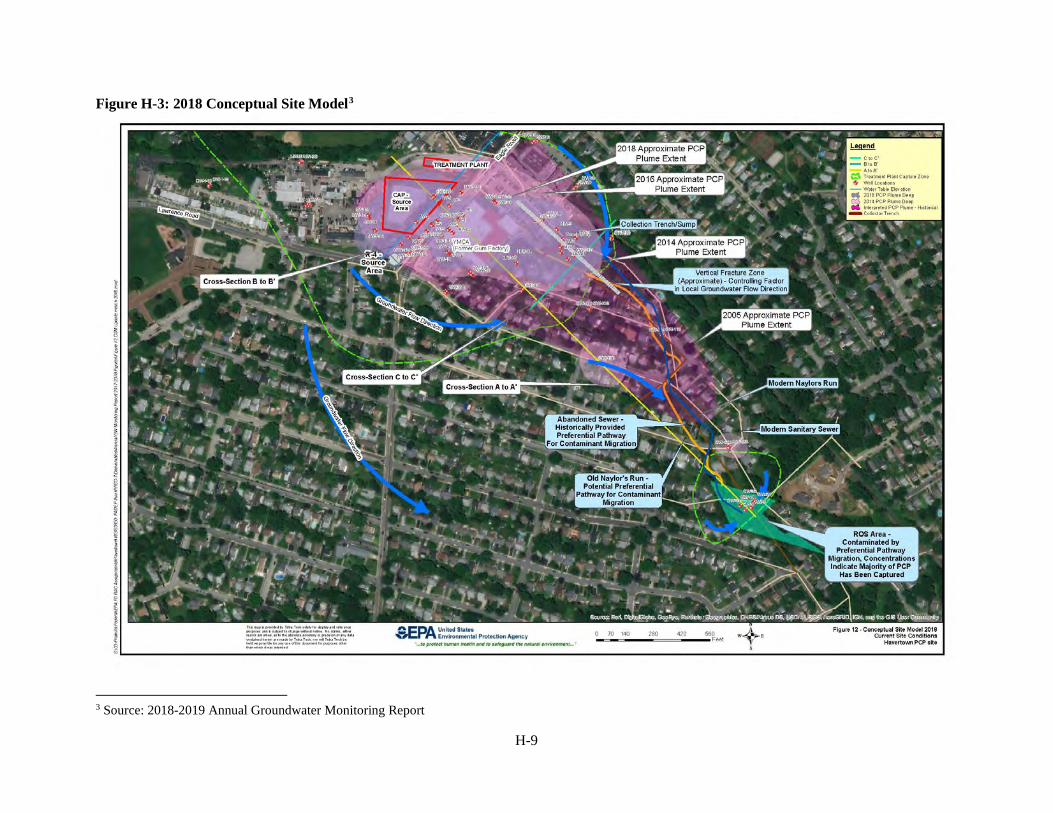
H-9
Figure H-3: 2018 Conceptual Site Model3
3 Source: 2018-2019 Annual Groundwater Monitoring Report
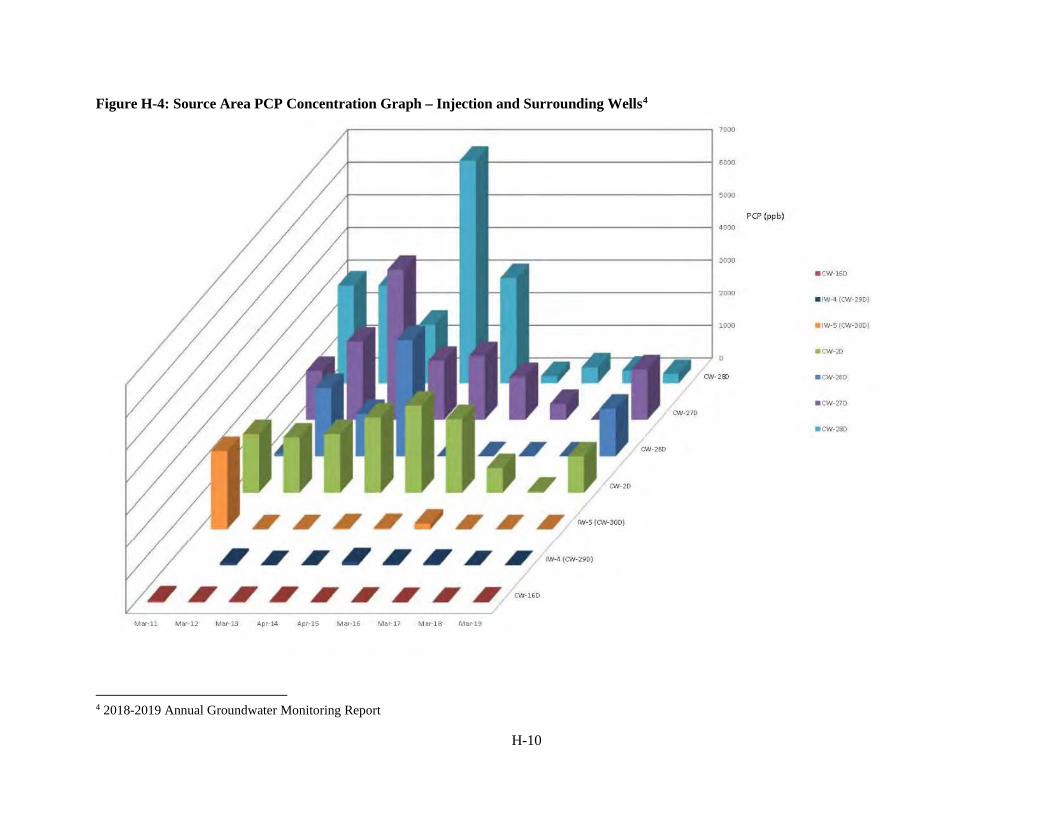
H-10
Figure H-4: Source Area PCP Concentration Graph – Injection and Surrounding Wells4
4 2018-2019 Annual Groundwater Monitoring Report
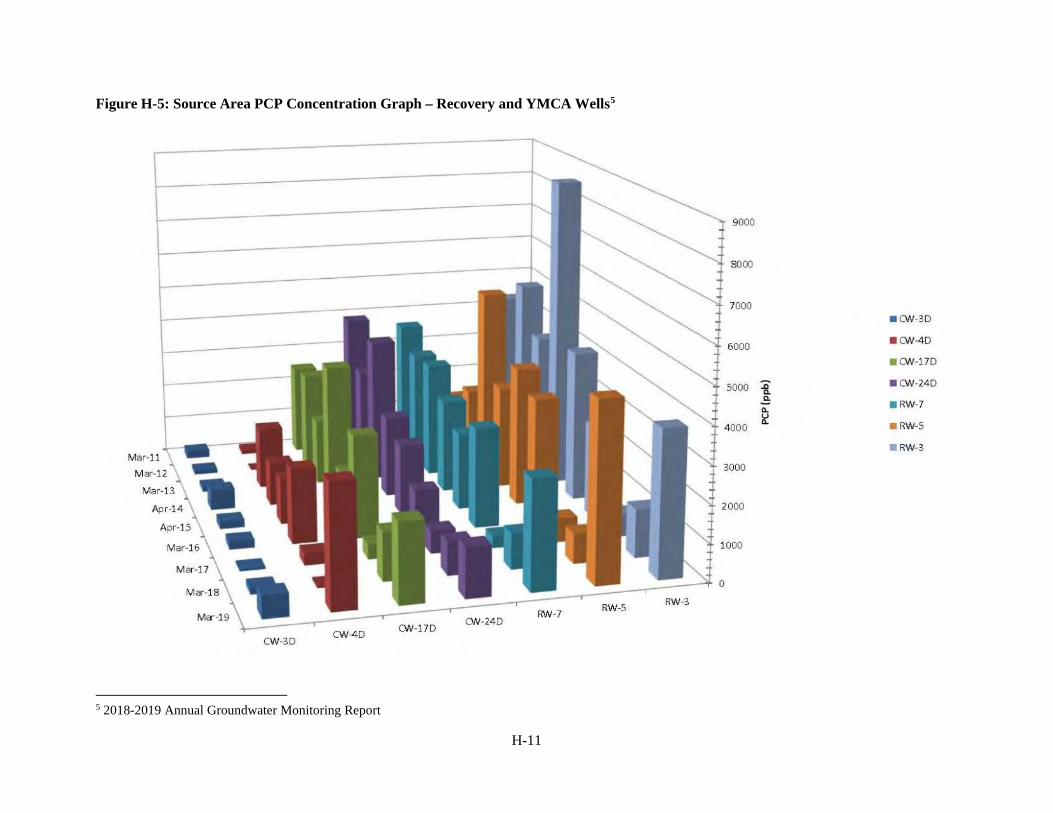
H-11
Figure H-5: Source Area PCP Concentration Graph – Recovery and YMCA Wells5
5 2018-2019 Annual Groundwater Monitoring Report
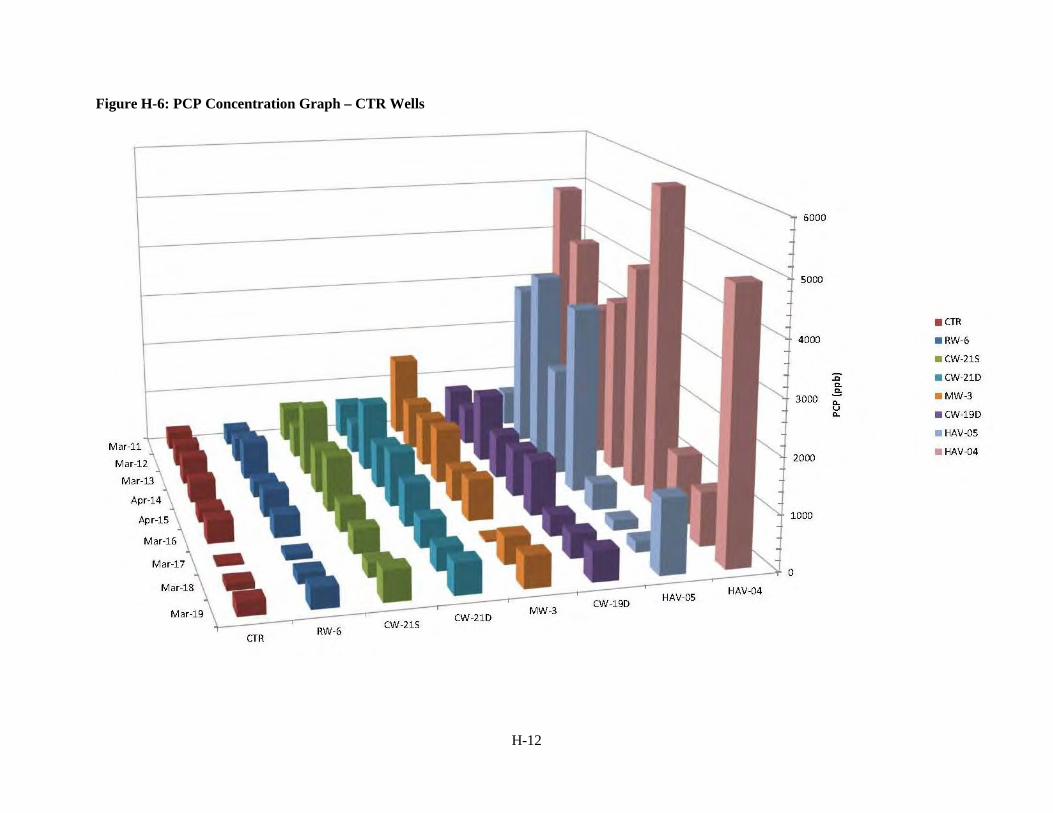
H-12
Figure H-6: PCP Concentration Graph – CTR Wells
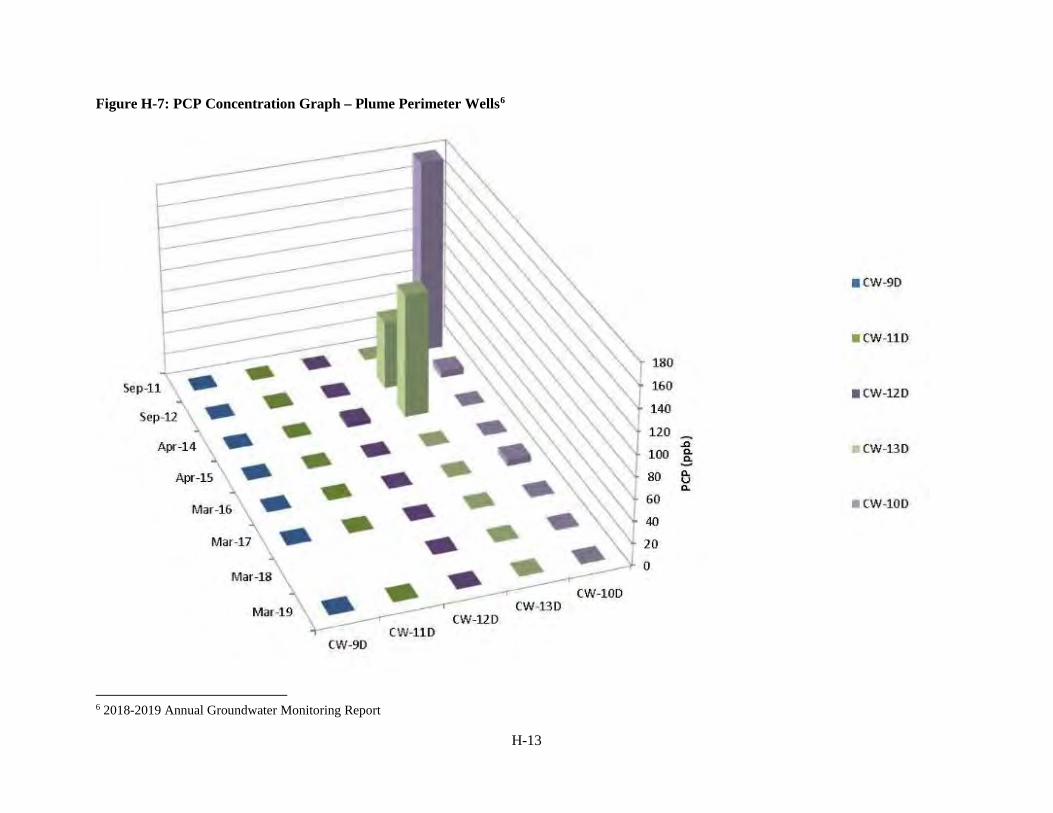
H-13
Figure H-7: PCP Concentration Graph – Plume Perimeter Wells6
6 2018-2019 Annual Groundwater Monitoring Report
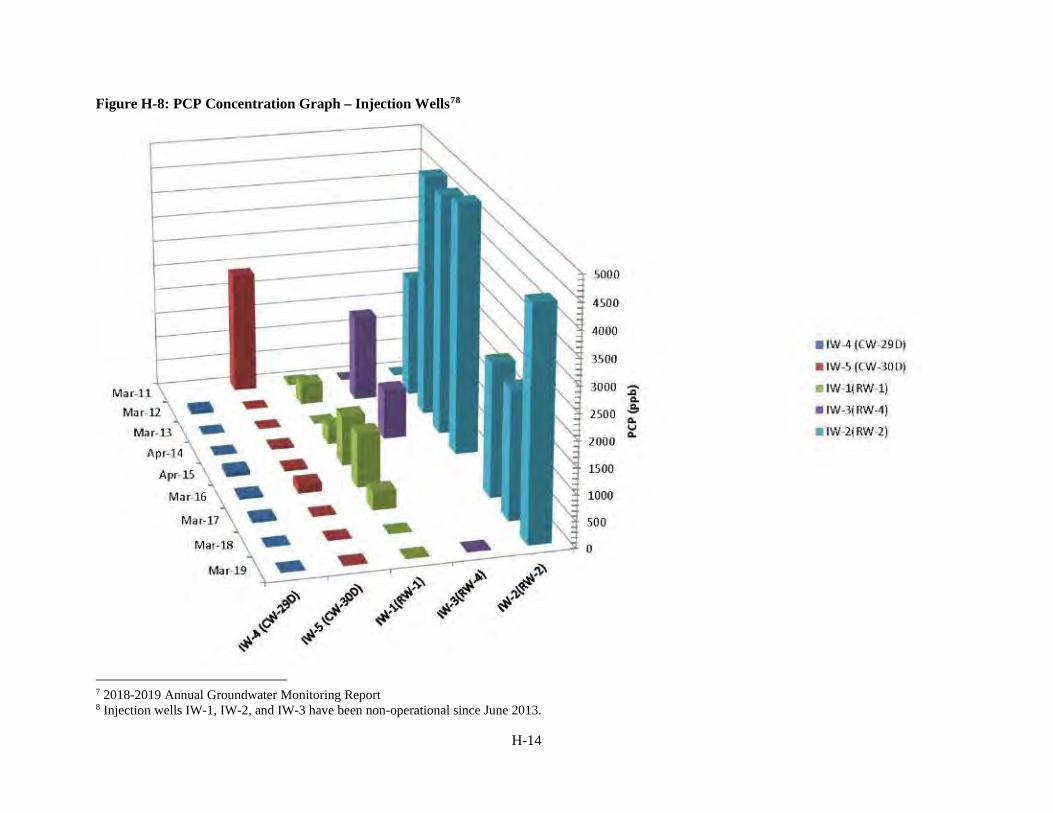
H-14
Figure H-8: PCP Concentration Graph – Injection Wells78
7 2018-2019 Annual Groundwater Monitoring Report 8 Injection wells IW-1, IW-2, and IW-3 have been non-operational since June 2013.
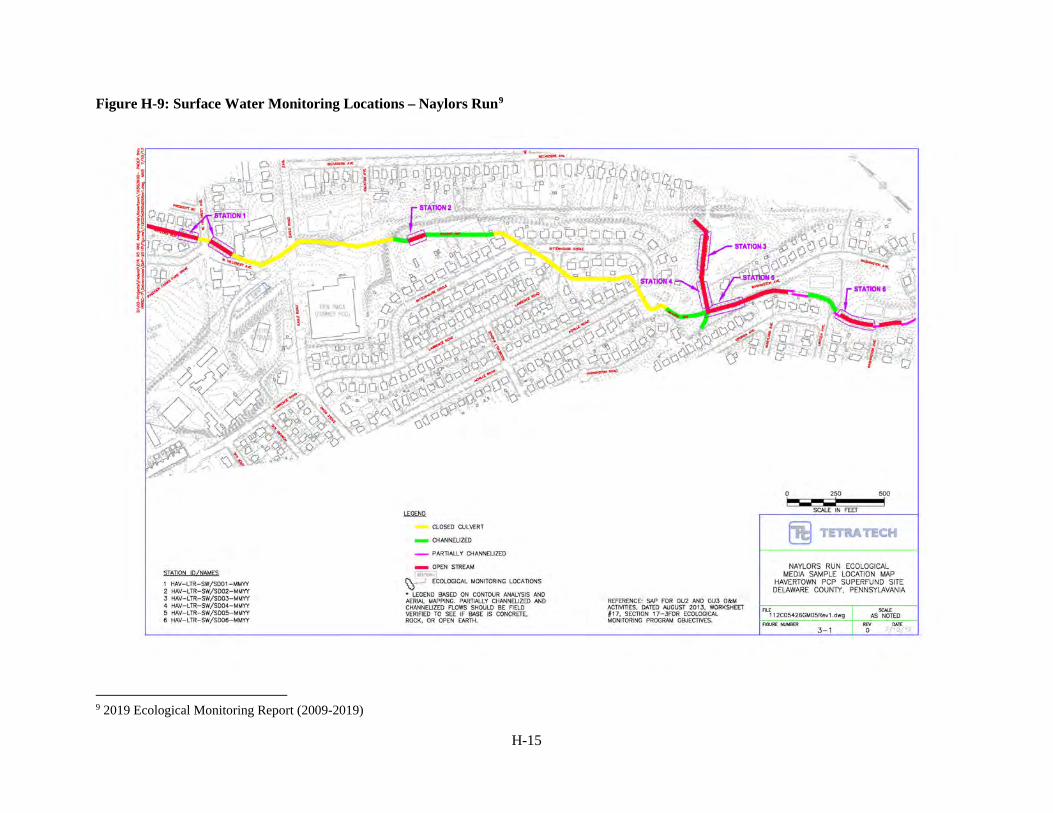
H-15
Figure H-9: Surface Water Monitoring Locations – Naylors Run9
9 2019 Ecological Monitoring Report (2009-2019)

H-16
Figure H-10: Surface Water Monitoring Locations – Reference10
10 2019 Ecological Monitoring Report (2009-2019)
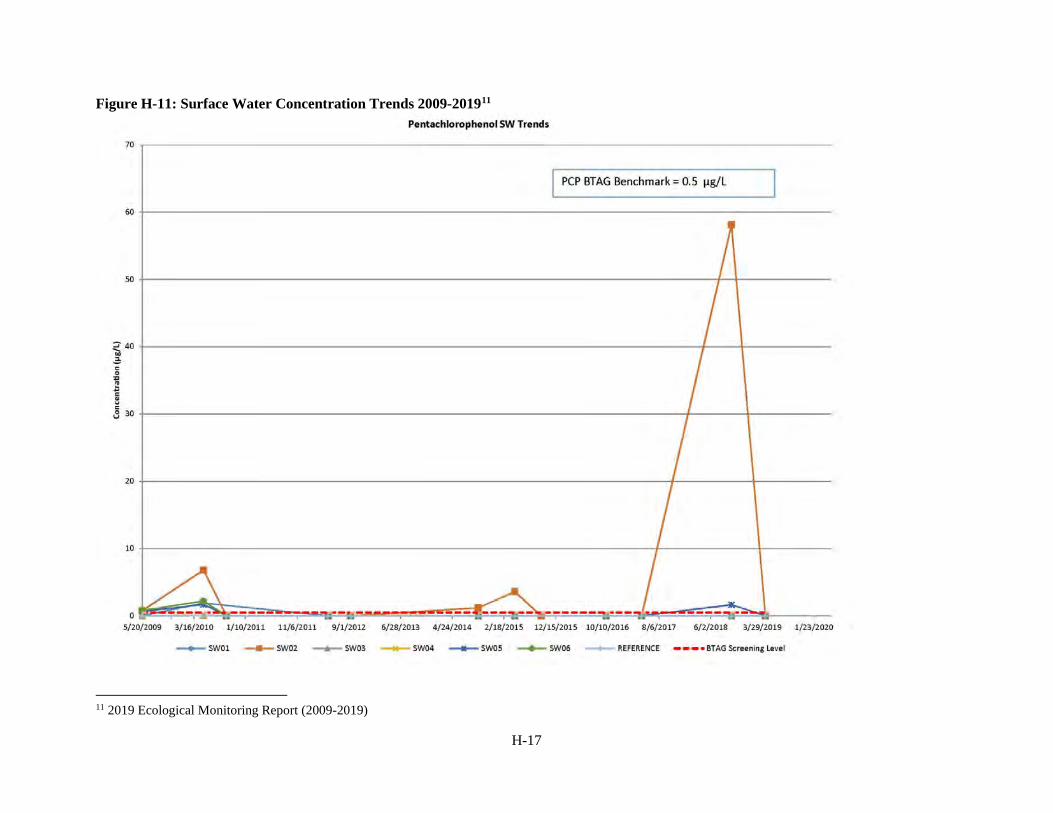
H-17
Figure H-11: Surface Water Concentration Trends 2009-201911
11 2019 Ecological Monitoring Report (2009-2019)
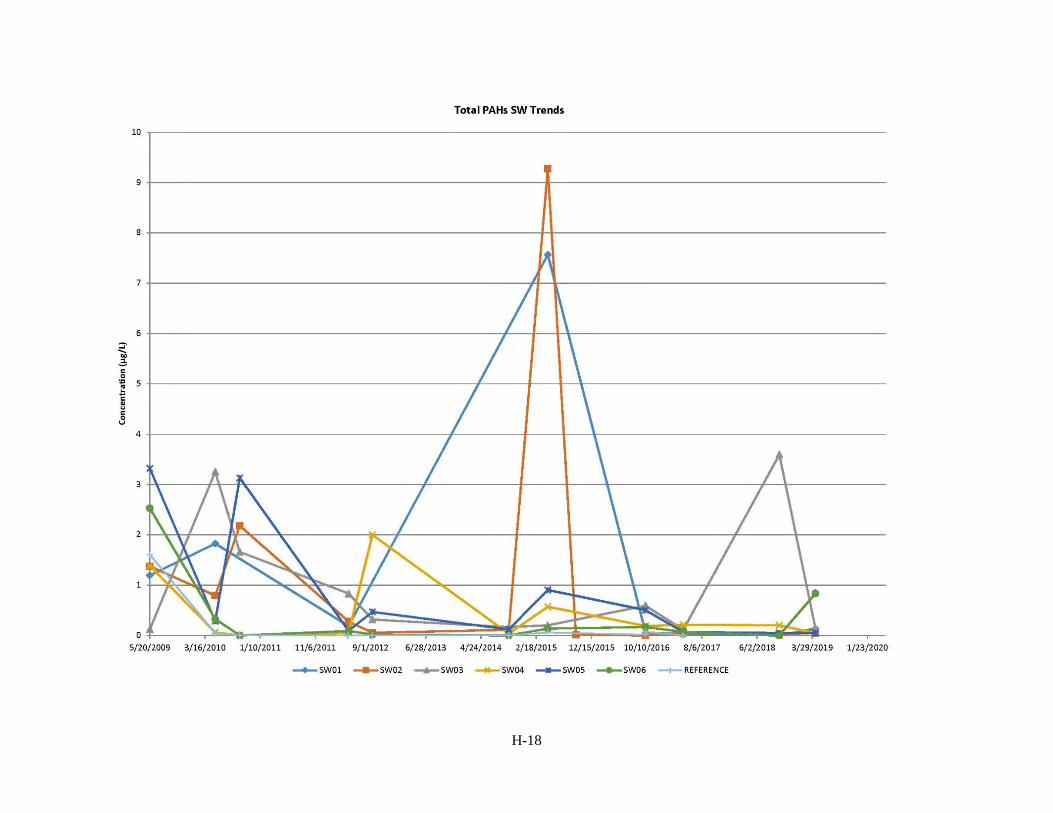
H-18
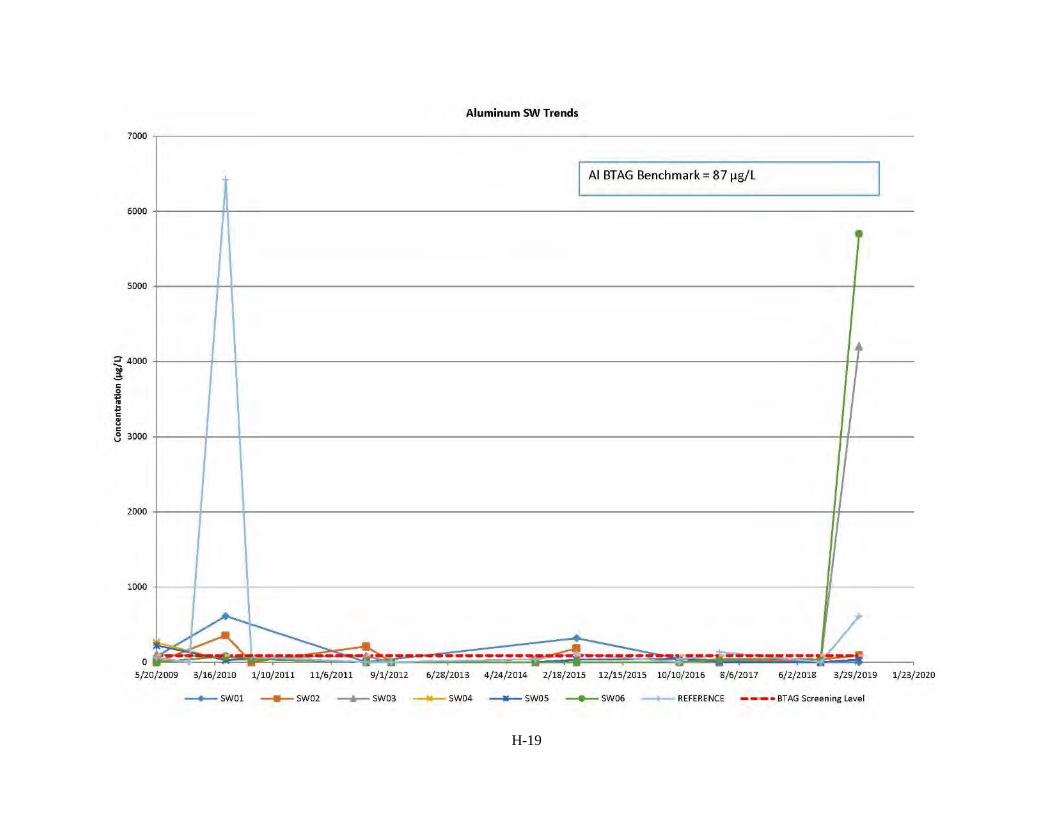
H-19
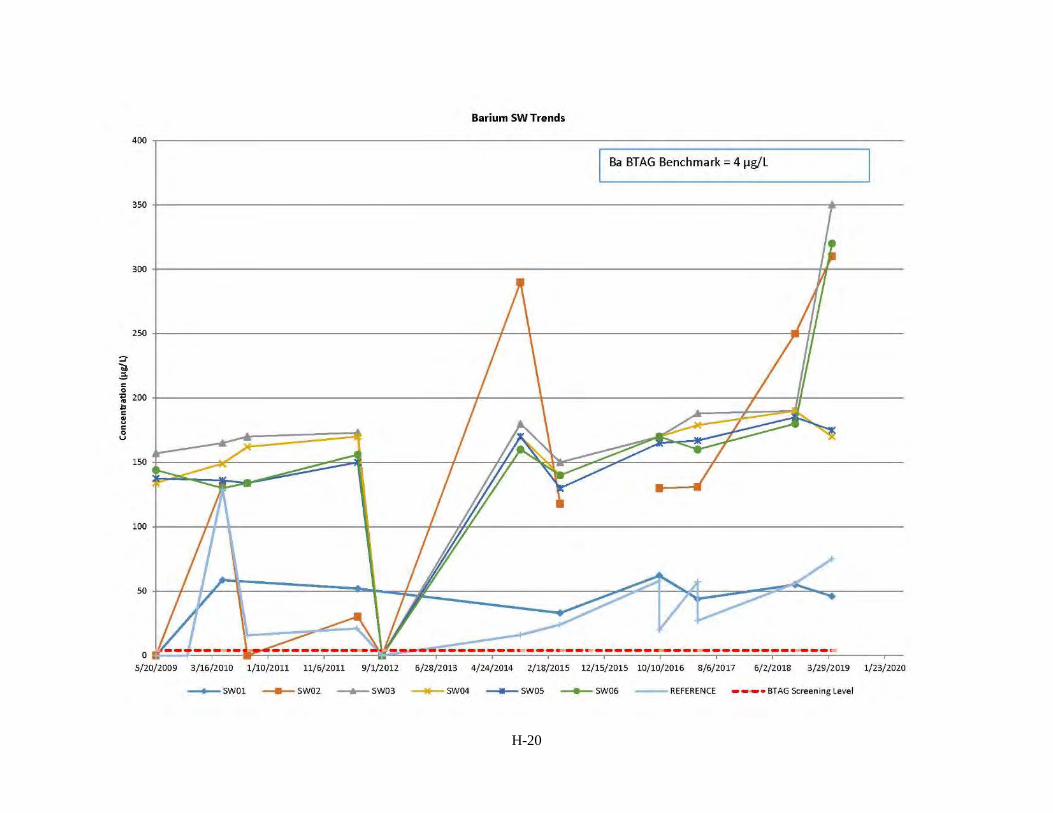
H-20
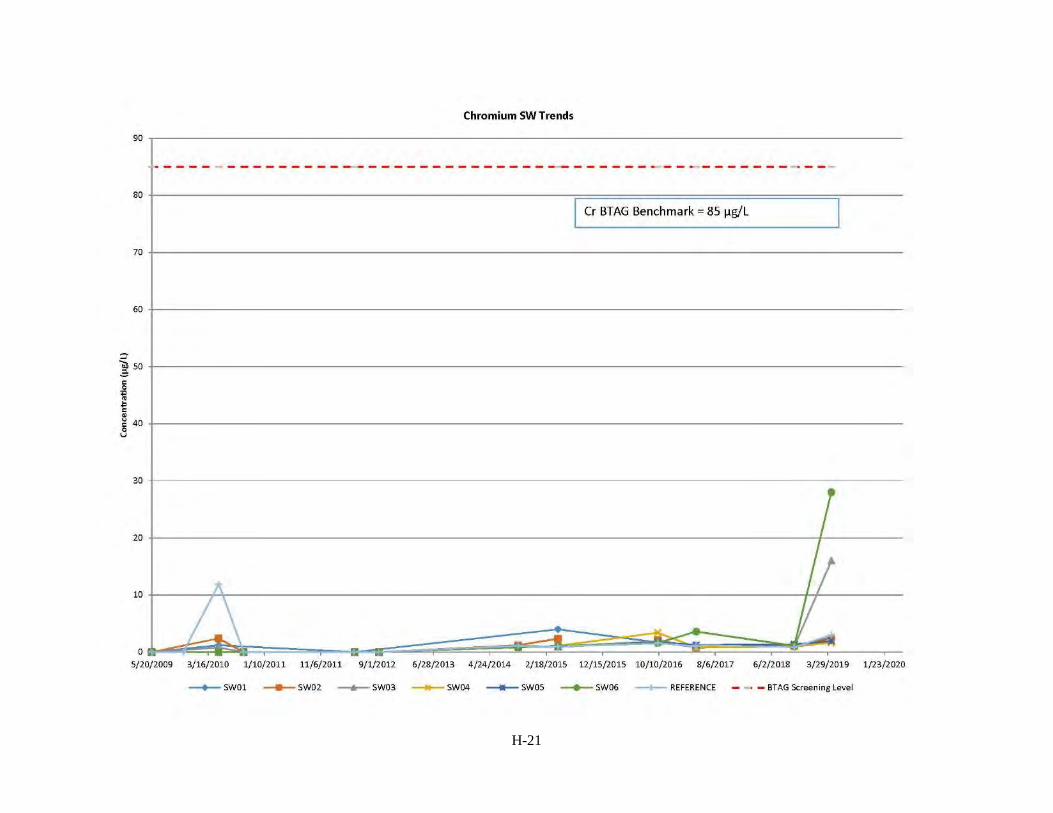
H-21
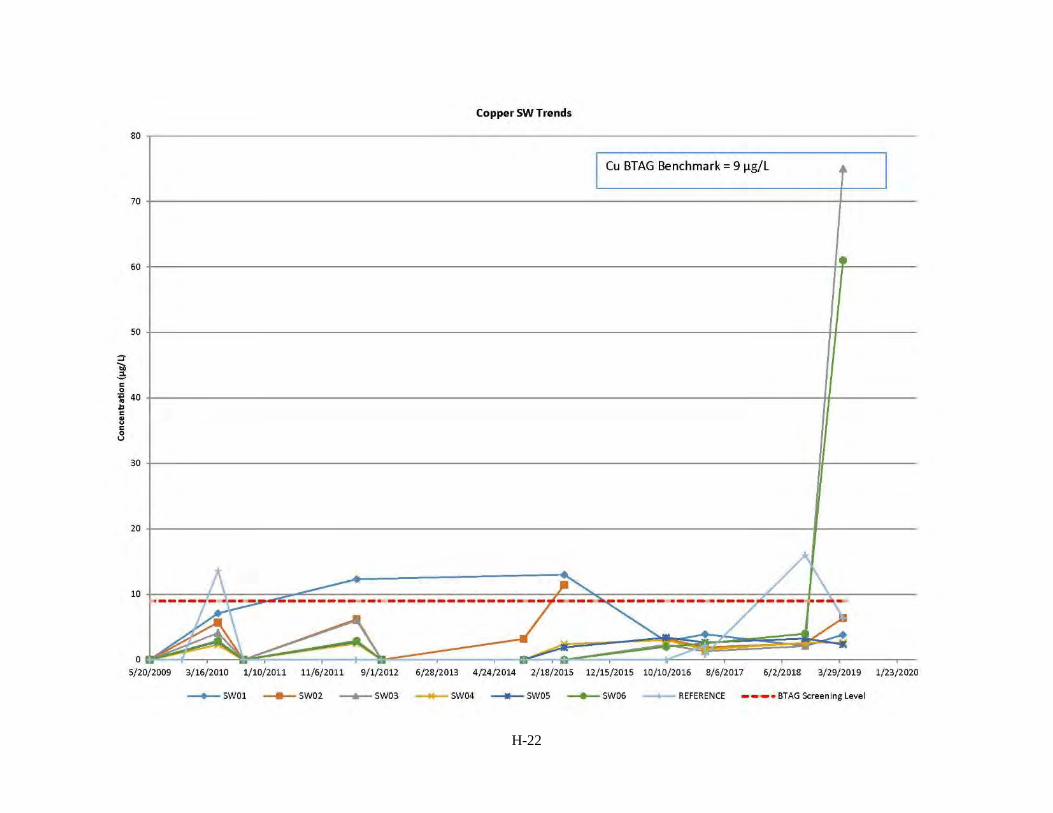
H-22
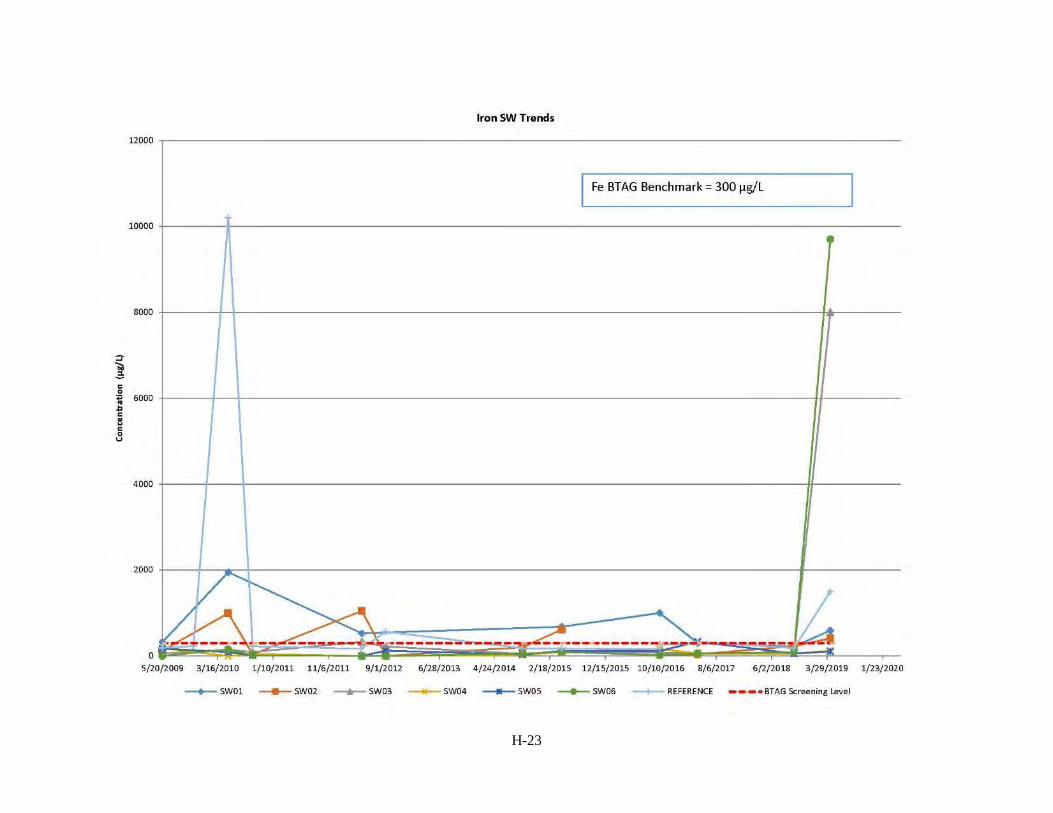
H-23
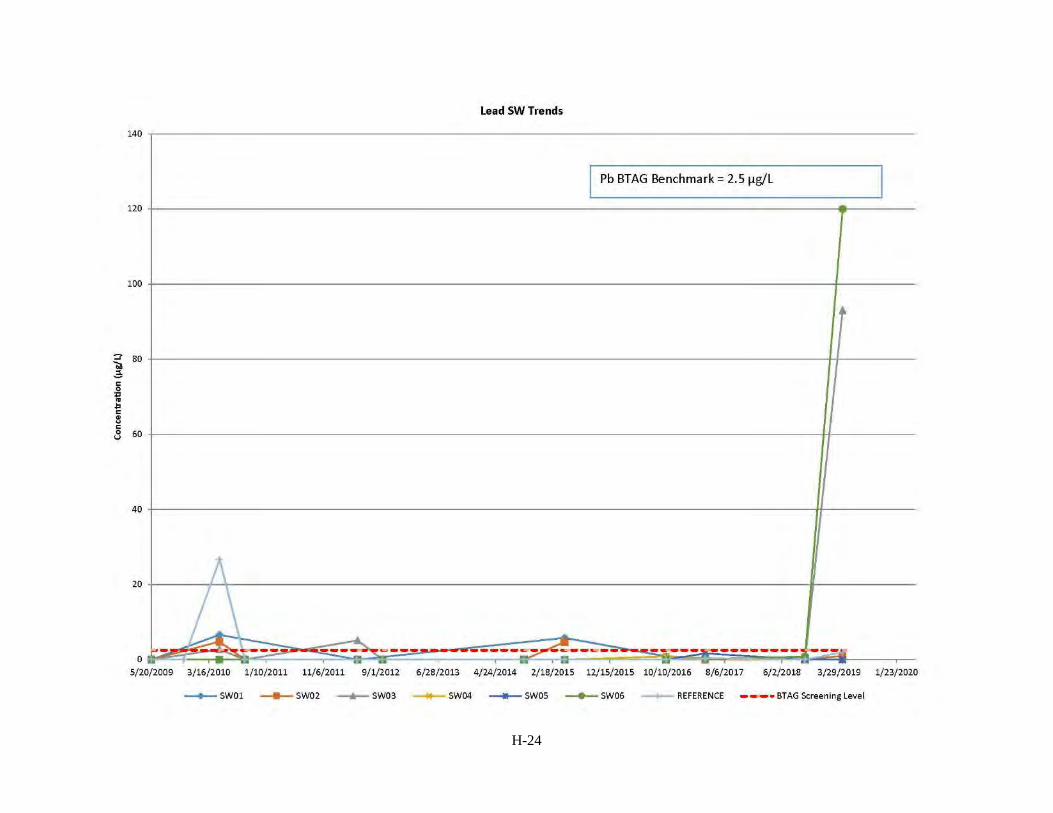
H-24
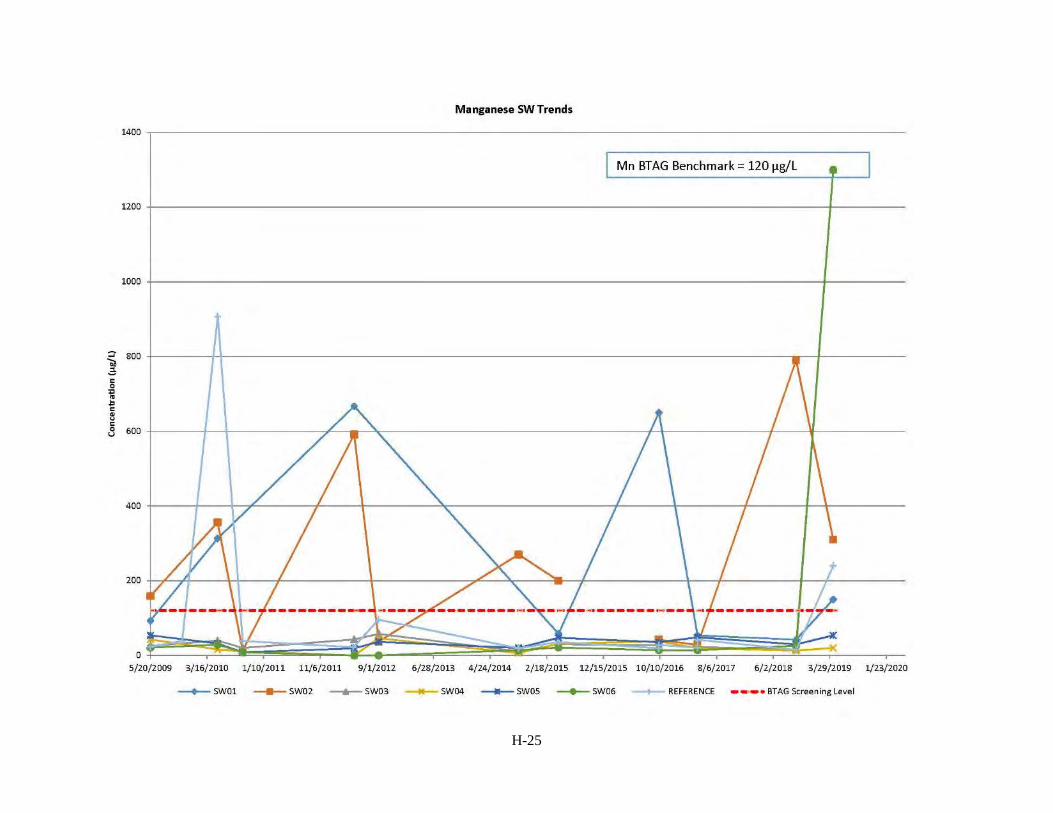
H-25
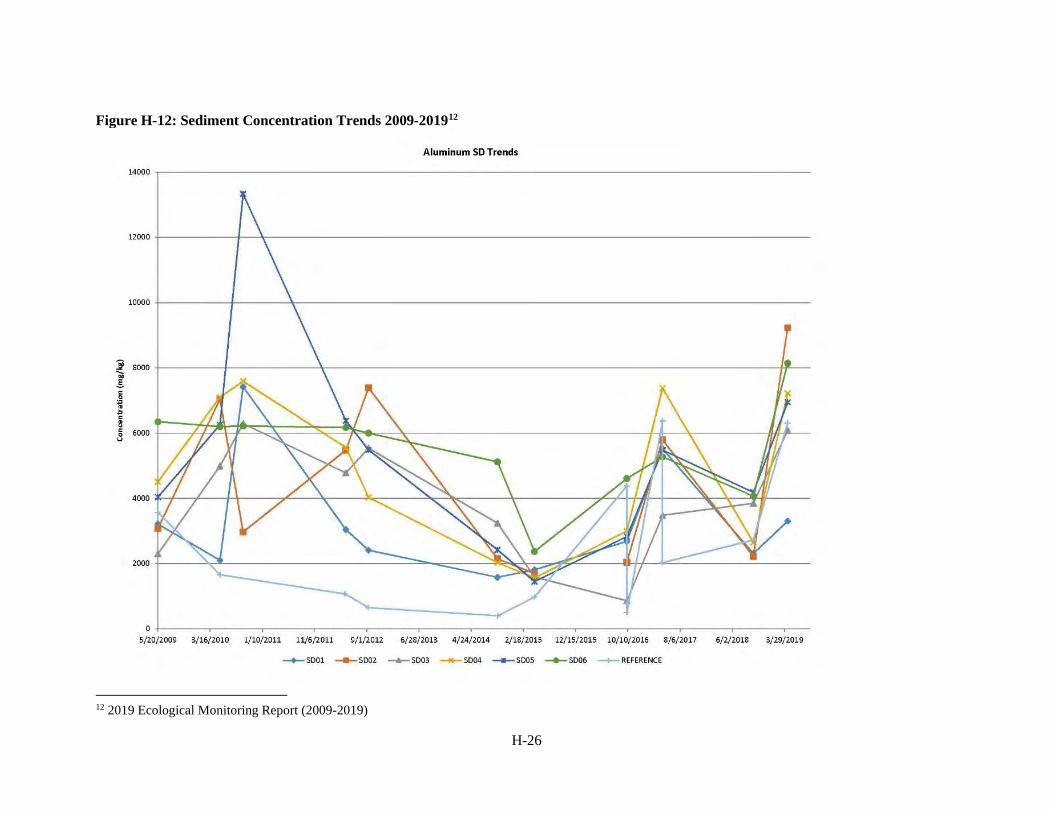
H-26
Figure H-12: Sediment Concentration Trends 2009-201912
12 2019 Ecological Monitoring Report (2009-2019)
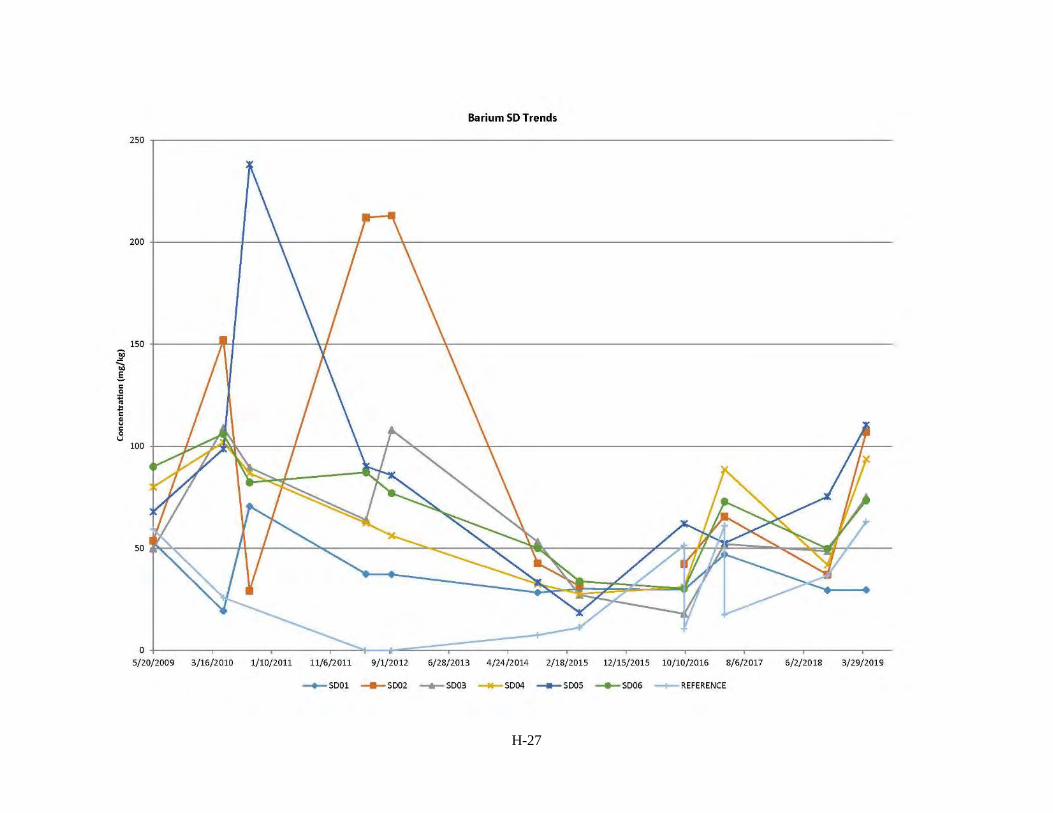
H-27
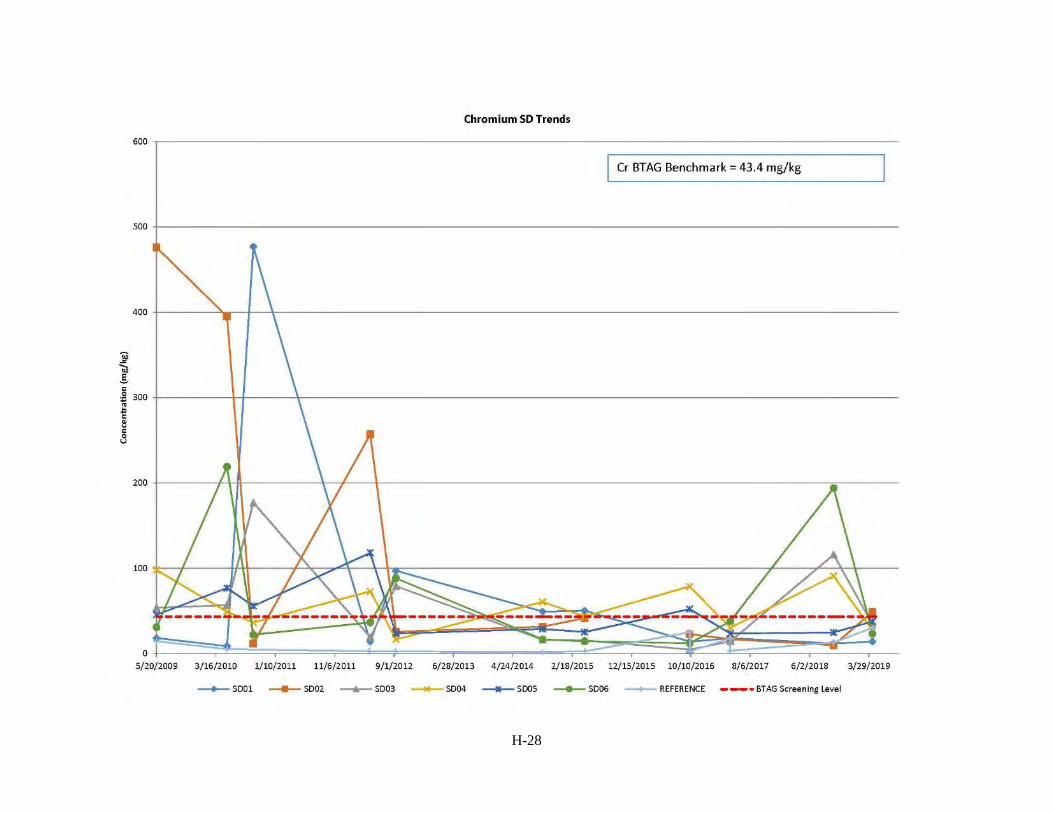
H-28
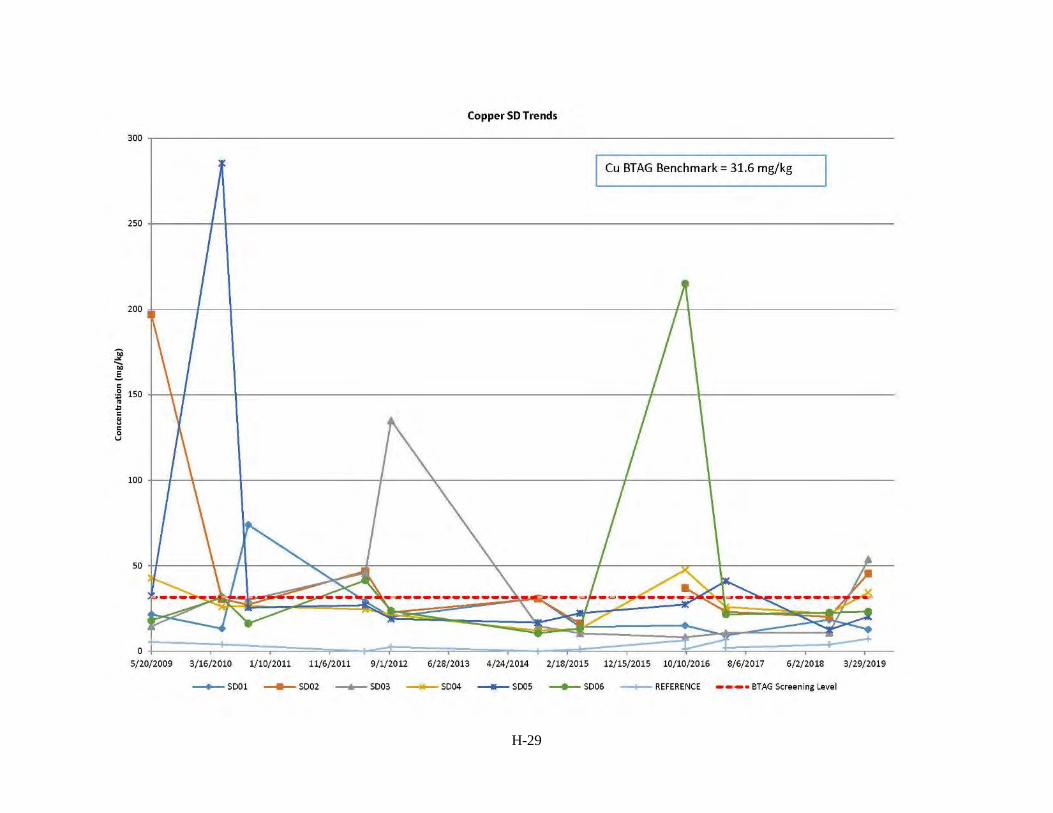
H-29
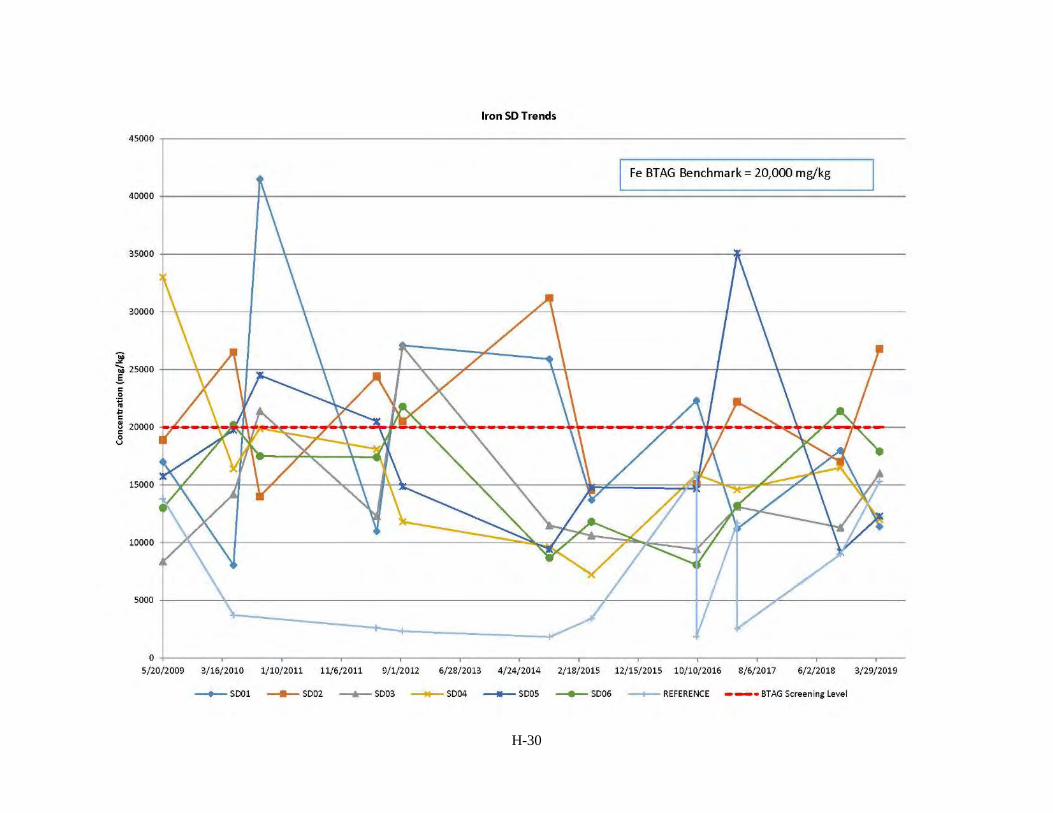
H-30
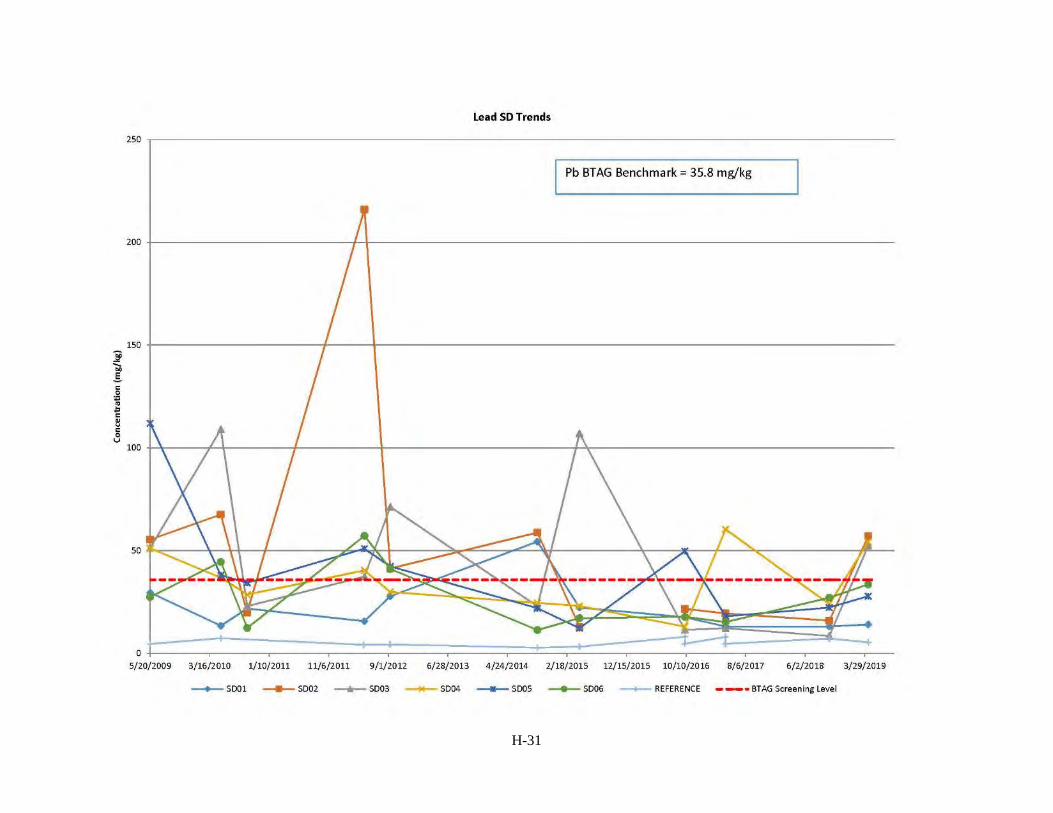
H-31
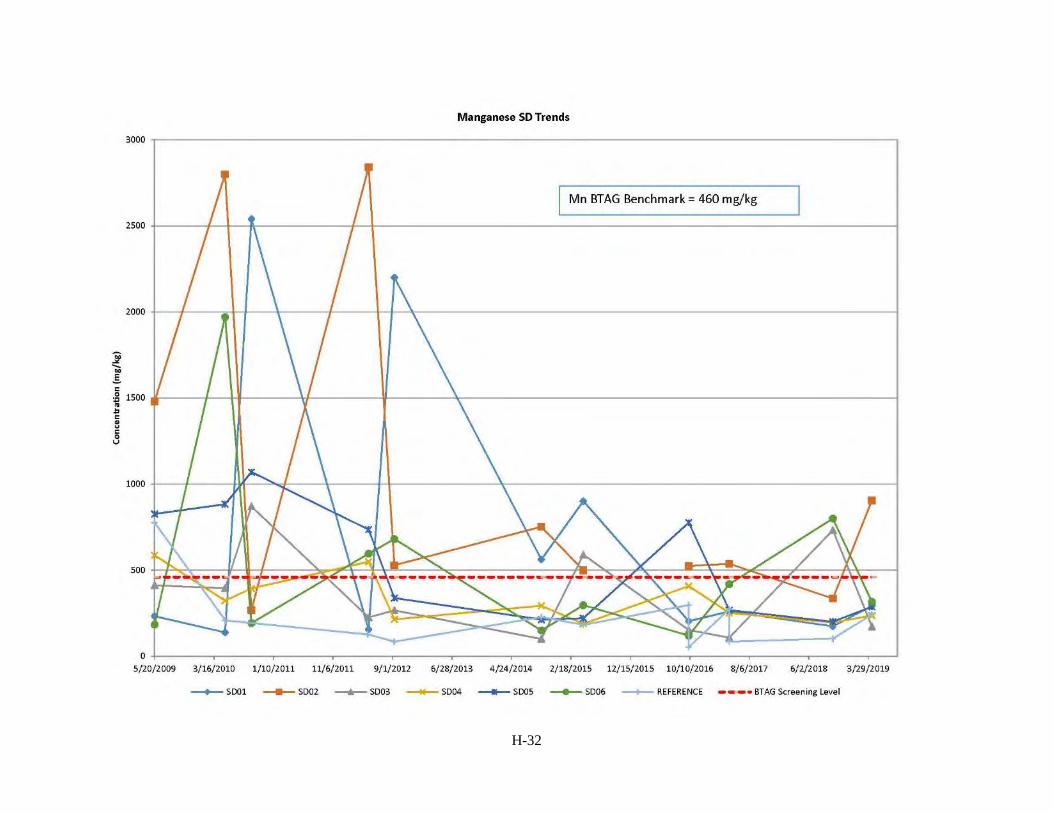
H-32
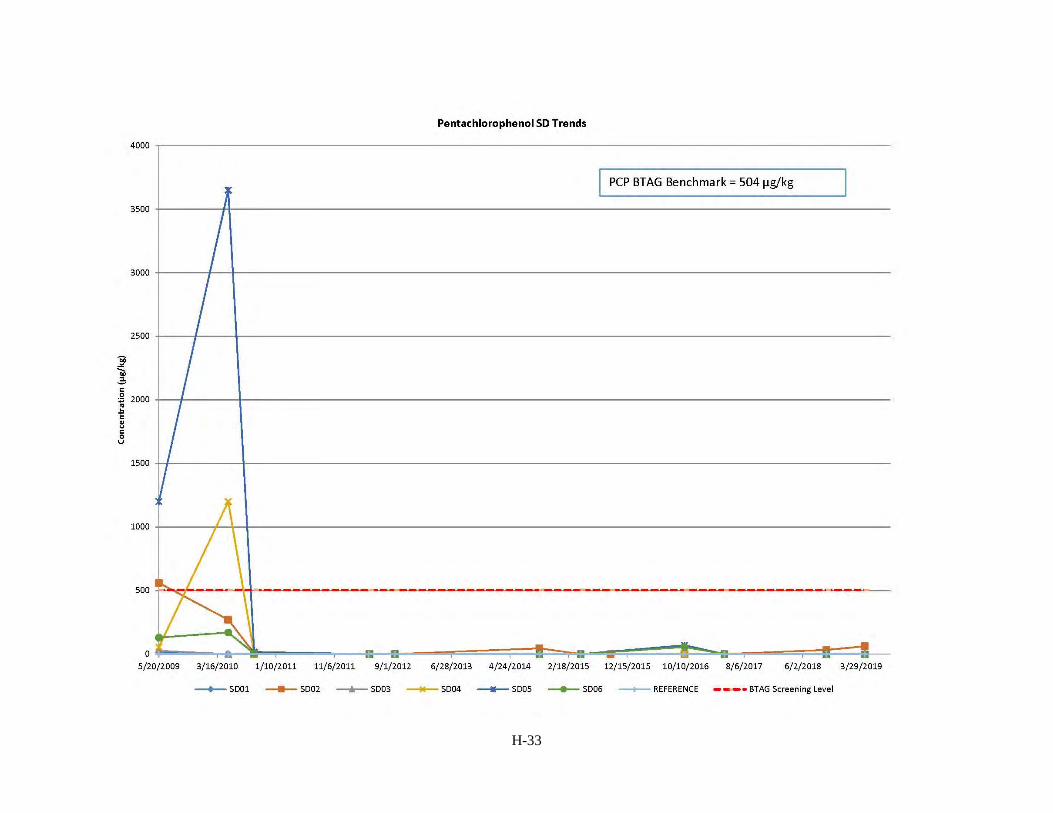
H-33
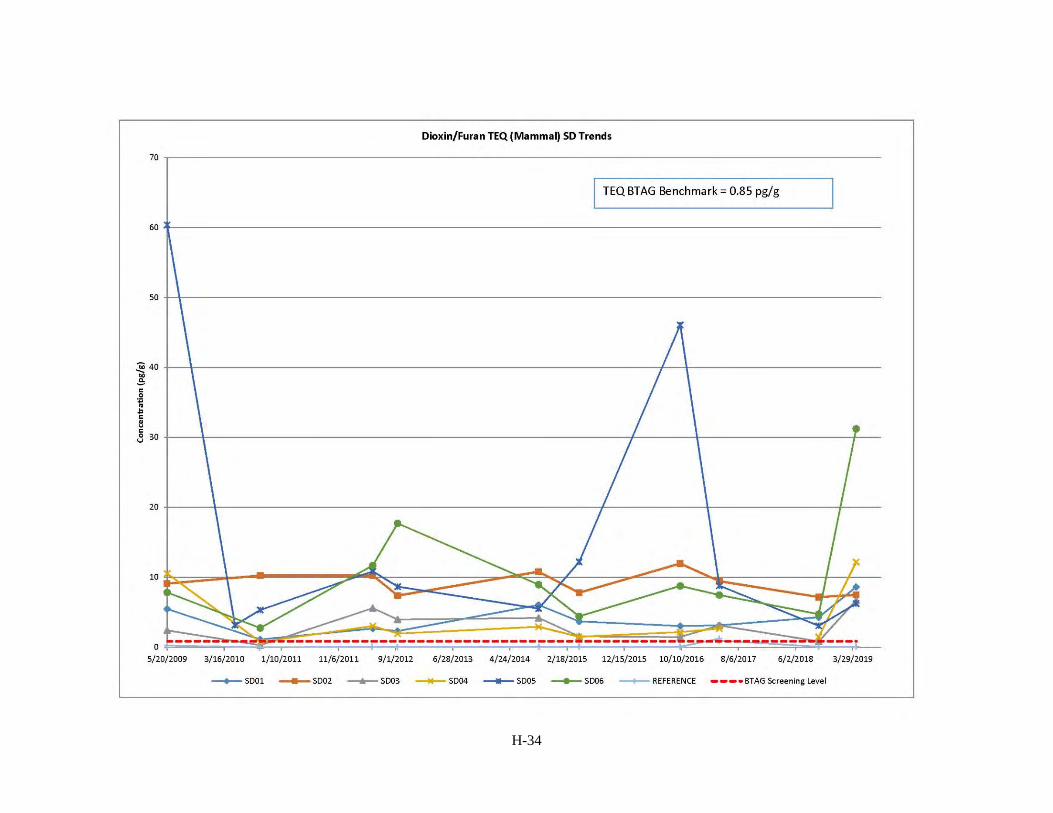
H-34
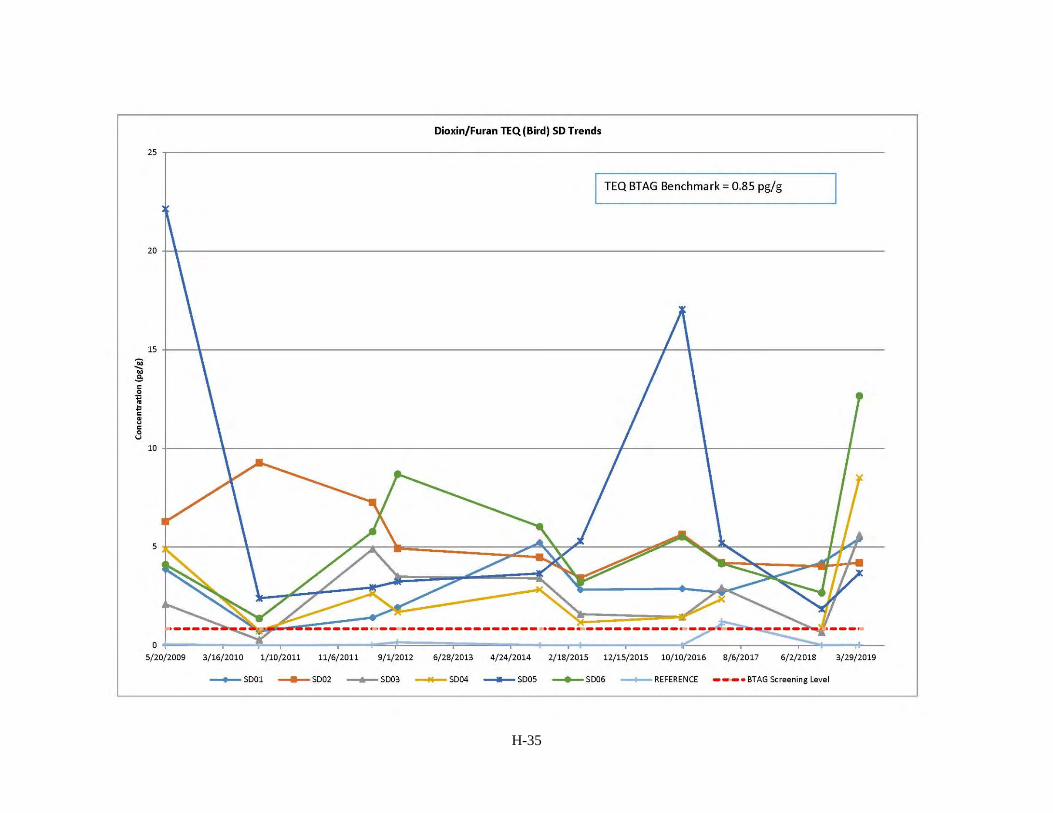
H-35
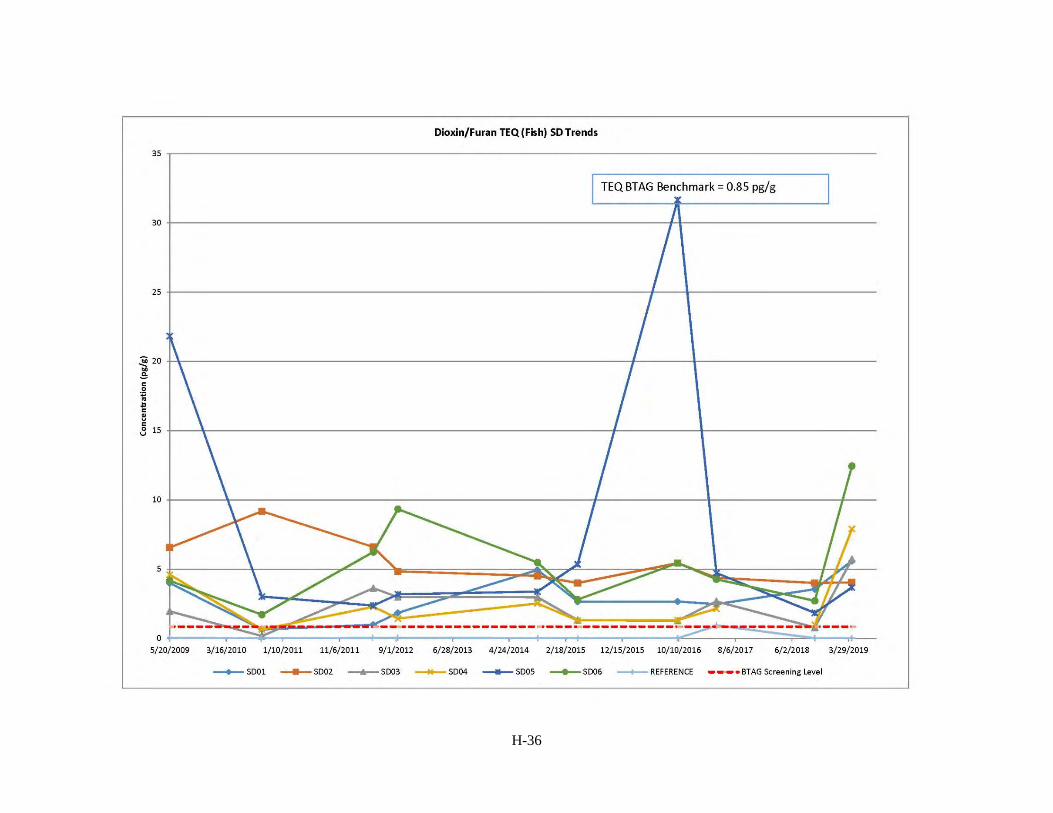
H-36
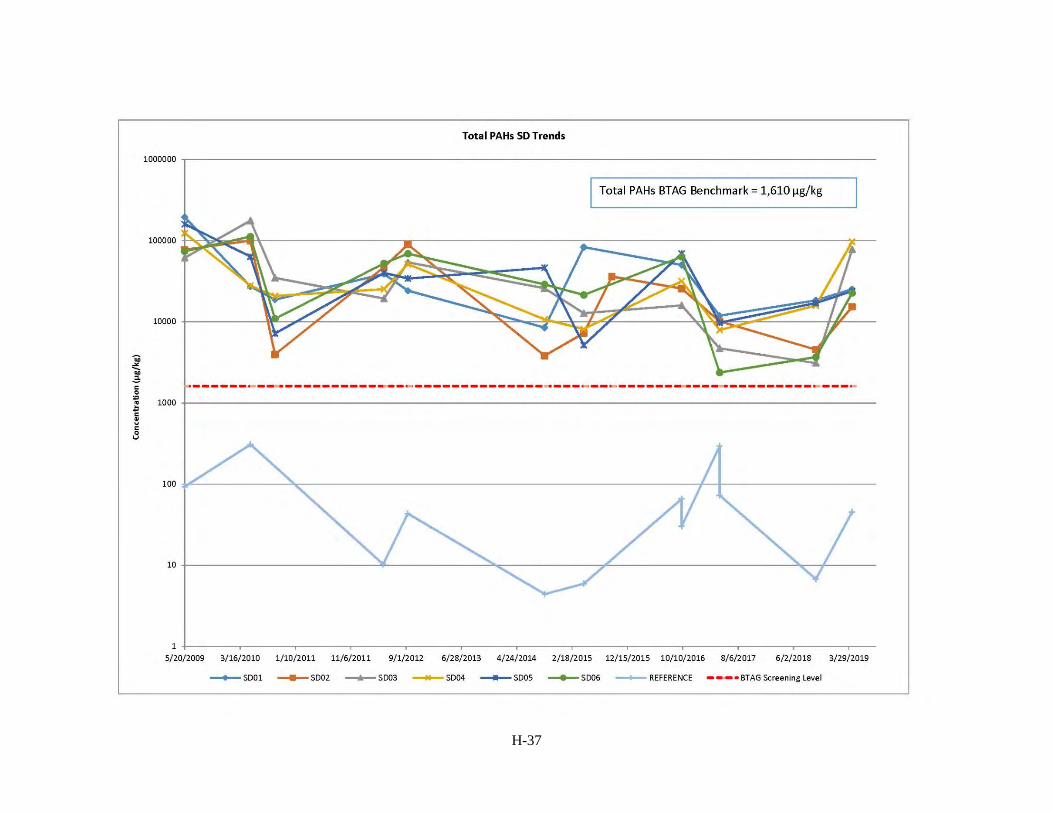
H-37
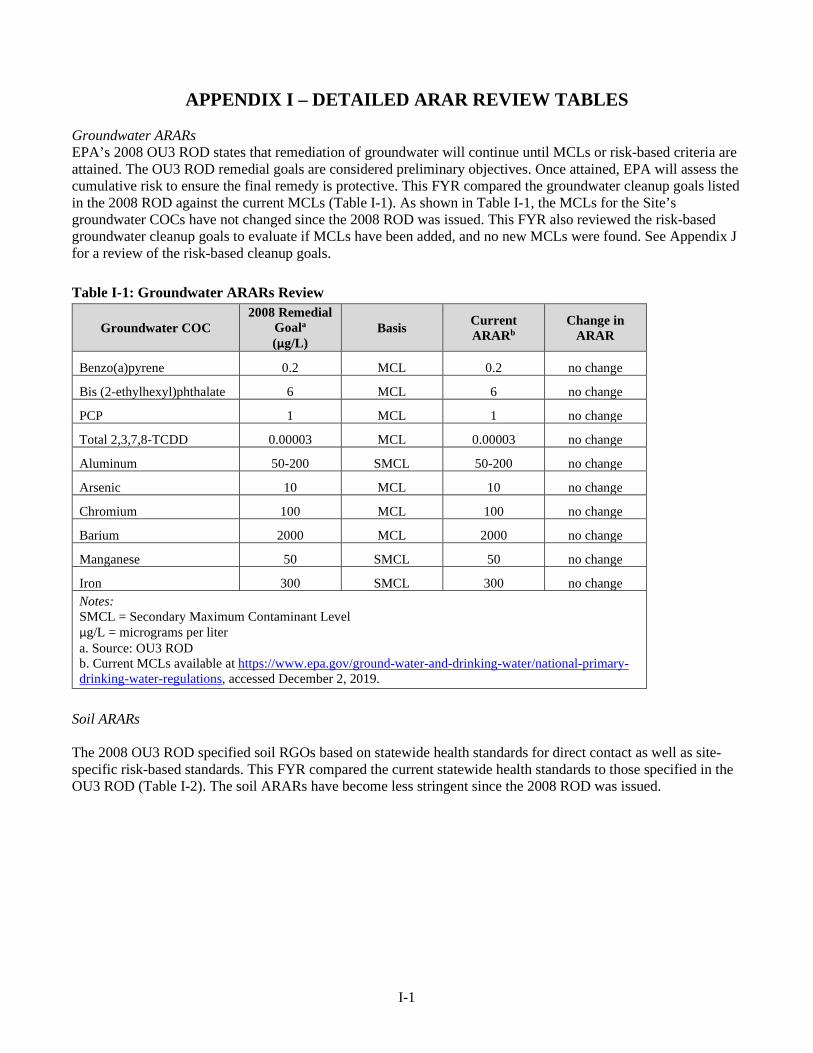
I-1
APPENDIX I – DETAILED ARAR REVIEW TABLES
Groundwater ARARs EPA’s 2008 OU3 ROD states that remediation of groundwater will continue until MCLs or risk-based criteria are attained. The OU3 ROD remedial goals are considered preliminary objectives. Once attained, EPA will assess the cumulative risk to ensure the final remedy is protective. This FYR compared the groundwater cleanup goals listed in the 2008 ROD against the current MCLs (Table I-1). As shown in Table I-1, the MCLs for the Site’s groundwater COCs have not changed since the 2008 ROD was issued. This FYR also reviewed the risk-based groundwater cleanup goals to evaluate if MCLs have been added, and no new MCLs were found. See Appendix J for a review of the risk-based cleanup goals. Table I-1: Groundwater ARARs Review
Groundwater COC 2008 Remedial
Goala
(µg/L) Basis Current
ARARb Change in
ARAR
Benzo(a)pyrene 0.2 MCL 0.2 no change
Bis (2-ethylhexyl)phthalate 6 MCL 6 no change
PCP 1 MCL 1 no change
Total 2,3,7,8-TCDD 0.00003 MCL 0.00003 no change
Aluminum 50-200 SMCL 50-200 no change
Arsenic 10 MCL 10 no change
Chromium 100 MCL 100 no change
Barium 2000 MCL 2000 no change
Manganese 50 SMCL 50 no change
Iron 300 SMCL 300 no change Notes: SMCL = Secondary Maximum Contaminant Level µg/L = micrograms per liter a. Source: OU3 ROD b. Current MCLs available at https://www.epa.gov/ground-water-and-drinking-water/national-primary-drinking-water-regulations, accessed December 2, 2019.
Soil ARARs The 2008 OU3 ROD specified soil RGOs based on statewide health standards for direct contact as well as site-specific risk-based standards. This FYR compared the current statewide health standards to those specified in the OU3 ROD (Table I-2). The soil ARARs have become less stringent since the 2008 ROD was issued.
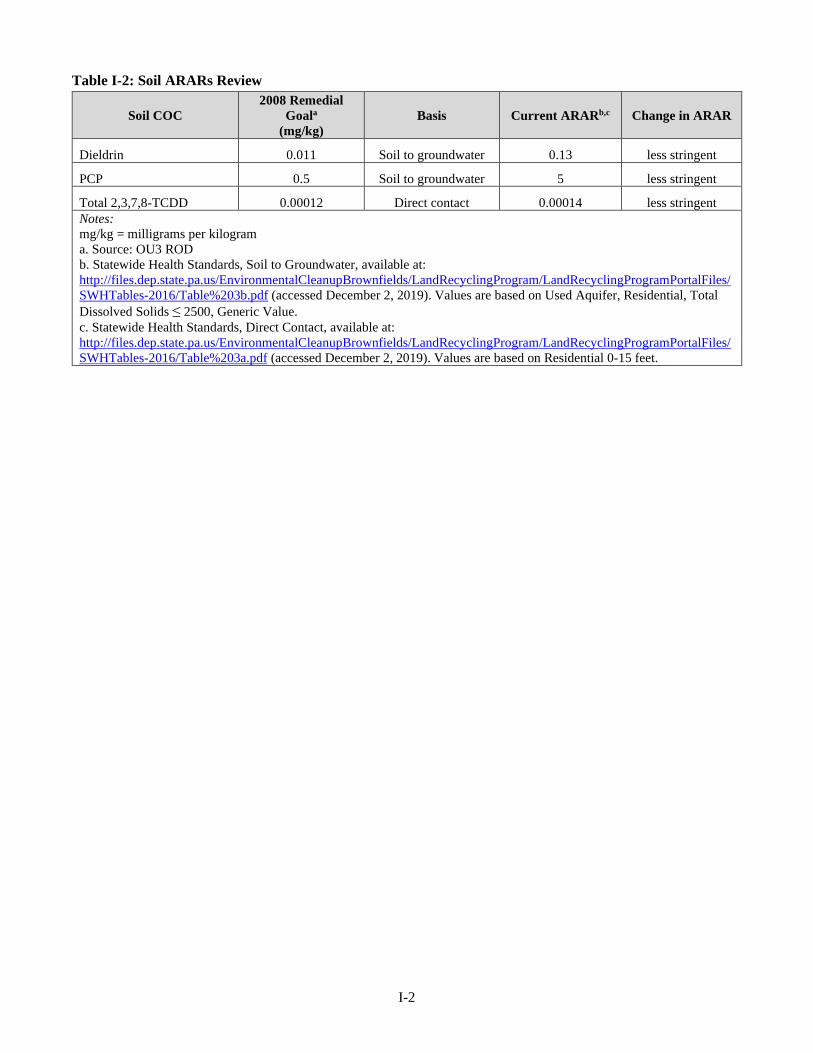
I-2
Table I-2: Soil ARARs Review
Soil COC 2008 Remedial
Goala
(mg/kg) Basis Current ARARb,c Change in ARAR
Dieldrin 0.011 Soil to groundwater 0.13 less stringent
PCP 0.5 Soil to groundwater 5 less stringent
Total 2,3,7,8-TCDD 0.00012 Direct contact 0.00014 less stringent Notes: mg/kg = milligrams per kilogram a. Source: OU3 ROD b. Statewide Health Standards, Soil to Groundwater, available at: http://files.dep.state.pa.us/EnvironmentalCleanupBrownfields/LandRecyclingProgram/LandRecyclingProgramPortalFiles/SWHTables-2016/Table%203b.pdf (accessed December 2, 2019). Values are based on Used Aquifer, Residential, Total Dissolved Solids ≤ 2500, Generic Value. c. Statewide Health Standards, Direct Contact, available at: http://files.dep.state.pa.us/EnvironmentalCleanupBrownfields/LandRecyclingProgram/LandRecyclingProgramPortalFiles/SWHTables-2016/Table%203a.pdf (accessed December 2, 2019). Values are based on Residential 0-15 feet.
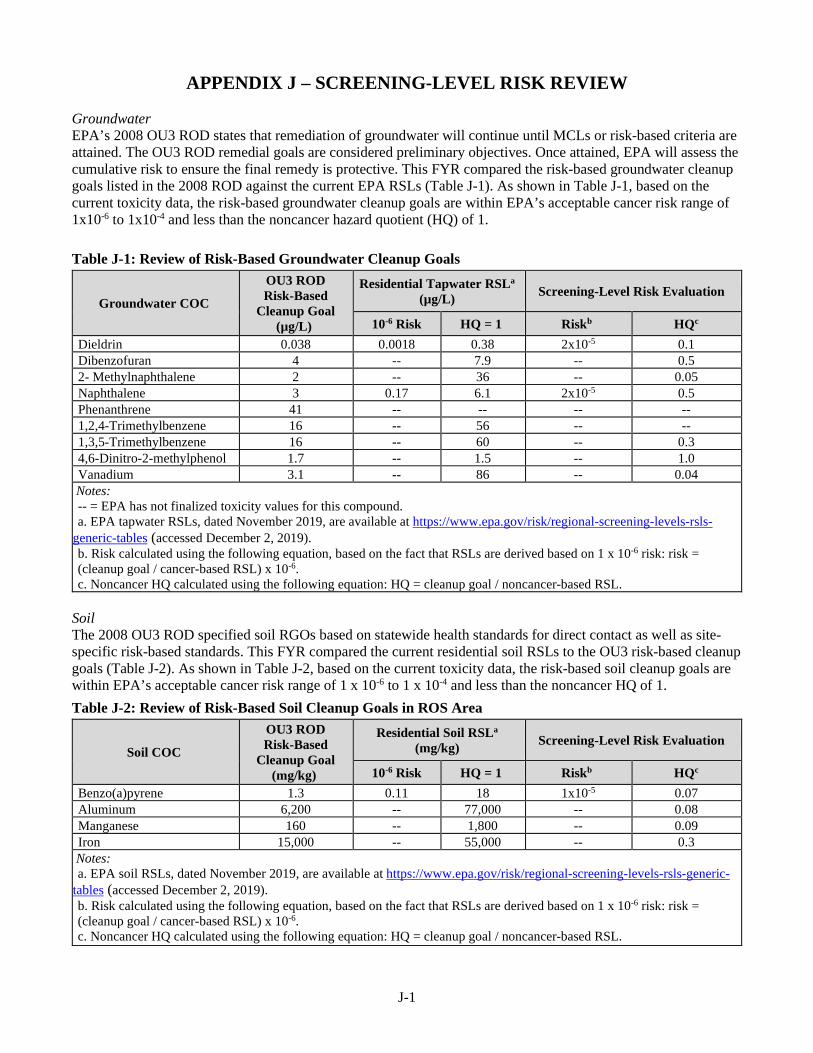
J-1
APPENDIX J – SCREENING-LEVEL RISK REVIEW Groundwater EPA’s 2008 OU3 ROD states that remediation of groundwater will continue until MCLs or risk-based criteria are attained. The OU3 ROD remedial goals are considered preliminary objectives. Once attained, EPA will assess the cumulative risk to ensure the final remedy is protective. This FYR compared the risk-based groundwater cleanup goals listed in the 2008 ROD against the current EPA RSLs (Table J-1). As shown in Table J-1, based on the current toxicity data, the risk-based groundwater cleanup goals are within EPA’s acceptable cancer risk range of 1x10⁻⁶ to 1x10⁻⁴ and less than the noncancer hazard quotient (HQ) of 1. Table J-1: Review of Risk-Based Groundwater Cleanup Goals
Groundwater COC
OU3 ROD Risk-Based
Cleanup Goal (µg/L)
Residential Tapwater RSLa (µg/L) Screening-Level Risk Evaluation
10-6 Risk HQ = 1 Riskb HQc Dieldrin 0.038 0.0018 0.38 2x10⁻⁵ 0.1 Dibenzofuran 4 -- 7.9 -- 0.5 2- Methylnaphthalene 2 -- 36 -- 0.05 Naphthalene 3 0.17 6.1 2x10⁻⁵ 0.5 Phenanthrene 41 -- -- -- -- 1,2,4-Trimethylbenzene 16 -- 56 -- -- 1,3,5-Trimethylbenzene 16 -- 60 -- 0.3 4,6-Dinitro-2-methylphenol 1.7 -- 1.5 -- 1.0 Vanadium 3.1 -- 86 -- 0.04
Notes: -- = EPA has not finalized toxicity values for this compound. a. EPA tapwater RSLs, dated November 2019, are available at https://www.epa.gov/risk/regional-screening-levels-rsls-
generic-tables (accessed December 2, 2019). b. Risk calculated using the following equation, based on the fact that RSLs are derived based on 1 x 10⁻⁶ risk: risk = (cleanup goal / cancer-based RSL) x 10-6. c. Noncancer HQ calculated using the following equation: HQ = cleanup goal / noncancer-based RSL.
Soil The 2008 OU3 ROD specified soil RGOs based on statewide health standards for direct contact as well as site-specific risk-based standards. This FYR compared the current residential soil RSLs to the OU3 risk-based cleanup goals (Table J-2). As shown in Table J-2, based on the current toxicity data, the risk-based soil cleanup goals are within EPA’s acceptable cancer risk range of 1 x 10⁻⁶ to 1 x 10⁻⁴ and less than the noncancer HQ of 1. Table J-2: Review of Risk-Based Soil Cleanup Goals in ROS Area
Soil COC
OU3 ROD Risk-Based
Cleanup Goal (mg/kg)
Residential Soil RSLa (mg/kg) Screening-Level Risk Evaluation
10-6 Risk HQ = 1 Riskb HQc Benzo(a)pyrene 1.3 0.11 18 1x10⁻⁵ 0.07 Aluminum 6,200 -- 77,000 -- 0.08 Manganese 160 -- 1,800 -- 0.09 Iron 15,000 -- 55,000 -- 0.3
Notes: a. EPA soil RSLs, dated November 2019, are available at https://www.epa.gov/risk/regional-screening-levels-rsls-generic-
tables (accessed December 2, 2019). b. Risk calculated using the following equation, based on the fact that RSLs are derived based on 1 x 10⁻⁶ risk: risk = (cleanup goal / cancer-based RSL) x 10-6. c. Noncancer HQ calculated using the following equation: HQ = cleanup goal / noncancer-based RSL.