final report - clean air action plancleanairactionplan.org/documents/siemens-scaqmd-catenary... ·...
TRANSCRIPT
Unrestricted Siemens AG 2018 - eHighway Page 1 of 53
FINAL REPORT
SCAQMD Contract 14062
Construction of a 1 Mile Catenary System and Develop &Demonstrate Catenary Hybrid Electric Trucks

Unrestricted Siemens AG 2018 - eHighway Page 2 of 53
eHighway SoCalFinal Report
SCAQMD Contract 14062
Construction of a 1 Mile Catenary System andDevelop & Demonstrate Catenary Electric Trucks
Final Test Results and Project ReportProject Period: 2014/7/14 - 2018/02/28
Provided by Siemens Industry INC
2018/Mar/12; Carson, CA and Erlangen, Germany
Unrestricted Siemens AG 2018 - eHighway Page 3 of 53
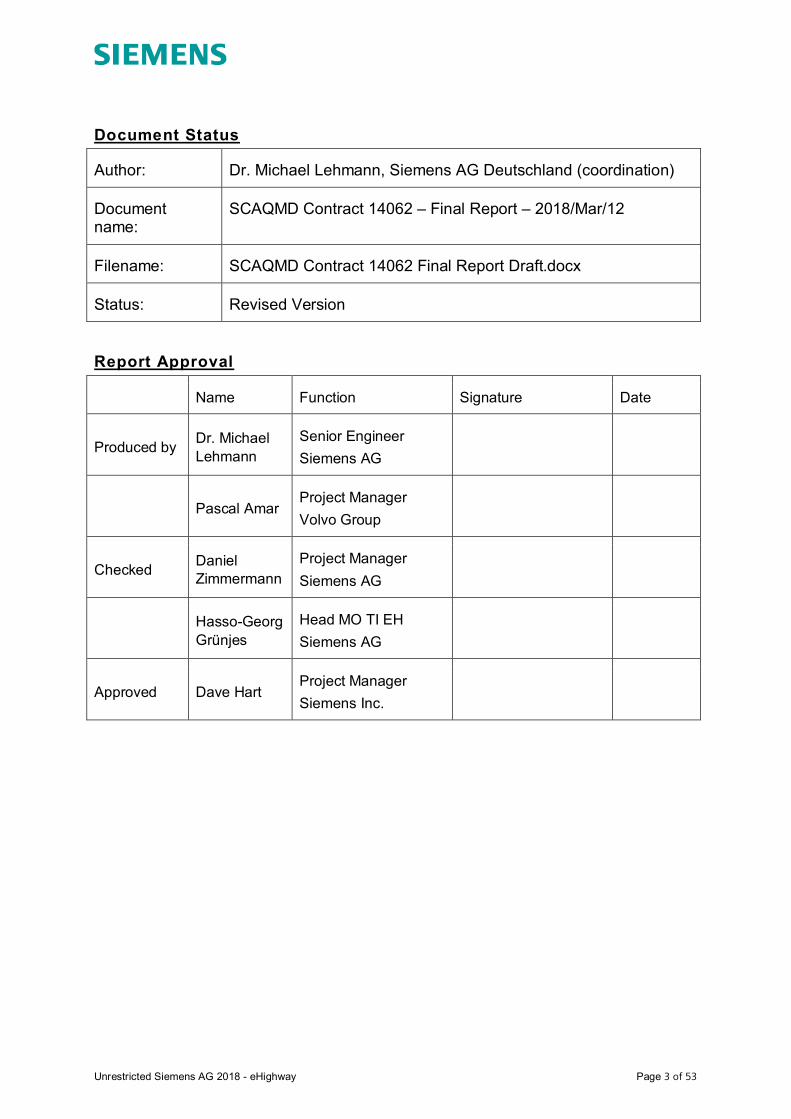
Document Status
Author: Dr. Michael Lehmann, Siemens AG Deutschland (coordination)
Documentname:
SCAQMD Contract 14062 – Final Report – 2018/Mar/12
Filename: SCAQMD Contract 14062 Final Report Draft.docx
Status: Revised Version
Report Approval
Name Function Signature Date
Produced by Dr. MichaelLehmann
Senior EngineerSiemens AG
Pascal AmarProject ManagerVolvo Group
Checked DanielZimmermann
Project ManagerSiemens AG
Hasso-GeorgGrünjes
Head MO TI EHSiemens AG
Approved Dave HartProject ManagerSiemens Inc.

Unrestricted Siemens AG 2018 - eHighway Page 4 of 53
Contents
1 Purpose and structure of the document ............................................................. 62 Project background and objectives ..................................................................... 73 Executive summary .............................................................................................. 93.1 Statement of project .......................................................................................................... 93.2 Project objectives .............................................................................................................. 93.3 The eHighway as a zero emission road freight technology .............................................. 103.4 Project conclusions ......................................................................................................... 103.5 Recommendations and future work ................................................................................. 113.6 Acknowledgment of all project sponsors .......................................................................... 11
4 eHighway – ZE technology essentials............................................................... 124.1 Substation and catenary for external power supply ......................................................... 124.2 The eHighway hybrid trucks and pantographs ................................................................. 134.3 Driveway ......................................................................................................................... 164.4 Operation and maintenance ............................................................................................ 16
5 Scope of work according contract .................................................................... 175.1 Task 1 - Basic Infrastructure System Design ................................................................... 185.2 Task 2 - CEQA and Construction Permitting .................................................................... 205.3 Task 3 - Infrastructure System Detailed Design ............................................................... 215.4 Task 4 - Procurement and Manufacturing – Infrastructure ............................................... 235.5 Task 5 - Installation and Commissioning of Infrastructure ................................................ 255.6 Task 6 - Pantograph system definition and interface Identification .................................. 275.7 Task 7 - Pantograph engineering integration and certification ......................................... 295.8 Task 8 - Pantograph production, assembly and integration into the hybrid trucks ............ 315.9 Task 9 - Catenary truck and infrastructure demonstration ............................................... 33
5.9.1 Component Integration Testing in Germany (Task 9.1) ...................................... 335.9.2 Testing on site Alameda Street - Demonstration phase and testing ................... 345.9.3 Catenary system safety analysis (Task 9.4) ....................................................... 35
5.10 Task 10 - Determine owner and operator of system ........................................................ 375.11 Task 11 - Project management and reporting .................................................................. 375.12 Task 12 - System decommissioning and site restoration ................................................. 37
6 Challenges, findings, recommendations .......................................................... 386.1 Challenges during project execution ................................................................................ 386.2 Findings during testing phase .......................................................................................... 396.3 Recommendations for research and improvement .......................................................... 40
7 Assessment of project goals ............................................................................. 427.1 Zero emission goods movement technologies ................................................................. 427.2 Most viable technology .................................................................................................... 437.3 Conclusions and perspectives ......................................................................................... 45
Unrestricted Siemens AG 2018 - eHighway Page 5 of 53
8 Public relations and communication ................................................................. 468.1 Press and media releases ............................................................................................... 468.2 Presentations to Customers and Stakeholders ................................................................ 47
9 Abbreviations, literature and Indices ................................................................ 489.1 Abbreviations .................................................................................................................. 489.2 Literature ......................................................................................................................... 499.3 Figures ............................................................................................................................ 519.4 Tables ............................................................................................................................. 51
10 Appendices .......................................................................................................... 5210.1 Project Synopsis.............................................................................................................. 5210.2 Information package I – Press & Media event ................................................................. 5210.3 Information package II – Press Releases ........................................................................ 5210.4 Photo documentation ...................................................................................................... 5210.5 Vehicle data sheets and key facts ................................................................................... 53

Unrestricted Siemens AG 2018 - eHighway Page 6 of 53
1 Purpose and structure of the documentThe aim of this document is to supply a final report of the SCAQMD Contract 14062. Itis structured according to the contractual requirements of the statement of work [1] andcomplements the deliverables which were provided during project execution. The mainfocus is to summarize all tasks and specially concentrating on system performance andtesting in course of the EHWY SoCal project on Alameda Street in Carson, CA.The project focused on erection of 1 mile catenary bi-directional infrastructure, a powersupply substation and integration of pantograph type current collectors into threedifferent trucks which were intensely tested, see Figure 1 and Figure 2. Details ontesting and results are given in [2].
Figure 1 TransPower CCAT (front) and ECAT (behind) at test track next to substation
Figure 2 MACK Truck (Volvo Group) with trailer on Alameda Street

Unrestricted Siemens AG 2018 - eHighway Page 7 of 53
2 Project background and objectivesAir quality remains a major challenge for Southern California. According to the 2016 AirQuality Management Plan (AQMP) “the most significant air quality challenge in theBasin is to reduce nitrogen oxides (NOx) emissions sufficiently to meet the upcomingozone standard deadlines.”[A1] The AQMP further states that 552 tons NOx is emittedeach year and that 56% of this stems from on-road mobile sources. The largestsegment of mobile sources causing these emissions is heavy-duty trucks, which emit147 tons of NOx each year. Forecasts point to significant NOx reductions across allsegments, but NOx emissions will remain a challenge and heavy-duty trucks will remainthe leading emitter of NOx for as long as the forecasts have been modeled (year 2031).As the 2015 AQMD White Paper on Goods Movement states, “the analysis for thegoods movement sector shows a need for greater penetration of zero- and near-zero-emission technologies in order to attain air quality standards” [A2].The AQMP also highlights the importance of co-benefits, for instance from state levelplans to reduce greenhouse gas (GHG) emissions. Transportation has become the byfar biggest source and is currently estimated to emit 39% of all California’s GHG. This ispartly because of the strong decarbonization achievements on the power generationside, but it is also due to the growth in transportation activity as well as slow progress inmaking vehicles (such as heavy-duty trucks) emit less. In fact, the forecast for freightrelated GHG emissions shows that trucks constitute the biggest source and areforecasted to grow strongly up to 2050, the year by which California should havereduced all its GHG emissions by 80% compared to 1990 levels, see following Figure 3.
Figure 3 Trends in California GHG Emissions [A3]
In accordance with State Bill (SB) 375 ARB sets goals for Metropolitan PlanningOrganizations (MPOs) such as Southern California Association of Governments

Unrestricted Siemens AG 2018 - eHighway Page 8 of 53
(SCAG) to reduce emissions from cars and light vans [A4]. As of the 2017 update theSCAG was expected to achieve GHG reductions of 21% by 2035. Truck emissions (andother goods movement) falls under the California Sustainable Freight Action Plan(CSFAP) [A5]. It “establishes clear targets to improve freight efficiency, transition tozero-emission technologies, and increase competitiveness of California's freightsystem”. One such target is to “deploy over 100,000 freight vehicles and equipmentcapable of zero emission operation.” The California Air Resources Board (CARB)estimates there to be around US $53 billion over the next 10 years to address GHGemissions from transportation [A6]. Alone in 2018/2019 $398 million is available forclean trucks [A7]. There are also examples of funding being available to infrastructurefor those vehicles [A8].
Figure 4 Statewide GHG Emissions from Freight Sources [A9]
To a significant extent both air quality issues and GHG emissions stem from truckoperations. Therefore SCAQMD decided to road test that zero emission technology inthe port drayage operations.Taking the increasing demand for renewable electrical energy in all sectors into accountit will be essential to apply solutions with maximum efficiency, as shown in Figure 5.
Figure 5 WTW (well to wheel) efficiencies of decarbonized road freight options

Unrestricted Siemens AG 2018 - eHighway Page 9 of 53
3 Executive summary3.1 Statement of projectFor heavy-duty vehicles, the diesel engine is used almost exclusively as the method ofpropulsion. Since the end of the 1960s, the fuel consumption of a 40-ton truck trailerwas reduced by around a third. By 2030, a further increase in engine efficiency from 20to 30 % is forecasted. While the innovations and the developments for traditionalcombustion trucks to lower emissions are progressing, the increasing road trafficvolume caused by a demanding transport sector is compensating those improvements.Thus there is the need of a rapid and practicable solution to freeze and sustainablylower all emissions - locally harmful exhausts and greenhouse gases. Renewablygenerated electrical energy will play a significant role in achieving these targets. At thesame time the technical and operational limitations of energy storage systems (such asbatteries) must be overcome. This can be best achieved by supplying the electricalenergy to propell a heavy truck over long distances by means of an electric road system(ERS). ERS with external power supply make it possible to upgrade existing roadinfrastructure and thus avoid the need to develop new costly routes including their longplanning and approval procedures. To realize emission reduced transport the provisionof zero emission corridors based on an electric road system is an option. Thosecorridors could provide a major contribution to the targeted emission goals. For non-electrified sections the use of complementary technologies, i.e. batteries, fuel cells, orrange extenders with compressed natural gas (CNG) or synthetic fuels may be added.The key purpose of the project is to demonstrate the viability of such a zero emissioncorridor with catenary supply combined with a variety of low- or zero- emission trucks.
3.2 Project objectivesHeavy-duty trucks are the number one source of smog-forming emissions in SouthernCalifornia. Developing a zero- or near-zero emission goods transport system at theports will reduce smog-forming, toxic and greenhouse gas emissions in communitiesaround the ports, which are heavily impacted by air pollution.The primary goal of this project was to promote the implementation of zero emissiongoods movement technologies, and the secondary goal was to demonstrate the mostviable technology to be adopted for a future, regional zero-emissions corridor. This wasdone by combining an overhead contact line based electric road system with trucksfrom different OEM suppliers utilizing three different drive technologies. Key to successand major objectives of the project was the integration of an advanced pantograph intothree class 8 trucks to allow full electric operation on the catenary infrastructure built forthis project. The catenary system was built in both directions on a 1 mile stretch ofAlameda Street in Carson, CA, which is a major truck route heavily used by trucksserving the ports of Long Beach and Los Angeles.After integration of hybrid drivetrains and pantographs into the trucks and following theconstruction of the catenary infrastructure, the project was completed by comprehensivetests under real traffic conditions on a public road. This testing was meant to measurethe required parameters, to check the operational procedures and to demonstratematurity of the solution. The outcomes of those tests are outlined in [2].Further objectives of the project are the assessment of the environmental benefits andthe determination of key financial indicators of the zero emission technology.

Unrestricted Siemens AG 2018 - eHighway Page 10 of 53
3.3 The eHighway as a zero emission road freighttechnology
In order to achieve the project objectives it was necessary to design, build andcommission a catenary infrastructure consisting of a bipolar overhead catenary systemsupported by poles located on the median, a DC (direct current) traction powersubstation and an operation and control center. Together with the two hybrid and onefull electric truck, these subsystems form the eHighway system as shown in Figure 6.
Figure 6 Subsystems and components of the eHighway systemThe road testing of the catenary type zero emission technology required two inter-related work strings. On the one hand all planning, design and implementation works ofthe subsystems with their technical interfaces had to be carried out including theiradaption to the local requirements. On the other hand external stakeholders andtechnical interfaces (e.g. to energy suppliers and road administration) required intensecollaboration. Consequently a major subject as well as a key outcome of the project isan improved understanding of all interfaces that need to be considered for a widerimplementation of the technology.
3.4 Project conclusionsThe project has shown that the eHighway system can be implemented in an existingroad infrastructure as a potential zero emission goods transport technology. Duringdemonstration the eHighway system proved to be a viable technology suitable for e.g.regional zero criteria pollutant emission corridors. On the one mile demonstration trackand beyond – depending on the capacity of the onboard energy storage – the class 8trucks were able to operate without any tailpipe emissions. Based on the demonstrationresults the eHighway system may be considered as one of the valid options for zeroemission road freight transports. Provided that renewable electrical energy is used,significant additional CO2 reductions can also be realized.Implementing the eHighway system requires investments in both, the road sideelectrification infrastructure and the eHighway adapted trucks. However, such capitalexpenditure can generate a return on investment as evaluated in the provided businesscases. These are influenced by a multitude of factors such as technology costs,efficiency rates, energy pricing, utilization, transport density, and local infrastructureinstallation conditions. A general business case was developed and submited [14].Nevertheless for individual projects detailed business evaluations are recommended.

Unrestricted Siemens AG 2018 - eHighway Page 11 of 53
Taking into consideration that the system tested was still in a R&D phase and had notreached product maturity in all subsystems yet the performance of the demonstration onAlameda Street is a successful proof of concept in a representative applicationenvironment, but certain externalities resulting from a heavily industrialized andurbanized area need further study on potential costs. Future steps for industrialization ofpantograph and hybrid drive technologies were derived from this milestone project.While underway with the execution of the engineering of the OCS foundationsundocumented utilties were uncovered in the median of Alameda Street. A newfoundation type had to be designed for installation above ground. This design changerequired new engineering designs, permits, approvals, safety barrier design, andisolation of the foundations from traffic - both motorized combustion and motorizedelectrification. In addition, after the execution of the contract documents the State ofCalifornia enacted a law which required the offsetting of a structure from a highpressure gas line. Although SOCAL Gas frequently visited on-site works at all designand construction stages and after the system had been employed for 14 monthsSOCAL Gas required the movement of the substation.After negotiations between SOCAL Gas and AQMD the gas utility allowed for the testingto run from July 1 of 2017 to December 28 of 2017 or a total data testing period of sixmonths. The above mentiones tasks increased the project duration by one year.
3.5 Recommendations and future workThis project demonstrated, that different drive configurations can be used incombination with the eHighway system. Future work should concentrate on:∂ Additional cost/schedule considerations of externalities of urban/industrial
environments.∂ Intensified cooperation with truck OEMs to allow for truck and pantograph
industrialization. The prototyped trucks used in the demonstration had inherentlimitations such as extended wheelbase and slightly reduced payloads, and thusare not yet ready to be directly industrialized.
∂ Elaborating further the interfaces towards energy suppliers with regards to marketroles as infrastructure providers and operators (incl. energy billing).
Since the feasibility of the catenary technology as a highly efficient continuous powersupply backbone is demonstrated, and since the eHighway system can be combinedwith the other technologies for decarbonized zero emission transport, an option forfuture decisions is provided. Parallel developments in energy storages (e.g. batteries) oralternate on-board supplies (e.g. fuel cells) will not deteriorate the eHighway conceptbut increase the overall efficiency on non-electrified sections, whereas reducing costsmay impact the overall economic feasibility.
3.6 Acknowledgment of all project sponsorsThe eHighway demonstration project was funded by the following parties:∂ SCAQMD – South Coast Air Quality Management District∂ China Shipping Fund∂ California Energy Commission∂ Port of Long Beach∂ L. A. Metro∂ Siemens INC (in-kind contributions)We as Siemens INC. are deeply grateful for having had the opportunity to demonstratethe viability of this zero emission technology in a challenging public surrounding.

Unrestricted Siemens AG 2018 - eHighway Page 12 of 53
4 eHighway – ZE technology essentialsTo realize the project objectives it was necessary to design, build and commission thecorresponding infrastructure consisting of a two pole overhead catenary systemsupported by masts, a traction power substation and an operation and control center. Asecond string of work packages was related to the trucks including their hybridizationand the integration of pantographs. While a complete review of the assigned projecttasks is given in Chapter 5 this short chapter is meant to provide key information on thetechnology.The basic idea of the eHighway technology is depicted in Figure 7:
a) after entering an electrified section the pantograph equipped truck detects anoverhead contact line so that a connection can be established while driving
b) once the pantograph is raised and electric contacts in the truck are closed, theexternal power flow can start via the substation components and the catenary
c) within the truck the electric drive is powered directly from the catenary and abattery may be charged in parallel for off-line sections
Figure 7 eHighway core functionalities - (a) contact line detection, (b) external power supplyand (c) power flow in the hybrid truck
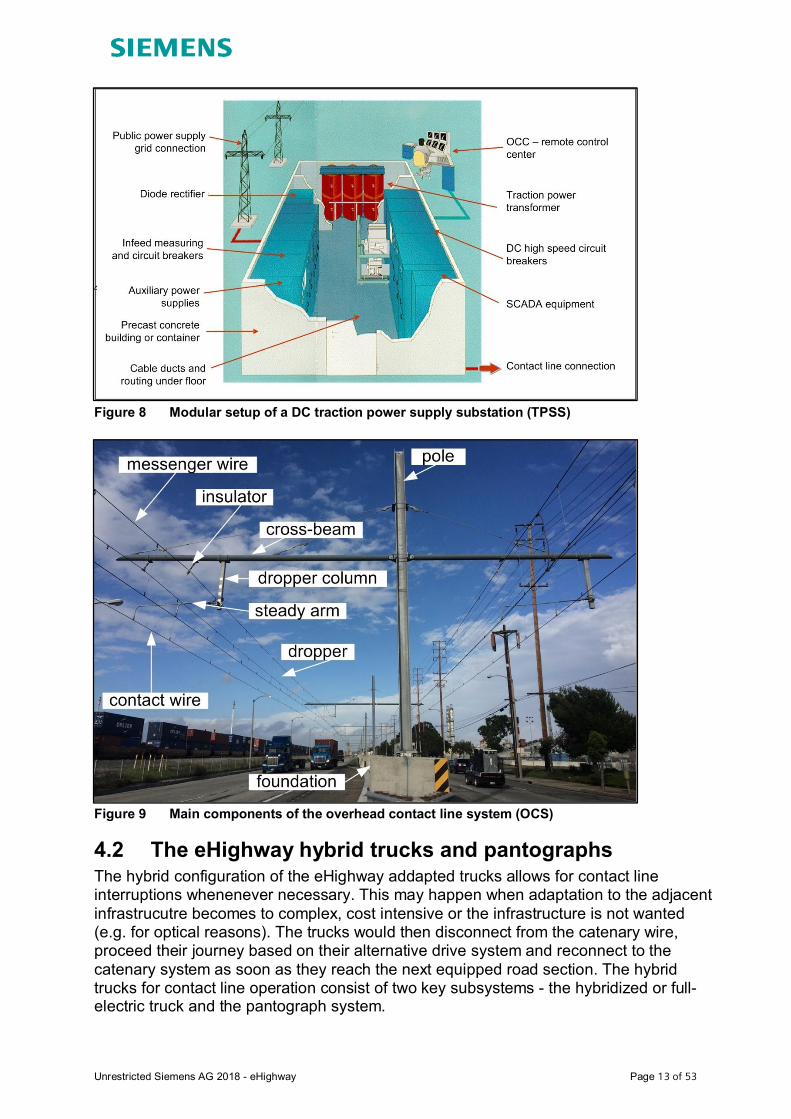
4.1 Substation and catenary for external power supplyThe electrical infrastructure system mainly consist of two parts: the substations and theoverhead contact line system. Both are based on mature rail electrification technology.The traction power supply substations have a modular set-up according Figure 8. Thesesubstations are designed as containers or precast concrete buildings which areprefabricated and tested at the factory to allow for a fast and relatively simple placementand commissioning at site. They provide fundamental safety features which, amongstothers, allow for safe power turn off in case of any irregularities.The overhead contact line system consist of a bi-polar catenary sytem suspended bycantilever arms which are attached to poles that are placed alongside the road or on themedian. The system therefore can be installed without modifications/interference to theroad surface whereas crash protection must be individually assessed. The overheadcontact line system can be addepted to curves, bridges and highway entries or exits.The main components of a straight layout are shown in Figure 9.
Unrestricted Siemens AG 2018 - eHighway Page 13 of 53
Figure 8 Modular setup of a DC traction power supply substation (TPSS)
Figure 9 Main components of the overhead contact line system (OCS)
4.2 The eHighway hybrid trucks and pantographsThe hybrid configuration of the eHighway addapted trucks allows for contact lineinterruptions whenenever necessary. This may happen when adaptation to the adjacentinfrastrucutre becomes to complex, cost intensive or the infrastructure is not wanted(e.g. for optical reasons). The trucks would then disconnect from the catenary wire,proceed their journey based on their alternative drive system and reconnect to thecatenary system as soon as they reach the next equipped road section. The hybridtrucks for contact line operation consist of two key subsystems - the hybridized or full-electric truck and the pantograph system.
Unrestricted Siemens AG 2018 - eHighway Page 14 of 53
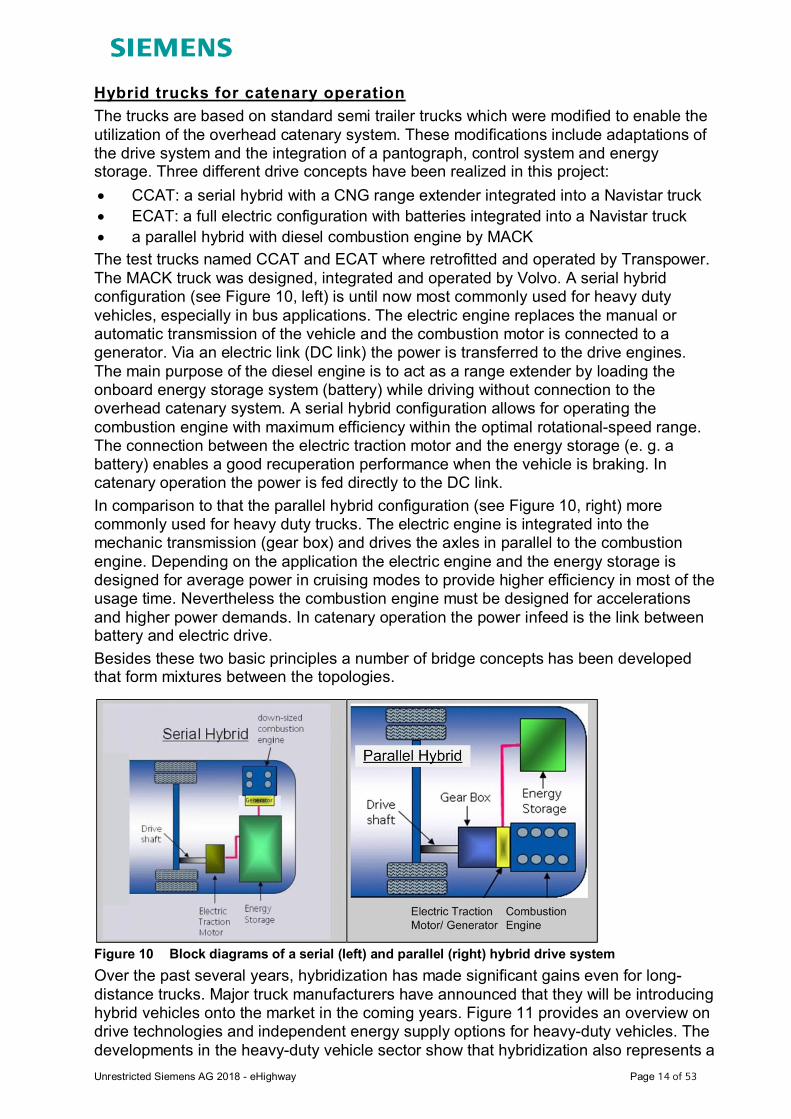
Hybrid trucks for catenary operationThe trucks are based on standard semi trailer trucks which were modified to enable theutilization of the overhead catenary system. These modifications include adaptations ofthe drive system and the integration of a pantograph, control system and energystorage. Three different drive concepts have been realized in this project:∂ CCAT: a serial hybrid with a CNG range extender integrated into a Navistar truck∂ ECAT: a full electric configuration with batteries integrated into a Navistar truck∂ a parallel hybrid with diesel combustion engine by MACKThe test trucks named CCAT and ECAT where retrofitted and operated by Transpower.The MACK truck was designed, integrated and operated by Volvo. A serial hybridconfiguration (see Figure 10, left) is until now most commonly used for heavy dutyvehicles, especially in bus applications. The electric engine replaces the manual orautomatic transmission of the vehicle and the combustion motor is connected to agenerator. Via an electric link (DC link) the power is transferred to the drive engines.The main purpose of the diesel engine is to act as a range extender by loading theonboard energy storage system (battery) while driving without connection to theoverhead catenary system. A serial hybrid configuration allows for operating thecombustion engine with maximum efficiency within the optimal rotational-speed range.The connection between the electric traction motor and the energy storage (e. g. abattery) enables a good recuperation performance when the vehicle is braking. Incatenary operation the power is fed directly to the DC link.In comparison to that the parallel hybrid configuration (see Figure 10, right) morecommonly used for heavy duty trucks. The electric engine is integrated into themechanic transmission (gear box) and drives the axles in parallel to the combustionengine. Depending on the application the electric engine and the energy storage isdesigned for average power in cruising modes to provide higher efficiency in most of theusage time. Nevertheless the combustion engine must be designed for accelerationsand higher power demands. In catenary operation the power infeed is the link betweenbattery and electric drive.Besides these two basic principles a number of bridge concepts has been developedthat form mixtures between the topologies.
Figure 10 Block diagrams of a serial (left) and parallel (right) hybrid drive systemOver the past several years, hybridization has made significant gains even for long-distance trucks. Major truck manufacturers have announced that they will be introducinghybrid vehicles onto the market in the coming years. Figure 11 provides an overview ondrive technologies and independent energy supply options for heavy-duty vehicles. Thedevelopments in the heavy-duty vehicle sector show that hybridization also represents a

Unrestricted Siemens AG 2018 - eHighway Page 15 of 53
decisive component for more sustainable road freight transportation. In a modularhybrid concept, different combinations of drive modules (electric engine or combustionengine) and systems of energy supply or storage (batteries, fuel cells, overhead line,conventional or synthetic fuels) are possible depending on the development status andinfrastructure. The applications used in the SoCal project are marked green. Theindividual vehicle configurations are summarized in chapter 5.8 and in [12].
Figure 11 Architectures for catenary supplied trucks (green options were realized in project)
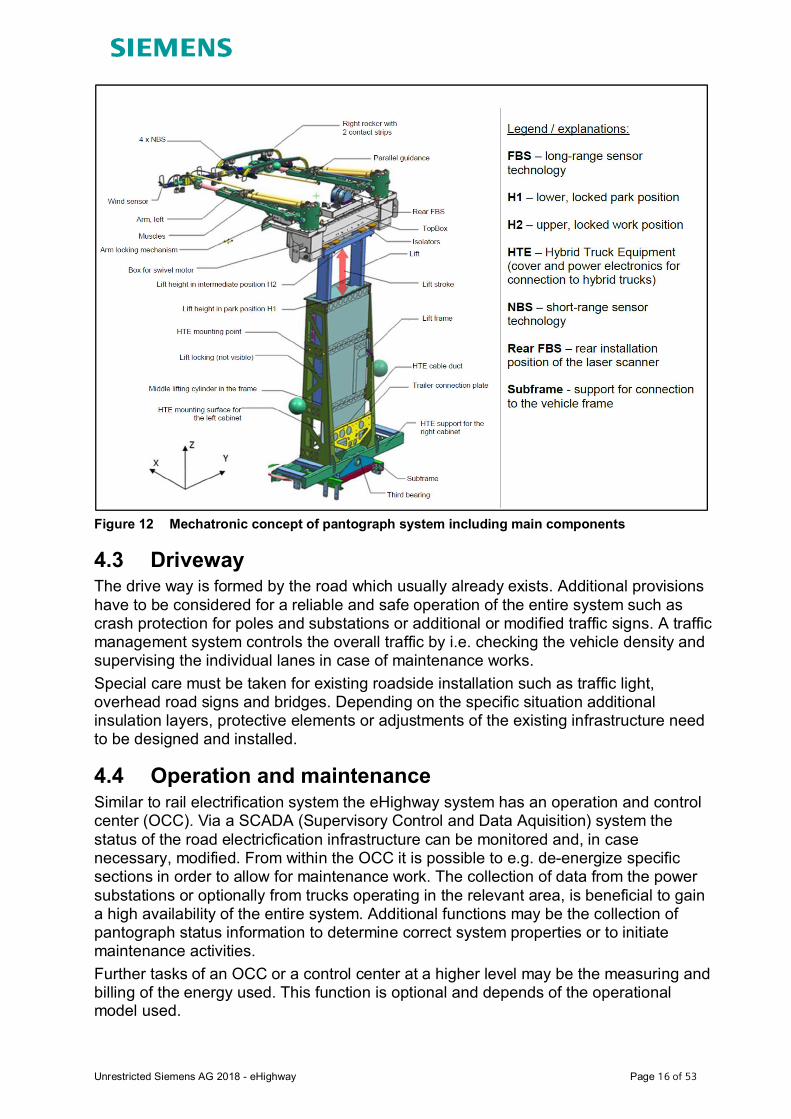
Pantograph systemThe central innovation of the system is an intelligent pantograph which transfers theelectrical energy from the eHighway overhead contact line system to the electric tractionmotor and the onboard energy storage system. Compared to panthographs used forrailbound vehicles the eHighway pantograph has to comply with several additionalrequirements. In railways the return current can flow back to the substation via the steelwheels and rails. In road applications the return current cannot flow back via the rubbertires and road surface, so the eHighway system requires a bi-polar overhead contactline system. The pantograph has thus to be able to connected and disconnect with twooverhead wires simultaneously. Moreover and unlike trolley busses connection must bedone while driving as the trucks are not supposed to stop the traffic flow when enteringelectrified sections.Road based vehicles are not rail-guided. An active control of the pantograph is requiredto compensate for the irregular lateral movements of the trucks within their lane. At thesame time a controlled vertical movement of the pantograph has to ensure that the rightcontact force with the overhead wires is maintained during operation. In order tomaintain the flexibility of the trucks and limit their dependence on the overhead contactline system a safe retraction mechanism is required in case the driver wants to changelane, overtake other vehicles or needs to perform an evasive maneuver.When installed on the truck the pantograph system may neither limit the loading volumeof the truck nor the loading and off-loading operation of goods. Finally the pantographsystem had to be designed in a way that it can be used by different truck manufacturersand a wide range of truck types.The basic mechatronic system is shown in Figure 12. Amongst other items it depicts theconnector frame to the base vehicle, the different sensor systems NBS (near field) andFBS (far field) and the two lift positions. Each pantograph head comprises of the carboncontact strips and four near field sensors to detect out of range use so that a loweringprocedure can be triggered.
Unrestricted Siemens AG 2018 - eHighway Page 16 of 53
Figure 12 Mechatronic concept of pantograph system including main components
4.3 DrivewayThe drive way is formed by the road which usually already exists. Additional provisionshave to be considered for a reliable and safe operation of the entire system such ascrash protection for poles and substations or additional or modified traffic signs. A trafficmanagement system controls the overall traffic by i.e. checking the vehicle density andsupervising the individual lanes in case of maintenance works.Special care must be taken for existing roadside installation such as traffic light,overhead road signs and bridges. Depending on the specific situation additionalinsulation layers, protective elements or adjustments of the existing infrastructure needto be designed and installed.
4.4 Operation and maintenanceSimilar to rail electrification system the eHighway system has an operation and controlcenter (OCC). Via a SCADA (Supervisory Control and Data Aquisition) system thestatus of the road electricfication infrastructure can be monitored and, in casenecessary, modified. From within the OCC it is possible to e.g. de-energize specificsections in order to allow for maintenance work. The collection of data from the powersubstations or optionally from trucks operating in the relevant area, is beneficial to gaina high availability of the entire system. Additional functions may be the collection ofpantograph status information to determine correct system properties or to initiatemaintenance activities.Further tasks of an OCC or a control center at a higher level may be the measuring andbilling of the energy used. This function is optional and depends of the operationalmodel used.

Unrestricted Siemens AG 2018 - eHighway Page 17 of 53
5 Scope of work according contractThe overall scope of the project comprised of development and demonstration of anoverhead catenary system (infrastructure) and corresponding pantographs to powervarious OEM class 8 trucks with different hybrid propulsion systems.The interfaces of the pantographs to the trucks were to be defined by Siemens. Furtherwork items included the testing and commissioning of the pantographs at the truckmanufacturing and laboratory sites. In total four adaptable pantograph systems weremanufactured to be installed and integrated on the trucks.The bipolar DC catenary system was designed and installed in both directions alongAlameda Street. The approximate one mile segment extends north to south from E.Lomita Blvd to the Dominguez Channel. At the middle, underneath Sepulveda Blvd.overpass, a containerized traction power rectifying substation and a control centre hadto be installed.The project had to be completed by a 12 month testing and demonstration phase, whichwas agreed to be reduced to 6 month. This reduction was necessary since theoperational license could not be extended. The individual test items and results of thetest phase are documented in [2].The project was split into twelve individual tasks as listed in Table 1. It reflects thecontractual requirements and sequence of the tasks according to the statement of work.As all tasks were to be reported in detail with individual deliverables, this final projectreport concentrates on brief summaries of the individual tasks in the following sub-chapters.Table 1 Project tasks and assignment of report chapters
Task Title ChapterTask 1 Basic Infrastructure System Design 5.1Task 2 CEQA and Construction Permitting 5.2Task 3 Infrastructure System Detailed Design 5.3Task 4 Procurement and Manufacturing - Infrastructure 5.4Task 5 Installation and Commissioning of Infrastructure 5.5Task 6 Pantograph System Definition and Interface Identification 5.6Task 7 Pantograph Engineering Integration and Certification 5.7Task 8 Pantograph Production, Assembly and Integration into Each
Vehicle5.8
Task 9 Catenary Truck and Infrastructure Demonstration 5.9Task 10 Determine Owner and Operator of System 5.10Task 11 Project Management and Reporting 5.11Task 12 System Decommissioning and Site Restoration 5.12
Unrestricted Siemens AG 2018 - eHighway Page 18 of 53
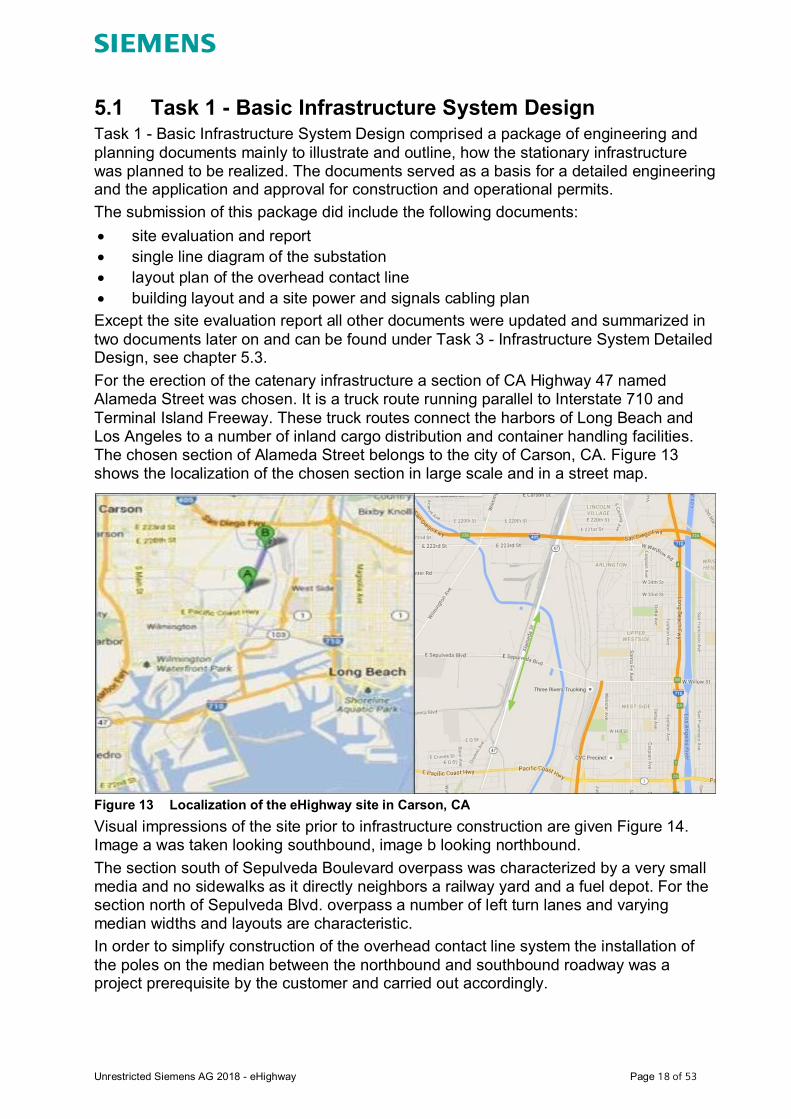
5.1 Task 1 - Basic Infrastructure System DesignTask 1 - Basic Infrastructure System Design comprised a package of engineering andplanning documents mainly to illustrate and outline, how the stationary infrastructurewas planned to be realized. The documents served as a basis for a detailed engineeringand the application and approval for construction and operational permits.The submission of this package did include the following documents:∂ site evaluation and report∂ single line diagram of the substation∂ layout plan of the overhead contact line∂ building layout and a site power and signals cabling planExcept the site evaluation report all other documents were updated and summarized intwo documents later on and can be found under Task 3 - Infrastructure System DetailedDesign, see chapter 5.3.For the erection of the catenary infrastructure a section of CA Highway 47 namedAlameda Street was chosen. It is a truck route running parallel to Interstate 710 andTerminal Island Freeway. These truck routes connect the harbors of Long Beach andLos Angeles to a number of inland cargo distribution and container handling facilities.The chosen section of Alameda Street belongs to the city of Carson, CA. Figure 13shows the localization of the chosen section in large scale and in a street map.
Figure 13 Localization of the eHighway site in Carson, CAVisual impressions of the site prior to infrastructure construction are given Figure 14.Image a was taken looking southbound, image b looking northbound.The section south of Sepulveda Boulevard overpass was characterized by a very smallmedia and no sidewalks as it directly neighbors a railway yard and a fuel depot. For thesection north of Sepulveda Blvd. overpass a number of left turn lanes and varyingmedian widths and layouts are characteristic.In order to simplify construction of the overhead contact line system the installation ofthe poles on the median between the northbound and southbound roadway was aproject prerequisite by the customer and carried out accordingly.

Unrestricted Siemens AG 2018 - eHighway Page 19 of 53
Figure 14 Alameda Street at Carson, CA prior to infrastructure construction (a – southbound, b– northbound)
Unrestricted Siemens AG 2018 - eHighway Page 20 of 53
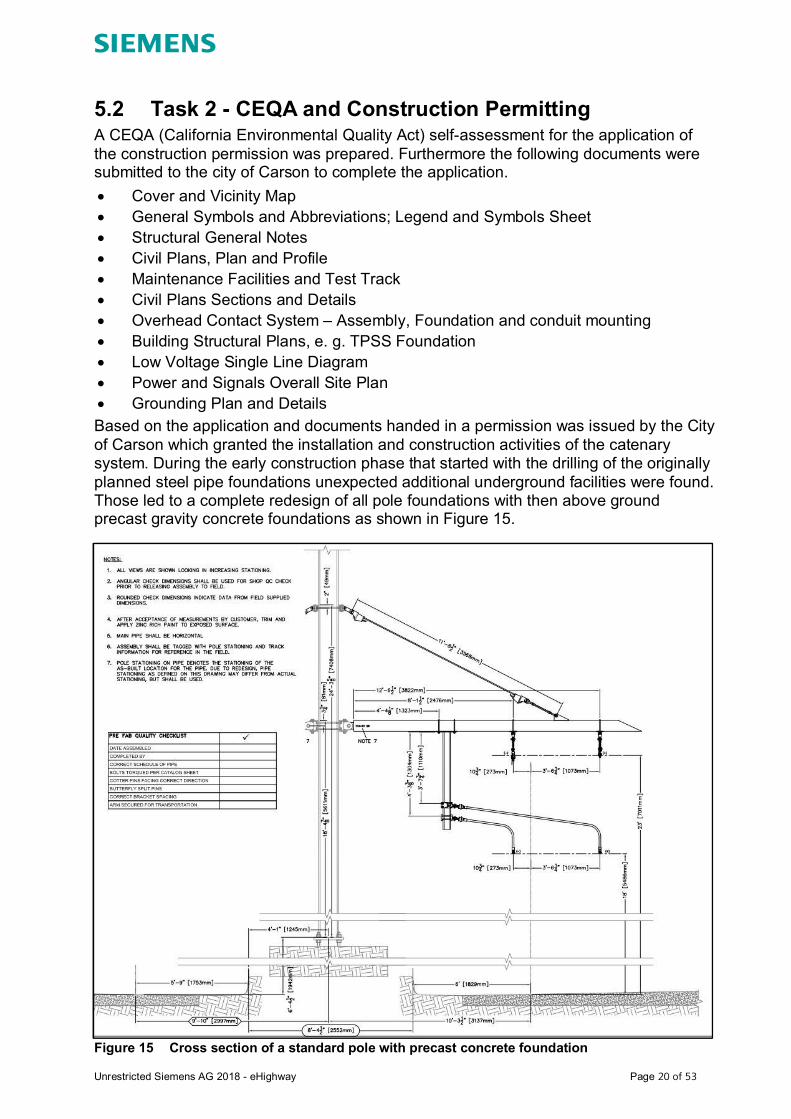
5.2 Task 2 - CEQA and Construction PermittingA CEQA (California Environmental Quality Act) self-assessment for the application ofthe construction permission was prepared. Furthermore the following documents weresubmitted to the city of Carson to complete the application.∂ Cover and Vicinity Map∂ General Symbols and Abbreviations; Legend and Symbols Sheet∂ Structural General Notes∂ Civil Plans, Plan and Profile∂ Maintenance Facilities and Test Track∂ Civil Plans Sections and Details∂ Overhead Contact System – Assembly, Foundation and conduit mounting∂ Building Structural Plans, e. g. TPSS Foundation∂ Low Voltage Single Line Diagram∂ Power and Signals Overall Site Plan∂ Grounding Plan and DetailsBased on the application and documents handed in a permission was issued by the Cityof Carson which granted the installation and construction activities of the catenarysystem. During the early construction phase that started with the drilling of the originallyplanned steel pipe foundations unexpected additional underground facilities were found.Those led to a complete redesign of all pole foundations with then above groundprecast gravity concrete foundations as shown in Figure 15.
Figure 15 Cross section of a standard pole with precast concrete foundation
Unrestricted Siemens AG 2018 - eHighway Page 21 of 53
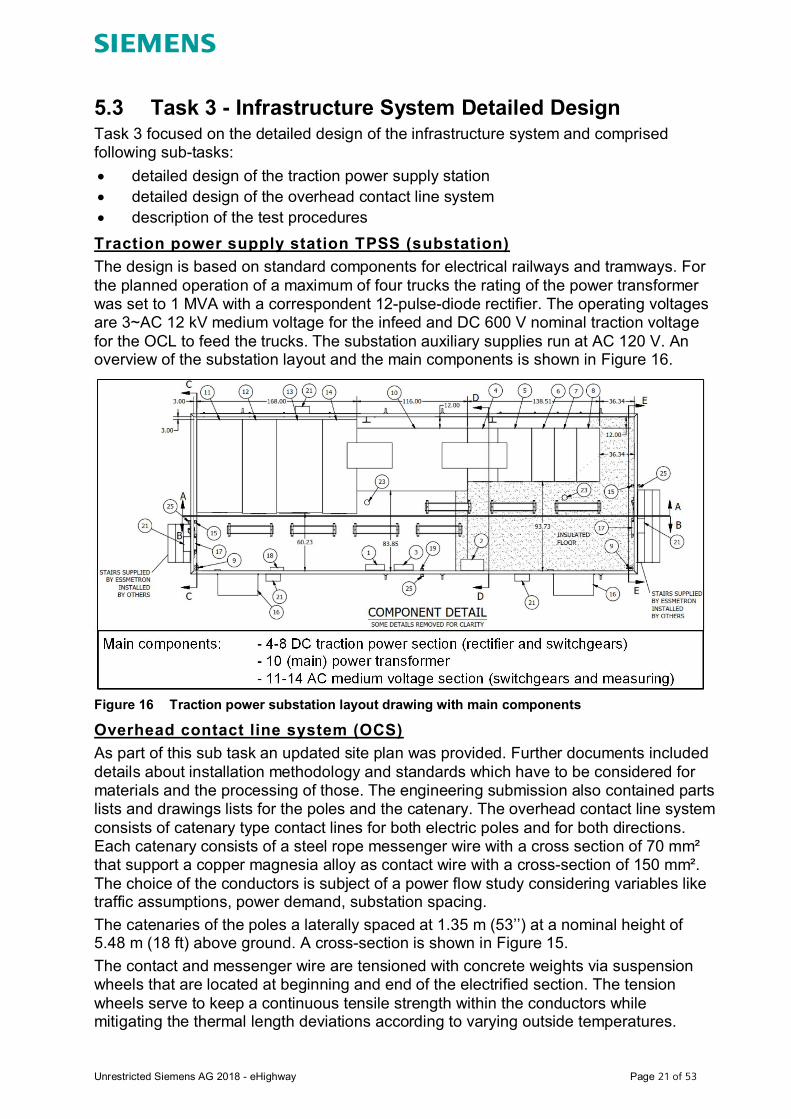
5.3 Task 3 - Infrastructure System Detailed DesignTask 3 focused on the detailed design of the infrastructure system and comprisedfollowing sub-tasks:∂ detailed design of the traction power supply station∂ detailed design of the overhead contact line system∂ description of the test proceduresTraction power supply station TPSS (substation)The design is based on standard components for electrical railways and tramways. Forthe planned operation of a maximum of four trucks the rating of the power transformerwas set to 1 MVA with a correspondent 12-pulse-diode rectifier. The operating voltagesare 3~AC 12 kV medium voltage for the infeed and DC 600 V nominal traction voltagefor the OCL to feed the trucks. The substation auxiliary supplies run at AC 120 V. Anoverview of the substation layout and the main components is shown in Figure 16.
Figure 16 Traction power substation layout drawing with main components
Overhead contact line system (OCS)As part of this sub task an updated site plan was provided. Further documents includeddetails about installation methodology and standards which have to be considered formaterials and the processing of those. The engineering submission also contained partslists and drawings lists for the poles and the catenary. The overhead contact line systemconsists of catenary type contact lines for both electric poles and for both directions.Each catenary consists of a steel rope messenger wire with a cross section of 70 mm²that support a copper magnesia alloy as contact wire with a cross-section of 150 mm².The choice of the conductors is subject of a power flow study considering variables liketraffic assumptions, power demand, substation spacing.The catenaries of the poles a laterally spaced at 1.35 m (53’’) at a nominal height of5.48 m (18 ft) above ground. A cross-section is shown in Figure 15.The contact and messenger wire are tensioned with concrete weights via suspensionwheels that are located at beginning and end of the electrified section. The tensionwheels serve to keep a continuous tensile strength within the conductors whilemitigating the thermal length deviations according to varying outside temperatures.

Unrestricted Siemens AG 2018 - eHighway Page 22 of 53
As a road specific adaption one of the messenger wires had to be insulated as it canpossibly get to close to the existing traffic light signal unit. Figure 17 shows that detail.
Figure 17 Messenger wire insulation at traffic light signal unit
Above ground foundation requirementsDue to the poorly documented underground utilities in the City of Carson, a pressurizedgas line was uncovered on Alameda Street median during the first construction phasewhich caused the stoppage of work in constructing the originally planned undergroundfoundation. This lead to the redesign, re-permitting, purchasing and installation of anabove ground foundation not unlike a trust block system, see Figure 18 b (page 26).From this came the requirement for a traffic abutment system in the median as well asvarious traffic safety systems to be employed, such as crash attenuators see Figure 18c.Infrastructure test procedures and descriptionsTests are crucial for the proper and reliable functionality of a system. For this sub tasktest procedures were submitted, that were also used to perform testing of the projectinfrastructure, including traction power substation, overhead contact line, and thegeneral site. This comprehensive collection of test procedures includes production(factory) testing, field testing, and commissioning as applicable to this subsystem.A test matrix excel sheet was attached. The matrix described which test procedures arefor production, field, or commissioning tests. Although all test procedures weresubmitted under Task 3 the performance of the individual tests was part of later tasks.

Unrestricted Siemens AG 2018 - eHighway Page 23 of 53
5.4 Task 4 - Procurement and Manufacturing –Infrastructure
The test descriptions introduced in the previous chapter form the basis for therequirements of Task 4. It is separated in 3 different subtasks comprising factoryacceptance tests (FAT) for the traction power supply station (TPSS), the overheadcontact line systems (OCS) and the auxiliary infrastructure.Traction power supply station TPSS (substation)Comprehensive technical and functional tests of the AC high voltage cabinets and theDC units were conducted for the TPS including:∂ DC Breaker truck production test∂ DC Incoming/Feeder cubicle production test∂ Negative cubicle production test∂ Rectifier production test∂ TPSS Field test (same procedure as used for field commissioning)∂ AC Switchgear production testThe DC Feeder breaker functional tests included preliminary settings and functionalitychecks of the protection relays. The most important functions tested were:∂ Maximum current tripping∂ Relative current rise function∂ Absolute current step function∂ Transformer temperature warning and tripping∂ Maximum and minimum voltage trippingFor the transformer a separate FAT was issued by the manufacturer SchaffnerMTCTransformers. The different losses for magnetization and caused by the current flow inthe winding systems under load were measured. Over a wide load range thetransformer efficiency is at about 98.8 %, so even moderate loads do not causeincreased losses. The transformer has one primary high voltage winding system andtwo secondary winding systems using a star-delta configuration to reduce harmonicdistortion in combination with the 12 pulse diode rectifier. A detailed analysis of the gridimpact was done by SCE – Southern California Edison proving no negative effects ofthe eHighway power supply [10].All tests for all substation components were passed without any objections. After theFAT the TPSS was ready for the shipment to the construction site at Carson, CA.TPSS (substation) - localizationAfter the execution of the contract documents the State of California enacted a lawwhich required the offsetting of a structure from a high pressure gas Line. During theconstruction period SOCAL Gas visited the foundation of the substation and witnessedthe following construction works: excavation, placement of the grounding grid,construction of the foundation and finally the setting of the substation container.This intern, i. e. the law changes, lead to internal reviews by SOCAL Gas as to thelocation of the Substaion which caused the project to stall on the testing of the vehiclesfor over six months. Once the added duration fo the testing was negotiated said testingresumed.

Unrestricted Siemens AG 2018 - eHighway Page 24 of 53
Overhead contact line system (OCS)This subtask comprised a documentation of testing results as applicable for productionrequirements of each product supplied by Siemens for the OCL or purchased byvendors. The production tests have been conducted in the Tualatin, OR warehouse(unless stated otherwise on the test reports) and followed Siemens quality guidelines.The tests required for release to construction site depend on the properties of eachproduct and were defined and implemented to provide a consistent quality of goods.For the different parts and groups the following tests are applicable:∂ Fittings and hardware (visual and dimensional tests; sample galvanizing)∂ Insulators:
o Visual and dimensional testso Dielectric insulation testo Mechanical load proof test
∂ Wires:o Visual and dimensional testso Mechanical tension and elongation testso Electrical resistance testo Twist test
∂ Poles (Certified material test, welder certificate)Auxiliary infrastructureA FAT was done for the temporary office for site and control room. Other facilities i.e.CCTV, fences etc. were tested under Task 5.4 auxiliary infrastructure field acceptancetest report.

Unrestricted Siemens AG 2018 - eHighway Page 25 of 53
5.5 Task 5 - Installation and Commissioning ofInfrastructure
All site installation works were finalized with extensive tests to proof the reliability andsafety of all components and subsystems. They were conducted by qualified personal,witnessed and documented.Overhead contact line system (OCS)For the OCS a mechanical acceptance test was done, comprising foundations of thepoles, cantilevers and head spans, contact wires and droppers, messenger wires,insulators, pole mounted disconnectors. The disconnector was tested electrically. Thetest was successful and minor irregularities could be fixed on short notice. The testsincluded:∂ OCS Electrical test, including high potential and isolation testing∂ OCS Energization test∂ OCS Mechanical Inspection, including height controlTraction power supply station (substation - TPSS)This test is to prove that all of the connections are correct and that no shipping damagehas occurred to the insulators or other components. Since those tests are an importantsafety feature for the entire system they were quite comprehensive and took severaldays. Beside visual inspections, measurements, functional tests and readjustments tothe settings were done.∂ TPSS Field function test∂ TPSS Energization test∂ TPSS Short circuit test∂ AC Main breaker Siprotec relay settings∂ Transformer temperature monitor settings∂ DC Positive switch settings∂ DC Feeder breaker Sitras Pro relay settingsAfter these tests were completed for both subsystems the eHighway demo track wasready to start the system integration with the modified hybrid trucks along the AlamedaStreet.The pictures on the following two pages illustrate the construction process:∂ Figure 18 a – delivery of the TPSS and unloading by crane∂ Figure 18 b – all concrete foundations placed, median widening completed∂ Figure 18 c – all poles placed, begin of route with crash attenuators∂ Figure 18 d – catenary works with fork lifts

Unrestricted Siemens AG 2018 - eHighway Page 26 of 53
Figure 18 Construction phase – setting of foundations and poles

Unrestricted Siemens AG 2018 - eHighway Page 27 of 53
5.6 Task 6 - Pantograph system definition and interfaceIdentification
During the design process for the different hybrid trucks, a comprehensive interfacesynchronization between the Siemens pantograph system and the different OEMs andintegrators was necessary. For identifcation and definition the interfaces were structuredin different categories based on developments over several years. This structure wasalso used as a basis for the integration tests at the OEMs test sites. Moreover thisstructure is transferrable to other hybrid trucks and helps to standardize and optimizepantograph integration as individually customized solutions are limited.All interfaces were successfully implemented during the project together with the OEMpartners Volvo and Transpower. Figure 19 gives an overview about the infaces followedby a brief characterization of the interface contents.
Figure 19 Pantograph interface overview
IF01 – Mechanical interface: PAN – TruckThis interface defines the mechanical interaction between the truck and the pantograph.Dimensions, weight and speeds are settled in this interface. The mechanical mountingto the base frame with an adaptable sub-frame lies in the responsibility of the trucksupplier.IF02 – Right PAN Box (RPB) – pantographThe right PAN Box contains all electrical and pneumatic elements to control thepantograph. It serves also as main interface enclosure for signals, electrical power, andpneumatics necessary to control the pantograph.IF03 – Truck – Cabin Components (CC)For the communication between the truck cabin and pantograph a touch screen andadditional dashboard buttons are installed as human machine interface (HMI). Thisinterface defines communication with the CAN-Bus of the truck and contains messagedefinitions.

Unrestricted Siemens AG 2018 - eHighway Page 28 of 53
IF04 – SIE-SG – OEMThis interface outlines the electrical parameters for the power consumption of theelectrical drive system. It defines performance ranges the power supply, thepantograph, and the electric hybrid drive are designed for. The voltage range definitionsused for the EHWY SoCal project were according to Figure 20. For the demo project onAlameda Street no inverter was installed at the substation.
Figure 20 Voltage range definitions for the demo project
IF05 – Truck – Right PAN BoxThis interface defines the pneumatic and electrical requirements between the truck andthe pantograph. Cables and hoses are determined and responsibility for the supply.IF06 – RPB – CCThis interface defines the signal characteristic requirements for the communicationbetween the truck and the RPB i.e. via Ethernet or Profinet.IF07 – Truck – LOBThe LOB (left OEM box) provides an installation space for interface components of theOEM truck. Mechanical data and dimensions are defined in this interface.IF08 – PAN – windshield (WS)This interface defines the mechanical space requirements for a windshield (WS) whichis part of the truck equipment. A 3-D model was provided to the truck manufacturerconsidering the needed ranges for movements of the pantograph.

Unrestricted Siemens AG 2018 - eHighway Page 29 of 53
5.7 Task 7 - Pantograph engineering integration andcertification
There were in total four pantographs manufactured and tested at the workshops. Afterthe pantographs have left the assembly line they were tested and certified in a test field.All four pantographs had the same technical design, but were fabricated in sequence. Inparallel the integration planning into the individual trucks started. For the mechanicalintegration 3D-Models were used, as shown in Figure 21 for Volvo [11] and Transpowertrucks [12].
Figure 21 3D-Model of pantograph integration into Volvo (left) and Transpower truck (right)The factory acceptance tests were performed individually at the manufacturing site inBerlin. For the FATs the pantographs were connected to the operation panel (HMI)which was supposed to be installed in the truck cabin later on (see Figure 22). The rightPAN Box (RPB) containing several control elements for the pantograph was pre-testedin the assembly factory in Chemnitz/Germany. The FAT configuration consists of thepantograph system incl. external compressed air supply, an external DC 600 V powersupply and the cabin components with related software licenses. Open issues werelisted at the end of the FAT report.In particular the following tests were conducted:∂ Visual Inspection:
o Pantograph armso Topbox lifto Right PAN box (RPB)
∂ Functional Tests:o Startup and shutdowno Operational functionso Safety functions including automated dropping device (ADD) to detect broken
carbon contact stripso Graphical user interface, operating messages

Unrestricted Siemens AG 2018 - eHighway Page 30 of 53
Figure 22 Arrangement for pantograph FAT at BerlinA key test refers to the pantograph control and lateral working range. Figure 23 showsthis test with the ultimate horizontal arm positions. Proper functionality of the lateral armmovement was a pre-requisite for the planned tests with trucks operating at the edge oflane to determine usability over the full lane width.
Figure 23 Pantograph horizontal working range test during FAT at Berlin
Unrestricted Siemens AG 2018 - eHighway Page 31 of 53
5.8 Task 8 - Pantograph production, assembly andintegration into the hybrid trucks
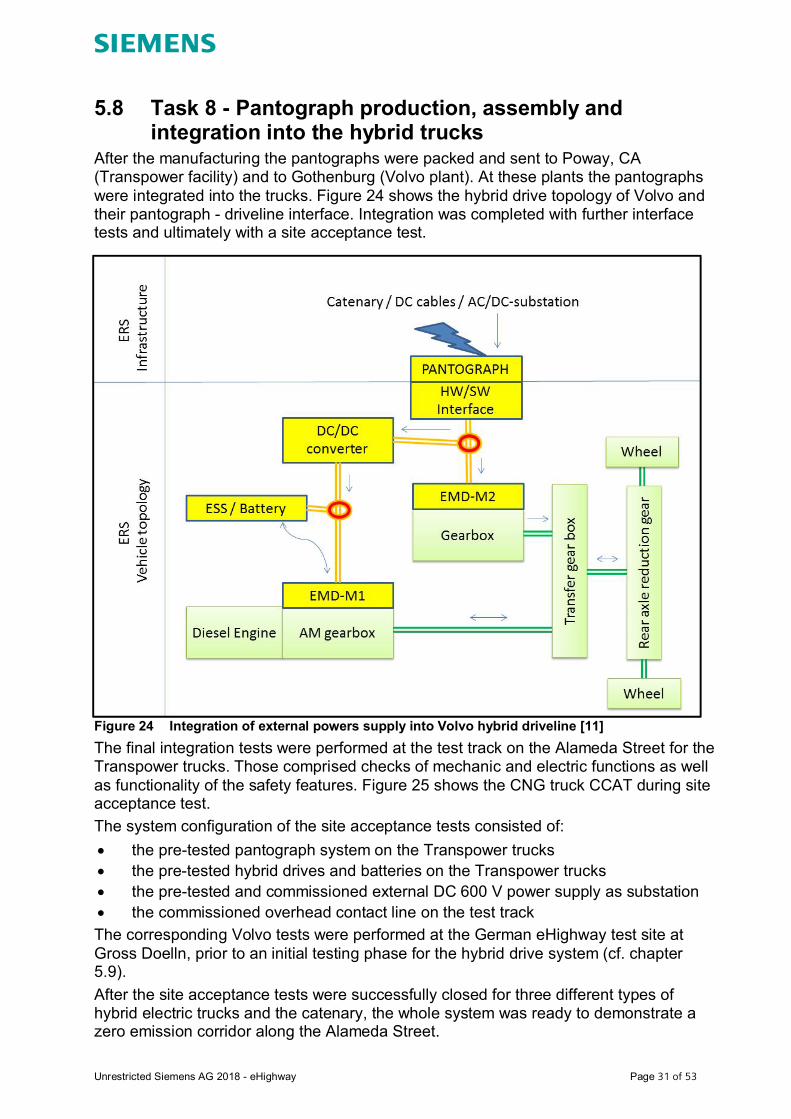
After the manufacturing the pantographs were packed and sent to Poway, CA(Transpower facility) and to Gothenburg (Volvo plant). At these plants the pantographswere integrated into the trucks. Figure 24 shows the hybrid drive topology of Volvo andtheir pantograph - driveline interface. Integration was completed with further interfacetests and ultimately with a site acceptance test.
Figure 24 Integration of external powers supply into Volvo hybrid driveline [11]The final integration tests were performed at the test track on the Alameda Street for theTranspower trucks. Those comprised checks of mechanic and electric functions as wellas functionality of the safety features. Figure 25 shows the CNG truck CCAT during siteacceptance test.The system configuration of the site acceptance tests consisted of:∂ the pre-tested pantograph system on the Transpower trucks∂ the pre-tested hybrid drives and batteries on the Transpower trucks∂ the pre-tested and commissioned external DC 600 V power supply as substation∂ the commissioned overhead contact line on the test trackThe corresponding Volvo tests were performed at the German eHighway test site atGross Doelln, prior to an initial testing phase for the hybrid drive system (cf. chapter5.9).After the site acceptance tests were successfully closed for three different types ofhybrid electric trucks and the catenary, the whole system was ready to demonstrate azero emission corridor along the Alameda Street.

Unrestricted Siemens AG 2018 - eHighway Page 32 of 53
Figure 25 Transpower CNG truck CCAT during site acceptance test

Unrestricted Siemens AG 2018 - eHighway Page 33 of 53
5.9 Task 9 - Catenary truck and infrastructuredemonstration
This task can be considered as the technical core of the project as it serves to studyand demonstrate maturity and reliability of the electric power supply of hybrid trucks viaa catenary system. The task is subdivided in three main topics:∂ Component integration testing of the MACK truck in Germany (cf. chapter 5.9.1)∂ System integration and performance testing on Alameda Street with all hybridized
trucks (cf. chapter 5.9.2)∂ Catenary system safety analysis to evaluate potential hazards and mitigation
measures related to the catenary system (cf. chapter 5.9.3)
5.9.1 Component Integration Testing in Germany (Task 9.1)After the factory acceptance test (FAT) in Gothenburg/Sweden the MACK truck wastransported to the e-Highway test site in Gross Doelln/Germany before it was shipped toLos Angeles. Thus the first dynamic functions of the truck were tested, and it waspossible to prove that the pantograph system can operate on different catenary systemas long as their key parameters are in the interoperability range.The integration and optimization works comprised the following aspects:∂ site acceptance test including safety functions and proof of correct integration∂ evaluation of vertical and horizontal working ranges∂ power transfer to hybrid drive system including optimization of the power split
between the two electric driveline that form a combination of a parallel and serialhybrid drive (cf. Figure 10, Figure 24)
∂ evaluation of acoustic emissions at different speeds (cf. [2])Figure 26 shows the MACK truck at the non-public eHighway test track at Gross Doellnnorth of Berlin. The substation is situated in the side margin.
Figure 26 Test of MACK truck at Gross Doelln site 2016

Unrestricted Siemens AG 2018 - eHighway Page 34 of 53
5.9.2 Testing on site Alameda Street - Demonstration phase and testingThe system integration and performance testing was carried out during a 6 monthperiod from June to December 2017. While specific integration and optimization task ofthe different trucks dominated the first months later test weeks concentrated on theperformance testing that followed the required test items according to the statement ofwork [1]. Table 2 lists the required test items. Results are discussed in [2].Table 2 Test items and assignment of report chapters
Item Test description
A1 Infrastructure commissioning tests
A2 Energy efficiency testing
A3 General truck performance testing
A4 Pantograph performance and contact quality
A5 Drive in / drive out testing
A6 Overtaking testing
A7 Emergency braking testing
A8 Operating at the edge testing
A9 Proof of fail-safe pantograph design
A10 Ergonomics testing
A11 Weather and ambient condition test
A12 New algorithm testing*
Test planning and actual execution had to consider specifics of a heavily used truckroute. For a number of integration and performance tests the electrified lanes had to bereserved and closed by traffic management see (Figure 27), which turned out to be hardto enforce. Moreover at different times testing had to be coordinated with road works bythird parties, which occasionally limited availability of the mainline infrastructure.
Figure 27 Traffic management in place in both directions

Unrestricted Siemens AG 2018 - eHighway Page 35 of 53
5.9.3 Catenary system safety analysis (Task 9.4)The introduction of a catenary system into public road infrastructures for tramway,trolleybus and electric truck applications raises a number of safety related concerns.While all safety rules, standards and project specific safety procedures could betransferred from existing electric public transport applications further topics were studiedin detail in the related research projects in Germany. Hence the catenary system safetyanalysis can be derived in a three-step approach:∂ Review of existing catenary system safety engineering methods and adaption of
the overhead contact line design for road and highway applications∂ Performance of an Operating and Support Hazard Analysis (OSHA) considering
the project specifics for the 1 mile stretch on Alameda Street corridor∂ Review and provision of discussion regarding process and results of the technical
assessment of the integration of the catenary system by the German FederalHighway Research Institute (BASt – Bundesanstalt für Straßenwesen) [13]
The key aspects of these work streams are explained in the following sub-chapters.Review of existing catenary system safety engineering methodsDesign, construction and operation of catenary systems are very mature and based onvast experience of more than 100 years of expertise. The experience made contributedto a wide set of system, product, component, material and testing standards that arelikewise applicable for rail and road applications. In the course of eHighway relatedresearch projects delta analysis were performed to identify additional risks andmitigation measures that result specifically from the highway application context.One key finding was the mitigation of risks related to broken contact wires. In railwayapplications the broken contact wire falls to the ground and triggers a short circuit whichis then detected by the substation and triggers the switch to interrupt power supplyimmediately. As road surfaces are not conductive enough this procedure is notapplicable. Moreover the coiling wire forms a mechanic obstacle. As a mitigationmeasure the dropper spacing was revised to 3 meters to prevent the contact wire fromfalling down. This measure was tested by cutting the wire, as shown in Figure 28.
Figure 28 Reduced dropper spacing prevent broken wires from falling to ground
Unrestricted Siemens AG 2018 - eHighway Page 36 of 53
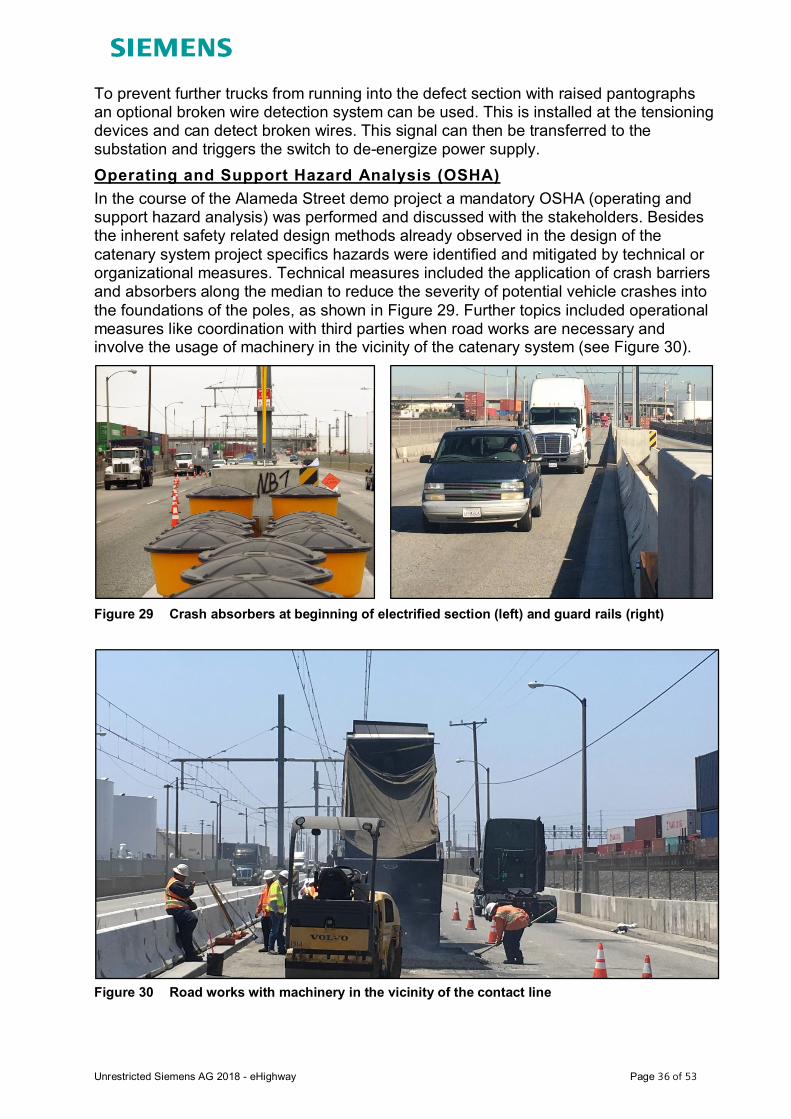
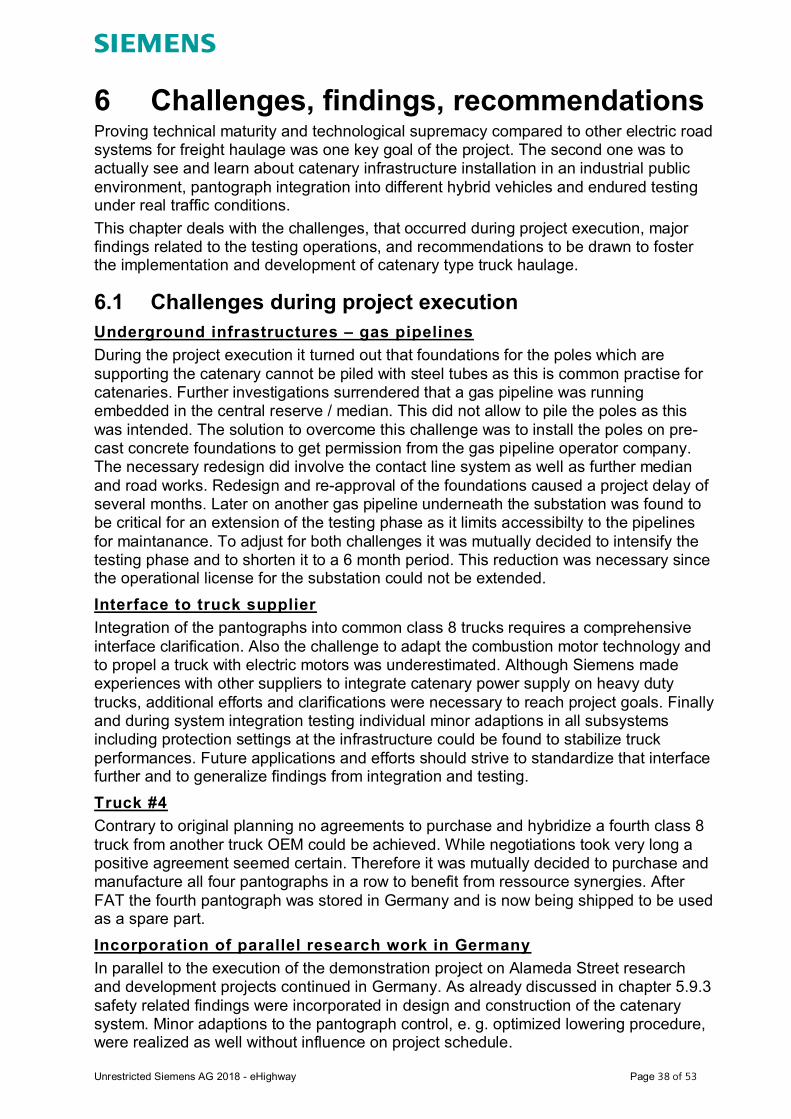
To prevent further trucks from running into the defect section with raised pantographsan optional broken wire detection system can be used. This is installed at the tensioningdevices and can detect broken wires. This signal can then be transferred to thesubstation and triggers the switch to de-energize power supply.Operating and Support Hazard Analysis (OSHA)In the course of the Alameda Street demo project a mandatory OSHA (operating andsupport hazard analysis) was performed and discussed with the stakeholders. Besidesthe inherent safety related design methods already observed in the design of thecatenary system project specifics hazards were identified and mitigated by technical ororganizational measures. Technical measures included the application of crash barriersand absorbers along the median to reduce the severity of potential vehicle crashes intothe foundations of the poles, as shown in Figure 29. Further topics included operationalmeasures like coordination with third parties when road works are necessary andinvolve the usage of machinery in the vicinity of the catenary system (see Figure 30).
Figure 29 Crash absorbers at beginning of electrified section (left) and guard rails (right)
Figure 30 Road works with machinery in the vicinity of the contact line

Unrestricted Siemens AG 2018 - eHighway Page 37 of 53
5.10 Task 10 - Determine owner and operator of systemDespite intense stakeholder dialogue and high public attention during the demonstrationphase, cf. chapter 8 – Public relation, it was not possible to determine ways foruninterrupted ownership and operation of the demonstration site along Alameda Street.Therefore the decommissioning according task 12 (see chapter 5.12) was carried out.Nevertheless the discussion of and with relevant stakeholders revealed a lot of insightsthat form an integral part for further system applications. The related findings areintegrated into [14] that deals with the economic assessment and implications of theeHighway system. A survey of potential owner operators of an eHighway system wasconducted by SCAQMD’s consultant and will be presented as a separate documentalong with this report.
5.11 Task 11 - Project management and reportingDuring construction and commissioning all required reporting was provided up to thestoppage of work as stated below and in chapter 6.1. Once truck testing was underwayreporting was provided as required.General adherence to schedule can be summarized as follows:∂ The schedule was kept up until local utility SOCal Gas required the TPSS to be
moved due to California State law enacted January of 2016 whereinencroachment with in an easement of a high pressure gas line was illegal. Thiscaused a stop in the work for six months until the SCAQMD negotiated a sixmonth period for testing of the pantograph equipped trucks on the OCS System onAlameda Street.
∂ Once the test period was granted the trucks were tested from July 1, 2017 throughJanuary 3, 2018 with the outcome as previously noted.
∂ Upon completion of the six month test period the contract was changed to reflectthe test period as defined.
∂ Due to AQMD’s negotiation process for the furtherance of testing of the tucksAQMD did not advise or include Siemens in the negotiation. Therefore Siemenswas directed to stop further execution of the work until AQMD and SOCAL Gascame to the agreement of the testing duration and test start date and test enddate. This in turn presented little to no data to report back to AQMD on a monthlybasis.
∂ Once testing was underway on July 1, 2017 AQMD was notified via letter of thetesting start date.
∂ AQMD was henceforth presented with the required quarterly reports for the testingsubmittals.
∂ Through this testing process Siemens advised AQMD of the resource loadingschedule and the resource requirements schedule for the duration of the project.
5.12 Task 12 - System decommissioning and site restorationWhile evaluation of the project results and compilation of the final report this task wasstill ongoing.The Decommissioning of the site is currently underway. The requests for proposals(RFP) have been provided to three thus contractors with work instructions and sitereview. Answers to these RFPs are currently being entertained.Permits are currently being sought for the scope of work through the City of Carson andprovisions are being made for the offloading and disposition of the site equipment.
Unrestricted Siemens AG 2018 - eHighway Page 38 of 53
6 Challenges, findings, recommendationsProving technical maturity and technological supremacy compared to other electric roadsystems for freight haulage was one key goal of the project. The second one was toactually see and learn about catenary infrastructure installation in an industrial publicenvironment, pantograph integration into different hybrid vehicles and endured testingunder real traffic conditions.This chapter deals with the challenges, that occurred during project execution, majorfindings related to the testing operations, and recommendations to be drawn to fosterthe implementation and development of catenary type truck haulage.
6.1 Challenges during project executionUnderground infrastructures – gas pipelinesDuring the project execution it turned out that foundations for the poles which aresupporting the catenary cannot be piled with steel tubes as this is common practise forcatenaries. Further investigations surrendered that a gas pipeline was runningembedded in the central reserve / median. This did not allow to pile the poles as thiswas intended. The solution to overcome this challenge was to install the poles on pre-cast concrete foundations to get permission from the gas pipeline operator company.The necessary redesign did involve the contact line system as well as further medianand road works. Redesign and re-approval of the foundations caused a project delay ofseveral months. Later on another gas pipeline underneath the substation was found tobe critical for an extension of the testing phase as it limits accessibilty to the pipelinesfor maintanance. To adjust for both challenges it was mutually decided to intensify thetesting phase and to shorten it to a 6 month period. This reduction was necessary sincethe operational license for the substation could not be extended.Interface to truck supplierIntegration of the pantographs into common class 8 trucks requires a comprehensiveinterface clarification. Also the challenge to adapt the combustion motor technology andto propel a truck with electric motors was underestimated. Although Siemens madeexperiences with other suppliers to integrate catenary power supply on heavy dutytrucks, additional efforts and clarifications were necessary to reach project goals. Finallyand during system integration testing individual minor adaptions in all subsystemsincluding protection settings at the infrastructure could be found to stabilize truckperformances. Future applications and efforts should strive to standardize that interfacefurther and to generalize findings from integration and testing.Truck #4Contrary to original planning no agreements to purchase and hybridize a fourth class 8truck from another truck OEM could be achieved. While negotiations took very long apositive agreement seemed certain. Therefore it was mutually decided to purchase andmanufacture all four pantographs in a row to benefit from ressource synergies. AfterFAT the fourth pantograph was stored in Germany and is now being shipped to be usedas a spare part.Incorporation of parallel research work in GermanyIn parallel to the execution of the demonstration project on Alameda Street researchand development projects continued in Germany. As already discussed in chapter 5.9.3safety related findings were incorporated in design and construction of the catenarysystem. Minor adaptions to the pantograph control, e. g. optimized lowering procedure,were realized as well without influence on project schedule.

Unrestricted Siemens AG 2018 - eHighway Page 39 of 53
6.2 Findings during testing phaseTest operation related findings∂ Achieving and maintaining a sufficient level of stability for the entire system -
substation, prototype vehicles, and pantographs - was a challenge during systemintegration and parts of the paralleled testing time. It required quick support fromspecialists as well as securing availability of special spare parts.
∂ The combination of the relatively short electrified track with the heavy trafficconditions made it hard for the drivers to accomplish specific test routines like fullovertaking maneuvers or edge of lane testing without traffic interference.
∂ All trucks feature battery buffered electric drives that charge in parallel to driving.Given the traffic conditions and short electric run time in each drive it was veryhard to repeatedly reach cruising speeds and steady states for the drivetrains.
∂ The sharp turns (U-turns) at Alameda Street were leading to increased trailer tiresdegradation and eventually stop of trailer operations in early December.
Truck related findingsWhile the reliability of the prototype trucks has been well sufficient to support the datacollection and performance testing activities, the following observations are worthhighlighting:∂ Electrified truck auxiliaries (24 V/12 V batteries, air compressors) remain key
assets of vehicles without auxiliaries powered permanently by diesel engines. Thisaccounts especially for the air compressor given the higher air supply needs dueto the higher contact line height and the rough road. More powerful compressorswould be helpful to avoid overload the auxiliaries.
∂ The main battery systems of contact line powered vehicles show significantdifferences in the use cases and electric cycling, calling for increased maintenancetime for battery balancing. Future designs should include other cell typesspecifically designed for static and dynamic charging.
∂ Maintaining proper alignment of the vehicle with the infrastructure at all times toprevent loss of contact has proven to be challenging in certain driving situations.Therefore further deployment of electrified roadways along freight corridors shouldconsider integration of vehicle automation technologies to assist the driver, e. g.assisted steering, automated positioning in lane center.
∂ The cycle times of pantographs – especially for connection – are relatively longand should be optimized in future designs.
∂ Studying driver ergonomics revealed that positioning of the displays andnecessary involvement of the drivers to operate the pantograph can be optimized.In the mid-term automatic pantograph operation should be considered.
Infrastructure related findings∂ With the current pantograph design and the given legislative framework (contact
line height at 18 ft nominal) the pantographs operate at the vertical edge of theirworking range. Potential optimizations for future operation have been derived.
∂ Integration (esp. substation relay setting) of different vehicle types call for closecooperation of all subsystem specialists. The system integration findings have tobe generalized as further detailed interface specifications towards the truckdrivetrain integrators and the substation designers.
∂ Turn-outs and variable street layouts demand more complex catenaryconstructions and increase testing impact when closed lanes are required.

Unrestricted Siemens AG 2018 - eHighway Page 40 of 53
6.3 Recommendations for research and improvementThe eHighway is based on proven and mature technology, especially on infrastructureside. Nevertheless, compared with other transport systems, the eHighway is still arather young concept with further development plans regarding system optimization.Further R&D works and steps towards higher TRL (technology readiness level) must betaken and are already planned. This is most important for industrialization androbustness of the pantographs and electric hybrid drivetrains optimized for heavy truckapplications. Based on the challenges overcome, findings made, and discussionsstarted with stakeholder the following recommendations can be derived:Regulatory frameworkAfter the successful demonstration of the technical feasibility of the eHighway systemthe regulatory framework will need to be evaluated in further detail as it has a majorimpact on the commercial viability of future projects. The major aspects include taxation,emission charging, billing and accounting, infrastructure design and approval guidelines.Power supply and generationThe interfaces towards energy suppliers should be elaborated further with regards tomarket roles as infrastructure providers and operators as well as to further analyze andspecify technical aspect. The topics to be considered comprise the shift to increaseregenerative power generation, technical network connections aspect, power flowestimations and optimized system designs, energy metering and billing, and systemoperation and maintenance.Others use casesBeside the use of overhead lines by truck it could be also considered to adapt thistechnology to propel electric buses in private or public sector. This could increase thenumber of vehicles on electrified sections and open up synergies for design andproduction of electric drivetrains for commercial vehicles.Truck technologyThe catenary technology can serve as an electric backbone for dynamic supply andadditional charging of vehicle storages. To extend ranges beyond electrified sections forcomplete ZE cycles supplementary systems like on-board batteries, fuel cells, orPtG/PtL combustion engines will be needed. Future work should simplify drivetraincombinations and head for mutual optimization of energy storages to gain vehicledesigns matching the designated applications.The vehicle built by Volvo for this project was a technology demonstrator intended torepresent an eHighway enabled vehicle. The vehicle included several technologies notready for commercialization and was optimized for maximum flexibility with regards tooperating modes.With the experience gained both in terms of technology and operating conditions duringthis demonstration, substantial design improvements were identified with regards tocomplexity, weight and reliability for this specific application.The primary areas to be addressed in future works include:∂ Vehicle power distribution system where number of energy conversion steps can
be greatly reduced.⋅ This would lead to a less complex electric mechanical propulsion topology.
∂ Joint optimization of vehicle and pantograph design aimed to reach a globallyoptimal design.⋅ This would lead to a less complex interface and control of connection /
disconnection of pantograph.

Unrestricted Siemens AG 2018 - eHighway Page 41 of 53
Endurance tests and increased testing conditionsDuring the development of the eHighway components and products comprehensivetests were conducted and proved road stability adequately matching the developmentstages.Nevertheless the existing contact line sections in demonstration projects are too short togain endurance test results. Future field trials already feature longer electrified sectionsand increased truck operations to achieve more mileage as a better base to evaluateand improve robustness.In order to further increase the maturity of the concept, future testing should include abroader operating context where both dynamic events such as entry/exit of theeHighway at higher speeds as well as steady state conditions can be studied in moredetail.This would require an enhanced test track setup which should preferably be definedjointly by infrastructure, vehicle provider and local authorities. Some desiredcharacteristics of such test tracks known from vehicle providers include at least above40 km as well as variation in road grades (+/- 3-5%) to better represent long haulvehicle operation.

Unrestricted Siemens AG 2018 - eHighway Page 42 of 53
7 Assessment of project goals7.1 Zero emission goods movement technologiesZero emission freight haulage techonologies comprise solutions with on-board energystorages based on alternative fuels or electricity and solutions with external powersupply, see Figure 31.
Figure 31 Zero emission technology matrix for road freight applicationsA key driver to determine applicability and to differentiate the solutions is a closerexamination of the overall efficiencies according Figure 32.
Figure 32 WTW efficiencies as specific power consumptions of different ZE technologies

Unrestricted Siemens AG 2018 - eHighway Page 43 of 53
Analysis of Figure 32 allows the following conclusions:∂ External power supplies by means of catenary systems are by far the most
efficient technology.∂ Batteries are still more efficient than conventional diesel traction, but will always be
limited by ranges, additional weights and production and lifecycle relatedemissions.
∂ Hydrogene fuel cell systems and synthetic fuels (e-fuels) are characterized byunduly low efficiencies, see also Figure 5 and Figure 32, leading to drawbacks ascore decarbonization technologies.
∂ To achieve an acceptable efficiency level compared to conventional diesel tractiona blend of technologies is necessary with highly efficient direct electricity use onelectrified core network sections and extension of electric range by batteries orsynthetic fuels.
Electrifying core corridors and heavily used truck routes can be a catalyst towardsenvironmental friendly but still economically feasible ZE freight system.
7.2 Most viable technologyAs shown in the overview in Figure 31 different external power supplies can bediscussed. Typically they are summarized with the term ERS – electric road systemsand comprise the following technologies:∂ Power supply via overhead contact line systems (catenary)∂ Inductive energy transmission∂ Power supply via a ground-based (earth) conductor railFigure 34 characterizes these different technologies by explaining power transmissionprinciples and a short discussion of advantages and disadvantages. Further state-of-artinformation on all types of ERS is assembled in [15]. Based on the scale of the existingpublic demonstrations on Alameda Street corridor and E16 highway in Sweden as wellas the planned field trials in Germany the catenary type power supply can beconsidered as the most mature ERS technology. Moreover transmission efficiency onthe contact point between infrastructure and vehicle reaches 99 % [16] and is muchhigher than the inevitable transmission losses in inductive solutions.With specific consideration of the heavy truck volumes that are discussed for ZEcorridors ground-based conductor rails must be questioned regarding their integrationinto the road surface. While lane grooves can be compensated by vehicle suspensionsand the pneumatic pantograph mechatronics in overhead contact line applications suchdistortions (see Figure 33) cannot be handled by integrated conductor rails.
Figure 33 Lane grooves on Alameda Street at intersection
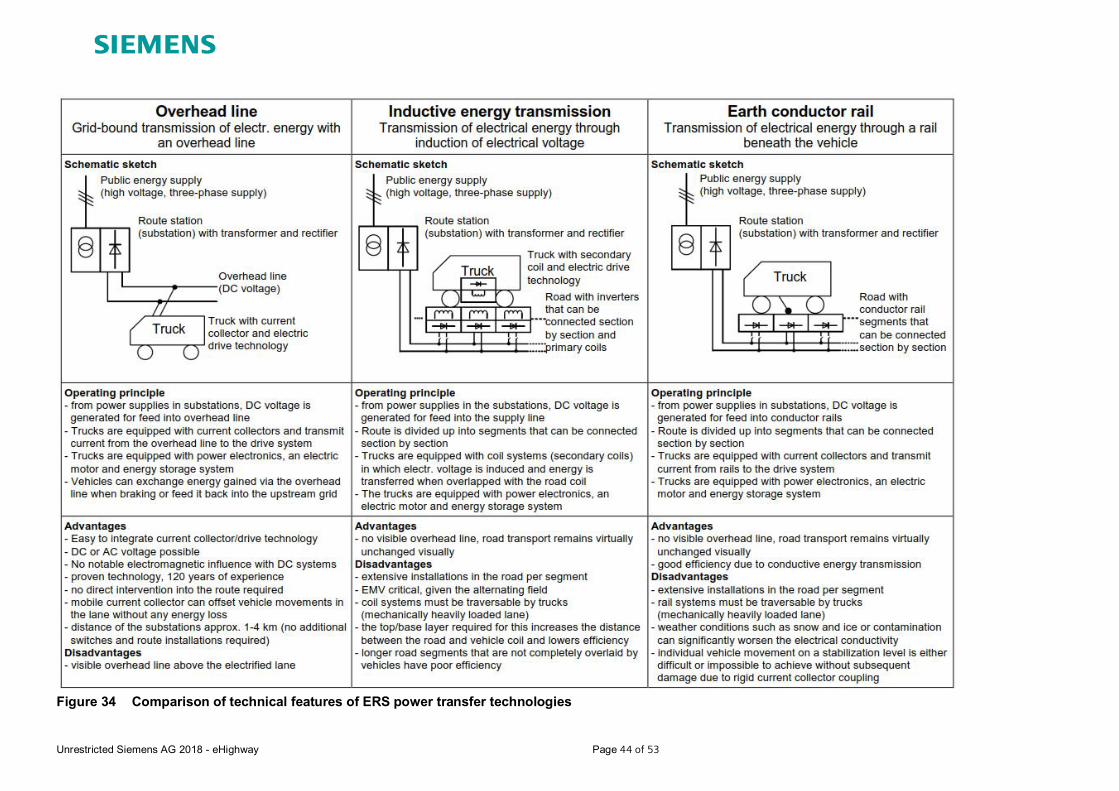
Unrestricted Siemens AG 2018 - eHighway Page 44 of 53
Figure 34 Comparison of technical features of ERS power transfer technologies

Unrestricted Siemens AG 2018 - eHighway Page 45 of 53
7.3 Conclusions and perspectivesThe project has demonstrated that the eHighway system can be implemented in anexisting road infrastructure as a potential zero emission goods transport technology.During the testing phase the eHighway system proved to be a viable technologysuitable for e.g. regional zero-emissions corridors. The whole project and the testinggained wide interest by stakeholders and potential users, see Figure 35.
Figure 35 Catenary supplied hybrid trucks raise attention of key stakeholders for ZE transportLessons learned from this project and from the eHighway related activities of Siemensand its cooperations partners are being implemented in the ongoing development andimprovement. A strong focus will be put on a new generation of the pantograph systemwhich is to be released for the field trials on German highways in 2019. Themodifications are targeting at reducing the weight and complexity of the pantographs inorder to increase the availability while at the same time reduce the costs.During the recent years the eHighway system is increasingly being considered as thebackbone technology - not only for shuttle applications in ports and mines, but althoughas core solution to reach ambitious climate protection and emission reduction targets.When larger distances of highways are being electrified with overhead contact lines,there will remain a share of the routes where the vehicles have to utilize their alternativedrive system. Besides batteries and synthetic fuels used in conventional or down-sizedcombustion engines small fuel cell systems may be used, if this technology proves outfeasible and cost-compatible in the future. The adaptation of the trucks to the specificneeds of the logistics companies offers great potential to achieve ZE road freighttransport while at the same time foster the development of these technologies.Larger scale projects also offer potential to reduce infrastructure costs significantly asdiscussed in the business cases for further applications in Southern California.

Unrestricted Siemens AG 2018 - eHighway Page 46 of 53
8 Public relations and communication8.1 Press and media releasesThe feedback from public media, internet platforms and TV stations on the project were positive.The TV report from Discovery Canada has given a comprehensive overview of the goals andtargets which were achieved during the project duration. The following Internet Links have beenpublished after the opening of the eHighway on the Alameda Street.All press and media releases can be found in the attachments under the chapter 10.2:
- SoCal Siemens Inc Newsroom (November 8, 2017)- Siemens eHighway Runs for SoCal, Fleets & Fuels (November 17, 2017)- How about electric semis that draw power from overhead wires?, Green Car Reports
(November 20, 2017)- Siemens Begins Zero-Emissions Highway Testing in California, Heavy Duty Trucking
(November 13, 2017)- First 'eHighway' Demonstration Project Under Way, Environmental Protection
(November 20, 2017)- California's First Electric Highway Is Finally Open, Green Matters (November 13, 2017)- Siemens Begins Zero-Emissions Highway Testing in California, Trucking Info (November
13, 2017)- Today’s Pickup: California ports become testing ground for electrified highway, Freight
Waves (November 13, 2017)- One way to curb freight emissions: Put trucks on an electric catenary system, Ars
Technica (November 10, 2017)- Never Mind Electric Cars: Why Electric Roads are the Real Key to the Future, Inverse
(November 10, 2017)- Trucks start rolling down California eHighway, New Atlas (November 10, 2017)- Siemens eHighway Heavy-Duty Trucks Continue In California, Clean Technica
(November 12, 2017)- Siemens debuts first electrified eHighway in the US, Gears of Biz (November 10, 2017)- When overhead wires feed energy to trucks in California demo, Tech Xplore (November
10, 2017)- Ports of LA and Long Beach Debut Hybrid Trolley-Trucks, The Maritime Executive
(November 9, 2017)- Siemens Unveils California’s New Electric Highway, The News Wheel (November 12,
2017)- This Week in Tech: An Electric Highway for Green Transportation, Architect Magazine
(November 10, 2017)- Today’s Pickup: California ports become testing ground for electrified highway, Freight
Waves (November 10, 2017)- First US eHighway demonstration in California, Energy News Live (November 10, 2017)- California Builds First Electric Highway, For Construction Pros (November 9, 2017)- First U.S. eHighway Electrified Trucks Running in California, Construction Equipment
(November 9, 2017)- Syndication: America’s first eHighway goes live in California, Blouin News (November
10, 2017)- Hybrid 'trolley trucks' debut in Port of LA, Long Beach, Fox 11 Los Angeles (November
9, 2017)- This Electric Highway Powers Trucks Without Recharging- Fast Company, November 9, 2017- There's Now An Electric Highway In California Forbes, November 8, 2017

Unrestricted Siemens AG 2018 - eHighway Page 47 of 53
- eHighway broadcast coverage-ABC, CBS November 8, 2017- Trolly-like system for heavy-duty trucks tested near the ports of LA, Long Beach Daily
Breeze (LA local), November 8, 2017- Siemens debuts first electrified eHighway in the US Inhabitat, November 9, 2017- Siemens Tests Novel eHighway for Heavy-Duty Trucks in California Next-Gen
Transportation News, November 8, 2017- California Builds First Electric Highway- Forconstructionpros.com, November 9, 2017- First U.S. eHighway Demonstration Running in California, Mass Transit, November 8,
2017- Siemens To Conduct eHighway Trials With Electric Volvo Trucks In California Inside
EVs, November 9, 2017- Electrified 'eHighway' demonstration running in California Utility Products, November 8,
2017- Siemens Tram-Trucks Cruise Near LA Port, Port Technology, November 9, 2017- Siemens launches the first eHighway demonstration in the US
TV Reports- Discovery Channel Canada 12-01-2018
8.2 Presentations to Customers and StakeholdersDuring the construction and testing phases a number of technical presentations wereheld at site. Table 3 lists these dates. For the press and media event an informationpackage was provided, cf. chapter 10.2.Table 3 Date and topic of customer and stakeholder presentations
Date Topic
2015-12-22 Funding partners demonstration at substation and test track
2017-07-18 Port of Long Beach
2017-07-18 SCE – Technical Group 1
2017-09-07 AQMD Board Meeting
2017-10-14 4th International Moving Forward Network Conference
2017-11-08 Press and Media Event
2017-11-30 Discovery Channel Canada
2017-12-12 SCE – Technical Group 2
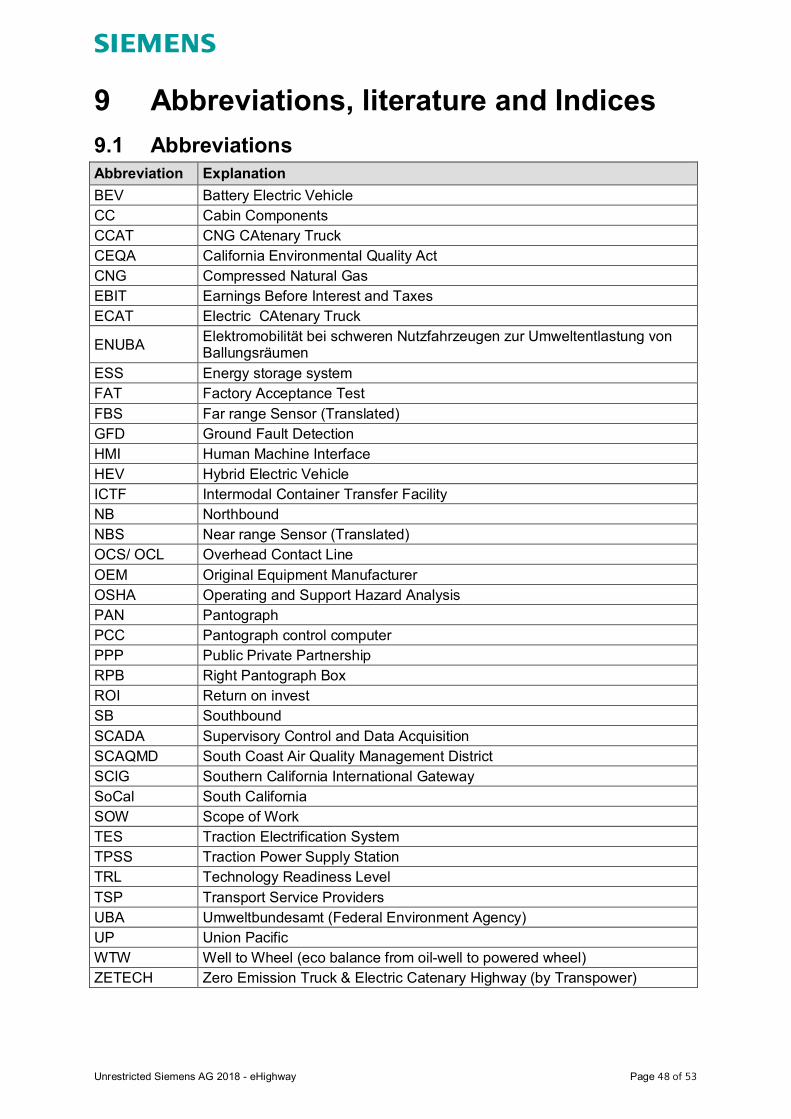
Unrestricted Siemens AG 2018 - eHighway Page 48 of 53
9 Abbreviations, literature and Indices9.1 AbbreviationsAbbreviation ExplanationBEV Battery Electric VehicleCC Cabin ComponentsCCAT CNG CAtenary TruckCEQA California Environmental Quality ActCNG Compressed Natural GasEBIT Earnings Before Interest and TaxesECAT Electric CAtenary Truck
ENUBA Elektromobilität bei schweren Nutzfahrzeugen zur Umweltentlastung vonBallungsräumen
ESS Energy storage systemFAT Factory Acceptance TestFBS Far range Sensor (Translated)GFD Ground Fault DetectionHMI Human Machine InterfaceHEV Hybrid Electric VehicleICTF Intermodal Container Transfer FacilityNB NorthboundNBS Near range Sensor (Translated)OCS/ OCL Overhead Contact LineOEM Original Equipment ManufacturerOSHA Operating and Support Hazard AnalysisPAN PantographPCC Pantograph control computerPPP Public Private PartnershipRPB Right Pantograph BoxROI Return on investSB SouthboundSCADA Supervisory Control and Data AcquisitionSCAQMD South Coast Air Quality Management DistrictSCIG Southern California International GatewaySoCal South CaliforniaSOW Scope of WorkTES Traction Electrification SystemTPSS Traction Power Supply StationTRL Technology Readiness LevelTSP Transport Service ProvidersUBA Umweltbundesamt (Federal Environment Agency)UP Union PacificWTW Well to Wheel (eco balance from oil-well to powered wheel)ZETECH Zero Emission Truck & Electric Catenary Highway (by Transpower)

Unrestricted Siemens AG 2018 - eHighway Page 49 of 53
9.2 Literature[1] SCAQMD: Contract No. 14062 incl. Statement of Work. Diamond Bar, 2014[2] Siemens AG [Hrsg.]: SCAQMD Contract 14062. Q4 Testing Report, 22 Feb 2018.[3] UNFCC United Nations Framework Convention on Climate Change: Paris
Agreement. Paris, 12.12.2015. Link:https://unfccc.int/resource/docs/2015/cop21/eng/l09r01.pdf
[4] EPA - United States Environmental Protection Agency: Sources of GreenhouseGas Emissions for 2015. Link: https://www.epa.gov/ghgemissions/sources-greenhouse-gas-emissions
[5] ITF - International Transport Forum: Outlook 2017. Link:http://www.keepeek.com/Digital-Asset-Management/oecd/transport/itf-transport-outlook-2017/summary/english_e979b24d-en#.Wo2GapiWwu4#page1
[6] ATA - American Transport Assosiation: Latest U.S. Freight TransportationForecast Shows Continued Growth for Trucking. Arlington, VA, 12 October 2016.Link: http://www.trucking.org/article/Latest-U.S.-Freight-Transportation-Forecast-Shows-Continued-Growth-for-Trucking?_sm_au_=iVVJPMK76jFbbMqH
[7] CALSTART: I-710 Project Zero-Emission Truck Commercialization Study FinalReport. November 2013. Link: http://www.calstart.org/Libraries/I-710_Project/I-710_Project_Zero-Emission_Truck_Commercialization_Study_Final_Report.sflb.ashx
[8] Siemens AG [Hrsg.]: ENUBA – Elektromobilität bei schweren Nutzfahrzeugen zurUmweltentlastung von Ballungsräumen (FKZ: 16EM0077). Abschlussbericht.München, 2012. Link: http://www.erneuerbar-mobil.de/sites/default/files/publications/abschlussbericht-enuba_1.pdf
[9] Siemens AG [Hrsg.]: ENUBA 2 – Elektromobilität bei schweren Nutzfahrzeugenzur Umweltentlastung von Ballungsräumen (FKZ: 16EM1010, 16EM1011,16EM1104). Abschlussbericht der Verbundforschungspartner. München, 2016.Link: http://erneuerbar-mobil.de/sites/default/files/2016-09/ENUBA2_Abschlussbericht_V3_TIB_31-08-2016.pdf
[10] SCE - Southern California Edison: Grid Technology and Modernization File,eHighway Grid Impact Assessment. Memorandum by Ioan, A. and Smith, J.Record No.: TC-15-027-TR06. Pomona, CA, February 2018. (internal report)
[11] Volvo Group: Demonstration of Siemens Electric Road System on Diesel ElectricHybrid Truck - eHighway Vehicle Test Report. Report by Amar, P. and Larsson,B. Record No.: P4348. Gothenburg, January 2018. (internal report)
[12] TransPower: Electric and CNG Hybrid Trucks for the Zero Emission Truck &Electric Catenary Highway (ECHT-ZETECH). Final Report. Escondido, CA,December 2017. (internal report)
[13] Siemens AG [Hrsg.]: ENUBA 2 - Technical assessment, Result report (TB-E).Presented to German Federal Highway Research Institute (BASt – Bundesanstaltfür Straßenwesen). Erlangen, August 2015. (non-public report)
[14] Siemens AG: Business cases for future catenary projects in the South Coast AirBasin. Report to SCAQMD, February 2018. (internal report)
[15] SINTEF Energy Research: Technology for dynamic on-road power transfer toelectric vehicles – Overview and electro-technical evaluation of state-of-the-art forconductive and inductive power transfer technologies. Project: ELinGO – Electricinfrastructure for Goods Transport. Project report 1.2, Oslo, January 2018.

Unrestricted Siemens AG 2018 - eHighway Page 50 of 53
[16] Lehmann, M. et. al.: Untersuchung eines Stromabnehmers für schwereNutzfahrzeuge. In: eb - Elektrische Bahnen, Jg. 111 (2013) H. 11, S. 657ff
Additional literature sources for project background[A1] http://www.aqmd.gov/home/air-quality/clean-air-plans/air-quality-mgt-plan/final-
2016-aqmp[A2] http://www.aqmd.gov/docs/default-source/Agendas/aqmp/white-paper-working-
groups/wp-goodsmvmt-final.pdf?sfvrsn=2[A3] https://www.arb.ca.gov/cc/inventory/pubs/reports/2000_2015/ghg_inventory_tren
ds_00-15.pdf[A4] http://www.ca-ilg.org/post/basics-sb-375[A5] http://www.casustainablefreight.org/documents/PlanElements/AppendixB_FINAL
_07272016.pdf[A6] https://www.arb.ca.gov/cc/sb375/sb375_workshop%20presentation_los_angeles.
pdf slide 21[A7] https://www.trucks.com/2017/12/11/california-green-truck-incentive-package/[A8] http://www.energy.ca.gov/contracts/GFO-17-603/[A9] https://www.arb.ca.gov/gmp/sfti/Sustainable_Freight_Draft_4-3-2015.pdf pages
13 & 24
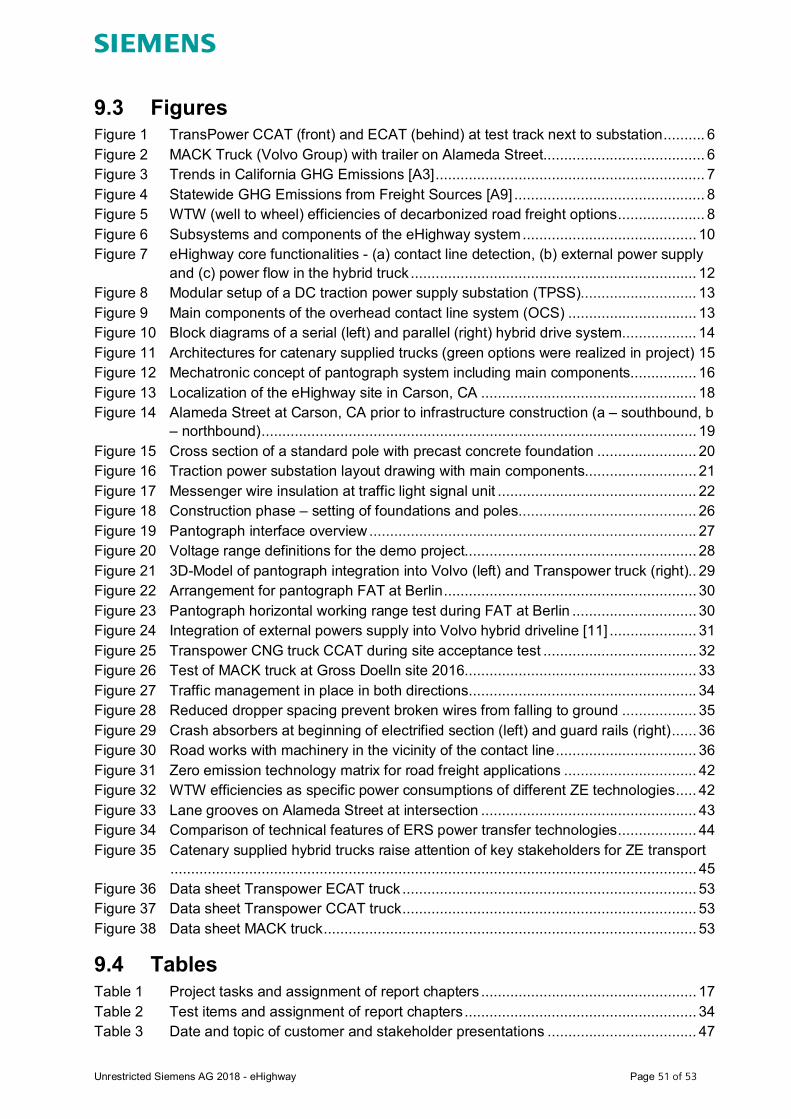
Unrestricted Siemens AG 2018 - eHighway Page 51 of 53
9.3 FiguresFigure 1 TransPower CCAT (front) and ECAT (behind) at test track next to substation .......... 6Figure 2 MACK Truck (Volvo Group) with trailer on Alameda Street ....................................... 6Figure 3 Trends in California GHG Emissions [A3] ................................................................. 7Figure 4 Statewide GHG Emissions from Freight Sources [A9] .............................................. 8Figure 5 WTW (well to wheel) efficiencies of decarbonized road freight options ..................... 8Figure 6 Subsystems and components of the eHighway system .......................................... 10Figure 7 eHighway core functionalities - (a) contact line detection, (b) external power supply
and (c) power flow in the hybrid truck ..................................................................... 12Figure 8 Modular setup of a DC traction power supply substation (TPSS)............................ 13Figure 9 Main components of the overhead contact line system (OCS) ............................... 13Figure 10 Block diagrams of a serial (left) and parallel (right) hybrid drive system .................. 14Figure 11 Architectures for catenary supplied trucks (green options were realized in project) 15Figure 12 Mechatronic concept of pantograph system including main components ................ 16Figure 13 Localization of the eHighway site in Carson, CA .................................................... 18Figure 14 Alameda Street at Carson, CA prior to infrastructure construction (a – southbound, b
– northbound) ......................................................................................................... 19Figure 15 Cross section of a standard pole with precast concrete foundation ........................ 20Figure 16 Traction power substation layout drawing with main components........................... 21Figure 17 Messenger wire insulation at traffic light signal unit ................................................ 22Figure 18 Construction phase – setting of foundations and poles ........................................... 26Figure 19 Pantograph interface overview ............................................................................... 27Figure 20 Voltage range definitions for the demo project........................................................ 28Figure 21 3D-Model of pantograph integration into Volvo (left) and Transpower truck (right).. 29Figure 22 Arrangement for pantograph FAT at Berlin ............................................................. 30Figure 23 Pantograph horizontal working range test during FAT at Berlin .............................. 30Figure 24 Integration of external powers supply into Volvo hybrid driveline [11] ..................... 31Figure 25 Transpower CNG truck CCAT during site acceptance test ..................................... 32Figure 26 Test of MACK truck at Gross Doelln site 2016........................................................ 33Figure 27 Traffic management in place in both directions ....................................................... 34Figure 28 Reduced dropper spacing prevent broken wires from falling to ground .................. 35Figure 29 Crash absorbers at beginning of electrified section (left) and guard rails (right) ...... 36Figure 30 Road works with machinery in the vicinity of the contact line .................................. 36Figure 31 Zero emission technology matrix for road freight applications ................................ 42Figure 32 WTW efficiencies as specific power consumptions of different ZE technologies ..... 42Figure 33 Lane grooves on Alameda Street at intersection .................................................... 43Figure 34 Comparison of technical features of ERS power transfer technologies ................... 44Figure 35 Catenary supplied hybrid trucks raise attention of key stakeholders for ZE transport
............................................................................................................................... 45Figure 36 Data sheet Transpower ECAT truck ....................................................................... 53Figure 37 Data sheet Transpower CCAT truck ....................................................................... 53Figure 38 Data sheet MACK truck .......................................................................................... 53
9.4 TablesTable 1 Project tasks and assignment of report chapters .................................................... 17Table 2 Test items and assignment of report chapters ........................................................ 34Table 3 Date and topic of customer and stakeholder presentations .................................... 47
Unrestricted Siemens AG 2018 - eHighway Page 52 of 53
10 Appendices10.1 Project Synopsis
Provided as PDF: SCAQMD Contract 14062_synopsis.pdf
10.2 Information package I – Press & Media event
Provided as Zip-File: SCAQMD_14062_MediaPackage.zip
10.3 Information package II – Press Releases
Provided as Zip-File: SCAQMD_14062_PressReleases.zip
10.4 Photo documentationThe photograph documentation contains the following aspects:∂ Construction: SCAQMD_14062_Construction.zip∂ Testing: SCAQMD_14062_Testing.zip∂ Miscellaneous: SCAQMD_14062_ Miscellaneous.zip∂ Graphics used in the report: SCAQMD_14062_ ReportGraphics.zip
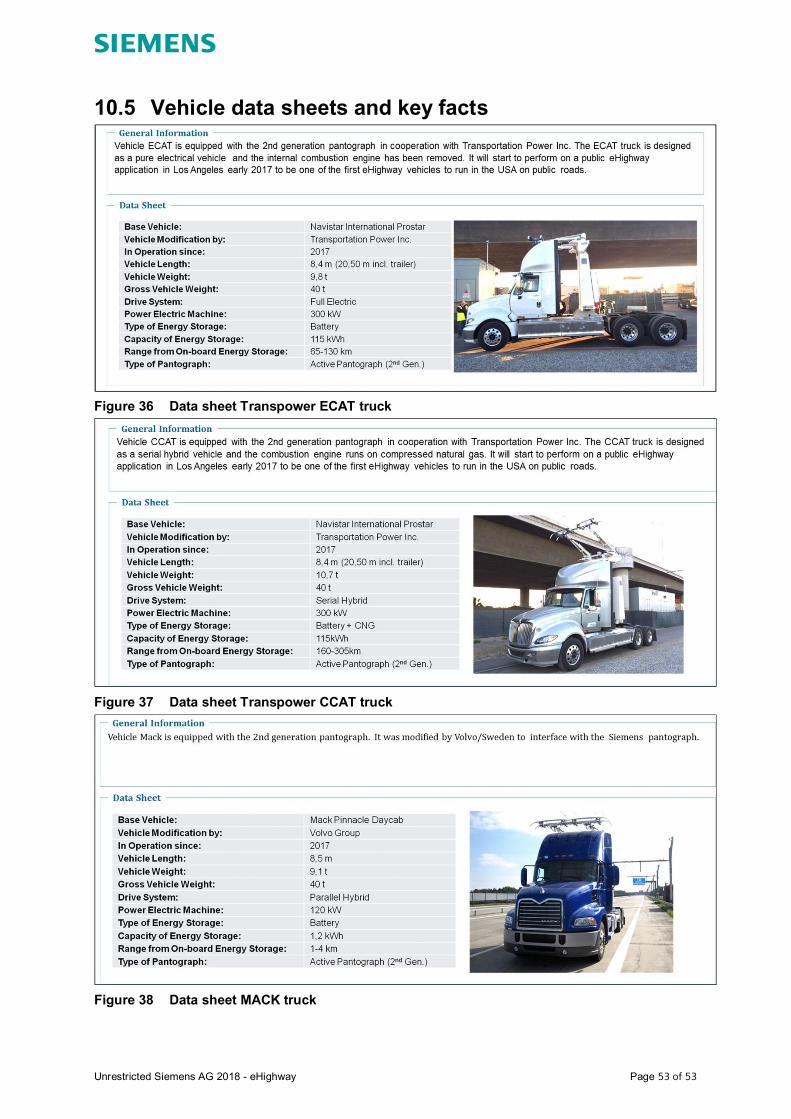
Unrestricted Siemens AG 2018 - eHighway Page 53 of 53
10.5 Vehicle data sheets and key facts
Figure 36 Data sheet Transpower ECAT truck
Figure 37 Data sheet Transpower CCAT truck
Figure 38 Data sheet MACK truck

© Ricardo plc 2017
TCO of Overhead Catenary System power port
drayage trucks
Final Report
16 February 2018
2© Ricardo plc 2018
• Executive Summary
• Sensitivity Analysis
• CAPEX Assumptions
• OPEX Assumptions
Contents
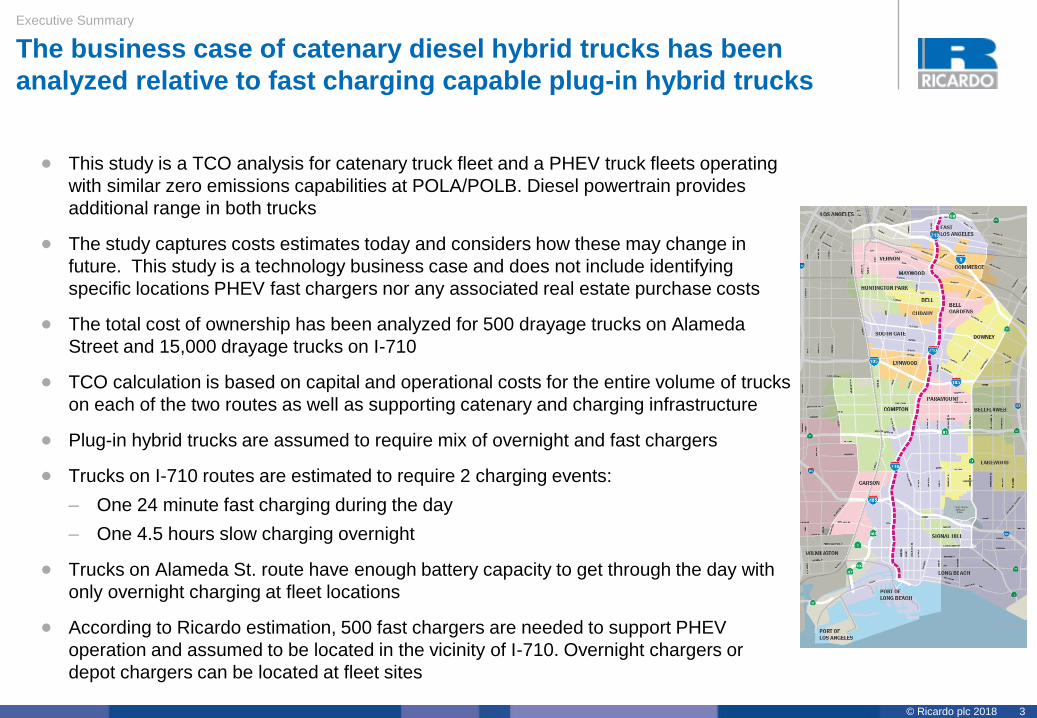
3© Ricardo plc 2018
Executive Summary
The business case of catenary diesel hybrid trucks has been
analyzed relative to fast charging capable plug-in hybrid trucks
• This study is a TCO analysis for catenary truck fleet and a PHEV truck fleets operating
with similar zero emissions capabilities at POLA/POLB. Diesel powertrain provides
additional range in both trucks
• The study captures costs estimates today and considers how these may change in
future. This study is a technology business case and does not include identifying
specific locations PHEV fast chargers nor any associated real estate purchase costs
• The total cost of ownership has been analyzed for 500 drayage trucks on Alameda
Street and 15,000 drayage trucks on I-710
• TCO calculation is based on capital and operational costs for the entire volume of trucks
on each of the two routes as well as supporting catenary and charging infrastructure
• Plug-in hybrid trucks are assumed to require mix of overnight and fast chargers
• Trucks on I-710 routes are estimated to require 2 charging events:
– One 24 minute fast charging during the day
– One 4.5 hours slow charging overnight
• Trucks on Alameda St. route have enough battery capacity to get through the day with
only overnight charging at fleet locations
• According to Ricardo estimation, 500 fast chargers are needed to support PHEV
operation and assumed to be located in the vicinity of I-710. Overnight chargers or
depot chargers can be located at fleet sites

4© Ricardo plc 2018
• Plug-in diesel hybrid are more
expensive than catenary trucks due
to cost of battery pack
• Catenary infrastructure is
underutilized for a volume of 500
trucks and is more expensive than
charging infrastructure which are
sized to meet demands of truck
volume
• Miles driven on diesel are same for
catenary and plug-in hybrid trucks
• Zero emission miles driven on
catenary are 10% more efficient
than PHEV as there are no losses in
battery. However cost of electricity
is higher in catenary due to
increased usage during day time
peak hours. Plug-in trucks on
Alameda St. are assumed to require
only overnight charging which keeps
electricity rates low
• Maintenance and repair cost for 250
overnight chargers is higher than
cost for maintaining catenary
infrastructure
Executive Summary
Catenary truck TCO is 8-20% higher than PHEV on Alameda St;
Catenary infrastructure is underutilized and more expensive
TCO for system of 500 trucks on Alameda Street over 10 years of vehicle ownership
A high scenario for catenary
infrastructure cost is assumed
to capture potentially high cost
of construction on Alameda St.
$8 MM $8 MM $8 MM
$20 MM $15 MM $20 MM
$19 MM$19 MM
$19 MM
$13 MM$28 MM
$69 MM
$72 MM
$69 MM
$4 MM$4 MM
Plug-in
Diesel Hybrid
Diesel Hybrid
Catenary
$123 MM
$5 MM
$4 MM
Diesel Hybrid
Catenary
$133 MM
+20%
$148 MM
+8%
Vehicle Maintenance & Repair
Vehicle CAPEX
Amortized Infrastructure CAPEX incl. financing
Fuel Cost-Electricity
Infrastructure Maintenance & Repair
Fuel Cost-Diesel
Base scenario:
Catenary cost -
$5.7 M per mile
High scenario:
Catenary cost -
$12 M per mile

5© Ricardo plc 2018
Executive Summary
Catenary truck TCO is comparable to PHEV on I-710; Vehicle and
catenary CAPEX is more attractive but OPEX is higher than PHEVs
-1%
Plug-in Diesel Hybrid
$4,838 MM
$152 MM
$450 MM
$930 MM
$931 MM
$450 MM
$1,227 MM
$931 MM
$102 MM
$2,070 MM
$215 MM
$2,160 MM
Diesel Hybrid
Catenary
$4,797 MM
$17 MM
Vehicle Maintenance & Repair
Infrastructure Maintenance & Repair
Fuel Cost-Electricity
Fuel Cost-Diesel
Amortized Infrastructure CAPEX incl. financing
Vehicle CAPEX
TCO for system of 15,000 trucks on I-710 over 10 years of vehicle ownership
• Plug-in diesel hybrid are more
expensive than catenary trucks due to
cost of battery pack
• Catenary infrastructure is less
expensive than estimated network of
500 fast chargers and 7,500 overnight
chargers required for 15,000 trucks
• Miles driven on diesel are same for
catenary and plug-in hybrid trucks
• Zero emission miles driven on catenary
are 10% more efficient than PHEV as
there are no losses in battery.
However cost of electricity is higher in
catenary due to usage during day time
peak hours. Plug-in trucks on I-710 are
assumed to require one fast charging
event during day followed by overnight
charging which mitigates overall
electricity rates
• Maintenance and repair cost for 500
fast chargers and 7,500 overnight
chargers is significantly higher than
cost for maintaining catenary
infrastructure

6© Ricardo plc 2018
Executive Summary
TCO of catenary and PHEV trucks are quite comparable; Overall
investment in catenary infrastructure is lower than cost of chargers
$323
$10$30
$62
$62
$14
$144
Diesel Hybrid
Catenary
$320
$1$30
Plug-in
Diesel Hybrid
$82
$62
$7
$138
-1%
I-710$ in Thousands
Plug-in
Diesel Hybrid
$246
$10$16
$30
$37
$8
$144
Diesel Hybrid
Catenary
$266
$7$16
$41
$37
$27
$138
+8%
Alameda Street$ in Thousands
TCO for per truck over 10 years of vehicle ownership
Infrastructure Maintenance & Repair
Fuel Cost-Electricity
Vehicle Maintenance & Repair
Fuel Cost-Diesel
Amortized Infrastructure CAPEX
Vehicle CAPEX
Upfront Infrastructure Investment (excludes financing)
+360%
Plug-in
Diesel Hybrid
Diesel Hybrid
Catenary
$5 MM
$23 MM
Diesel Hybrid
Catenary
Plug-in
Diesel Hybrid
-40%
$175 MM
$290 MM
I-710Alameda Street$ in Million $ in Million
Catenary
Infrastructure
Charging
Infrastructure
Life length 30 years 20 years

7© Ricardo plc 2018
Executive Summary
CAPEX for chargers can be competitive with catenary for trucks
using I-710, if charger costs can come down to $600/kW by 2025
• Charging Infrastructure cost is
already lower than the
catenary infrastructure for
Alameda St. route
• Based on baseline assumption
of $1,000/kW for chargers, the
CAPEX is higher than catenary
for I-710 route which may be
disadvantage from funding
perspective
• However, at $600/kW per
charger which is in the realm of
possibility, CAPEX can be
competitive with catenary
• Variations can be expected in
indirect costs for catenary
infrastructure on Alameda St.
but overall catenary
infrastructure CAPEX still
remains significantly higher
than charging infrastructure
Sensitivity analysis of charger cost
$8 MM$6 MM
$3 MM
$23 MM
BaselineCatenary
Infrastructure
Low High
Infrastructure cost for Alameda Street
$406 MM
$290 MM
$174 MM$175 MM
Low Baseline HighCatenary
Infrastructure
Infrastructure cost for I-710
$48 MM
$23 MM$19 MM
$6 MM
Low HighBaselineCharging
Infrastructure
Infrastructure on Alameda Street
Sensitivity analysis of catenary indirect cost
Charger cost $/kW scenario
Low Baseline High
$600 $1,000 $1,400
Catenary indirect cost for Alameda Street
Low Baseline High
10% of
direct cost
30% of
direct cost
172% of
direct cost
Charging Infrastructure Charging Infrastructure
Catenary Infrastructure

8© Ricardo plc 2018
Executive Summary
TCO results, in general, show less than 4% variation to large swings
in key parameters and hence not very sensitive to assumed values
-8% -6% -4% -2% 0% 2% 4% 6% 8%
Demand charge rate
Battery cost
Charger cost
PHEV on Alameda Street
Low High
-8% -6% -4% -2% 0% 2% 4% 6% 8%
Demand charge rate
Energy charge rate
Battery cost
Charger cost
Fast charger only
PHEV on I-710
Low High
-8% -6% -4% -2% 0% 2% 4% 6% 8%
Demand charge rate
Energy charge rate
Pantograph cost
Catenary on I-710
Low High
• Elimination of demand charge rate has appreciable impact on TCO of both Catenary and
PHEV truck but does not change the business case. Overall TCO still remains comparable
• Catenary infrastructure cost high scenario increases TCO on Alameda Street of Catenary
truck by 11%, but in the base scenario, Catenary infrastructure cost is already significantly
higher than charging infrastructure
% change in TCO as a result of variation in key parameters
Sensitivity
AnalysisLow Baseline High
Charger cost
$/kW600 1000 1400
Pantograph
cost $ per truck10000 20000 30000
Battery cost
$/kWh150 200 NA
Catenary
indirect cost
10% of
direct cost
30% of
direct cost
172% of
direct cost
Fast charger NA
Fast
charger +
Overnight
charger
Fast
charger only
Average
energy charge
rate $/kWh
0.11 0.14 0.16
Demand
charge rate
$/kW
0 11 14
Sensitivity analysis list
-6%-4%-2%0% 2% 4% 6% 8%10%12%
Demand charge rate
Pantograph cost
Energy charge rate
Catenary cost
Catenary on Alameda Street
Low High

9© Ricardo plc 2018
• Executive Summary
• Sensitivity Analysis
• CAPEX Assumptions
• OPEX Assumptions
Contents

10© Ricardo plc 2018
Sensitivity Analysis
40% swing in charger cost results in 1% to 2 % change in TCO
suggesting that impact on TCO is not significant
$8 MM $8 MM $8 MM
$5 MM
$6 MM
$72 MM
Baseline
$123 MM
$5 MM
$124 MM
$15 MM
$19 MM
-1% +1%
High
$15 MM
$19 MM
$4 MM
$72 MM
$121 MM
$5 MM
$15 MM
$19 MM
$2 MM
$72 MM
Vehicle CAPEX
Infrastructure Maintenance & Repair
Vehicle Maintenance & Repair
Fuel Cost-Electricity
Fuel Cost-Diesel
Amortized Infrastructure CAPEX
Charger cost $/kW
Low
$300 MM
$2,160 MM
Baseline
$4,838 MM
$152 MM
$450 MM
$930 MM
$931 MM
$215 MM
$2,160 MM$2,160 MM
-2% +2%
High
$4,923 MM
$152 MM
$450 MM
$930 MM
$931 MM
$4,752 MM
$152 MM
$450 MM
$930 MM
$931 MM
$129 MM
Low
TCO sensitivity analysis on charger cost for PHEV
• Level II AC charger costs have been declining due to increase in demand from light-duty segment. There is potential for DC fast charger costs to
decline too as volume goes up and $600/KW installed cost may be feasible
• Study on charger cost roadmap can provide further insights on future infrastructure investment needs and comparison with catenary
Alameda Street I-710
Low Baseline High
$600 $1,000 $1,400

11© Ricardo plc 2018
Sensitivity Analysis
Pantograph accounts for small proportion of catenary truck cost;
Hence 50% change in pantograph cost varies TCO by 3% to 4% only
Pantograph cost $ per truck
Low
$17 MM$450 MM
$1,227 MM
$931 MM
$102 MM
$2,070 MM
$4,647 MM
$17 MM$450 MM
$931 MM
$102 MM
$1,920 MM
-3% +3%
High
$4,947 MM
$17 MM$450 MM
$1,227 MM
$931 MM
$102 MM
$2,220 MM
Baseline
$4,797 MM
$1,227 MM
Low
TCO sensitivity analysis on pantograph cost for catenary truck
Alameda Street I-710
$8 MM $8 MM $8 MM
$20 MM $20 MM $20 MM
$19 MM $19 MM $19 MM
$13 MM $13 MM $13 MM
$64 MM $69 MM $74 MM
$4 MM
High
+4%-4%
$138 MM
Baseline
$133 MM
$4 MM
$128 MM
$4 MM
Fuel Cost-Electricity
Vehicle CAPEX
Fuel Cost-Diesel
Infrastructure Maintenance & Repair
Vehicle Maintenance & Repair
Amortized Infrastructure CAPEX
Low Baseline High
$10,000 $20,000 $30,000
• Although vehicle CAPEX constitutes a high percentage of TCO, pantograph only accounts ~8% of total vehicle cost
• Even though impact on TCO is not appreciable, $10,000 different vehicle cost can impact purchase decision of fleet operators

12© Ricardo plc 2018
Sensitivity Analysis
Reduction in battery cost from $200 /kWh to $150 /kWh brings the
PHEV cost at par with catenary truck; TCO changes by 2%
Battery cost $/kWh
Low
-2%
Baseline
$4,838 MM
$152 MM
$450 MM
$930 MM
$931 MM
$215 MM
$2,160 MM
$4,748 MM
$152 MM
$450 MM
$930 MM
$931 MM
$215 MM
$2,070 MM
Low
TCO sensitivity analysis on battery cost
• Automotive battery price projections for 2025 are aggressive but Ricardo has assumed that prices will continue to be relatively higher for heavy-
duty industry due to lower demand. Baseline battery cost of $200/kWh is based on Ricardo’s adoption model
• However, OEMs in both light duty and heavy duty markets can achieve lower battery prices. Hence, a scenario with $150/kWh is considered
Alameda Street I-710
$19 MM
$4 MM
$69 MM
$123 MM
$5 MM$8 MM
$15 MM
$19 MM
$4 MM
$72 MM
$120 MM
$5 MM$8 MM
$15 MM
-2%
Baseline
Infrastructure Maintenance & Repair
Vehicle Maintenance & Repair
Fuel Cost-Electricity
Fuel Cost-Diesel
Amortized Infrastructure CAPEX
Vehicle CAPEX
Low Baseline High
$150 $200 NA

13© Ricardo plc 2018
Sensitivity Analysis
Construction of catenary infrastructure on Alameda St. presents
higher degree of uncertainty in costs; TCO varies by 2% to 11%
Catenary indirect cost-Alameda
Low
TCO sensitivity analysis on catenary indirect cost
Alameda Street
$4 MM$8 MM$8 MM$8 MM
$20 MM$20 MM $20 MM
$19 MM$19 MM $19 MM
$11 MM $13 MM
$28 MM
$69 MM$69 MM
$69 MM
+11%-2%
High
$148 MM
Baseline
$133 MM
$4 MM
$131 MM
$4 MM
Amortized Infrastructure CAPEX
Vehicle CAPEX
Infrastructure Maintenance & Repair
Fuel Cost-Electricity
Vehicle Maintenance & Repair
Fuel Cost-Diesel
• Indirect costs for the baseline scenario assumes 10% of direct cost for project management cost and 20% for contingency.
• However, catenary construction at Alameda street may also have potential costs such as viaduct elevation, safety adjustment, compensation
for Electromagnetic Compatibility issue, etc. The high cost scenario includes these potential costs in the form of a higher contingency
• Low indirect cost scenario assume no contingency cost.
Low Baseline High
10% of direct
cost
30% of direct
cost
172% of
direct cost

14© Ricardo plc 2018
Sensitivity Analysis
Charging infrastructure comprising of only fast chargers increases
TCO; Use of overnight chargers has economic benefits
Fast charger or Overnight charger
TCO sensitivity analysis on fast charger numbers
I-710
+5%
Fast charger
only
$5,096 MM
$4 MM$450 MM
$1,366 MM
$931 MM
$185 MM
$2,160 MM
Baseline
$4,838 MM
$152 MM$450 MM
$930 MM
$931 MM
$215 MM
$2,160 MM
Infrastructure Maintenance & Repair
Vehicle Maintenance & Repair
Fuel Cost-Electricity
Fuel Cost-Diesel
Amortized Infrastructure CAPEX
Vehicle CAPEX
• Fast chargers incur higher electricity rates due to day time use (peak periods) and demand charges and hence have higher cost
of operation compared to overnight chargers
Baseline Fast charger only
Fast charger +
Overnight charger
Fast charger only

15© Ricardo plc 2018
Sensitivity Analysis
20% variation on energy charge rate affects TCO by 2% to 4%;
Impact is slightly greater on Catenary due to higher day time use
TCO sensitivity analysis on energy charge component of electricity rate
• Average energy charge rate is a weighted-average rate based on traffic distribution during peak-hours and off-peak hours. In this
study, the average energy charge rate only applies to power draw from catenary and fast chargers
• Average energy rates do not apply to overnight chargers as they operate during off-peak hours only
• Baseline energy charge rate is calculated on SCE’s proposed electricity cost schedule: TOU-EV-9 (From 2 kV to 50 kV). According
to SCE’ s varied schedules, energy charge rates increase when power requirements (kW and kV) decrease. To reflect the impact
from different schedules, Ricardo used a 20% higher rate in high case and a 20% lower rate in low case
Low
-4% +4%
High
$4,982 MM
$17 MM
$450 MM
$1,411 MM
$931 MM
$102 MM
$2,070 MM
Baseline
$4,797 MM
$17 MM$450 MM
$1,227 MM
$931 MM
$102 MM
$2,070 MM
$4,613 MM
$17 MM$450 MM
$1,042 MM
$931 MM
$102 MM
$2,070 MM
Alameda Street(Catenary)
I-710(Catenary)
$8 MM $8 MM $8 MM
$17 MM $20 MM $24 MM
$19 MM$19 MM $19 MM
$13 MM $13 MM$13 MM
$69 MM $69 MM$69 MM
$4 MM
Baseline
$133 MM
$4 MM
$130 MM
$4 MM
-2% +2%
High
$136 MM
Infrastructure Maintenance & Repair
Vehicle Maintenance & Repair
Fuel Cost-Electricity
Fuel Cost-Diesel
Amortized Infrastructure CAPEX
Vehicle CAPEX
$152 MM$450 MM
$1,033 MM
$931 MM
$215 MM
$2,160 MM
Baseline
$4,838 MM
+2%
High
$4,940 MM
$152 MM$450 MM
$930 MM
$931 MM
$215 MM
$2,160 MM
$4,735 MM
$152 MM$450 MM
$828 MM
$931 MM
$215 MM
$2,160 MM
-2%
I-710(PHEV)
Low Low
Low Baseline High
$0.11 $0.14 $0.16
Average energy charge rate $/kWh

16© Ricardo plc 2018
Low Baseline High
$0 $11 $14
Sensitivity Analysis
Elimination of demand charge reduces TCO by 4% to 8%; Impact is
slightly greater on PHEV trucks but TCO remains comparable
Demand charge rate $/kW
Low
$8 MM $8 MM $8 MM
$8 MM$15 MM $17 MM
$19 MM$19 MM $19 MM
$72 MM$72 MM $72 MM
$5 MM$5 MM$5 MM
-6% +1%
High
$4 MM
$115 MM
$4 MM
Baseline
$123 MM $124 MM
$4 MM
Low
TCO sensitivity analysis on pantograph cost for catenary truck
$8 MM $8 MM $8 MM
$15 MM $20 MM $21 MM
$19 MM$19 MM $19 MM
$13 MM$13 MM $13 MM
$69 MM$69 MM $69 MM
$4 MM
$134 MM
Baseline
$133 MM
$4 MM
$128 MM
$4 MM
-4% +1%
High
Infrastructure Maintenance & Repair
Vehicle Maintenance & Repair
Fuel Cost-Electricity
Fuel Cost-Diesel
Amortized Infrastructure CAPEX
Vehicle CAPEX
Alameda Street (Catenary) Alameda Street (PHEV)
$450 MM $450 MM $450 MM
$538 MM$930 MM
$931 MM
$931 MM $931 MM
$4,445 MM
$152 MM
-8% +2%
$152 MM
$215 MM
$2,160 MM
$215 MM
$2,160 MM
Baseline
$4,838 MM
High
$4,916 MM
$152 MM
$1,009 MM
$215 MM
$2,160 MM
$17 MM
$102 MM
$102 MM
$2,070 MM
$450 MM
$1,288 MM
$4,858 MM
$931 MM
$4,797 MM
$17 MM$450 MM
$1,227 MM
$931 MM
$102 MM
$2,070 MM
Baseline
+1%-6%
High
$2,070 MM
$4,493 MM
$17 MM$450 MM
$923 MM
$931 MM
I-710 (Catenary) I-710 (PHEV)
Low Low
• Both catenary and plug-in hybrid trucks
in the study present a requirement for
continuous high power
• Hence there is a possibility that
continuous demand from large scale
electrification of drayage trucks will not
incur demand charges which is reflected
in the “low” scenario
• Demand charge costs is a smaller
percentage of total electricity cost
compared to energy charge for both
catenary and PHEV trucks
17© Ricardo plc 2018
• Executive Summary
• Sensitivity Analysis
• CAPEX Assumptions
• OPEX Assumptions
Contents

18© Ricardo plc 2018
Sources Alameda Street I-710
Siemens500
(projected in 2021 by Siemens)
14,000
(projected in 2031 by Siemens)
LA Metro NA15,000-24,000
(SR-91 to port, projected in 2035)
Gladstein, Neandross &
Associates
(GNA)
300
(Drayage
Truck volume at ICTF in 2012)
9,500
(Actual volume in 2012)
22,000
(projected during 2020-2030)
CAPEX Assumptions
Number of Trucks in system
Drayage Truck Volume utilizing Alameda St. and I-710
Ricardo Assumption
(in 2025)
500 15,000
The business case has been studied based on electrification of
15,000 trucks on I-710 and 500 trucks on Alameda Street in 2025

19© Ricardo plc 2018
The study assumes catenary length of 4 miles on Alameda Street
and 19 miles on I-710
Duty Cycle
Source: Siemens Assumptions, CALSTART, Ricardo Analysis
I-710 Project Zero-Emission Truck Commercialization Study
Duty CycleOne-way
Distance
Near-Dock (between Port and nearby intermodal facility)
5-6 miles
Local(between downtown LA rail yards and
distribution centers)
8-10 miles
Regional(to Inland Empire distribution warehouses)
45-60 miles
Previous Ricardo studies show that one-way distances vary between 5 to 60 miles depending on route
Alameda St. I-710
Catenary length 4 miles 19 miles
One-way distance 8 miles 30 miles
# of round-trips per day 4 2
Distance per day 64 miles 120 miles
Ricardo Assumptions
CAPEX Assumptions

20© Ricardo plc 2018
Diesel mild hybrid catenary truck is selected for analysis due to low
vehicle price compared to full electric or series hybrids
Overheard catenary powered port truck configurations in US
Selected configuration for analysis
Diesel Hybrid Catenary Truck
Full Electric Catenary Truck
CNG Series Hybrid Catenary
Truck
Source: Siemens
CAPEX Assumptions

21© Ricardo plc 2018
Target and Reference Vehicle Specs
Source: Ricardo Analysis
Parameters
Target Vehicle
(Diesel Hybrid
Catenary)
Reference Vehicle
(Plug-in Diesel
Hybrid)
Battery
Energy2.5 kWh
125 kWh(spec’d for power & range)
Electric Range20 miles each way on
Catenary
One round trip with
zero emission
operation on I-710 on
single charge
Motor Peak
Power300 kW
Engine 11L 405 HP Diesel
Fuel Tank 75 Gallons
Diesel Range 400+ miles
Zero emission miles
on Catenary (target
vehicle) and battery
(reference vehicle)
Diesel Only
Diesel Only
Assumed 20
miles one-way
Key Specifications of Target & Reference Trucks for I-710
All trucks must be “Full Service” trucks and should be able to serve both I-710 and Alameda St.
Vehicle specs are based on I-710 duty cycle as it is the more demanding duty cycle
The study compares Diesel-Catenary drayage truck with a Diesel
plug-in hybrid with similar zero emission operation capability
CAPEX Assumptions

22© Ricardo plc 2018
Target and Reference Vehicle Cost
Source: Ricardo Analysis
Battery and pantograph are the highest cost differentiators between
Catenary and PHEV trucks; Catenary estimated to be $5,800 cheaper
$110,000 $110,000
$25,000
$8,350
$7,050
$20,000
$143,350
$0
+$5,800
Diesel Plug-in Hybrid
Truck (Reference)
Diesel-Catenary
Truck (Target)
$137,550
$500
Conventional Diesel Truck
Battery
Motor & Power electronics
Pantograph + DC/DC converter • Vehicle costs are build up of baseline diesel truck and hybrid or
catenary components
• Hybrid components and pantograph costs based on high
production volume in 2025
– Battery Pack: $200/kWh
(Based on Ricardo advanced technology commercial vehicle adoption
rate model). Automotive battery prices projections by 2025 are very
aggressive but it is assumed that prices for HD truck industry will
remain somewhat higher due to lower demand than automotive
– Motor/Inverter: $ 23.5/kW
– Pantograph: $20,000
Ricardo assumes both Alameda and I-710 start operation in 2025.
Vehicle volume is 15,500 in total. Thus, pantograph cost is based on
high production volume at $20,000 for both locations
$250
$200
$150
$100
$300
OEMLux Research
Bloomberg
Bloomberg
BNEPUBS
Battery Price Projections ($/kWh) in 2025
Ricardo assumption
Lower bound
CAPEX Assumptions
Pantograph + DC/DC converter cost
High volume (15,000+ vehicles) $ 20,000
Low volume (500 vehicles) $ 50,000
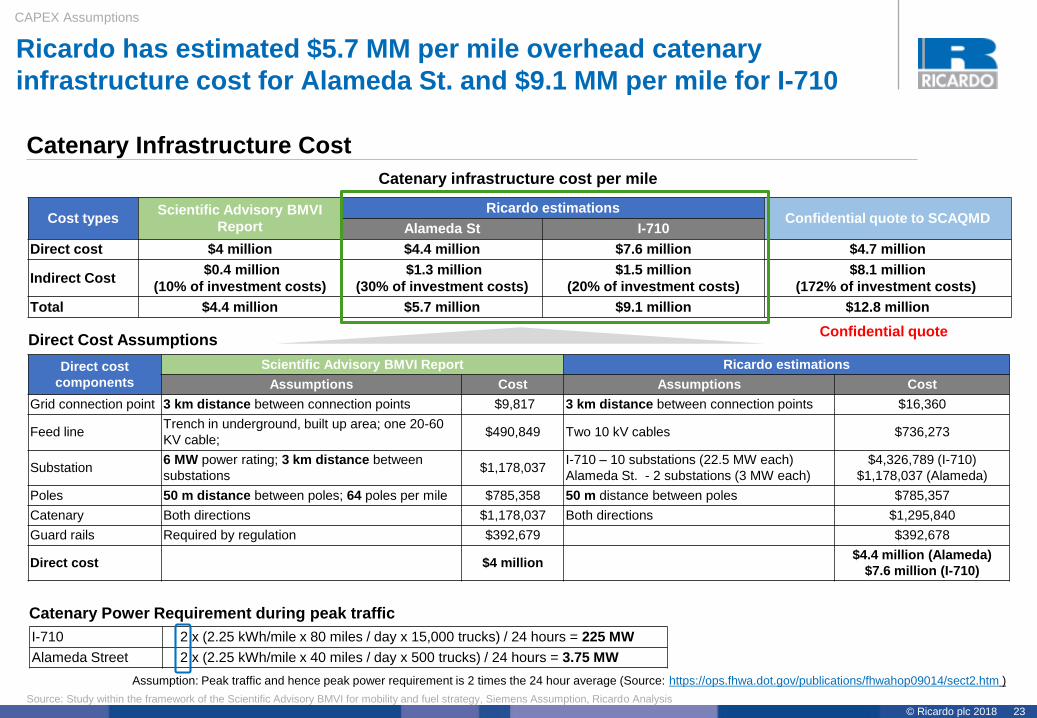
23© Ricardo plc 2018
Catenary Infrastructure Cost
CAPEX Assumptions
Cost typesScientific Advisory BMVI
Report
Ricardo estimationsConfidential quote to SCAQMD
Alameda St I-710
Direct cost $4 million $4.4 million $7.6 million $4.7 million
Indirect Cost$0.4 million
(10% of investment costs)
$1.3 million
(30% of investment costs)
$1.5 million
(20% of investment costs)
$8.1 million
(172% of investment costs)
Total $4.4 million $5.7 million $9.1 million $12.8 million
Direct cost
components
Scientific Advisory BMVI Report Ricardo estimations
Assumptions Cost Assumptions Cost
Grid connection point 3 km distance between connection points $9,817 3 km distance between connection points $16,360
Feed lineTrench in underground, built up area; one 20-60
KV cable;$490,849 Two 10 kV cables $736,273
Substation6 MW power rating; 3 km distance between
substations$1,178,037
I-710 – 10 substations (22.5 MW each)
Alameda St. - 2 substations (3 MW each)
$4,326,789 (I-710)
$1,178,037 (Alameda)
Poles 50 m distance between poles; 64 poles per mile $785,358 50 m distance between poles $785,357
Catenary Both directions $1,178,037 Both directions $1,295,840
Guard rails Required by regulation $392,679 $392,678
Direct cost $4 million$4.4 million (Alameda)
$7.6 million (I-710)
Direct Cost Assumptions
Catenary infrastructure cost per mile
Ricardo has estimated $5.7 MM per mile overhead catenary
infrastructure cost for Alameda St. and $9.1 MM per mile for I-710
Confidential quote
Source: Study within the framework of the Scientific Advisory BMVI for mobility and fuel strategy, Siemens Assumption, Ricardo Analysis
I-710 2 x (2.25 kWh/mile x 80 miles / day x 15,000 trucks) / 24 hours = 225 MW
Alameda Street 2 x (2.25 kWh/mile x 40 miles / day x 500 trucks) / 24 hours = 3.75 MW
Catenary Power Requirement during peak traffic
Assumption: Peak traffic and hence peak power requirement is 2 times the 24 hour average (Source: https://ops.fhwa.dot.gov/publications/fhwahop09014/sect2.htm )

24© Ricardo plc 2018
PHEV Truck Charging Requirement on Alameda St. and I-710
Alameda St. I-710
Number of Trucks in system 500 15,000
Number of round-trips 4 2
Fast charging
Number of fast charging events per day
Fast Charger not needed
15,000
Fast Charger kW
(24 min charging @ 2 C rate)250 kW
Number of fast chargers500
(Assuming traffic in peak hours is twice
as average traffic in a 24 hour window)
Max. System Power Draw 125 MW
Overnight
charging
Number of overnight charging events per day 500 15,000
Charger kW
(5 hrs charging)22 kW 22 kW
Number of overnight chargers250
(One overnight charger per 2 trucks)
7,500(One overnight charger per 2 trucks)
Max. System Power Draw 5.5 MW 165 MW
CAPEX Assumptions
500 fast chargers and 7,500 overnight chargers estimated for trucks
using I-710; only 250 overnight chargers for trucks on Alameda St.
Source: Ricardo Analysis

25© Ricardo plc 2018
Installed cost of charging infrastructure varies significantly; Avg.
cost of $1,000/kW assumed by 2025 based on several data points
Charger Cost
Source: Ricardo Analysis
$400
$0
$600
$1,000
$1,400
$1,800
$2,200
$2,400
$2,000
$1,600
$1,200
$800
$200
250 kW
DC Fast Charger
22 kW
Overnight Slow
Charger
$250,000 $22,000
Current cost of chargers ranging from 20 kW to 300 kW normalized to $/kW
(includes charging unit and installation)
Avg. in 2017
Upper bound for sensitivity analysis
Lower bound for sensitivity analysis
Avg. in 2025
Assumed installed costs in 2025
CAPEX Assumptions
• Level II charger costs have been declining due to increase in demand from light-duty segment
• There is potential for depot and fast charger costs to decline too as volume goes up in future. Although cost of charger units are
typically less than cost of installation, large scale deployment can also help reduce cost of installation.
• Hence, it is assumed that average cost can come down by $200/kW by 2025

26© Ricardo plc 2018
CAPEX Assumptions
Store / Rest Area
400 ft
50 f
t
1,1
50
ft
1,800 ft
Installation of all 500 fast charger units within a single facility is
estimated to require a footprint of 1,800 ft. x 1,150 ft.
Each bay contains 25 chargers
and parking for 25 trucks
Ingress / Egress
Ingress / Egress
Ingress / Egress
Ingress / Egress
• Fast chargers can be
distributed across different
locations or can be within
one facility in the vicinity
of I-710
• The footprint has been
estimated for just one of
the possible layouts
• The actual footprint of
chargers is less than 6 x 6
feet and of less
consequence
• Footprint requirements is
based on number of
parking spaces and space
to manage ingress,
egress and navigation of
several trucks
• Possible siting and layout
of DC fast charging
infrastructure needs to be
studied further
15’x50’ lanes (25 lanes)
150 ft150 ft
Dimensions not to scale
100 ft
150 ft 150 ft
100 ft
Source: Ricardo Analysis
Charging Station
Truck flow patterns and best locations for fast charge around I-710 as well as real estate costs are not in scope of this study

27© Ricardo plc 2018
• Executive Summary
• Sensitivity Analysis
• CAPEX Assumptions
• OPEX Assumptions
Contents

28© Ricardo plc 2018
I-710 Project Zero-Emission Truck Commercialization Study
Source: CALSTART, 2013
Drayage Truck Vehicle Life
Ownership life and operation time
Ricardo Assumptions
OPEX Assumptions
TCO estimated over 10 years of ownership with no residual value;
30 years life for catenary infrastructure and 20 years for chargers
OPEX Parameters Assumptions
Vehicle Ownership length 10 years
Catenary infrastructure life
length
30 years
Charger life length 20 years
Operation days per year 250 days

29© Ricardo plc 2018
Maintenance Components# of action
per year Cost
Inspection catenary system 1 $ 5,000
Re-tensioning catenary system 1 $ 10,000
Replacement overhead wires 1 $ 30,000
Replacement of load carry wire 1 $ 4,000
Replacement isolators catenary system 0.05 $ 833
Replacement load baring arms of the
catenary system 0.03 $ 3,333
Revision of substation 0.0001 $ 5,000
Incidental cost 1 $ 2,000
Indirect cost of maintenance activities 50% of direct cost
Total cost per mile $ 90,250
OPEX Assumptions
Infrastructure Maintenance cost
Ricardo assumption on maintenance schedule
Annual maintenance cost for catenary infrastructure is $90,250/mile
Annual cost for fast and overnight chargers are $2,000 and $420
Siemens assumptions Ricardo
estimationsAlameda St I-710
2% of investment 2% of investment$90,250
per mile$114,518 per mile $171,679 per mile
Catenary infrastructure maintenance cost
Assumed Maintenance
Cost (2025 and beyond)
$2,000 per year
Source: Expert Interviews, Take Charge: A Roadmap to Electric New York City Taxis, Siemens analysis,
Ricardo analysis, Costs Associated With Non-Residential Electric Vehicle Supply Equipment
22 kW overnight charger maintenance costs
$2,000
$1,500
$2,500
$3,500
$3,000
Expert Input
Expert Input
Public report
Public report
Key Maintenance Events
Replacement of liquid cooled charging
cables (Can cost $3,000 - $4,000 a piece
today)
Filtration cleaning every 3 to 6 months
depending on operating environment
Regular inspection every 2 years and
torque down all high power connections
Manual resets for software malfunction
250 kW DC fast charger maintenance costs
Assumed Maintenance
Cost (2025 and beyond)
$420 per year
Key Maintenance Events
Regular inspection and replacement of
cables
No cooling fans and hence no need for
filtration replacement or cleaning
Few power electronics compared to DC
fast charger
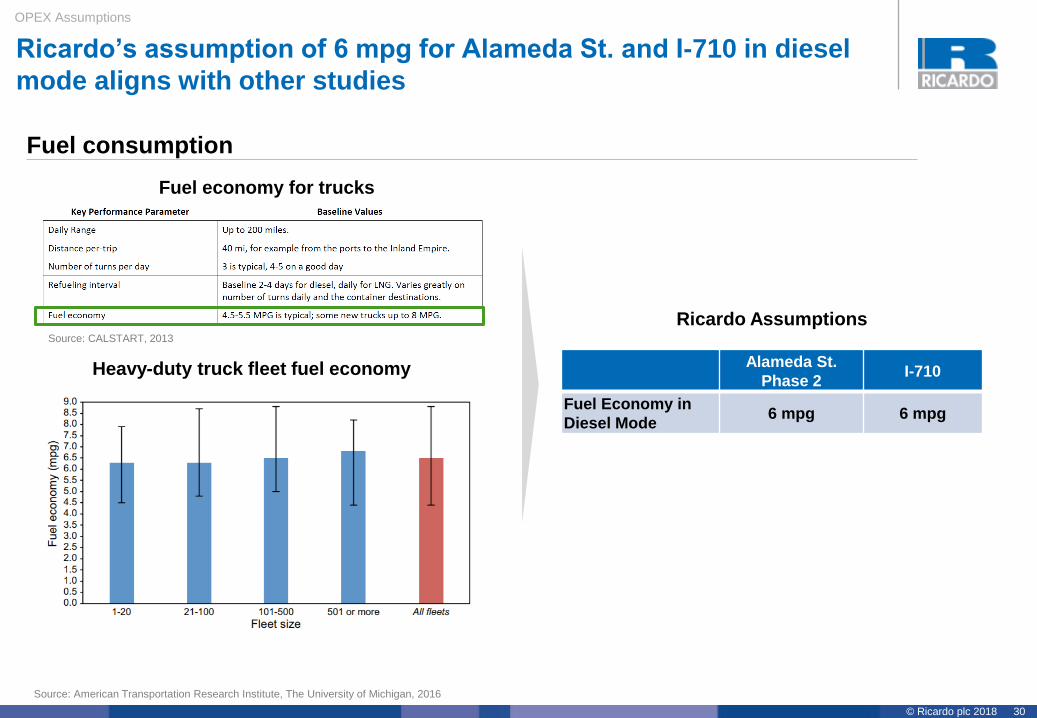
30© Ricardo plc 2018
OPEX Assumptions
Fuel consumption
Source: CALSTART, 2013
Source: American Transportation Research Institute, The University of Michigan, 2016
Heavy-duty truck fleet fuel economy
Ricardo Assumptions
Alameda St.
Phase 2I-710
Fuel Economy in
Diesel Mode6 mpg 6 mpg
Ricardo’s assumption of 6 mpg for Alameda St. and I-710 in diesel
mode aligns with other studies
Fuel economy for trucks

31© Ricardo plc 2018
Fuel price projection
Source: EIA, 2018
$-
$0.50
$1.00
$1.50
$2.00
$2.50
$3.00
$3.50
$4.00
$4.50
2019 2021 2023 2025 2027 2029 2031 2033
$/g
al
Diesel Price Projection(Source: Eia.gov)
US Average
Diesel cost is estimated based on EIA projection; diesel price is
projected to grow steadily
Diesel:
Ricardo used EIA projections on diesel cost during
the vehicle ownership length
OPEX Assumptions

32© Ricardo plc 2018
OPEX Assumptions
Ricardo Assumptions
Electricity demand charges
Electricity cost is build up of energy charges, demand charges and
customer charges; Rates assumed to be flat during ownership
$14.88
$33.24$15.24
$8.12
PHEV
$30.17
$0.05
Catenary
$41.40
$0.05
$23.90
$66.47$38.45
$0.00$16.24
PHEV
$62.52
$0.17
Catenary
$82.71
Energy charge
Demand charge
Customer charger
Alameda Street electricity cost for each truckAssumptions
Catenary Truck Plug-in Hybrid Truck
Alameda St. I-710 Alameda St. I-710
Energy
charges
On-Peak and
Mid-Peak rates
On-Peak and
Mid-Peak ratesOff-Peak rates
Off-Peak rates(Overnight charger)
On-Peak and Mid-
Peak rates(Fast charger)
Demand
charges
Peak demand:
3.7 MW
Peak demand:
225 MW
Peak demand:
5.5 MW
165 MW (overnight charger)
125 MW (fast charger)
Customer
charges1 account 1 account 1 account
100 accounts(Overnight charger)
1 account(Fast charger)
I-710 electricity cost for each truck
Electricity rates (TOU-EV-9)
($ in Thousands)
($ in Thousands)
Charge Types Total Rate
Energy Charge - $/kWh
Summer Season (average) 0.18
Winter Season (average) 0.12
Facilities Related-Demand Charge - $/kW of Billing Demand/Meter/Month
11.27
Customer Charge - $/Meter/Month
212.25
Source: Southern California Edison, 2018
Discussions with Southern California Edison indicated that required power for catenary or fast charge could be provided with appropriate planning
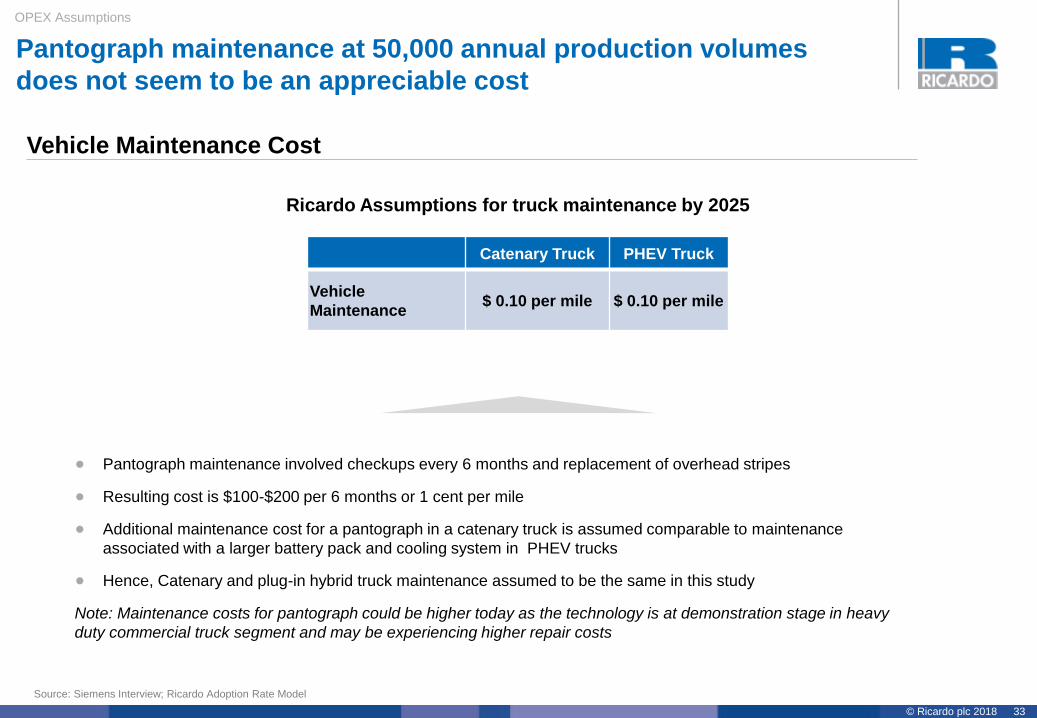
33© Ricardo plc 2018
OPEX Assumptions
Vehicle Maintenance Cost
Source: Siemens Interview; Ricardo Adoption Rate Model
Ricardo Assumptions for truck maintenance by 2025
Catenary Truck PHEV Truck
Vehicle
Maintenance$ 0.10 per mile $ 0.10 per mile
Pantograph maintenance at 50,000 annual production volumes
does not seem to be an appreciable cost
• Pantograph maintenance involved checkups every 6 months and replacement of overhead stripes
• Resulting cost is $100-$200 per 6 months or 1 cent per mile
• Additional maintenance cost for a pantograph in a catenary truck is assumed comparable to maintenance
associated with a larger battery pack and cooling system in PHEV trucks
• Hence, Catenary and plug-in hybrid truck maintenance assumed to be the same in this study
Note: Maintenance costs for pantograph could be higher today as the technology is at demonstration stage in heavy
duty commercial truck segment and may be experiencing higher repair costs
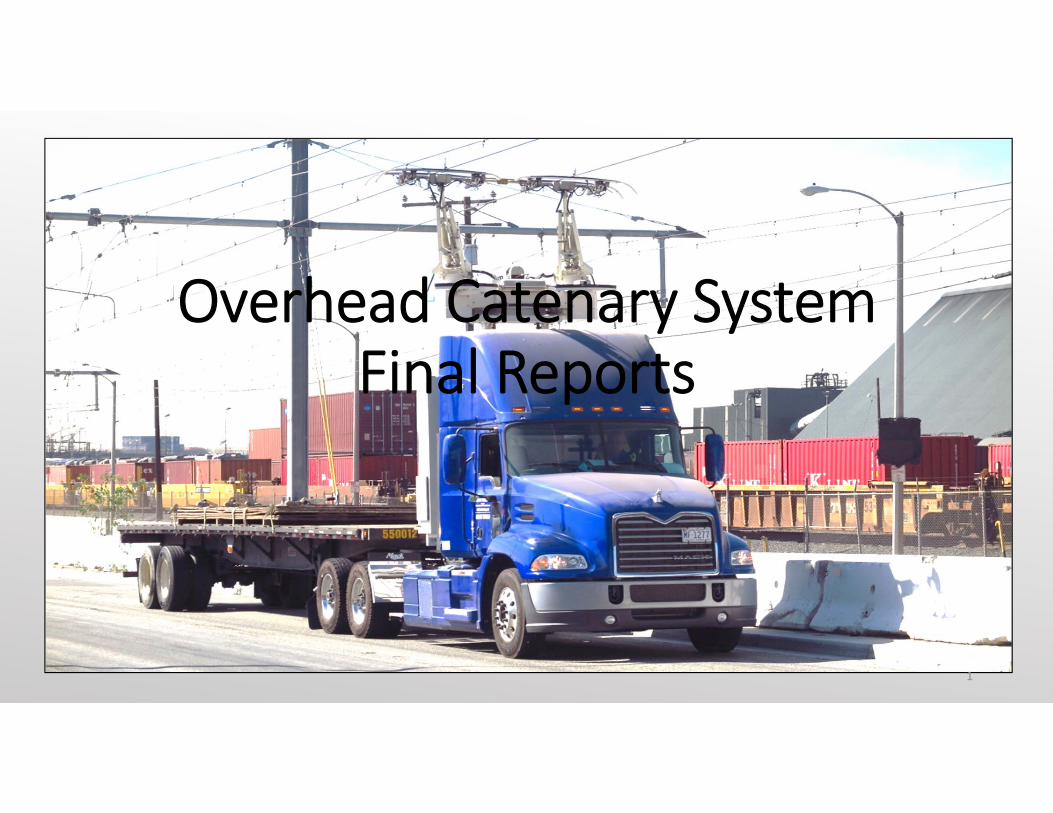
Overhead Catenary System Final Reports
1

Agenda
• Summary of five key reports:• Siemens Final Report• Owner Operator Survey• SCE Grid Impact Report• Siemens eHighway Business Case• Total Cost of Ownership Study
• Open discussion on reports• Open discussion on the future of OCS technology
2

Siemens Final Report• The goal: to promote zero emission goods movement technologies
and demonstrate a viable wayside power solution• Constructed and demonstrated eHighway infrastructure
• Significant construction challenges given limited discussion• Demonstrated 3 trucks – Battery electric, CNG Hybrid, Diesel Hybrid
• Vehicle challenges were discussed in detail• Conclusion: Alameda Street is a successful proof of concept in a
representative application environment• Recommendation: Technology improvements and lower costs are
needed to impact economic feasibility
3

Owner Operator Survey• Survey of three entities to assess interest in management of a potential
OCS system: SCE, LA Metro, and Cofiroute USA • The three organizations were open to serving a role in the development
and/or operation of an OCS• Issues: adoption of the OCS by private operators, competition with other
technologies, truck costs too high for fleets• SCE could potentially construct the system but would require approval
from the CPUC• LA Metro discussed the possibility of linking incentive funds for catenary‐
enabled trucks to commitments to use the system • Cofiroute’s services are currently limited to operation and maintenance of
tolling system
4

SCE Grid Impact Report
• In parallel with the OCS demonstration SCE performed a grid system impact study to understand potential electrification and expansion of the OCS technology
• The system was evaluated to ensure that the power supply system could operate safely under typical characteristics of power system without having an adverse impact on the grid
• The eHighway system was compliant with IEEE 519 standards based on the data, and operated safely. There were no indications of adverse impact to grid voltage.
5
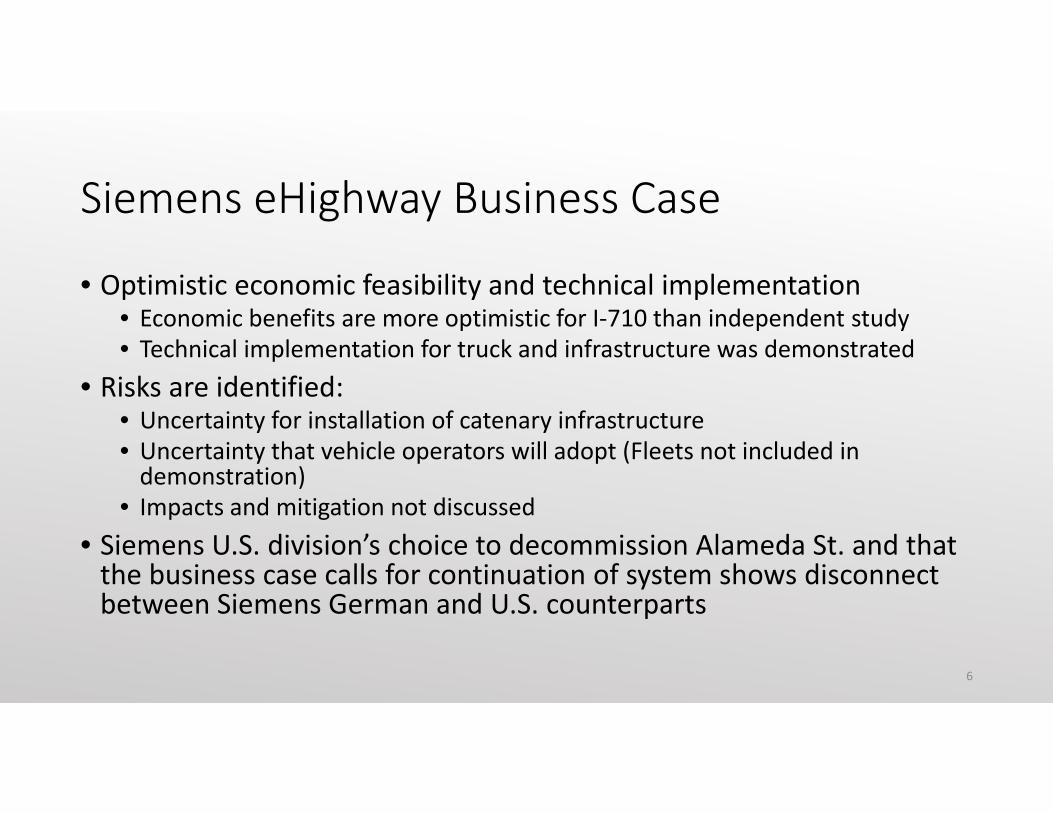
Siemens eHighway Business Case
• Optimistic economic feasibility and technical implementation• Economic benefits are more optimistic for I‐710 than independent study• Technical implementation for truck and infrastructure was demonstrated
• Risks are identified:• Uncertainty for installation of catenary infrastructure• Uncertainty that vehicle operators will adopt (Fleets not included in
demonstration)• Impacts and mitigation not discussed
• Siemens U.S. division’s choice to decommission Alameda St. and that the business case calls for continuation of system shows disconnect between Siemens German and U.S. counterparts
6
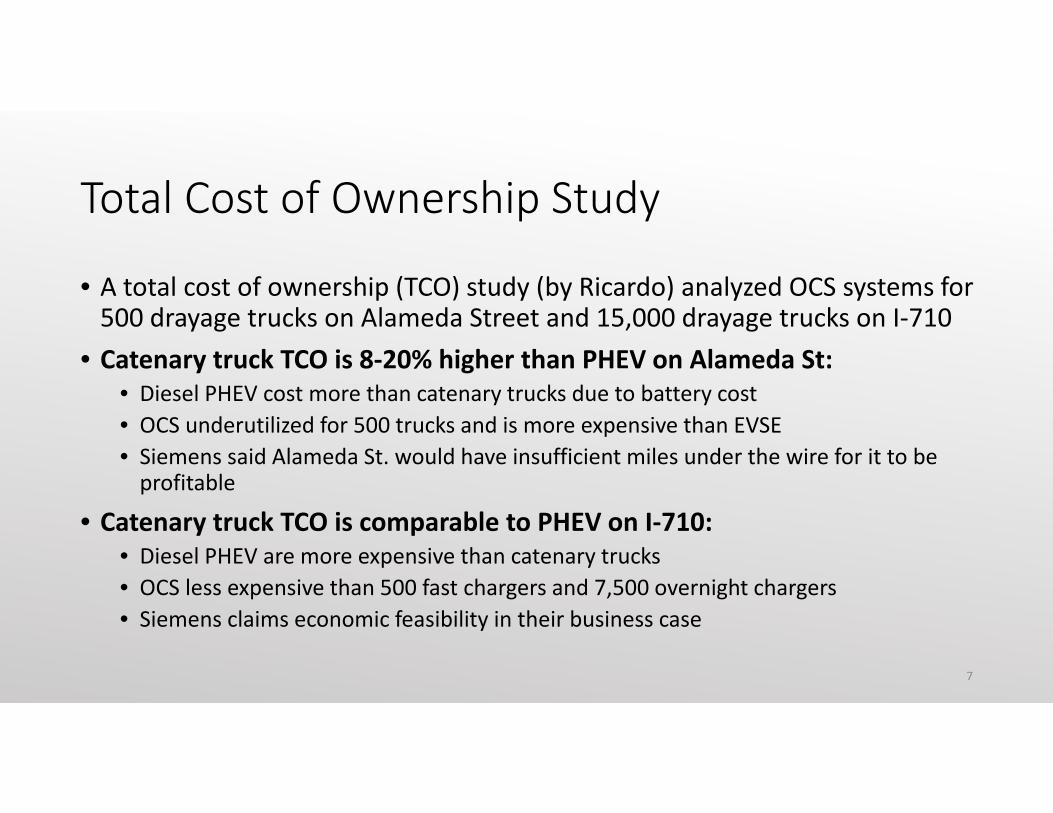
Total Cost of Ownership Study
• A total cost of ownership (TCO) study (by Ricardo) analyzed OCS systems for 500 drayage trucks on Alameda Street and 15,000 drayage trucks on I‐710
• Catenary truck TCO is 8‐20% higher than PHEV on Alameda St:• Diesel PHEV cost more than catenary trucks due to battery cost• OCS underutilized for 500 trucks and is more expensive than EVSE• Siemens said Alameda St. would have insufficient miles under the wire for it to be
profitable
• Catenary truck TCO is comparable to PHEV on I‐710:• Diesel PHEV are more expensive than catenary trucks• OCS less expensive than 500 fast chargers and 7,500 overnight chargers• Siemens claims economic feasibility in their business case
7

Discussions ‐ Questions
8