financial statements 2017 - marimekko...margin than in the previous year, and reduced depreciation...
TRANSCRIPT
Financial Statements 2017

1

2
3
CONTENTS
4 From the President and CEO
6 2017 in a nutshell
7 Strategy
9 Report of the Board of Directors and
the financial statements for the financial period
from 1 January to 31 December 2017
9 Report of the Board of Directors
16 Proposal for the distribution of profit
18 Consolidated financial statements, IFRS
18 Consolidated income statement
19 Consolidated balance sheet
20 Consolidated cash flow statement
21 Consolidated statement of changes in shareholders’ equity
22 Notes to the consolidated financial statements
44 Parent company financial statements, FAS
44 Parent company income statement
45 Parent company balance sheet
46 Parent company cash flow statement
47 Notes to the parent company financial statements
56 Group key figures1
58 Share and shareholders1
62 Signatures to the financial statements and
the report of the Board of Directors
63 Auditor’s report
69 Corporate Governance
78 Board of Directors and management
80 Information for shareholders
1 Part of the report of the Board of Directors.
Colour and joy for everyday life
Marimekko is a Finnish lifestyle design
company whose original prints and
colours have brought joy to people’s
everyday lives since 1951. Our product
portfolio includes high-quality clothing,
bags and accessories as well as home
décor items ranging from textiles to
tableware. Timelessness, quality and
functionality are the cornerstones on
which our recognisable design has
always been built.
When Marimekko was founded, its
unparalleled printed fabrics gave it a
strong and unique identity. Even today,
we have our own printing factory in
Helsinki that produces around a million
metres of fabric every year. The printing
mill serves both as a factory and as
an innovative hub for our design and
product development team.
Our products are sold in about 40
countries. In 2017, brand sales of the
products worldwide amounted to 193
million euros and our net sales were 102
million euros. Roughly 160 Marimekko
stores serve customers around the
globe. Our key markets are Northern
Europe, North America and the Asia-
Pacific region. We employ about 450
people. The Marimekko share is quoted
on Nasdaq Helsinki Ltd.
© Marimekko CorporationPuusepänkatu 4 00880 HelsinkiFinland
Tel. +358 9 758 [email protected]
4
From the President and CEO
Marimekko has behind it an eventful
year filled with work. I am particularly
pleased that we succeeded in 2017
in reinforcing our international
competitiveness and improving our
profitability in line with our objectives.
Our net sales grew by 3 percent to
EUR 102.3 million (99.6) and our
operating profit rose to EUR 8.4 million
(5.2). Our comparable operating profit
grew by 41 percent to EUR 8.6 million
(6.1). Also, EBITDA, cash flow from
operating activities and equity ratio
improved. A successful holiday season
crowned the closing months of the
year – as is typical in our sector, the
proportion of holiday sales is particularly
significant in the fourth quarter.
Our results were boosted by growth
in net sales, generated primarily by
retail sales in Finland and Australia,
international wholesale sales, and
royalties in the Asia-Pacific region. In
addition, our relative sales margin was
an improvement on the previous year;
this was thanks, among other factors,
to growth in regular-priced sales. Our
operating profit was also improved by
reduced depreciation and personnel
expenses. A drag was exerted on results
by a decline in wholesale sales in
Finland. This was due to the fact that
wholesale sales for the second half of
the previous year included nonrecurring
promotional deliveries, of which there
were none in 2017.
All in all, I think we can be pleased
with the steps we have recently taken.
Our financial trend in 2017 is an
indication that our long-term work has
begun to bear fruit. We are well poised
to continue as, in the years ahead, we
seek distinctly stronger growth than
before. Expanding the customer base,
enhancing operational efficiency and
utilising the new opportunities afforded
by digitisation will play a central role in
this work. The key drivers of our growth
will be e-commerce and partner-led
retail in Asia.
Digitisation is currently the biggest
of the revolutionary megatrends in our
sector, and the role of online business
in our internationalisation strategy
is constantly growing. Of central
importance to our online business are
digital transformation management as
well as the development of omnichannel
operations and related digital
solutions. In 2017, we extended our
own e-commerce to 17 new countries
in Europe and today our online store
already reaches customers in 30
countries.
The building of a new direction for
our collections and our brand continued
in 2017. Our design and product
development team focused in particular
on revamping our ready-to-wear
collections. Progress was also made in
refining our product range and pricing
strategies as well as in enhancing the
efficiency of our procurement chain.
This year, we are continuing to develop
a product portfolio that will appeal to an
even broader customer base. Our design
team was strengthened in January
2018 when Satu Maaranen took up her
duties as head designer of Marimekko’s
ready-to-wear, bags and accessories.
Her highly international profile and
experience and – above all – her fresh
and modern perspective were clinching
factors in her appointment.
It is crucial to raise our profile
through means such as social media,
PR and brand partnerships as we seek
a broader international customer base.
Among our most important efforts
every year is the presentation of
our ready-to-wear collection at Paris
Fashion Week, which is one of the top
global events in our sector. In October
2017, we were happy that our bold
prints and colours were also shown
in Paris in Junya Watanabe’s spring/
summer 2018 collection for Comme des
Garçons. In November and December,
we gained positive visibility in Japan
when two notable Tokyo galleries
opened Marimekko Spirit exhibitions.
In November, we also reported the start
of cooperation between Marimekko and
the Finnish fibre technology company
Spinnova on the development and
commercialisation of new, wood-based
textiles. In addition, as a result of
international collaboration, Marimekko-
patterned accessories for Microsoft’s
Surface devices hit the market.
I think it is great that Marimekko’s
net sales topped the 100-million-euro
mark in the hundredth year of Finland’s
independence. It was gratifying to
see in how many and such different,
creative ways and events the Finns
celebrated their country together.

5
”Our hard work was rewarded and we
succeeded in improving on the previous
year as measured by several indicators.”
Also here at Marimekko, our theme
for the centenary year – bold patterns
for Finland – was strongly grounded
in doing things together. One of our
partnership events was the international
Marimekko Designathon competition,
which we arranged together with Slush,
Europe’s leading event for technology
and start-ups, and Junction, the largest
hackathon in Europe.
The year 2018 also promises a
wide variety of interesting events.
For example, we will be celebrating
the 50th anniversary of the striped
Tasaraita pattern. This Marimekko
classic and symbol of equality was
designed by Annika Rimala in 1968 for
everyone regardless of age or gender.
Timelessness is one of the foundation
stones of our design philosophy and the
uninterrupted popularity of Tasaraita
expresses this superbly.
This year began with a splash when
we announced in January two limited
edition collaboration collections, one
with the Japanese clothing brand Uniqlo
and the other with the cosmetics brand
Clinique. Both are globally renowned
and prestigious operators. Partnerships
like this are of great value to us as they
play a significant part in underpinning
our international profile and in reaching
new target groups.
Tiina Alahuhta-Kasko
6
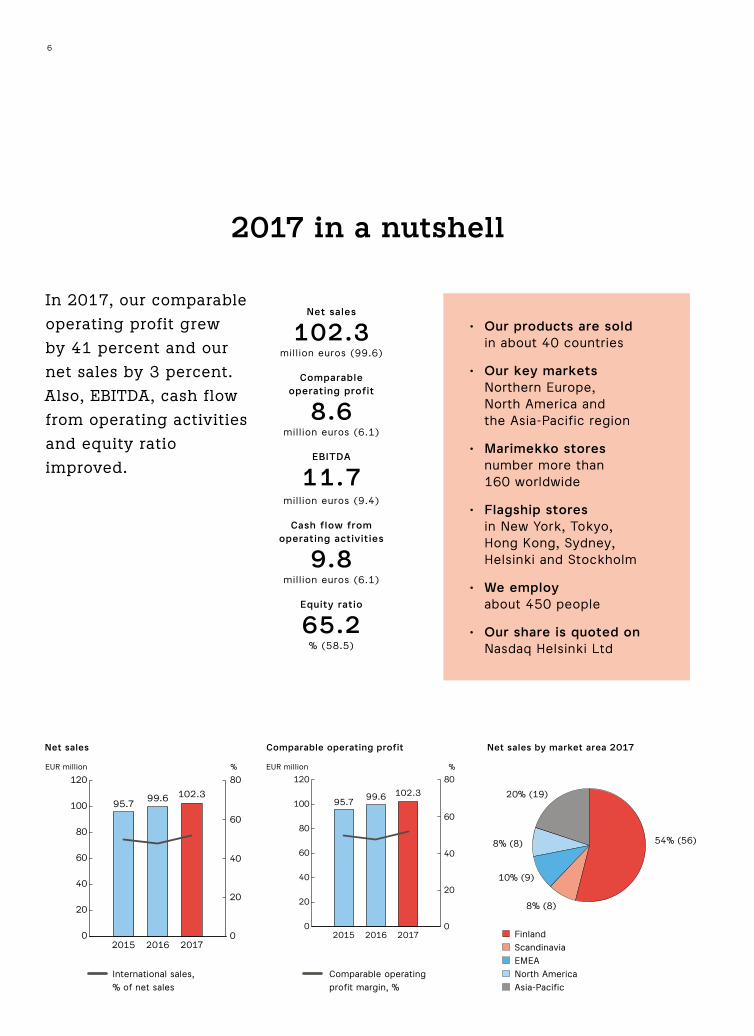
2017 in a nutshell
Net sales by market area 2017
54% (56)
8% (8)
FinlandScandinaviaEMEANorth AmericaAsia-Pacific
10% (9)
8% (8)
20% (19)
Net sales
0
20
40
60
80
100
120 80
60
40
20
02015
95.799.6 102.3
2016 2017
International sales, % of net sales
EUR million %
Comparable operating profit
0
20
40
60
80
100
120 80
60
40
20
02015
95.799.6 102.3
2016 2017
Comparable operating profit margin, %
EUR million %
• Our products are sold in about 40 countries
• Our key markets Northern Europe, North America and the Asia-Pacific region
• Marimekko stores number more than 160 worldwide
• Flagship stores in New York, Tokyo, Hong Kong, Sydney, Helsinki and Stockholm
• We employ about 450 people
• Our share is quoted on Nasdaq Helsinki Ltd
Net sales
102.3mill ion euros (99.6)
Comparable operating profit
8.6mill ion euros (6.1)
EBITDA
11.7mill ion euros (9.4)
Cash flow from operating activities
9.8mill ion euros (6.1)
Equity ratio
65.2% (58.5)
In 2017, our comparable
operating profit grew
by 41 percent and our
net sales by 3 percent.
Also, EBITDA, cash flow
from operating activities
and equity ratio
improved.

7
Strategy
For details about the focus areas of our strategy, please visit our website company.marimekko.com > About Marimekko > Strategy & financial goals
Our vision is to be the world’s most inspiring lifestyle design
brand renowned for bold prints.
Marimekko has a long-term international growth strategy.
In recent years, we have focused in particular on enhancing
our profitability and international competitiveness.
The main objective of our strategy for 2018–2022 is to
build a broader target audience and grow. To reach this
goal, we have defined five strategic success factors.

8
9
¹ Brand sales are given as an alternative non-IFRS key figure. Brand sales, consisting of estimated sales of Marimekko products at consumer prices, are calculated by adding together the company’s own retail net sales and the estimated retail value of Marimekko products sold by other retailers. The estimate, based on Marimekko’s realised wholesale sales and royalty income, is unofficial and does not include VAT. The key figure is not audited. The calculation method for 2017 figures has been restated for the coefficients used; to maintain comparability, the change also applies to the figures for 2016.
Report of the Board of Directors
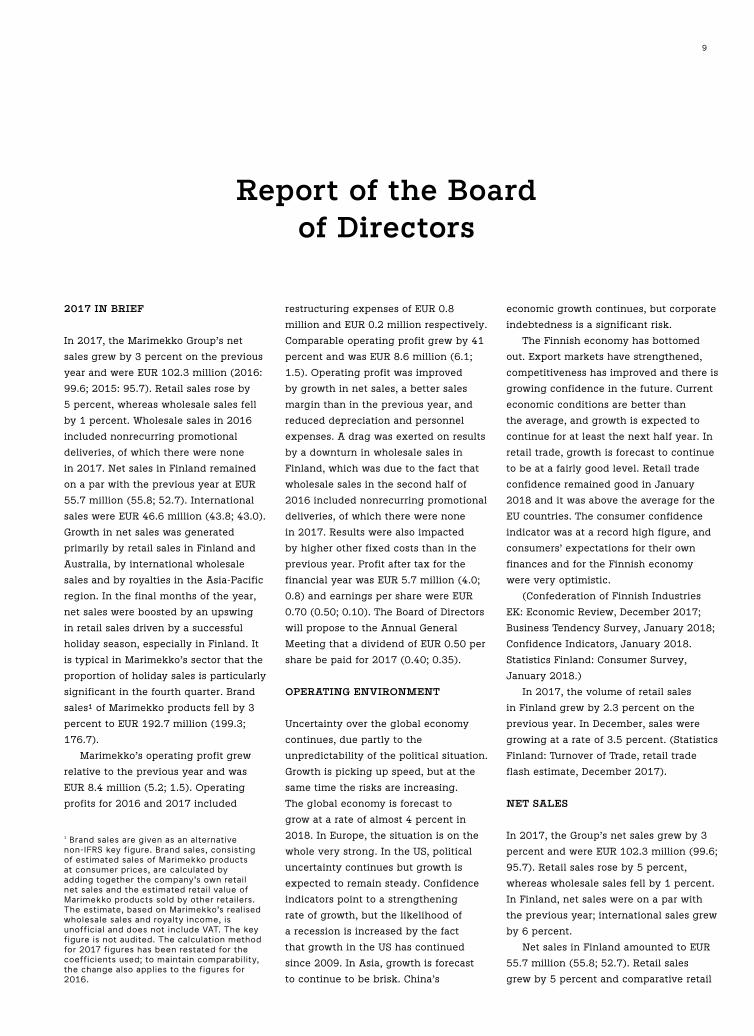
2017 IN BRIEF
In 2017, the Marimekko Group’s net
sales grew by 3 percent on the previous
year and were EUR 102.3 million (2016:
99.6; 2015: 95.7). Retail sales rose by
5 percent, whereas wholesale sales fell
by 1 percent. Wholesale sales in 2016
included nonrecurring promotional
deliveries, of which there were none
in 2017. Net sales in Finland remained
on a par with the previous year at EUR
55.7 million (55.8; 52.7). International
sales were EUR 46.6 million (43.8; 43.0).
Growth in net sales was generated
primarily by retail sales in Finland and
Australia, by international wholesale
sales and by royalties in the Asia-Pacific
region. In the final months of the year,
net sales were boosted by an upswing
in retail sales driven by a successful
holiday season, especially in Finland. It
is typical in Marimekko’s sector that the
proportion of holiday sales is particularly
significant in the fourth quarter. Brand
sales¹ of Marimekko products fell by 3
percent to EUR 192.7 million (199.3;
176.7).
Marimekko’s operating profit grew
relative to the previous year and was
EUR 8.4 million (5.2; 1.5). Operating
profits for 2016 and 2017 included
restructuring expenses of EUR 0.8
million and EUR 0.2 million respectively.
Comparable operating profit grew by 41
percent and was EUR 8.6 million (6.1;
1.5). Operating profit was improved
by growth in net sales, a better sales
margin than in the previous year, and
reduced depreciation and personnel
expenses. A drag was exerted on results
by a downturn in wholesale sales in
Finland, which was due to the fact that
wholesale sales in the second half of
2016 included nonrecurring promotional
deliveries, of which there were none
in 2017. Results were also impacted
by higher other fixed costs than in the
previous year. Profit after tax for the
financial year was EUR 5.7 million (4.0;
0.8) and earnings per share were EUR
0.70 (0.50; 0.10). The Board of Directors
will propose to the Annual General
Meeting that a dividend of EUR 0.50 per
share be paid for 2017 (0.40; 0.35).
OPERATING ENVIRONMENT
Uncertainty over the global economy
continues, due partly to the
unpredictability of the political situation.
Growth is picking up speed, but at the
same time the risks are increasing.
The global economy is forecast to
grow at a rate of almost 4 percent in
2018. In Europe, the situation is on the
whole very strong. In the US, political
uncertainty continues but growth is
expected to remain steady. Confidence
indicators point to a strengthening
rate of growth, but the likelihood of
a recession is increased by the fact
that growth in the US has continued
since 2009. In Asia, growth is forecast
to continue to be brisk. China’s
economic growth continues, but corporate
indebtedness is a significant risk.
The Finnish economy has bottomed
out. Export markets have strengthened,
competitiveness has improved and there is
growing confidence in the future. Current
economic conditions are better than
the average, and growth is expected to
continue for at least the next half year. In
retail trade, growth is forecast to continue
to be at a fairly good level. Retail trade
confidence remained good in January
2018 and it was above the average for the
EU countries. The consumer confidence
indicator was at a record high figure, and
consumers’ expectations for their own
finances and for the Finnish economy
were very optimistic.
(Confederation of Finnish Industries
EK: Economic Review, December 2017;
Business Tendency Survey, January 2018;
Confidence Indicators, January 2018.
Statistics Finland: Consumer Survey,
January 2018.)
In 2017, the volume of retail sales
in Finland grew by 2.3 percent on the
previous year. In December, sales were
growing at a rate of 3.5 percent. (Statistics
Finland: Turnover of Trade, retail trade
flash estimate, December 2017).
NET SALES
In 2017, the Group’s net sales grew by 3
percent and were EUR 102.3 million (99.6;
95.7). Retail sales rose by 5 percent,
whereas wholesale sales fell by 1 percent.
In Finland, net sales were on a par with
the previous year; international sales grew
by 6 percent.
Net sales in Finland amounted to EUR
55.7 million (55.8; 52.7). Retail sales
grew by 5 percent and comparative retail

10
Net sales by market area (EUR million) 2017 2016 Change, %
Finland 55.7 55.8 0
Retail sales 40.8 38.9 5
Wholesale sales 14.6 16.6 -12
Royalties 0.2 0.3 -22
Scandinavia 8.5 7.8 8
Retail sales 5.1 5.0 2
Wholesale sales 3.4 2.9 18
Royalties - -
EMEA 9.7 9.2 5
Retail sales 1.1 1.1 5
Wholesale sales 8.3 7.8 6
Royalties 0.3 0.3 -1
North America 8.3 7.9 4
Retail sales 5.3 5.2 1
Wholesale sales 2.5 2.2 14
Royalties 0.5 0.5 2
Asia-Pacific 20.2 18.8 7
Retail sales 4.0 3.5 16
Wholesale sales 15.5 15.4 1
Royalties 0.6 -
International sales, total 46.6 43.8 6
Retail sales 15.5 14.8 5
Wholesale sales 29.7 28.3 5
Royalties 1.4 0.8 75
Total 102.3 99.6 3
Retail sales 56.3 53.6 5
Wholesale sales 44.4 44.9 -1
Royalties 1.6 1.1 52
All f igures in the table have been individually rounded to millions of euros, so there may be rounding differences in the totals. The change percentages have been calculated on exact f igures before rounding.
sales² by 4 percent. The rise in sales
was partly attributable to growth in
regular-priced sales. Wholesale sales
fell by 12 percent. The decline was due
to the fact that wholesale sales in the
third and fourth quarters of the previous
year included nonrecurring promotional
deliveries, of which there were none
in 2017. A successful holiday season
boosted both retail and wholesale sales
in the last quarter.
In the company’s second-biggest
market, the Asia-Pacific region, net sales
grew by 7 percent to EUR 20.2 million
(18.8; 17.7). Wholesale sales rose by
1 percent. In the market area’s main
country, Japan, sales grew by 4 percent;
the growth was due to royalties received
under a new licensing agreement in the
third quarter. Retail sales (Australia)
rose by 16 percent due to a clearance
promotion carried out in the second
quarter and the additional sales of a
store opened in November 2016.
FINANCIAL RESULT
In 2017, the Group’s operating profit
improved on the previous year and was
EUR 8.4 million (5.2; 1.5). Operating
profits for 2016 and 2017 included
restructuring expenses of EUR 0.8
million and EUR 0.2 million respectively.
Comparable operating profit for 2017
was EUR 8.6 million (6.1; 1.5). Results
were improved by growth in net sales,
which was generated primarily by
retail sales in Finland and Australia,
international wholesale sales, and
royalties in the Asia-Pacific region.
Furthermore, relative sales margin
was an improvement on the previous
year; this was thanks, among other
Report of the Board of Directors
2 Includes both bricks-and-mortar and online sales.

11
factors, to growth in regular-priced
sales. Operating profit was also boosted
by lower depreciation and personnel
expenses. A drag was exerted on results
by a downturn in wholesale sales in
Finland. This was due to the fact that
wholesale sales in the third and fourth
quarters of the previous year included
nonrecurring promotional deliveries, of
which there were none in 2017. Results
were also impacted by higher other
fixed costs than in the previous year.
Marketing expenses for the year
2017 were EUR 4.5 million (4.4; 5.1), or
4 percent of the Group’s net sales (4; 5).
The Group’s depreciation and
impairments totalled EUR 3.3 million
(4.1; 4.5), or 3 percent of net sales
(4; 5).
Operating profit margin was 8.2
percent (5.3; 1.6) and comparable
operating profit margin was 8.4 percent
(6.1; 1.6).
Net financial expenses were EUR
1.2 million (0.1; 0.2), or 1 percent of
net sales (0; 0). Foreign exchange
changes recorded in net financial items
amounted to EUR -1.0 million (0.1; 0.0).
Result for 2017 before taxes was
EUR 7.1 million (5.2; 1.3). Result after
taxes was EUR 5.7 million (4.0; 0.8) and
earnings per share were EUR 0.70 (0.50;
0.10).
BALANCE SHEET
The consolidated balance sheet total
as of 31 December 2017 was EUR 47.1
million (48.5; 46.1). Equity attributable
to the equity holders of the parent
company was EUR 30.7 million (28.3;
27.1), or EUR 3.79 per share (3.50;
3.35).
Non-current assets at the end of
2017 stood at EUR 13.3 million (15.6;
17.4).
At the end of the year, net working
capital was EUR 14.5 million (15.3;
13.0). Inventories were EUR 20.9 million
(21.4; 18.5).
CASH FLOW AND FINANCING
In 2017, cash flow from operating
activities was EUR 9.8 million (6.1; 6.3),
or EUR 1.21 per share (0.76; 0.78). Cash
flow before cash flow from financing
activities was EUR 8.8 million (3.6; 3.1).
The Group’s financial liabilities at the
end of the year were EUR 3.3 million
(6.0; 7.3).
At the end of the year, the Group’s
cash and cash equivalents amounted to
EUR 6.2 million (3.5; 4.2). In addition,
the Group had unused committed long-
and short-term credit lines of EUR 18.0
million (14.4; 15.2).
The Group’s equity ratio at the end
of 2017 was 65.2 percent (58.5; 59.0).
Gearing was -9.4 percent (8.8; 11.3).
INVESTMENTS
The Group’s gross investments were EUR
1.2 million (2.7; 3.6), or 1 percent of
net sales (3; 4). Most of the investments
were devoted to the company’s IT
systems and store premises.
STORE NETWORK
In 2017, the main thrust in expanding
the Marimekko store network continued
to be on openings of retailer-owned
Marimekko stores. The company
achieved its aim of opening around
10–20 new Marimekko stores and
shop-in-shops.
In the course of the year, a total
of 12 stores were opened, one of
which was company-owned, four were
retailer-owned Marimekko stores,
and seven were shop-in-shops. Of the
stores opened, seven were located
in the company’s growth market in
the Asia-Pacific region. Marimekko’s
own e-commerce was extended to 17
new countries in Europe; at the end of
the year, the company’s online store
reached customers in 30 countries.
A total of 10 Marimekko stores and
shop-in-shops were closed in 2017.
The seven shop-in-shops located in El
Palacio de Hierro’s department stores
in Mexico were closed due to changes
in the stores’ assortment concept.
The impact of these shop closures on
wholesale sales in North America was
very small.
SHARES AND SHAREHOLDERS
Shares and share capital
Marimekko Corporation’s share is
quoted in the Consumer Goods sector of
Nasdaq Helsinki Ltd. The company has
one series of shares, each conferring
the same voting rights to their holders.
At the end of the financial year, the
company’s fully paid-up share capital,
as recorded in the Trade Register,
amounted to EUR 8,040,000 and the
number of shares totalled 8,089,610.
Shareholdings
According to the book-entry register,
Marimekko had 7,575 shareholders
at the end of 2017 (7,270; 7,084). Of
the shares, 11.4 percent were owned
by nominee-registered or non-Finnish
holders (10.5; 20.1). The breakdown of
Finnish ownership by owner group was
as follows: households 40.0 percent,
non-financial corporations and housing
corporations 32.6 percent, general
government 10.2 percent, financial and
insurance corporations 3.9 percent, and
non-profit institutions 1.9 percent.
At the end of the year, the number
of shares owned either directly or
indirectly by members of the Board
Report of the Board of Directors

12
Net sales (EUR million) Operating profit (EUR million) Operating profit margin (%)
* Operating profits for 2016 and 2017 included restructuring expenses of EUR 0.8 million and EUR 0.2 million respectively.
Average personnelEquity ratio (%)
Report of the Board of Directors
Result after taxes (EUR million) Gross investments (EUR million)
0
1
2
3
4
5
6
2015
0.8
4.0
5.7
2016 20170
1
2
3
4
2015
3.6
2.7
1.2
2016 2017
0
20
40
60
80
100
120
2015
95.799.6 102.3
2016 20170
2
4
6
8
10
2015
1.5
8.4*
5.2*
2016 20170
2
4
6
8
10
2015
1.6
8.2*
5.3*
2016 2017
0
100
200
300
400
500
2015
460441 425
2016 20170
20
40
60
80
2015
59.0 58.565.2
2016 2017
13
of Directors and the Management
Group of the company was 1,335,295,
representing 16.5 percent of the number
and voting rights of the company’s
shares.
Marimekko has neither made nor is
aware of any shareholder agreements
concerning the company’s shares or
other commitments agreeing on the
company’s ownership or the use
of voting rights. Information on
the largest shareholders can be
found on the company’s website at
company.marimekko.com under
Investors/Share information/
Shareholders. Further details of
shareholdings are available on pages
58–61 of these financial statements.
Share trading and the company’s
market capitalisation
In 2017, a total of 796,964 Marimekko
shares were traded (2,112,657;
1,062,373), representing 9.9 percent
of the shares outstanding (26.1; 13.1).
The total value of the share turnover
was EUR 8,042,982. The lowest price
of the Marimekko share was EUR 9.10,
the highest was EUR 10.99 and the
average price was EUR 10.09. At the
end of the year, the closing price of the
share was EUR 10.10. The company’s
market capitalisation on 31 December
2017 was EUR 81,705,061 (76,689,503;
67,143,763).
Flaggings
Marimekko did not receive any flagging
notifications in 2017.
Authorisations
At the end of the year, the Board of
Directors had no valid authorisations
to carry out share issues or to issue
convertible bonds or bonds with
warrants, or to acquire or surrender
Marimekko shares. Marimekko
Corporation holds none of its own
shares.
PERSONNEL
In 2017, the number of employees
averaged 425 (441; 460). At the end of
the year, the Group had 446 employees
(431; 476), of whom 122 (111; 126)
worked outside Finland. Salaries,
wages and bonuses paid to personnel
amounted to EUR 19.4 million (19.8;
20.4).
During the year, personnel work
focused on assessing the efficiency and
needs of different HR practices with
an eye to the future of an even more
international Marimekko. The emphasis
was on developing managerial work as
well as planning and implementing a
new performance management model.
The model was piloted in Marimekko’s
own retail stores. A comprehensive
survey was conducted to measure
employee job satisfaction and
engagement. The results of the survey
were reviewed collectively, and every
team held a workshop to enhance the
team’s operations. Also, key competence
descriptions were defined during 2017
in order to harmonise the company’s
operations in different countries. All
these measures were aimed at building
a more consistent and stronger basis for
Marimekko’s international operations,
the cornerstones of which are
committed and skilled personnel, and
effective practices.
In 2017, the turnover of employees
leaving was 20.8 percent (16.1; 9.2.).
SUSTAINABILITY
Sustainability management at
Marimekko is part of everyday
leadership and operational
development. Among the principal
themes of Marimekko’s sustainability
strategy extending to the year 2020
are sustainable and timeless design,
engagement of stakeholders, a
responsible supply chain, resource
efficiency, and caring for the
environment and personnel. In the
next few years, the company will focus
on improving the transparency of the
supply chain as well as increasing the
proportion of more sustainably produced
cotton and other more sustainable raw
materials in its products.
The company has a Code of Conduct
specifying the way of working for
all employees and management.
Marimekko’s supplier partners also have
to commit themselves to compliance
with the guidelines drawn up for them,
which among other things include a
prohibition on child labour and forced
labour.
Marimekko reports in greater
detail on its sustainability work and
on issues of the environment, health
and safety in a separate sustainability
review issued annually. The report can
be read on the company’s website at
company.marimekko.com under
Sustainability/Sustainability review.
The next review will be published in
summer 2018.
Non-financial information
As Marimekko has less than 500
employees, the company is not required
to prepare a non-financial information
statement.
THE ENVIRONMENT, HEALTH AND SAFETY
The environment
Care for the environment is one of the
cornerstones of Marimekko’s business.
Subcontractors are also contractually
obligated to commit themselves
Report of the Board of Directors

14
to shouldering their environmental
responsibilities. The environmental
aspects of the company’s in-house
manufacturing are related to the
operations of the textile printing factory
in Herttoniemi, Helsinki. Marimekko
seeks to reduce the environmental
impacts of its operations, to cut its
carbon footprint and to improve its
resource efficiency, among other means,
by using renewable energy sources
and optimising logistics, by decreasing
water consumption, and by minimising,
recycling and repurposing waste.
Health and safety
Safety and well-being in the workplace
are monitored and enhanced at
Marimekko in collaboration with
human resources, the workplace safety
committee and occupational healthcare.
Occupational wellness is supported by
promoting the employees’ health, job
and functional capacity as well as their
quality of life in many ways. For instance,
Marimekko applies an early-intervention
model which provides support for the
working community. Securing a safe
working environment means the advance
prevention of accidents as well as
recognising and avoiding hazards and
near-misses. In order to prevent potential
hazards, personnel are trained in issues
of occupational safety and safety risks
are regularly monitored. During 2017,
the sickness absence percentage based
on theoretical regular working hours
was 2.9 percent (2.6; 2.5) among
Marimekko’s employees in Finland.
RESEARCH AND DEVELOPMENT
Marimekko’s product planning and
development costs arise from the design
of collections and collaboration on new
materials. Design costs are recorded in
expenses.
MANAGEMENT
Board of Directors, management and
auditors
Marimekko Corporation’s Board of
Directors are elected by the Annual
General Meeting. According to the
Articles of Association, the Board of
Directors shall consist of four to seven
ordinary members. Their term of office
ends at the conclusion of the next
Annual General Meeting. The Board
elects a Chairman from amongst its
members.
The duties and responsibilities of
the Board of Directors are determined
primarily by the Articles of Association
and the Finnish Companies Act. The
Board deliberates on all matters that
are significant to the Marimekko
Group’s business operations. These
include approving strategic policies,
budgets and operating plans, and
deciding on significant investments,
mergers and acquisitions. The Articles
of Association do not provide the Board
of Directors or the President and CEO
with any powers other than those that
are customary. Decisions to amend the
Articles of Association or to increase the
share capital are made pursuant to the
provisions of the Finnish Companies Act
in force.
The Annual General Meeting of
6 April 2017 appointed seven members
to the company’s Board of Directors.
Elina Björklund, Arthur Engel, Mika
Ihamuotila, Mikko-Heikki Inkeroinen
and Catharina Stackelberg-Hammarén
were re-elected. Rebekka Bay and Helle
Priess were elected as new members
of the Board of Directors. The Board is
chaired by Mika Ihamuotila and vice-
chaired by Elina Björklund.
From among its members, the Board
of Directors elected Elina Björklund as
Chairman and Mikko-Heikki Inkeroinen
and Catharina Stackelberg-Hammarén as
members of the Audit and Remuneration
Committee.
The Annual General Meeting
resolved that the annual remuneration
payable to the members of the Board of
Directors be as follows: EUR 40,000 to
the Chairman, EUR 30,000 to the Vice
Chairman and EUR 22,000 to the other
members of the Board. According to
the resolution by the Annual General
Meeting, approximately 40 percent of
the annual remuneration were to be
paid in Marimekko Corporation’s shares
acquired from the market and the rest
in cash. In addition, the Annual General
Meeting resolved that in case a member
of the Board held the company’s shares
worth more than EUR 500,000 on the
date of the Meeting, 6 April 2017, the
remuneration would be paid entirely
in cash. The Annual General Meeting
further resolved that no separate
remuneration be paid for committee
work to persons elected to any
committee. In the remuneration payable
to the Vice Chairman of the Board,
chairing the Audit and Remuneration
Committee has been taken into account.
The Board of Directors elects the
company’s President and CEO and
decides on the President and CEO’s
salary and other remuneration on the
basis of a proposal drawn up by the
Audit and Remuneration Committee.
The duties of the President and CEO are
set down in the Finnish Companies Act.
The post of Marimekko Corporation’s
President and CEO is held by Tiina
Alahuhta-Kasko.
The following changes in the
company’s management took place
in 2017. Päivi Paltola started as the
company’s Chief Marketing Officer
(CMO) on 30 January 2017, Tanya
Strohmayer became Human Resources
Director on 10 February 2017 and Tina
Report of the Board of Directors
15
Broman took up duties as Chief Supply
Chain Officer (CSCO) on 2 October
2017. All of the aforementioned are also
members of Marimekko’s Management
Group. The company’s Chief Digital
Officer (CDO) Kari Härkönen was
appointed to the Management Group as
of 14 December 2017. Creative Director
and Management Group member Anna
Teurnell stood down from her post on
27 February 2017. Marimekko reported
on 7 December 2017 of its decision
to transform its operational model in
respect of design management and of
its appointment of Satu Maaranen as
head designer of ready-to-wear, bags
and accessories from 8 January 2018.
At the end of 2017, the company’s
Management Group comprised Tiina
Alahuhta-Kasko as Chairman and Elina
Aalto, Tina Broman, Kari Härkönen,
Päivi Lonka, Päivi Paltola and Tanya
Strohmayer as members.
The Annual General Meeting re-
elected PricewaterhouseCoopers Oy,
Authorised Public Accountants, as
the company’s auditor. Ylva Eriksson,
Authorised Public Accountant,
continued as chief auditor. It was
decided that the auditor’s fee will be
paid as per invoice approved by the
company.
Corporate governance statement
The corporate governance statement for
2017 can be found on the company’s
website at company.marimekko.com
under Investors/Management/Corporate
governance.
OTHER EVENTS DURING 2017
Enquiries concerning the company’s
premises in Helsinki
In its half-year financial report of
10 August 2017, Marimekko announced
that it was investigating the option of
the sale and leaseback of the building
owned by the Marimekko Group in the
Herttoniemi district of Helsinki housing
the company’s head office and textile
printing factory and two of its stores.
Any decisions on the matter will be
reported separately in due time.
MAJOR RISKS AND FACTORS OF UNCERTAINTY
Factors of uncertainty over the global
economic trend affect the retail trade
and consumer confidence in all of the
company’s market areas. The company’s
major strategic risks are associated
with changes in consumers’ purchasing
behaviour and buying power, especially
in Finland and Japan, which are the
company’s biggest single countries for
business.
Near-term strategic risks include
risks related to changes in the
company’s design, product assortment
and product pricing. Digitisation
in retail trade and the intensified
competition and rapidly changing
operating environment that this entails
also bring risks. The company’s ability
to design, develop and commercialise
new products that meet consumers’
expectations while ensuring effective
production, sourcing and logistics has
an impact on the company’s sales and
profitability. International e-commerce
increases the options available to
consumers and multichannel business
is of growing importance in the retail
trade. Maintaining competitiveness in a
rapidly changing operating environment
being revolutionised by digitisation
demands agility, efficiency and the
constant re-evaluation of operations.
The company’s growth is based
primarily on opening retailer-owned
Marimekko stores and shop-in-shops
and expanding e-commerce as well
as setting up company-owned stores
and concession shop-in-shops in the
company’s main market areas. The
Asia-Pacific region is Marimekko’s
second-biggest market, and it plays
an important role in the company’s
growth and internationalisation.
Changes in distribution channel
solutions may impact the company’s
sales and profitability. Major partnership
choices, partnering contracts and
other collaboration agreements
involve considerable risks. Store lease
agreements in Finland and abroad also
contain risks.
Intellectual property rights play a
vital role in the company’s success,
and the company’s ability to manage
these rights may have an impact on the
value and reputation of the company.
Agreements with freelance designers
and fees paid to designers based on
these agreements are also an essential
part of the management of intellectual
property rights.
The company’s operational risks
prominently include those related
to the management and success of
modernisation and internationalisation,
changes in procurement and logistics
processes, and changes in the prices of
raw materials and other procurement
items. Information system functionality
and reliability also involve risks;
malfunctions, for example in data
communications or in the company’s
own online store, can disrupt business
momentarily. The company primarily
uses subcontractors to manufacture
its products. Of the sustainability
aspects of manufacturing, those related
to the supply chain and enhancing
its transparency, in particular, are of
growing significance to customers.
Compliance with sustainable business
methods is important in maintaining
customers’ confidence; any failures or
Report of the Board of Directors

16
errors in this area will involve reputation
risks. Any delays or disturbances in
supply, or fluctuations in the quality of
products, may have a harmful impact
on business. As product distribution
is expanded and operations are
diversified, risks associated with
inventory management also grow. As
Marimekko is a small company, ongoing
modernisation and development projects
increase risks related to key personnel.
Among the company’s financial risks,
those related to the structure of sales,
price trends for factors of production,
changes in cost structure, changes in
exchange rates (particularly the US
dollar, Swedish krona and Australian
dollar), taxation, and customers’
liquidity may have an impact on the
company’s financial status.
MARKET OUTLOOK AND GROWTH TARGETS FOR 2018
Uncertainty in the global economy is
forecast to continue, partly because
of the unpredictability of the political
situation. Consumer demand forecasts
vary among Marimekko’s different
market areas.
Finland, Marimekko’s important
domestic market, represents about half
of the company’s net sales. Growth
in retail trade is forecast to be at a
fairly good level. Sales in 2018 will be
impacted positively by nonrecurring
promotional deliveries; in 2017 there
were no similarly large deliveries.
Marimekko’s sales in Finland are
expected to grow in 2018.
The Asia-Pacific region, Marimekko’s
second-biggest market, plays a
significant part in the company’s
internationalisation. Japan is clearly the
most important country in this region
to Marimekko; the other countries’
combined share of the company’s
net sales is still relatively small, as
operations in these markets are in fairly
early stages. Japan already has a very
comprehensive network of Marimekko
stores, and new ones are being opened
at a rate of a few stores per year.
Sales are supported by enhancing the
operations of stores and by optimising
the product range. Sales in the Asia-
Pacific region this year are forecast to
grow. The company sees increasing
demand for its products in this area
especially in the longer term.
In 2018, the main thrust in
expansion remains on openings of
retailer-owned Marimekko stores, and
continuing growth is expected in the
company’s own e-commerce and other
online sales channels. The aim is to
open around 10–15 new Marimekko
stores and shop-in-shops. The company
will continue the enhancement of the
operations of Marimekko stores opened
in recent years.
Royalty income is forecast to be
roughly on a par with the previous year.
The expenses of marketing
operations in 2018 are forecast to be
higher than in 2017 (EUR 4.5 million).
The total investments are estimated to
grow relative to the previous year (EUR
1.2 million).
Due to the seasonal nature of
Marimekko’s business, the major portion
of the company’s net sales and earnings
are traditionally generated during the
last two quarters of the year. The share
of holiday sales in particular of the
company’s net sales for the last quarter
is considerable and the outcome of the
holiday season has a significant impact
on results for the whole year.
FINANCIAL GUIDANCE FOR 2018
The Marimekko Group’s net sales and
comparable operating profit for 2018
are forecast to be at the same level as or
higher than in the previous year.
THE BOARD OF DIRECTORS’ PROPOSAL FOR THE DISTRIBUTION OF PROFIT
On 31 December 2017, the parent
company’s distributable funds amounted
to EUR 19,194,424.94; profit for the
financial year was EUR 4,948,190.32.
The Board of Directors will propose
to the Annual General Meeting that a
dividend of EUR 0.50 per share be paid
for 2017 to a total of EUR 4,044,805 and
that the remaining funds be retained
in equity. The Board will propose
16 April 2018 as the dividend record
date, and 23 April 2018 for the dividend
payout. No substantial changes in the
company’s financial position have
occurred after the end of the financial
year. The company’s liquidity is
good and, in the view of the Board of
Directors, the proposed dividend payout
does not jeopardise the company’s
solvency.
ANNUAL GENERAL MEETING
Marimekko Corporation’s Annual
General Meeting will be held on
Thursday 12 April 2018 from 2 p.m.
onwards at the company’s head office,
Puusepänkatu 4, 00880 Helsinki,
Finland.
Helsinki, 14 February 2018
Marimekko Corporation
Board of Directors
Report of the Board of Directors

17

18
CONSOLIDATED INCOME STATEMENT
(EUR 1,000) Note 1 Jan.–31 Dec. 2017 1 Jan.–31 Dec. 2016
NET SALES 1. 102,324 99,614
Other operating income 2. 406 376
Increase (-) / decrease (+) in inventories of completed and unfinished products 294 2,960
Raw materials and consumables 3. -37,401 -40,199
Employee benefit expenses 4. -24,543 -25,671
Depreciation and impairments 5. -3,308 -4,114
Other operating expenses 6. -29,413 -27,716
OPERATING PROFIT 8,360 5,249
Financial income 7. 39 164
Financial expenses 8. -1,269 -243
-1,230 -79
RESULT BEFORE TAXES 7,130 5,170
Income taxes 9. -1,470 -1,138
NET RESULT FOR THE PERIOD 5,660 4,032
Distribution of net result to equity holders of the parent company 5,660 4,032
Basic and diluted earnings per share calculated on the result attributable
to equity holders of the parent companyt, EUR 10. 0.70 0.50
COMPREHENSIVE CONSOLIDATED INCOME STATEMENT
(EUR 1,000) 1 Jan.–31 Dec. 2017 1 Jan.–31 Dec. 2016
Net result for the period 5,660 4,032
Items that could be reclassified to profit or loss at a future point in time
Change in translation difference -71 -14
COMPREHENSIVE RESULT FOR THE PERIOD 5,589 4,018
Distribution of net result to equity holders of the parent company 5,589 4,018
The notes are an integral part of the f inancial statements.
Consolidated financial statements, IFRS
19
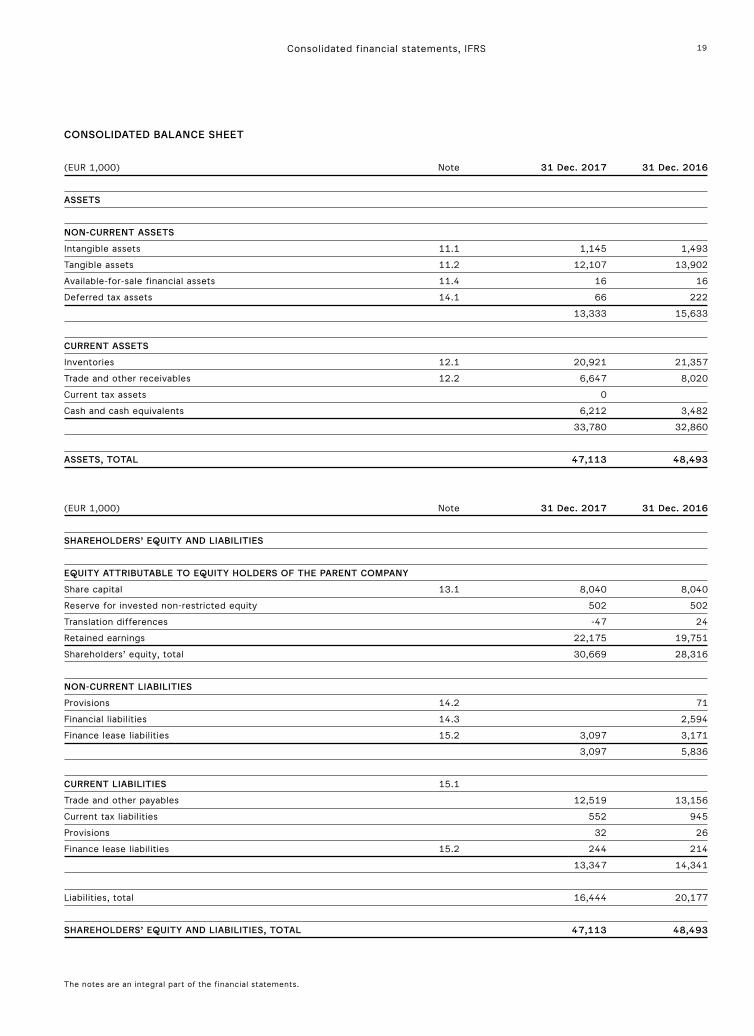
CONSOLIDATED BALANCE SHEET
(EUR 1,000) Note 31 Dec. 2017 31 Dec. 2016
ASSETS
NON-CURRENT ASSETS
Intangible assets 11.1 1,145 1,493
Tangible assets 11.2 12,107 13,902
Available-for-sale financial assets 11.4 16 16
Deferred tax assets 14.1 66 222
13,333 15,633
CURRENT ASSETS
Inventories 12.1 20,921 21,357
Trade and other receivables 12.2 6,647 8,020
Current tax assets 0
Cash and cash equivalents 6,212 3,482
33,780 32,860
ASSETS, TOTAL 47,113 48,493
(EUR 1,000) Note 31 Dec. 2017 31 Dec. 2016
SHAREHOLDERS’ EQUITY AND LIABILITIES
EQUITY ATTRIBUTABLE TO EQUITY HOLDERS OF THE PARENT COMPANY
Share capital 13.1 8,040 8,040
Reserve for invested non-restricted equity 502 502
Translation differences -47 24
Retained earnings 22,175 19,751
Shareholders’ equity, total 30,669 28,316
NON-CURRENT LIABILITIES
Provisions 14.2 71
Financial liabilities 14.3 2,594
Finance lease liabilities 15.2 3,097 3,171
3,097 5,836
CURRENT LIABILITIES 15.1
Trade and other payables 12,519 13,156
Current tax liabilities 552 945
Provisions 32 26
Finance lease liabilities 15.2 244 214
13,347 14,341
Liabilities, total 16,444 20,177
SHAREHOLDERS’ EQUITY AND LIABILITIES, TOTAL 47,113 48,493
The notes are an integral part of the f inancial statements.
Consolidated financial statements, IFRS

20
The notes are an integral part of the f inancial statements.
CONSOLIDATED CASH FLOW STATEMENT
(EUR 1,000) Note 1 Jan.–31 Dec. 2017 1 Jan.–31 Dec. 2016
CASH FLOW FROM OPERATING ACTIVITIES
Net profit for the period 5,660 4,032
Adjustments
Depreciation and impairments 3,308 4,114
Financial income and expenses 1,230 79
Taxes 1,470 1,138
Cash flow before change in working capital 11,668 9,363
Change in working capital 416
Increase (-) / decrease (+) in current non-interest-bearing trade receivables 1,027 -2,224
Increase (-) / decrease (+) in inventories 437 -2,803
Increase (+) / decrease (-) in current non-interest-bearing liabilities -1,047 2,445
Cash flow from operating activities before financial items and taxes 12,084 6,781
Paid interest and payments on other financial expenses -433 -169
Interest received 22 33
Taxes paid -1,863 -520
CASH FLOW FROM OPERATING ACTIVITIES 9,810 6,125
CASH FLOW FROM INVESTING ACTIVITIES
Proceeds from sale of available-for-sale financial assets 3
Investments in intangible assets -701 -573
Investments in tangible assets -280 -1,986
CASH FLOW FROM INVESTING ACTIVITIES -978 -2,559
CASH FLOW FROM FINANCING ACTIVITIES
Payments of long-term loans 21. -2,594 -1,240
Short-term loans drawn 2,000 4,000
Payments of short-term loans -2,000 -4,000
Payments of finance lease liabilities 21. -273 -261
Dividends paid -3,236 -2,831
CASH FLOW FROM FINANCING ACTIVITIES -6,103 -4,332
Change in cash and cash equivalents 2,730 -766
Cash and cash equivalents at the beginning of the period 3,482 4,249
Cash and cash equivalents at the end of the period 6,212 3,482
Consolidated financial statements, IFRS

21
CONSOLIDATED STATEMENT OF CHANGES IN SHAREHOLDERS’ EQUITY
Equity attributable to equity holders of the parent company
Reserve for invested Shareholders’ non-restricted Translation Retained equity,(EUR 1,000) Share capital equity differences earnings total
Shareholders’ equity 1 Jan. 2016 8,040 502 38 18,549 27,129
Comprehensive result
Net result for the period 4,032 4,032
Translation differences -14 -14
Total comprehensive result for the period -14 4,032 4,018
Transactions with owners
Dividends paid -2,831 -2,831
Shareholders’ equity 31 Dec. 2016 8,040 502 24 19,751 28,316
Shareholders’ equity 1 Jan. 2017 8,040 502 24 19,751 28,316
Comprehensive result
Net result for the period 5,660 5,660
Translation differences -71 -71
Total comprehensive result for the period -71 5,660 5,589
Transactions with owners
Dividends paid -3,236 -3,236
Shareholders’ equity 31 Dec. 2017 8,040 502 -47 22,175 30,669
The notes are an integral part of the f inancial statements.
Consolidated financial statements, IFRS
22
COMPANY PROFILE
Marimekko Corporation is a Finnish
clothing and textile company.
Marimekko Corporation and its
subsidiaries form a Group that designs,
manufactures and markets clothing,
interior decoration products and bags.
Marimekko Corporation’s shares
are quoted on Nasdaq Helsinki
Ltd. The company is domiciled in
Helsinki, and its registered address
is Puusepänkatu 4, 00880 Helsinki,
Finland. The financial year of all Group
companies is the calendar year.
Copies of the consolidated
financial statements are available at
company.marimekko.com and the head
office of the Group’s parent company
at Puusepänkatu 4, 00880 Helsinki,
Finland.
Marimekko Corporation’s Board
of Directors approved these financial
statements for publication at its meeting
on 14 February 2018. According
to the Finnish Companies Act,
shareholders have the right to accept
or reject the financial statements at
the Annual General Meeting held after
the publication. The Annual General
Meeting may also amend the financial
statements.
ACCOUNTING POLICY APPLIED IN THE CONSOLIDATED FINANCIAL STATEMENTS
Accounting policy
The financial statements have been
prepared in accordance with the
International Financial Reporting
Standards (IFRS), complying with the
IAS and IFRS standards as well as the
SIC and IFRIC interpretations in force
as at 31 December 2017. In the Finnish
Accounting Act and the provisions laid
down pursuant to the Act, International
Financial Reporting Standards refer to
the standards approved for use in the EU
in accordance with the procedures laid
down in IAS Regulation (EC) 1606/2002
of the European Parliament, and the
interpretations of these standards. The
notes to the consolidated financial
statements also comply with Finnish
accounting and company legislation
which complements IFRS regulations.
The financial statements have been
prepared at historical cost. Financial
statement information is presented in
thousands of euros.
Accounting estimates and judgments
The preparation of financial statements
in accordance with IFRS calls for the
management to use estimates and
assumptions with regard to the future.
The estimates and assumptions included
in the financial statements are based on
the best knowledge of the management
as at the closing of the books. These
estimates and assumptions affect the
value of tangible and intangible assets
in the balance sheet and the income
and expenses for the year in the
income statement. Discretion also has
to be exercised when the accounting
conventions for the financial statements
are selected and applied, and estimates
have to be made, for example, of
depreciation periods, any impairments,
valuation of inventories, income taxes,
deferred tax assets and provisions
(including credit loss provisions). The
actual figures may deviate from these
estimates.
Principles of consolidation
Marimekko’s consolidated financial
statements include the accounts of the
parent company Marimekko Corporation
and its subsidiaries. Subsidiaries are
companies in which the Group has the
right to determine the financial and
operating principles of the undertaking
or business operations, usually by
virtue of a shareholding that entitles
to more than half of the voting rights.
Intra-Group share ownership has been
eliminated using the acquisition cost
method. Acquired subsidiaries are
consolidated in the Group’s financial
statements as of the date on which the
Group acquired a controlling interest
and divested subsidiaries until the date
when such control ceases. Intra-Group
business transactions, intra-Group profit
margins related to inventories and fixed
assets, intra-Group receivables and
liabilities and intra-Group distribution of
profit have been eliminated.
Segment reporting
The Group’s business segment is the
Marimekko business. The segment
information presented by the Group
is based on internal reporting to the
chief operational decision-maker, in
which the management’s assessment
of the segment’s profitability is based
on monitoring the segment’s operating
profit and in which the valuation
principles for assets and liabilities are in
accordance with IFRS regulations.
The President and CEO of the
company acts as the chief operational
decision-maker.
Translation of items denominated in
foreign currency
The results and financial position
of Group units are measured in the
currency used in the primary business
environment of the unit in question
(functional currency). The consolidated
financial statements are presented in
euros, the functional and presentation
currency of the parent company.
Transactions in foreign currencies are
recognised in the functional currency
at the exchange rate on the date of
transaction. The foreign-currency-
denominated receivables and liabilities
of the parent company and its Finnish
NOTES TO THE CONSOLIDATED FINANCIAL STATEMENTS
Consolidated financial statements, IFRS

23
subsidiaries have been converted to
euro amounts using the exchange
rates quoted by the European Central
Bank on the closing date. The foreign-
currency-denominated receivables and
liabilities of foreign subsidiaries have
been converted at the exchange rate of
the country in question on the closing
date. Foreign exchange differences
in business operations are booked in
the corresponding income statement
accounts above operating profit and
foreign exchange differences on
financial items in financial income and
expenses.
The foreign-currency-denominated
income statements of subsidiaries
are converted to euro amounts using
the average exchange rate for the
financial year and the balance sheets
at the average rate on the closing date.
Differences arising from translation and
translation differences in shareholders’
equity are recorded as a separate item
in shareholders’ equity.
Revenue recognition and net sales
Most of the Group’s income is comprised
of wholesale and retail sales of products
plus royalties. Sales of products are
recognised as income when the
significant risks and rewards incident
to the ownership of goods have been
transferred to the buyer. The Group
then relinquishes oversight and control
of the product. In wholesale, this is
mainly the moment when the goods
are handed over to the customer as
set forth in the agreed delivery clause.
In retail where cash or a credit card is
used as means of payment, the income
is recognised at the time of sale. The
revenue recognition of licensing and
royalty income is handled in accordance
with the clauses of the agreement
between Marimekko and the licensee.
The clauses in the licensing agreements
mainly provide for royalties payable to
Marimekko for sales of products covered
by the agreement, based either on a
percentage rate or the number of items.
At least the minimum annual royalty as
stipulated in the agreement is payable
by some of the licensees.
In the calculation of net sales, sales
proceeds are adjusted with indirect
taxes and sales adjusting items such
as discounts granted. The distribution
costs of products sold are recognised in
other operating expenses in the income
statement.
Other operating income
Other operating income includes, for
example, rental income from lease
agreements classified as other lease
agreements, insurance payouts and sales
proceeds of fixed assets.
Operating profit
IAS 1 Presentation of Financial
Statements does not contain a definition
of operating profit. The Group has
defined this concept as follows:
operating profit is the net amount of
net sales and other operating income
less the purchase expenses adjusted
with the expenses incurred due to the
increase or decrease in inventories or
completed and unfinished products
and production for own use, employee
benefit expenses, depreciation, possible
impairment loss and other operating
expenses. Any income statement items
other than the above are presented
below the operating profit. Foreign
exchange differences are included in
the operating profit, provided they
are attributable to items related to
business operations. Otherwise they are
recognised in financial items.
Employee benefits
Pension commitments
The pension security of the personnel
of the Group’s Finnish companies
has been arranged under the Finnish
statutory employee pension plan
(TyEL) through an external pension
insurance company. Foreign subsidiaries
have arranged pensions for their
personnel in accordance with local
legislation. The Group’s pension cover
is arranged wholly under defined
contribution schemes. Under a defined
contribution arrangement, the Group
pays contributions to publicly or
privately managed pension insurances.
These contributions are either
compulsory, based on an agreement
or voluntary. The Group does not have
any payment obligations other than
these contributions. The contributions
are recognised as employee benefit
expenses at the time when they
become due. Any contributions paid in
advance are included in the assets on
the balance sheet, insofar as they are
recoverable as future refunds or future
reductions of contributions.
Share-based payments
The long-term bonus systems granted
to the Management Group by the
Board of Directors are valued at fair
value at each closing date and the
change in fair value is recorded as an
employee benefit expense in the income
statement to the extent the share-
based payments have been vested. The
possible bonus will be paid in cash.
The bonus systems are described
in greater detail in note 4 to the
consolidated financial statements.
Interest income
Interest income is recognised on a time-
proportion basis using the effective
interest method.
Dividend income
Dividend income is recognised as
income when the right to dividends is
established.
Consolidated financial statements, IFRS

24
Income taxes
Taxes on the Group companies’
financial results for the period, taxes
from previous periods and the change
in deferred taxes are recorded as the
Group’s taxes. Taxes on the taxable
income for the period are calculated
on taxable income in accordance with
the tax rate in force in the country in
question. Deferred taxes are calculated
on all temporary differences between
the book value and the taxable value.
However, a deferred tax liability is not
accounted for if it arises from the initial
recognition of an asset or liability in
a transaction, other than a business
combination, that at the time of the
transaction affects neither accounting
nor taxable income. In taxation deferred
tax is not recognised for non-deductible
goodwill and deferred tax is not
recognised for distributable earnings
of subsidiaries where it is probable
that the difference will not reverse
in the foreseeable future. The largest
temporary differences are due to the
amortisation of fixed assets. Deferred
taxes are calculated using the tax rates
set by the closing date. Deferred tax
assets are recognised to the extent that
it is probable that future taxable profit,
against which the temporary difference
can be utilised, will be available.
Earnings per share
The basic earnings per share are
calculated by dividing the profit for the
period attributable to equity holders of
the parent company by the weighted
average of shares outstanding. The
weighted average number of shares
used to calculate the diluted earnings
per share takes into account the diluting
effect of the conversion of potential
common shares into actual shares
during the period. There are no potential
shares outstanding at the moment.
Intangible assets
Intangible assets with finite useful
lives are recognised in the balance
sheet at original cost less depreciation.
Depreciation of intangible assets is
carried out on a straight-line basis over
their estimated useful life.
The estimated useful lives are as
follows:
• intangible rights 5–10 years
• computer software 3–5 years.
The major intangible asset items
are trademarks. Other intangible assets
are computer software and information
systems. The Group has not had any
such development expenditure that
should be recognised as assets under
IAS 38 and recorded as amortised
expense over their useful life.
Tangible assets
Tangible assets mainly consist
of buildings, machinery and
equipment. Tangible assets also
include expenditures on conversions
and renovations of leased premises
comprising, for example, completion
work on business interiors in rented
premises. Tangible assets are recorded
in the balance sheet at original cost less
depreciation. Depreciation of tangible
assets is carried out on a straight-line
basis over their estimated useful life.
The estimated useful lives are as
follows:
• buildings and structures 40 years
• machinery and equipment 3–15 years.
The residual value and useful life of
tangible assets are reviewed at the end
of each financial year and if necessary
adjusted to reflect changes in the
expectation of economic benefit.
If a tangible asset consists of several
parts with different useful lives, each
part is treated as a separate asset.
Significant cost of replacing a part is
capitalised when the company will
derive economic benefit from the
asset. Other expenses such as regular
maintenance, repair and servicing costs
are entered as expenses in the income
statement when they are incurred.
Investment aid is recognised as a
reduction to investments and the aid
recorded in the income statement is
booked in other operating income.
Borrowing costs
Borrowing costs are recognised as
expenses during the financial year in
which they were incurred. Borrowing
costs have not been recognised as part
of the acquisition cost of assets.
Provisions and contingent liabilities
A provision is recognised when
the Group has a present legal or
constructive obligation as a result of a
past event, and it is probable that an
outflow of resources will be required
to settle the obligation and a reliable
estimate of the amount of the obligation
can be made.
A restructuring provision is
recognised when the Group has
compiled a detailed restructuring
plan, launched its implementation or
informed the parties concerned.
A contingent liability is a potential
liability based on previous events.
It depends on the realisation of an
uncertain future event beyond the
Group’s control. Contingent liabilities
also include obligations which will
most likely not lead to a payment or
the amount of which cannot be reliably
determined. Contingent liabilities are
disclosed in the notes.
Impairment
On each closing date, asset items are
assessed for indications of impairment.
If there are such indications, the
recoverable amount of said asset item is
estimated. The impairment recognised
is the amount by which the book value
Consolidated financial statements, IFRS

25
of the asset item exceeds its recoverable
amount, which is the higher of its net
selling price or value in use. Value in
use is based on discounted future net
cash flows as a rule.
Lease agreements
In accordance with IAS 17 Leases, lease
agreements in which the Group assumes
substantially all the risks and rewards
incident to ownership of the asset are
classified as finance lease agreements.
Assets acquired under finance
lease agreements, less accumulated
depreciation, are recognised in tangible
or intangible assets, and the obligations
of the agreements are recognised in
interest-bearing liabilities. A financial
lease is booked in the balance sheet
and recognised at fair value of the
asset at the time of entering into the
lease agreement or, if lower, at the
present value of future minimum
lease payments. Tangible or intangible
fixed assets acquired under finance
lease agreements are depreciated in
line with the Group’s depreciation
policy over their useful life or lease
period, whichever is shorter, and any
impairment loss is recognised. Rents
payable under lease agreements are
divided into financial expenses and debt
repayment.
Lease agreements in which the risks
and rewards incident to ownership are
retained by the lessor are treated as
other lease agreements. Rents payable
under other lease agreements are
expenses in the income statement on a
straight-line basis over the lease period.
Inventories
Inventories are presented at the
acquisition cost or at the lower probable
net realisation value. The acquisition
cost of manufactured inventories
includes not only purchase expenditure
on materials, direct labour and other
direct costs, but also a share of the fixed
and variable general costs of production.
Net realisable value is the estimated
selling price in the ordinary course of
business, less the estimated costs for
completion and selling expenses.
Financial assets
The Group classifies its financial assets
in the following categories: loans and
other receivables and available-for-
sale financial assets. The classification
depends on the purpose for which the
financial assets were acquired and is
determined at initial recognition by the
management.
Loans and receivables consist of
trade receivables, other receivables and
cash and cash equivalents.
Available-for-sale financial assets
comprise shares and they are included
in non-current assets, unless it is
intended that they will be held for
less than 12 months from the closing
date, in which case they are included
in current assets. Available-for-sale
financial assets are measured at fair
value or, where the fair value cannot
be reliably determined, at acquisition
cost. Available-for-sale financial assets
on the closing date comprise unlisted
shares measured at historical cost less
any impairment. The company does not
intend to dispose of these shares for the
present.
Loans and other receivables are
initially recognised at fair value and
subsequently at amortised cost using
the effective interest method. An
impairment of trade receivables is
recognised when there is objective
evidence that the Group will not receive
all of the benefits on the original terms.
Indications of the impairment of trade
receivables include the significant
financial difficulties of the debtor, the
likelihood of bankruptcy, failure to make
payments, or a delay of over 90 days in
paying. Impairment loss is recognised
under other operating expenses in the
income statement.
Cash and cash equivalents
The Group’s cash and cash equivalents
include cash at hand and at banks. The
Group does not have any other items
classified as cash and cash equivalents.
Dividends, shareholders’ equity and
treasury shares
The Board of Directors’ proposal for
dividend distribution has not been
recognised in the financial statements;
the dividends will only be recognised
on the basis of the Annual General
Meeting’s approval.
Outstanding common shares are
presented as share capital. Costs related
to the granting or acquisition of the
company’s own equity instruments are
presented as equity allowance. If the
company purchases its own shares,
the price including direct costs is
recognised as decrease in equity.
Financial liabilities
Financial liabilities are initially
recognised at fair value including
transaction costs and subsequently
at amortised cost using the effective
interest method. Financial liabilities are
non-current, unless they are repayable
on demand or the Group intends to
repay them within the next 12 months.
New standards and interpretations
In preparing these consolidated financial
statements, the Group has followed
the same accounting policies as in the
financial statements for 2016 except for
the effect of changes required by the
adoption of the following new standards,
interpretations and amendments to
existing standards and interpretations
on 1 January 2017. The new standards,
interpretations and amendments
Consolidated financial statements, IFRS
26
to existing standards have had no
impact on the consolidated financial
statements.
- IAS 7 (amendment) “Cash flow
statements”. The amendment aims
at entities to provide disclosures on
changes in liabilities arising from
financing activities.
- IAS 12 (amendment) “Income
Taxes”. The amendment aims at
clarifying the recognition of deferred tax
assets for unrealised losses related to
debt instruments measured at fair value.
Below is a list of standards,
interpretations and amendments that
have been issued and are effective for
periods after 1 January 2017. They will
be adopted by the Group in 2018 or
later. The impacts of each change on
the consolidated financial statements
are commented separately.
- IFRS 15 ”Revenue from Contracts
with Customers”. The new standard
provides a comprehensive framework
for recognising revenue and the amount
and timing of the revenue. IFRS 15
replaces the effective guidelines for
recognition, such as IAS 18 ”Revenue”
and IAS 11 ”Construction Contracts”.
According to IFRS 15, revenue is
recognised when a customer obtains
control of a good or service. A customer
obtains control when it has the ability
to direct the use of and obtain the
benefits from the good or service. The
core principle of IFRS 15 is that an
entity recognises revenue to depict the
transfer of promised goods or services
to customers in an amount that reflects
the consideration to which the entity
expects to be entitled in exchange
for those goods or services. IFRS 15
will increase the amount of disclosure
information related to customer
contracts and significant judgements
made. The Group has made a decision to
use a modified retrospective approach.
The standard must be adopted from
1 January 2018.
- The Group sells design products
in Marimekko’s retail stores and online
store, and through wholesale trade both
in Finland and overseas. The goods are
handed over to the customer one item
or several items at a time in the stores
or by a carrier. The customer can utilise
each sold product separately and the
products are not dependent on other
products sold by Marimekko. In recent
years, the Group has had no service
or project business and less than two
percent of revenue has consisted of
royalty revenues. In wholesale trade, the
terms of delivery determine the point of
time when the customer obtains control
of the goods. Determining the separately
identifiable performance obligations
is uncomplicated. The fulfilling of
the obligations is verifiable by the
payment receipts or transportation
documents. In compliance with IFRS
15, the contributions by the customers
are allocated to distinct goods and
recognised as revenue by the Group
when the goods are handed over to
the customer in the store or when the
wholesale customer obtains control
of the goods according to the terms
of delivery. The Group has made an
analysis on implementing IFRS 15
on recognising revenues from retail,
wholesale and licensing. Based on
this analysis, the implementation of
IFRS 15 will not have an impact on the
consolidated financial statements of the
Group.
- IFRS 9 ”Financial instruments”.
The new standard replaces most of
the guidance in IAS 39. IFRS 9 retains
but simplifies the mixed measurement
model and establishes three primary
measurement categories for financial
assets: amortised cost, fair value
through OCI and fair value through P&L.
There is now a new expected credit
losses model that replaces the incurred
loss impairment model used in IAS 39.
The standard’s requirements related
to general hedge accounting have also
been revised. IAS 39’s requirements
for recognition and derecognition
of financial instruments have been
retained. Implementing the standard
will not have a material impact on
the consolidated income statement or
balance sheet.
- IFRS 16 “Leases”. The new standard
requires lessees to recognise a liability
reflecting the future rental payments
and an asset related to authority to use
the asset, for almost all leases. Lessees
cease to classify leases as finance
leases or operating leases. The standard
contains an optional exemption for
certain short-term leases and leases
of low-value assets. Applying IFRS 16
will increase the amount of assets and
liabilities recognised in the Group’s
balance sheet, related to leases of store
premises. Leases of store premises are
currently classified as operating leases.
The change will also have an impact
on the consolidated income statement,
as the rental expense will be replaced
by depreciation of the leased asset and
interest expense on the finance lease
liability.
Consolidated financial statements, IFRS

27
1. SEGMENT INFORMATION
The operational segments are reported in the same way as internal reporting to the chief operational decision-maker. The chief operational decision-maker monitors Marimekko’s business as a whole. The company is domiciled in Finland. Net sales from external customers in Finland totalled EUR 55,690 thousand and from external customers in other countries EUR 46,635 thousand. The total amount of non-current assets in Finland excluding financial instruments and deferred tax assets (the Group has no assets arising from employee benefits or insurance contracts) was EUR 12,579 thousand (14,913) and the total amount of corresponding non-current assets in other countries was EUR 688 thousand (498).
(EUR 1,000) 2017 2016
Net sales
Finland 55,690 55,770
Other countries 46,635 43,844
Total 102,324 99,614
Assets
Finland 39,660 39,332
Other countries 7,453 9,161
Total 47,113 48,493
Investments
Finland 954 2,327
Other countries 256 394
Total 1,210 2,721
Net sales
Product sales 100,680 98,532
Licence income 1,644 1,082
Total 102,324 99,614
2. OTHER OPERATING INCOME
(EUR 1,000) 2017 2016
Rental income 282 313
Other income 124 63
Total 406 376
3. RAW MATERIALS AND CONSUMABLES
(EUR 1,000) 2017 2016
Materials and supplies
Purchases during the financial year 23,161 26,777
Increase (-) / decrease (+) in inventories 687 -135
Total 23,847 26,643
External services 13,553 13,556
Total 37,401 40,199
Exchange rate differences included in raw materials and consumables
Exchange rate gains (-) / losses (+) of purchases 75 50
Consolidated financial statements, IFRS

28
4. EMPLOYEE BENEFIT EXPENSES
(EUR 1,000) 2017 2016
Salaries, wages and bonuses 19,366 19,807
Share-based payments (cash settled) -67 30
Pension expenses – defined contribution plans 2,491 2,742
Other indirect social expenditure 2,753 3,092
Total 24,543 25,671
Average number of employees
2017 2016
Salaried employees 401 417
Non-salaried employees 24 24
Total 425 441
Share-based payments During the financial year, the Marimekko Group had a long-term bonus system targeted at the Management Group. On 7 May 2014, the Board of Directors of Marimekko Corporation agreed on establishing a long-term bonus system targeted at the company’s Management Group. The system is composed of two earnings periods, which are 8 May 2014–31 October 2017 and 8 May 2014–28 February 2018. The possible bonus for each earnings period is based on the total yield on Marimekko Corporation’s shares, including dividends. At the end of the first earnings period, on 31 October 2017, the value of the share was below the target price. The second earnings period ends in spring 2018. Earning the bonus requires that the person still works for the company at the time of the payment. When receiving the bonus, the person in question commits themselves to using 50% of the net value of the bonus for acquiring the company’s shares at transaction price within six months from receiving the bonus. The shares acquired with the bonus cannot be surrendered prior to two years from the time of acquiring the shares. The annual maximum value of the bonus paid to a member of the Management Group in the bonus system equals the approximate value of annual gross salary. The system encompasses seven Management Group members, including the President and CEO. The fair value of granted share-based payments has been determined using the binary cash-or-nothing call option valuation model. The significant measurement parameters in the model are the share price at the commencement date of the earnings period, EUR 9.55 added with 10% resulting in EUR 10.50, and volatility 28%. The grant date of the share-based payments is the date of the Board resolution. The fair value of the share-based payments on the grant date was on average EUR 1.05/option whereby the total fair value of the plan amounted to EUR 313 thousand. Granted share-based payments will be subsequently valued at fair value at each closing date and the change in fair value will be recorded in the income statement to the extent the payments are vested. Each member to the plan will be compensated for the earnings period with an amount equivalent to 1.5 months’ gross salary for each one (1) euro, with which the closing share price (inclusive of dividends) exceeds the initial share value of EUR 10.50. Gross salary is defined for the purposes of the plan as the fixed monthly salary, inclusive of fringe benefits, prevailing at the commencement of the plan in May 2014. At the end of 2017, the fair value of the share-based payments vested and booked as current liabilities was EUR 13 thousand (81). This EUR 67 thousand decrease in the fair value of the share-based payments was booked in employee benefit expenses in the 2017 consolidated income statement.
Consolidated financial statements, IFRS
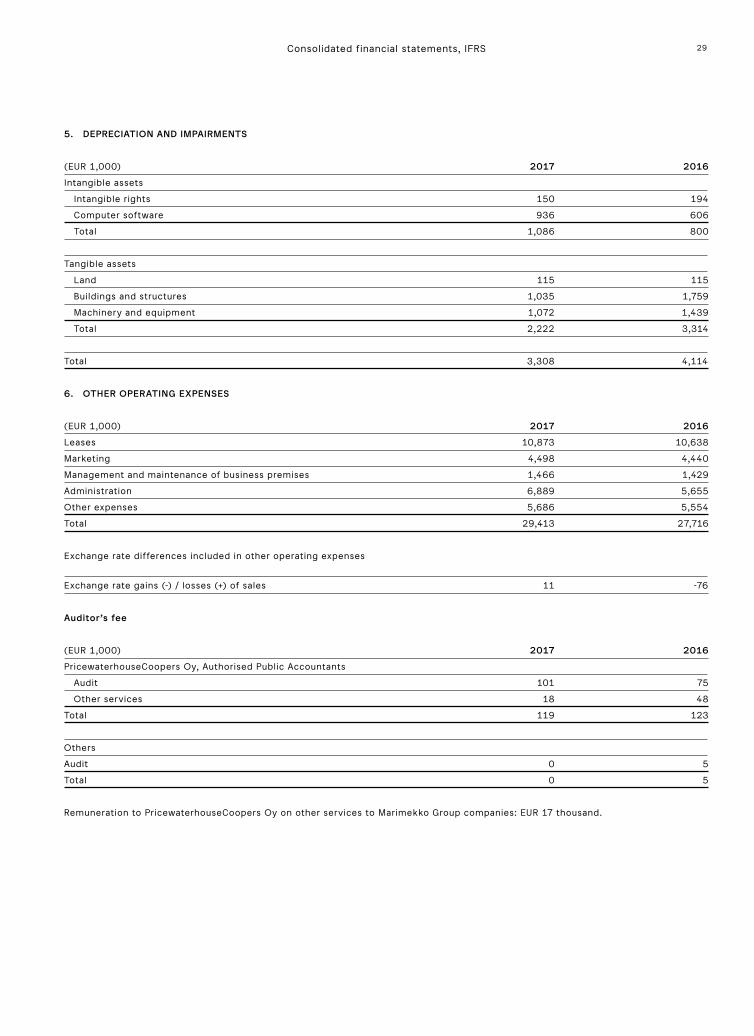
29
5. DEPRECIATION AND IMPAIRMENTS
(EUR 1,000) 2017 2016
Intangible assets
Intangible rights 150 194
Computer software 936 606
Total 1,086 800
Tangible assets
Land 115 115
Buildings and structures 1,035 1,759
Machinery and equipment 1,072 1,439
Total 2,222 3,314
Total 3,308 4,114
6. OTHER OPERATING EXPENSES
(EUR 1,000) 2017 2016
Leases 10,873 10,638
Marketing 4,498 4,440
Management and maintenance of business premises 1,466 1,429
Administration 6,889 5,655
Other expenses 5,686 5,554
Total 29,413 27,716
Exchange rate differences included in other operating expenses
Exchange rate gains (-) / losses (+) of sales 11 -76
Auditor’s fee
(EUR 1,000) 2017 2016
PricewaterhouseCoopers Oy, Authorised Public Accountants
Audit 101 75
Other services 18 48
Total 119 123
Others
Audit 0 5
Total 0 5
Remuneration to PricewaterhouseCoopers Oy on other services to Marimekko Group companies: EUR 17 thousand.
Consolidated financial statements, IFRS

30
7. FINANCIAL INCOME
(EUR 1,000) 2017 2016
Interest income on loans and other receivables 22 43
Other financial income 16 122
Total 39 164
Exchange rate gains included in financial income 16 122
8. FINANCIAL EXPENSES
(EUR 1,000) 2017 2016
Interest expenses on financial liabilities measured at amortised cost -84 -86
Interest expenses on finance lease liability -117 -119
Other financial expenses -1,068 -38
Total -1,269 -243
Exchange rate losses included in financial expenses 1,034
9. INCOME TAXES
(EUR 1,000) 2017 2016
Taxes on taxable earnings for the period 1,279 1,368
Taxes from previous periods 29
Deferred taxes 162 -230
Total 1,470 1,138
Reconciliation statement of taxes calculated on the basis of tax expenses in the income statement and the Group’s Finnish tax rate (20% in 2017 and 20% in 2016)
Profit before taxes 7,130 5,170
Taxes calculated at the Finnish tax rate 1,426 1,034
Different tax rates of foreign subsidiaries -4 -22
Non-recognised deferred income tax on taxable losses for the period 15 47
Taxes from previous periods 29 32
Non-deductible expenses 5 47
Taxes in the income statement 1,470 1,138
10. EARNINGS PER SHARE
2017 2016
Net result for the period, EUR 1,000 5,660 4,032
Weighted average number of shares, 1,000 8,090 8,090
Basic and dilluted earnings per share, EUR 0.70 0.50
Consolidated financial statements, IFRS

31
11. NON-CURRENT ASSETS
11.1 Intangible assets
2017 Advance payments and Intangible Computer acquisitions (EUR 1,000) rights software in progress Total
Acquisition cost, 1 Jan. 2017 2,360 5,913 131 8,403
Translation differences -4 -21 -25
Increases 37 664 701
Transfers 131 -131
Acquisition cost, 31 Dec. 2017 2,394 6,686 0 9,080
Accumulated depreciation, 1 Jan. 2017 2,045 4,866 6,910
Translation differences -2 -59 -61
Depreciation during the financial year 150 936 1,086
Accumulated depreciation, 31 Dec. 2017 2,192 5,743 7,935
Book value, 31 Dec. 2017 202 943 0 1,145
Book value, 1 Jan. 2017 428 1,161 268 1,856
Book value, 31 Dec. 2017 202 943 0 1,145
2016 Advance payments and Intangible Computer acquisitions (EUR 1,000) rights software in progress Total
Acquisition cost, 1 Jan. 2016 2,278 7,628 268 10,174
Translation differences 1 6 7
Increases 81 315 177 573
Decreases -2,208 -142 -2,350
Transfers 171 -171
Acquisition cost, 31 Dec. 2016 2,360 5,913 131 8,403
Accumulated depreciation, 1 Jan. 2016 1,851 6,467 8,317
Translation differences 1 0 1
Accumulated depreciation of decreases 2,208 2,208
Depreciation during the financial year 194 606 800
Accumulated depreciation, 31 Dec. 2016 2,045 4,866 6,910
Book value, 31 Dec. 2016 315 1,047 131 1,493
Book value, 1 Jan. 2016 428 1,161 268 1,856
Book value, 31 Dec. 2016 315 1,047 131 1,493
Consolidated financial statements, IFRS

32
11.2 Tangible assets
2017 Advance Machinery payments and Buildings and and acquisitions (EUR 1,000) Land structures equipment in progress Total
Acquisition cost, 1 Jan. 2017 3,515 20,673 20,826 60 45,074
Translation differences -865 -545 -1,410
Increases 1 509 510
Transfers 60 -60 0
Acquisition cost, 31 Dec. 2017 3,515 19,870 20,789 0 44,174
Accumulated depreciation, 1 Jan. 2017 577 13,247 17,348 31,172
Translation differences -763 -564 -1,327
Depreciation during the financial year 115 1,035 1,072 2,222
Accumulated depreciation, 31 Dec. 2017 692 13,519 17,856 0 32,068
Book value, 31 Dec. 2017 2,823 6,351 2,933 0 12,107
Book value, 1 Jan. 2017 3,054 8,594 3,520 318 15,486
Book value, 31 Dec. 2017 2,823 6,351 2,933 0 12,107
Book value of production machinery, 31 Dec. 2017 1,694
2016 Advance Machinery payments and Buildings and and acquisitions (EUR 1,000) Land structures equipment in progress Total
Acquisition cost, 1 Jan. 2016 3,515 20,060 19,400 318 43,292
Translation differences 18 28 46
Increases 595 1,124 62 1,782
Decreases -1 -46 -46
Transfers 274 -274 0
Acquisition cost, 31 Dec. 2016 3,515 20,673 20,826 60 45,074
Accumulated depreciation, 1 Jan. 2016 460 11,466 15,880 27,806
Translation differences 22 30 52
Depreciation during the financial year 115 1,759 1,439 3,314
Accumulated depreciation, 31 Dec. 2016 577 13,247 17,348 31,172
Book value, 31 Dec. 2016 2,938 7,426 3,477 60 13,902
Book value, 1 Jan. 2016 3,054 8,594 3,520 318 15,486
Book value, 31 Dec. 2016 2,938 7,426 3,477 60 13,902
Book value of production machinery, 31 Dec. 2016 2,058
Consolidated financial statements, IFRS

33
11.3 Finance lease agreements
Land as well as machinery and equipment in tangible assets include the following assets acquired under finance lease agreements. The finance lease assets relate to the land lease agreement of the property of the Helsinki head office and printing factory as well as machinery and equipment leased under a finance lease agreement since 1 January 2014.
2017
Machinery and (EUR 1,000) Land equipment Total
Acquisition cost, 1 Jan. 2017 3,460 755 4,215
Increases 229 229
Acquisition cost, 31 Dec. 2017 3,460 984 4,444
Accumulated depreciation, 1 Jan. 2017 577 472 1,049
Depreciation during the financial year 115 196 311
Accumulated depreciation, 31 Dec. 2017 692 668 1,360
Book value, 31 Dec. 2017 2,768 316 3,084
Book value, 1 Jan. 2017 2,883 283 3,166
Book value, 31 Dec. 2017 2,768 316 3,084
2016
Machinery and (EUR 1,000) Land equipment Total
Acquisition cost, 1 Jan. 2016 3,460 588 4,048
Increases 167 167
Acquisition cost, 31 Dec. 2016 3,460 755 4,215
Accumulated depreciation, 1 Jan. 2016 461 286 747
Depreciation during the financial year 115 186 302
Accumulated depreciation, 31 Dec. 2016 577 472 1,049
Book value, 31 Dec. 2016 2,883 283 3,166
Book value, 1 Jan. 2016 2,999 302 3,301
Book value, 31 Dec. 2016 2,883 283 3,166
11.4 Available-for-sale financial assets
(EUR 1,000) 2017 2016
Available-for-sale shares
Acquisition cost, 1 Jan. 16 16
Decreases 0
Acquisition cost, 31 Dec. 16 16
Book value, 31 Dec. 16 16
Financial assets, total 16 16
Available-for-sale financial assets comprise unlisted shares, which are presented at cost because their fair values are not reliably known.
Consolidated financial statements, IFRS
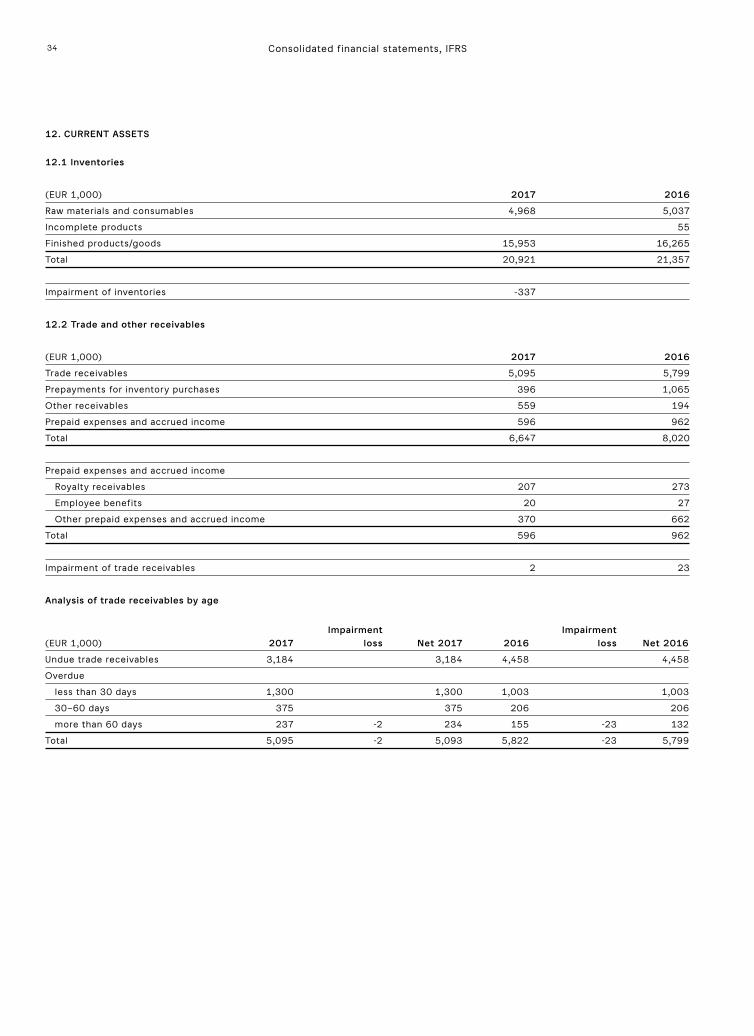
34
12. CURRENT ASSETS
12.1 Inventories
(EUR 1,000) 2017 2016
Raw materials and consumables 4,968 5,037
Incomplete products 55
Finished products/goods 15,953 16,265
Total 20,921 21,357
Impairment of inventories -337
12.2 Trade and other receivables
(EUR 1,000) 2017 2016
Trade receivables 5,095 5,799
Prepayments for inventory purchases 396 1,065
Other receivables 559 194
Prepaid expenses and accrued income 596 962
Total 6,647 8,020
Prepaid expenses and accrued income
Royalty receivables 207 273
Employee benefits 20 27
Other prepaid expenses and accrued income 370 662
Total 596 962
Impairment of trade receivables 2 23
Analysis of trade receivables by age
Impairment Impairment (EUR 1,000) 2017 loss Net 2017 2016 loss Net 2016
Undue trade receivables 3,184 3,184 4,458 4,458
Overdue
less than 30 days 1,300 1,300 1,003 1,003
30–60 days 375 375 206 206
more than 60 days 237 -2 234 155 -23 132
Total 5,095 -2 5,093 5,822 -23 5,799
Consolidated financial statements, IFRS
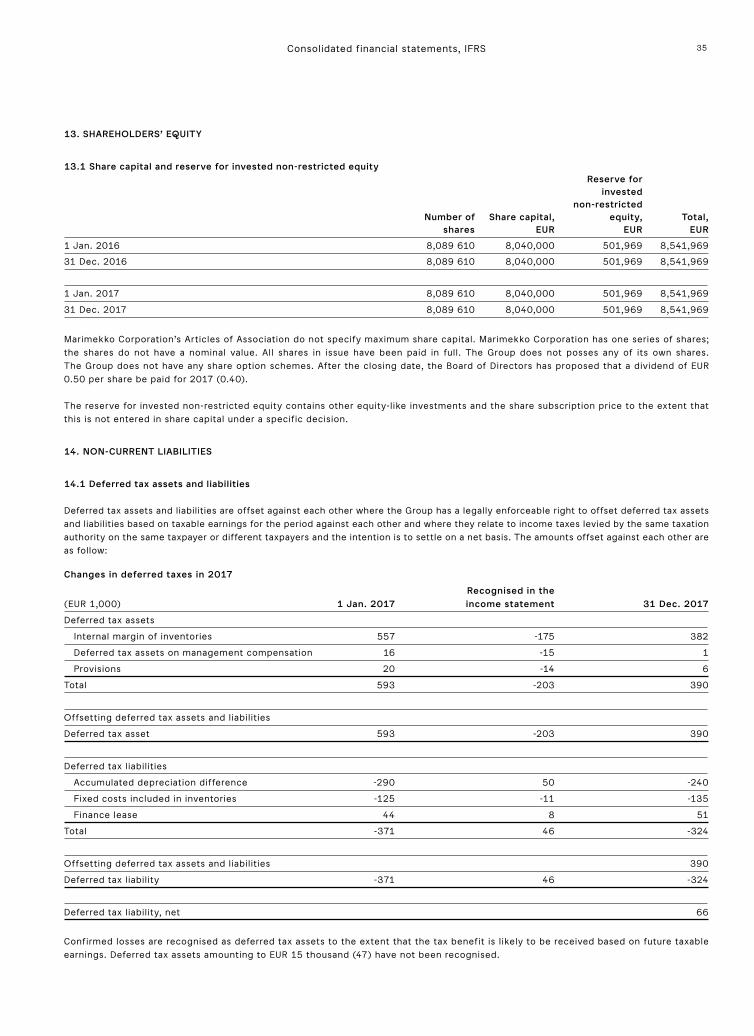
35
13. SHAREHOLDERS’ EQUITY
13.1 Share capital and reserve for invested non-restricted equity Reserve for invested non-restricted Number of Share capital, equity, Total, shares EUR EUR EUR
1 Jan. 2016 8,089 610 8,040,000 501,969 8,541,969
31 Dec. 2016 8,089 610 8,040,000 501,969 8,541,969
1 Jan. 2017 8,089 610 8,040,000 501,969 8,541,969
31 Dec. 2017 8,089 610 8,040,000 501,969 8,541,969
Marimekko Corporation’s Articles of Association do not specify maximum share capital. Marimekko Corporation has one series of shares; the shares do not have a nominal value. All shares in issue have been paid in full. The Group does not posses any of its own shares. The Group does not have any share option schemes. After the closing date, the Board of Directors has proposed that a dividend of EUR 0.50 per share be paid for 2017 (0.40). The reserve for invested non-restricted equity contains other equity-like investments and the share subscription price to the extent that this is not entered in share capital under a specific decision.
14. NON-CURRENT LIABILITIES
14.1 Deferred tax assets and liabilities
Deferred tax assets and liabilities are offset against each other where the Group has a legally enforceable right to offset deferred tax assets and liabilities based on taxable earnings for the period against each other and where they relate to income taxes levied by the same taxation authority on the same taxpayer or different taxpayers and the intention is to settle on a net basis. The amounts offset against each other are as follow: Changes in deferred taxes in 2017
Recognised in the (EUR 1,000) 1 Jan. 2017 income statement 31 Dec. 2017
Deferred tax assets
Internal margin of inventories 557 -175 382
Deferred tax assets on management compensation 16 -15 1
Provisions 20 -14 6
Total 593 -203 390
Offsetting deferred tax assets and liabilities
Deferred tax asset 593 -203 390
Deferred tax liabilities
Accumulated depreciation difference -290 50 -240
Fixed costs included in inventories -125 -11 -135
Finance lease 44 8 51
Total -371 46 -324
Offsetting deferred tax assets and liabilities 390
Deferred tax liability -371 46 -324
Deferred tax liability, net 66
Confirmed losses are recognised as deferred tax assets to the extent that the tax benefit is likely to be received based on future taxable earnings. Deferred tax assets amounting to EUR 15 thousand (47) have not been recognised.
Consolidated financial statements, IFRS

36
Changes in deferred taxes in 2016 Recognised in the (EUR 1,000) 1 Jan. 2016 income statement 31 Dec. 2016
Deferred tax assets
Internal margin of inventories 407 150 557
Deferred tax assets on management compensation 10 6 16
Provisions 38 -18 20
Total 455 138 593
Offsetting deferred tax assets and liabilities
Deferred tax asset 455 138 593
Deferred tax liabilities
Accumulated depreciation difference -345 55 -290
Fixed costs included in inventories -155 30 -125
Finance lease 37 7 44
Total -463 92 -371
Offsetting deferred tax assets and liabilities 593
Deferred tax liability -463 92 -371
Deferred tax liability, net 222
14.2 Non-current provisions
(EUR 1,000) 2017 2016
Provision for restructuring cost
Book value, 1 Jan. 71 190
Decreases -39 -119
Transfer to short-term provisions -32
Book value, 31 Dec. 0 71
The non-current provisions relate to the company’s possible future obligation to pay the employer’s liability component within the unemployment insurance contribution. This future payment obligation to the Unemployment Insurance Fund was born as a result of the redundancies following consultative negotiations in Finland in 2013, 2014 and 2015. The payment obligation materialises for the most part within two years after the ending of the employment of the employee meeting the requirements of the employer’s liability component.
14.3 Interest-bearing non-current liabilities
(EUR 1,000) 2017 2016
Financial liabilities 2,594
Finance lease liabilities 3,097 3,171
Total 3,097 5,765
The interest rate of the financial liabilities was 0.3–0.9% (0.2–1.3%). All f inancial liabilities were euro denominated.
Consolidated financial statements, IFRS

37
15. CURRENT LIABILITIES
15.1 Current liabilities
(EUR 1,000) 2017 2016
Trade and other payables
Trade payables 5,554 5,018
Other payables 2,192 2,611
Accrued liabilities and deferred income 4,447 5,527
Provisions 32 26
Finance lease liabilities 244 214
Current tax liabilities 552 945
Total 13,021 14,341
Accrued liabilities and deferred income
Employee benefits 3,126 3,079
Other accrued liabilities and deferred income 1,321 2,447
Total 4,447 5,527
15.2 Finance lease liabilities Assets are classif ied as assets leased under a finance lease agreement, if the risks and rewards incidental to ownership of the assets are substantially assumed by the Group. The lease liabilities have efficient security, since the lessor regains the right to the leased asset, if lease payments are neglected. The Group’s finance lease liabilities relate to the land lease of the property of the Helsinki head office and printing factory as well as machinery and equipment leased under a finance lease agreement since 1 January 2014.
Gross amount of finance lease liabilities – minimum lease payments by due date:
(EUR 1,000) 2017 2016
No later than 1 year 393 356
Later than 1 year – no later than 5 years 961 946
Later than 5 years 3,574 3,762
Total 4,928 5,064
Future financial expenses -1,588 -1,678
Current value of the finance lease liabilities 3,341 3,385
The current value of the finance lease liabilities matures as follows:
No later than 1 year 244 214
Later than 1 year – no later than 5 years 518 497
Later than 5 years 2,579 2,674
Current value of the finance lease liabilities 3,341 3,385
Consolidated financial statements, IFRS

38
16. FAIR VALUES OF FINANCIAL ASSETS AND LIABILITIES
The company’s financial assets consist of short-term trade and other receivables as well as cash and cash equivalents. Therefore the book value of these asstes is a fair assumption of their fair value. The book value of trade and other payables is also a fair assumption of their fair value. Book values and fair values of financial liabilities and finance lease liabilities
Book value Fair value Book value Fair value(EUR 1,000) 2017 2017 2016 2016
Financial liabilities 2,594 2,594
Finance lease liabilities 3,341 3,341 3,385 3,385
The company has determined the fair value based on the discounted cash flows using the market rate and credit risk premium at the end of the financial period. The fair values have been classif ied at level 3 of the fair value hierarchy as they include the management’s estimates. The levels of the fair value hierarchy are presented below: - quoted prices in active markets for identical assets and liabilities (level 1). - inputs other than quoted prices included in level 1 that are observable for the asset or liability (level 2). - inputs for the asset or liability that are not based on observable market data (unobservable inputs) (level 3).
17. GUARANTEES, CONTINGENT LIABILITIES AND OTHER COMMITMENTS
(EUR 1,000) 2017 2016
Other own liabilities and commitments
Lease liabilities for machinery and equipment 313 361
Liabilities relating to lease agreements for business premises 25,395 32,348
Commitments, total 25,709 32,709
Other lease agreements
The Group as lessee
Minimum lease payments under other non-cancellable lease agreements
No later than 1 year 9,516 9,761
Later than 1 year – no later than 5 years 16,150 21,204
Later than 5 years 43 1,744
Total 25,709 32,709
The Group has leased several of its store, office and warehouse premises. These lease agreements are valid either for a fixed period or for the time being. The rent icrease index, renewal and other terms of the agreements vary. The 2017 income statement includes EUR 10,873 thousand (10,638) in rental expenses paid on the basis of other non-cancellable lease agreements. The Group has no liabilities resulting from derivative contracts, and there are no outstanding guarantees or any other contingent liabilities which have been granted on behalf of the management of the company or its shareholders.
Consolidated financial statements, IFRS

39
18. RELATED PARTY TRANSACTIONS
The Group’s related parties include the members of the Board of Directors and Management Group as well as the parent company and subsidiaries. The following members of the Board of Directors and Management Group were related parties to the Group in 2017: Mika Ihamuotila, Chairman of the BoardElina Björklund, Vice Chairman of the BoardRebekka Bay, member of the Board from 6 April 2017Arthur Engel, member of the BoardMikko-Heikki Inkeroinen, member of the BoardJoakim Karske, member of the Board until 6 April 2017Helle Priess, member of the Board from 6 April 2017Catharina Stackelberg-Hammarén, member of the Board Tiina Alahuhta-Kasko, President and CEO, member of the Management GroupElina Aalto, CFO and member of the Management GroupTina Broman, CSCO and member of the Management Group from 2 October 2017Kari Härkönen, CDO and member of the Management Group from 14 December 2017 Päivi Lonka, CSO and member of the Management GroupPäivi Paltola, CMO and member of the Management Group from 30 January 2017Tanya Strohmayer, HRD and member of the Management Group from 28 February 2017Anna Teurnell, Creative Director and member of the Management Group until 27 February 2017 The following members of the Board of Directors and Management Group were related parties to the Group in 2016: Mika Ihamuotila, Chairman of the Board Elina Björklund, Vice Chairman of the Board Arthur Engel, member of the BoardMikko-Heikki Inkeroinen, member of the Board Joakim Karske, member of the BoardCatharina Stackelberg-Hammarén, member of the BoardTiina Alahuhta-Kasko, President and CEO and member of the Management Group (President until 11 April 2016, President and CEO from 11 April 2016)Elina Aalto, CFO and member of the Management Group Lasse Lindqvist, CMO and member of the Management Group until 15 June 2016Päivi Lonka, CSO and member of the Management GroupNiina Nenonen, CPO and member of the Management Group until 15 March 2016Anna Teurnell, Creative Director and member of the Management Group The relationships of the Group’s parent company and subsidiaries are as follows:
Parent company
Marimekko Corporation, Helsinki, Finland
Subsidiaries
Company and domicile Group’s holding, % Share of voting rights, %
Keskinäinen Kiinteistö Oy Marikko, Helsinki, Finland 100 100
Marimekko Services Oy, Helsinki, Finland 100 100
Marimekko AB, Stockholm, Sweden *) 100 100
Marimekko Australia PTY Ltd, Victoria, Australia 100 100
Marimekko GmbH, Frankfurt am Main, Germany 100 100
Marimekko North America LLC, Delaware, United States 100 100
Marimekko North America Retail LLC, Delaware, United States 100 100
Marimekko North America Holding Co, Delaware, United States 100 100
Marimekko UK Ltd, London, United Kingdom 100 100
*) Marimekko AB has branches in Norway and Denmark.
Consolidated financial statements, IFRS

40
The following transactions were carried out with related parties: Management’s employee benefits
Emoluments
Employee benefits of the President and CEO as well as other members of the Management Group in 2017 Salaries and Share-based (EUR 1,000) bonuses bonus system *) Total
Mika Ihamuotila, full-time Chairman of the Board 111 111
Tiina Alahuhta-Kasko, President and CEO 316 316
Other members of the Management Group 864 864
Total 1,291 1,291
Remuneration to the Board of Directors in 2017
(EUR 1,000)
Rebekka Bay ¹ 54
Elina Björklund 30
Arthur Engel ² 30
Mika Ihamuotila 40
Mikko-Heikki Inkeroinen 22
Helle Priess ³ 42
Catharina Stackelberg-Hammarén 22
Total 241
Employee benefits of the management in 2017, total 1,532
*) The change in fair value of the cash-settled plan was negative. 1 Board remuneration EUR 22 thousand and payments for consulting services EUR 32 thousand.2 Board remuneration EUR 22 thousand and payments for consulting services EUR 8 thousand.3 Board remuneration EUR 22 thousand and payments for consulting services EUR 20 thousand.
Employee benefits of the President and CEO as well as other members of the Management Board in 2016 Salaries and Share-based (EUR 1,000) bonuses bonus system *) Total
Mika Ihamuotila, Chairman of the Board ¹ 171
Tiina Alahuhta-Kasko, President and CEO ² 232
Other members of the Management Group 609
Total 1,012 30 1,042
Remuneration to the Board of Directors in 2016
(EUR 1,000)
Elina Björklund 30
Arthur Engel ³ 47
Mika Ihamuotila ¹ 40
Mikko-Heikki Inkeroinen 22
Joakim Karske 22
Catharina Stackelberg-Hammarén 22
Total 183
Employee benefits of the management in 2016, total 1,225
*) Change in fair value of the cash-settled plan.1 CEO and Chairman of the Board until 11 April 2016, full-time Chairman of the Board from 11 April 2016.2 President until 11 April 2016, President and CEO from 11 April 2016.3 Board remuneration EUR 22 thousand and payments for consulting services EUR 25 thousand.
Consolidated financial statements, IFRS

41
The pension benefits include only statutory pension payments. The management does not have additional pension benefits. Related parties are among beneficiaries of share-based bonus systems. The management’s long-term bonus systems are presented in greater detail under note 4 to the financial statements. Other related party transactions
In 2016, Marimekko Corporation paid consultancy fees amounting to EUR 13 thousand to Oy H Ihamuotila Ab Ltd, a company owned by Helena Ihamuotila, wife of Mika Ihamuotila, full-time Chairman of the Board. The consultancy consisted of separately determined PR assignments. 19. FINANCIAL RISK MANAGEMENT During the normal course of its business operations, the Marimekko Group is exposed to financial risks. The principal f inancial risks are liquidity risk, credit risk, foreign currency risk and interest rate risk. The company’s Board of Directors has confirmed the principles, responsibilities and organisation of risk management for the Group. The Board of Directors also monitors the success of risk management. According to its risk management principles, Marimekko classif ies its risks as strategic, operational, economic and accident risks. Economic risks include financial risks. Responsibility for the implementation of risk management measures concerning financial risks lies with the Group’s CFO. The main objective of financial risk management is to ensure reasonably-priced financing in all circumstances, and thereby minimise the unfavourable effects, if any, on the Group’s financial performance. Marimekko has not used derivative instruments when hedging against risks. Liquidity risk The Group continuously seeks to assess and monitor the amount of funding required by the business operations to ensure that sufficient liquid funds are available for the daily business and repayment of maturing debts. The assessment is based on monthly cash flow and liquidity forecasts. The Group aims to maintain a high liquidity level at all times in order to eliminate liquidity risk. In order to minimise liquidity risk, the Group’s near-term and next few years’ f inancing needs can be covered by liquid funds as well as committed long-term or short-term credit facilities or credit facilities valid until further notice. At the end of the financial period, the Group had access to credit facilities totalling EUR 18 million, out of which EUR 13 million were valid until further notice. No committed credit facilities were drawn at the end of the financial period. The Marimekko Group’s borrowing is unsecured. However, the committed credit facilities include two financial covenants: the ratio of net debt excluding finance lease debt to EBITDA as well as the Group’s equity ratio. The conditions in the loan agreements have been met during the financial year. Maturity analysis for the Group’s financial liabilities; the figures are not discounted, and they include both interest payments and capital repayments:
31 Dec. 2017
(EUR 1,000) Less than 1 year 1–2 years 3–5 years Over 5 years
Finance lease liabilities 393 527 592 3,386
Trade and other payables 12,519
Total 12,912 527 592 3,386
31 Dec. 2016
(EUR 1,000) Less than 1 year 1–2 years 3–5 years Over 5 years
Financial liabilities 13 2,607
Finance lease liabilities 414 536 597 3,575
Trade and other payables 13,156
Total 13,583 3,143 597 3,575
Consolidated financial statements, IFRS
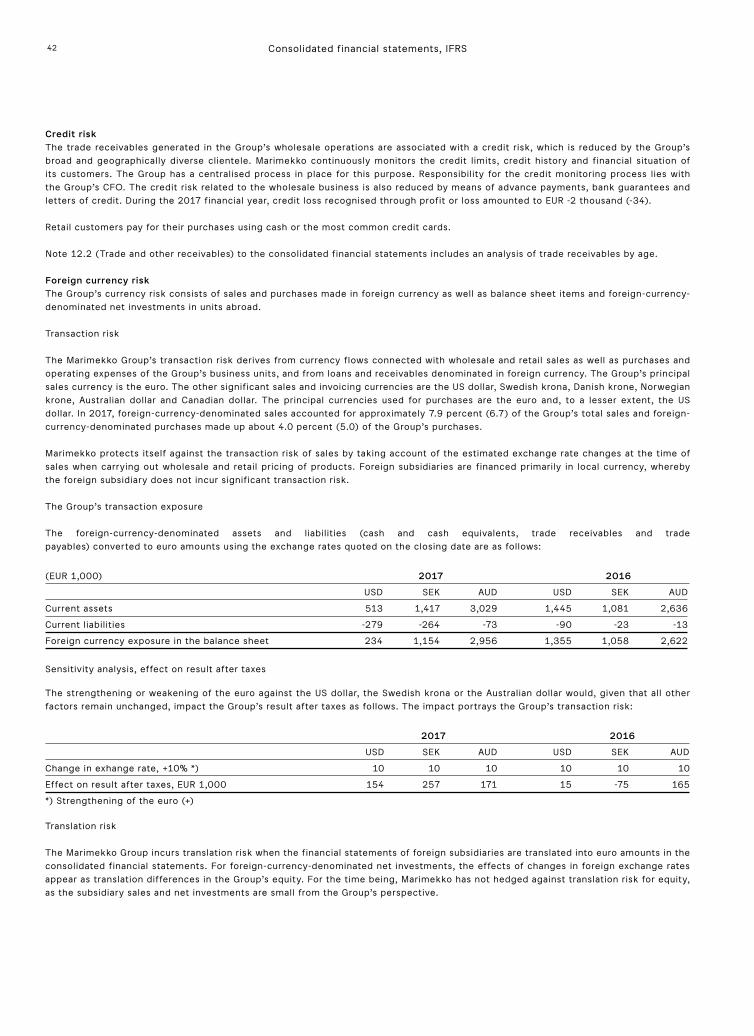
42
Credit risk The trade receivables generated in the Group’s wholesale operations are associated with a credit risk, which is reduced by the Group’s broad and geographically diverse clientele. Marimekko continuously monitors the credit limits, credit history and financial situation of its customers. The Group has a centralised process in place for this purpose. Responsibility for the credit monitoring process lies with the Group’s CFO. The credit risk related to the wholesale business is also reduced by means of advance payments, bank guarantees and letters of credit. During the 2017 financial year, credit loss recognised through profit or loss amounted to EUR -2 thousand (-34). Retail customers pay for their purchases using cash or the most common credit cards. Note 12.2 (Trade and other receivables) to the consolidated financial statements includes an analysis of trade receivables by age. Foreign currency risk The Group’s currency risk consists of sales and purchases made in foreign currency as well as balance sheet items and foreign-currency-denominated net investments in units abroad. Transaction risk The Marimekko Group’s transaction risk derives from currency flows connected with wholesale and retail sales as well as purchases and operating expenses of the Group’s business units, and from loans and receivables denominated in foreign currency. The Group’s principal sales currency is the euro. The other significant sales and invoicing currencies are the US dollar, Swedish krona, Danish krone, Norwegian krone, Australian dollar and Canadian dollar. The principal currencies used for purchases are the euro and, to a lesser extent, the US dollar. In 2017, foreign-currency-denominated sales accounted for approximately 7.9 percent (6.7) of the Group’s total sales and foreign-currency-denominated purchases made up about 4.0 percent (5.0) of the Group’s purchases. Marimekko protects itself against the transaction risk of sales by taking account of the estimated exchange rate changes at the time of sales when carrying out wholesale and retail pricing of products. Foreign subsidiaries are financed primarily in local currency, whereby the foreign subsidiary does not incur significant transaction risk. The Group’s transaction exposure The foreign-currency-denominated assets and liabilities (cash and cash equivalents, trade receivables and trade payables) converted to euro amounts using the exchange rates quoted on the closing date are as follows:
(EUR 1,000) 2017 2016
USD SEK AUD USD SEK AUD
Current assets 513 1,417 3,029 1,445 1,081 2,636
Current liabilities -279 -264 -73 -90 -23 -13
Foreign currency exposure in the balance sheet 234 1,154 2,956 1,355 1,058 2,622
Sensitivity analysis, effect on result after taxes The strengthening or weakening of the euro against the US dollar, the Swedish krona or the Australian dollar would, given that all other factors remain unchanged, impact the Group’s result after taxes as follows. The impact portrays the Group’s transaction risk:
2017 2016
USD SEK AUD USD SEK AUD
Change in exhange rate, +10% *) 10 10 10 10 10 10
Effect on result after taxes, EUR 1,000 154 257 171 15 -75 165
*) Strengthening of the euro (+)
Translation risk The Marimekko Group incurs translation risk when the financial statements of foreign subsidiaries are translated into euro amounts in the consolidated financial statements. For foreign-currency-denominated net investments, the effects of changes in foreign exchange rates appear as translation differences in the Group’s equity. For the time being, Marimekko has not hedged against translation risk for equity, as the subsidiary sales and net investments are small from the Group’s perspective.
Consolidated financial statements, IFRS

43
Interest rate risk The Group’s interest rate risk primarily results from changes in the interest on cash and cash equivalents and on current and non-current interest-bearing liabilities due to changes in market rates. The changes in the interest rates of these assets and liabilities have an impact on the Group’s profit.
(EUR 1,000) 2017 2016
Cash and cash equivalents 6,212 3,482
Interest-bearing liabilities 2,594
Finance lease liabilities 3,341 3,385
The Group’s interest-bearing liabilities at the end of the financial year consisted of drawn credit facilities and finance lease liabilities. The Group had access to credit facilities totalling EUR 18 million, of which EUR 13 million were committed long-term credit facilities or valid until futher notice. The credit facilities are denominated in euros and have variable interest rates. At the end of the 2017 financial year, no credit facilities were drawn; at the end of 2016, facilities valid until further notice amounting to EUR 2.6 million were drawn.
20. CAPITAL MANAGEMENT
The purpose of capital management is to maintain a capital structure that optimally supports the Group’s strategic objectives. Efficient capital management measures ensure normal operating conditions for the business and increase the shareholder value in the long term. The principal factors affecting the capital structure are profitability, dividend distribution and investments. The capital managed equals the shareholders’ equity shown on the consolidated balance sheet. No external capital requirements are applied to the Group. The Group continuously monitors the development of its capital structure by means of the equity ratio and gearing. The Group’s strategic objective is to maintain the equity ratio at the minimum of 50 percent. At the end of 2017, the Group’s net liabilities amounted to EUR -2,871 thousand (2,497) and gearing was -9.4 percent (8.8).
Gearing
(EUR 1,000) 2017 2016
Financial liabilities 2,594
Finance lease liabilities 3,341 3,385
Deducting cash and cash equivalents -6,212 -3,482
Net liabilities -2,871 2,497
Shareholders’ equity, total 30,669 28,316
Gearing, % -9.4 8.8
21. NOTES TO CASH FLOW STATEMENT
Balance sheet Cash flow statement Balance sheet 31 Dec. 2017 1 Jan.–31 Dec. 2017 1 Jan. 2017
Financial liabilities
Long-term overdraft account -2,594 2,594
Finance lease liabilities
Finance lease liabilities, increases during 2017 229
Finance lease liabilities 3,112 -273 3,385
Financial liabilities, total 3,341 -2,867 5,979
22. EVENTS AFTER THE CLOSING DATE
The management of the company is not aware of any significant events after the closing date.
Consolidated financial statements, IFRS

44
Parent company financial statements, FAS
PARENT COMPANY INCOME STATEMENT
(EUR 1,000) Note 1 Jan.–31 Dec. 2017 1 Jan.–31 Dec. 2016
NET SALES 1. 94,469 94,287
Increase (+) or decrease (-) in inventories of completed and unfinished products 569 2,544
Other operating income 2. 292 373
Materials and services 3. -38,277 -40,559
Personnel expenses 4. -17,291 -18,495
Depreciation and impairments 5. -2,007 -2,189
Other operating expenses 6. -30,758 -29,756
OPERATING PROFIT 6,997 6,204
Financial income and expenses 7. -872 528
RESULT BEFORE APPROPRIATIONS AND TAXES 6,125 6,732
Appropriations 8. 57 126
Income taxes 9. -1,234 -1,282
NET RESULT FOR THE PERIOD 4,948 5,577

45
PARENT COMPANY BALANCE SHEET
(EUR 1,000) Note 31 Dec. 2017 31 Dec. 2016
ASSETS
FIXED ASSETS 11.
Intangible assets 11.1 2,457 3,204
Tangible assets 11.2 2,398 2,932
Investments 11.3
Participations in Group companies 3,630 3,630
Other shares and participations 16 3,646 16 3,646
FIXED ASSETS, TOTAL 8,501 9,782
CURRENT ASSETS
Inventories 12. 18,668 19,122
Current receivables 13. 17,798 20,508
Cash in hand and at banks 3,926 758
CURRENT ASSETS, TOTAL 40,392 40,389
ASSETS, TOTAL 48,893 50,171
(EUR 1,000) 31 Dec. 2017 31 Dec. 2016
SHAREHOLDERS’ EQUITY AND LIABILITIES
SHAREHOLDERS’ EQUITY 14.
Share capital 8,040 8,040
Reserve for invested non-restricted equity 502 502
Retained earnings 13,744 11,403
Net profit for the period 4,948 5,577
SHAREHOLDERS’ EQUITY, TOTAL 27,234 25,522
ACCUMULATED APPROPRIATIONS 15. 1,373 1,430
PROVISIONS 16.
Other mandatory provisions 32 76
LIABILITIES 17.
Non-current liabilities 17.1 0 2,594
Current liabilities 17.2 20,254 20,549
LIABILITIES, TOTAL 20,254 23,143
SHAREHOLDERS’ EQUITY AND LIABILITIES, TOTAL 48,893 50,171
Parent company financial statements, FAS
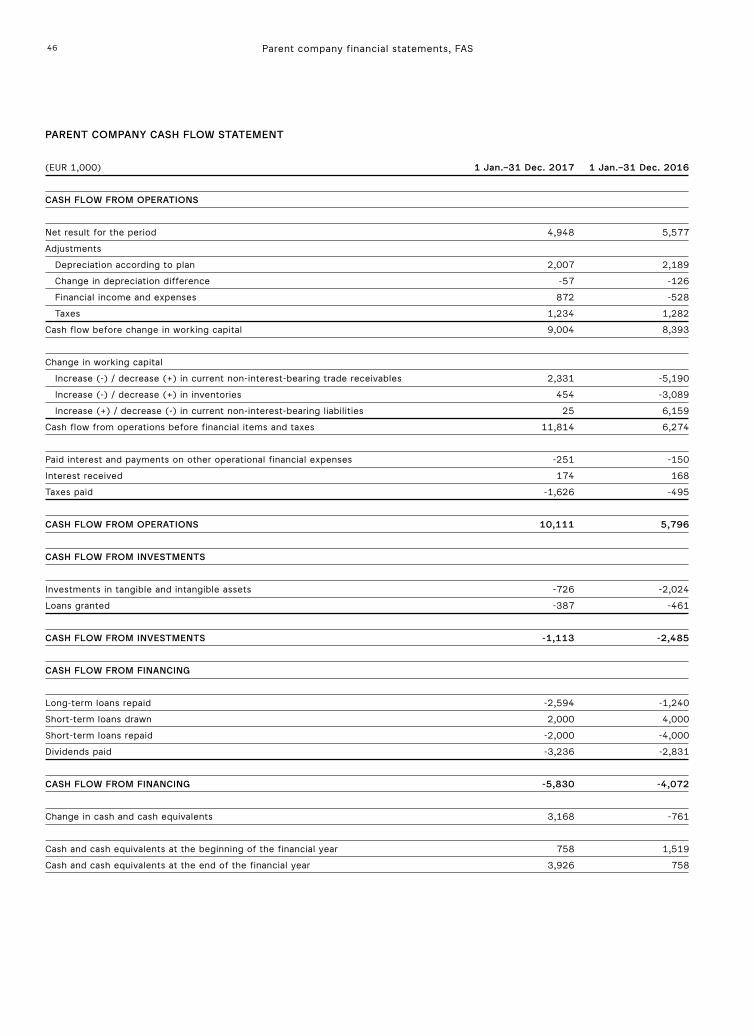
46
PARENT COMPANY CASH FLOW STATEMENT
(EUR 1,000) 1 Jan.–31 Dec. 2017 1 Jan.–31 Dec. 2016
CASH FLOW FROM OPERATIONS
Net result for the period 4,948 5,577
Adjustments
Depreciation according to plan 2,007 2,189
Change in depreciation difference -57 -126
Financial income and expenses 872 -528
Taxes 1,234 1,282
Cash flow before change in working capital 9,004 8,393
Change in working capital
Increase (-) / decrease (+) in current non-interest-bearing trade receivables 2,331 -5,190
Increase (-) / decrease (+) in inventories 454 -3,089
Increase (+) / decrease (-) in current non-interest-bearing liabilities 25 6,159
Cash flow from operations before financial items and taxes 11,814 6,274
Paid interest and payments on other operational financial expenses -251 -150
Interest received 174 168
Taxes paid -1,626 -495
CASH FLOW FROM OPERATIONS 10,111 5,796
CASH FLOW FROM INVESTMENTS
Investments in tangible and intangible assets -726 -2,024
Loans granted -387 -461
CASH FLOW FROM INVESTMENTS -1,113 -2,485
CASH FLOW FROM FINANCING
Long-term loans repaid -2,594 -1,240
Short-term loans drawn 2,000 4,000
Short-term loans repaid -2,000 -4,000
Dividends paid -3,236 -2,831
CASH FLOW FROM FINANCING -5,830 -4,072
Change in cash and cash equivalents 3,168 -761
Cash and cash equivalents at the beginning of the financial year 758 1,519
Cash and cash equivalents at the end of the financial year 3,926 758
Parent company financial statements, FAS

47
ACCOUNTING POLICY
Marimekko Corporation’s financial
statements have been prepared in
accordance with the legislation and
regulations that are in force in Finland.
The financial year of the company is
the calendar year.
Measurement of fixed assets
Fixed assets are recorded in the
balance sheet at the original acquisition
cost less depreciation according to
plan. Depreciation according to plan
has been calculated using straight-line
depreciation on the estimated useful
life of the fixed assets.
Periods of depreciation:
• intangible rights 5–10 years
• other capitalised expenditure
3–10 years
• machinery and equipment
5–15 years.
Inventories
Inventories are presented at the
acquisition cost or at the lower
probable net realisation value. The
value of inventories does not include
any share of fixed purchasing and
manufacturing costs.
Pension commitments
The pension security of the company’s
personnel has been arranged under
the statutory employee pension plan
(TyEL) through a pension insurance
company.
Items denominated in foreign
currency
The foreign-currency-denominated
receivables and liabilities of the
company have been converted to euro
amounts using the exchange rate
quoted by the European Central Bank
on the closing date.
Leasing
Leasing payments are treated as rental
expenditures.
Appropriations
On the basis of local legislation and
accounting practices, companies in
Finland and Sweden can, in their
separate financial statements, record
in appropriations the depreciation
difference and the change in
voluntary reserves, which are items
that mainly have an effect on taxation.
Taxes
Recorded as direct taxes are the direct
taxes calculated from the taxable
result of the company.
NOTES TO THE PARENT COMPANY FINANCIAL STATEMENTS
Parent company financial statements, FAS
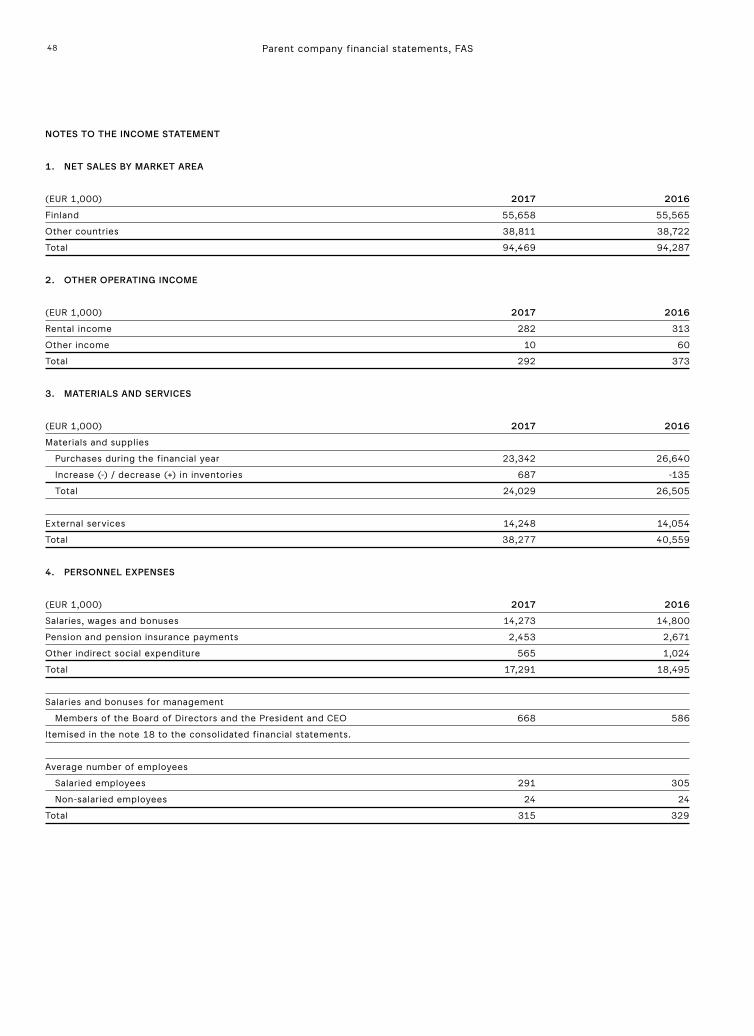
48
NOTES TO THE INCOME STATEMENT
1. NET SALES BY MARKET AREA
(EUR 1,000) 2017 2016
Finland 55,658 55,565
Other countries 38,811 38,722
Total 94,469 94,287
2. OTHER OPERATING INCOME
(EUR 1,000) 2017 2016
Rental income 282 313
Other income 10 60
Total 292 373
3. MATERIALS AND SERVICES
(EUR 1,000) 2017 2016
Materials and supplies
Purchases during the financial year 23,342 26,640
Increase (-) / decrease (+) in inventories 687 -135
Total 24,029 26,505
External services 14,248 14,054
Total 38,277 40,559
4. PERSONNEL EXPENSES
(EUR 1,000) 2017 2016
Salaries, wages and bonuses 14,273 14,800
Pension and pension insurance payments 2,453 2,671
Other indirect social expenditure 565 1,024
Total 17,291 18,495
Salaries and bonuses for management
Members of the Board of Directors and the President and CEO 668 586
Itemised in the note 18 to the consolidated financial statements.
Average number of employees
Salaried employees 291 305
Non-salaried employees 24 24
Total 315 329
Parent company financial statements, FAS

49
5. DEPRECIATION AND IMPAIRMENTS
(EUR 1,000) 2017 2016
Intangible assets
Intangible rights 137 181
Other capitalised expenditure 1,171 1,105
Total 1,308 1,286
Tangible assets
Buildings and structures 12 12
Machinery and equipment 687 892
Total 699 903
Total 2,007 2,189
6. OTHER OPERATING EXPENSES
(EUR 1,000) 2017 2016
Leases 7,378 7,160
Marketing 10,054 10,802
Other expenses 13,326 11,793
Total 30,758 29,756
7. FINANCIAL INCOME AND EXPENSES
(EUR 1,000) 2017 2016
Other interest and financial income
From Group companies 165 164
From others 21 162
Total 186 326
Interest and other financial expenses
Impairment of Group receivables 0 -350
To others 1,058 148
Total 1,058 -202
Financial income and expenses, total -872 528
Financial income and expenses include exchange rate differences (net)
From others 951 119
Total 951 119
Parent company financial statements, FAS
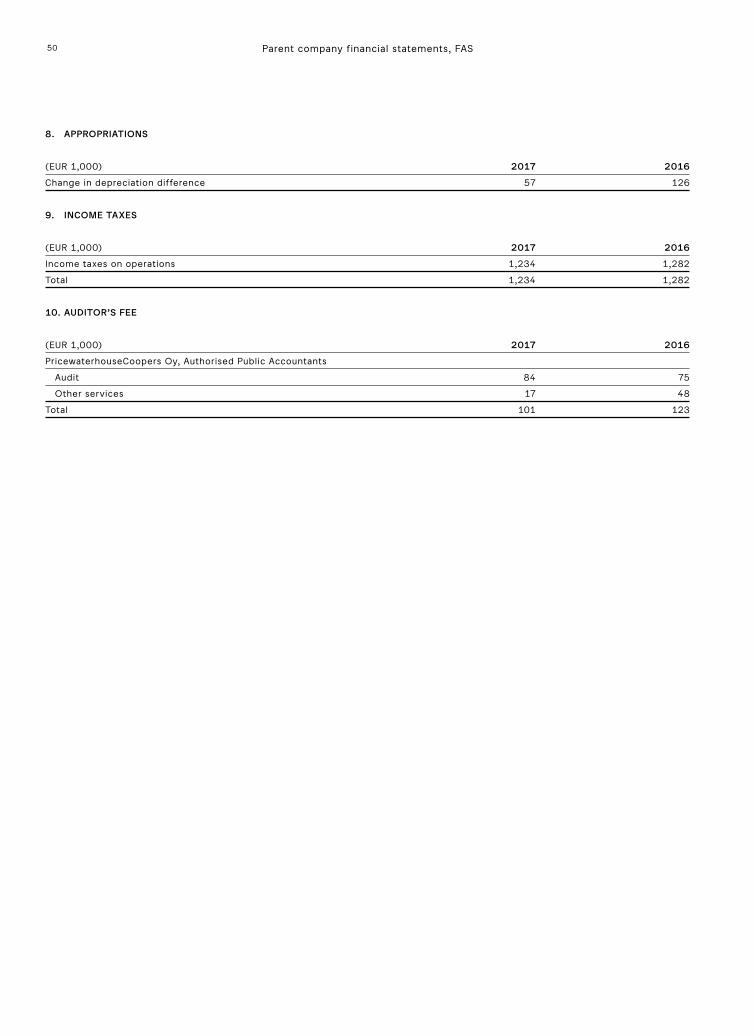
50
8. APPROPRIATIONS
(EUR 1,000) 2017 2016
Change in depreciation difference 57 126
9. INCOME TAXES
(EUR 1,000) 2017 2016
Income taxes on operations 1,234 1,282
Total 1,234 1,282
10. AUDITOR’S FEE
(EUR 1,000) 2017 2016
PricewaterhouseCoopers Oy, Authorised Public Accountants
Audit 84 75
Other services 17 48
Total 101 123
Parent company financial statements, FAS

51
NOTES TO THE BALANCE SHEET
11. FIXED ASSETS 11.1 Intangible assets
2017 Advance Other payments and Intangible Computer capitalised acquisitions (EUR 1,000) rights software expenditure in progress Total
Acquisition cost, 1 Jan. 2017 1,682 5,464 6,896 132 14,174
Increases 37 393 130 560
Transfers between groups 132 -132
Acquisition cost, 31 Dec. 2017 1,719 5,989 7,026 14,734
Accumulated depreciation, 1 Jan. 2017 1,384 4,866 4,720 10,970
Depreciation during the financial year 137 623 548 1,308
Accumulated depreciation, 31 Dec. 2017 1,521 5,489 5,268 12,278
Book value, 31 Dec. 2017 199 500 1,758 2,457
2016 Advance Other payments and Intangible Computer capitalised acquisitions (EUR 1,000) rights software expenditure in progress Total
Acquisition cost, 1 Jan. 2016 1,601 5,292 6,187 269 13,350
Increases 81 567 177 825
Transfers between groups 171 142 -314
Acquisition cost, 31 Dec. 2016 1,682 5,464 6,896 132 14,174
Accumulated depreciation, 1 Jan. 2016 1,203 4,260 4,222 9,684
Depreciation during the financial year 181 606 498 1,286
Accumulated depreciation, 31 Dec. 2016 1,384 4,866 4,720 10,970
Book value, 31 Dec. 2016 299 598 2,176 132 3,204
11.2 Tangible assets
2017 Advance Machinery Other payments and Land and Buildings and and tangible acquisitions (EUR 1,000) water areas structures equipment assets in progress Total
Acquisition cost, 1 Jan. 2017 38 417 14,084 28 14,568
Increases 165 165
Acquisition cost, 31 Dec. 2017 38 417 14,249 28 14,733
Accumulated depreciation, 1 Jan. 2017 295 11,340 11,635
Depreciation during the financial year 12 687 699
Accumulated depreciation, 31 Dec. 2017 307 12,027 12,334
Book value, 31 Dec. 2017 38 110 2,222 28 2,398
Parent company financial statements, FAS

52
2016 Advance Machinery Other payments and Land and Buildings and and tangible acquisitions (EUR 1,000) water areas structures equipment assets in progress Total
Acquisition cost, 1 Jan. 2016 38 417 12,886 28 317 13,687
Increases 924 2 926
Transfers between groups 274 -274
Decreases -46 -46
Acquisition cost, 31 Dec. 2016 38 417 14,084 28 14,568
Accumulated depreciation, 1 Jan. 2016 260 10,472 10,732
Depreciation during the financial year 35 868 903
Accumulated depreciation, 31 Dec. 2016 295 11,340 11,635
Book value, 31 Dec. 2016 38 122 2,744 28 2,932
Book value of production machinery and equipment
31 Dec. 2017 1,694
31 Dec. 2016 2,058
11.3 Investments 2017 Shares in Group Other shares and (EUR 1,000) companies participations Total
Acquisition cost, 1 Jan. 2017 3,921 16 3,937
Acquisition cost, 31 Dec. 2017 3,921 16 3,937
Accumulated depreciation, 31 Dec. 2017 290 290
Book value, 31 Dec. 2017 3,631 16 3,646
2016 Shares in Group Other shares and (EUR 1,000) companies participations Total
Acquisition cost, 1 Jan. 2016 3,921 16 3,937
Acquisition cost, 31 Dec. 2016 3,921 16 3,937
Accumulated depreciation, 31 Dec. 2016 290 290
Book value, 31 Dec. 2016 3,631 16 3,647
Parent company financial statements, FAS

53
Group companies
Company and domicile Parent company’s holding, % Share of voting rights, %
Keskinäinen Kiinteistö Oy Marikko, Helsinki, Finland 100 100
Marimekko Services Oy, Helsinki, Finland 100 100
Marimekko AB, Stockholm, Sweden *) 100 100
Marimekko Australia PTY Ltd, Victoria, Australia 100 100
Marimekko GmbH, Frankfurt am Main, Germany 100 100
Marimekko North America LLC, Delaware, United States 100 100
Marimekko North America Retail LLC, Delaware, United States 100 100
Marimekko North America Holding Co, Delaware, United States 100 100
Marimekko UK Ltd, London, United Kingdom 100 100
*) Marimekko AB has branches in Norway and Denmark.
12. INVENTORIES
(EUR 1,000) 2017 2016
Raw materials and consumables 4,835 4,982
Incomplete products 133 55
Finished products/goods 13,304 13,364
Advance payments 396 721
Total 18,668 19,122
13. CURRENT RECEIVABLES
(EUR 1,000) 2017 2016
Trade receivables 4,971 5,714
Receivables from Group companies
Trade receivables 3,490 4,789
Loan receivables 8,819 9,211
Prepaid expenses and accrued income 18 140
Total 12,327 14,140
Other receivables 41 41
Prepaid expenses and accrued income 459 612
Total 17,798 20,508
Prepaid expenses and accrued income
Royalty receivables 207 273
Tax assets 0 3
Other prepaid expenses and accrued income 252 336
Total 459 612
In 2016, Marimekko Corporation reversed impairment bookings made in 2013 amounting to EUR 350 thousand. The impairment reversal was made on loan receivables from the Swedish subsidiary.
Parent company financial statements, FAS

54
14. SHAREHOLDERS’ EQUITY
(EUR 1,000) 2017 2016
Share capital, 1 Jan. 8,040 8,040
Share capital, 31 Dec. 8,040 8,040
Reserve for invested non-restricted equity, 1 Jan. 502 502
Reserve for invested non-restricted equity, 31 Dec. 502 502
Retained earnings, 1 Jan. 16,980 14,235
Dividends paid -3,236 -2,831
Retained earnings, 31 Dec. 13,744 11,403
Net result for the period 4,948 5,577
Shareholders’ equity, total 27,234 25,522
Calculation of distributable funds, 31 Dec.
(EUR 1,000) 2017 2016
Retained earnings 13,744 11,403
Net result for the period 4,948 5,577
Reserve for invested non-restricted equity 502 502
Total 19,194 17,482
15. ACCUMULATED APPROPRIATIONS
(EUR 1,000) 2017 2016
Accumulated depreciation difference
Intangible rights 50 68
Other capitalised expenditure 796 739
Machinery and equipment 385 482
Buildings and structures 141 141
Total 1,372 1,430
16. PROVISIONS
(EUR 1,000) 2017 2016
Provision for restructuring cost
Book value, 1 Jan. 2013 71 190
Decreases 39 119
Book value, 31 Dec. 2013 32 71
Parent company financial statements, FAS

55
17. LIABILITIES
17.1 Interest-bearing and non-interest-bearing liabilities
(EUR 1,000) 2017 2016
Interest-bearing liabilities
Non-current 2,594
Total 2,594
Non-interest-bearing liabilities
Current 20,254 20,549
Total 20,254 20,549
17.2 Current liabilities
(EUR 1,000) 2017 2016
Advances received 270
Trade payables 5,219 4,541
Debts to Group companies
Trade payables 2,156 549
Accrued liabilities and deferred income 6,334 7,503
Other current liabilities 1,755 2,193
Accrued liabilities and deferred income 4,520 5,762
Total 20,254 20,549
Accrued liabilities and deferred income
Wages and salaries with social security contributions 2,796 2,915
Accrued income tax liabilities 546 938
Other accrued liabilities and deferred income 1,178 1,909
Total 4,520 5,762
18. GUARANTEES, CONTINGENT LIABILITIES AND OTHER COMMITMENTS
(EUR 1,000) 2017 2016
For the liabilities of the Group company
Guarantees 12,452 11,677
Other own liabilities and commitments
Leasing liabilities
Payments due in the following financial year 377 365
Payments due later 350 356
Total 727 722
Liabilities relating to lease agreements
Payments due in the following financial year 5,644 5,738
Payments due later 10,161 14,320
Total 15,806 20,057
Parent company financial statements, FAS
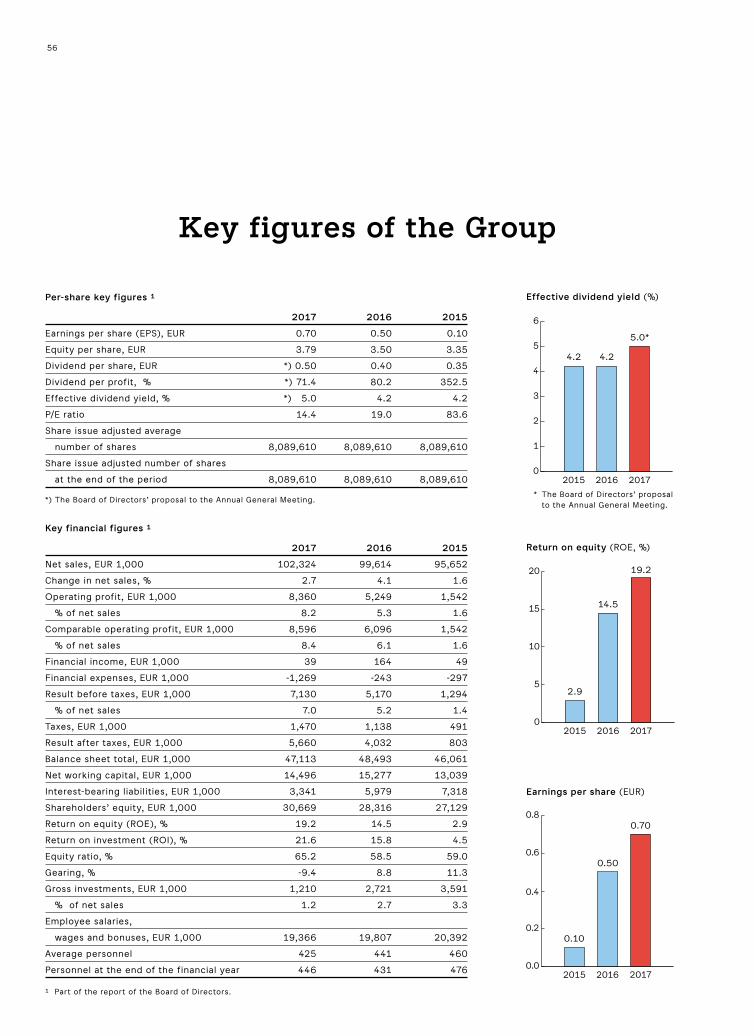
56
Per-share key figures ¹
2017 2016 2015
Earnings per share (EPS), EUR 0.70 0.50 0.10
Equity per share, EUR 3.79 3.50 3.35
Dividend per share, EUR *) 0.50 0.40 0.35
Dividend per profit, % *) 71.4 80.2 352.5
Effective dividend yield, % *) 5.0 4.2 4.2
P/E ratio 14.4 19.0 83.6
Share issue adjusted average
number of shares 8,089,610 8,089,610 8,089,610
Share issue adjusted number of shares
at the end of the period 8,089,610 8,089,610 8,089,610
*) The Board of Directors’ proposal to the Annual General Meeting.
Key financial figures ¹
2017 2016 2015
Net sales, EUR 1,000 102,324 99,614 95,652
Change in net sales, % 2.7 4.1 1.6
Operating profit, EUR 1,000 8,360 5,249 1,542
% of net sales 8.2 5.3 1.6
Comparable operating profit, EUR 1,000 8,596 6,096 1,542
% of net sales 8.4 6.1 1.6
Financial income, EUR 1,000 39 164 49
Financial expenses, EUR 1,000 -1,269 -243 -297
Result before taxes, EUR 1,000 7,130 5,170 1,294
% of net sales 7.0 5.2 1.4
Taxes, EUR 1,000 1,470 1,138 491
Result after taxes, EUR 1,000 5,660 4,032 803
Balance sheet total, EUR 1,000 47,113 48,493 46,061
Net working capital, EUR 1,000 14,496 15,277 13,039
Interest-bearing liabilities, EUR 1,000 3,341 5,979 7,318
Shareholders’ equity, EUR 1,000 30,669 28,316 27,129
Return on equity (ROE), % 19.2 14.5 2.9
Return on investment (ROI), % 21.6 15.8 4.5
Equity ratio, % 65.2 58.5 59.0
Gearing, % -9.4 8.8 11.3
Gross investments, EUR 1,000 1,210 2,721 3,591
% of net sales 1.2 2.7 3.3
Employee salaries,
wages and bonuses, EUR 1,000 19,366 19,807 20,392
Average personnel 425 441 460
Personnel at the end of the financial year 446 431 476
Key figures of the Group
¹ Part of the report of the Board of Directors.
* The Board of Directors’ proposal to the Annual General Meeting.
Earnings per share (EUR)
Effective dividend yield (%)
Return on equity (ROE, %)
0.0
0.2
0.4
0.6
0.8
2015
0.10
0.50
0.70
2016 2017
0
1
2
3
4
5
6
2015
4.2
5.0*
2016 2017
4.2
0
5
10
15
20
2015
14.5
2.9
19.2
2016 2017

57
FINANCIAL GOALS
Marimekko’s financial goals focus on securing
the company’s profitable growth.
The company’s financial goals are as follows:
• annual growth in consolidated net sales
over 10%
• operating profit margin 10%
• return on equity (ROE) over 15%
• equity ratio 50%.
* The Board of Directors’ proposal to the Annual General Meeting.
Formulas for the key figures
COMPARABLE EBITDA, EUR Operating result – depreciation – impairments – items affecting comparability
COMPARABLE OPERATING RESULT, EUR Operating result – items affecting comparability in operating result
COMPARABLE OPERATING RESULT Operating result – items affecting comparability in operating result x 100
MARGIN, % Net sales
RETURN ON EQUITY (ROE), % Profit before taxes – income taxes x 100
Shareholders’ equity (average for the financial year)
RETURN ON INVESTMENT (ROI), % Profit before taxes + interest and other financial expenses x 100
Balance sheet total – non-interest-bearing liabilities (average for the financial year)
EQUITY RATIO, % Shareholders’ equity x 100
Balance sheet total – advances received
EARNINGS PER SHARE (EPS), EUR Profit before taxes – income taxes
Share issue adjusted average number of shares
EQUITY PER SHARE, EUR Shareholders’ equity
Number of shares, 31 Dec.
DIVIDEND PER SHARE, EUR Dividend paid for the financial year
Number of shares, 31 Dec.
DIVIDEND PER PROFIT, % Dividend per share x 100
Earnings per share (EPS), share issue adjusted
EFFECTIVE DIVIDEND YIELD, % Dividend per share x 100
Adjusted share price, 31 Dec.
P/E RATIO Adjusted share price, 31 Dec.
Earnings per share (EPS), share issue adjusted
NET WORKING CAPITAL, EUR Inventories + trade and other receivables + current tax assets – tax liabilities – current provisions – trade and other payables
INTEREST-BEARING NET DEBT, EUR Interest-bearing liabilities – cash in hand and at banks – interest-bearing loan receivables
GEARING, % Interest-bearing net debt x 100
Shareholders’ equity
Equity per share (EUR)
P/E ratio Dividend per share (EUR)
Return on investment (ROI, %)
Key figures of the Group
0
1
2
3
4
2015
3.35 3.503.79
2016 2017
0
20
40
60
80
100
2015
83.6
19.0
2016 2017
14.4
0.0
0.1
0.2
0.3
0.4
0.5
0.6
2015
0.350.40
0.50*
2016 2017
0
5
10
15
20
25
2015
4.5
15.8
2016 2017
21.6

58
Share
Marimekko Corporation’s share is quoted
in the Consumer Goods sector of Nasdaq
Helsinki Ltd. Marimekko Corporation
was listed on the I List of the Helsinki
Stock Exchange in March 1999 and on
the main list on 27 December 2002.
The company has one series of shares,
each conferring the same voting rights
to their holders. The company’s shares
have been included in the book-entry
register since 17 February 1999.
Share capital and number of shares
At the end of 2017, Marimekko
Corporation’s fully paid-up share capital,
as recorded in the Trade Register,
amounted to EUR 8,040,000, and the
number of shares was 8,089,610.
Authorisations
At the end of 2017, the Board of
Directors had no valid authorisations
to carry out share issues or issue
convertible bonds or bonds with
warrants, or to acquire or surrender
Marimekko shares.
Shareholder agreements
Marimekko has neither made nor is
aware of any shareholder agreements
concerning the company’s shares or
other commitments agreeing on the
company’s ownership or the use of
voting rights.
Dividend policy
Marimekko aims to pay a regular
dividend every year. The dividends
to be paid and their amount and the
payout date depend on the company’s
financial result, financial situation,
equity ratio, need for working capital
and other factors. Marimekko intends
to follow a stable and active dividends
policy that by and large reflects the
company’s earnings trend. Marimekko’s
goal is to distribute as dividends
at least half of earnings per share
annually.
Dividend for 2016
A dividend of EUR 0.40 per share to
a total of EUR 3,235,844 was paid for
2016 in accordance with the decision
of the Annual General Meeting held on
6 April 2017. The dividend was paid
out on 19 April 2017.
Proposal for the dividend for 2017
The Board of Directors will propose
to the Annual General Meeting that
the dividend to be paid for the 2017
financial year be EUR 0.50 per share to
a total of EUR 4,044,805. The Board will
propose 16 April 2018 as the dividend
record date and 23 April 2018 as the
dividend payout date.
Shareholders
According to the book-entry register,
Marimekko Corporation had 7,575
registered shareholders at the end of
2017. Of the shares, 11.4 percent were
owned by nominee-registered or non-
Finnish holders at the year end.
Flaggings
Marimekko did not receive any flagging
notifications during 2017.
Share andshareholders
Management’s shareholding
At the end of 2017, members of the
Board of Directors and the Management
Group of the company either directly or
indirectly owned 1,335,295 shares, i.e.
16.5 percent of the number and voting
rights of the company’s shares.

59
Largest shareholders according to the book-entry register, 31 December 2017
Number of shares and votes Percentage of holding and votes
1. Muotitila Ltd 1,297,700 16.04
2. Moomin Characters Oy Ltd 585,000 7.23
3. Ehrnrooth Anna Sophia 400,377 4.95
4. Varma Mutual Pension Insurance Company 385,920 4.77
5. Oy Etra Invest Ab 236,823 2.93
6. Odin Finland 231,301 2.86
7. Veritas Pension Insurance Company Ltd. 220,000 2.72
8. Ilmarinen Mutual Pension Insurance Company 215,419 2.66
9. Aktia Europe Small Cap Equity Fund 168,900 2.09
10. Taaleritehdas Mikro Markka Equity Fund 100,000 1.24
Total 3,841,440 47.49
Nominee-registered and non-Finnish holders 923,805 11.42
Others 3,324,365 41.09
Total 8,089,610 100.00
Marimekko shares owned directly or indirectly by members of the Board of Directors and the Management Group,
31 December 2017
Number of shares and votes Percentage of holding and votes
Mika Ihamuotila 1,297,700 16.04
Rebekka Bay 816 0.01
Elina Björklund 10,368 0.13
Arthur Engel 12,374 0.15
Mikko-Heikki Inkeroinen 3,302 0.04
Helle Priess 816 0.01
Catharina Stackelberg-Hammarén 3,569 0.04
Tiina Alahuhta-Kasko 5,450 0.07
Elina Aalto 0 0.00
Tina Broman 0 0.00
Kari Härkönen 0 0.00
Päivi Lonka 900 0.01
Päivi Paltola 0 0.00
Tanya Strohmayer 0 0.00
Total 1,335,295 16.50
Share and shareholders
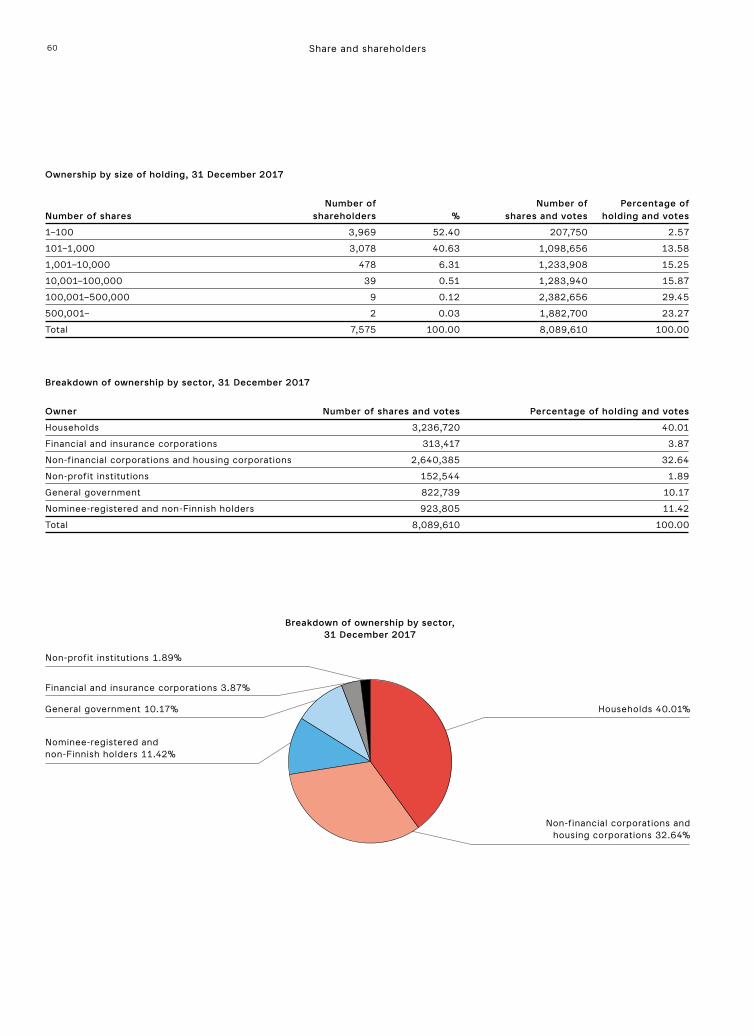
60
Ownership by size of holding, 31 December 2017
Number of Number of Percentage ofNumber of shares shareholders % shares and votes holding and votes
1–100 3,969 52.40 207,750 2.57
101–1,000 3,078 40.63 1,098,656 13.58
1,001–10,000 478 6.31 1,233,908 15.25
10,001–100,000 39 0.51 1,283,940 15.87
100,001–500,000 9 0.12 2,382,656 29.45
500,001– 2 0.03 1,882,700 23.27
Total 7,575 100.00 8,089,610 100.00
Breakdown of ownership by sector, 31 December 2017
Owner Number of shares and votes Percentage of holding and votes
Households 3,236,720 40.01
Financial and insurance corporations 313,417 3.87
Non-financial corporations and housing corporations 2,640,385 32.64
Non-profit institutions 152,544 1.89
General government 822,739 10.17
Nominee-registered and non-Finnish holders 923,805 11.42
Total 8,089,610 100.00
Breakdown of ownership by sector, 31 December 2017
Non-profit institutions 1.89%
Financial and insurance corporations 3.87%
General government 10.17%
Nominee-registered and non-Finnish holders 11.42%
Households 40.01%
Non-financial corporations and housing corporations 32.64%
Share and shareholders
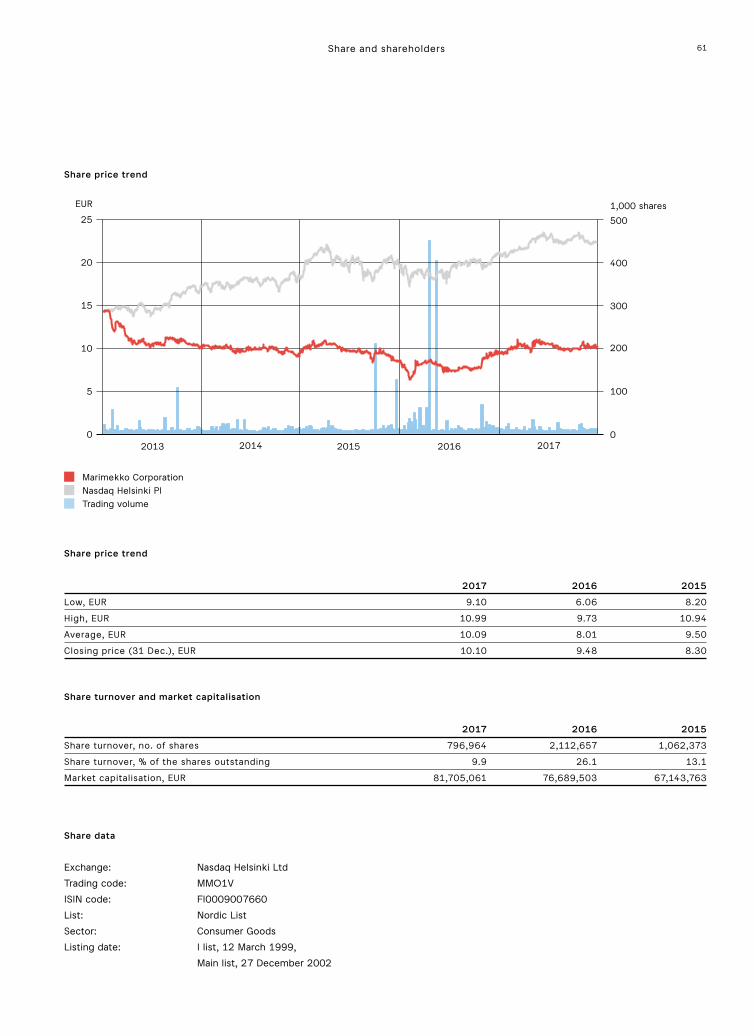
61
Share turnover and market capitalisation
2017 2016 2015
Share turnover, no. of shares 796,964 2,112,657 1,062,373
Share turnover, % of the shares outstanding 9.9 26.1 13.1
Market capitalisation, EUR 81,705,061 76,689,503 67,143,763
Share price trend
2017 2016 2015
Low, EUR 9.10 6.06 8.20
High, EUR 10.99 9.73 10.94
Average, EUR 10.09 8.01 9.50
Closing price (31 Dec.), EUR 10.10 9.48 8.30
Share data
Exchange: Nasdaq Helsinki Ltd
Trading code: MMO1V
ISIN code: FI0009007660
List: Nordic List
Sector: Consumer Goods
Listing date: I list, 12 March 1999,
Main list, 27 December 2002
Share price trend
Marimekko CorporationNasdaq Helsinki PITrading volume
25
20
EUR 1,000 shares
15
10 200
300
400
500
100
0
5
02013 2014 2015 2016 2017
Share and shareholders

62
Mika Ihamuotila Elina Björklund Rebekka Bay Arthur Engel
Chairman of the Board Vice Chairman of the Board Member of the Board Member of the Board
Mikko-Heikki Inkeroinen Helle Priess Catharina Stackelberg-Hammarén
Member of the Board Member of the Board Member of the Board
Tiina Alahuhta-Kasko
President and CEO
THE AUDITORS’ NOTE
Our auditor’s report has been issued today.
Helsinki, 7 March 2018
PricewaterhouseCoopers Oy
Authorised Public Accountants
Ylva Eriksson
Authorised Public Accountant
Helsinki, 14 February 2018
Signatures to the financial statements and the report of
the Board of Directors

63
Auditor’s report TO THE ANNUAL GENERAL MEETING OF MARIMEKKO CORPORATION
REPORT ON THE AUDIT OF THE FINANCIAL STATEMENTS
OPINION
In our opinion
• the consolidated financial statements give a true and fair view of the group’s financial position and financial performance and
cash flows in accordance with International Financial Reporting Standards (IFRS) as adopted by the EU
• the financial statements give a true and fair view of the parent company’s financial performance and financial position in
accordance with the laws and regulations governing the preparation of the financial statements in Finland and comply with
statutory requirements.
Our opinion is consistent with the additional report to the Audit and Remuneration Committee.
What we have audited
We have audited the financial statements of Marimekko Corporation (business identity code 0111316-2) for the year ended 31
December 2017. The financial statements comprise:
• the consolidated balance sheet, income statement, statement of comprehensive income, statement of changes in equity,
statement of cash flows and notes, including a summary of significant accounting policies
• the parent company’s balance sheet, income statement, statement of cash flows and notes.
BASIS FOR OPINION
We conducted our audit in accordance with good auditing practice in Finland. Our responsibilities under good auditing practice
are further described in the Auditor’s Responsibilities for the Audit of the Financial Statements section of our report.
We believe that the audit evidence we have obtained is sufficient and appropriate to provide a basis for our opinion.
Independence
We are independent of the parent company and of the group companies in accordance with the ethical requirements that are
applicable in Finland and are relevant to our audit, and we have fulfilled our other ethical responsibilities in accordance with
these requirements.
To the best of our knowledge and belief, the non-audit services that we have provided to the parent company and to the group
companies are in accordance with the applicable law and regulations in Finland and we have not provided non-audit services that
are prohibited under Article 5(1) of Regulation (EU) No 537/2014. The non-audit services that we have provided are disclosed in
note 6 to the Financial Statements.
(Translation of the Finnish Original)

64
Materiality
Group scoping
Key auditmatters
As part of designing our audit, we determined materiality and assessed the risks of material misstatement in the financial
statements. In particular, we considered where management made subjective judgements; for example, in respect of significant
accounting estimates that involved making assumptions and considering future events that are inherently uncertain.
Materiality
The scope of our audit was influenced by our application of materiality. An audit is designed to obtain reasonable assurance
whether the financial statements are free from material misstatement. Misstatements may arise due to fraud or error. They are
considered material if individually or in aggregate, they could reasonably be expected to influence the economic decisions of
users taken on the basis of the financial statements.
Based on our professional judgement, we determined certain quantitative thresholds for materiality, including the overall group
materiality for the consolidated financial statements as set out in the table below. These, together with qualitative considerations,
helped us to determine the scope of our audit and the nature, timing and extent of our audit procedures and to evaluate the
effect of misstatements on the financial statements as a whole.
Overall group materiality € 0.6 million
How we determined it Net sales and profit before tax
Rationale for the materiality benchmark applied We chose the combination of net sales and profit before tax as the
benchmark because, in our view, the performance of the Group
is most commonly measured by users of the financial statements
by using these criteria, and they are generally accepted
benchmarks.
How we tailored our group audit scope
We tailored the scope of our audit, taking into account the structure of the Marimekko Group, the accounting processes and
controls, and the industry in which the group operates.
We focused our group audit on the Finnish companies covering the majority of the Group’s revenues, assets and liabilities. In
addition, we performed analytical procedures on the foreign sales companies.
Auditor’s report
Materiality• We have applied an overall group materiality of € 0.6 million.
Audit Scope• The group audit focused on the companies in Finland covering the
majority of the Group’s net sales, assets and liabilities.
Key audit matters• Revenue recognition• Valuation and existence of the inventory
OUR AUDIT APPROACH
Overview
65
KEY AUDIT MATTERS
Key audit matters are those matters that, in our professional judgment, were of most significance in our audit of the financial
statements of the current period. These matters were addressed in the context of our audit of the financial statements as a whole,
and in forming our opinion thereon, and we do not provide a separate opinion on these matters.
As in all of our audits, we also addressed the risk of management override of internal controls, including among other matters
consideration of whether there was evidence of bias that represented a risk of material misstatement due to fraud.
KEY AUDIT MATTER IN THE AUDIT OF THE GROUP
Revenue recognition
We refer to the income statement of the Group and to the
notes “Principles for revenue recognition and net sales”.
The Group’s revenue is generated from wholesale and retail
sales of clothes, bags, accessories and home décor items,
and from royalties. The wholesale contracts include different
delivery terms, which determine when the significant risks
and rewards have been transferred to the buyer. Retail
sales generally consist of small transactions paid by cash
or payment card and revenue is recognised at the time of
the transaction. Revenue from royalties is recognised in
accordance with the terms of the agreement with the licensee.
Revenue recognition include a risk that revenue is
not recorded in the correct period or that recorded sales
transactions have not occurred. Therefore, this was a focus
area in our audit.
Valuation and existence of inventory
We refer to the balance sheet of the Group and to the notes
“Inventory”.
Inventory consists of fabrics and other raw-materials as well
as of half-finished and finished goods, which include clothes,
bags, accessories and home décor items.
Inventories are valued at the lower of acquisition cost
or probable net realisable value. The Group capitalises
certain directly attributable overheads within the cost of
manufactured inventories.
Inventory constitutes a significant part of the Group’s
assets. The inventory accounting includes manual work
processes, among other things, relating to valuation and
compiling the inventory balances, which increases the risk for
errors. Therefore, valuation and existence of inventory were
focus areas in our audit.
HOW OUR AUDIT ADDRESSED THE KEY AUDIT MATTER
The audit of different revenue streams included both testing
of the company’s key controls, as well as substantive audit
procedures.
The substantive testing included, among other things, the
following procedures:
• We selected a sample of sales invoices recorded during the
financial period and compared them to the delivery notes
and payments received.
• We checked that sales transactions had been recorded in the
right financial period by comparing sales invoices recorded
before and after year-end to the dates of delivery notes and
to delivery terms, and by testing credit invoices made in
January 2018.
• For retail sales we tested reconciliations of cash and
payment card payments and selected a sample of sales
transactions and compared them with payments received.
• We inspected the terms of selected licencing agreements
and tested that royalty income was recorded in accordance
with the terms of the agreements.
We tested the company’s key controls relating to inventory
balances and valuation. In addition, we performed, among
other things, the following:
• We attended physical stock counting in selected stores and
other inventory locations. We analysed the results of the
company’s own inventory counts and how the company had
resolved any inventory differences.
• We tested, on a sample basis, inventory items and
compared the values with latest purchase invoices and
cost calculations. In addition, we used system based data-
analytics to identify unexpected variances in the values of
inventory items during the year and we investigated the
reasons for such variances.
• We compared the book value of selected inventory items to
their probable sales prices to ensure that the inventory is
not overvalued.
Auditor’s report

66
RESPONSIBILITIES OF THE BOARD OF DIRECTORS AND THE MANAGING DIRECTOR FOR THE FINANCIAL
STATEMENTS
The Board of Directors and the Managing Director are responsible for the preparation of consolidated financial statements that
give a true and fair view in accordance with International Financial Reporting Standards (IFRS) as adopted by the EU, and of
financial statements that give a true and fair view in accordance with the laws and regulations governing the preparation of
financial statements in Finland and comply with statutory requirements. The Board of Directors and the Managing Director are
also responsible for such internal control as they determine is necessary to enable the preparation of financial statements that are
free from material misstatement, whether due to fraud or error.
In preparing the financial statements, the Board of Directors and the Managing Director are responsible for assessing the
parent company’s and the group’s ability to continue as a going concern, disclosing, as applicable, matters relating to going
concern and using the going concern basis of accounting. The financial statements are prepared using the going concern basis
of accounting unless there is an intention to liquidate the parent company or the group or to cease operations, or there is no
realistic alternative but to do so.
AUDITOR’S RESPONSIBILITIES FOR THE AUDIT OF THE FINANCIAL STATEMENTS
Our objectives are to obtain reasonable assurance about whether the financial statements as a whole are free from material
misstatement, whether due to fraud or error, and to issue an auditor’s report that includes our opinion. Reasonable assurance
is a high level of assurance, but is not a guarantee that an audit conducted in accordance with good auditing practice will
always detect a material misstatement when it exists. Misstatements can arise from fraud or error and are considered material if,
individually or in the aggregate, they could reasonably be expected to influence the economic decisions of users taken on the
basis of these financial statements.
As part of an audit in accordance with good auditing practice, we exercise professional judgment and maintain professional
skepticism throughout the audit. We also:
• Identify and assess the risks of material misstatement of the financial statements, whether due to fraud or error, design and
perform audit procedures responsive to those risks, and obtain audit evidence that is sufficient and appropriate to provide a
basis for our opinion. The risk of not detecting a material misstatement resulting from fraud is higher than for one resulting
from error, as fraud may involve collusion, forgery, intentional omissions, misrepresentations, or the override of internal control.
• Obtain an understanding of internal control relevant to the audit in order to design audit procedures that are appropriate in the
circumstances, but not for the purpose of expressing an opinion on the effectiveness of the parent company’s or the group’s
internal control.
• Evaluate the appropriateness of accounting policies used and the reasonableness of accounting estimates and related
disclosures made by management.
• Conclude on the appropriateness of the Board of Directors’ and the Managing Director’s use of the going concern basis of
accounting and based on the audit evidence obtained, whether a material uncertainty exists related to events or conditions
that may cast significant doubt on the parent company’s or the group’s ability to continue as a going concern. If we conclude
that a material uncertainty exists, we are required to draw attention in our auditor’s report to the related disclosures in the
financial statements or, if such disclosures are inadequate, to modify our opinion. Our conclusions are based on the audit
evidence obtained up to the date of our auditor’s report. However, future events or conditions may cause the parent company
or the group to cease to continue as a going concern.
• Evaluate the overall presentation, structure and content of the financial statements, including the disclosures, and whether
the financial statements represent the underlying transactions and events so that the financial statements give a true and fair
view.
• Obtain sufficient appropriate audit evidence regarding the financial information of the entities or business activities within the
group to express an opinion on the consolidated financial statements. We are responsible for the direction, supervision and
performance of the group audit. We remain solely responsible for our audit opinion.
Auditor’s report
We have no key audit matters to report with respect to our audit of the parent company financial statements.
There are no significant risks of material misstatement referred to in Article 10(2c) of Regulation (EU) No 537/2014 with respect
to the consolidated financial statements or the parent company financial statements.

67
We communicate with those charged with governance regarding, among other matters, the planned scope and timing of the
audit and significant audit findings, including any significant deficiencies in internal control that we identify during our audit.
We also provide those charged with governance with a statement that we have complied with relevant ethical requirements
regarding independence, and to communicate with them all relationships and other matters that may reasonably be thought to
bear on our independence, and where applicable, related safeguards.
From the matters communicated with those charged with governance, we determine those matters that were of most
significance in the audit of the financial statements of the current period and are therefore the key audit matters. We describe
these matters in our auditor’s report unless law or regulation precludes public disclosure about the matter or when, in extremely
rare circumstances, we determine that a matter should not be communicated in our report because the adverse consequences of
doing so would reasonably be expected to outweigh the public interest benefits of such communication.
OTHER REPORTING REQUIREMENTS
APPOINTMENT
We were first appointed as auditors by the annual general meeting on 3 April 2008. Our appointment represents a total period of
uninterrupted engagement of 10 years.
OTHER INFORMATION
The Board of Directors and the Managing Director are responsible for the other information. The other information comprises the
report of the Board of Directors and the information included in the Annual Report, but does not include the financial statements
and our auditor’s report thereon. We have obtained the report of the Board of Directors prior to the date of this auditor’s report
and the Annual Report is expected to be made available to us after that date.
Our opinion on the financial statements does not cover the other information.
In connection with our audit of the financial statements, our responsibility is to read the other information identified
above and, in doing so, consider whether the other information is materially inconsistent with the financial statements or
our knowledge obtained in the audit, or otherwise appears to be materially misstated. With respect to the report of the Board
of Directors, our responsibility also includes considering whether the report of the Board of Directors has been prepared in
accordance with the applicable laws and regulations.
In our opinion
• the information in the report of the Board of Directors is consistent with the information in the financial statements
• the report of the Board of Directors has been prepared in accordance with the applicable laws and regulations.
If, based on the work we have performed on the other information that we obtained prior to the date of this auditor’s report, we
conclude that there is a material misstatement of this other information, we are required to report that fact. We have nothing to
report in this regard.
Helsinki, 7 March 2018
PricewaterhouseCoopers Oy
Authorised Public Accountants
Ylva Eriksson
Authorised Public Accountant
Auditor’s report

68
69
Corporate governance
APPLICABLE PROVISIONS
Marimekko Corporation is a Finnish
public limited company, which applies
the Finnish Companies Act, other
regulations concerning public listed
companies, Marimekko Corporation’s
Articles of Association and Nasdaq
Helsinki Ltd’s rules and regulations in
its decision-making and administration.
In addition, Marimekko Corporation
complies with the Finnish Corporate
Governance Code for listed companies,
in force since 1 January 2016, according
to the comply-or-explain principle
without deviating from individual
recommendations.
Group structure
The Marimekko Group comprises
Marimekko Corporation and its
subsidiaries. The company’s registered
office is in Helsinki, Finland.
GENERAL MEETING
Shareholders exercise the highest
decision-making authority in
Marimekko Corporation through the
General Meeting. General Meetings
are either Annual General Meetings or
Extraordinary General Meetings. The
Annual General Meeting shall be held
every year within six months of the
close of the financial year on the day set
by the Board of Directors.
Extraordinary General Meetings are
convened when necessary. According
to the Companies Act, an Extraordinary
General Meeting must be held when the
Board of Directors considers it advisable
or when shareholders representing at
least one-tenth of the company’s shares
request in writing that a meeting be
held to deliberate on a specified matter.
Shareholders have the right to have
items included on the agenda of the
General Meeting, provided they present
their demand in writing to the Board of
Directors well in advance, so that the
item can be included in the Notice of
Meeting.
The company discloses on its website
the date by which a shareholder must
notify the company’s Board of Directors
of an issue that he or she demands to
be addressed at the Annual General
Meeting. The date is published no later
than by the end of the financial period
preceding the Annual General Meeting,
and it cannot be earlier than the date
four weeks prior to the publishing of
the Notice of the Meeting. The Annual
General Meeting deliberates on matters
set out in Article 10 of the Articles of
Association as being the business of
Annual General Meetings, and other
proposals, if any, made to the General
Meeting. The company’s Board of
Directors prepares an agenda for the
meeting.
In accordance with the Finnish
Companies Act, the Annual General
Meeting takes decisions on matters such
as:
• adopting the financial statements
• the distribution of profit
• the number of Board members, their
election and remuneration
• the election of auditors and their
remuneration
• amendments to the Articles of
Association.
Convening a General Meeting
Shareholders are invited to the General
Meeting through a Notice of the General
Meeting published on the company’s
website not earlier than three months
and not later than three weeks before
the Meeting, but in any case at least
nine days prior to the General Meeting’s
record date. In addition, the Board of
Directors may decide to publish the
Notice of the General Meeting in one
or more newspapers. The Notice of
the General Meeting and the Board’s
proposals to the General Meeting are
also published in a stock exchange
release. The following information is
also made available on the company’s
website at least three weeks before the
General Meeting:
• the documents to be submitted to the
General Meeting
• draft resolutions to the General
Meeting.
Right to attend a General Meeting
Shareholders registered in the
company’s Shareholder Register, held
by Euroclear Finland Ltd on behalf of
the Board of Directors of Marimekko
Corporation, on the record date of the
General Meeting, announced separately
by the company, have the right to
attend a General Meeting. Shareholders
wishing to attend the General Meeting
must inform the company of their
intention to do so by the deadline
specified in the Notice of the Meeting.
Shareholders may attend the Meeting
themselves or through a representative
by proxy, who must present a power of
attorney or other reliable proof of their
authority to represent the shareholder.
70
Shareholders can exercise their
right to speak and to vote at a General
Meeting. Shareholders are entitled to
cast the total number of votes conferred
by their shareholding as on the record
date. One share confers one vote in
all matters addressed at the General
Meeting. Decisions are made by a
simple or qualified majority of votes
as provided by law and the Articles of
Association.
Record of proceedings at General
Meetings
The company prepares minutes of the
General Meeting, which, together with
voting results and the appendices to the
minutes that are part of a decision made
by the Meeting, are made available
to the shareholders on the company’s
website within two weeks of the General
Meeting. The documents related to the
General Meeting will be available on the
company’s website at least for five years
after the Meeting. The company also
announces any decisions taken at the
General Meeting in a stock exchange
release issued promptly after the
Meeting.
Presence of administrative bodies at
a General Meeting
The Chairman and all of the members of
the Board of Directors and the President
and CEO shall be present at the General
Meetings. The company’s auditor shall
attend the Annual General Meeting, and
candidates up for election to the Board
for the first time shall be present at the
Meeting in which the election is held.
BOARD OF DIRECTORS
Composition and term of office
The members of Marimekko
Corporation’s Board of Directors are
elected at the Annual General Meeting.
The proposal for the composition of the
Board of Directors is prepared by the
major shareholders of the company.
The term of office of the Board of
Directors expires at the close of the
Annual General Meeting following their
election. According to the Articles of
Association, the Board of Directors
comprises a minimum of four and a
maximum of seven ordinary members.
The number of Marimekko Corporation’s
Board members is set in proportion
to the company’s size. The Articles of
Association do not set an upper age
limit for Board members, restrict the
number of their terms of office or in
any other way restrict the General
Meeting’s authority in the election of
Board members. There is no particular
order governing the appointment of
Board members. The Board of Directors
elects a Chairman from amongst its
members. The company’s President and
CEO cannot be elected to serve as the
Chairman of the Board of Directors.
Diversity of the Board of Directors
When preparing the proposal for
the composition of the Board of
Directors, the major shareholders take
account of the company’s business
requirements and trends as well as
the strategy of the company. The
main objective is to ensure that the
composition of the Board of Directors
supports the company’s business
operations, strategy and customer-
orientated approach in an optimal
manner. The diversity of the Board of
Directors ensures the realisation of the
aforementioned objective. The diversity
of the Board is reviewed from different
perspectives. The most important factors
for the company are the mutually
complementary experience, education
and know-how from different fields and
different geographic areas as well as
the personal attributes of the directors.
The diversity of the Board of Directors
is promoted in particular by the gender
and age diversity of the directors. Also
taken into account in the composition of
the Board of Directors are the long-term
objectives of the company as well as
succession planning.
Members of the Board of Directors
Marimekko Corporation’s Annual
General Meeting held on 6 April 2017
elected seven members to the Board
of Directors for a term beginning on
6 April 2017 and ending at the close
of the 2018 Annual General Meeting.
Elina Björklund, Arthur Engel, Mika
Ihamuotila, Mikko-Heikki Inkeroinen
and Catharina Stackelberg-Hammarén
were re-elected as members of the
Board of Directors. Rebekka Bay and
Helle Priess were elected as new
members of the Board of Directors. The
Board is chaired by Mika Ihamuotila and
vice-chaired by Elina Björklund.
The Board members are presented
on pages 78–79 and on the company’s
website under Investors/Management.
Independence evaluation
The Corporate Governance Code
states that the majority of Board
members shall be independent of
the company. A person without any
significant connection to the company
other than Board membership is
considered independent of the
company. In addition, at least two of
the directors representing this majority
shall be independent of significant
shareholders of the company. The
Board evaluates the independence
of its members annually. Among the
members of Marimekko Corporation’s
Corporate governance

71
Board of Directors, Rebekka Bay, Elina
Björklund, Arthur Engel, Mikko-Heikki
Inkeroinen, Helle Priess and Catharina
Stackelberg-Hammarén are independent
of the company and its significant
shareholders.
Mika Ihamuotila has acted as full-
time Chairman of the Board since
11 April 2016 pursuant to a separate
executive service agreement governing
his full-time chairmanship. Before
the above date, Mika Ihamuotila’s
executive service agreement also
included the duties of the CEO. The
Audit and Remuneration Committee
of the company handles and prepares
matters related to the executive
service agreement’s terms and Mika
Ihamuotila’s remuneration.
Duties and responsibilities of the
Board of Directors
The Board of Directors is responsible
for the proper organisation of the
company’s administration, operations,
accounting and asset management.
In addition to the duties specified in
the Finnish Companies Act and the
Articles of Association, the written rules
of procedure adopted by the Board
contain further provisions concerning
the Board’s operating principles and
principal duties. The Board reviews and
confirms the rules of procedure annually
at its constitutive meeting, held
following the Annual General Meeting.
The Board reviews all matters that are
significant to or have long-term effects
on the company’s business operations.
According to the rules of procedure,
the Board addresses issues such as the
following:
• specifying and confirming strategic
objectives and policies for the Group
and the various business areas
• reviewing and confirming operating
plans and budgets for the Group and
the various business areas
• reviewing and approving interim
reports, the consolidated financial
statements and the Report of the
Board of Directors
• expanding and downsizing business
operations
• considering mergers, acquisitions
and demergers and restructuring
arrangements
BOARD OF DIRECTORS
Independent of the company and Board member its significant Position since shareholders Attendance
Mika Ihamuotila Chairman since 2015 2008 No 10/10
Elina Björklund Vice Chairman since 2015 2011 Yes 10/10
Rebekka Bay Member 2017 Yes 7/10
Arthur Engel Member 2011 Yes 10/10
Mikko-Heikki Inkeroinen Member 2015 Yes 10/10
Joakim Karske*) Member 2008 Yes 3/10
Helle Priess Member 2017 Yes 7/10
Catharina Stackelberg-Hammarén Member 2014 Yes 10/10
*) Member of the Board until 6 April 2017.
AUDIT AND REMUNERATION COMMITTEE
Independent of Committee the company and member its significant Position since shareholders Attendance
Elina Björklund Chairman since 2015 2015 Yes 5/5
Mikko-Heikki Inkeroinen Member 2017 Yes 4/5
Joakim Karske*) Member 2015 Yes 1/5
Catharina Stackelberg-Hammarén Member 2015 Yes 5/5
*) Member of the Audit and Remuneration Committee until 6 April 2017.
Corporate governance

72
• deciding on investments and the
acquisition and sale of assets that
are either strategically or financially
significant
• deciding on financial policy and
contingent liabilities related to
financing arrangements
• approving the Group’s reporting, risk
management procedures and internal
control procedures and audit and
control systems
• approving the audit plan
• appointing the company’s President
and CEO and the members of the
Management Group and deciding on
their remuneration
• providing instructions for the
President and CEO.
In 2017, the Board focused, among
other things, on the following subjects:
• development of Marimekko
Corporation’s strategy as well as
confirming strategic objectives for the
various business areas
• development of a strategy for the
international expansion of physical
retail and e-commerce
• strategic development of the product
portfolio as well as measures to
improve productivity in the medium
term
• reviewing the design and brand
strategy
• reviewing and confirming operating
plans and budgets.
Meeting procedures and
decision-making
The Chairman of the Board is
responsible for convening and chairing
Board meetings. The Board has not
assigned responsibility for monitoring
any particular aspects of the business to
individual Board members. The Board
evaluates its performance annually
each January under the direction of the
Chairman. In 2017, the Board convened
ten times. The Board members’
attendance rate at meetings was 100%.
Committees
The Board of Directors elected by the
Annual General Meeting on 6 April 2017
appointed an Audit and Remuneration
Committee from among its members.
The Board elected Elina Björklund as
Chairman and Mikko-Heikki Inkeroinen
and Catharina Stackelberg-Hammarén as
members of the Audit and Remuneration
Committee.
The Board of Directors has not
established any other committees.
The Audit and Remuneration
Committee handles and prepares
matters relating to the terms and
remuneration of Marimekko’s executive
management as well as other tasks and
supervision typically assigned to audit
and remuneration committees. These
include, for example, the following:
• monitoring the reporting process of
financial statements
• supervising the financial reporting
process
• monitoring the efficiency of the
company’s internal control and
internal audit, if applicable, and risk
management systems
• reviewing the description of the main
features of the internal control and
risk management systems pertaining
to the financial reporting process,
which is included in the company’s
corporate governance statement
• monitoring the statutory audit of the
financial statements and consolidated
financial statements
• evaluating the independence of the
statutory auditor or audit firm and
especially the related services offered
to the company
• preparation of the proposal for
resolution on the election of the
auditor
• reviewing, overseeing and
verifying outcomes of management
compensation plans and programmes.
In 2017, the Audit and Remuneration
Committee held five meetings. The
Committee members’ attendance rate at
meetings was 100%.
Marimekko does not have a
Supervisory Board.
MANAGEMENT OF THE GROUP
President and CEO
The Board of Directors elects the
company’s President and CEO and
decides on the terms of the President
and CEO’s employment agreement. The
terms are specified in a written contract
which is approved by the Board of
Directors. The Audit and Remuneration
Committee of the company handles and
prepares matters related to the terms
of the employment agreement and the
remuneration of the President and CEO.
The President and CEO is responsible
for the day-to-day management and
development of the Group in accordance
with the instructions and orders of the
Board of Directors. The President and
CEO is also responsible for keeping the
Board up to date with regard to the
development of the company’s business
and financial situation.
Tiina Alahuhta-Kasko has been the
company’s President since 9 April 2015
and President and CEO since 11 April
2016.
Subsidiary administration
The members of the subsidiaries’ Boards
of Directors are elected from amongst
the Marimekko Group’s executive
management.
Corporate governance

73
Management Group
The company’s business operations
have been divided into a number of
responsibility areas, the directors of
which form the company’s Management
Group. The company’s President
and CEO acts as the Chairman of the
Management Group. The Board of
Directors appoints the members of
the Management Group and decides
on their remuneration. The Audit
and Remuneration Committee of the
company handles and prepares matters
related to the terms of the employment
agreements and remuneration of the
Management Group. The Management
Group has no authority based on law or
the Articles of Association.
The Management Group reviews
business matters and procedures
affecting the entire Group. The
Management Group also reviews
the operating plans and business
development of the various business
areas. The Management Group
convenes every two weeks on
average. Information on the members
is presented on page 79 and on the
company’s website under Investors/
Management.
REMUNERATION
The main objectives of remuneration at
Marimekko Corporation are to promote
competitiveness and long-term financial
success of the company, contribute
to the favourable development of
shareholder value and increase the
commitment of the company’s key
persons.
Remuneration of the members of the
Board of Directors
The Annual General Meeting decides
on the remuneration payable to the
Board of Directors. The Audit and
Remuneration Committee of the
company handles and prepares matters
related to the remuneration payable to
the Board of Directors. All members of
the Audit and Remuneration Committee
are independent of the company
and its significant shareholders. A
person serving the company under
an employment or service agreement
receives no fee for the membership of
the Board of a Marimekko subsidiary.
According to the resolution
by the Annual General Meeting of
6 April 2017, approximately 40 percent
of the annual remuneration to the
Board of Directors in 2017 was paid
in Marimekko Corporation’s shares
acquired from the market and the rest
in cash. In case a member of the Board
held the company’s shares worth more
than EUR 500,000 on the date of the
Annual General Meeting, 6 April 2017,
the remuneration was paid entirely in
cash. According to the decision of the
Annual General Meeting, the shares
were acquired directly on behalf of the
Board members within two weeks from
the release of the interim report for
1 January–31 March 2017 or if this was
not possible due to insider rules, as
soon as possible thereafter. There are
no special rules applying to the Board
of Directors concerning the ownership
of shares received as remuneration. The
Board is not, as a rule, entitled to any
other financial benefits in addition to
the fixed annual payment. Marimekko
has not issued monetary loans to the
Board members or guarantees or other
contingent liabilities on their behalf.
In 2017, the Annual General Meeting
resolved that the annual remuneration
payable to the members of the Board be
as follows: EUR 40,000 to the Chairman,
EUR 30,000 to the Vice Chairman and
EUR 22,000 to the other members
of the Board. The Board members
receive no additional fee for attending
Board meetings. Committee members
receive no additional remuneration for
committee work, nor any additional fee
for attending committee meetings. The
remuneration of the Vice Chairman of
the Board includes chairing the Audit
and Remuneration Committee.
In addition to the annual
remuneration of the Chairman of the
Board decided on by the Annual General
Meeting, Mika Ihamuotila, full-time
Chairman of the Board, has been paid a
monthly fee of EUR 8,800 pursuant to
a separate full-time executive service
agreement with the company. No other
fees, such as annual bonuses or benefits,
in addition to the above-mentioned,
have been paid to Mr Ihamuotila. His
pension is determined by the statutory
employee pension plan (TyEL). The
Audit and Remuneration Committee
of the company handles and prepares
matters related to the terms of the
executive service agreement and
remuneration of the full-time Chairman
of the Board.
Remuneration of the President
and CEO
The Board of Directors of Marimekko
Corporation decides on the salary and
remuneration payable to the President
and CEO. The Audit and Remuneration
Committee of the company handles and
prepares matters related to the terms of
the service contract and remuneration of
the President and CEO. All members of
the Audit and Remuneration Committee
are independent of the company and its
significant shareholders.
The remuneration of the President
and CEO consists of a regular salary and
fringe benefits, an annual bonus as well
Corporate governance
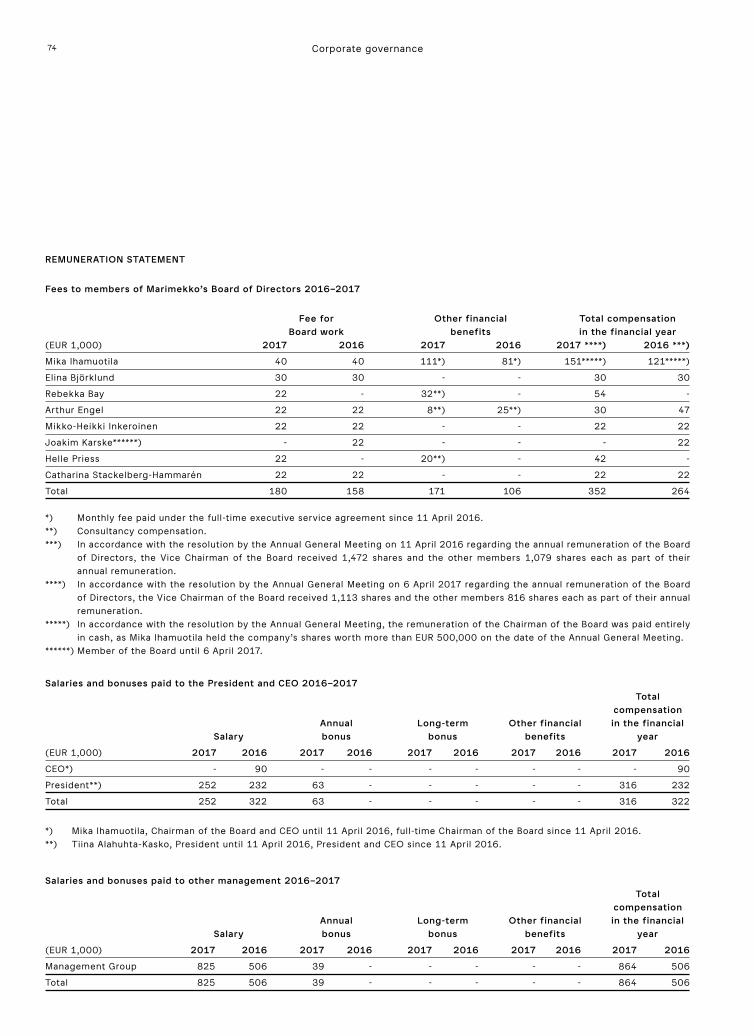
74
REMUNERATION STATEMENT
Fees to members of Marimekko’s Board of Directors 2016–2017
Fee for Other financial Total compensation Board work benefits in the financial year (EUR 1,000) 2017 2016 2017 2016 2017 ****) 2016 ***)
Mika Ihamuotila 40 40 111*) 81*) 151*****) 121*****)
Elina Björklund 30 30 - - 30 30
Rebekka Bay 22 - 32**) - 54 -
Arthur Engel 22 22 8**) 25**) 30 47
Mikko-Heikki Inkeroinen 22 22 - - 22 22
Joakim Karske******) - 22 - - - 22
Helle Priess 22 - 20**) - 42 -
Catharina Stackelberg-Hammarén 22 22 - - 22 22
Total 180 158 171 106 352 264
*) Monthly fee paid under the full-time executive service agreement since 11 April 2016.**) Consultancy compensation.***) In accordance with the resolution by the Annual General Meeting on 11 April 2016 regarding the annual remuneration of the Board of Directors, the Vice Chairman of the Board received 1,472 shares and the other members 1,079 shares each as part of their annual remuneration.****) In accordance with the resolution by the Annual General Meeting on 6 April 2017 regarding the annual remuneration of the Board of Directors, the Vice Chairman of the Board received 1,113 shares and the other members 816 shares each as part of their annual remuneration.*****) In accordance with the resolution by the Annual General Meeting, the remuneration of the Chairman of the Board was paid entirely in cash, as Mika Ihamuotila held the company’s shares worth more than EUR 500,000 on the date of the Annual General Meeting.******) Member of the Board until 6 April 2017.
Salaries and bonuses paid to the President and CEO 2016–2017 Total compensation Annual Long-term Other financial in the financial Salary bonus bonus benefits year
(EUR 1,000) 2017 2016 2017 2016 2017 2016 2017 2016 2017 2016
CEO*) - 90 - - - - - - - 90
President**) 252 232 63 - - - - - 316 232
Total 252 322 63 - - - - - 316 322
*) Mika Ihamuotila, Chairman of the Board and CEO until 11 April 2016, full-time Chairman of the Board since 11 April 2016.**) Tiina Alahuhta-Kasko, President until 11 April 2016, President and CEO since 11 April 2016.
Salaries and bonuses paid to other management 2016–2017 Total compensation Annual Long-term Other financial in the financial Salary bonus bonus benefits year
(EUR 1,000) 2017 2016 2017 2016 2017 2016 2017 2016 2017 2016
Management Group 825 506 39 - - - - - 864 506
Total 825 506 39 - - - - - 864 506
Corporate governance

75
as a so-called long-term bonus system
targeted at the company’s Management
Group, including the President and
CEO. Under the contract between the
company and Tiina Alahuhta-Kasko,
the President and CEO is, in addition to
her regular salary, entitled to an annual
bonus, the maximum amount of which
corresponds to her regular salary for
four months. The principles determining
the bonus are confirmed annually
by the Board of Directors based on a
proposal by the Audit and Remuneration
Committee. The President and CEO’s
pension is determined by the statutory
employee pension plan (TyEL). If the
President and CEO resigns of her own
accord, her term of notice is six months
and she is entitled to a remuneration
corresponding to her regular salary for
six months. If the company terminates
the contract, the term of notice is
six months and the President and
CEO is entitled to a remuneration
corresponding to her regular salary for
six months. The remuneration in case of
termination is tied to a fixed-term non-
compete obligation.
Remuneration of other management
The Board of Directors of Marimekko
Corporation decides on the salary and
remuneration payable to the members
of the Management Group. The Audit
and Remuneration Committee of the
company handles and prepares matters
related to the terms of the service
contracts and remuneration of senior
management. All members of the Audit
and Remuneration Committee are
independent of the company and its
significant shareholders.
The remuneration of the
Management Group members consists
of a regular salary and fringe benefits,
an annual bonus as well as a so-called
long-term bonus system. The annual
bonus is based on the growth of the
company’s consolidated net sales,
operating result and individual
objectives separately determined by the
Board of Directors. The members of the
Management Group fall within the scope
of the statutory employee pension plan
(TyEL).
The Board of Directors decided on
7 May 2014 on establishing a long-term
bonus system targeted at the company’s
Management Group. The purpose of
the bonus system is to encourage the
Management Group to operate with
a business mentality and to add to
the company’s value in the long term
in particular. The aim is to combine
the owners’ and the Management
Group’s targets in order to increase
the company’s value and to elicit the
Management Group’s commitment to
the company over a span of several
years.
The system is composed of
two earnings periods, which are
8 May 2014–31 October 2017 and
8 May 2014–28 February 2018. The
possible bonus for each earnings
period is based on the total yield
on Marimekko Corporation’s shares,
including dividends. The possible bonus
is determined to be paid in cash in two
instalments. The first instalment would
have been due in autumn 2017, and
the possible second instalment will be
due in spring 2018. Earning the bonus
requires that the person still works
for the company at the time of the
payment. When receiving the bonus, the
person in question commits themselves
to using 50 percent of the net value of
the bonus for acquiring the company’s
shares at transaction price within six
months from receiving the bonus. The
shares acquired with the bonus cannot
be surrendered prior to two years from
the time of acquiring the shares. The
annual maximum value of the bonus
paid to a member of the Management
Group in the bonus system equals the
approximate value of annual gross
salary. The system encompasses seven
Management Group members, including
the President and CEO.
AUDIT
According to the Articles of Association,
the company must have one auditor
and, if the auditor is not an audit firm,
one deputy auditor. The auditor and
deputy auditor must be authorised
by the Finnish Central Chamber of
Commerce. The auditors are appointed
in the Annual General Meeting.
The Annual General Meeting
held on 6 April 2017 elected
PricewaterhouseCoopers Oy, Authorised
Public Accountants, as auditor for
the Marimekko Group and the Group
companies, with Ylva Eriksson,
Authorised Public Accountant, as chief
auditor. The Annual General Meeting
also decided that the auditor’s fee will
be paid as per invoice approved by the
company.
The remuneration paid for audit
services in 2017 was EUR 101 thousand.
The remuneration paid to the auditor for
non-audit services in 2017 was EUR 18
thousand.
The auditor issues an auditor’s report
in connection with the company’s
financial statements to the Board of
Directors and, as required by law, an
audit report to the shareholders. The
auditor is present at the Board meeting
where the annual financial statements
are reviewed and, if needed, at the
meetings of the Audit and Remuneration
Committee.
Corporate governance
76 Corporate governance
RISK MANAGEMENT, INTERNAL
CONTROL AND INTERNAL AUDIT
Risk management, internal control and
internal auditing are crucial elements
of Marimekko’s administration and
management. The Board of Directors
and the President and CEO bear
responsibility for organising controls.
The Audit and Remuneration Committee
handles and prepares matters relating to
risk management.
Risk management and risks
Marimekko Corporation’s risk
management is based on the risk
management policy confirmed by the
company’s Board of Directors, which
defines the principles, objectives and
responsibilities of risk management, as
well as the organisation and control of
the risk management process.
Risk management principles
Marimekko Corporation’s risk
management aims to safeguard
the smooth continuity of business
operations and ensure stable profit
development for the company.
Comprehensive risk management is
an ongoing, systematic process which
involves identifying and evaluating
risks associated with the company’s
operations and operating environment.
The company’s key risks comprise risks
which could prevent the company from
exploiting business opportunities or
jeopardise or prevent the achievement
of the strategic objectives of the Group
or a Group company, or the continuity
of operations or would otherwise
have significant consequences for the
company, its personnel or stakeholders.
Risk management is an integral element
of the company’s management and
decision-making process, covering all of
the Group’s functions.
A more detailed description of
Marimekko’s risk management process
is available on the company’s website
under Investors/Management. The most
significant risks are also described in
the report of the Board of Directors on
pages 15–16.
Internal control and internal audit
Marimekko applies internal control
principles and an operating plan for the
execution and monitoring of internal
control. In the Marimekko Group,
internal control is a process, for which
the Board of Directors and the President
and CEO are responsible.
The objective of internal control is to
provide reasonable assurance that:
• the company’s operations are effective
and aligned with strategy
• financial reporting and management
information is reliable
• the Group is in compliance with
applicable laws and regulations
• a Code of Conduct and ethical values
are established.
Marimekko’s Board of Directors
focuses on increasing shareholder value
and, in accordance with good corporate
governance, ensures that the company
has defined internal control principles.
The Board’s Audit and Remuneration
Committee is responsible for monitoring
the efficiency of the company’s internal
control and risk management.
The system of internal control
of Marimekko Corporation is based
on the Committee of Sponsoring
Organizations’ (COSO) framework,
which consists of five key components:
control environment, risk assessment,
control activities, information and
communications, and monitoring.
Considering the nature and extent
of the company’s business, Marimekko
Corporation has not found it necessary
to establish a separate internal audit
function. When necessary, the Board
may purchase internal audit services
from an external service provider.
INSIDER ADMINISTRATION
Marimekko Corporation’s insider policy,
based on the Guidelines for Insiders of
Nasdaq Helsinki Ltd and the Market
Abuse Regulation (MAR), describes
the main obligations of insiders of
Marimekko Corporation as well as the
trade reporting of managers and their
closely associated persons under MAR
and related regulations and guidance.
The Board of Directors of Marimekko
Corporation confirms the policy.
A more detailed description of the
company’s insider administration is
available on the company’s website
under Investors/Management/Corporate
governance.
CORPORATE GOVERNANCE
STATEMENT
The corporate governance statement is
issued separately from the report of the
Board of Directors. It can be found on
the company’s website under Investors/
Management/Corporate governance.
77Hallinnointiperiaatteet

78
Board of Directors and management, 31. Dec. 2017
BOARD OF DIRECTORS
Mika Ihamuotila born 1964
Chairman of the Board
Ph.D. (Econ.)
Principal occupation: Executive
Chairman of the Board of Marimekko
Corporation, 2016–
Primary work experience and key
positions of trust:
Chairman of the Board and CEO of
Marimekko Corporation, 2015–2016;
President and CEO of Marimekko
Corporation and Vice Chairman of
the Board, 2008–2015; President and
CEO of Sampo Bank plc, 2001–2007;
President and CEO of Mandatum Bank
Plc, 2000–2001; Executive Director of
Mandatum Bank Plc, 1998–2000; Partner
of Mandatum & Co Ltd, 1994–1998;
Visiting scholar of Yale University (USA),
1992–1993; Member of the Board of
Sanoma Corporation, 2013–; Member
of the Board of Rovio Entertainment
Ltd, 2013– and Chairman of the Board,
2017–; Chairman of the Board of the
Mannerheim Foundation, 2017–
Elina Björklund born 1970
Vice Chairman of the Board
Chairman of the Audit and
Remuneration Committee
M.Sc. (Econ.), IDBM Pro
Principal occupation: CEO of Reima Ltd,
2012–
Primary work experience and key
positions of trust:
Partner and Director of BIetBI Advisors
(Shanghai, China), 2011–2012;
Vice President Marketing in Fiskars
Corporation’s Home division and
Member of Executive Board, 2009–2010;
several executive positions and Member
of Executive Board in Iittala Group Ltd,
2005–2009 and Development Manager,
2004–2005; CEO of Ebit Ltd, 2001–
2004; Deputy Managing Director of
Merita Securities Ltd (current Nordea),
1998–1999 and Chief Equity Analyst,
1996–1999; Equity Analyst of Kansallis-
Osake-Pankki Equity Research, 1994–
1995; Member of the Board of Directors
and Audit Committee of Finnair Plc
2009–2012; Member of the Board of the
HSE Foundation, 2013–; Member of the
Board of the Finnish-Russian Chamber
of Commerce, 2016–; Member of EVA
Supervisory Board, 2016–
Rebekka Bay born 1969
Member of the Board
BA (Hons) in Fashion
Principal occupation: Creative Director
of Uniqlo Global Innovation Center Inc.,
2017–
Primary work experience and key
positions of trust:
Head of Design and Product of Everlane
(New York), 2015–2017; Creative
Director EVP of Gap Global Design, Gap
Inc. (New York), 2012–2015; Creative
Director of Bruuns Bazaar (Copenhagen),
2011–2012;
Creative Director of COS (London),
2006–2011
Arthur Engel born 1967
Member of the Board
Economics degree
Principal occupation: non-executive
board member; independent advisor and
investor at Hilaritas AB, 2013–
Primary work experience and key
positions of trust:
CEO of Björn Borg AB, 2008–2013; CEO
of Gant Company AB, 2001–2007 and
COO, 2000–2001; CEO and several
executive positions at Leo Burnett
Advertising Agency, 1994–2000; Statoil
Svenska AB, 1991–1994; Chairman of
the Board of Directors of Caliroots AB,
2013–; Member of the Board of Directors
of MQ, 2014–; Member of the Advisory
Board for Economic Studies at the
University of Stockholm; Chairman of
the Board of Directors of Rapunzel of
Sweden, 2015–; Chairman of the Board
of Directors of OnePiece AS, 2015–;
Chairman of the Board of Directors of
Five AB, 2016–; Member of the Board of
Directors of Eton AB, 2016–
Mikko-Heikki Inkeroinen born 1987
Member of the Board
Member of the Audit and Remuneration
Committee
M.Soc.Sc.
Principal occupation: Head of Digital
Commerce of Expert AS, 2015–
Primary work experience and key
positions of trust:
Marketing & E-commerce Manager and
member of company steering group of
Expert ASA Oy, 2010–2015; Member
of the Board of Finnish Recycling
Corporation Ltd, 2014–2015; Member
of the Board of the Finnish Conscript
Union, 2008–2009; Member of the Board
of the Union of Upper Secondary School
Students in Finland, 2006–2007

79Board of Directors and management, 31. Dec. 2017
Helle Priess born 1976
Member of the Board
BA (Chinese studies)
Principal occupation: Owner & CEO of
Priess Ltd., 2009–
Primary work experience and key
positions of trust:
CEO of BTX Far East Asia / BTX China,
2005–2008; CEO of Emborg Foods
China, 2002–2005; Retail Business
Development Manager of Bestseller
Fashion Group (Beijing), 1998–2001;
Member of the Board of Universal
Robots (Singapore) Pte, Ltd., 2015–
2017; Member of the Board of Universal
Robots (Shanghai) Ltd., 2013–2017;
Advisory Board Member of Björn Borg
(China) Limited, 2012–2014
Catharina Stackelberg-Hammarén
born 1970
Member of the Board
Member of the Audit and Remuneration
Committee
M.Sc. (Econ.)
Principal occupation: Founder and
Managing Director of Marketing Clinic,
2004–
Primary work experience and key
positions of trust:
Managing Director of Coca-Cola Finland,
2003–2004 and 2000–2002; Managing
Director of Coca-Cola AB, 2002–2003;
Marketing Director of Coca-Cola
Nordic & Baltic Division (Copenhagen,
Denmark), 2000; Consumer Marketing
Manager of Coca-Cola Finland, 1996–
2000; Marketing Manager of Sentra
plc, 1994–1996; Member of the Board
of Mint of Finland Ltd, 2004–2011;
Member of the Board of Tradedoubler
Ltd, 2006–2007; Member of the Board
of EQ Plc, 2011–2012; Member of the
Board of Cision AB, 2013–2014; Member
of the Board of Jokerit Hockey Club Oy,
2013–2014; Member of the Board of
Scan Securities Ab, 1996–; Member of
the Board of Alma Media Corporation,
2009–; Member of the Board of
Stiftelsen Svenska Handelshögskolan,
2011–; Member of the Board of Aktia
Bank p.l.c., 2012–
MANAGEMENT GROUP
Chairman:
Tiina Alahuhta-Kasko born 1981
President and CEO
Employed by the company since 2005
Members:
Elina Aalto born 1968
Chief Financial Officer (CFO)
Employed by the company since 2015
Tina Broman born 1969
Chief Supply Chain Officer (CSCO)
Employed by the company since 2017
Kari Härkönen born 1981
Chief Digital Officer (CDO)
Employed by the company since 2016
Päivi Lonka born 1962
Chief Sales Officer (CSO)
Employed by the company since 2004
Päivi Paltola born 1971
Chief Marketing Officer (CMO)
Employed by the company since 2017
Tanya Strohmayer born 1970
Human Resources Director
Employed by the company since 2017
For additional information, see the
Report of the Board of Directors,
Management on pages 14–15.
Information on the Board and
Management Group members’
shareholdings in Marimekko Corporation
on 31 December 2017 is provided on
page 59.

80
Information for shareholders
Schedule for financial reporting
in 2018
- Financial Statements Bulletin 2017,
Thursday, 15 February 2018
- Financial Statements 2017, week 12
at the latest
- Interim Reports
• January–March,
Wednesday, 9 May 2018
• January–June,
Thursday, 9 August 2018
• January–September,
Thursday, 1 November 2018
Annual General Meeting
Marimekko Corporation’s Annual General
Meeting will be held from 2 p.m.
onwards on Thursday, 12 April 2018 at
Marimekko Corporation’s head office,
Puusepänkatu 4, 00880 Helsinki, Finland.
Shareholders who have been registered
by the Annual General Meeting’s record
date of 29 March 2018 at the latest in
the company’s Shareholder Register,
held by Euroclear Finland Ltd on behalf
of the Board of Directors of Marimekko
Corporation, have the right to attend the
Annual General Meeting. The shareholder
in whose name the shares are registered
is automatically entered in the company’s
Shareholder Register.
Shareholders who wish to attend the
Annual General Meeting must notify
the company of their intention to do so
before 4 p.m. on Monday, 9 April 2018 at
the latest:
• by filling in the registration
form on the company’s website
company.marimekko.com under
Investors/Management/General
Meeting;
• by email to [email protected];
• by telephone on +358 20 770 6893.
A holder of nominee-registered shares
may participate in the Annual General
Meeting with those shares under which
the holder would be entitled to be
registered in the company’s Shareholder
Register, held by Euroclear Finland Ltd
on behalf of the Board of Directors of
Marimekko Corporation, on 29 March
2018. Additionally, participation requires
that the holder of nominee-registered
shares is temporarily registered in the
Shareholder Register no later than 9 April
2018 at 10 a.m. Temporary registration
in the Shareholder Register shall be
deemed to be a registration for the
Annual General Meeting. A holder of
nominee-registered shares is advised
to request the necessary instructions
regarding the temporary registration in
the Shareholder Register, the issuing
of proxy documents and registration
for the General Meeting from their
custodian bank well in advance. The
account management organisation of the
custodian bank will register a holder of
nominee-registered shares, who wants
to participate in the Annual General
Meeting, to be temporarily entered into
the company’s Shareholder Register by
the above-mentioned time.
Any proxy documents should be
sent in original to the company before
the registration deadline. Notice of the
Annual General Meeting and further
information is provided on the company’s
website under Investors/Management/
General Meeting.
Dividends
The Board of Directors will propose to the
Annual General Meeting that a dividend
of EUR 0.50 per share be paid for 2017.
The dividend will be paid to shareholders
who are registered on the dividend
payout record date of 16 April 2018 in
the company’s Shareholder Register
held by Euroclear Finland Ltd on behalf
of the Board of Directors of Marimekko
Corporation. The Board of Directors will
propose to the Annual General Meeting
that the dividend be paid on 23 April
2018.
Principles of investor relations
Marimekko Corporation complies with
the principles of equity in its investor
communications and publishes all its
investor information primarily on its
website in Finnish and English.
Information sessions and
silent period
Information sessions are held at least
twice a year for analysts and the media,
always when the financial statements
and half-year results are released as
well as when necessary in connection
with the disclosure of other significant
matters. Marimekko has a four-week
silent period before the publication of
earnings reports.
Analysts
A list of banks and securities brokers that
actively follow Marimekko’s development
is available on the company’s website
under Investors/Marimekko as an
investment/Analysts.
Financial reports
Marimekko Corporation’s financial
statements and interim reports are
published in Finnish and English.
Printed financial statements 2017 are
available upon request. Interim reports
are also sent upon request to the address
provided by the subscriber. Financial
information is posted on the company’s
website under Releases and publications.
To order publications, contact:
Marimekko Corporation
Corporate Communications
P.O. Box 107, 00811 Helsinki, Finland
Tel. +358 9 758 71,
Investor relations
Elina Aalto, CFO
Marimekko Corporation
P.O. Box 107, 00811 Helsinki, Finland
Tel. +358 9 758 7261
Piia Kumpulainen,
Communications Director
Marimekko Corporation
P.O. Box 107, 00811 Helsinki
Tel. +358 9 758 7293

marimekko.com