fiscal decentralization in korea* - hitotsubashi universitykokyo/apppsympo04/pdf-papers-nov... ·...
TRANSCRIPT

Fiscal Decentralization in Korea*
Junghun Kim
Korea Institute of Public Finance 79-6 Garak-Dong, Songpa-Gu,
Seoul 138-774, Korea Email: [email protected]
September, 2004
------------------------------------------------ This is a significantly revised version of the paper presented at “International Symposium on Fiscal Decentralization in Asia Revisited”, Hitotsubashi University, February, 2004.
Table of Contents
I. Introduction ............................................................................................................................................ 3 II. Process and Features of Fiscal Decentralization............................................................................... 5 III. System of Local Public Finance ......................................................................................................... 7
1. Structure of Government.................................................................................................................. 7 2. Expenditure Assignment.................................................................................................................. 9 3. Revenue Assignment ...................................................................................................................... 11 IV. Inter-regional Disparity and Intergovernmental Transfers 1. Inter-regional Disparity .................................................................................................................. 17
2. Intergovernmental Transfers ......................................................................................................... 22 V. Main Issues of Fiscal Decentralization............................................................................................. 26
References ................................................................................................................................... 29
- 2 -

I. Introduction
Decentralization is currently a hot policy issue in Korea. Though the issue has been around since the late 1980s, when Korea was preparing to revive local autonomy system, it is gaining a new momentum because the new administration is giving it a major push: among the three national agenda of the administration of President Noh Mu-Hyun, decentralization is one of them.1 The meaning of decentralization, however, is being interpreted in many different ways, depending on the representations and interests of the various parties involved. The divided opinions over the meaning of decentralization are especially pronounced in the area of fiscal decentralization. This is because local governments in Korea are heavily dependent on intergovernmental transfers from the central government. In addition, local taxes in Korea are a kind of intergovernmental transfers since local tax rates are virtually fixed.2 Given the large size of intergovernmental grants, a change in the system of intergovernmental transfers will affect, to a significant extent, the economic status of both individuals and local governments. Therefore, it is not surprising that the meaning of fiscal decentralization is subject to heated debates. Generally speaking, relatively rich local governments tend to view fiscal decentralization as a process to transfer some national taxes to local governments. On the other hand, relatively poor local governments tend to interpret fiscal decentralization as a process to guarantee them more financial resources. The exact meaning of decentralization is actually a fundamental issue, since it is complicated and confusing even in the literature. As Treisman (2002) notes, the usage of the term in the literature often suffers from vagueness. Also, even when the meaning of decentralization is carefully defined, it is inevitably not straightforward.3 Moreover, as is discussed in Ebel and Yilmaz (2003), the empirical measurement of the extent of fiscal decentralization often adds to confusion rather than clarification. The reason why fiscal decentralization is so controversial in Korea is not just attributed to the innate difficulty of clearly defining its meaning. It is rather because fiscal decentralization involves the issue of regional redistribution policy. Local public finance in Korea has been strongly oriented toward equalizing fiscal capacities and expenditure levels of local governments. However, the fiscal capacity gap between Seoul metropolitan region and the rest
1Other two agenda are “Balanced Regional Development” and “Northeast Asia’s Economic Hub”. In addition to this, the President promised to establish an “administration capital” outside Seoul metropolitan region during the presidential campaign. 2This view is expressed in, e.g., McLure (2001) and Bird and Tarasov (2004). 3See Litvack, Ahmad, and Bird (1998): “Decentralization is not easily defined. It takes many forms and has several dimensions. … Thus care must be used in labeling, and labels must be interpreted with care.” (p. 4)
- 3 -

of the region has been ever widening despite the large amount of intergovernmental transfers. The concern of the general public over the so-called “Capital Region Problem” is perhaps bigger than the issue of fiscal decentralization.4 After all, the meaning of fiscal decentralization is different to different individuals and local governments. Therefore, fiscal decentralization is seen by many as a means to achieve more balanced regional development between Seoul capital region and the other areas. The vague meaning of fiscal decentralization and its implicit connection with balanced regional development policy can make a good case that the objective of fiscal decentralization is to put more financial resources into under-developed areas, or areas outside Seoul metropolitan region. If we take this simplistic approach, the necessity of fiscal decentralization is simply transformed into the necessity of a larger amount of intergovernmental grants. However, as is aptly pointed out by Bahl (1999), fiscal decentralization is a comprehensive system, and finance should follow function.5 Viewed from this perspective, what is noticeably lacking in the current discussion on fiscal decentralization in Korea is the issue of expenditure assignment. More precisely speaking, expenditure assignment is actively discussed in Korea, but it is mainly with respect to vertical fiscal imbalance, i.e., the mismatch between revenue capacities and expenditure responsibilities at different levels of governments. But what is more important is Korea is the characteristics of local expenditures rather than just the size of local expenditures. An ideal form of fiscal decentralization would be a match between fiscal capacities and expenditure responsibilities at the different levels of government. In practice, vertical fiscal imbalance and horizontal fiscal imbalance arise because the case for decentralizing taxes is weaker than the case for decentralizing expenditures, and also because local governments are not homogenous.6 Intergovernmental transfers are then employed as a means to reduce the vertical and horizontal fiscal imbalances between levels of government. The issues on the design of intergovernmental transfers for this purpose are well discussed in the literature, and these discussions have important implications on the fiscal decentralization in Korea.7 However, equally important, and perhaps more important issue in Korea is the connection between fiscal decentralization and the balanced regional development policy, a distinct feature in Korea. In this respect, more attention should be paid to the composition of local expenditures rather than just the size of local expenditures. More specifically, the characteristic of local expenditures in Korea is such that the size of local expenditures does not proportionately increase with the size 4“Capital Region Problem” is a term popularly used in Korea to describe the high share of population living in the Seoul metropolitan area. This terminology is similar to “Tokyo Problem” in Japan. 5These are rule #1 and rule #2 in Bahl (1999). 6See Boadway (2001). 7See, e.g., Boadway (2001), Joumard and Kongsrud (2003), and Bird and Tarasov (2004) for the
- 4 -

of local population. This is because publicly provided privates goods such as health, education and welfare are not the responsibilities of local governments in Korea.8 As Boadway and Flatters (1982) and Boadway and Hobson (1993) argue, different sizes of population do not give rise to differences in net fiscal benefit between regions, when local governments provide publicly provided private goods. However, differences in net fiscal benefit arise, when local governments provide nearly pure public goods. Since, in this case, the net fiscal benefit differential is proportional to the size of population in a local jurisdiction, in-migration into a large city such as Seoul becomes a fiscally attractive choice. Therefore, in order to make fiscal decentralization consistent with achieving less regional disparity, fiscal decentralization should be focused on adjusting the composition of expenditures of local governments, rather than on the size of intergovernmental transfers. The paper is organized as follows. In Section II, process and features of fiscal decentralization are discussed. In section III, the system of local public finance is overviewed. In section IV, inter-regional disparity and intergovernmental transfers are discussed. Section V concludes the paper with a discussion on the main issues of fiscal decentralization in Korea.
II. Process and features of fiscal decentralization
Korea became officially independent in 1948 after three years of US Military Government. Local Autonomy Act was enacted in 1949 and, after three years of preparation, local autonomy system was introduced in 1952. That system was abolished in 1961, however, when President Park seized the power. Under the revised constitution of the 3rd Republic, local autonomy system was put off indefinitely until the unification of the Korean peninsula. After the assassination of President Park in 1979, the constitution of the 5th Republic reintroduced a constitutional base for local autonomy. However, the 5th Constitution did not restore the local autonomy system immediately: the supplementary Article 10 of the constitution stated that local councils shall be resumed incrementally according to the degree of financial self-sufficiency of local autonomy. During the 1980s, the political and economic status of Korea changed significantly. As a result of the strong democratic movement in the late 1980s, a significant revision of Local Autonomy Act was finally made in 1988, and it laid out a ground for full-fledged local autonomy. With subsequent minor revisions of Local Autonomy Act, local council elections were held in 1991, and a full-fledged local autonomy system started in 1995, with the heads of local governments being elected by popular votes.
discussion on the design of intergovernmental transfers. 8This is in contrast with the practices in many countries (Boadway, 2001, p. 112).
- 5 -
Even though the local autonomy system started with great expectation, its performance has been less than satisfactory. No local governments in Korea have voluntarily changed local tax rates even if they have the power to do so.9 On the spending side, expenditure assignment is not very clear due to the legacy of long period of centralization. To make things worse, the lack of clear expenditure assignment seems to be welcome by both the central and local governments. The central government enjoys the blurred division of responsibilities because it offers room for flexibly exercising its financial powers. Local governments also enjoy it since it allows them to claim that any services they provide are ultimately the responsibilities of the central government. The blurred nature of expenditure assignment thus makes it possible for local governments to ask for more intergovernmental transfers from the central government whenever there arise more local expenditure needs. Another reason why local autonomy system launched in 1995 is seen to be unsatisfactory is based upon the so-called “Capital Region Problem”. The population living in Seoul region is about 22.7 million, which is 47% of the total population.10 When the magnitudes of fiscal resources are examined, the dominance of Seoul Metropolitan area is even more pronounced. The share of individual income tax revenue collected in this region is 71%, and the share of corporate income tax is as high as 85%. The share of local tax is somewhat lower than this, but its share is still more than 50%. Also, if we compare the share of metropolitan population living around the major cities in the world, it is almost the highest in Korea.11 It is generally believed in Korea that a part of the reason why Seoul has become a target of such a large immigration is because it has benefited from the centralized regime that had prevailed for about 30 years.12 Therefore, it was initially hoped that the system of local autonomy would be conducive to lessening the strong tendency of agglomeration around the capital city. Although nine years of local autonomy is too short to test this hypothesis, the migration pattern so far does not show any sign that “Capital Region Problem” has been lessened since the initiation of the local autonomy system.
9Out of 17 local taxes, local governments can adjust tax rates, usually 50% below or above the standard rate, of 9 local taxes. Local governments can also adjust tax bases of three other property-related local taxes. 10The population of Seoul is 10.2 million. The population of Gyonggi, the province that surrounds Seoul is close to 9.9 million. Incheon, a third largest city close to Seoul, has a population of 2.57 million. 11The population shares of the metropolitan areas of Tokyo, London, Paris, Mexico City, and Kuala Lumpur are, respectively, 27%, 20%, 17%, 21%, and 17% (http://www.citypopulation.de/). 12There are theoretical works that shares this view. Ades and Glaeser (1995) find in their cross-country study that authoritarian regimes have bigger populations in the capital city: “Urban giants ultimately stem from the concentration of power in the hands of a small cadre of agents living in the capital. ... Migrants come to the city because of the demand created by the concentration of wealth, the desire to influence the leadership, the transfers given by the leadership to quell local unrest and the safety of the capital.” (p. 224). See also Alesina and Spolaore (1997).
- 6 -

Partly because of disappointing performance of local autonomy, and partly because of the worsening regional disparities, fiscal decentralization and ‘balanced regional development’ are being adopted as major reform policy agenda for the new administration. Unfortunately, how we can achieve both policy objectives, and whether it is even possible for fiscal decentralization to mitigate the centripetal force of Seoul metropolitan area are not clearly known yet. If we take a simplistic approach, there is a chance that fiscal devolution results in a larger Seoul metropolitan area due to the already heavy concentration of financial resources and population around Seoul region. Despite this fact, the debate of fiscal decentralization tends to be focused on transfer of fiscal resources to local governments that include, by definition, the city of Seoul. Also, the policy of balanced regional development is pursued under the premise that the agglomeration effect of Seoul region can be mitigated by a combination of industrial policy and regional policy. Since the nature of agglomeration around Seoul metropolitan area is not clearly understood, however, these policies are facing tough challenges.
III. System of Local Public Finance13 1. Structure of Government The total area of Korea is 99,393 square kilometers and the total population as of 2003 was about 48.3 million. Administratively, local governments are divided into a total of 16 prefectures and 234 municipalities. Prefectures, upper-level local governments, are composed of a metropolis (Seoul), six wide-area cities (Busan, Daegu, Incheon, Gwangju, Daejeon, and Ulsan), and nine provinces (Gangwon, Kyonggi, Chungbuk, Chungnam, Jeonbuk, Jeonnam, Gyeongbuk, Gyeongnam, and Jeju). According to the Local Autonomy Act, the functions of prefectures are divided into two categories: intermediation between the national government and municipal governments; and area-wide administration. They are responsible for matters that affect broad geographical areas within their jurisdiction or for which a single standard needs to be maintained throughout the prefecture. Municipalities consist of cities, towns (Gun), and special districts (Gu). Cities have a population of 50,000 or more, and towns (Gun) have a population of under 50,000. Special districts are autonomous municipalities under seven big cities (Fig. 1). The functions of municipalities are, in principle, the local functions that are not covered by prefectures. However, the municipalities whose population is over 500 thousands sometimes can take care of the functions assigned to
13Structure of local public finance in Korea is also discussed, with more emphasis on local bond market, in Kim (2003).
- 7 -

prefectures. In case when prefectures and municipalities compete for a certain type of function, municipalities take precedence over prefectures.
Figure1. Korean Local Government System (2004. 1)
Province (Do) (9)
Metropolitan City (6)
Seoul
City (Si) (77)
County(Gun) (83) County
(Gun) (5) Special districs (Gu)
(44) Special districs (Gu)
(25)
District (Gu) (22)
Central Government
The populations of local governments vary greatly depending on their types and locations. Out of 48.3 million people in Korea, 10.17 million (21%) reside in Seoul. Another 10.2 million (21.1%) live in Kyonggi, a province that surrounds Seoul. Incheon, about 30km west to Seoul, has a population of 2.57 million (5.3%). Altogether, 47.4% of Korea's population live around Seoul metropolitan area. Also, 12.7 million (26.4%) live in the six major cities. Therefore about 70% of the population live in large cities and their surroundings. The number of local governments has been changed to a great extent during the 1990s. Before 1991, the year when local council elections were held, the number of local governments was 286 with the number of cities 67, that of counties 137, and that of special districts 70. In 1995, amalgamation of local governments took place to a significant extent, with many counties being absorbed into neighboring cities. As a result, the number of counties was reduced to 93, and the numbers of cities and special districts increased to, respectively, 72 and 90. In 1997, a southeast city of Ulsan became an upper-level local government, whereby the number of the upper-level local governments increased to 16. Since then, there have been minor changes in the number of cities and counties. As of January 2004, the numbers of cities, counties, and special districts are, respectively, 77, 88, and 91. Among the 88 counties, which are mostly rural area, 5 of them belong to metropolitan cities. Therefore some part of the metropolitan cities consists of rural areas. 2. Expenditure Assignment
- 8 -
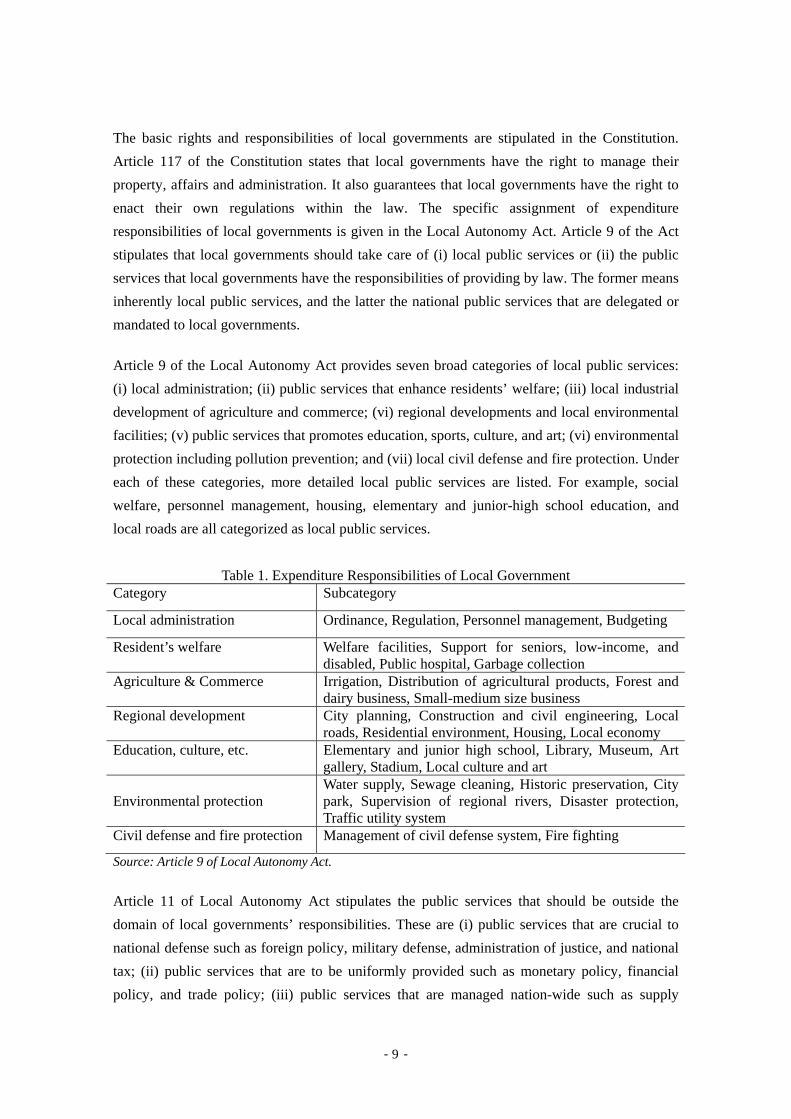
The basic rights and responsibilities of local governments are stipulated in the Constitution. Article 117 of the Constitution states that local governments have the right to manage their property, affairs and administration. It also guarantees that local governments have the right to enact their own regulations within the law. The specific assignment of expenditure responsibilities of local governments is given in the Local Autonomy Act. Article 9 of the Act stipulates that local governments should take care of (i) local public services or (ii) the public services that local governments have the responsibilities of providing by law. The former means inherently local public services, and the latter the national public services that are delegated or mandated to local governments.
Article 9 of the Local Autonomy Act provides seven broad categories of local public services: (i) local administration; (ii) public services that enhance residents’ welfare; (iii) local industrial development of agriculture and commerce; (vi) regional developments and local environmental facilities; (v) public services that promotes education, sports, culture, and art; (vi) environmental protection including pollution prevention; and (vii) local civil defense and fire protection. Under each of these categories, more detailed local public services are listed. For example, social welfare, personnel management, housing, elementary and junior-high school education, and local roads are all categorized as local public services.
Table 1. Expenditure Responsibilities of Local Government Category Subcategory
Local administration Ordinance, Regulation, Personnel management, Budgeting
Resident’s welfare Welfare facilities, Support for seniors, low-income, and disabled, Public hospital, Garbage collection
Agriculture & Commerce Irrigation, Distribution of agricultural products, Forest and dairy business, Small-medium size business
Regional development City planning, Construction and civil engineering, Local roads, Residential environment, Housing, Local economy
Education, culture, etc. Elementary and junior high school, Library, Museum, Art gallery, Stadium, Local culture and art
Environmental protection
Water supply, Sewage cleaning, Historic preservation, City park, Supervision of regional rivers, Disaster protection, Traffic utility system
Civil defense and fire protection Management of civil defense system, Fire fighting
Source: Article 9 of Local Autonomy Act. Article 11 of Local Autonomy Act stipulates the public services that should be outside the domain of local governments’ responsibilities. These are (i) public services that are crucial to national defense such as foreign policy, military defense, administration of justice, and national tax; (ii) public services that are to be uniformly provided such as monetary policy, financial policy, and trade policy; (iii) public services that are managed nation-wide such as supply
- 9 -

control of agriculture, fishery, and livestock, and trade; (iv) public services that are provided nation-wide such as national development plan, management of national forest, management of national river, highway, harbor, expressway, national highway, and management of national park; (v) public service that needs uniform standard nation-wide such as labor standard and survey standard; (vi) public services that need national coordination such as postal systems and railway; and (vii) public services such as inspection, test, research, navigation management, meteorological management, and nuclear engineering development that requires high technologies. The Local Autonomy Act seems to clearly define central and local expenditure responsibilities through Article 9, Article 10 and Article 11. However, the distinction between central and local functions is not very clear in practice. The problem of blurred division of responsibilities is known to exist in many other countries, but the problem seems to be more serious in Korea due to the long history of centralized government. Under the centralized government structure, clearly defining local government’s functions was not an important issue. As a result of such a legacy, the laws that govern public services usually stipulate the responsibilities of central and local governments in very vague ways. The problem of vagueness starts with the Local Autonomy Act. When local or central functions are defined in Article 9 and Article 11, it defines such functions with the proviso that “the functions can be changed, if individual laws define local functions in a different way”. Since this means any individual law can define local functions differently from the Local Autonomy Act, the role of the Article 9 and Article 11 of the Act is confined to a declaration of the basic nature of central and local functions. For example, the definition of a local function such as “the public services that enhance local residents’ welfare” is too broad to have any binding effect on the division of functions between central and local government. The vague nature of the expenditure responsibilities is a serious one since remedying it requires handling almost 4,000 individual ordinances, regulations, and laws that govern public services. There have been recent efforts to examine all legal documents to define expenditure responsibilities more clearly. In 1999, a committee (Presidential Commission on Devolution Promotion Local Authorities) was established for this purpose, and 493 central functions become local ones by the end of 2001. The effort to transfer central functions to local governments is ongoing in the current administration with even bigger push and thousand of central functions are expected to become local functions within a few years.14
14The definition of function needs clarification. A recent study by KRILA (2003) tried to define smallest unit of government functions based on about 3,500 legal documents. It found that there are about 41,000 government functions, of which 73% is the central function. The terminology of “government function” is usually used in a broader context. For example, the number of major government function defined by the
- 10 -

Despite such efforts, the problem of blurred division of expenditure responsibilities is not expected to be solved in the near future. First of all, the current effort put on the division of expenditure responsibilities is focused on expanding local functions, rather than clarifying overlapping functions. The issue that lies at the heart of the problem is central government’s mandates and local governments heavy reliance on intergovernmental transfers. Very often, individual laws passed in the parliament dictate, without any financial commitment, that a certain function should be taken care of by local governments. This is a legacy of centralization era, when both functions and financial resources of local governments were ultimately determined by the central government. If we try to sort out true local functions from mandates, the size of the intergovernmental transfers should be also adjusted. Therefore, even if we succeed in clarifying overlapping functions, which is already a very difficult and time-consuming process, the issue of redesigning fiscal relationship between central and local governments will necessarily follow. 3. Revenue Assignment 3.1. Overview The revenue of local governments consists of local taxes, non-tax revenues, intergovernmental grants, and local debts. According to the local government budget of 2003, the amounts of local tax revenue, non-tax revenue, intergovernmental grants, and local debts are, respectively, 31.98 Trillion Won (36.6%), 23.23 Trillion Won (26.6%), 29.4 Trillion Won (33.7%), and 2.67 Trillion Won (3.1%).15 Intergovernmental transfers consist of Local Shared Tax, Local Transfer Fund, and National Subsidy, and their shares in the intergovernmental transfers are, respectively, 40.3%, 16.5%, and 43.1%.16 The extent to which local governments are financially independent is usually described by an index called FII (Fiscal Independence Index), which is the share of own-source revenue of local governments. The average FII as of 2003 is 57.2%, but it differs greatly from one local government to another, reflecting their diverse financial profiles. Seoul is financially almost independent, with 94.5% of FII. The average FII of metropolitan cities is much lower at 68.8%, with its lowest FII being 54.6%. Thus, although regarded relatively rich local governments, some of the metropolitan cities are far from being financially independent. Province’s financial
Census Bureau of the US is 70. 15One dollar is approximately 1,200 Won. 16Local Share Tax is general grants, Local Transfer Fund is a kind of block grants, and National Subsidy is specific grants. More detailed discussions on intergovernmental grants will be given in section IV.
- 11 -

capacity is even more lower, with the average FII at 41.3. Compounding the problem of province’s low average FII is its large variance: the wealthiest province, Kyonggi, has an FII of 78.0%; the poorest, Jeonnam, 14.2%. Cities, lower-level local governments where at least 50,000 people live, have an average FII of 38.8%, with the highest at 70.4% and the lowest, 12.3%. Towns, mostly rural areas where people less than 50,000 live, can hardly be regarded as independent as they have an average FII of only 16.6%. The financial status of special districts, which are located in the big cities, is very diverse with the highest FII of 92.7% and the lowest 19.4%.
Table 2. The share of own-source revenue by type of local governments (%)
Seoul Metropolitan Cities Provinces Cities Towns Special
districts Average 94.5 68.8 41.3 38.8 16.6 42.6
Highest 94.5 72.7 78.0 70.4 48.6 92.7
Lowest - 54.6 14.2 12.3 7.1 19.4 Source: Ministry of Government Administration and Home Affairs.
The distribution of FII of local governments shows that majority of local governments are heavily dependent on the central government’s intergovernmental transfers, with 54% of local governments having FII less than 30%. However, just counting the number of local governments gives somewhat misleading information on the financial environment under which local residents are living. Since majority of people live in a small number local governments in which FII is above 70%, most of local residents, especially those living around Seoul metropolitan area, enjoy relatively high degree of financial independence of local governments.
Table 3. The distribution of share of own-source revenue of local governments (%)
Total Prefectures Cities Towns Special districts
Less than 10% 10~30% 30~50% 50~70% 70~90%
Higher than 90%
10(4%) 126(50%) 83(30%) 20(8%) 7(3%) 4(2%)
0 7 1 3 4 1
0 32 30 14 1 0
10 72 6 0 0 0
0 15 46 3 2 3
Total 250(100) 16 77 88 69 Source: Ministry of Government Administration and Home Affairs.
When we take a look at the trend of FII, shown in Fig. 2, we can see that the share of own
- 12 -
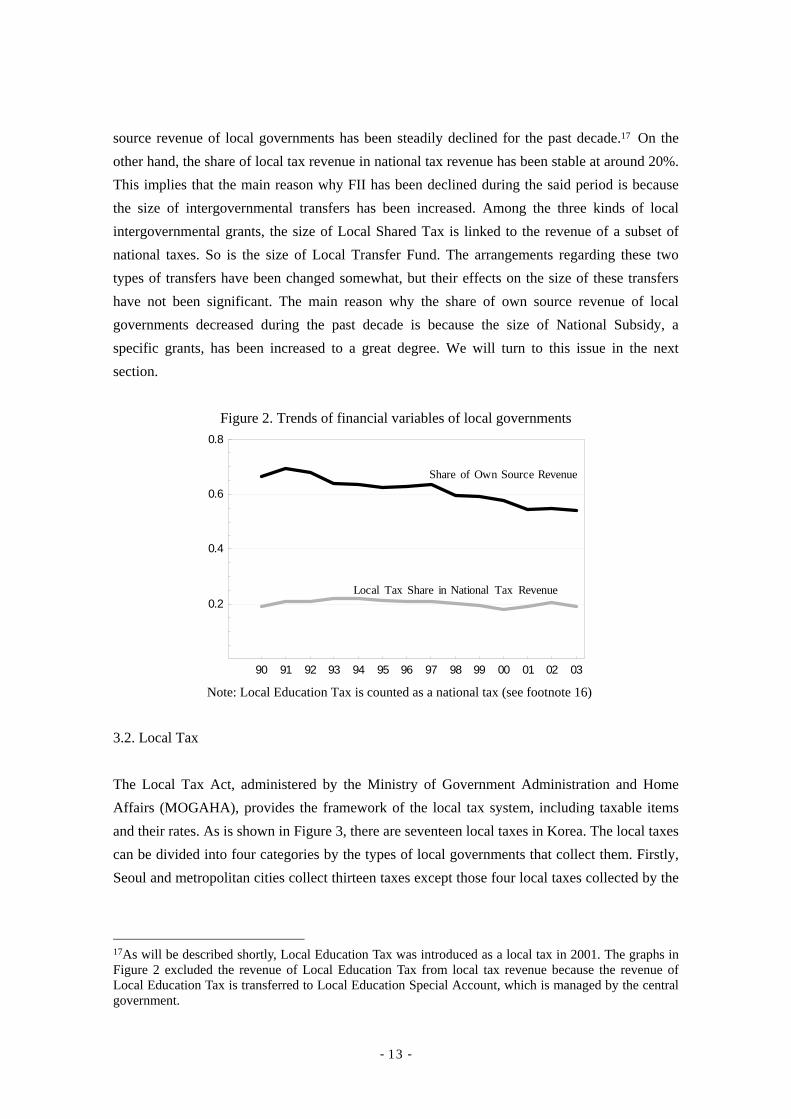
source revenue of local governments has been steadily declined for the past decade.17 On the other hand, the share of local tax revenue in national tax revenue has been stable at around 20%. This implies that the main reason why FII has been declined during the said period is because the size of intergovernmental transfers has been increased. Among the three kinds of local intergovernmental grants, the size of Local Shared Tax is linked to the revenue of a subset of national taxes. So is the size of Local Transfer Fund. The arrangements regarding these two types of transfers have been changed somewhat, but their effects on the size of these transfers have not been significant. The main reason why the share of own source revenue of local governments decreased during the past decade is because the size of National Subsidy, a specific grants, has been increased to a great degree. We will turn to this issue in the next section.
Figure 2. Trends of financial variables of local governments
90 91 92 93 94 95 96 97 98 99 00 01 02 03
0.2
0.4
0.6
0.8
Local Tax Share in National Tax Revenue
Share of Own Source Revenue
Note: Local Education Tax is counted as a national tax (see footnote 16)
3.2. Local Tax The Local Tax Act, administered by the Ministry of Government Administration and Home Affairs (MOGAHA), provides the framework of the local tax system, including taxable items and their rates. As is shown in Figure 3, there are seventeen local taxes in Korea. The local taxes can be divided into four categories by the types of local governments that collect them. Firstly, Seoul and metropolitan cities collect thirteen taxes except those four local taxes collected by the
17As will be described shortly, Local Education Tax was introduced as a local tax in 2001. The graphs in Figure 2 excluded the revenue of Local Education Tax from local tax revenue because the revenue of Local Education Tax is transferred to Local Education Special Account, which is managed by the central government.
- 13 -
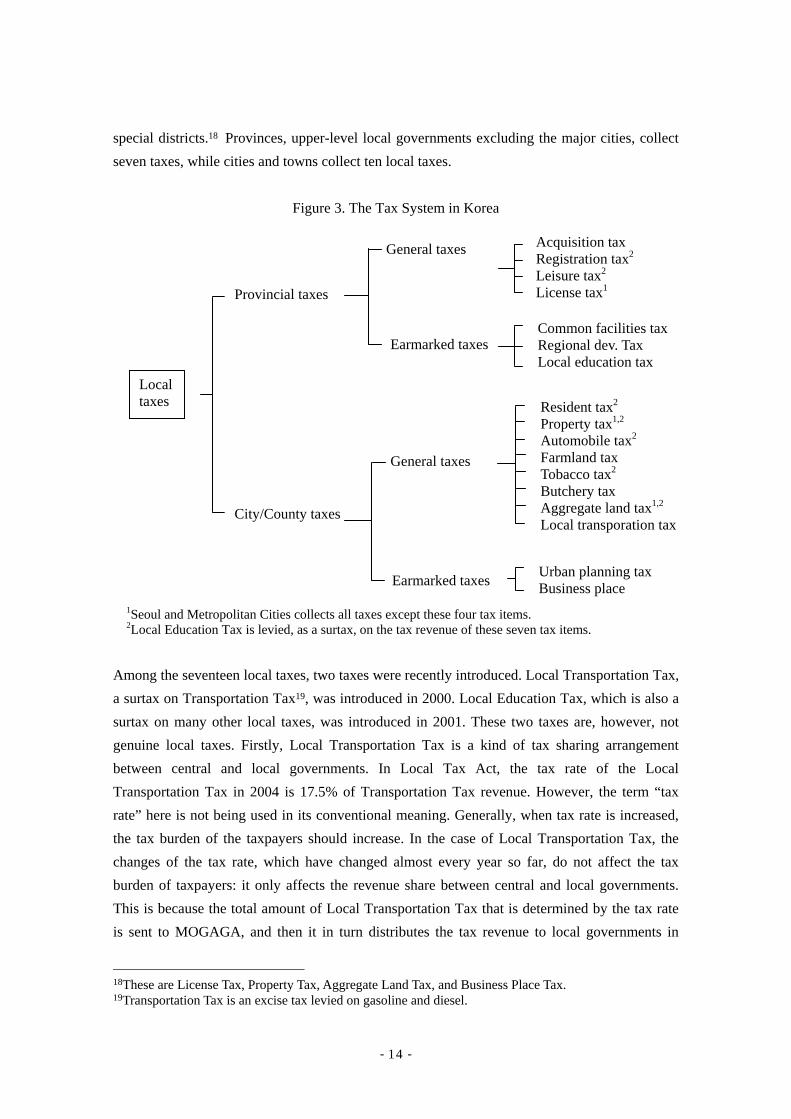
special districts.18 Provinces, upper-level local governments excluding the major cities, collect seven taxes, while cities and towns collect ten local taxes.
Figure 3. The Tax System in Korea
General taxes
Earmarked taxes
Acquisition tax Registration tax2
Leisure tax2 License tax1 Common facilities tax Regional dev. Tax Local education tax
General taxes
Earmarked taxes
Resident tax2 Property tax1,2 Automobile tax2 Farmland tax Tobacco tax2 Butchery tax Aggregate land tax1,2 Local transporation tax
Urban planning tax Business place
City/County taxes
Provincial taxes
Local taxes
1Seoul and Metropolitan Cities collects all taxes except these four tax items. 2Local Education Tax is levied, as a surtax, on the tax revenue of these seven tax items.
Among the seventeen local taxes, two taxes were recently introduced. Local Transportation Tax, a surtax on Transportation Tax19, was introduced in 2000. Local Education Tax, which is also a surtax on many other local taxes, was introduced in 2001. These two taxes are, however, not genuine local taxes. Firstly, Local Transportation Tax is a kind of tax sharing arrangement between central and local governments. In Local Tax Act, the tax rate of the Local Transportation Tax in 2004 is 17.5% of Transportation Tax revenue. However, the term “tax rate” here is not being used in its conventional meaning. Generally, when tax rate is increased, the tax burden of the taxpayers should increase. In the case of Local Transportation Tax, the changes of the tax rate, which have changed almost every year so far, do not affect the tax burden of taxpayers: it only affects the revenue share between central and local governments. This is because the total amount of Local Transportation Tax that is determined by the tax rate is sent to MOGAGA, and then it in turn distributes the tax revenue to local governments in
- 14 -
18These are License Tax, Property Tax, Aggregate Land Tax, and Business Place Tax. 19Transportation Tax is an excise tax levied on gasoline and diesel.

proportion to the share of Car Tax revenue of each local government. Because of the tax sharing nature of the Local Transportation Tax, few citizens recognize that they are paying a local tax when they pump fuel at the gas station.20 The characteristic of (Local) Education Tax is even more peculiar. Before 2001, Education Tax was levied, as a surtax, on three national taxes and seven local taxes.21 In 2001, the parts of Education Tax that were levied on local taxes became Local Education Tax. The revenue of Education Tax, a national tax, is transferred to a special account for Local Education Transfer Fund, managed by the Ministry of Education and Human Resource Development (MOE). The fund is then sent to Local Education Special Account, a revenue source of Office of Education located at sixteen prefectures.22 The revenue of Local Education Tax, collected by local governments, is also sent to the Local Education Special Account. Therefore, the change in 2001 didn’t make any difference in Local Education Special Account, except that we have split Education Tax into central and local taxes. Apparently, however, the change makes the revenue of local taxes look increased compared to that of national taxes, which is not really true since local governments have no control over the revenue of Local Education Tax. It is often argued that Korea's local governments do not have an independent taxing power.23 This is because Article 59 of the Constitution stipulates that the rates and bases of taxes should be determined by law. This seems to imply that local governments cannot independently decide on the local tax rates through by-laws. However, while the Local Tax Act dictates the basic framework of local taxes, it allows local governments to determine the tax rates of eleven local taxes within a certain limits (usually 50 percent below or above the standard rate determined in the Local Tax Act). Therefore, local governments do have an independent power to set their own local tax rates.24
20The Local Consumption Tax in Japan introduced in 1997 is collected by the central government as a part of value-added tax, and then one forth of the revenue is distributed to local governments based upon consumption statistics. In this sense, Local Transportation Tax in Korea and Local Consumption Tax in Japan are similar. However, consumers in Japan can recognize the Local Consumption Tax from the receipts since its tax amount is separately shown from the value-added tax. 21It is also levied at 0.5% on the profit of financial insurance company. 22It is argued by, among others, MOE and Association of teachers, that Korea enjoys local autonomy in the area of education service. This is because the head of Office of Education is elected by vote. Also, the budget of Office of Education is not directly managed by the central government (MOE), but through Local Education Special Account. However, the election is not by direct popular vote, but by electoral college that consist of a few thousand electors. Also, the budget spent on local education is not under the control of local governments and resident. Therefore Office of Education is in effect an administrative arm of MOE. 23For example, see OECD (2000). 24The question is then why local governments do not exercise their given taxing power. We will discuss this issue in section V.
- 15 -

The basic principle of the determination of national and local taxes in Korea is “tax base separation”. This principle is governed by National and Local Tax Adjustment Act. Specifically, Article 4 of the Act forbids tax sharing between the central and local governments, except for the cases where this law explicitly allows it. However, the exceptions have become too prevalent to be meaningful. Local Education Tax, which is really a national tax, is imposed on many local taxes, and so are Special Tax for Rural Development. Also local governments impose a surtax of 10 percent on the Income Tax, which is a national tax.
Among the seventeen local taxes, the Acquisition Tax and Registration Tax are the most important ones. These are levied at 5.8% on the values of properties such as land and structures when they are bought.25 As can be seen from Figure 4, the share of these two taxes in local tax revenue is more than 40%. Also, the share has been increased quite rapidly during recent years due to increases in the tax bases of these taxes. A third largest local tax in Korea is Residence Tax, which is a surtax levied on Income Tax revenue. Its share in local tax revenue was about 10% in the middle of 1990s, but it has been increasing since then, reaching 16% as of 2003. The reason why the Residence Tax has been increasing recently is because of the rapid increase in corporate income tax revenue.26
Figure 4. Tax share of main local taxes
90 91 92 93 94 95 96 97 98 99 00 01 02 03
0.1
0.2
0.3
0.4
0.5
Acquisition Tax and Registration Tax
Residence Tax
Land Tax and property Tax
The annual recurrent taxes on land and structures should be important revenues of local
25The tax rate of Acquisition Tax is 2%, and 0.2% of Special Tax for Rural Development is also levied along with it (The tax rate of Special Tax for Rural Development is 10%). The tax rate of Registration Tax is 3%, and 0.6% of Local Education Tax is also levied (The tax rate of Local Education Tax is 20%). Those who buy properties usually do not pay attention to these complicated schemes, and just pay the whole amount. 26The share of corporate income tax in national tax revenue was around 15% up until 1999. However, the revenue has increased sharply since then because, among others, the debt of companies has been significantly decreased after restructuring.
- 16 -

governments. But their share in local tax revenue is not very high in Korea. The tax share of Aggregate Land Tax and Property Tax was around 10% in the middle of 1990s, and it has been steadily decreased for the past decade. The trend is changing from 2003 because of property tax reform drive by the new administration. According to the recent announcement of the government, the tax revenue of recurrent taxes on land and structures are expected to double within four years. However, because there are strong resistances from relatively rich individuals and local governments, whether such a plan will be successful remains to be seen. IV. Inter-regional Disparity and Intergovernmental Transfers 1. Inter-regional Disparity As discussed in the introduction, the most pronounced feature of the economic environment surrounding local public finance in Korea is the concentration of economic resources around Seoul metropolitan area. 27 International comparison shows that the extent of population concentration around the capital region is almost the highest in Korea, which is about 47% as of 2003. The population share of the capital regions of the countries known to have a big capital city is much smaller compared to Seoul metropolitan area: the population share of Tokyo is 27%, that of Mexico City is 21%, and that of Paris is less than 20%.28
Figure 5. Population share of capital region (2002)
0.1 0.2 0.3 0.4 0.5
SeoulTaipeiTokyo
MexicoCityLondon
KualaLumpurParis
ManilaBankokJakarta
HoChiMinh
0.450.33
0.270.21
0.20.170.17
0.160.12
0.070.05
Source: (http://www.citypopulation.de/)
The current concentration of population around Seoul metropolitan region is the result of thirty years of continuous immigration into the region. In the early 1970s, when Korea was at the 27The capital region of Korea consists of Seoul, the city of Incheon, and Kyonggi province. 28The populations of the metropolitan areas of Tokyo, Mexico city, Seoul, and Paris are, respectively, 33.9
- 17 -

beginning stage of economic development, the population share of Seoul metropolitan region was about 28%. However, by the end of 1970s, the share rose to 34.6%. The inflow of immigration into the region kept continuing in the 1980s, and by the end of 1980s, the share of the region grew to 42.8%. An interesting aspect of agglomeration of Seoul metropolitan region is that the inflow of immigration into the city of Seoul was at peak around 1990. However, the size of Seoul metropolitan region kept growing after that, because many satellite cities around Seoul began to grow by a rapid pace during the 1990s. Thus, the population share of Seoul metropolitan area became 45.8% at 2000, and it still keeps growing, reaching 47.4% as of 2003.
Figure 6. Trend of population share of capital region
70 75 80 85 90 95 00 03
0.1
0.2
0.3
0.4
0.5 Population share of Seoul metropolitan region
Population share of Seoul
The large share of population of Seoul metropolitan region means that the local governments in the region also collect a large amount of revenue. As a matter of fact, the local tax share of Seoul metropolitan region is even greater than the population share. Also, as is the case of the population share, it has steadily increased during the past decade except last year. Specifically, the share of local tax revenue in the metropolitan area was about 54% in 1995, and then it has increased to 56.7% in 2000. It reached over 60% in 2002 and then decreased to 59.2% last year.29 In Figure 2, the share of Acquisition Tax and Registration Tax of Seoul metropolitan region in the local tax revenue is shown since they are the most important revenue sources for local governments.30 Its share in Seoul metropolitan area had been similar to that of the total local tax share until 1998, but it noticeably increased since then. Since Korea was hit by financial crisis in that year, this change seems to be related to it. One possibility is that the financial crisis hit regional area more severely than Seoul metropolitan area. This will make the million, 22.1 million, 21.9 million, and 9.9 million (http://www.citypopulation.de/). 29It is not clear why the tax share of the metropolitan area declined despite an increase in population share in 2003. The numbers for 2003 used in Figure 4 is not yet official, so there is possibility that the numbers for 2003 are not completely accurate.
- 18 -
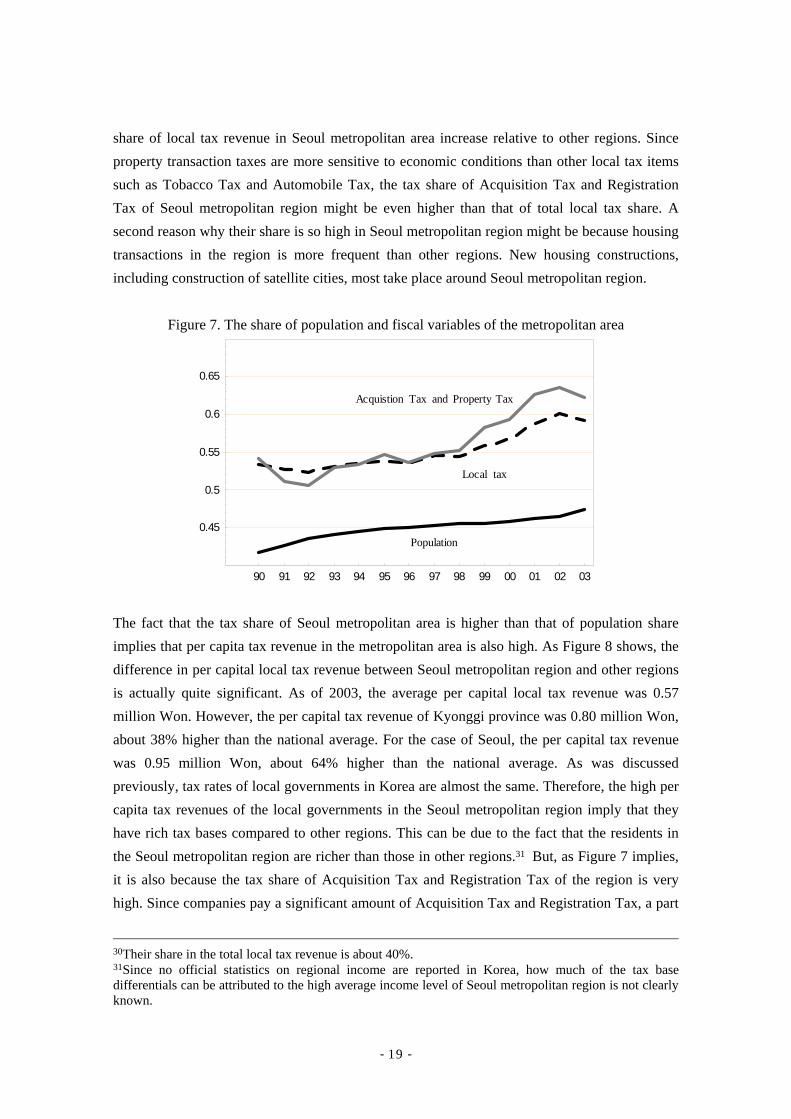
share of local tax revenue in Seoul metropolitan area increase relative to other regions. Since property transaction taxes are more sensitive to economic conditions than other local tax items such as Tobacco Tax and Automobile Tax, the tax share of Acquisition Tax and Registration Tax of Seoul metropolitan region might be even higher than that of total local tax share. A second reason why their share is so high in Seoul metropolitan region might be because housing transactions in the region is more frequent than other regions. New housing constructions, including construction of satellite cities, most take place around Seoul metropolitan region.
Figure 7. The share of population and fiscal variables of the metropolitan area
90 91 92 93 94 95 96 97 98 99 00 01 02 03
0.45
0.5
0.55
0.6
0.65
Population
Local tax
Acquistion Tax and Property Tax
The fact that the tax share of Seoul metropolitan area is higher than that of population share implies that per capita tax revenue in the metropolitan area is also high. As Figure 8 shows, the difference in per capital local tax revenue between Seoul metropolitan region and other regions is actually quite significant. As of 2003, the average per capital local tax revenue was 0.57 million Won. However, the per capital tax revenue of Kyonggi province was 0.80 million Won, about 38% higher than the national average. For the case of Seoul, the per capital tax revenue was 0.95 million Won, about 64% higher than the national average. As was discussed previously, tax rates of local governments in Korea are almost the same. Therefore, the high per capita tax revenues of the local governments in the Seoul metropolitan region imply that they have rich tax bases compared to other regions. This can be due to the fact that the residents in the Seoul metropolitan region are richer than those in other regions.31 But, as Figure 7 implies, it is also because the tax share of Acquisition Tax and Registration Tax of the region is very high. Since companies pay a significant amount of Acquisition Tax and Registration Tax, a part
30Their share in the total local tax revenue is about 40%. 31Since no official statistics on regional income are reported in Korea, how much of the tax base differentials can be attributed to the high average income level of Seoul metropolitan region is not clearly known.
- 19 -

of the reason why Seoul metropolitan area enjoys higher per capita tax revenue is because business activities in the region is much more intense compared to other regions. Therefore, assuming that the tax-payers of business-related taxes are not necessarily local residents, it can be argued that a part of the reason why local governments in the Seoul metropolitan region collect a large amount of local taxes is because they enjoy tax-exporting.
Figure 8. Per capita local tax revenue (prefectures)32
2× 10⁶ 4×10⁶ 6× 10⁶ 8× 10⁶ 1× 10⁷ 1.2× 10⁷Pop
0.2
0.4
0.6
0.8
1Million Won
Seoul
BusanDGIC
GJ
DJUlsan
Kyonggi
GWCB
CN
JB JN
GB
GN
Jeju
If a local government collects a higher amount of per capita local tax, it is generally expected its per capita local expenditure should be also high. However, a very notable aspect of local public finance in Korea is that per capita expenditure in Seoul metropolitan region is significantly lower than that in the other regions. As of 2002, the average per capital local expenditure was about 1.93 million Won. On the other hand, the per capita local expenditure of Kyonggi province was about 1.49 million Won, 22.8% lower than the average. The per capita local expenditure of Seoul was 1.13 million Won, 41% lower than the average. These are in contrast with much higher per capita local expenditure of provinces such as Gangwon, Jeonnam, and Gyeongbuk, as can be seen in Figure 9. The fact that per capita local expenditure is high in Seoul metropolitan region and low in provinces implies that there is a negative relationship between per capita expenditure and the size of population. As a matter of fact, the relationship between the per capita local expenditure and population is noticeably tight if we take a look at the data of cities and town, as is shown in Figure 9.33 Note that the linear relationship between per capita expenditure and population breaks down when the size of population becomes greater than 1 million. However, this is 32Initials are as follows: DJ: DaeJeon, IC: InCheon, GJ: GwangJu, GW: GangWon, CB: ChungBuk CN: ChungNam, DG: DaeGu, GB: GyeongBuk, GN: GyeongNam, JB: JeonBuk, JN: JeonNam.
- 20 -

because Seoul and six wide-area cities, whose populations are greater than 1 million, take wider expenditure responsibilities than the other smaller cities and towns.34 Therefore, if we take into account only those expenditure categories that are covered by all local governments, it is very likely that the linear relationship between per capita expenditure and population holds even for big cities.
Figure 8. Per capita local tax revenue (prefectures)
2× 10⁶ 4×10⁶ 6× 10⁶ 8× 10⁶ 1×10⁷ 1.2× 10⁷Pop
0.5
1
1.5
2
2.5
3
3.5
4Million Won
SeoulBusanDGIC
GJDJ
Ulsan
Kyonggi
GangWon
CBCNJB
JeonNam
GBGN
Jeju
Figure 9. The distribution of per capita local expenditure (million Won)35
10 12 14 16 18pop
−2
−1.5
−1
−0.5
0
0.5
1
1.5
2Localexpenditure
The high level of per capita tax revenue and low level of per capita expenditure in Seoul metropolitan region may look inconsistent since residents are not likely to be willing to pay a high amount of local taxes while receiving a low level of public expenditure benefits. This 33The data used is Seoul, six wide-area cities, 74 cities, and 89 towns. 34At the same time, major cities collect more local taxes than cities and towns.
- 21 -

apparent inconsistency can be explained by two possible reasons. First, although the per capita tax revenue in Seoul metropolitan region is high, residents in the region might not be paying as much taxes due to tax exporting, as was discussed previously. Second, low level of per capita expenditures does not necessarily mean low level of public expenditure benefits if local public goods exhibit little congestion. Although these arguments suggest possible reasons for the apparent inconsistency, they at the same time indicate the source of inefficiencies of local public finance in Korea since both tax exporting and scale economies in the provision of local public goods suggest that tax assignment and expenditure assignment are not appropriately designed. 2. Intergovernmental Transfers Since provinces have high levels of per capita expenditure while collecting low levels of per capita tax revenue, the gap is filled by intergovernmental grants. In figure 10, three types of intergovernmental grants (Local Shared Tax, Local Transfer Fund and National Subsidies) are combined, and its per capita amount is plotted against population sizes of local governments. As is expected, the negative relationship between per capita intergovernmental grants and population is fairly tight except a few local governments, including the metropolitan cities whose populations are greater than one million. As was mentioned before, metropolitan cities have more expenditure responsibilities than cities and towns, which are not completely covered by their additional local tax items. Thus, metropolitan cities in general receive more intergovernmental grants than the cities and towns of similar size. Therefore, if we include “metropolitan city dummy” in explaining the relationship between per capita grants and population sizes, the relationship is very tight. The negative and very tight relationship between the per capita intergovernmental grants and population sizes is an important feature of local public finance in Korea. In general, theories of intergovernmental grants do not imply such a simple and tight negative relationship between the two variables, because the factors that determine intergovernmental grants should be in principle various variables that measure fiscal capacities and fiscal needs. Also, such a simple relationship between population and per capita grants is not easily found in other countries. It should be also noted that the intergovernmental grants in Figure 10 includes all three types of grants in Korea. The three intergovernmental grants have their own purposes, and LST can best be categorized as equalization grants, while LTF and National Subsidies are a type of program grants.36 Even though the three types of grants have distinct purposes, population size is still a dominant factor in the determination of these grants.
35Variables are in log scales. 36The characteristics of these three intergovernmental grants will be discussed in detail shortly.
- 22 -

Figure 10. The distribution of per capita local expenditure (million Won, 2002)37
10 11 12 13 14 15 16
−3
−2
−1
0
1
2
grants per capita
Another notable aspect of intergovernmental grants in Korea is the fact that it has significantly increased since 1995, the year when Korea reintroduced the system of local autonomy. As was shown in Figure 2, the share of own-source revenue of local governments has steadily decreased during the past decade. This is because the share of local tax revenue in the total tax revenue has been at around 20%, while the amount of intergovernmental grants has been steadily increasing. As can be seen from Figure 11, the most notable change in intergovernmental grants during the past decade is an increase in the amount of National Subsidies. Until 1995, the size of National Subsidies was similar to that of LST, however it rapidly increased since then partly because National Subsidies include welfare programs that were significantly expanded after the financial crisis in 1998. Because it is generally regarded that general grants are better form of intergovernmental grants than conditional grants, there have been discussions to reduce the size of National Subsidies and instead increase the size of LST. The need for such change became stronger around 2000, since the gap between National Subsidies and LST became noticeably wide. As a result, the share of LST in national tax revenue increased from 13.27% to 15% in 2001. However, a more fundamental reform took place after the current administration took power. It set up decentralization and balanced regional development as national agenda, and is vigorously pursued local public finance reform. As a result major changes took place to the system of intergovernmental grants.
Figure 10. The distribution of per capita local expenditure (million Won, 2002)
37Variables are in log scales.
- 23 -

90 91 92 93 94 95 96 97 98 99 00 01 020
2.5µ106
5µ106
7.5µ106
1µ107
1.25µ107
1.5µ107
National Subsidy
Local Shared Tax
Local Transfer Fund
Firstly, Local Transfer Fund, which has been in existence since 1991, is going to be abolished in 2005. The Local Transfer Fund can be categorized as a block grants since it is provided to local governments for five broadly defined local functions such as roads, sewage, regional development, rural area development, and juvenile care. However, the real nature of the Local Transfer Fund is quite unique. On the one hand, it has the characteristic of block grants in the sense that allocation method and target projects are defined in law and regulation.38 On the other hand, it has the characteristic of tax sharing between the central and local governments since the revenue does not come from the central government's general revenue but from 100% of Liquor Tax revenue and 14.2% of National Transportation Tax revenue.39 Thus local governments have been viewing the Local Transfer Fund as some type of tax sharing between the central and local governments. There is a historical reason why Local Transfer Fund has these unique characteristics. When it was introduced in 1991, a need arose to increase the local governments' revenue to prepare for the coming years of local autonomy. However, simply transferring more tax bases to local governments was ruled out since it would increase regional revenue disparity. Thus, the combination of tax base sharing and equalizing grants came into being in order to strengthen the local fiscal base and at the same time ensure balanced regional development. Although Local Transfer Fund has had a positive side of expanding local road infrastructures and local
38Local Transfer Fund was originally introduced for local road construction and maintenance. As time passes by, other projects have been added. As of 2004, Among this the share of local road construction and maintenance projects is 43.5%; the share of sewage cleaning projects is 30.5%; the share of regional development projects is 17.2%; the share of rural development projects is 8.1%; and the share of youth-related projects is 0.7%. 39Originally, 50% of the Excess Land Tax, 15% of Liquor Tax, and 100% of Telephone Tax were the sources of Local Transfer Fund. The Excess Land Tax was abolished since then, and the ratio of the Liquor Tax revenue was increased to 60% in 1992, 80% in 1994, and 100% in 1997. In 2001, Telephone Tax was abolished and National Transportation Tax replaced it as a source of Local Transfer Fund.
- 24 -

environmental facilities, it has been also criticized for a rigid management of financial resources. The criticism was recently focused on the system of investing a fixed portion of Liquor Tax, since the link between revenue of Liquor Tax and need for local road infrastructure is not strong. Also, rather artificial division of Local Transfer Fund into many categories by fixed formula has been criticized as an example of rigid management of earmarked revenue. Therefore, starting from 2005, Local Transfer Fund is abolished and the same amount of local revenue is transferred to local governments by an increase of Local Shared Tax. As a result, the share of Local Shared Tax in national tax revenue will arise from 15% to 19.13%.40 Another significant change of intergovernmental grants, effective in 2005, is an introduction of a new type of intergovernmental grants called Balanced Development Special Account (BDSA). National Subsidies were subject to major review in 2003, and the programs supported by the subsidy were categorized into three types: (1) programs that do not need central government’s matching grants; (2) programs that need the matching grants of line ministries; (3) programs that are related to balanced regional development. The responsibilities of the programs that fall into the first category will be transferred to local governments with the equivalent amount of grants being transferred to them via Local Shared Tax. The definition of the third category is somewhat ambiguous and arbitrary, but the programs whose spill-over effects seem to be less than the programs of category two, and more than the programs of category will be managed by BDSA. Although the definition of BDSA is not clear-cut, several interesting features can be found from it. Since BDSA has been derived from National Subsidies, it is managed by Ministry of Budget and Planning (MPB). However, local governments and MOGAHA tend to view it as a replacement of Local Transfer Fund, and the fact that BDSA is managed by Ministry of Budget and Planning is sometimes used as an argument that local public finance is more centralized rather than decentralized. However, this argument lacks substance since both MOGAHA and MPB are ministries of central government. In fact, a fundamental change in the management of intergovernmental grants can be found in the characteristics of BDSA. First, the allocation of BDSA will be largely based upon formula rather than project evaluation. Second, the programs supported by BDSA compete with each other in the sense that local governments can choose their preferred set of programs given the menu of programs supported by BDSA. Therefore, if a line ministry wants to keep a subsidy program, it has now an incentive to make the program attractive to local governments, rather than control them, as it did with National Subsidies. At the same time, local governments also have an incentive to develop their planning skill since
40 The effect of Local Transfer Fund on the increase in Local Shared Tax is actually 2.8%. Additional 1.33% is due to other considerations such as transfer of expenditure responsibilities to local governments.
- 25 -
they do not have unconditional rights to spend the amount of BDSA allocated to them. If they do not provide reasonable plans to expend the allocated amount of BDSA, a part of the BDSA grants can be carried over to the next year, and, after several years, it can be ultimately reclaimed by central government. Since BDSA has not started yet, whether it will become a successful block grants remains to be seen. So far, few local governments regard BDSA something different from the existing types of intergovernmental grants. Also, it is not easy to choose a menu of programs from which it is desirable to let local governments freely choose, since spill-over effect of each program is not the same. Another issue is whether BDSA grants should be allocated to upper-level local governments, or lower-level local governments. As for 2005, BDSA grants are allocated to upper-level local governments. But many lower-level local governments have expressed their discontent with being controlled by upper-level local governments. Therefore, the need for designing allocation formula to be applied directly to lower-level local governments is also being debated. Given these many uncertainties surrounding BDSA grants, it is premature to have any optimistic evaluation of the new system. But, as far as the behaviors of line ministries are concerned, there is a sign that they are competing with each other for BDSA grants, and becoming more cooperative to local governments rather than controlling. So the remaining issue is whether local governments can develop planning skills and find best value for BDSA grants as well as other types of grants
V. Main Issues of Fiscal Decentralization Evaluation of the effects of fiscal decentralization in Korea is a controversial subject. First of all, local public finance system has not changed much even though the system of local autonomy was introduced in 1995. In addition, political and administrative decentralization are not favorably regard by many since there have been noticeable increases in corruption charges against elected officials of local governments. The number of corruption charges on local public officials in the first term of local autonomy was 23, and it increased to 49 in the second term. Also, the participant rate in the local election steadily declined from 68.4% in 1995, to 52.7% in 1998, and to 48.8% in 2002. Despite such disappointing performance of local autonomy so far, it seems that the overall evaluation of decentralization is still positive. This is because many people feel positive effects of local autonomy after long period of centralized regime. More fundamentally, the benefit of politically decentralized decision-making process may not be easily felt, but its contribution on the welfare of citizens will be great in the long run. The psychologically positive effect of
- 26 -

decentralization on the minds of citizens is also very important. As a matter of fact, when there are discussions on moving toward more centralized political system, motivated by the poor record of decentralization, few people support such idea. Therefore, despite many disappointing performances of local autonomy, the remedies should be found not in the centralization context but in the context of better system of decentralization. In order to have better political and fiscal accountability of local governments, two major issues need to be tackled, although neither of which is likely to be resolved within short period of time. The first issue that needs to be resolved is blurred nature of expenditure responsibilities between levels of governments. The wide-range of responsibilities of local governments declared in the Local Autonomy Act clearly seems to emphasize the role of local governments in providing public services. However, despite these provisions, the basic nature of public service delivery in Korea is still centralized. Among many reasons behind this, unclear assignment of expenditure responsibilities between levels of governments lies at the root of the problems.41 When there is no clear distinction between local public goods and national public goods, local governments do not have an incentive to raise revenue from local taxes for any types of public goods since they may be ultimately funded by the central government. Thus blurred division of expenditure responsibilities is an important reason why no local tax rates have been changed since the initiation of the local autonomy in 1995. The second problem that causes weak fiscal accountability of local governments in Korea is the mismatch between tax assignment and expenditure assignment. As was discussed in section IV, there is great inter-regional disparity between Seoul metropolitan region and other regions in Korea. There can be many reasons behind agglomeration of economic activities around capital cities, and many cases of big agglomeration are found around the world. However, what is distinctive in Korea is the mismatch between levels of per capita tax revenue and per capita expenditure of local governments, especially in Seoul metropolitan region. Specifically, the level of per capita tax in Seoul metropolitan region is relatively higher than that in other regions, and the level of per capita expenditure in Seoul metropolitan region is relatively lower than that in other regions. This implies that, if net fiscal benefit from local public sector is determined by per capita levels of public expenditure and tax revenue, it is hard to explain why people are willing to migrate into Seoul metropolitan region. We can of course hypothesize that people migrate into Seoul metropolitan region, despite low level of net fiscal benefits, because they can earn higher real wages in the region. This is not true, however, since housing costs in Seoul metropolitan region is three or four times that in other regions. Therefore, the only reason
41Similar views are expressed in Ahmad et al. (1995) and Shiavo-Campo and Sundaram (2000) about the decentralization process in China.
- 27 -

people are willing to migrate into Seoul metropolitan region should be that the correlation among net fiscal benefit, per capita tax revenue, and per capita public expenditure in the region is not strong. There are two possible reasons for this. First, if there is tax exporting, per capita tax burden is less than per capita tax revenue. Second, if there is little congestion effect in the consumption of public goods, it is total, not per capita, amount of public expenditure that determines the size of public expenditure benefit. As was discussed in section IV, the structures of tax assignment and expenditure assignment in Korea are such that both of these factors are likely to play a role in creating a large amount of net fiscal benefits in the metropolitan region. When a local government takes advantage of tax exporting, and provides public goods with little congestion effect, it is hard to expect fiscal accountability from it. This is because, in an extreme case, residents can get enough public goods with little amount of local tax burden. In such a case, the population size of the local government will grow until high housing costs bring down real wages in the jurisdiction low enough to deter further immigration. It seems that such a scenario can be applied to the current situation of Seoul metropolitan region. The population of Seoul was peaked around 1990, as was seen in Figure 6, and the growth rate of the population of Seoul metropolitan region seems to be slowing down, although exactly when the population size of the region will actually go down is hard to predict yet. In sum, the lack of fiscal accountability is closely related to the seemingly unrelated issue of regional disparity in Korea. Therefore, rather than dealing with the two important issues from separate perspectives, we need to focus on redesign of tax assignment and expenditure assignment, in the direction of linking fiscal capacities and expenditure responsibilities as close as possible. Such a measure will not only improve the fiscal accountability of local governments, but also stop local public sector from causing inefficient migration between regions.
- 28 -

References
Ades, A., and E. Glaeser, 1995, “Trade and circuses: explaining urban giants”, Quarterly Journal of Economics 109, 195-228.
Ahmad, E., Qiang, G., and V. Tanzi, 1995, Reforming China’s Finances. Washington, DC:
IMF. Alesina, A., and E. Spolaore, 1997, “On the number and size of nations”, Quarterly Journal of
Economics 112, 1027-56. Bahl, R., 1999, “Implementation rules for fiscal decentralization”, World Bank. Bergstrom, T. and Goodman, R., 1973, “Private Demands for Public Goods”, American
Economic Review 63, 280-296. Bird, R., and Tarasov, A., 2004, “Closing the gap: fiscal imbalances and intergovernmental
transfers in developed federations”, Environment and Planning C: Government and Policy 22, 77-102.
Boadway, R. and Flatters, F., 1982, “Efficiency and Equalization Payments in a Federal System of Government: A Synthesis and Extention of Recent Results”, Journal of Canadian Economics 15, 613-33.
Boadway, R. and Hobson, P., 1993, Intergovernmental Fiscal Relations in Canada, Toronto: Canadian Tax Foundation.
Boadway, R., 2001, “Inter-governmental fiscal relations: the facilitator of fiscal decentralization”, Constitutional Political Economy 12, 93-121.
Borcherding, T. and Deacon, R., 1972, “The Demand for the Services of Non-federal Government”, American Economic Review 62, 891-901.
Castells, A., 2001, “The Role of Intergovernmental Finance in Achieving Diversity and Cohesion: the Case of Spain”, Environment and Planning C: Government and Policy 19, 189-206.
Flatters, F., J. Henderson, and Mieszkowski, P., 1974, “Public Goods, Efficiency, and Regional Fiscal Equalization” Journal of Public Economics, 3, 99-112.
Hayashi, M., 2002, “Returns to scale, congestion and the minimal efficient scales of the local public services in Japan”, Financial Review 61 (In Japanese).
Joumard, I. and Kongsrud, M., 2003, “Fiscal Relations Across Government Levels” Working Paper No. 375, OECD.
Kim, J., 2003, “Local Government Finance and Bond Market Financing in Korea”, in Y. H. Kim (ed.), Study on Local Government and Bond Market Financing, Asian Development Bank.
Krugman, P., and Obstfeld, M., 1994, International Economics: Harper & Collins. Krugman, P., 1991, “Increasing Returns and Economic Geography” Journal of Political
- 29 -

- 30 -
Economy 99, 483-499. Krugman, P., 1996, The Self-Organizing Economy, Blackwell: Cambridge. Litvack, J., Ahmad, J, and R. Bird, 1998, “Rethinking Decentralization in Developing
Countries”, Sector Studies Series, World Bank. McLure, C., 2001, “The Tax assignment problem: ruminations on how theory and practice
depend on history”, National Tax Journal 52, 339-364. OECD, “The Tax System in Korea : More Fairness and Less Complexity Required”, Economics
Department Working Papers No. 271, 2000. Reiter, M. and Weichenrieder, A., 1997, “Are Public Goods Public? A Critical Survey of the
Demand Estimates for Local Public Services”, FinanzArchiv 54, 374-408. Schiavo-Campo, S., and P. Sundaram, 2000, Serve and To Preserve: Improving Public
Administration In A Competitive World. Manila: ADB. Sole-Olle, A and Bosch, N., 2003, “On the Relationship Between Local Authority Size and
Expenditure: Lessons for the Design of Intergovernmental Transfers in Spain”, Working Paper, University of Barcelona.
Treisman, D., 2002, “Defining and Measuring Decentralization: A Global Perspective”, Working Paper, UCLA.