five -year budget projections: fiscal … congress/five...five -year budget projections: fiscal...
TRANSCRIPT
FIVE -YEAR BUDGET PROJECTIONS:FISCAL YEARS 1979-83
HEARINGBEFORE THE
JOINT ECONOMIC COMMITTEECONGRESS OFY THE UNITED STATES
NINETY-FIFTH CONGRESS .
FIRST SESSION
DECEMBER 5, 1977
Printed for the use of the Joint Economic Committee
U.S. GOVERNMENT PRINTING OFFICE
WASHINGTON: 197820-816 0
For sale by the Superintendent of Documents. U.S. Government Printing OfficeWashington. D.C. 20402

JOINT ECONOMIC COMMITTEE
(Created pursuant to see. 5(a) of Public Law 304, 79th Cong.)
RICHARD BOLLING, Missouri, ChairmanHUBERT H. HUMPHREY, Minnesota, Vice Cairman
HOUSE OF REPRESENTATIVES SENATE
HENRY S. REUSS, Wisconsin JOHN SPARKMAN, AlabamaWILLIAM S. MOORHEAD, Pennsylvania WILLIAM PROXMIRE, Wisconsin
LEE H. HAMILTON, Indiana ABRAHAM RIBICOFF, ConnecticutGILLIS W. LONG, Louisiana LLOYD BENTSEN, TexasOTIS O. PIKE, New York EDWARD M. KENNEDY, MassachusettsCLARENCE J. BROWN, Ohio JACOB K. JAVITS, New YorkGARRY BROWN, Michigan WILLIAM V. ROTH. Ja., DelawareMARGARET M. HECKLER, Massachusetts JAMES A. McCLURE, IdahoJOHN H. ROUSSELOT, California ORRIN G. HATCH, Utah
JoHN R. STARK, Rrecut' DiredorLouis C. KRAUTHOVY II, Aeiutant Diredcor
RICHABD F. KAUFMAN, General Countd
EcoNomIS
G. THOMAS CATOR ROBERT D. HAMBIN Pmuf McMARTrN
WuLLAM A. Cox KENT H. HUGHES DEBORAH NORELU MATZ
THOMAS F. DEENBURO L. DOuGLAS LEE GEORGE R. TYLER
MINORITY
CHARLzS H. BRADFORD STEPHEN J. ENTIN GEORGO D. KRUMB1RAA
M. CATHERINE MILLER MARK R. POTICINSEI
(II)
Jr.
" � � � ft�%. ��'
CONTENT S
WITNESS AND STATEMENT
MONDAY, DECEMBER 5, 1977
Proxmire, Hon. William, member of the Joint Economic Committee: PageOpening statement _ ---- 1
Rivlin Hon. Alice M., Director, Congressional Budget Office, accompaniedby dames L. Blum, Assistant Director for Budget Analysis; and JamesCapra, Chief, Projections Unit - - 2
SUBMISSIONS FOR THE RECORD.
MONDAY, DECEMBER 5, 1977
Rivlin, Hon. Alice M., et al.:Report by the Congressional Budget Office entitled "Five-Year Budget
Projections: Fiscal Years 1979-1983," dated December 1977 3Response to Senator Proxmire's request to supply long-term assumed
interest rates -73Response to Senator Proxmire's request to provide estimates of a
current policy full employment budget - 76Response to Senator Proxmire's request to supply the assumed growth
of the civilian labor force - 77Response to Senator Proxmire's query regarding revenues as a percent
of GNP, assuming required stimulus comes from tax cuts -78
(M)

FIVE-YEAR BUDGET PROJECTIONS: FISCAL YEARS197943
MONDAY, DECEMBER 5, 1977
CONGRESS OF THE UNITED STATES,JOINT ECONOMIC COMMITTEE,
Washington, D: C.The committee met, pursuant to notice, at 10:03 a.m., in room 5302,
Dirksen Senate Office Building, Hon. William Proxmire (member ofthe committee) presiding.
Present: Senator Proxmire.Also present: G. Thomas Cator, William A. Cox, and L. Douglas
Lee, professional staff members; Mark Borchelt, administrativeassistant; and Charles H. Bradford, minority professional staffmember.
OPENING STATEMENT OF SENATOR PROXMIRE
Senator PROXMIRE. The committee will come to order.We are honored and pleased to have Mrs. Alice Rivlin, Director of
the Congressional Budget Office, to discuss with us the 5-year budgetprojections prepared by her Office.
In my judgment, these long-term budget projections are, one of themost important features of the Budget Control Act of 1974. Theyprovide Congress with the basic information needed to begin earlyconsideration of budget matters and they show- clearly the commit-ments we have made for budget resources in future years.
The CBO's report this year is particularly important. Normally onNovember 10, the President submits estimates of the current servicesbudget for the coming year; the Joint Economic Committee reviewsthese estimates and reports to Congress.
This year, the chairman of the Joint Economic Committee, thechairman of the Budget Committee, and the chairman of the Appro-priations Committee agreed to a request from OMB for a 1-yearexperiment.
This year, the President's current services estimates will be pre-sented in January with his budget proposal and, therefore, wil bebased on the same set of economic assumptions.
We hope that this change will increase the usefulness of the docu-ment. The JEC will report on the current services estimates in Marchwhen we submit our annual report.
The Congressional Budget Office has been helpful to us in the pastand I trust we can call upon you again if this is necessary.
The Congressional Budget Office projections have been more helpfulthan OMB's because they cover a longer time horizon. Since there willbe no OMB report until late January, your report assumes addedsignificance.
(1)

2
As you know, I have long supported the notion that the only wayto effectively organize and gain effective control over budget expendi-tures is to plan several years in advance. I am very pleased to see thatyour report demonstrates how much we can increase budget controlby increasing planning horizons.
I am also pleased to see you have improved your projection meth-odology so you now take into consideration the impact of the budgeton the economy as well as the impact of the economy on the budget.
As I read this report, it is in part pessimistic and part rather opti-mistic. You project an unemployment rate of 4.5 percent in 1983,which I think most people regard as optimistic.
But, then, you project an inflation rate of 6 percent, which I regardas very unfortunate if realistic.
The growth path necessary is optimistic in that it assumes strongerthan average growth in non-Federal demand coupled with substantialamounts of economic stimulus.
Your report seems to confirm the conclusions of the Joint EconomicCommittee staff study released earlier this year which said it would be
c virtually impossible to achieve all the economic goals President Carterset forth for 1980.
Mrs. Rivlin, please proceed with your statement. I look forward todiscussing these and other issues with you.
STATEMENT OF HON. ALICE M. RIVLIN, DIRECTOR, CONGRES-SIONAL BUDGET OFFICE, ACCOMPANIED BY JAMES L. BLUM,ASSISTANT DIRECTOR FOR BUDGET ANALYSIS; AND JAMESCAPRA, CHIEF, PROJECTIONS UNIT
Mrs. RIVLIN. Thank you very much, Senator Proxmire.Before I proceed, let me introduce the two gentlemen with me,
James Blum, on my left, who is the Assistant Director for BudgetAnalysis at the Congressional Budget Office, and James Capra, onmy right, who is the Chief of our Projections Unit responsible forpreparing this report.
This morning we are releasing our report, "Five-Year Budget Projec-tions: Fiscal Years 1979-1983." I ask permission that the report beentered in the record.
[The report referred to follows:]

3
FIVE-YEARBUDGETPROJECTIONS:FISCALYEARS1979-1983As . b/ Pkkt 9.344
CONGRES OF THE UNWM SMATE OCONGRESSONAL KCCff Cffla

4
FIVE-YEAR BUDGET PROJECTIONS:
FISCAL YEARS 1979-1983
The Congress of the United StatesCongressional Budget Office
5
NOTES
Unless otherwise-indicated, all years referred to arefiscal years. For 1976 and before, fiscal years ran from July Ithrough June 30 and were referred to by the years in whichthey ended. The Congressional Budget Act of 1974 changedthe fiscal year to begin on October I and end on September 30.The interim between the old and new fiscal years, July Ithrough September 30, 1976, is called the transition quarter;fiscal year 1977 began on October 1, 1976.
Details in the text, tables, and figures of this reportmay not add to totals because. of rounding.
20-816 0 - 78 - 2

6
PREFACE
As required by section 308(c) of the Congressional Budget Act of 1974(Public Law 93-344), this report by the Congressional Budget Office projectstotal new budget authority, outlays, and receipts for each fiscal yearbetween 1979 and 1983. The act requires the report on federal budgetprojections to be issued as soon as practicable after the beginning of eachfiscal year.
The primary purpose of these projections is to provide a neutralbaseline against which the Congress can consider potential changes duringits deliberations about the next annual budget. A longer-term framework ishelpful in making annual budget choices because these decisions frequentlyhave little impact on the budget in the short run but can significantlyinfluence relative budget priorities over a period of several years.
The projections presented in this report are based on the estimatedbudget revenues and outlays specified in the Second Concurrent Resolutionon the Budget for Fiscal Year 1978 (H. Con. Res. 341). This report containsestimates of expenditures and revenues under a current policy, or "no newpolicy change" concept for 1979-1983. In addition, the report includesestimates of the fiscal stimulus that would be required if the economy is togrow at an annual rate of 4.8 percent until the unemployment rate reaches4.5 percent in 1983.
The Congressional Budget Act also requires the Congressional BudgetOffice to project tax expenditures for each of the next five fiscal years. Aseparate report on tax expenditure projections will be issued at a later date.
Alice M. RivlinDirector
December 5, 1977
iii

7
CONTENTS
Page
PREFACE
SUMMARY
CHAPTER L.
CHAPTER II.
CHAPTER IIl.
APPENDIX A.
INTRODUCTION AND OVERVIEW ........
Economic Assumptions .............Budget Implications of the
Economic Assumptions ............The Projected Deficit .............Multiyear Targets ...............
PROJECTIONS OF CURRENT POLICYSPENDING . . . . . .. . . . . . ... . . . . .Spending Projection Assumptions;. .......Projected Increases in Federal Spending'.....Multiyear Budgeting and Projections of
Federal Spending. .............The Composition-of Federal Spending .......
PROJECTIONS OF CURRENT POLICY -REVENUES .
Revenue Projection Assumptions ..Revenue Projections ..........Federal Revenues: A Historical Perspective. .'
THE EFFECTS OF LESS VIGOROUSECONOMIC GROWTH .............
Budget Implications of Less VigorousEconomic Growth ..............
The Projected Deficit Under Less VigorousEconomic Growth ..............
v
iii
xi
257
10
1018
2123
28
2830~30
35
37
39

8
Page
APPENDIX B.
APPENDIX C.
ALTERNATIVE SCENARIOS FORNONFEDERAL DEMAND ............
Nonfederal Demand: A More OptimisticScenario.
Nonfederal Demand: A More PessimisticScenario.
FEDERAL EXPENDITURES ON A NATIONALINCOME ACCOUNTS BASIS. ........
Differences Between the Unified Budget andFederal Expenditures on a National IncomeAccounts Basis ...............
The CBO NIA Model .. ...........Federal Expenditures, National Income Accounts,
Fiscal Years 1978 to 1983 ...........The Shortfall in the National Income Accounts.
vi
40
40
40
43
4345
4647

9
TABLES
Page
1. AGGREGATE ECONOMIC ASSUMPTIONS ... . . . ... 2
2. FIVE-YEAR BUDGET PROJECTIONS ... . . . . . ... 4
3. CHANGE IN FISCAL YEAR 1977 OUTLAYS FROMTHIRD CONCURRENT RESOLUTION THROUGHACTUAL SPENDING . . . . . . . . . . . . . . . . . . 15
4. PROJECTED INCREASES IN FEDERAL OUTLAYS .19
S. CURRENT POLICY PROJECTIONS BY YEAR OFCOMMITMENT .22
6. PERCENT OF OUTLAYS CONTROLLABLE THROUGH THEBUDGET PROCESS, UNDER ALTERNATIVE ASSUMPTIONSABOUT MULTIYEAR TARGETING .22
7. MAJOR COMPONENTS OF BUDGET OUTLAYPROJECTIONS . . ....... . 25
8. BUDGET AUTHORITY PROJECTIONS BY FUNCTION . ... 26
9. OUTLAY PROJECTIONS BY FUNCTION . . .... . 27
10. EFFECTS OF HOUSE-PASSED AND SENATE-PASSEDENERGY BILLS ON FIVE-YEAR PROJECTIONS .29
11. EFFECTS OF SOCIAL SECURITY LEGISLATIONON TOTAL REVENUES .30
12. PROJECTIONS OF CURRENT POLICY RECEIPTSBY SOURCE .31
13. COMPOSITION OF FEDERAL RECEIPTS ......... . 32
vii
10
APPENDIX TABLES
Page
A-1. AGGREGATE ECONOMIC ASSUMPTIONS UNDER LESSVIGOROUS ECONOMIC GROWTH ............ . 37
A-2. FIVE-YEAR BUDGET PROJECTIONS, UNDER LESSVIGOROUS ECONOMIC GROWTH ............ . 38
B-i. FIVE-YEAR BUDGET PROJECTIONS, ASSUMING STRONGNONFEDERAL DEMAND ............ ... . 41
B-2. FIVE-YEAR BUDGET PROJECTIONS, UNDER LESSVIGOROUS ECONOMIC GROWTH ............ . 42
C-i. ADJUSTMENTS BETWEEN THE UNIFIED BUDGETAND FEDERAL EXPENDITURES IN NATIONALINCOME ACCOUNTS .... . . .... .......... 45
C-2. ESTIMATES OF FEDERAL EXPENDITURES IN NATIONALINCOME ACCOUNTS .... . . . . . . . . . . . . . . 47
C-3. FISCAL YEAR 1977 SHORTFALL ON A NATIONAL INCOMEACCOUNTS BASIS .... . . . . . . . . . . . . . . . 48
FIGURES
Page
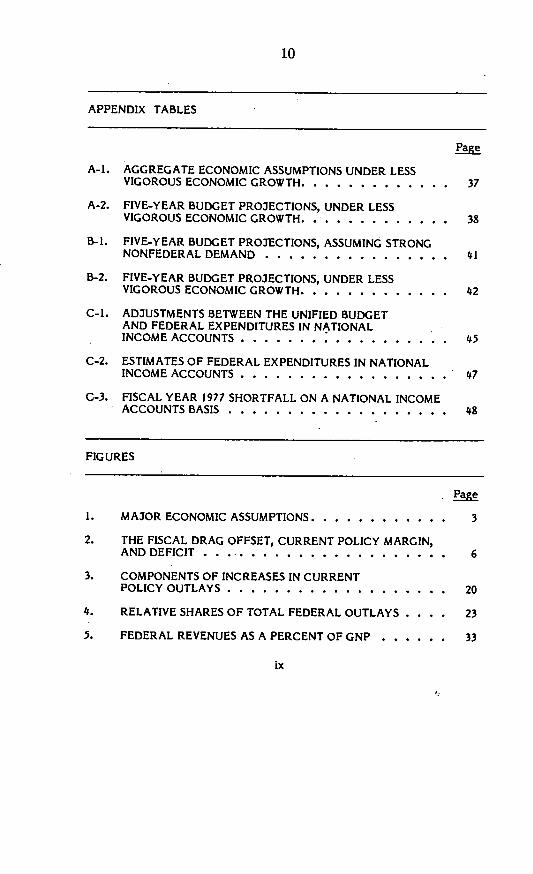
1. MAJOR ECONOMIC ASSUMPTIONS. 3
2. THE FISCAL DRAG OFFSET, CURRENT POLICY MARGIN,AND DEFICIT ...... . . . . . . . . . . . . .. 6
3. COMPONENTS OF INCREASES IN CURRENTPOLICY OUTLAYS ..... . . ...... . . . . . . 20
4. RELATIVE SHARES OF TOTAL FEDERAL OUTLAYS . . . . 23
5. FEDERAL REVENUES AS A PERCENT OF GNP . .. . . . 33
ix

11
SUMMARY
This report presents projections of federal spending and revenues overfiscal years 1979-1983. Federal spending and revenues are projected underthe assumption of the continuation of current policies. In addition,estimates are made of the tax cuts or spending increases that would beneeded in order to sustain the economic growth objective contained in theSecond Concurrent Resolution on the Budget for Fiscal Year 1978.
Under current tax laws, projected receipts rise by 13.2 percent peryear, from $457 billion in fiscal year 1979 to $751 billion in fiscal year 1983.As a percent of the gross national product (GNP), receipts rise from 20 to 22percent. This increase is dominated by individual income tax receipts.Current policy outlays rise more slowly, from $495 billion in fiscal year 1979to $655 billion in fiscal year 1983. Social security, medicare, and medicaidare responsible for almost half the increase in outlays. As a percent ofGNP, outlays decline from 22 to 19 percent. This disproportionate rise inreceipts as compared to outlays occurs because of the progressive nature ofindividual income taxes.
The projections of current policy receipts and outlays were estimatedassuming real GNP growth of about 4.8 percent per year until theunemployment rate reaches 4.5 percent. If current policies are followedunchanged during the next five years, however, the federal budget will exerta restrictive influence on the economy because the receipts the governmentis taking out of the economy will rise much faster than the outlays it isputting back into the economy in the form of wages, purchases, andpayments to individuals. For the economic assumptions to be realized,therefore, fiscal and monetary policy would in all likelihood have to be usedto offset the fiscal drag exerted by the projected current policy budgets.
The magnitude of tax cuts or spending increases needed to offset thefiscal drag would depend on the strength of demand in the nonfederal sectorsof the. economy. Stronger nonfederal demand would mean that smaller taxcuts and spending increases would be needed to achieve the assumed growthrates. Under the assumption that nonfederal demand is slightly strongerthan the average since World War II, roughly $120 billion annually inadditional budget stimulus -- tax cuts or spending increases - would beneeded by fiscal year 1983.
The projected budget deficit is estimated by comparing the additionalbudget stimulus needed to offset fiscal drag to the current policy margin
xi

12
generated by the excess of current policy receipts over outlays. As long asthe fiscal drag offset is greater than the current policy margin, the budget isprojected to remain in deficit. As shown in the table, the fiscal drag offsetwould be greater than the current policy margin throughout the five-yearperiod. By fiscal year 1983, the projected deficit would be $19 billion.
(By fiscal years, in billions of dollars)
1978Second Projections
Concurrent 1979 1980 1981 1982 1983Resolution
Current Policy Receipts 397.0 457 519 590 668 751
Current Policy Outlays 458.25 495 529 565 606 655
Current Policy Margin -61.25 -38 -10 25 62 96
Fiscal Drag Offset -- 29 51 74 101 115
Deficit- (-) or Surplus -61.25 -67 -61 -49 -39 -19
The projection of the deficit described above assumes nonfederaldemand that is slightly stronger than the average over the past thirty years.This is not the only possible outcome. For example, if a business investmentboom developed, either spontaneously or in response to expansionarymonetary policy, or if growth in economic activity in the rest of the worldstimulated United States exports, the need to offset the fiscal drag would besmaller and the size of the deficit would decline more rapidly, perhaps to apoint of budget balance. On the other hand, if nonfederal demand grew veryslowly, more expansionary policies and an increasing budget deficit might beneeded to reach the assumed output and unemployment goals.
xii
13
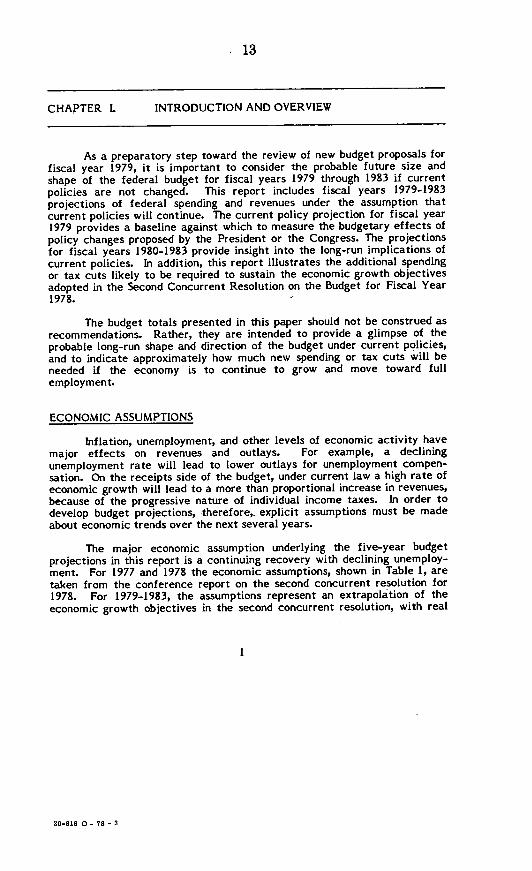
CHAPTER L INTRODUCTION AND OVERVIEW
As a preparatory step toward the review of new budget proposals forfiscal year 1979, it is important to consider the probable future size andshape of the federal budget for fiscal years 1979 through 1983 if currentpolicies are not changed. This report includes fiscal years 1979-1983projections of federal spending and revenues under the assumption thatcurrent policies will continue. The current policy projection for fiscal year1979 provides a baseline against which to measure the budgetary effects ofpolicy changes proposed by the President or the Congress. The projectionsfor fiscal years 1980-1983 provide insight into the long-run implications ofcurrent policies. In addition, this report illustrates the additional spendingor tax cuts likely to be required to sustain the economic growth objectivesadopted in the Second Concurrent Resolution on the Budget for Fiscal Year1978.
The budget totals presented in this paper should not be construed asrecommendations. Rather, they are intended to provide a glimpse of theprobable long-run shape and direction of the budget under current policies,and to indicate approximately how much new spending or tax cuts will beneeded if the economy is to continue to grow and move toward fullemployment.
ECONOMIC ASSUMPTIONS
Inflation, unemployment, and other levels of economic activity havemajor effects on revenues and outlays. For example, a decliningunemployment rate will lead to lower outlays for unemployment compen-sation. On the receipts side of the budget, under current law a high rate ofeconomic growth will lead to a more than proportional increase in revenues,because of the progressive nature of individual income taxes. In order todevelop budget projections, therefore,. explicit assumptions must be madeabout economic trends over the next several years.
The major economic assumption underlying the five-year budgetprojections in this report is a continuing recovery with declining unemploy-ment. For 1977 and 1978 the economic assumptions, shown in Table 1, aretaken from the conference report on the second concurrent resolution for1978. For 1979-1983, the assumptions represent an extrapolation of theeconomic growth objectives in the second concurrent resolution, with real
I
20-816 0 - 78 - 3

14
economic growth - as measured by the rate of growth in the gross nationalproduct (GNP) in constant dollars -- holding at approximately 4.8 percentthrough 1982 and dropping to 3.7 percent in 1983 as the unemployment ratereaches 4.5 percent (see Figure 1).
TABLE 1. AGGREGATE ECONOMIC ASSUMPTIONS: BY CALENDAR YEARS
Selected Economic Variables 1977 1978 1979 1980 1981 1982 1983
Gross National Product (GNP)Current dollar GNP
(in billions of dollars) 1,898.0 2,107.0 2,333.8 2,582.2 2,853.9 3,156.4 3,465.2Real GNP (in billions of 1,338.0 1,402.7 1,467.9 1,533.4 1,612.2 1,688.3 1,751.4
Growth rate of real GNP 5.0 4.8 4.7 4.8 4.8 4.7 3.7Unemployment Rate (percent) 7.0 6.5 6.2 5.7 5.2 4.7 4.5
Consumer Price Index 6.5 3.6 6.0 5.7 5.5 5.7 5.9(percent change)
This growth path is consistent with the economic assumptions usedfor the previous budget projections of the Congressional BudgetOffice (CBO). With respect to inflation, the consumer price index (CPT isassumed to rise at an annual rate of 5.5 to 6.0 percent between 1977 and1983. The assumed inflation rates do not include the possible effects ofpending energy or social security legislation.
The economic assumptions for 1979 through 1983 should not beconstrued as an economic forecast in the sense of being the best estimate ofhow the economy is likely to behave. Rather, they should be viewed as oneof many possible long-run targets for the economy. The assumed growthpath could be described as optimistic, but not unrealistic. The average rateof growth sustained since World War n has been 3.3 percent. During 1961 to1966, the economy grew at an average annual rate of 5.4 percent. Theassumed inflation rates might also be described as moderately optimistic.They are considerably above long-run historical experience but lower thanthe average inflation of the last several years.
BUDGET IMPLICATIONS OF THE ECONOMIC ASSUMPTIONS
Under current spending and tax policies, the budget implications ofthe economic assumptions are shown in Table 2. Receipts increase by about13.2 percent per year under current law from $457 billion in fiscal year 1979
2

15
Figure 1.
MAJOR ECONOMIC ASSUMPTIONSREAL ECONOMIC GROWTH
8 _Acw Projected
24-- - - - -- -
2 -~~~~~~~~~~~~~~~
4
-2
1973 1975 1977 1979 1981 1983
UNEMPLOYMENT RATEPERCENT
Actual Proecsod-
8 Aczl
6 -- _ _
4 _
2-
1973 1 75 1977 1979 1981 1983
INCREASE IN CONSUMER PRICESPERCENT
10 _ -~~
8 _ ____ _
4__
2
1973 1975 1977 1979CALENDAR YEARS
1981
3

16
to $751 billion in fiscal year 1983. Current policy outlays rise at about halfthat rate, approximately 7.3 percent per year, from $495 billion in fiscalyear 1979 to $655 billion in fiscal year 1983. As a percent of GNP, currentpolicy receipts increase from 20 to 22 percent, while outlays decline from 22to 19 percent. The dramatic rise in receipts as compared to outlays occursbecause of the progressive nature of individual income taxes.
TABLE 2. FIVE-YEAR BUDGET PROJECTIONS a: BY FISCAL YEARS,IN BILLIONS OF DOLLARS
Second ProjectionsConcurrent 1979 1980 1981 1982 1983Resolution
Current Policy Receipts 397.0 457 519 590 668 751
Current Policy Outlays 458.25 495 529 565 606 655
Current Policy Margin -61.25 -38 -10 25 62 96
Fiscal Drag Offset -- b/ 29 51 74 101 115
Deficit (-) or Surplus -61.25 -67 -61 -49 -39 -19
a/ For definitions of current policy margin, fiscal drag offset, and deficit,see page 5 of this report.
b/ It is assumed that the spending ceiling and revenue floor in the secondconcurrent resolution are consistent with the fiscal stimulus needed forthe economy to grow at the rate of 4.8 percent in fiscal year 1978. Ifmore or less fiscal stimulus is required, corresponding adjustmentswould have to be made in the estimates of the fiscal drag offset forfiscal years 1979-1983.
Under current policy assumptions, the receipts that the federalgovernment would take out of the economy would be rising much faster thanthe outlays it would be putting back into the economy in the form of wages,purchases, and payments to individuals. Hence, the federal budget would beexerting a fiscal drag on the economy, making it unlikely, if not impossible,to achieve the growth assumptions shown in Table 1. For the target growth

17
assumptions to be realized, therefore, fiscal and monetary policies would, inall likelihood, have to be used to offset this natural tendency of projectedcurrent policy budgets to move in a restrictive direction.
If tax cuts or spending increases were used to offset the fiscal drag,their necessary magnitude would depend on the strength of the nonfederalsectors of the economy -- namely, the four major components of nonfederaldemand: consumption, investment, state and local government purchases,and net exports. Stronger nonfederal demand would mean that smaller taxcuts or spending increases would be required to achieve the assumedeconomic growth rates. Conversely, weaker nonfederal demand wouldrequire larger tax cuts or spending increases to achieve the growth rates.To illustrate the requirement for additional spending or tax cuts, this reportchooses one possible scenario for the growth in nonfederal demand, which isassumed to be moderate by historical standards -- stronger than the averageof the post-World War II years, but somewhat weaker than the peak period of1961-1966. 1/
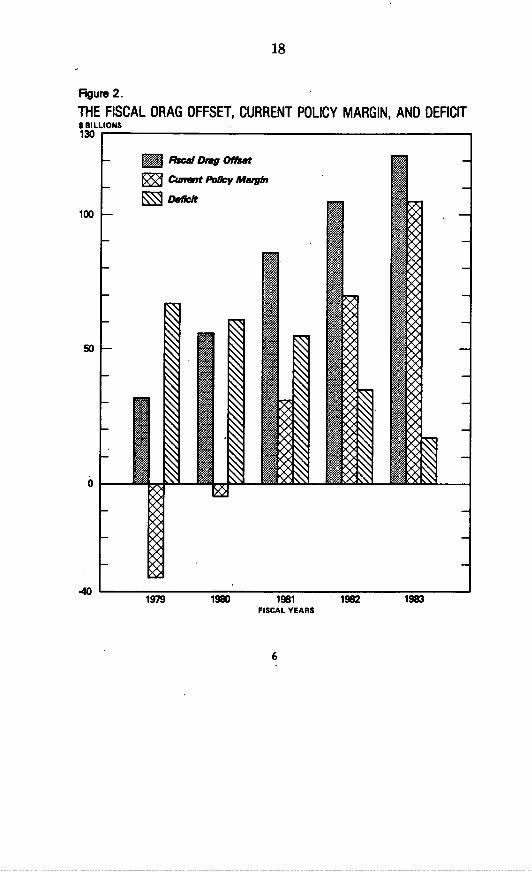
THE PROJECTED DEFICIT
As noted earlier, if the economy were to follow the growth targetassumed in this report, receipts would rise faster than outlays, exerting adrag on the economy that would itself tend to reduce economic growth.Assuming moderate nonfederal demand, approximately how much wouldtaxes have to be cut or expenditures increased to offset the drag and keepthe economy on the target growth path?
Rough answers to this question are shown in Table 2 and in Figure 2.The current policy margin indicates the excess of receipts over outlays thatwould develop if the target growth path were realized. The fiscal dragoffset indicates a rough estimate of the amount by which taxes would haveto be cut or spending increased to keep the economy on the growth path, if
I/ The personal saving rate (a reflection of consumption behavior) isassumed to average 5.9 percent. Real investment is assumed to grow atan average of 7 percent. State and local government purchases in realterms are assumed to grow at an average annual rate of 3 percent. Netexports are assumed on average to be nearly balanced over the five-year period. (See Closing the Fiscal Policy Loop. CBO TechnicalAnalysis Paper, December 1977, for a detailed discussion of these majorcomponents of nonfederal demand.) Monetary policy is assumed to besufficiently accommodative so as not to preclude the attainment of thenonfederal demand scenario.
5
18
A'gure 2.
THE FISCAL DRAG OFFSET, CURRENT POLICY MARGIN, AND DEFICIT
1981FISCAL YEARS
6

19
the nonfederal demand were "moderate" as defined earlier. As long as thecurrent policy margin is less than the fiscal drag offset, the budget wouldremain in deficit. For example, in fiscal year 1981 the current policy,margin would be $25 billion, the required fiscal drag offset would be $74billion, and the projected deficit would be $49 billion. In fact, the currentpolicy margin would be less than the required offset throughout theprojection period. Consequently, under the economic assumptions specifiedearlier, the budget is projected to be still in deficit by fiscal year 1983.
The scenario just decribed is a plausible set of-projections of thedeficit over the next five years; it is by no means the only possible outcome.If monetary policy became more expansionary, if a business investmentboom developed spontaneously, or if growth in economic activity in the restof the world stimulated exports from the United States, the need to offsetthe fiscal drag in a current policy budget might be much less than under theabove assumptions. This, in turn, could lead to a more rapid decline in thedeficit than shown here. On the other hand, if the economy were subject toshocks of the kind it experienced in the early 1970s, or if businessinvestment failed to grow sufficiently, more expansionary policies and anincreasing deficit might be needed to reach the output-and unemploymentgoals assumed earlier.
Furthermore, even if the assumptions about nonfederal demandturned out to be correct, the dollar amount of fiscal action required to meetthe output and unemployment goals could vary, depending on which items inthe budget were altered to meet the needs of fiscal policy. Generallyspeaking, purchases of goods and services have more impact per budgetdollar on output and employment than broadly based tax changes or changesin income support programs. Public employment programs tend to havemore impact-on jobs-than other instruments of fiscal policy. Speciallydesigned tax changes, such as the'investment taxvcredit, can have powerfuleffects on output and -jobs a-fter a lag of one'or two years. These and manyother special characteristics of the-budget need to be taken into account indesigning a detailed-fiscal policy strategy. Not surprisingly, consideration ofall the alternative economic assumptions and combinations.of fiscalinstruments leads to a range- of possible budget outcomes- in the next fiveyears. For example, as shown in Appendixc B, if nonfederal demand becamestrong -- comparable to the rapid growth of the early 1960s -- the budgetcould be balanced by fiscal year 1982 and still attain the economic growthassumed above.
MULTIYEAR TARGETS
At present, budget resolutions are adopted by the Congress for oneyear at a time. Since a large part of any given year's budget is determined
7
/

20
by decisions made in. prior years, the Congress is faced each year with abudget largely composed of spending and receipts that have not been subjectto review within an integrated framework. As suggested in a recent CBOreport on advance budgeting, 2/ one way of dealing with this problem Is tohave budget targets set by the Congress in advance. Five-year budgetprojections shed light oi{ how the Congress might proceed with formulatingmultiyear targets. Projections such as those found in this report provide abaseline on which to build plans for future spending and receipts. Inaddition, they provide a rough estimate of how much room is available for-net increases in spending or tax reductions.
Several key questions are involved in the setting of multiyear targets.What are the goals for the economy and for the deficit? How much shouldbe allocated for tax cuts or spending increases? What is the appropriatelevel for federal spending and receipts in relation to the economy?
Many possible goals exist for the economy and the deficit. Theprojections in this report suggest that an unemployment rate of 4.5 percentand a deficit of $19 billion could be achieved by 1983, assuming anaccommodative monetary policy and slightly above average performance bythe nonfederal sectors of the economy. If the Congress were to adopt the4.5 percent unemployment target, but to set a more ambitious goal of abalanced budget by fiscal year 1983, performance by the nonfederal sectorswould have to be stronger than assumed here.
In addition to setting goals for the. economy and the deficit, theCongress might want to set goals for the level of spending or for the level ofreceipts in relation to the economy. For example, the Congress might set asa goal a level of federal spending as a percent of GNP. At present, spendingis 21.2 percent of potential GNP (defined as the value of GNP if theeconomy were at a 4.5 percent unemployment rate). Current policyprojections of outlays in this report show the federal goverment's share ofpotential GNP falling to 18.8 percent by fiscal year 1983. If the Congresswere to set as a goal the maintenance of the current federal share ofpotential GNP, a sizable part of the fiscal drag offset alluded to earlierwould be used for spending increases. As an alternative to maintaining thecurrent federal share of potential GNP, the federal income tax system mightbe indexed, so that effective rates would not rise because of inflation. Thiswould cut taxes below current policy from year to year, since theprogressive income tax system implicit in current policy has a more thanproportional response to inflation. As a result, indexing would commit a
2/ Advance Budgeting: A Report to the Congress, CBO Report,February 1977.
8
21
portion of the fiscal drag offset for these automatic tax cuts. Theremainder would be available either for further tax cuts or for spendingincreases.
An important element in decisions about multiyear targets is program
needs and costs. These range from welfare reform to national health
insurance to the integration of corporate and individual income taxes. The
needs and costs for new programs will be discussed in the context of
multiyear budget targets in the forthcoming CBO annual report, BudgetOptions for Fiscal Year 1979.
9
20-816 0 - 78 - 4
22
CHAPTER 1I. PROJECTIONS OF CURRENT POLICY SPENDING
In addition to considering the size of the federal budget over the nextfive years, the Congress will also address the question of the appropriatelong-run composition of the budget to reflect national needs and priorities.Before the Congress begins to consider these problems, it is important toreview the composition of the federal budget under the assumption of acontinuation of current policies. This chapter presents details on thecurrent policy projections of federal spending. 1/ The chapter opens with apresentation of the specific assumptions and methodologies used for theprojections, followed by a discussion of the major components of theprojected increases in current policy spending. The next section onadvanced budgeting shows what fraction of future spending is basicallypredetermined under alternative assumptions about advanced budgeting.The chapter ends by comparing the projected composition of federalspending under current policy assumptions and the composition of the budgetin the past.
SPENDING PROJECTION ASSUMPTIONS
Projections of spending rely on a specific set of assumptions aboutthe meaning of current policy for federal spending programs. The guidingprinciple is to maintain current programs in a manner consistent with theSecond Concurrent Resolution on the Budget for Fiscal Year 1978.Implementation of this principle results in several different methodologiesbeing used in preparing projections. For example, economic stimulusprograms are projected by different methods than are ongoing energy ordefense programs. In addition, federal spending for the past two fiscal yearshas fallen well below the levels in the concurrent resolutions on the budget.For this reason, the components of the spending shortfall for fiscal year1977 have been enumerated and its effects on the projections, if any,identified.
I/ The discussion in this chapter is confined to the unified budget. Itshould be noted, however, that certain activities of the federalgovernment are not reflected in the unified budget. Outlays for so-called off-budget agencies were over $8 billion in fiscal year 1977.
10
23
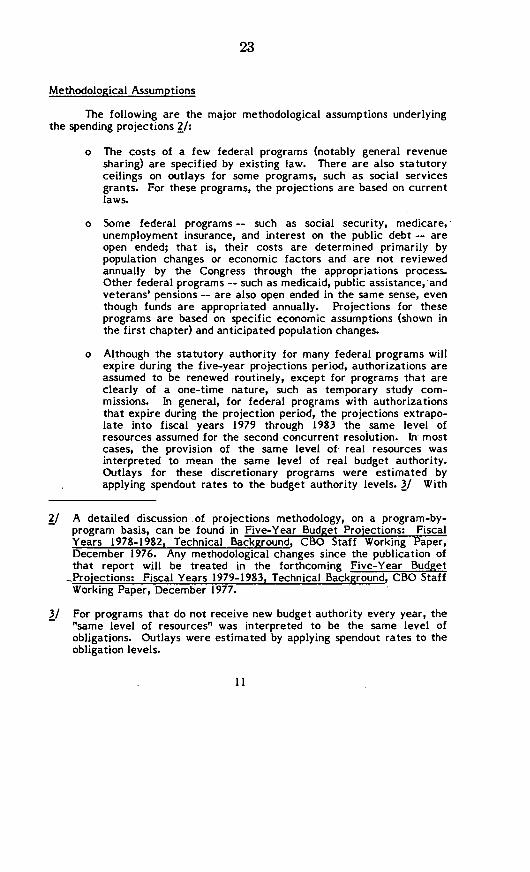
Methodological Assumptions
The following are the major methodological assumptions underlyingthe spending projections 2/:
o The costs of a few federal programs (notably general revenuesharing) are specified by existing law. There are also statutoryceilings on outlays for some programs, such as social servicesgrants. For these programs, the projections are based on currentlaws.
o Some federal programs-- such as social security, medicare,unemployment insurance, and interest on the public debt -- areopen ended; that is, their costs are determined primarily bypopulation changes or economic factors and are not reviewedannually by the Congress through the appropriations process.Other federal programs -- such as medicaid, public assistance, andveterans' pensions -- are also open ended in the same sense, eventhough funds are appropriated annually. Projections for theseprograms are based on specific economic assumptions (shown inthe first chapter) and anticipated population changes.
o Although the statutory authority for many federal programs willexpire during the five-year projections period, authorizations areassumed to be renewed routinely, except for programs that areclearly of a one-time nature, such as temporary study com-missions. In general, for federal programs with authorizationsthat expire during the projection period, the projections extrapo-late into fiscal years 1979 through 1983 the same level ofresources assumed for the second concurrent resolution. In mostcases, the provision of the same level of real resources wasinterpreted to mean the same level of real budget authority.Outlays for these discretionary programs were estimated byapplying spendout rates to the budget authority levels. 3/ With
2/ A detailed discussion of projections methodology, on a program-by-program basis, can be found in Five-Year Budget Projections: FiscalYears 1978-1982, Technical Background, CBO Staff Working Paper,December 1976. Any methodological changes since the publication ofthat report will be treated in the forthcoming Five-Year Budget
-Proiections: Fiscal Years 1979-1983, Technical Background, CBO StaffWorking Paper, December 1977.
3/ For programs that do not receive new budget authority every year, the"same level of resources" was interpreted to be the same level ofobligations. Outlays were estimated by applying spendout rates to theobligation levels.
I I

24
few exceptions, the projections do not include funding for specificneeds or projects, such as the cruise missile. Rather, they holdconstant the resources, such as procurement funds, that aredevoted to general needs, like national security. No attempt wasmade in this analysis to determine what specific projects could befunded under these assumptions. 4/
o The major exceptions to the above rule are programs that areassumed to be of a temporary nature and are projected to bephased out over the projections period. For example, thetemporary employment assistance program, which provides fundsfor public service jobs at state and local government levels, isassumed to phase down as the unemployment rate falls.
o The projections assume no change in military or civilian federalemployment. Federal pay scales are assumed to be adjustedannually in accordance with the Federal Pay Comparability Act of1970. The costs for such pay increases each year are initiallyestimated under the category "allowances for payraises" and thenare distributed among federal programs the following year, as iscustomary in federal budget presentation.
o Existing laws provide for various automatic cost-of-living adjust-ments of some sort for virtually all federal programs providingdirect benefit payments to individuals. (Veterans' benefits are amajor exception.) The benefit levels for some programs, such aspublic assistance and unemployment insurance, are set by stateand local governments under federal guidelines. It is assumed thatthe benefits under these programs will also. keep pace withinflation. Outlays for certain other programs, such as medicareand medicaid, are indirectly indexed for inflation since the federalgovernment pays part of the costs. Together, benefit paymentprograms that respond automatically to inflation comprise nearlyone-half of the federal budget.
o As discussed above, for most federal programs with authorizationsdue to expire during the projections period, the projectionscontain a constant real funding level. For these programs,
4/ CBO is in the process of estimating alternative defense force structuresthat fit within current policy constraints, using the Defense ResourceModel. A discussion of the model can be found in Real Growth andDecline in Defense Operating Costs: Fiscal Year 1978, CBO StaffWorking Paper, July 1977.
12
25
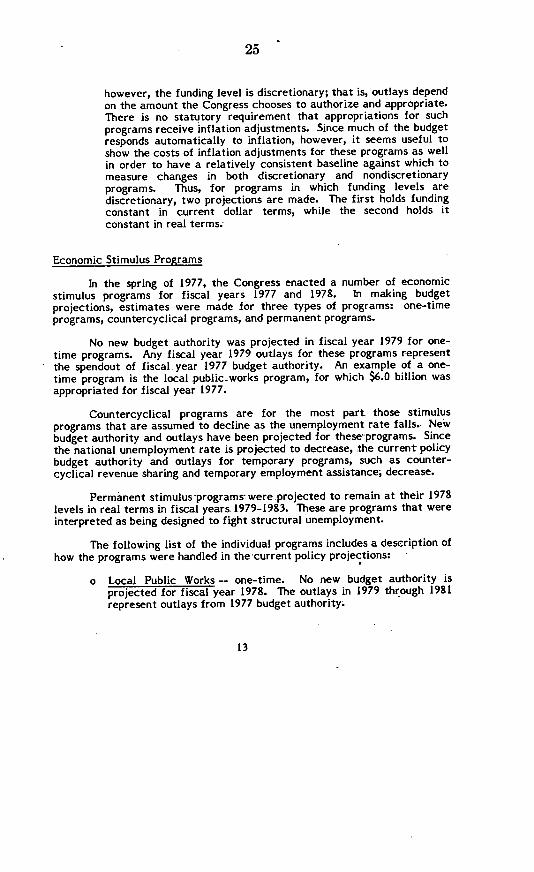
however, the funding level is discretionary; that is, outlays dependon the amount the Congress chooses to authorize and appropriate.There is no statutory requirement that appropriations for suchprograms receive inflation adjustments. Since much of the budgetresponds automatically to inflation, however, it seems useful toshow the costs of inflation adjustments for these programs as wellin order to have a relatively consistent baseline against which tomeasure changes in both discretionary and nondiscretionaryprograms. Thus, for programs in which funding levels arediscretionary, two projections are made. The first holds fundingconstant in current dollar terms, while the second holds itconstant in real terms;
Economic Stimulus Programs
In the spring of 1977, the Congress enacted a number of economicstimulus programs for fiscal years 1977 and 1978. In making budgetprojections, estimates were made for three types of programs: one-timeprograms, countercyclical programs, and permanent programs.
No new budget authority was projected in fiscal year 1979 for one-time programs. Any fiscal year 1979 outlays for these programs representthe spendout of fiscal year 1977 budget authority. An example of a one-time program is the local .public.works program, for which $6.0 billion wasappropriated for fiscal year 1977.
Countercyclical programs are for the most part those stimulusprograms that are assumed to decline as the unemployment rate falls. Newbudget authority and outlays have been projected for these-programs. Sincethe national unemployment rate is projected to decrease, the current policybudget authority and outlays for temporary programs, such as counter-cyclical revenue sharing and temporary employment assistance, decrease.
Permanent stimulus programs were projected to remain at their 1978levels in real terms in fiscal years 1979-1983. These are programs that wereinterpreted as being designed to fight structural unemployment.
The following list of the individual programs includes a description ofhow the programs were handled in the current policy projections:
o Local Public Works -- one-time. No new budget authority isprojected for fiscal year 1978. The outlays in 1979 through 1981represent outlays from 1977 budget authority.
13
26
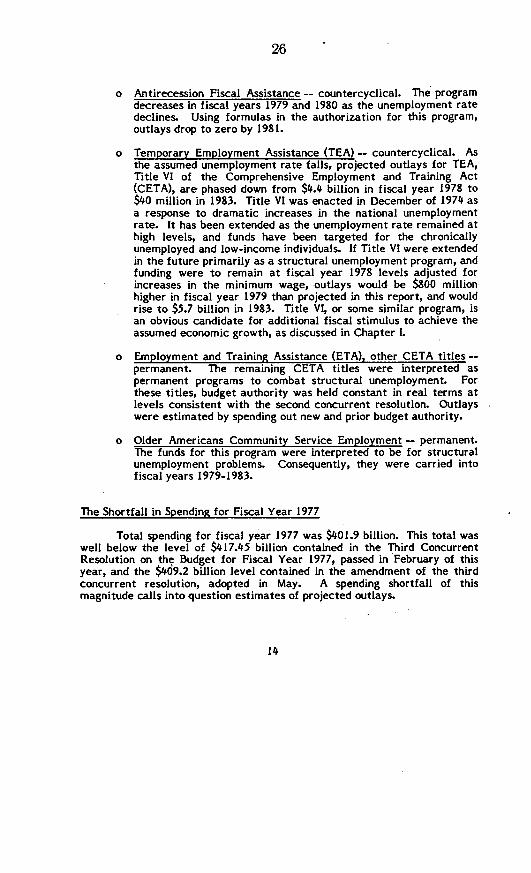
o Antirecession Fiscal Assistance -- countercyclical. The programdecreases in fiscal years 1979 and 1980 as the unemployment ratedeclines. Using formulas in the authorization for this program,outlays drop to zero by 1981.
o Temporary Employment Assistance (TEA) - countercyclical. Asthe assumed unemployment rate falls, projected outlays for TEA,Title VI of the Comprehensive Employment and Training Act(CETA), are phased down from $4.4 billion in fiscal year 1978 to$40 million in 1983. Title VI was enacted in December of 1974 asa response to dramatic increases in the national unemploymentrate. It has been extended as the unemployment rate remained athigh levels, and funds have been targeted for the chronicallyunemployed and low-income individuals. If Title VI were extendedin the future primarily as a structural unemployment program, andfunding were to remain at fiscal year 1978 levels adjusted forincreases in the minimum wage, outlays would be $800 millionhigher in fiscal year 1979 than projected in this report, and wouldrise to $5.7 billion in 1983. Title VI, or some similar program, isan obvious candidate for additional fiscal stimulus to achieve theassumed economic growth, as discussed in Chapter 1.
o Employment and Training Assistance (ETA), other CETA titles --permanent. The remaining CETA titles were interpreted aspermanent programs to combat structural unemployment. Forthese titles, budget authority was held constant in real terms atlevels consistent with the second concurrent resolution. Outlayswere estimated by spending out new and prior budget authority.
o Older Americans Community Service Employment -- permanent.The funds for this program were interpreted to be for structuralunemployment problems. Consequently, they were carried intofiscal years 1979-1983.
The Shortfall in Spending for Fiscal Year 1977
Total spending for fiscal year 1977 was $401.9 billion. This total waswell below the level of $417.45 billion contained in the Third ConcurrentResolution on the Budget for Fiscal Year 1977, passed in February of thisyear, and the $409.2 billion level contained in the amendment of the thirdconcurrent resolution, adopted in May. A spending shortfall of thismagnitude calls into question estimates of projected outlays.
14
27
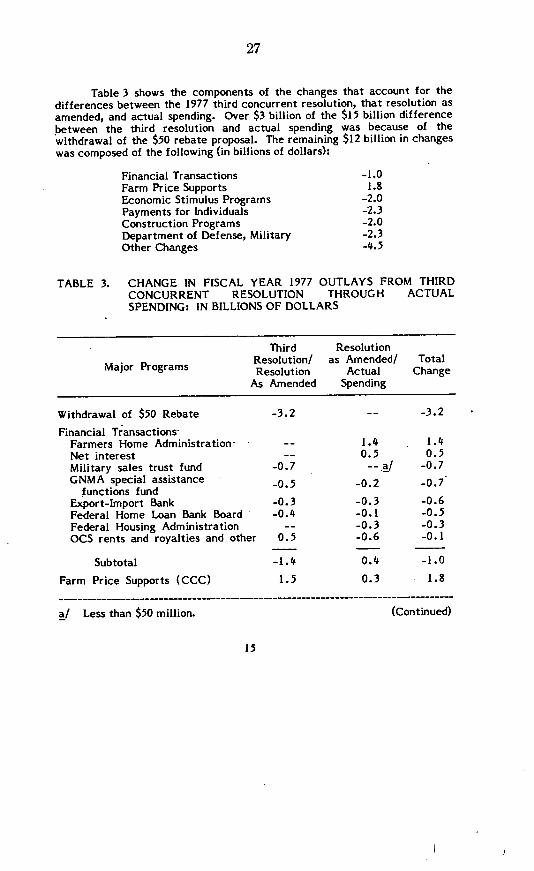
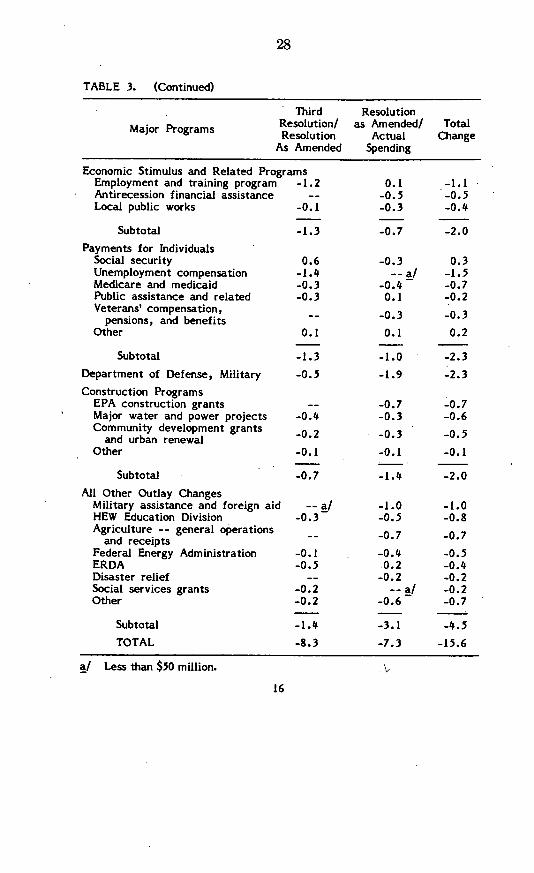
Table 3 shows the components of the changes that account for thedifferences between the 1977 third concurrent resolution, that resolution asamended, and actual spending. Over $3 billion of the $15 billion differencebetween the third resolution and actual spending was because of thewithdrawal of the $50 rebate proposal. The remaining $12 billion in changeswas composed of the following (in billions of dollars):
Financial TransactionsFarm Price SupportsEconomic Stimulus ProgramsPayments for IndividualsConstruction ProgramsDepartment of Defense, MilitaryOther Changes
-1.01.8
-2.0-2.3-2.0-2.3-4.5
TABLE 3. CHANGE IN FISCAL YEAR 1977 OUTLAYS FROM THIRDCONCURRENT RESOLUTION THROUGH ACTUALSPENDING: IN BILLIONS OF DOLLARS
Third ResolutionResolution/ as Amended/ Total
Major Programs Resolution Actual ChangeAs Amended Spending
Withdrawal of $50 Rebate -3.2 -- -3.2
Financial Transactions-Farmers Home Administration- -- 1.4 1.4Net interest -- 0.5 0.5Military sales trust fund -0.7 -- _a/ -0.7GNMA special assistance 0.5 -0.2 -0.7
functions fundExport-Import Bank -0.3 -0.3 -0.6Federal Home Loan Bank Board -0.4 -0.1 -0.5Federal Housing Administration -- -0.3 -0.3OCS rents and royalties and other 0.5 -0.6 -0.1
Subtotal -1.4 0.4 -1.0
Farm Price Supports (CCC) 1.5 0.3 1.8…__ _ _ _ _ _ _ _ _ _ _ _ _ _ _ _ - _ _ _ _ _ _ _ _ _ _ _ _ _ _ _ _ _ - -------_ _ _ _ _ _ _ _ _ _ _ _ _ _ _ _ _ _ _ _ _ _ _ -_ _ _ _ _ _ _ _ _ _ _ _
a/ Less than $50 million. (Continued)
15
I
28
TABLE 3. (Continued)
Third ResolutionMajor Programs Resolution/ as Amended/ Total
Resolution Actual ChangeAs Amended Spending
Economic Stimulus and Related ProgramsEmployment and training program -1.2 0.1 -1.1 -Antirecession financial assistance -- -0.3 -0.5Local public works -0.1 -0.3 -0.4
Subtotal -1.3 -0.7 -2.0Payments for Individuals
Social security 0.6 -0.3 0.3Unemployment compensation -1.4 -- a/ -1.5Medicare and medicaid -0.3 -0.4 -0.7Public assistance and related -0.3 0.1 -0.2Veterans' compensation,
pensions, and benefitsOther 0.1 0.1 0.2
Subtotal -1.3 -1.0 -2.3Department of Defense, Military -0.5 -1.9 -2.3Construction Programs
EPA construction grants -- -0.7 -0.7Major water and power projects -0.4 -0.3 -0.6Community development grants -0.2 -0.3 -0.5
and urban renewalOther -0.1 -0.1 -0.1
Subtotal -0.7 -1.4 -2.0
All Other Outlay ChangesMilitary assistance and foreign aid -- a/ -1.0 -1.0HEW Education Division -0.3 -0.5 -0.8Agriculture -- general operations -- -0.7 -0.7
and receiptsFederal Energy Administration -0.1 -0.4 -0.5ERDA -0.5 0.2 -0.4Disaster relief -- -0.2 -0.2Social services grants -0.2 -- a/ -0.2Other -0.2 -0.6 -0.7
Subtotal -1.4 -3.1 -4.5
TOTAL -8.3 -7.3 -15.6
a/ Less than $50 million. .
16

29
The change in the category of financial transactions is composed of anumber of increases and decreases. One of the significant decreases was inthe foreign military sales trust fund. For estimating trust fund gross outlaysand receipts, CBO has recently devised a new methodology, which isreflected in the most recent estimates for fiscal year 1978 and in theprojections for fiscal years 1979-1983. 5/ Most of the other changes reflectthe difficulty in estimating outlays for agencies involved in the financingand credit activities of the federal government. Estimates for this categorywill probably continue to be a problem in the future.
The change in farm price supports reflects the problem of large cropsand falling market prices, as well as the higher dairy support rate effectedby the Administration on April 1, 1977. Most of this change was anticipatedin the amendment to the third concurrent resolution.
Changes in the economic stimulus programs are the result of severalfactors. First, the appropriation for the programs was approved later thananticipated in the third concurrent resolution. Also, original estimates forthese programs were overly optimistic about the time necessary for actualimplementation. Finally, part of the change in antirecessional fiscalassistance stems from the lower than anticipated unemployment rate in thefirst quarter of 1977. CBO's scorekeeping estimates for fiscal year 1978 andprojections for 1979-1983 have been adjusted somewhat to reflect thesefactors. For all of the economic stimulus programs, CBO estimates for 1978are less than or equal to those of the Administration.
Changes in the unemployment compensation category, explained bythe unexpectedly rapid rate of economic growth and the decline in theunemployment rate in the first half of 1977, account for the difference inpayments for individuals. If the economy performs better in 1978-1983 thanhas been assumed in Chapter I, projected outlays for unemployment benefitswould be too high. If the economy does not grow at the assumed rate of 4.8percent per year, however, actual outlays would exceed the estimates.
The changes in construction programs, Department of Defense,Military, and other spending programs reflect the pervasiveness of shortfallphenomena throughout the budget. In July 1977 CBO reestimated outlaysfor fiscal year 1977 at $402.6 billion. Since July, CBO has reestimated total
5/ For details on the projections methodology for the foreign military salestrust fund, see the forthcoming Five-Year Budget Projections: FiscalYears 1979-1983, Technical Background, CBO Staff Working Paper,December 1977.
17
20-816 0 - 78 - 5

30
outlays for 1978 downward by over $2 billion. Outlays for 1978 arereestimated downward by another $3.5 billion in the CBO ScorekeepingReport Number 5 for 1978, released the same week as this projectionsreport. These reestimates reflect widespread adjustment of the spendoutrates used to estimate outlays for most accounts, and were used for theestimates in this report.
Based on analysis of past trends, spending for 1978 may fall belowcurrent scorekeeping estimates. 6/ Outlays for fiscal year 1978 will againbe reestimated shortly after the submission of the President's budget. Newspending projections will be made in the early spring of 1978 and will reflect.the fiscal year 1978 reestimates.
PROJECTED INCREASES IN FEDERAL SPENDING
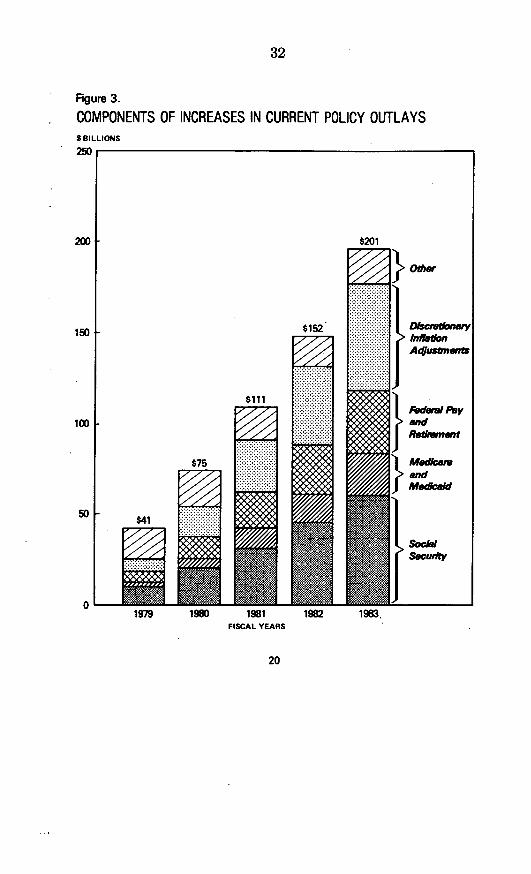
Current policy outlays are projected to increase to $655 billion byfiscal year 1983. The average rate of increase is approximately 7.3 percentannually. Table 4 shows the components of the increases in federal spendingfrom CBO's current estimate for fiscal year 1978, given current policyassumptions. The largest component of the increase is social securitypayments, which by fiscal year 1983 would total $156 billion, $60 billionabove the current estimate for fiscal year 1978. The next largest increase isfor medicare and medicaid benefits ($33 billion by fiscal year 1983). Theseincreases would be tempered, however, by cost-control legislation antici-pated in the second concurrent resolution. As shown in the table, thislegislation is projected to save $10 billion by fiscal year 1983.
For many federal programs the funding levels are discretionary. TheCongress may choose not to index these programs to inflation, in contrast toothers like social security for which indexing is specified by law. The costof inflation increases for discretionary programs is demonstrated inFigure 3. Of the discretionary inflation increases, over 40 percent is fordefense while the remainder is for grants to state and local governments,veterans' benefits increases, and other federal operations.
6/ Since the 1950s, year-to-year increases in federal outlays have averagedabout 8 percent. The increase implicit in the current CBO scorekeepingestimate is almost 13 percent. Although it is likely that the increasefor 1978 may be above the average, with some of the economic stimulusprograms beginning to spend out, there is some chance that the percentincrease in outlays will be only about II percent, which would mean ashortfall of $6.to $8 billion from the current estimate.
18

31
TABLE 4. PROJECTED INCREASES IN FEDERAL OUTLAYS:FISCAL YEARS, IN BILLIONS OF DOLLARS
BY
1979 1980 1981 1982 1983
CBO Current Estimate for 1978
Add: Increases Mandated underExisting Law
Social securityMedicare and medicaidPay increases for federal
employeesRetired military and civil
service retirementNet interestDefense purchasesAll other spending (net)
Subtotal
Add: Further Adjustments forInflation
Maintain 1978 level ofdefense purchases
Maintain 1978 level of grantsand other federal purchases
Cost-of-living increase forVeterans' benefits
Subtotal
Add: Legislation Anticipated inSecond Concurrent Resolution
Medicare and medicaidcost control
Other legislation
TOTAL
454 454 454 454 454
105
4
2
329
489
2010
9
4
647
514
3118
13
7
86.
538
4425
18
9
97
566
2 6 11 17
3 9 16 27
4
495
-3- 2
495
2
531
-4
2
529
2
567
-6
2
565
3 4
613 663
-9
2
606
19
6033
23
12
98
600
23
36
-10
2
655
32
Figure 3.
COMPONENTS OF INCREASES INS BILLIONS
250
200
150
100
75.:.:
50 EE
0
CURRENT POLICY OUTLAYS
$152
$201
-......... }.::::::::::::::::::::::::::::::::::.:::::::::::::::::::::::.,'..:.,...:.:... :.: ....::::::::::::::::::::::::.:.::: ::::::::
Q41
1979 1980 1981 1982 1983.FISCAL YEARS
20
FedsW PayAndRetigent
MedicareandMedcafd

33
MULTIYEAR BUDGETING AND PROJECTIONS OF FEDERAL SPENDING
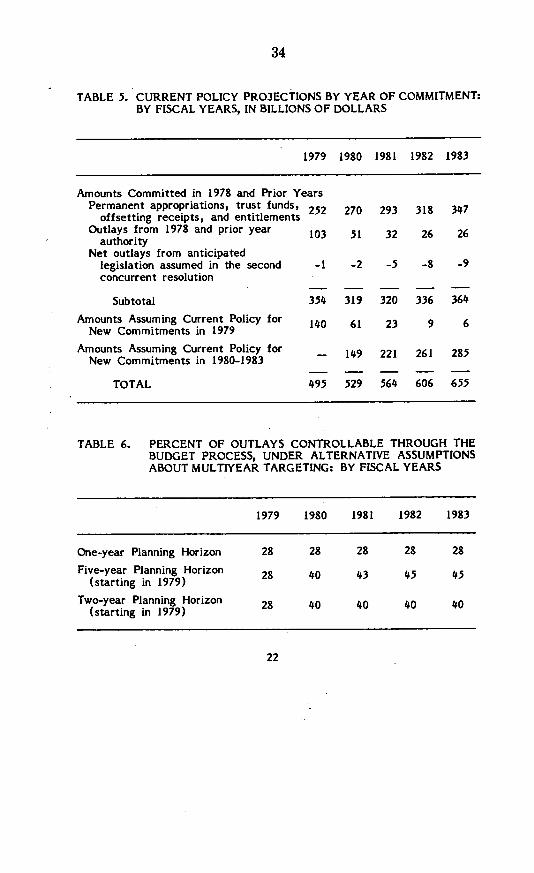
A considerable amount of federal spending over the next five years ismandated by current law. In the absence of changes in these laws, theoutlays fall outside the control of the annual budget process. For example,benefit payments for social security are determined by formulas in theauthorizing legislation for the program. Table 5 shows committed outlaysfor permanent appropriations, trust funds, offsetting re'ceipts, and entitle-ments; these comprise approximately 50 percent of current and projectedoutlays. A second source of commitments is outlays resulting fromappropriations made in fiscal 1978 and prior years. Unless the Congresswere to rescind the budget authority for these previously funded programs,the outlays shown in Table 5 would have to be considered as uncontrollablewhen reviewing spending in fiscal years 1979-1983. Finally, Table 5 showsthe outlays from legislation for fiscal year 1978 that was anticipated in thesecond concurrent resolution. If this legislation is enacted as assumed, theoutlays shown will be determined before the start of fiscal year 1979.Outlays mandated under current law become the base for consideration ofnew spending commitments in fiscal years 1979-1983.
If the Congress does not change commitments made in 1978 and prioryears, the outlays subject to control under current procedures in fiscal years1979-1983 are those from new commitments. This represents only 28percent of projected outlays for fiscal year 1979; the percent rises to about45 percent for fiscal year 1983. In the absence of other changes in thebudget reviewing procedures of the Congress, however, the increase incontrol would not occur unless the Congress adopts an advanced budgeting oradvanced targeting approach to federal spending. As shown in Table 5, theportion of the budget that is subject to control in fiscal year 1979 is onlyabout $140 billion because of commitments made in fiscal year 1978 andprior years. If the Congress waits until next year to review the fiscal year1980 budget and continues to use a one-year planning horizon, the outlaysfrom 1979 commitments will be, for all practical purposes, beyond thecontrol of the budget process, and only about $150 billion will be subject tocontrol.
Table 6 shows the percent of budget outlays that fall under thecontrol of the budget process under alternative assumptions about advancedtargeting. As shown in the table, if the Congress continues to set spendingtargets for one year at a time, a constant 28 percent of outlays falls underthe control of the budget process. On the other hand, if the Congress wereto set five-year targets starting with fiscal year 1979, an increasing share ofprojected outlays would fall under the control of the budget process. Thetable also demonstrates that a large part of the increased control resultingfrom advanced targeting can be derived by using a two-year planninghorizon.
21
34
TABLE 5. CURRENT POLICY PROJECTIONS BY YEAR OF COMMITMENT:BY FISCAL YEARS, IN BILLIONS OF DOLLARS
1979 1980 1981 1982 1983
Amounts Committed in 1978 and Prior YearsPermanent appropriations, trust funds, 252 270 293 318 347
offsetting receipts, and entitlementsOutlays from 1978 and prior year 103 51 32 26 26
authorityNet outlays from anticipated
legislation assumed in the second -I -2 -5 -8 -9concurrent resolution
Subtotal 354 319 320 336 364
Amounts Assuming Current Policy for 140 61 23 9 6New Commitments in 1979
Amounts Assuming Current Policy for - 149 221 261 285New Commitments in 1980-1983
TOTAL 495 529 564 606 655
TABLE 6. PERCENT OF OUTLAYS CONTROLLABLE THROUGH THEBUDGET PROCESS, UNDER ALTERNATIVE ASSUMPTIONSABOUT MULTIYEAR TARGETING: BY FISCAL YEARS
1979 1980 1981 1982 1983
One-year Planning Horizon 28 28 28 28 28
Five-year Planning Horizon 28 40 43 45 45(starting in 1979)
Two-year Planning Horizon 28 40 40 40 40(starting in 1979)
22

35
Figure 4.
RELATIVE SHARESOF TOTALFEDERAL OUTLAYS
1963
1978 Second Concurrent
M NATIONAL DEFENSE
g BENEFIT PAYMENTS
M GRANTSM OTHER
THE COMPOSITION OF FEDERALSPENDING
In fiscal year 1963, outlays fornational defense comprised 46 percent offederal spending, while benefit paymentsfor individuals represented 26 percent ofthe total. Grants to state and localgovernments for other than benefit pay-ments were only 4.5 percent of totalfederal outlays.
Major Spending Components
During the past 15 years, the com-position of the budget has changed consid-erably. Of the $458 billion ceiling in the1978 second concurrent resolution, only 24percent is assumed to be for nationaldefense, while 44 percent is for benefitpayments. The dramatic rise in the sharefor benefit payments seen in Figure 4results primarily from increases for con-tributory benefit payment programs likesocial security. The share of the budgetappropriated for grants to state and localgovernments has more than doubled since1963 as new grant programs such asEnvironmental Protection Agency con-struction grants, general revenue sharing,and antirecession grant programs havebeen enacted.
Under current policy assumptions,the composition of federal spending wouldchange slightly by fiscal year 1983. Theincrease in national defense generallycorresponds with inflation increases. Theshare of the budget for benefit paymentsfor individuals would increase to 47percent because, in the absence of policychanges, these programs would be in-fluenced both by inflation and by changes
23
I
36
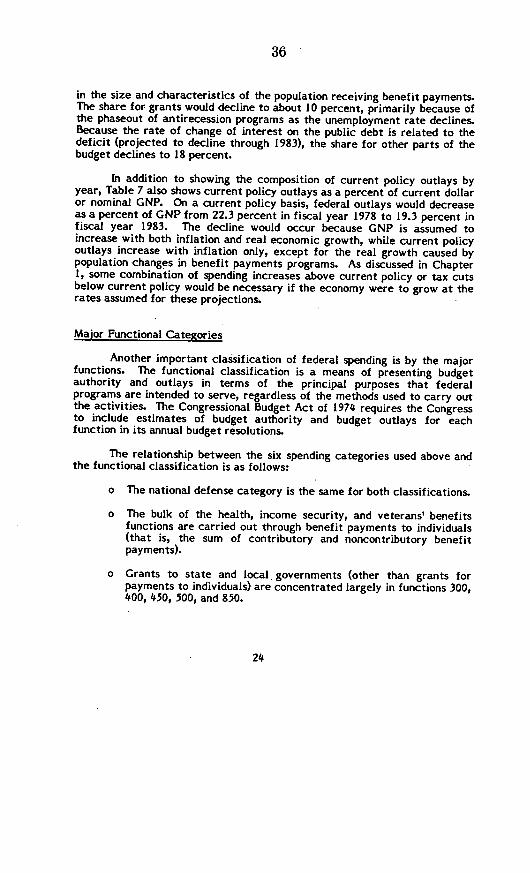
in the size and characteristics of the population receiving benefit payments.The share for grants would decline to about 10 percent, primarily because ofthe phaseout of antirecession programs as the unemployment rate declines.Because the rate of change of interest on the public debt is related to thedeficit (projected to decline through 1983), the share for other parts of thebudget declines to 18 percent.
In addition to showing the composition of current policy outlays byyear, Table 7 also shows current policy outlays as a percent of current dollaror nominal GNP. On a current policy basis, federal outlays would decreaseas a percent of GNP from 22.3 percent in fiscal year 1978 to 19.3 percent infiscal year 1983. The decline would occur because GNP is assumed toincrease with both inflation and real economic growth, while current policyoutlays increase with inflation only, except for the real growth caused bypopulation changes in benefit payments programs. As discussed in Chapter1, some combination of spending increases above current policy or tax cutsbelow current policy would be necessary if the economy were to grow at therates assumed for these projections.
Major Functional Categories
Another important classification of federal spending is by the majorfunctions. The functional classification is a means of presenting budgetauthority and outlays in terms of the principal purposes that federalprograms are intended to serve, regardless of the methods used to carry outthe activities. The Congressional Budget Act of 1974 requires the Congressto include estimates of budget authority and budget outlays for eachfunction in its annual budget resolutions.
The relationship between the six spending categories used above andthe functional classification is as follows:
o The national defense category is the same for both classifications.
o The bulk of the health, income security, and veterans' benefitsfunctions are carried out through benefit payments to individuals(that is, the sum of contributory and noncontributory benefitpayments).
o Grants to state and local, governments (other than grants forpayments to individuals) are concentrated largely in functions 300,400, 450, 500, and 850.
24

37
TABLE 7. MAJOR COMPONENTS OF BUDGET OUTLAY PROJECTIONS: BY FISCAL YEARS
1977 Second Current Policy ProjectionsMajor Component Estimate Concurrent 1979 1980 1981 1982 1983
Resolution
In Billions of Dollars
National DefenseContributory Benefit Pay-
ments for IndividualsOther Benefit Payments
for IndividualsGrants to State and
Local GovernmentsNet InterestOther Federal Operations
TOTAL
97 110 119 128 139 150 161
136 148 161 176 194 213 238
46 49 53 57 60 64 68
47
3047
402
57
3362
458
57
3768
495
38
3972
529
53
4173
565
60
4277
606
63
4282
655
As a Percent of Total Outlays
National DefenseContributory Benefit Pay-
ments for IndividualsOther Benefit Payments
for IndividualsGrants to State and
Local GovernmentsNet InterestOther Federal Operations
TOTAL
24 24 24 24 25 25 25
34 32 33 33 34 35 36
It 11 11 11 11 11 10
12
712
100
12
713
100
12 11 10 10 10
7 714 14
100 100
7103
100
713
100
613
100
As a Percent of GNP
21.8 22.3 21.8 21.0 20.3 19.7 19.3TOTAL
o Net interest consists of the interest function and the interestreceived by trust funds, which comprise approximately one-halfthe undistributed offsetting receipts function.
o Other federal operations are distributed throughout all functionalcategories except national defense and interest.
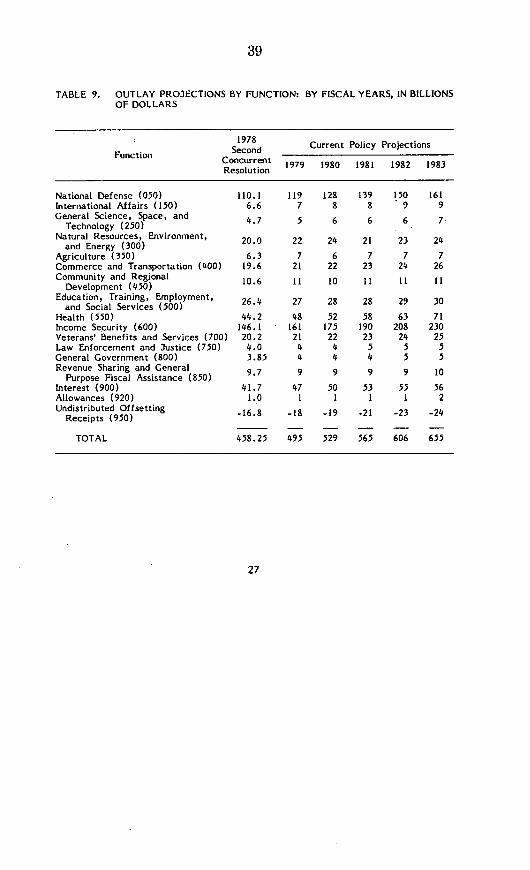
Tables 8 and 9 present the projections of outlays and budget authorityby the 17 major functions used for the Congressional budget resolutions infiscal years 1976 through 1978. The projections for 1979-1983 includediscretionary inflation adjustments.
25

38
Since the inflation adjustments used for the projections are relativelyuniform for most federal programs, the percent breakdown of projectedtotal outlays by functional category changes little between fiscal years 1978and 1983. Increases for social security in the income security function areoffset by projected decreases in unemployment compensation. Theprojected declining shares for the general revenue sharing and the education,training, employment, and social services functions are caused by thephasing out of certain antirecession programs. The declining share forveterans' benefits and services results from the projected decline in thenumber of veterans receiving benefits.
TABLE 8. BUDGET AUTHORITY PROJECTIONS BY FUNCTION: BY FISCAL YEARS,IN BILLIONS OF DOLLARS
1978Function Second Current Policy Projections
FuctonConcurrent 1979 1980 1981 1982 1983Resolution
National Defense (050) 116.4 128 138 148 158 169International Affairs (150) 8.0 9 10 11 11 12General Science, Space, and
Technology (250) 4.9 5 6 6 7 7Natural Resources, Environment, 24.6 22 21 20 23 25
and Energy (300)246 2 21 0 23 5Agriculture (350) 2.1 5 7 7 6 7Commerce and Transportation (400) 20.4 21 24 26 27 28Community and Regional
Development (450) 8.2 10 11 11 12 12Education, Training, Employment, 26.3 2 2 2
and Social Services (500) * 6 2 9 30 32Health (550) 47.7 53 58 68 77 85Income Security (600) 178.6 193 210 225 242 261Veterans' Benefits and Services (700) 19.9 21 22 23 24 26Law Enforcement and Justice (750) 3.8 4 4 5 5 5General Government (800) 3.8 4 4 4 5 5Revenue Sharing and General
Purpose Fiscal Assistance (850) 9.6 9 9 9 9 10Interest (900) 41.7 47 50 53 55 56Allowances (920) 0.9 1 1 1 1 1Undistributed Offsetting
Receipts (950) -16.8 -18 19 -21 -23 -24
TOTAL 500.1 541 582 624 669 717
26
39
TABLE 9. OUTLAY PROJECTIONS BY FUNCTION: BY FISCAL YEARS, IN BILLIONSOF DOLLARS
1978Second Current Policy ProjectionsFunction Concurrent 1979 1980 1981 1982 1983
Resolution
National Defense (050) 110.1 119 128 139 150 161International Affairs ( 150) 6.6 7 8 8 9 9General Science, Space, and 4.7 5 6 6 6 7
Technology (250)Natural Resources, Environment, 20.0 22 24 21 23 24
and Energy (300)Agriculture (350) 6.3 7 6 7 7 7Commerce and Transportation (400) 19.6 21 22 23 24 26Community and Regional 10.6 11 10 11 11 11
Development (450)Education, Training, Employment, 26.4 27 28 28 29 30
and Social Services (500)Health (550) 44.2 48 52 58 63 71Income Security (600) 146.1 161 175 190 208 230Veterans' Benefits and Services (700) 20.2 21 22 23 24 25Law Enforcement and Justice (750) 4.0 4 4 5 5 5General Government (800) 3.85 4 4 4 5 5Revenue Sharing and General 9.7 9 9 9 9 10
Purpose Fiscal Assistance (850)Interest (900) 41.7 47 50 53 55 56Allowances (920) 1.0 1 1 1 1 2Undistributed Offsetting 6 9 21 23 24
Receipts (950) -16.8 -18 -I
TOTAL 458.25 495 529 565 606 655
27

40
CHAPTER III. PROJECTIONS OF CURRENT POLICY REVENUES
Equally as important as the composition of federal spending is thecomposition of federal revenues over the next five years. What share offederal revenues should be raised by individual income taxes as opposed tocorporate income taxes? How would the composition of revenues over thenext five years be affected by legislation to increase social insurance taxesand make the social security trust fund solvent? As a prelude toCongressional consideration of the long-run makeup of federal taxes, thischapter discusses projections of federal revenues assuming the continuationof existing laws. The chapter opens with a discussion of the assumptionsunderlying the revenue projections and then moves on to the current policyprojections of federal revenues. The basic result shown by the projections isthat under current law the share of revenues raised by individual incometaxes would increase, because of the progressive nature of federal individualincome tax, from 44 percent in fiscal year 1978 to 52 percent in 1983.
REVENUE PROJECTION ASSUMPTIONS
Current policy revenue projections assume a current dollar grossnational product (GNP) that grows at an average rate of 10.5 percentannually under the economic assumptions in Chapter L It is also assumedthat wages and salaries grow at an average annual rate of 10.5 percent,corporate profits at an average annual rate of 10.6 percent, and taxablepersonal income at an average annual rate of 10.7 percent. Theseassumptions reflect a gradual approach to 4.5 percent unemployment by1983, with real economic growth of 4.8 percent annually through 1982 and3.7 percent for 1983, as discussed in Chapter L
The current policy assumptions under which the revenue estimatesare made include extension of those provisions of the Tax Reform andSimplification Act of 1977 that would expire if not renewed. The onlyexception to this assumption is the jobs credit, which is assumed to expirewithout extension in 1978. The earned income credit is treated as a revenuereduction, and is assumed to be extended through fiscal year 1983. Socialsecurity tax revenues are forecast assuming steady increases in the wagebase from $15,300 in 1977 to $25,800 by 1983. Social security tax rates areassumed to rise from 5.85 percent in 1977 (employees share only) to 6.3percent for 1981 and subsequent years as specified in current law. 1/ Inaddition, the projections assume the scheduled 1978 increase in the wagebase for unemployment insurance payroll taxes.
1/ The social security wage base and tax rates apply to calendar years,although the revenue estimates are presented by fiscal year.
28

41
Both the House and the Senate have passed energy tax bills thatwould affect revenues significantly during the projection period. One oftheir common features is the extension throughout the projection period ofthe excise tax on gasoline. This extention is assumed in the revenueprojections. In most other respects, the bills have major unresolveddifferences. The House bill combines energy tax credits and excise taxesthat have not been included in the five-year revenue projections. TheSenate bill contains a substantial number of refundable energy tax creditsthat have also not been included in the five-year revenue projections. Theconference probably will produce a bill that compromises the differencesbetween the two bills. Table 10 shows the separate five-year revenueimpacts of the House and Senate bills on the revenue projections containedin this chapter.
TABLE 10. EFFECTS OF HOUSE-PASSED AND SENATE-PASSEDENERGY BILLS ON FIVE-YEAR PROJECTIONS: BY FISCALYEARS, IN BILLIONS OF DOLLARS
1978 1979 1980 1981 1982 1983
House Version -I - 9 12 4 1
Senate Version -2 a/ -5 -6 -7 -7 -7
a/ Individual provisions of the Senate bill add to -$2.014 billion for fiscalyear 1978, but the bill contains a provision that the total revenue lossshould not exceed $972 billion for fiscal year 1978.
Congressional action on social security tax revision is not yetcomplete, but the general outlines of the likely changes have begun tocrystalize. The House and Senate have separate measures to deal with theproblem of the solvency of the trust fund; the differences have not yet beenresolved in conference. Although each house has separate measures, therevenue impact will probably fall within a range bounded by the twoalternatives. If the conference reaches agreement on some proposalbetween the two alternatives, the effect from social security changes wouldbe an increase in revenues for the social insurance category in the rangeshown in Table 11.
29

42
TABLE 11. EFFECTS OF SOCIAL SECURITY LEGISLATION ON TOTALREVENUES: BY FISCAL YEARS, IN BILLIONS OF DOLLARS
1979 1980 1981 1982 1983
6-8 8-10 17 21-23 23-26
REVENUE PROJECTIONS
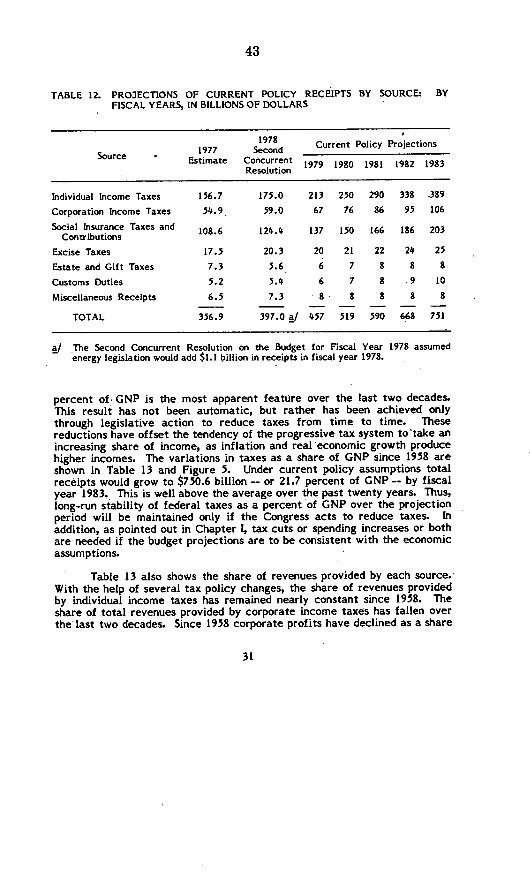
The total federal receipts projections by source are shown inTable 12. Total federal revenues under current law are projected to rise atan average annual rate of 13.2 percent, from $356.9 billion in fiscal year1977 to $751 billion in fiscal year 1983. The projected revenue increase of$394.1 billion from 1977-1983 is primarily attributable to individual incometaxes (59 percent), corporate income taxes (13 percent), and social insurancetaxes (24 percent). Together, individual income and social insurance taxesare expected to provide 79 percent of fiscal year 1983 receipts. Of theprojected $394.1 billion in revenue growth from 1977 to 1983, more than halfreflects increases caused by inflation.
Under current law, all three major tax sources are projected to yieldrevenues that rise more rapidly than the growth rate for GNP. Individualincome taxes grow most rapidly. After adjusting for changes in the standarddeduction and personal credits, the estimates of individual income taxliabilities have an elasticity of 1.4; that is, each percent growth in GNP isassociated with 1.4 percent growth in individual income tax liabilities.Under current law, both corporate income and social insurance taxes growslightly faster than corporate profits and GNP, respectively.
FEDERAL REVENUES: A HISTORICAL PERSPECTIVE
Federal revenues have grown more than fourfold since 1958 -- from$79 billion in fiscal year 1958 to nearly $360 billion for fiscal year 1977.Relative to the size of the economy, federal taxes have increased verylittle -- from 17.7 percent of GNP in 1958 to 18.8 percent of GNP in 1977.While there has been some fluctuation in receipts, stability of taxes as a
30
43
TABLE 12. PROJECTIONS OF CURRENT POLICY RECEIPTS BY SOURCE: BYFISCAL YEARS, IN BILLIONS OF DOLLARS
1978 Current Policy ProjectionsSource ~1977 Second ______ _________
Source ~~Estimate Concurrent 1979 1980 1981 1982 1983Resolution
Individual Income Taxes 156.7 175.0 213 250 290 338 .389
Corporation Income Taxes 54.9 59.0 67 76 86 95 106
Social Insurance Taxes and 108.6 124.4 137 150 166 186 203Contributions
Excise Taxes 17.5 20.3 20 21 22 24 25
Estate and Gift Taxes 7.3 5.6 6 7 8 8 8
Customs Duties 5.2 5.4 6 7 8 .9 10
Miscellaneous Receipts 6.5 7.3 8 8 8 8 8
TOTAL 356.9 397.0 a/ 457 519 590 668 751
a/ The Second Concurrent Resolution on the Budget for Fiscal Year 1978 assumedenergy legislation would add $1.1 billion in receipts in fiscal year 1978.
percent of GNP is the most apparent feature over the last two decades.This result has not been automatic, but rather has been achieved onlythrough legislative action to reduce taxes from time to time. Thesereductions have offset the tendency of the progressive tax system to'take anincreasing share of income, as inflation and real'economic growth producehigher incomes. The variations in taxes as a share of GNP since 1958 areshown in Table 13 and Figure 5. Under current policy assumptions totalreceipts would grow to $750.6 billion - or 21.7 percent of GNP -- by fiscalyear 1983. This is well above the average over the past twenty years. Thus,long-run stability of federal taxes as a percent of GNP over the projectionperiod will be maintained only if the Congress acts to reduce taxes. Inaddition, as pointed out in Chapter 1, tax cuts or spending increases or bothare needed if the budget projections are to be consistent with the economicassumptions.
Table 13 also shows the share of revenues provided by each source.With the help of several tax policy changes, the share of revenues providedby individual income taxes has remained nearly constant since 1958. Theshare of total revenues provided by corporate income taxes has fallen overthe'last two decades. Since 1958 corporate profits have declined as a share
31
44
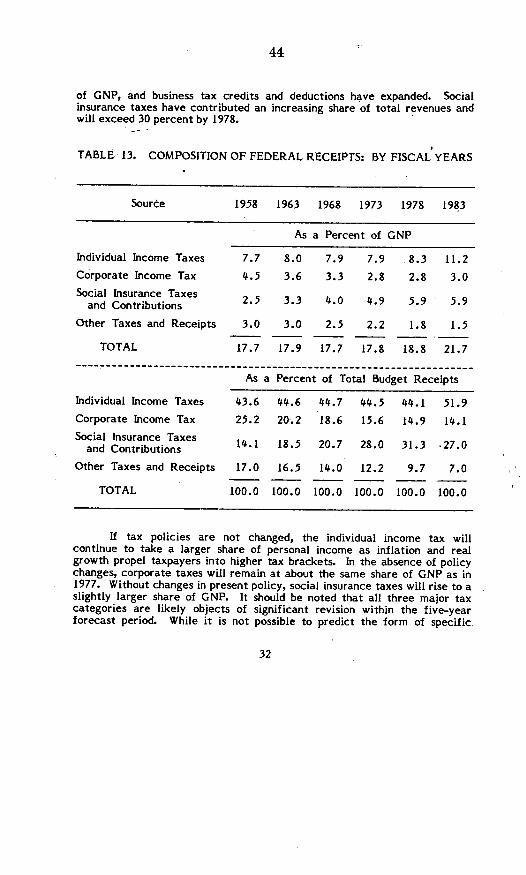
of GNP, and business tax credits and deductions have expanded. Socialinsurance taxes have contributed an increasing share of total revenues andwill exceed 30 percent by 1978.
TABLE- 13. COMPOSITION OF FEDERAL RECEIPTS: BY FISCAL YEARS
Sourde 1958 1963 1968 1973 1978 1983
As a Percent of GNP
Individual Income Taxes
Corporate Income Tax
Social Insurance Taxesand Contributions
Other Taxes and Receipts
TOTAL
7.7 8.0 7.9 7.9 8.3 11.24.5 3.6 3.3 2.8 2.8 3.0
2.5 3.3 4.0 4.9 5.9 - 5.9
3.0
17.7
3.0 2.5
17.9 17.7
2.2
17.8
1.8
18.8
1.5
21.7
As a Percent of Total Budget Receipts
Individual Income Taxes
Corporate Income Tax
Social Insurance Taxesand Contributions
Other Taxes and Receipts
TOTAL
43.6 44.6 44.7 44.5 44.1 51.9
25.2 20.2 18.6 15.6 14.9 14.1
14.1 18.5 20.7 28.0 31.3 .27.0
17.0
100.0
16.5
100.0
14.0
100.0
12.2
100.0
9.7 7.0
100.0 100.0
If tax policies are not changed, the individual income tax willcontinue to take a larger share of personal income as inflation and realgrowth propel taxpayers into higher tax brackets. In the absence of policychanges, corporate taxes will remain at about the same share of GNP as in1977. Without changes in present policy, social insurance taxes will rise to aslightly larger share of GNP. It should be noted that all three major taxcategories are likely objects of significant revision within the five-yearforecast period. While it is not possible to predict the form of specific
32

45
Figure 5.FEDERAL REVENUES AS A PERCENT OF GNPPERCENT OF GNP25 ,
FISCAL YEARS
33

46
proposals, there are actuarial deficits in the social insurance trust funds. Ifthese deficits are to be reduced through increased social insurance taxes, itis likely that social insurance taxes will become a larger share of totalrevenues. Revisions in corporate and individual income taxes are also likely,probably resulting in net tax reductions, especially if tax cuts are used togenerate the economic stimulus needed for the economy to grow at a 4.8percent annual rate.
34
47
APPENDIXES.

48
APPENDIX A. THE EFFECTS OF LESS VIGOROUS ECONOMIC GROWTH
As pointed out in Chapter I, inflation, unemployment, and other levelsof economic activity have a major impact on revenues and outlays. Thisappendix presents the effects of less vigorous economic growth onprojections of the budget. The results show that current policy receipts areaffected much more by alternative assumptions about real economic growththan are current policy outlays. The results also suggest that it might bepossible to balance the budget by fiscal year 1982 if a lower target wereassumed for real economic growth.
BUDGET IMPLICATIONS OF LESS VIGOROUS ECONOMIC GROWTH
The target for economic growth in Chapter I was relatively optimisticin light of historical experience. Suppose a less optimistic target of a 4percent annual rate of growth in real gross national product (GNP) wereassumed (see Table A-I). What would be the effect on projected currentpolicy revenues and outlays?
TABLE A-I. AGGREGATE ECONOMIC ASSUMPTIONSGROWTH: BY CALENDAR YEARS
UNDER LESS VIGOROUS ECONOMIC
Selected Economic Variables 1977 1978 1979 1980 1981 1982 1983
Gross National Product (GNP)
Cu(rrenbildionsofdolars) 1,898.0 2,107.0 2,321.7 2,547.1 2,787.0 3,047.2 3,329.5
Real GNP (in billions of 1,338.0 1,402.7 1,460.9 1,519.3 1,580.1 1,643.3 1,709.01972 dollars)
Growth rate of real GNP 5.0 4.8 4.2 4.0 4.0 4.0 4.0
Unemployment Rate (percent) 7.0 6.5 6.3 6.1 5.9 5.7 5.4
Consumer Price Index 6.5 5.6 6.0 5.6 5.3 5.2 5.1(percent change)
If the economy were to grow at only 4 percent per year from fiscalyears 1979 through 1983, current policy receipts would increase by 12percent annually -- from $456 billion in fiscal year 1979 to $722 billion infiscal year 1983. As a share of GNP, receipts would grow from 20 to 22percent. As shown in Table A-2, current policy outlays would grow from
37

49
$493 billion in fiscal year 1979 to $651 billion in fiscal year 1983. As apercent of GNP, outlays would decline from 21 to 20 percent. Theprojections of current policy receipts and outlays demonstrate that, whilethe level of current policy receipts is highly sensitive to the rate of realeconomic growth, the level of current policy outlays changes very little.The sensitivity of receipts exists because of the progressive nature of theindividual income tax; the lack of sensitivity of outlays is the result ofoffsetting changes. Under less vigorous economic growth, the unemploy-ment rate would decline more slowly. Therefore, outlays for programs likeunemployment compensation and various income supplements would behigher than they would be under more optimistic economic assumptions. Thelower inflation rates assumed in Table A-I, however, indicate that projectedcost-of-living increases would be smaller.
TABLE A-2. FIVE-YEAR BUDGET PROJECTIONS, UNDER LESSVIGOROUS ECONOMIC GROWTH: BY FISCAL YEARS, INBILLIONS OF DOLLARS
1978 ProjectionsSecond
Concurrent 1979 1980 1981 1982 1983Resolution
Current Policy Receipts 397.0 456 514 579 648 722Current Policy Outlays 458.25 493 529 565 605 651
Current Policy Margin -61.25 -37 -15 14 43 72Fiscal Drag Offset -- a/ 11 21 41 63 70Deficit (-) or Surplus -61.25 -48 -36 -27 -20 2
a/ It is assumed that the spending ceiling and revenue floor in the secondconcurrent resolution are consistent with the fiscal stimulus needed forthe economy to grow at the rate of 4.8 percent in fiscal year 1978. Ifmore or less fiscal stimulus is required, corresponding adjustmentswould have to be made in the estimates of the fiscal drag offset forfiscal years 1979-1983.
38

50
THE PROJECTED DEFICIT UNDER LESS VIGOROUS ECONOMIC GROWTH
Under current policy assumptions, the receipts the federal govern-ment would be taking out of the economy would rise faster than the outlaysit would be putting back into the economy in the form of wages, purchases,and payments to individuals. The fiscal drag exerted by the federal budgetwould itself tend to reduce economic growth. Consequently, for theeconomic assumptions to be realized, fiscal and monetary policy would, inall likelihood, have to be used to offset the fiscal drag.
As discussed in Chapter 1, if tax cuts or spending increases were usedto offset the restrictive effects of current policy budgets, the size of theoffset would depend on the strength of nonfederal demand. Under the so-called "moderate" scenario for nonfederal demand used in that chapter,approximately $74 billion in tax cuts or spending increases would be requiredby fiscal year 1983 to offset the fiscal drag and keep the economy on thegrowth path. As seen in Table A-2, the current policy margin isapproximately equal to the fiscal drag offset by fiscal year 1983, whichimplies that, under less vigorous economic growth and the moderate scenariofor nonfederal demand, it might be possible to balance the budget by fiscalyear 1983.
39

51
APPENDIX B. ALTERNATIVE SCENARIOS FOR NONFEDERALDEMAND
The so-called "moderate" scenario for nonfederal demand assumed inChapter I and Appendix A represents a plausible set of economic conditionsover the next five years. It is by no means, however, the only possibleoutcome. Expansionary monetary policy or autonomous factors could giverise to a boom in the nonfederal sectors. On the other hand, external shockssuch as an oil embargo or other factors might result in weaker growth innonfederal demand than is assumed for the moderate scenario. Thisappendix provides rough estimates of the effect of alternative assumptionsof nonfederal demand on projections of the deficit.
NONFEDERAL DEMAND: A MORE OPTIMISTIC SCENARIO
As discussed in Chapter I, stronger nonfederal demand would requireless budget stimulus in the form of tax cuts or spending increases to achievethe assumed 4.8 percent growth rate. Table B-I shows the effect of moreoptimistic assumptions of nonfederal demand on the fiscal drag offset. 1/By fiscal year 1983, the offset would be only $64 billion, compared to about$115 billion under the moderate scenario. Because of the smaller fiscal dragoffset, the budget is projected to be in balance by fiscal year 1982, when thecurrent policy margin would be equal to the required offset.
NONFEDERAL DEMAND: A MORE PESSIMISTIC SCENARIO
If nonfederal demand were weaker than in the moderate scenario,larger tax cuts or spending increases would be required to offset fiscal drag.Table B-2 shows the effect of more pessimistic assumptions. aboutnonfederal demand 2/ on the tax cuts and spending increases needed to
1/ For this scenario, the personal saving rate is assumed to average 5.8percent, and the annual growth in real investment to average 8.0percent. The assumed annual increase in real state and localgovernment purchases is 3.5 percent per year and real net exports areassumed to average $3 billion annually.
2/ Under the weaker nonfederal demand scenario, the personal saving rateis assumed to average 6.3 percent, and the annual growth of realinvestment to average 5.6 percent. The assumed growth rate of realstate and local purchases is 2.25 percent annually. Net exports areassumed to be nearly balanced over the five-year period.
40

52
achieve the growth path used in Appendix A. 3/ Under this weakernonfederal demand scenario, the current policy margin would be smallerthan the fiscal drag offset throughout the projection period. The deficitwould remain between $60 and $70 billion between fiscal years 1979 and1983.
TABLE B-1. FIVE-YEAR BUDGET PROJECTIONS, ASSUMING STRONGNONFEDERAL DEMAND: BY FISCAL YEARS, INBILLIONS OF DOLLARS
1978Second Projections
Concurrent 1979 1980 1981 1982 1983Resolution
Current Policy Receipts 397.0 457 519 590 668 751
Current Policy Outlays 458.25 495 529 565 606 655
Current Policy Margin -61.25 -38 -10 25 62 96
Fiscal Drag Offset -- a/ 17 31 46 62 64
Deficit (-) or Surplus -61.25 -55 -41 -21 -- 32
a/ It is assumed that the spending ceiling and revenue floor in the secondconcurrent resolution are consistent with the fiscal stimulus needed forthe economy to grow at the rate of 4.8 percent in fiscal year 1978. Ifmore or less fiscal stimulus is required, corresponding adjustmentswould have to be made in the estimates of the fiscal drag offset forfiscal years 1979-1983.
3/ If nonfederal demand were as weak as in this scenario, it is unlikely thatthe economy would grow at the 4.8 percent rate assumed in Chapter I.Consequently, the results are only reported for the 4.0 percent growthpath used in Appendix A.
41
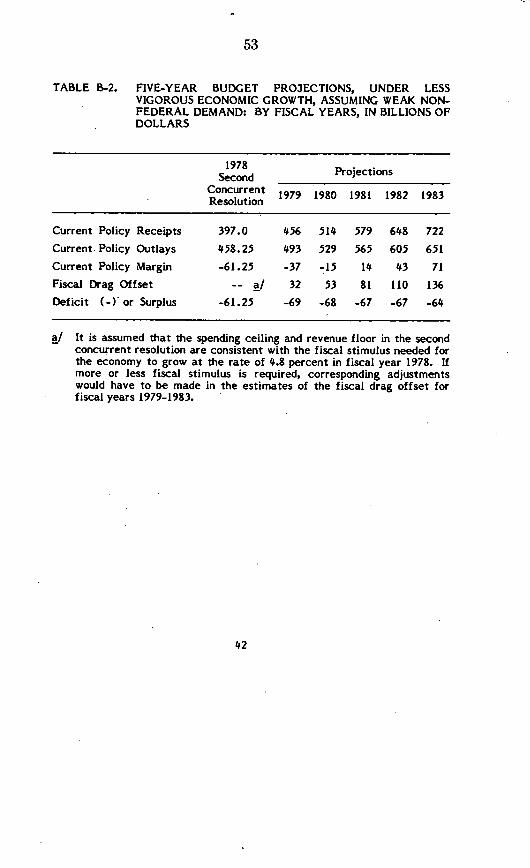
53
TABLE B-2. FIVE-YEAR BUDGET PROJECTIONS, UNDER LESSVIGOROUS ECONOMIC GROWTH, ASSUMING WEAK NON-FEDERAL DEMAND: BY FISCAL YEARS, IN BILLIONS OFDOLLARS
Second ProjectionsConcurrent 1979 1980 1981 1982 1983Resolution
Current Policy Receipts 397.0 456 514 579 648 722Current Policy Outlays 458.25 493 529 565 605 651
Current Policy Margin -61.25 -37 -15 14 43 71Fiscal Drag Offset -- a/ 32 53 81 110 136
Deficit (-) or Surplus -61.25 -69 -68 -67 -67 -64
a! It is assumed that the spending ceiling and revenue floor in the secondconcurrent resolution are consistent with the fiscal stimulus needed forthe economy to grow at the rate of 4.8 percent in fiscal year 1978. Ifmore or less fiscal stimulus is required, corresponding adjustmentswould have to be made in the estimates of the fiscal drag offset forfiscal years 1979-1983.
42

54
APPENDIX C. FEDERAL EXPENDITURES ON A NATIONAL INCOMEACCOUNTS BASIS
The unified budget and the federal sector of the national incomeaccounts (NIA) both measure receipts and expenditures of the federalgovernment. The national income accounts, however, focus on currentincome and production, and are, therefore, the most widely used indicator ofaggregate economic activity.
The distinction between the unified budget and the NIA federal sectorarises principally from netting and grossing differences, coverage dif-ferences, timing differences, and the NIA exclusion of financial trans-actions. Thus, both additions to and subtractions from the unified budgetare required to obtain the national income accounts measure. The federalgovernment's expenditures on a national income accounts basis are dividedinto several categories: defense and nondefense purchases, domestic andforeign transfers, grants-in-aid to state and local governments, domestic andforeign interest, and subsidies less the current surplus of governmententerprises.
DIFFERENCES BETWEEN THE UNIFIED BUDGET AND FEDERALEXPENDITURES ON A NATIONAL INCOME ACCOUNTS BASIS
Since the national income accounts focus on current income andproduction, they exclude transactions such as lending and borrowing that aremerely asset and liability transfers. These activities certainly influenceproduction and income but are not appropriately included in their measure-ment. The interest expended or earned as a result of financial transactionsis, however, included in the NIA under the net interest category.
Just as lending and borrowing are excluded as exchanges of assets, soare bonuses paid on Outer Continental Shelf (OCS) oil leases and thepurchase and sale of land. The unified budget treats OCS bonuses asproprietary receipts which are offset against outlays. This and otherprocedural differences mean that the federal surplus or deficit varies, -
depending on whether it is measured in unified budget or NIA terms.
Other differences between the federal sector of the NIA and theunified budget arise from certain netting and grossing adjustments. All suchadjustments involve the subtraction or addition of identical amounts to-bothunified budget outlays and receipts. Thus, while netting and grossingoperations affect the magnitude of receipts and outlays, they have no
43
55
impact on the surplus or deficit. One example of a grossing adjustmentinvolves government contributions for employee retirement. In the unifiedbudget, these contributions are not reflected in the totals since they areoffset by intragovernmental transactions. In the NIA, however, governmentcontributions for employee retirement are included as part of employeecompensation, a practice comparable to private sector accounting. On theexpenditure side of the budget, these payments fall into nondefensepurchases unless they are made by government enterprises, in which casethey are reflected in the current deficit of government enterprises. On thereceipts side, they are included in contributions for social insurance. Othernetting and grossing items include imputed contributions for social insurancefor unemployment compensation and for workman's compensation, receiptsfrom certain government life insurance programs, and other transactionsthat are more properly classified as budget receipts rather than as budgetexpenditures or offsets to these. Finally, expenditures for the earnedincome tax credit, which appear as negative receipts in the unified budget,are treated as transfers in the NIA.
Timing differences account for another class of adjustments. Exceptfor interest on the public debt (which is recorded on an accrual basis) unifiedbudget outlays are recorded on a cash basis. In the NIA, various timingbases are used. In general, transfers and grants are recorded on a cash basis;interest, subsidies, and the current surplus/deficit of government enterprisesare recorded on an accrual basis; and purchases are recorded on a deliverybasis. Major timing differences occur in the defense area, in which the.unified budget records outlays as they are made but the NIA record them attime of delivery.
Coverage differences comprise a final category of adjustments. Suchdifferences involve the NIA geographical exclusion of transactions withPuerto Rico, the Virgin Islands, and other U. S. territories, and inclusion ofcertain foreign currency transactions not in the budget. Also included hereare transactions of off-budget entities.
For an indication of the magnitude of the various kinds ofadjustments, Table C-I shows adjustment values for 1977 through 1983. 1/
1/ It is important to note that the adjustment categories given inTable C-I are not directly comparable with those given in the Survey ofCurrent Business (SCB). The principal difference arises from themethods used to include the transactions of off-budget entities. TheSCB tables usually reflect total outlays of off-budget entities under"Coverage -- other"; adjustments to these totals then appear in theappropriate categories. The CBO method involves the addition of therelevant off-budget transactions only.
44

56
The projected growth in the adjustments for government contributions isreasonable, since these adjustments are heavily dependent on federal wagelevels. Among other things, the growth in the other netting and grossingcategory reflects a projected increase in rents and royalties from the OuterContinental Shelf, treated in the NIA as budget revenues rather than asoffsets to expenditures. Though the negative adjustment for net lending isprojected to grow, it is important to note that the actual adjustment for agiven year could easily deviate from the expected pattern if loanrepayments or other transactions that have a positive impact upon netlending are higher than anticipated. The adjustment for defense timing isextremely volatile and can be expected to change. Likewise, variations inthe OCS bonuses may occur. Though the "Other" category remainsrelatively stable, it includes two offsetting trends: an increase ingeographical exclusions (a negative impact) and an increase in the estimatedoutlays of off-budget entities, mainly the Postal Service.
TABLE C-I. ADJUSTMENTS BETWEEN THE UNIFIED BUDGET AND FEDERAL EXPENDITURES INNATIONAL INCOME ACCOUNTS: BY FISCAL YEARS, IN BILLIONS OF DOLLARS
1977 Second Current Policy Projections
Resolutrion 1979 1980 1981 1982 1983
Unified Budget Outlays 401.9 458.3 494.8 529.3 564.9 606.1 654.9Lending .and financial transactions -1.7 -4.2 -6.1 -6.9 -7.1 -7.4 -7.5Government contribution to 6 6 7.0 7.7 8.4 9.1 9.9 10.7
employee retirement (grossing)Other netting and grossing 3.3 3.8 4.0 4.4 4.8 5.3 5.9Defense timing adjustment 3.1 0.4 0.3 0.3 0.3 0.3 0.3Bonuses on Outer Continental 1.7 2.0 1.7 1.7 1.9 2.3 1.3
Shelf land leasesOther a/ -2.8 -2.3 -2.2 -2.0 -2.1 -2.0 -1.8
Federal Sector, NIA Expenditures 412.1 465.0 500.2 535.2 571.8 614.4 663.8
a/ Includes nondefense timing adjustments, geographical adjustments, the appropriate transactions ofoff-budget entities, and so forth.
THE CBO NIA MODEL
The CBO national income accounts model is a simple tabulator whichbasically makes adjustments to the unified budget at the account level. Anew feature of this model is a bridge component that enables it to keeptrack of the various reasons behind each adjustment that is made.
45

57
In general, four operations are carried out for each account: (1) anumerical adjustment (a fixed percentage of the unified budget) iscalculated; (2) the adjustment is added or subtracted from the unified budgetnumber to produce outlays on an NIA basis; (3) the resulting NIA number isspread by fixed percentages over the appropriate categories (purchases,transfers, and so forth); and (4) the adjustment is divided by fixedpercentages among the relevant bridge items (lending, netting and grossing,and so forth).
The fixed percentages used in these calculations are based on detailedinformation describing the adjustments and spreads for 1974 and 1975.Wherever possible this adjustment pattern has been updated with theinformation provided in the 1977 and 1978 budget appendix, as well as withinformation from CBO program specialists. Items that are included in theNIA but not in the unified budget are computed by hand.
The basic NIA model has been functioning for slightly over a year; thebridge component was only recently completed. The model has been used totranslate many different "budgets": the President's budget, House andSenate resolutions, and CBO budget estimates. In those instances in whichthe same budget is translated by the Bureau of Economic Analysis (BEA) orthe Office of Management and Budget (OMB), the validity of the CBO modelis measured by -its ability to produce translations that are close to those ofBEA and OMB. In this respect, the model now appears to be operating at arelatively high level of accuracy.
FEDERAL EXPENDITURES, NATIONAL INCOME ACCOUNTS. FISCALYEARS 1978 TO 1983
Table C-2 displays national income account expenditures producedwith the aid of the CBO NIA model. The underlying unified budget numbers,as well as the reconciliation between unified budget and NIA totals, arethose presented in Table C-I. It is important to note that estimates of NIAtotals and their distribution among categories are sensitive to numerouseconomic and budget assumptions. Variations in such assumptions canproduce quite different NIA estimates.
The projected growth in purchases is close to the inflation rate thathas been assumed for the projection period. The projected expenditures fortransfers reflect both inflation and an increase in the number of socialsecurity recipients. The relatively small growth in grants is due to anassumed phaseout of the antirecession programs. The lack of change in thenet interest category is attributable to the assumption that the budgetdeficit will decline during the projection period and the large increase in
46

58
TABLE C-2. ESTIMATES OF FEDERAL EXPENDITURES IN NATIONAL INCOMEACCOUNTS: BY FISCAL YEARS, IN BILLIONS OF DOLLARS
Second Current Policy ProjectionsConcurrent 1979 1980 1981 1982 1983Resolution
Purchases 160.9 172.0 184.7 196.0 211.3 226.7Defense 101.7 109.5 118.4 128.3 138.3 149.0Nondefense 59.2 62.5 66.3 67.7 73.0 77.7
Transfer Payments 183.9 201.3 218.2 238.1 259.2 286.3Domestic 180.6 197.5 214.0 233.7 254.5 281.3Foreign 3.3 3.8 4.2 4.4 4.7 5.0
Grants 78.1 78.0 79.8 81.4 84.6 88.9
Net Interest 33.7 36.6 39.0 40.5 41.7 41.9
Subsidies less Current Surplus 8.4 12.3 13.5 15.8 17.6 19.9Subsidies 7.3 10.3 11.3 13.3 14.7 16.6Less: current surplus -1.1 -2.0 -2.2 -2.5 -2.9 -3.3
TOTAL 465.0 500.2 535.2 571.8 614.4 663.8
subsidies less the current surplus is influenced by, among other things,assumptions about the outlay pattern of the Commodity Credit Corporation,the Postal Service, and housing payments. Clearly, variations in assumptionsabout inflation, the size of the recipient population for transfer programs,the continuation of antirecession programs, and so on, would producesomewhat different estimates than those given in Table C-2.
THE SHORTFALL IN THE NATIONAL INCOME ACCOUNTS
Table C-3 compares BEA's translation of Carter's February budget(also the Third Concurrent Resolution on the Budget for Fiscal Year 1977)with an average of BEA's quarterly translations for fiscal year 1977. Basedon this comparison there has been a significant shortfall in expenditures.This shortfall is most pronounced in transfers and grants, but is also quiteevident in both defense and nondefense purchases.
47

59
TABLE C-3. FISCAL YEAR 1977 SHORTFALL ON A NATIONAL INCOMEACCOUNTS BASIS: IN BILLIONS OF DOLLARS
CarterBudget/ 17
Third Actuals b/ ShortfallConcurrent
Resolution a/
Unified Budget Outlays 417.4 401.9 15.5
NIA Totals 426.3 412.1 14.2
Purchases 145.0 140.9 4.1Defense 94.8 91.9 2.9Nondefense 50.2 49.0 1.2
Transfer Payments 174.5 170.3 4.2Domestic 171.2 167.1 4.1Foreign 3.3 3.2 0.1
Grants 70.3 65.8 4.5
Net Interest 29.1 28.8 0.3
Subsidies less Current Surplus 7.4 6.3 1.1
a/ Numbers taken from U. S. Department of Commerce, Survey of CurrentBusiness, May 1977, p. 2.
b/ This column represents an average of the quarterly translationsprepared by the Bureau of Economic Analysis. Data for the first threequarters of fiscal year 1977 were obtained from the Survey of CurrentBusiness, September 1977, Table 12, p. 12. Data for the final quarterare those that were released October 17, 1977.
48

60
Mrs. RIVLIN. The primary purpose of CBO's current policy pro-jections is to provide a neutral baseline for evaluating the effects ofnew proposals on the long-run size and shape of the budget.
As you know, the projections are estimates for 5 years ahead ofFederal spending and revenues under current policies, adjusted fordenriographic and economic changes in those 5 years.
The impact of new legislation on spending or revenues can beadded to or subtracted from this current policy base. This year, inaddition to estimating the effects of economic change on the budget,CBO has made estimates of the amount of additional spending ortax cuts likely to be required to sustain for 5 years the economicgrowth objectives adopted in the Second Concurrent Resolution onthe Budget for Fiscal Year 1978.
My testimony today will focus on three areas: (1) A summary ofthe GBO current policy projections of receipts and outlays; (2) esti-mates of the tax cuts or spending increases that would likely berequired if the economy were to continue to grow at the rates assumedin the second concurrent resolution; and (3) a brief discussion of how5-year projections might be useful in the formulation of multiyearbudgetary targets.
CURRENT POLICY PROJECTIONS
Economic assumptionsInflation, unemployment, and other levels of economic activity
have a major effect on revenues and outlays; hence, projectionsrequire assumptions about the state of the economy during the pro-jection period.
In the CBO report, "Five-Year Budget Projections: Fiscal Years1979-1983," the major economic assumption is a continuing recoverywith declining unemployment.
The economic assumptions for 1977 and 1978 are taken from theconference report on the second concurrent resolution on the budget.The assumptions for 1979 through 1983 represent an extrapolationof the economic growth objective for 1978 contained in the conferencereport, with real economic growth-as measured by the rate of growthin the gross national product (GNP) in constant dollars-holding atabout 4.8 percent through 1982 and dropping to 3.7 percent in 1983as the unemployment rate reaches 4.5 percent.
The economic assumptions for 1979 through 1983, which are shownin table 1, should be viewed as one of the many possible long-rangetargets for the economy. The rate of growth assumed is optimisticby historical standards, but not unrealistic.
[Table 1 follows:]TABLE 1.-AGGREGATE ECONOMIC ASSUMPTIONS
[By calendar years]
Selected economic variables 1977 1978 1979 1980 1981 1982 1983
Gross national product (GNP):Current dollar GNP (in billions of
dollars) -1,898.0 2,107.0 2,333.8 2,582. 2 2,853.9 3,156. 4 3,465. 2Real GNP (in billions of 1972
dollars) -1,338. 0 1,402. 7 1,467. 9 1,538. 4 1,612.2 1,688.3 1,751.4Growth rateofrealGNP- 5. 0 4.8 4. 7 4. 8 4.8 4. 7 3. 7
Unemployment rate (percent) -7.0 6.5 6. 2 5. 7 5. 2 4. 7 4.5Consumer Pricelndex(percentchange). 6.5 5.6 6.0 5.7 5.5 5. 7 5.9
61
Senator PROXMIRE. Could I interrupt; you said "long-rangetargets."
Mrs. RIVLIN. Yes; I think one could view them as targets.Senator PROXMIRE. Rather than projections of what you would
expect was the realistic likelihood?Mrs. RIVLIN. We are using these as assumptions. We have to
assume something.Senator PROXMIRE. Right.Mrs. RIVLIN. They are fairly optimistic assumptions about what
would happen to the economy and I think could be viewed as targetsfor economic growth.Budget implatu8ns of economic a88umptum8
Under these assumptions, current policy receipts would rise fasterthan outlays. Projected receipts would increase from $457 billion infiscal year 1979 to, $751 billion in 1983. As a percent of GNP, currentpolicy receipts would increase from 20 to 22 percent. Current policyoutlays would rise from $495 billion in fiscal year 1979 to $655 billionin fiscal year 1983, declining from 22 to 19 percent of gross nationalproduct. The disproportionate rise in receipts as compared with out-lays occurs because of the progressive nature of individual incometaxes.
The receipts the Government would be taking out of the economywould thus rise much faster than the outlays it would be puttingback into the economy. in the form of wages, purchases, and paymentsto individuals. Hence, if current policies are followed unchanged duringthe next 5 years, the Federal budget would exert a restrictive in-fluence on the economy. Consequently, for the optimistic assumptionsfor economic growth to be realized, fiscal and monetary policies wouldhave to be used to offset this fiscal drag exerted by the projectedcurrent policy budgets.
PROJECTED FISCAL DRAG OFFSETSI AND DEFICITS
As a new feature of this year's 5-year projections report, estimateshave been included of the approximate amount in tax cuts or spendingincreases that would be needed to offset this fiscal drag.
The size of the needed Federal offset depends, of course, on thestrength of non-Federal demand; namely, consumption, investment,State and local government purchases, and net exports.
Stronger non-Federal demand -would decrease the tax cuts andspending increases needed to achieve the assumed growth path,whereas weaker non-Federal demand would increase the necessaryoffset.
For the 5-year projections reports, CBO assumed a scenario fornon-Federal demand that is moderate by historical standards-stronger than the average of the post-World War II years, but some-what weaker than the peak period of 1961 through 1966.
Using this assumption for non-Federal demand, roughly $115 billionin additional budget stimulus-namely, tax cuts or spending in-creases-would be needed by fiscal year 1983 to offset the fiscal dragimplicit in current policy projections of receipts and outlays.
l"Fiscal drag offset" io defined here as the stimulus needed to achieve the desired eco-nomic goals, given non-Federal demands.

62
In order to determine what projected Federal budget deficit orsurplus is consistent with realization of the economic assumptions,this $115 billion that is needed to offset the fiscal drag and achieveeconomic goals must be compared with the current policy margin,which is the amount generated by the excess of current policy receiptsover outlays.
As long as the fiscal drag offset is greater than the current policymargin the budget is projected.. to remain in deficit. As shown intable 2, this would happen throughout the 5-year period under themoderate assumption about non-Federal demand. By fiscal year 1983,the projected deficit would have declined to about $19 billion, but thebudget would still not be in balance.
[Table 2 follows:]TABLE 2-5-YEAR BUDGET PROJECTIONS
{By fiscal years; in billions of dollars)
1978 2d Projectionsconcurrent
resolution 1979 1980 1981 1982 1983
Current policy receipts -397.0 457 519 590 668 751Current policy outlays -458.25 495 529 565 606 655Current policy margin -- 61. 25 -38 -10 25 62 96Fiscal drag offset -() 29 51 74 101 115Deficits (-) or surplus -- 61.25 -67 -61 -49 -39 -19
X It is assumed that the spending ceiling and revenue floor in the 2d concurrent resolution are consistent with thefiscal stimulus needed for the economy to grow at the rate of 4.8 percent in fiscal year 1978. If more or less fiscal stimulusis required, corresponding adjustments would have to be made in the estimates of the fiscal drag offset for fiscal years1979-83.
Mrs. RIVLIN. The scenario just described is a plausible one, but itcertainly is not the only possible outcome. If a sustained businessinvestment boom developed, either spontaneously or in response toexpansionary monetary policy, or if growth in economic activity inthe rest of the world stimulated U.S. exports, the need to offset thefiscal drag would be smaller and the budget deficit would decline morerapidly.
Fror example, using more optimistic assumptions about non-Federaldemand, comparable to the kind experienced in the early 1960's, therequired fiscal drag offset would equal the current policy margin byfiscal year 1982-which means the budget would be balanced by thatdate.
On the other hand, if non-Federal demand were to grow veryslowly, more expansionary policies and an increasing -budget deficitmight be needed to reach the assumed output and unemploymentgoals.
For example, under weaker assumptions about non-Federal demand,it might take deficits of $60 billion to $70 billion through fiscal year1983 just to sustain a 4-percent economic growth rate.
MULTIYEAR TARGETING
As you know, budget resolutions are now adopted- by the Congressfor 1 year at a time. Since a large part of any given year's budget isdetermined by decisions made in prior years,. the Congress-in eachyear is faced with a budget largely composed of spending and receiptsthat have not been subject to review within an integrated framework.

63
As part of its responsibility under section 502(c) of the CongressionalBudget Act of 1974, CBO conducted a study on the feasibility andadvisability of advancing all or some budget decisions so that, insteadof making them just before the start of a fiscal year, they could bemade at least 12 months in advance.
In that study, CBO recommended that the Congress begin for-mulating advance budget targets, with the eventual goal of annuallyadopting targets not only for the budget year, but for the 4 followingyears.
Projections like those found in the report are a useful baseline onwhich to build plans for future spending and receipts. In addition,estimates of the budget stimulus needed to offset fiscal drag providea rough idea of how much room will be available for net increases inspending or tax reductions, under various economic assumptions.
Several key questions are involved in setting multiyear targets.What are the goals for the economy and for the deficit? How muchshould be allocated for tax cuts or spending increases? What shouldbe the level for Federal spending and receipts as a percent of GNP?
The CBO 5-year-projections report suggests that an unemploymentrate of 4.5 percent and a deficit of about $19 billion might be achievedby fiscal year 1983, assuming an accommodative monetary policy andslightly above average performance for the non-Federal sectors of theeconomy.
In order to balance the budget by fiscal year 1983, however, theperformance of the non-Federal sectors would have to be stronger thanthat.
On the other hand, if the initial assumptions about non-Federaldemand were borne out, but a more optimistic goal was set for unem-ployment rates, the budget stimulus required would be greater thanthat estimated here, and the budget deficit would decline more slowly.
In addition to setting goals for the economy and the deficit, theCongress might want to set goals for the level of spending or for thelevel of receipts in relation to the economy.
For example, the Congress might set as a goal the maintenance of aspecified level of Federal spending as a percent of GNP. At present,spending is 21.2 percent of potential GNP-defined as the value of thegross national product if the economy were at a 4.5 percent unemploy-ment rate-but current policy projections show the Federal Govern-ment's share of potential GNP falling to 19.3 percent by fiscal year1983.
If the Congress were to set as a goal the maintenance of the current21.2 percent Federal share, a sizable part of the fiscal drag offsetalluded to earlier would have to be used for spending increases.
As an alternative to maintaining the current Federal share of poten-tial GNP, however, the Federal income tax system might be indexed,so that effective rates of taxes would not rise because of inflation.
This would cut taxes below current policy from year to year,because the progressive income tax system implicit in current policyhas a more than proportional response to inflation.
As a result, indexing would commit a portion of the fiscal dragoffset for these automatic tax cuts. The remainder would be availableeither for further tax cuts or for spending increases.
The most important decisions in a multiyear targeting processinvolve program needs and costs. Current policy projections of outlays
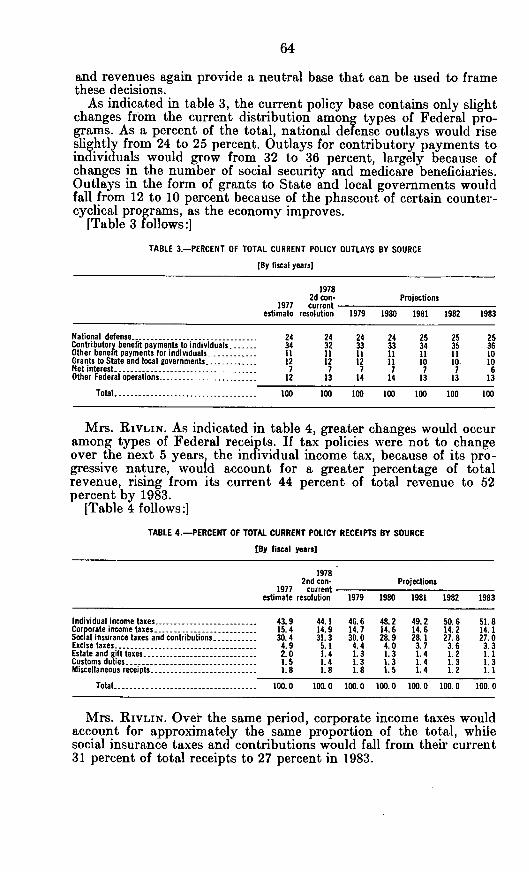
64
and revenues again provide a neutral base that can be used to framethese decisions.
As indicated in table 3, the current policy base contains only slightchanges from the current distribution amon types of Federal pro-grams. As a percent of the total, national defense outlays would riseslightly from 24 to 25 percent. Outlays for contributory payments toindividuals would grow from 32 to 36 percent, largely because ofchanges in the number of social security and medicare beneficiaries.Outlays in the form of grants to State and local governments wouldfall from 12 to 10 percent because of the phaseout of certain counter-cyclical programs, as the economy improves.
[Table 3 follows:]
TABLE 3.-PERCENT OF TOTAL CURRENT POLICY OUTLAYS BY SOURCE
[By fiscal yearsl
19782d con- Projections
1977 currentestimate resolution 1979 1980 1981 1982 1983
National defense -24 24 24 24 25 25 25Contributory benefit payments to individuals 34 32 33 33 34 35 36Other benefit payments for individuals -11 11 11 11 11 11 10Grants to State and local governments -12 12 12 11 10 10 10Net interest -,.- 7 7 7 7 7 7 6Other Federal operations -12 13 14 14 13 13 13
Total- - 100 100 100 100 100 100 100
Mrs. RIVLIN. As indicated in table 4, greater changes would occuramong types of Federal receipts. If tax policies were not to changeover the next 5 years, the individual income tax, because of its pro-gressive nature, would account for a greater percentage of totalrevenue, rising from its current 44 percent of total revenue to 52percent by 1983.
[Table 4 follows:]
TABLE 4.-PERCENT OF TOTAL CURRENT POLICY RECEIPTS BY SOURCE
[By fiscal years]
19782nd con- Projections
1977 currentestimate resolution 1979 1980 1981 1982 1983
Individual income taxes -43.9 44.1 46.6 48.2 49.2 50.6 51. 8Corporate income taxes -15.4 14.9 14.7 14.6 14.6 14.2 14.1Social insurance taxes and contributions -30.4 31.3 30.0 28.9 28.1 27.8 27. 0Excise taxes.------------------_ 4.9 5.1 4.4 4.0 3. 7 3.6 3. 3Estate and gift taxes 2.0 1. 4 1.3 1.3 1.4 1. 2 1.ICustoms duties . . 1. 5 1.4 1.3 1. 3 1.4 1.3 1. 3Miscellaneous receipts 1. 8 1.8 1. 8 1. 5 1.4 1. 2 1. 1
Total ------------------------- 100.0 100.0 100.0 100.0 100.0 100.0 100. 0
Mrs. RIVLIN. Over the same period, corporate income taxes wouldaccount for approximately the same proportion of the total, whilesocial insurance taxes and contributions would fall from their current31 percent of total receipts to 27 percent in 1983.
65
If pending social security legislation were enacted, however, theshare of total receipts that are for social insurance taxes and contribu-tions would decline very little.
The Congress, of course, has the option of modifying the currentpolicy base. Program changes that range from welfare reform tonational health insurance to energy legislation could, if enacted,significantly change the balance among types of programs.
In addition, each of the three major tax categories is a likely objectof significant revision over the next 5 years. Changes in social securitytaxes are currently before the Congress and modifications of theincome tax structure that could involve such issues as the integrationof corporate and individual income taxes and incentives for capitalformation will probably come before the Congress within the nextfew years.
These individual program changes will be debated within thecontext of, and will affect, other congressional goals-such as achievingfull employment, reducing or controlling inflation, achieving a givenmagnitude of Federal effort, and producing a balanced budget.
A hard fact is that in only the most optimistic scenario of non-Federal demand will the Congress be able to achieve all its desiredeconomic and budgetary goals. Consequently, the Congress will haveto face hard tradeoffs among program goals, full employment, and abalanced budget.
Although such choices probably cannot be avoided, the Congres-sional Budget Office believes that they can best be addressed in anadvanced targeting framework.
Thank you, Senator Proxmire.Senator PROXMIRE. Thank you, Mrs. Rivlin.I think this is a very, very helpful statement for giving us a realistic
framework within which to act on economic policies.You said when I interrupted you that you thought this might be
regarded as a target as well as a projection. I presume the 4.5-percentunemployment rate, as I said in my opening statement, is a fairly op-timistic target.
I think on the basis of our most recent experience we would behappy with that. But I cannot understand how we can possiblyjustify a 6-percent inflation as any kind of a target.
It seems to me that that would be a real failure if we have that5 or 6 years from now. How do you explain that 6-percent level?
Mrs. RIVLIN. No one thinks that 6-percent inflation is desirable.The reason we have assumed 6 percent in this projection is that webelieve that, unfortunately, the level of 6 percent is probably con-sistent with achieving a 4.5-percent unemployment rate by 1983.
Inflation, as you know Senator Proxmire, has proved extremelyintractable. Once we have it, it is very hard to get rid of it. An optimistabout inflation is one who thinks it won't get much worse. That isabout what we are saying here-that the 5 to 6 percent that we havebeen experiencing over the last couple of years will not, in our view,necessarily accelerate as we move to 4.5 percent unemployment.
Senator PROXMIRE. Then you are saying that there is in fact atradeoff, whether we like it or not; if we are going to try to reduceinflation, we are going to have to settle for a higher level of unem-ployment; if we are going to try to reduce unemployment moresharply, we will have to settle for a higher rate of inflation.

66
The Phillips curve is still true in spite of our recent experienceof the last couple years which seem to give us both high rates ofinflation and high levels of unemployment?
Mrs. RIvLIN. Yes; we are saying that, Senator Proxmire. There isa great deal of uncertainty about this relationship, but we do believethat certainly in extreme cases, if we were to move faster on the growthrate, say, to get a 4-percent unemployment rate in 5 years or gobelow that, that there would be costs in terms of inflation. Suchgrowth would accelerate, to some extent, the inflation rate.
Senator PROXMIRE. Well, now, the Humphrey-Hawkins bill saystwo things. I want to ask you, incidently, what that would do tothese projections if we enact the Humphrey-Hawkins bill.
No. 1, it sets a target of 4 percent unemployment. I am not sure ofthat; maybe you can tell me about the timetable-is that 4 percentunemployment within 5 years? Is that the projection?
Mrs. RIVLIN. By 1983, yes. It is the same time frame that we aretalking about.
Senator PROXMIRE. That is a half percent below what you have.Mrs. RIvLIN. That is right.Senator PROXMIRE. Are you saying, then, if we should pass the
Humphrey-Hawkins bill, that on the basis of realistic assumptions, weshould expect to have an inflation rate of higher than 6 percent,maybe 7 percent, something like that?
Mrs. RIvLIN. It would certainly add somewhat to inflationarypressure.
Senator PROXMIRE. Supposing we should adopt-I am thinkingvery seriously of putting in an amendment to the Humphrey-Hawkinsbill that would set a specific numerical target for inflation as well as foremployment.
I want to be realistic about it; at the same time, I think you couldargue very strongly and you could probably get support in -the Con-gress, including the Senate Banking Committee, for a 2- or 3-percent target for unemployment in 5 years.
But, you are saying if you do that, you are going to have to eithernot achieve it, or if you do achieve it, probably have a very high levelof unemployment.
Mrs. RIVLIN. Of inflation; yes. It depends, of course, on how youdo it. And there would be some measures, such as increased publicemployment, that would have less inflationary effect than achievingthe higher growth rate for economic policy.
Senator PROXMIRE. The Humphrey-Hawkins bill in all fairness,while it sets a level of unemployment, it also intends to do everythingit could to achieve price stability. So assume you follow policies thatare just as noninflationary as you can consistent with the reductionof unemployment.
Mrs. RIVLIN. Then, what would happen to inflation?Senator PROXMIRE. Right.Mrs. RIVLIN. I think, consistent with our projections, one would
certainly worry that the inflation rate would escalate above 6 percentas you moved below the 4.5-percent unemployment.
Senator PROXMIRE. Now, you also have in your statement theargument that on the basis of the assumptions, which you say arerelatively optimistic, we will have a $19 billion deficit in 1983.
Mrs. RIVLIN. Approximately.

67
Senator PROXMIRE. But with somewhat more optimistic assump-tions you could have a balanced budget in 1983 or 1982; is that right?
Mrs. RIVLIN. Yes.Senator PROXMIRE. Now the President has indicated that his
goal is to achieve a balanced budget in 1981. He now seems to indicatethat that is not a commitment but a goal, if not a dream.
Mrs. RIVLIN. I don't think he has said 1981 very recently, Senator.Senator PROXMIRE. I guess he keeps moving that year up. It is like
Arthur Burns' attempt to justify achievement of a specific target forincreasing the money supply. He forgets about what has been done inthe preceding few months and keeps pushing it up.
But 1981 was certainly the asserted goal a few months ago. It wouldbe interesting to hear whether you would say 1981 is at all practical orpossible to achieve with a level of unemployment of, say, 5.5 or 6percent?
Mrs. RIVLIN. We think it would be very difficult to achieve abalanced budget by 1981 on the growth path that we have projected.
Senator PROXMIRE. What kind of growth path would you need?You said "very difficult."
How could you achieve a balanced budget by 1981?Mrs. RIVLIN. By 1981. One would have to have sustained growth
of over 5 percent to achieve that by 1981. That would imply that thenon-Federal sectors, the private sector, State and local governments,would have to be extraordinarily strong, way above historical averagesand even somewhat above our report's optimistic scenario for non-Federal demand.
Senator PROXMIRE. Has there ever been a time in our economichistory that you can recall when after having had a period of a coupleyears of recovery, I guess it is a couple years now, a little more thanthat now, I guess, it started in the spring of 1975, this is the fall of1977, about 2Y2 years of recovery; has there ever been a period whenwe have had that sustained growth at the level you are talking aboutthat would give us a balanced budget by 1981?
Mrs. RIVLIN. We came quite close in the early 1960's; 1961 to 1966was a sustained period of high growth. If we could match that again,we would come close to balancing the budget by 1981. But we wouldhave to do even a little better than was done in the 1960's.
Senator PROXMIRE. We would have to do even better than we havedone with the best record we have ever had to balance the budget by1981?
Mrs. RIVLIN. Yes; we would.Senator PROXMIRE. Are there any anti-inflation policies that would
not increase unemployment that you think ought to be considered?Mrs. RIVLIN. No one has easy answers to inflation. There are a
variety of possibilities. Some form of incomes policy or wage-pricecontrol would be the first thing one would think about.
Senator PROXMIRE. Well, the administration apparently is firmlycommitted against wage-price controls or income policies, I under-stand. Let's rule that out.
What is next?Mrs. RIVLIN. What is next, I think, would be a variety of attempts
on the part of the Federal Government to mitigate inflation. Cer-tainly lowering payroll taxes would have that effect. Not increasingthe minimum wage would have an anti-inflationary effect.

68
Senator PROXMIRE. Well, that is in place, that has been signedinto law.
Mrs. RIVLIN. That is right.Senator PROXMIRE. So we know that will be in the law for 3 or 4
years.Mrs. RIVLIN. I don't have a ready-made kit of tools for doing this
once one rules out some of the more obvious things.Senator PROXMIRE. You have the Wallich proposal and the Okum
proposal, both of which would rely on the tax system to encourageemployers to hold down wages and to hold down prices.
Mrs. RIVLIN. Yes, those are interesting proposals, I think.Senator PROXMIRE. Put into the framework projected here, would
they in your view give us a better tradeoff of unemployment toinflation?
Mrs. RIVLIN. Yes; they are in a sense a form of incomes policyin which one would use the Federal tax system to give incentives tokeep wages and prices from increasing as rapidly as they have been.If they were to work; yes, they would mitigate inflation.
Senator PROXMIRE. All right.Mrs. RIVLIN. Another possibility along the same lines has been the
suggestion of using Federal incentives to encourage State and localgovernments to cut their sales taxes which would also have an anti-inflationary effect.
Senator PROXMIRE. Can you give some numerical notion of howimportant these would be? To what extent in your view would thatkind of policy providing a corporation income tax incentive, forinstance, of a reduction or increase, an increase if they increased priceand a reduction if they decreased them-what are the limits of policiesof that kind or of the kind that Arthur Okun is suggesting; or thesales tax proposals?
Are they pretty marginal? Do they give us less than one-half of 1percent less inflation, something of that kind; or are they somethingthat would be rather sharp and clear?
Mrs. RIVLIN. No one knows, Senator. These are new proposals withwhich there is no experience. It is difficult to estimate how effectivethey would be and we have not focused on these proposals in anydetail.
Clearly, if one could hold the increase in wages-Senator PROXMIRE. There is no experience in any other country
with that kind of policy? It is completely untried; is that right?Mrs. RIVLIN. There is experience with incomes policy--Senator PROXMIRE. Oh, no, no, I know there is with incomes policy
including experience here. I am talking about experience with a taxaction that would provide a tax incentive for holding down pricesand holding down wages.
Mrs. RIVLIN. I don't know of any direct experience, but there maybe some.
Senator PROXMIRE. Do your colleagues know of any?[Negative response.]Senator PROXMIRE. If unemployment were achieved such as is
called for in the Humphrey-Hawkins bill, if 4 percent were to bereached; what would be the difference in gross national product andgross receipts given your present projections?

69
Mrs. RIVLIN. If unemployment were to come down to 4 percent by1983, which is consistent with the Humphrey-Hawkins target, wewould then estimate that current policy receipts would be $760 billion,and current policy outlays would be $654 billion. That would give us-without anything else happening-a surplus of $106 billion. But onewould not expect to achieve that, since the drag on the economywould be considerable, and we estimate that in order to get to thosetargets, one would need a deficit by that year of about $40 billion.
Senator PROXMIRE. So, you would have to either spend more, taxless, or both, in order to achieve that?
Mrs. RIVLIN. That is right.Senator PROXMIRE. So you would have a deficit even with unem-
ployment of 4 percent?Mrs. RIVLIN. To get to the 4 percent unemployment, you would
have to use the Federal budget in a stimulatory manner. We are alsoassuming a moderate performance on the part of the non-Federalsector.
Senator PROXMIRE. Right.Let me ask you, how good are these 5-year projections really?Mrs. RIVLIN. What an unfair question!Senator PROXMIRE. Are they a mechanical arithmetical projection?
Maybe you can tell me. I have my own feelings about their beinguseful but I would like to hear your feeling about it.
Are there advantages in them to businessmen, the public, are theylikely to be misleading, possibly more misleading than they are worth?Or how do you justify them?
Mrs. RIVLIN. I think there is a basic dilemma for decisionmaking.It is very difficult to look ahead and predict accurately the perform-ance of anything as complicated as the U.S. economy. Any set ofprojections, even a year ahead, is quite likely to be wrong and wehave had experience over the last several years that would certainlybear that out.
On the other hand, it is important to look ahead and to see whatthe various possibilities are and these sets of projections, I think, givea framework for decisionmaking in the sense that they try to outlinethe conditions under which various things would ha ppen.
They tell you roughly what would happen to the Federal budget ifthe economy performs in a certain way; and how much stimuluswould be necessary through the Federal budget to bring about thegrowth path that is desired. We cannot claim that they are absolutelyaccurate or even approximately accurate but they do give the dimen-sions of the problem with which you are dealing.
Senator PROXMIRE. Let me ask you this: I understand we are inabout the third generation of econometric models in making projec-tions and they have been going on for 15 years or something like that.
Can you give me an idea of how accurate they have been and arethey getting more accurate; what is the range of error?
Mrs. RIVLIN. In general terms, I think certainly, they are gettingmore accurate. On the other hand, the world economy has made itextremely difficult to test that proposition in the last several years.One cannot expect econometric models of the U.S. economy to forecastsuch events as the Arabs raising oil prices, the weather, and otheroutside activities. All they can do is to tell you, when you get those
70
outside shocks to the economy, approximately what can you expectfrom them.
Senator PROXMIRE. I understand, I wouldn't expect them to beaccurate and I think there are all kinds of reasons why they shouldn'tbe.
Nevertheless, as a matter of fact, I would like to know how accuratethey have been.
Mrs. RIVLIN. What I am saying is that, when you are dealing ina world where there are these outside kinds of shocks, it is difficultto say what would have happened if you had not had them.
Senator PROXMIRE. Can you tell me, for instance, how badly dis-torted they were by the tremendous, completely unforeseen develop-ment in oil prices in 1973, 1974, 1975, and 1976?
What happened to the projections then? Were they off by anenormous factor? Was inflation much higher than expected?
Mrs. RIVLIN. There was no way that the models could have pre-dicted that. That is not a test of the models. Certainly, inflation wasmuch higher in 1973 and 1974 than would have been predicted byany model.
Senator PROXMIRE. CTn you find a period when they were accurate?Mrs. RIVLIN. Oh, sue. The 1960's models did pretty well, and
through certainly part If the 1970's, looking at the short run, theprojections have been fairly accurate, once one is given the outsideshocks that occurred.
Senator PROXMIRE. can recall in the last 15 or 20 years thatthere was a long pe od when Congress reduced the' President'sproposals for budget authority. I remembei Lyndon Johnson, whenhe was the majority leader, used to get up on the floor almost every-day and chided Senator Dirksen saying the Democrats were muchbetter economizers, much more careful about spending money, helddown spending much more than the President and he used to raisethe dickens about President Eisenhower being so extravagant andwasteful in spending.
But, as a matter of fact, Congress, for one reason or another didhold down or reduce Presidential proposals for new budget authority.
Now, under the Budget Act, Congress is going the other direction.They have exceeded the President's requests for spending.
Do you have any reason to determine whether in the first placemy cbseivation is accurate; in the second place, if it is accurate, is ita good thing or a bad thing?
Mrs. RIVLIN. It is substantially accurate over a period of theBudget Act or over the last 3 years. The congressionally enactedbudgets have been slightly higher than the Presidential proposals.I would not venture a comment on whether it was a good thing or abad thing. The Congressional Budget Office, as you know, does notmake recommendations oi take policy positions.
Senator PROXMIRE. Do you think that the Federal Reserve Boardshould be included in the budget process, in the receipts and expendi-tures examined by Congress through the budget and appropriationsprocess?
Mrs. RIVLIN. I don't really have a view on that, Senator. I think itis part of the whole discussion about-the independence of the FederalReserve and would change the nature of the relationship betweenCongress and the Federal Reserve.
71
Senator PROXMIRE. They spend about $700 million a year, theyhandle as you know over $6 billion, and what they don't spend revertsto the Treasury. I should say $7 billion is what they earn, comes in.And it is beyond me why that shouldn't be included.
But you say you have no opinion?Mrs. RIVLIN. It seems to me to be part of the discussion of the
independence of the Fed but not necessarily the most important part.The important part is how the Congress would exert control overmonetary policy itself.
Senator PROXMIRE. I cannot understand how understanding wherethe money goes would put Congress in a position to affect monetarypolicy one way or the other.
Now, you say that the income system might be indexed. You takeall the fun out of being a Senator. [Laughter.] And out of being aMember of Congress. Concerning inflation, the one thing we can dothat we are sure is pretty popular is cut taxes. If you index that youtake that away from us.
Mrs. RIVLIN. Right.Senator PROXMIRE. We have an automatic reason every election
year to reduce taxes and I doubt if Congress is going to go along withthat kind of recommendation.
Mrs. RIVLIN. You took away some of the fun from yourselves whenyou indexed the social security benefits. [Laughter.]
Senator PROXMIRE. Well, nobody is perfect. [Laughter.] I want tobe sure I fully understand the sensitivity of these long-range projec-tions. As I read your report, you said, first, it assumes the spendinglevels contained in the second concurrent resolution as a base; andsecondly, these spending levels are probably too high.
Using a current outlay estimate of $450 billion and deducting the$6 billion to $8 billion spending shortfall which many indicate islikely, fiscal year 1978 expenditures could be about $443 billion, $15billion below the target levels set in the second concurrent resolution.
Using this lower estimate as a base for 5-year projections andassuming your estimate annual increase of 7.3 percent, expenditureswould be roughly $23 billion below your estimate by 1983.
Do you follow my arithmetic?Mrs. RIVLIN. Those numbers seem to be too low. The spending level
in the second concurrent resolution is $458 billion. We believe it couldcome under that by $3 billion to $5 billion so that it might be that thetotal would be $450 billion. But the numbers you were giving seemunrealistic to me.
Senator PROXMIRE. Well, as I figured it, the reasoning is as I didit. You can modify my assumptions by that comment, if you wish;it could mean that an additional budget stimulus-you discuss $120billion by 1983-would be too low by roughly $25 billion.
This is using your optimistic assumptions about the strength ofrivate demand. You say that is not correct, it would be somewhat
fess than $25 billion; is that correct?Mrs. RIVLIN. Yes. Let me ask if Mr. Capra would like to answer
that question.Senator PROXMIRE. Go ahead, Mr. Capra.Mr. CAPRA. The report discusses a possible shortfall of $6 billion
to $8 billion. If you took the rates of increase we are talking about,that $6 billion to $8 billion inflates to about $12 billion by 1983 so I

7.2
think that the number, at least by my computations here, would bearound $12 billion or $13 billion.
So, that would be $12 billion or $13 billion, as you pointed out,Senator, of additional stimulus that would be needed under the as-sumptions we are using.
Senator PROXMIRE. Not $25 billion but $8 to $12 billion.Mr. CAPRA.. Right.Senator PROXMIRE. A second assumption is that the current social
security law remains in effect. Yet you say that the legislation nowunder consideration would increase taxes by $23 billion to $26 billionby 1983.
Now, combining the $8 billion to $12 billion spending reduction toa lower 1978 base with a $23 billion to $26 billion social security taxincrease means that the fiscal stimulus needed by 1983 could easilybe some $40 billion more than you estimated; is that correct?
What is your comment on that?Mrs. RIVLIN. Again, from what Mr. Capra just said, that is sub-
stantially correct. We do believe that an additional $23 billion to$26 billion would be needed to offset the fiscal drag, the restrictiveeffect of social security tax increases.
Senator PROXMIRE. NoW, all of this is, of course, assuming stronggrowth in non-Federal demand. If the scenario of weaker non-Federaldemand occurs, weaker demand, I figured $186 billion, maybe thatshould be $175 billion, would be necessary by 1983, yet the unem-ployment rate would remain at about 5.5 percent.
Do you follow that?Mrs. RIVLIN. That is right. Under the weaker assumptions about
non-Federal demand the picture looks bleak.Senator PROXMIRE. I am surprised to find no discussion of monetary
policy in your description of the economic path which underlies yourprojections. Surely that will play a role in any projection of thestrength of non-Federal demand.
Could you describe in general terms how money is handled in theseprojections? Specifically, what growth rate in M-1 is necessary toachieve your target of 4.5 percent unemployment?
Mrs. RIVLIN. You are correct, Senator, we did not make explicitassumptions about monetary policy. We have made assumptions aboutthe strength of non-Federal demand. The moderate assumptionassumes a rather sustained investment growth at a real rate of about7 percent, and the optimistic scenario assumes an 8-percent sustainedinvestment growth. Now, both of those imply, especially the mostoptimistic, an accommodative policy in the amount of-
Senator PROXMIRE. A what monetary policy?Mrs. RIVLIN. An accommodative monetary policy. It assumes that
the Federal Reserve would act to keep interest rates from rising,otherwise I think one would not expect-
Senator PROXMIRE. Do you have any idea what that would mean?Would that mean an increase in the money supply of 5 percent, 6 per-cent, or 7 percent?
Mrs. RIVLIN. We did not attempt to specify that.Senator PROXMIRE. What level of long-term interest rates do you
assume for that?Mrs. RIVLIN. Let me see if we have those.
73
We can supply those for the record, Senator.Senator PROXMIRE. We would like to get that.[The following information was subsequently supplied for the
record :]Long-term assumed interest rates, by calendar year
Calendar year: Moodles rate1977 7-& 011978 -8. 081979-83-8. 1 3
Senator PROXMIRE. It is interesting to hear and good to hear yourrecognition that monetary policy would play a siNcant role in theseareas.
Mrs. RIVLIN. Oh, it would. Monetary policy would be one of themost important determinants of the strength of non-Federal demand.And, clearly, it would take an expansionary monetary policy toachieve the optimistic non-Federal demand scenario or even a mod-erate one.
Senator PROXMIRE. Incidentally, are you familiar with a study,and I just read about it the other day. This is a study of some 200years of experience in England which indicated-I just made a noteof it-the study by Robert Schiller and Jeremy Seagull, published, ofall places, by the University of Chicago, which has been monetarist,but this is criticizing the monetarist view.
They say that using some 250 years of interest rate and price datafrom Britain torpedos the idea that interest rates fluctuate onlybecause of the expected rate of inflation.
The Schiller-Seagull analysis indicates easier money will not simplypush up prices but will spur economic growth.
That is the thesis that the nonmonetarists, I take it, have assumed.They recognize that, of course, there is some inflationary effect, butthere is also a considerable effect on economic growth.
I take it you espouse that view?Mrs. RIVLIN. Yes- I have not only seen that study but I think
monetarists and fiscaiists are coming together these days and there isa widespread view that monetary policy does affect the economy, notjust through prices alone.
Senator PROXMIRE. Now, if growth in 1978 is weaker than youforecast, necessitating a more expansive policy than that containedin the second concurrent resolution, what would you regard as appro-priate behavior by the Federal Reserve Board?
Mrs. RIVLIN. I hesitate to prescribe to the Federal Reserve Boardbut, presumably, if the economy comes in weaker than we have allassumed, then both a more expansionary fiscal policy and a moreexpansionary monetary policy would be in order to reach the targetsthat are desired.
Senator PROXMIRE. A footnote in this paper says that it is assumedthat the spending ceiling and revenue floor in the second concurrentresolution are consistent with the fiscal stimulus needed for the econ-omy to ow at a rate of 4.8 percent in fiscal 1978.
I would like to discuss the validity of that assumption. I know inour midyear report, the Joint Economic Committee forecasts a rateof 4 to 4.5 percent assuming spending levels in the second concurrentresolution.

74
It now appears that actual spending will be below the level of thesecond resolution. This causes me to question the validity of yourbasic assumption.
First, you regard your basic assumption as a reasonable one;would you forecast real growth at 4.8 percent next year?
Mrs. RIVLIN. For 1978?Senator PROXMIRE. That is right.Mrs. RIVLIN. Yes. We still think it is within a realistic range, the
"not improbable" range.Senator PROXMIRE. It is pretty high compared to the other fore-
casts. Mr. Burns told us 4.5 percent; the consensus of forecasts seemsto be around 4.5 percent, in the higher range at least.
Mrs. RIVLIN. That is correct. And the signals that the economyare giving right now can only be described as mixed. The last fewweeks have been a little bit stronger on some fronts than was thought,and I think until we see the end of the year's statistics-and what ishappening early in 1978, it would be very difficult to say.whether thisis realistic or not.
Senator PROXMIRE. If the economy moves to be much weaker nextyear, what impact will this. have on your budget projections, andeconomic stimulus needed to reach the 4.5-percent unemploymenttarget by 1983?
Mrs. RIVLIN. If the economy proves weaker, more stimulus willbe needed over the whole period to reach those goals.
Senator PROXMIRE. Now, President Carter has indicated he will askfor a substantial tax reduction early next year. This might becomeeffective on July 1, and it would, therefore, have some impact in1978 and 1979.
Do you consider a tax reduction desirable?Mrs. RIVLIN. A tax reduction is clearly one way to provide more
stimulus if you think more stimulus is needed.Senator PROXMIRE. It's one way; it is also a quicker way, many
people feel, than the spending route. My question again is, wouldyou view that as a desirable thing?
You simply tell me you cannot say if you feel that that is desirable.Mrs. RIVLIN. No; I really cannot make a policy recommendation,
Senator. We don't do that.Senator PROXMIRE. Well, can you give me any notion of the effects
of dividing that between consumers and businesses, supposing it alLgoes to consumers on the other hand, or supposing a quarter of it or asubstantial portion of it, a third of it, might go to business.
Would that have any effect inr your view on the stimulative effectof the tax cut?
I am not asking you to recommend one or the other; I am justsaying, what would the effect be?
Mrs. RIVLIN. I think we probably would have to think about thata little bit.
The most problematical part is what would be the effect onbusinesses, and that, of course, depends on what kind of a businesstax cut it is.
The objective presumably would be to stimulate investment,and not a lot is known about how to do that through the tax system.

75
Increases in the investment tax credit have had some effect in thepast, particularly temporary increases.
I think a corporate profits tax cut is likely to be less effective instimulating investment than some other things that I can think of,especially an investment tax credit.
Senator PROXMIRE. How should the monetary authorities respondto a tax reduction on the assumption they wanted to make that fullyeffective?
Mrs. RIVLIN. Assuming that the monetary authorities and thefiscal authorities have the same goal, which is a higher growth ratefor the economy, and if the economy is weakening, then one wouldthink the same reasoning that would lead the fiscal authorities to morestimulus would lead the monetary authorities to an easier monetarypolicy.
Senator PROXMIRE. Would you agree that if the Chairman of theFederal Reserve Board should take the notion that inflation is moreimportant to fight, and, therefore, have a restrictive policy, while thePresident of the United States and the Congress feel it is importantto stimulate the economy and provide more jobs, that the two policiesmay well clash and result in neutralizing each other?
Mrs. RIVLIN. That is certainly possible.Senator PROXMIRE. Now, your discussion stresses the need for
additional fiscal stimulus to achieve the target of 4.5 percent unem-ployment by 1983.
The discussion implies that either spending increases above currentpolicy levels or tax reductions can provide the necessary stimulus.
Do you mean to imply that it does not matter whether spendingincreases or taxes cut, would the impact on the deficit be the same?What about the types of spending increases or tax cut?
For example, some argue that over the long. run we need moreinvestment and tax cuts should, therefore, be directed to encouragethis. If this is true surely it will affect the non-Federal demand whichplaces such an important role in your projections.Mrs RIVINThat'is rcprjectonsMrs. RIVLIN. That is certainly correct. We are deriving verygeneral estimates here of stimulus, and we are assuming that, in thelarge, the effects would be the same. But it certainly makes a differencein how one carries out the stimulus.
If one is thinking, for instance, on how to achieve an optimisticlevel of non-Federal demand, then besides monetary policies, onemight consider what tax measures would stimulate investment. Atax policy more stimulative to investment for the same amount oftax cut might be able more likely to give you an optimistic scenario.
Senator PROXMIRE. In your projections, the baseline case shows theamount of fiscal stimulus needed to reach the growth target growsfrom $29 billion in 1979 to $115 in 1983.
Mrs. RIVLIN. Right.Senator PROXMIRE. Can you tell us the impact of this policy on
full employment budget? Can you provide full employment budgetsometimes on a current policy basis?
Mrs. RIVLIN. Yes; I guess we can. We can do that for the record.[The following information was subsequently supplied for the
record:]

76
ESTIMATES OF A CURRENT POLICY FULL EMPLOYMENT BUDGET
IBy fiscal years; in billionsl
1977 1978 1979 1980 1981 1982 1983
Receipts -396.1 439.1 496.4 551.0 612.9 681.2 760.9Outlays - 403.1 456.4 494.7 531.7 570. 3 614. 4 663.8
Surplus -- 7.0 -17.3 1.6 19.2 42.6 66.8 97. 1
Senator PROXMIRE. Your report characterizes the growth in non-Federal demand as moderate. I note that you have a very brief dis-cussion of a stronger non-Federal sector in an appendix.
Given the current situation with very low investment for the pastseveral years, it seems to me you would have been justified in makinga more optimistic assumption in this area.
Certainly it is not unreasonable to explore the implications of astronger private sector over the next several years.
Why and how did you select this scenario particularly?Mrs. RIVLIN. The moderate scenario was our major point.Senator PROXMIRE. But why did you think that to be more realistic
under all the circumstances?. Mrs. RIVLIN. It just seemed less extreme. One might reason thatbecause investment has been lagging in this recovery, there is.hopethat it will pick up and be extraordinarily strong in the next severalyears.
On the other hand, one might reason that the factors that have beencausing investment to lag, perhaps lack of confidence in the economyor other factors, would be likely to continue.
I don't know which is the more likely scenario, but we chose thismoderate scenario, which is moderately optimistic, after all, and isroughly consistent with historical averages and is, therefore, a usefulbaseline. We then offered calculations based on a more optimistic orless optimistic scenario.
Senator PROXMIRE. On Friday, the head of the Bureau of LaborStatistics testified before this committee and he pointed out severalreally startling developments to me.
One was that we have had a 3.9-million increase in jobs in the lastyear; second that that was the biggest increase in our history by far inany year; third, that we have had the highest proportion of the Ameri-can people at work than we have ever had, higher than in 1929-higher than in World War II, higher than any time-a higher pro-portion of the population is at work.
Now, the element that we have left out of this discussion so far isthat when you talk about unemployment at 4.5 percent, you have tomake an assumption of the size of the work force, and people cominginto the work force, and so forth.
There have been great, great changes in the last 20 years, particu-larly in the last year or two in the work force.
Now, with the kind of expansion which we have had, which Mr.Shiskin called the best we have ever had, that kind of expansion, nor-mally you would have had a sharp reduction in unemployment.
As you know, between April and November, there was no reductionat all. It has been 7 percent-6.9 to 7.1 percent.
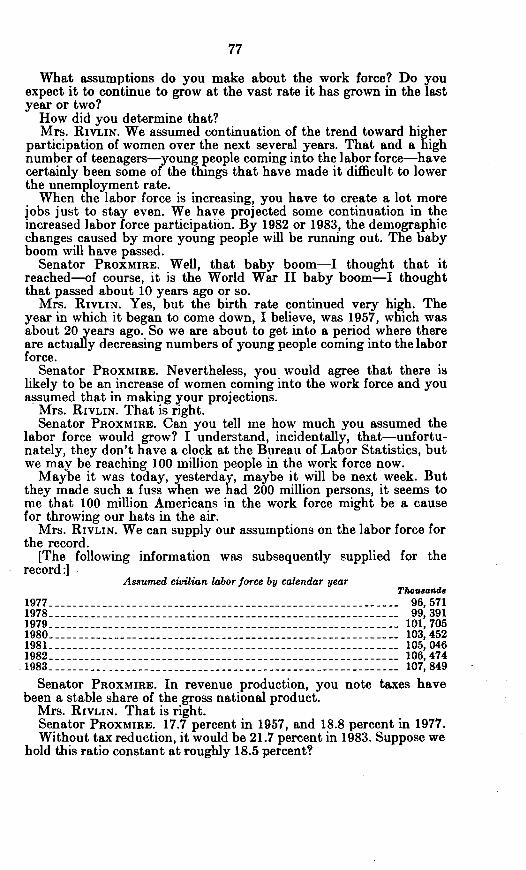
77
What assumptions do you make about the work force? Do youexpect it to continue to grow at the vast rate it has grown in the lastyear or two?
How did you determine that?Mrs. RIVLIN. We assumed continuation of the trend toward higher
participation of women over the next several years. That and a highnumber of teenagers-young people coming into the l abor force-havecertainly been some of the things that have made it difficult to lowerthe unemployment rate.
When the labor force is increasing, you have to create a lot morejobs just to stay even. We have projected some continuation in theincreased labor force participation. By 1982 or 1983, the demographicchanges caused by more young people will be running out. The babyboom will have passed.
Senator PROXMIRE. Well, that baby boom-I thought that itreached-of course, it is the World War II baby boom-I thoughtthat passed about 10 years ago or so.
Mrs. RIVLIN. Yes, but the birth rate continued very high. Theyear in which it began to come down, I believe, was 1957, which wasabout 20 years ago. So we are about to get into a period where thereare actually decreasing numbers of young people coming into the laborforce.
Senator PROXMIRE. Nevertheless, you would agree that there islikely to be an increase of women coming into the work force and youassumed that in making your projections.
Mrs. RIVLIN. That is right.Senator PROXMIRE. Can you tell me how much you assumed the
labor force would grow? I understand, incidentally, that-unfortu-nately, they don't have a clock at the Bureau of Labor Statistics, butwe may be reaching 100 million people in the work force now.
Maybe it was today, yesterday, maybe it will be next week. Butthey made such a fuss when we had 200 million persons, it seems tome that 100 million Americans in the work force might be a causefor throwing our hats in the air.
Mrs. RIVLIN. We can supply our assumptions on the labor force forthe record.
[The following information was subsequently supplied for therecord :]
Assumed civilian labor force by calendar yearTwhouwanda
1977 - 96,5711978 - 99,3911979 - 101,7051980 -_-------------------- 103,4521981 -- 105,0461982 - 106,4741983 ----- 107,849
Senator PROXMIRE. In revenue production, you note taxes havebeen a stable share of the gross national product.
Mrs. RIVLIN. That is right.Senator PROXMIRE. 17.7 percent in 1957, and 18.8 percent in 1977.Without tax reduction, it would be 21.7 percent in 1983. Suppose we
hold this ratio constant at roughly 18.5 percent?

78
Would this alone provide the amount of stimulus which you estimate-- is necessary to reach your underlying growth targets or would we need
to do more?Mrs. RIVLIN. Yes; I think that provides more than enough simdu-
lant.Senator PROXMIRE. More than enough stimulus?Mrs. RIVLIN. Yes.Senator PROXMIRE. At what rate would you feel we have a stimulus
that would give us no shortfall? You had $115 billion needed for thatmuch additional stimulus by 1983, but those were with the assump-tions I take it that we have a higher percentage of income going intaxes.
Can you tell me at what level you would need any further stimulusas a level of taxes? What percentage?
Mrs. RIVLIN. We can do that calculation for the record.Senator PROXMIRE. All right.[The following information was subsequently supplied for the
record:]
REVENUES AS A PERCENT OF GNP, ASSUMING REQUIRED STIMULUS COMES FROM TAX CUTS
[By fiscal years; in billions!
1978 1979 1980 1981 1982 1983
Current policy revenues - 397.0 457 519 590 668 751Tax cuts (cumulative) - -29 51 74 101 115
Net revenues -397. 0 428 468 516 567 636
GNP -2, 056.6 2, 273.8 2, 518.6 2, 782.8 3, 079.2 3, 386. 5Net revenues as a percent of GNP -19.3 18.8 18.6 18.5 18.4 18.8
Senator PROXMIRE. I see they broke your deadline in the Washing-ton Star today, "Hill Gets Bleak Jobs, Budget Picture." You willhave to change your name to "Cassandra."
No, I think you have done an excellent job, very helpful andrealistic and most timely for our committee and for the Congress andfor the public policy.
I think it is going to be extremely helpful having this picture.Thank you, very much. The committee will stand adjourned.Mrs. RIVLIN. Thank you very much.[Whereupon, at 11:08 a.m., the committee adjourned, subject to
the call of the Chair.]0