flooding in the guadalupe river basin at new braunfels texas
TRANSCRIPT
FLOODING IN THE GUADALUPE RIVER BASIN
AT NEW BRAUNFELS, TEXAS
Ashley Evans
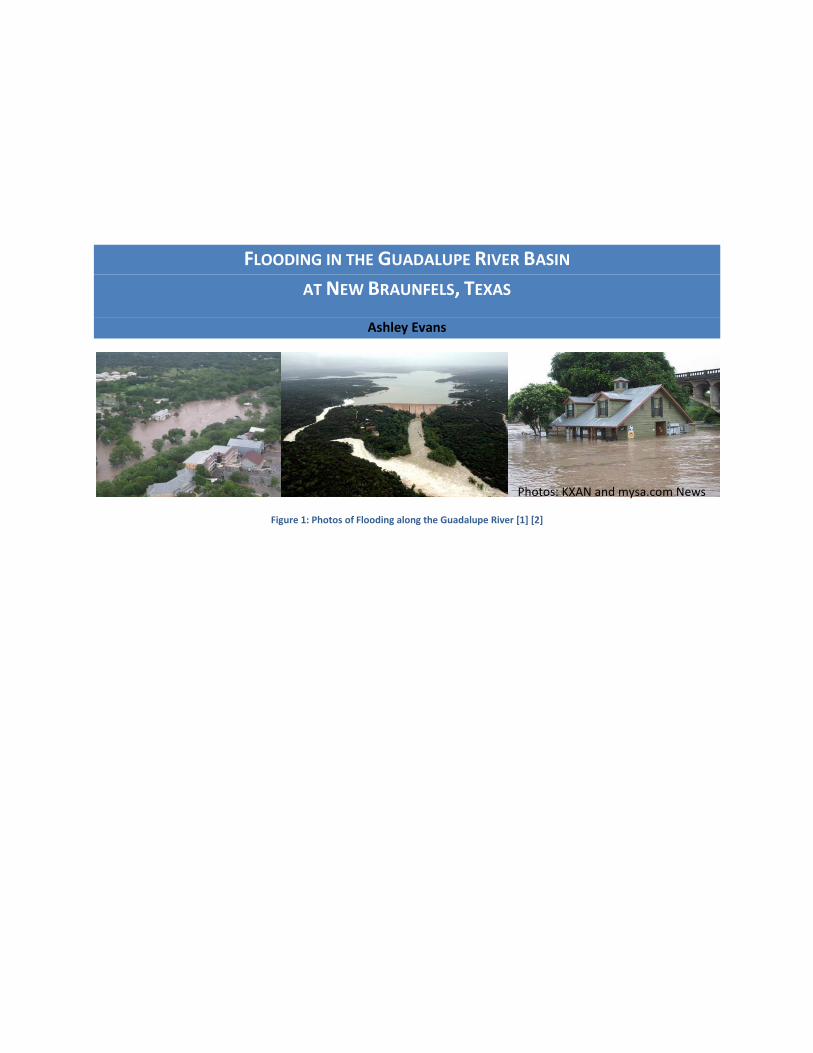
Figure 1: Photos of Flooding along the Guadalupe River [1] [2]
Photos: KXAN and mysa.com News
2
CONTENTS
Table of Figures ......................................................................................................................................................... 3
Table of Tables ........................................................................................................................................................... 4
Introduction ................................................................................................................................................................... 5
Basemap ........................................................................................................................................................................ 6
Digital Elevation Model (DEM) ...................................................................................................................................... 7
Streamflow Data ............................................................................................................................................................ 9
1998 Flood ................................................................................................................................................................... 10
2002 Flood ................................................................................................................................................................... 15
2002 Flood Phenomenon – The Canyon Lake Gorge ............................................................................................... 20
Floodplains................................................................................................................................................................... 22
Turbidity Data .............................................................................................................................................................. 27
Conclusions .................................................................................................................................................................. 27
Data Sources ................................................................................................................................................................ 28
Works Cited ................................................................................................................................................................. 29
3
TABLE OF FIGURES
Figure 1: Photos of Flooding along the Guadalupe River [1] [2] .................................................................................... 1
Figure 2: Guadalupe River Basin .................................................................................................................................... 6
Figure 3: USGS Gages in Comal County ......................................................................................................................... 7
Figure 4: Digital Elevation Model (DEM)........................................................................................................................ 8
Figure 5: UGSG Streamflow Data at New Braunfels, Sattler and Spring Branch ........................................................... 9
Figure 6: USGS Mean Gage Height Data at New Braunfels, Sattler, and Spring Branch ................................................ 9
Figure 7: Streamflow Data Surrounding the 1998 Flood. ............................................................................................ 10
Figure 8: Lake Storage Data During the 1998 Flood .................................................................................................... 10
Figure 9: Precipitation over the 1998 Flood in New Braunfels .................................................................................... 11
Figure 10: National Weather Service Precipitation Data for October 18, 1998 .......................................................... 12
Figure 11: Total Rainfall for the 1998 Flood ................................................................................................................ 12
Figure 12: Hourly Precipitation at 12PM on 10/17/1998 ............................................................................................ 13
Figure 13: Hourly Precipitation at 6PM on 10/17/1998 .............................................................................................. 13
Figure 14: Hourly Precipitation at 12AM on 10/18/1998 ............................................................................................ 14
Figure 15: Hourly Precipitation at 6 AM on 10/18/1998 ............................................................................................. 14
Figure 16: Hourly Precipitation at 12PM on 10/18/1998 ............................................................................................ 14
Figure 17: Hourly Precipitation at 6PM on 10/18/1998 .............................................................................................. 15
Figure 18: Streamflow Data Surrounding the 2002 Flood ........................................................................................... 16
Figure 19: Lake Storage During the 2002 Flood ........................................................................................................... 16
Figure 20: Precipitation over the 2002 Flood in New Braunfels .................................................................................. 17
Figure 21: Total Rainfall for the 2002 Flood ................................................................................................................ 17
Figure 22: Daily Precipitation on July 1, 2002 .............................................................................................................. 18
Figure 23: Daily Precipitation on July 2, 2002 .............................................................................................................. 18
Figure 24: Daily Precipitation on July 3, 2002 .............................................................................................................. 18
Figure 25: Daily Precipitation on July 4, 2002 .............................................................................................................. 19
Figure 26: Daily Precipitation on July 5, 2002 .............................................................................................................. 19
4
Figure 27: Daily Precipitation on July 6, 2002 .............................................................................................................. 19
Figure 28: Canyon Lake Gorge: Before and After the 2002 Flood [11] ........................................................................ 21
Figure 29: DEM and Imagery at the Canyon Lake Gorge ............................................................................................. 21
Figure 30: Corpscon Input and Output for Each Stream Gage Datum......................................................................... 22
Figure 31: 1998 Floodplain at Spring Branch (Upstream of Canyon Lake) .................................................................. 24
Figure 32: 2002 Floodplains at Spring Branch (Upstream of Canyon Lake) ................................................................. 24
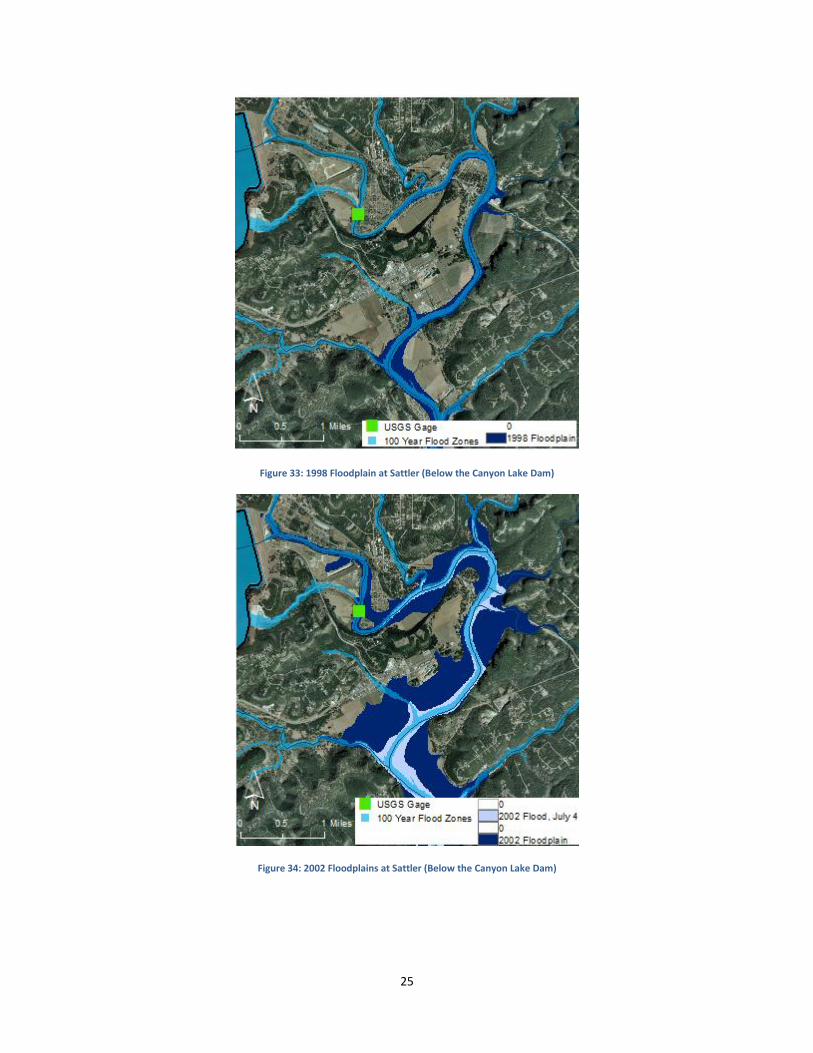
Figure 33: 1998 Floodplain at Sattler (Below the Canyon Lake Dam) ......................................................................... 25
Figure 34: 2002 Floodplains at Sattler (Below the Canyon Lake Dam) ........................................................................ 25
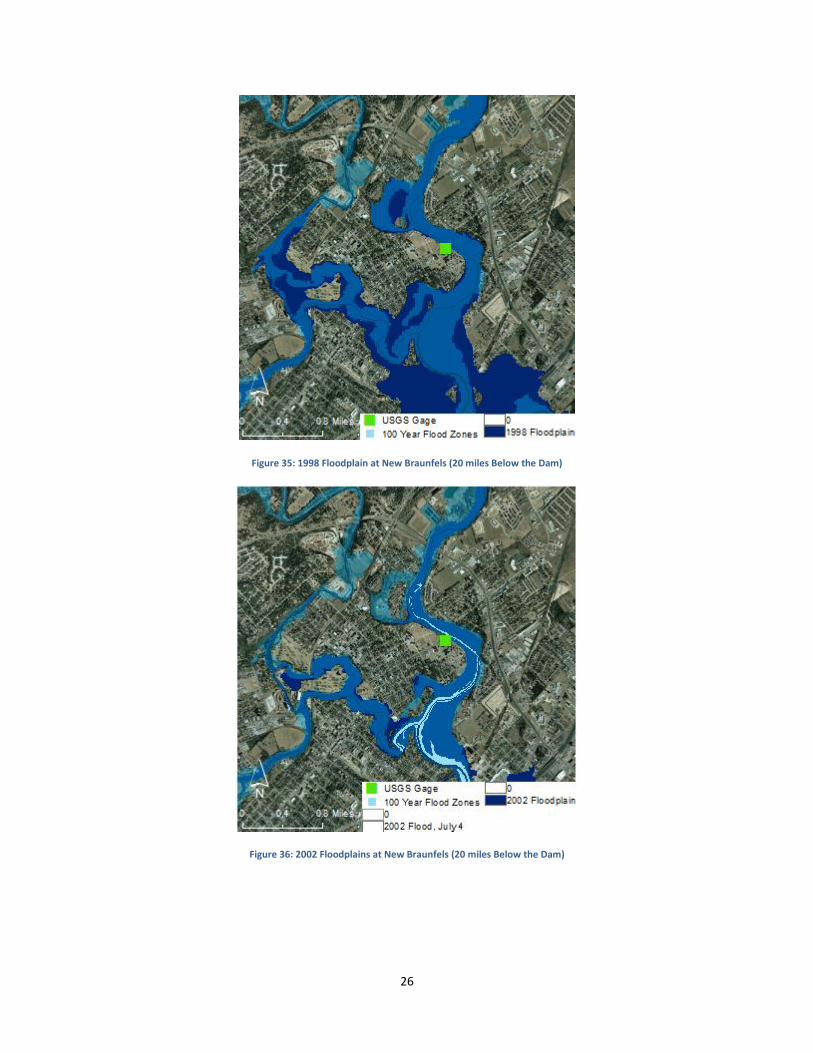
Figure 35: 1998 Floodplain at New Braunfels (20 miles Below the Dam) ................................................................... 26
Figure 36: 2002 Floodplains at New Braunfels (20 miles Below the Dam) .................................................................. 26
Figure 37: Comparison of the 1998 and 2002 Floods .................................................................................................. 27
TABLE OF TABLES
Table 1: 1998 and 2002 Flood Facts .............................................................................................................................. 5
Table 2: USGS Flood Gage Height Data........................................................................................................................ 23
5
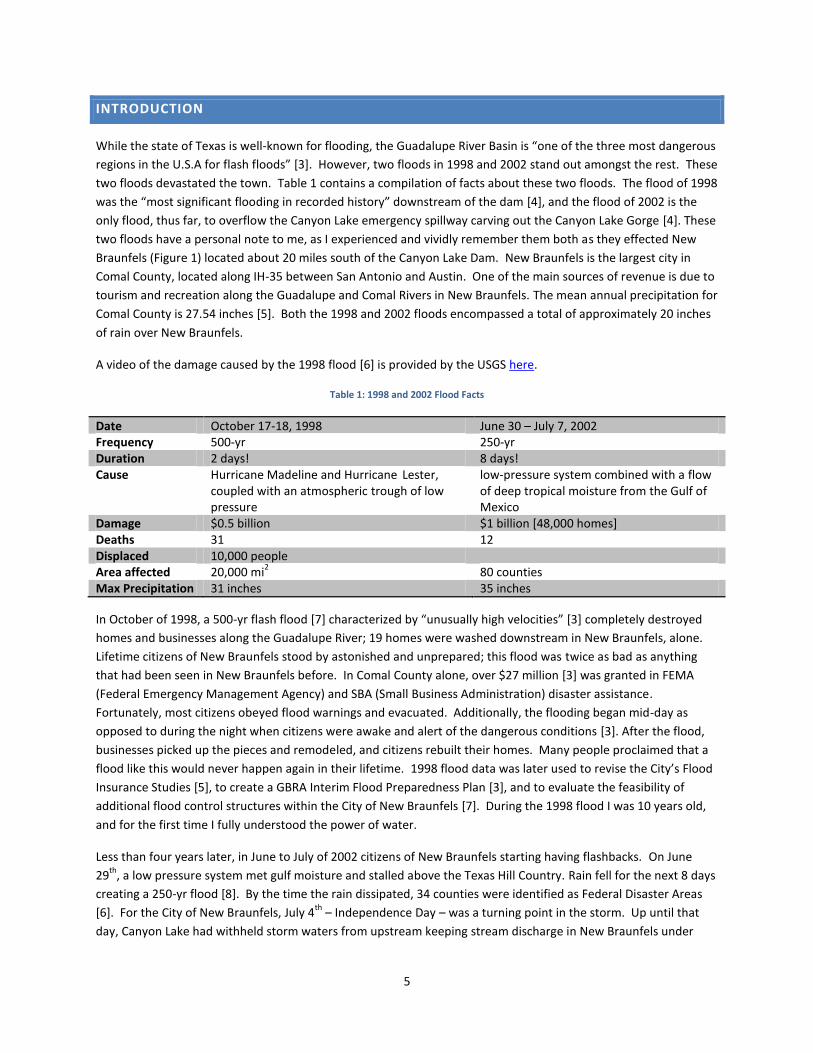
INTRODUCTION
While the state of Texas is well-known for flooding, the Guadalupe River Basin is “one of the three most dangerous
regions in the U.S.A for flash floods” [3]. However, two floods in 1998 and 2002 stand out amongst the rest. These
two floods devastated the town. Table 1 contains a compilation of facts about these two floods. The flood of 1998
was the “most significant flooding in recorded history” downstream of the dam [4], and the flood of 2002 is the
only flood, thus far, to overflow the Canyon Lake emergency spillway carving out the Canyon Lake Gorge [4]. These
two floods have a personal note to me, as I experienced and vividly remember them both as they effected New
Braunfels (Figure 1) located about 20 miles south of the Canyon Lake Dam. New Braunfels is the largest city in
Comal County, located along IH-35 between San Antonio and Austin. One of the main sources of revenue is due to
tourism and recreation along the Guadalupe and Comal Rivers in New Braunfels. The mean annual precipitation for
Comal County is 27.54 inches [5]. Both the 1998 and 2002 floods encompassed a total of approximately 20 inches
of rain over New Braunfels.
A video of the damage caused by the 1998 flood [6] is provided by the USGS here.
Table 1: 1998 and 2002 Flood Facts
Date October 17-18, 1998 June 30 – July 7, 2002 Frequency 500-yr 250-yr Duration 2 days! 8 days! Cause Hurricane Madeline and Hurricane Lester,
coupled with an atmospheric trough of low pressure
low-pressure system combined with a flow of deep tropical moisture from the Gulf of Mexico
Damage $0.5 billion $1 billion [48,000 homes] Deaths 31 12 Displaced 10,000 people Area affected 20,000 mi
2 80 counties
Max Precipitation 31 inches 35 inches
In October of 1998, a 500-yr flash flood [7] characterized by “unusually high velocities” [3] completely destroyed
homes and businesses along the Guadalupe River; 19 homes were washed downstream in New Braunfels, alone.
Lifetime citizens of New Braunfels stood by astonished and unprepared; this flood was twice as bad as anything
that had been seen in New Braunfels before. In Comal County alone, over $27 million [3] was granted in FEMA
(Federal Emergency Management Agency) and SBA (Small Business Administration) disaster assistance.
Fortunately, most citizens obeyed flood warnings and evacuated. Additionally, the flooding began mid-day as
opposed to during the night when citizens were awake and alert of the dangerous conditions [3]. After the flood,
businesses picked up the pieces and remodeled, and citizens rebuilt their homes. Many people proclaimed that a
flood like this would never happen again in their lifetime. 1998 flood data was later used to revise the City’s Flood
Insurance Studies [5], to create a GBRA Interim Flood Preparedness Plan [3], and to evaluate the feasibility of
additional flood control structures within the City of New Braunfels [7]. During the 1998 flood I was 10 years old,
and for the first time I fully understood the power of water.
Less than four years later, in June to July of 2002 citizens of New Braunfels starting having flashbacks. On June
29th
, a low pressure system met gulf moisture and stalled above the Texas Hill Country. Rain fell for the next 8 days
creating a 250-yr flood [8]. By the time the rain dissipated, 34 counties were identified as Federal Disaster Areas
[6]. For the City of New Braunfels, July 4th
– Independence Day – was a turning point in the storm. Up until that
day, Canyon Lake had withheld storm waters from upstream keeping stream discharge in New Braunfels under
6
control. However, at 3:30 PM on July 4th
, the spillway overtopped with flood waters 7 ft above the spillway. Less
than 24 hours later, by 10 AM on July 5th
, 850,000 yd3 had been eroded below the spillway creating a new gorge
along the water path [8]. Citizens again listened to warnings and heeded evacuation notices early on July 4th
.
Fortunately, the longer duration of this storm allowed for more predictability and warning than the 1998 flood.
Nevertheless, it was just as, or maybe even more, tragic. Homes were again washed downstream and businesses
were again flooded.
The objective of this report is to use ArcGIS as a tool to analyze and compare these two floods. Streamflow, gage
height, lake storage, and precipitation data were used to illustrate the differences between these two traumatic
storm events. Additionally, this hydrologic data was used to demonstrate the role of Canyon Lake as a flood
control device in these two floods.
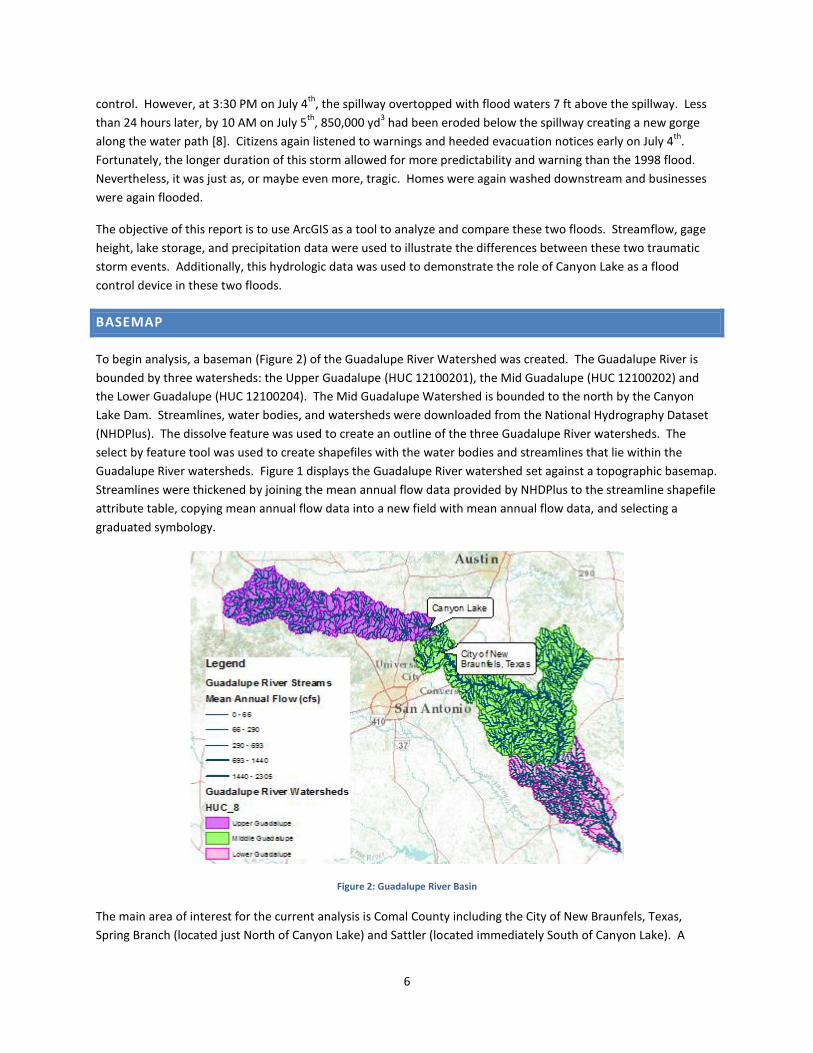
BASEMAP
To begin analysis, a baseman (Figure 2) of the Guadalupe River Watershed was created. The Guadalupe River is
bounded by three watersheds: the Upper Guadalupe (HUC 12100201), the Mid Guadalupe (HUC 12100202) and
the Lower Guadalupe (HUC 12100204). The Mid Guadalupe Watershed is bounded to the north by the Canyon
Lake Dam. Streamlines, water bodies, and watersheds were downloaded from the National Hydrography Dataset
(NHDPlus). The dissolve feature was used to create an outline of the three Guadalupe River watersheds. The
select by feature tool was used to create shapefiles with the water bodies and streamlines that lie within the
Guadalupe River watersheds. Figure 1 displays the Guadalupe River watershed set against a topographic basemap.
Streamlines were thickened by joining the mean annual flow data provided by NHDPlus to the streamline shapefile
attribute table, copying mean annual flow data into a new field with mean annual flow data, and selecting a
graduated symbology.
Figure 2: Guadalupe River Basin
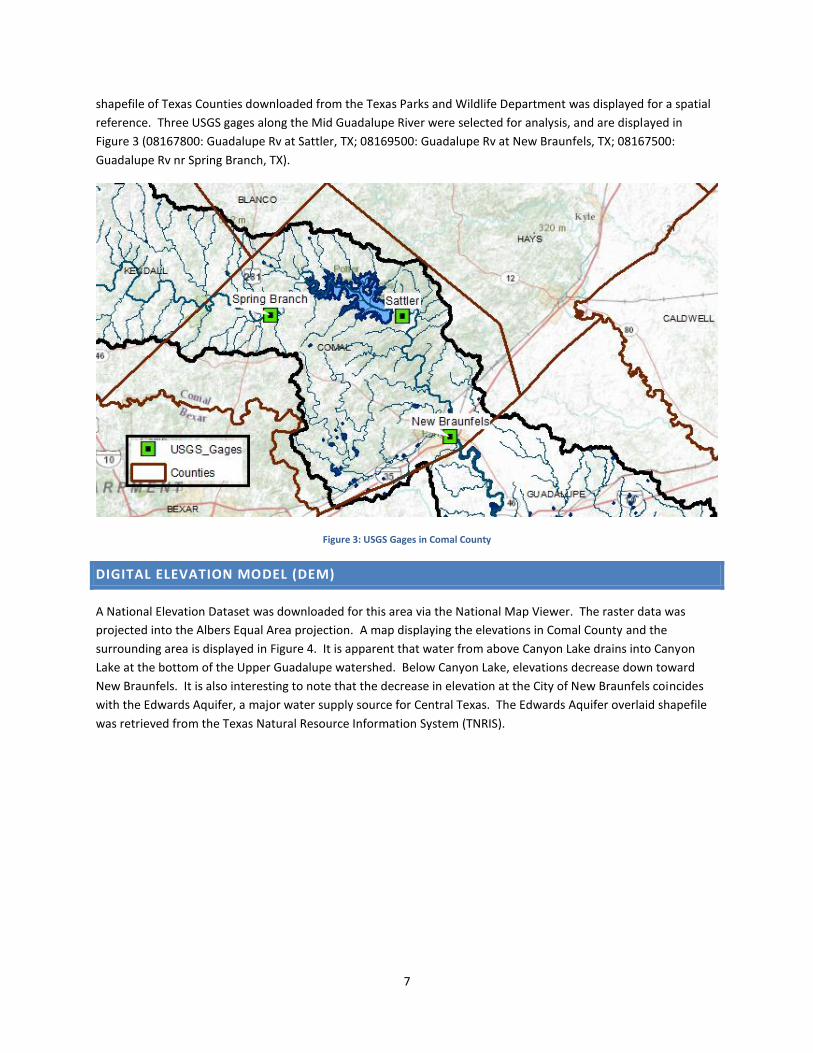
The main area of interest for the current analysis is Comal County including the City of New Braunfels, Texas,
Spring Branch (located just North of Canyon Lake) and Sattler (located immediately South of Canyon Lake). A
7
shapefile of Texas Counties downloaded from the Texas Parks and Wildlife Department was displayed for a spatial
reference. Three USGS gages along the Mid Guadalupe River were selected for analysis, and are displayed in
Figure 3 (08167800: Guadalupe Rv at Sattler, TX; 08169500: Guadalupe Rv at New Braunfels, TX; 08167500:
Guadalupe Rv nr Spring Branch, TX).
Figure 3: USGS Gages in Comal County
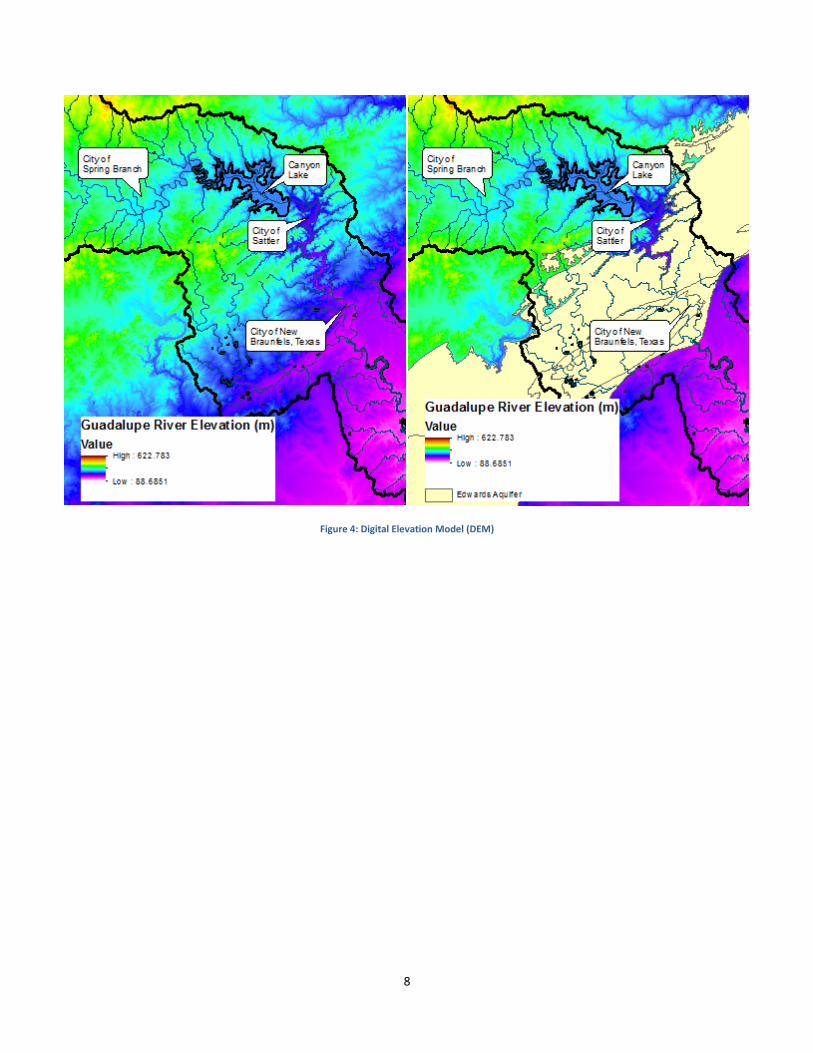
DIGITAL ELEVATION MODEL (DEM)
A National Elevation Dataset was downloaded for this area via the National Map Viewer. The raster data was
projected into the Albers Equal Area projection. A map displaying the elevations in Comal County and the
surrounding area is displayed in Figure 4. It is apparent that water from above Canyon Lake drains into Canyon
Lake at the bottom of the Upper Guadalupe watershed. Below Canyon Lake, elevations decrease down toward
New Braunfels. It is also interesting to note that the decrease in elevation at the City of New Braunfels coincides
with the Edwards Aquifer, a major water supply source for Central Texas. The Edwards Aquifer overlaid shapefile
was retrieved from the Texas Natural Resource Information System (TNRIS).
8
Figure 4: Digital Elevation Model (DEM)
9
STREAMFLOW DATA
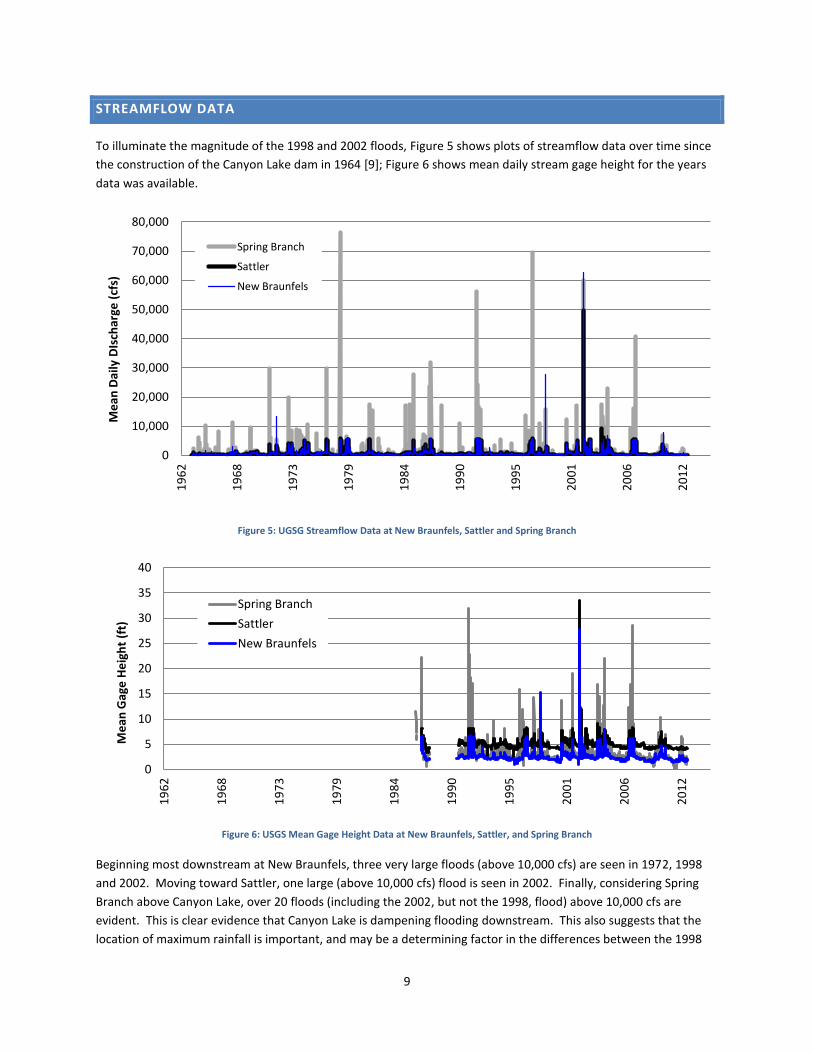
To illuminate the magnitude of the 1998 and 2002 floods, Figure 5 shows plots of streamflow data over time since
the construction of the Canyon Lake dam in 1964 [9]; Figure 6 shows mean daily stream gage height for the years
data was available.
Figure 5: UGSG Streamflow Data at New Braunfels, Sattler and Spring Branch
Figure 6: USGS Mean Gage Height Data at New Braunfels, Sattler, and Spring Branch
Beginning most downstream at New Braunfels, three very large floods (above 10,000 cfs) are seen in 1972, 1998
and 2002. Moving toward Sattler, one large (above 10,000 cfs) flood is seen in 2002. Finally, considering Spring
Branch above Canyon Lake, over 20 floods (including the 2002, but not the 1998, flood) above 10,000 cfs are
evident. This is clear evidence that Canyon Lake is dampening flooding downstream. This also suggests that the
location of maximum rainfall is important, and may be a determining factor in the differences between the 1998
0
10,000
20,000
30,000
40,000
50,000
60,000
70,000
80,000
19
62
19
68
19
73
19
79
19
84
19
90
19
95
20
01
20
06
20
12
Me
an D
aily
DIs
char
ge (
cfs)
Spring Branch
Sattler
New Braunfels
0
5
10
15
20
25
30
35
40
19
62
19
68
19
73
19
79
19
84
19
90
19
95
20
01
20
06
20
12
Me
an G
age
He
igh
t (f
t)
Spring Branch
Sattler
New Braunfels
10
and 2002 floods. However, considering data from all three USGS stations (especially the plots where the vertical
axis is limited) flooding is a common occurrence in Comal County.
Thus, even in the 575 square miles of Comal County, the 1998 flood is seen distinctly at New Braunfels, but not
above at Sattler or Spring Branch, while the 2002 flood was evident at all three locations. Since the data shown
above show that Canyon Lake does help to dampen downstream flooding, it is interesting to note (and further
consider) why the 1998 and 2002 floods do not follow the typical pattern of streamflow variation through these
three USGS gages.
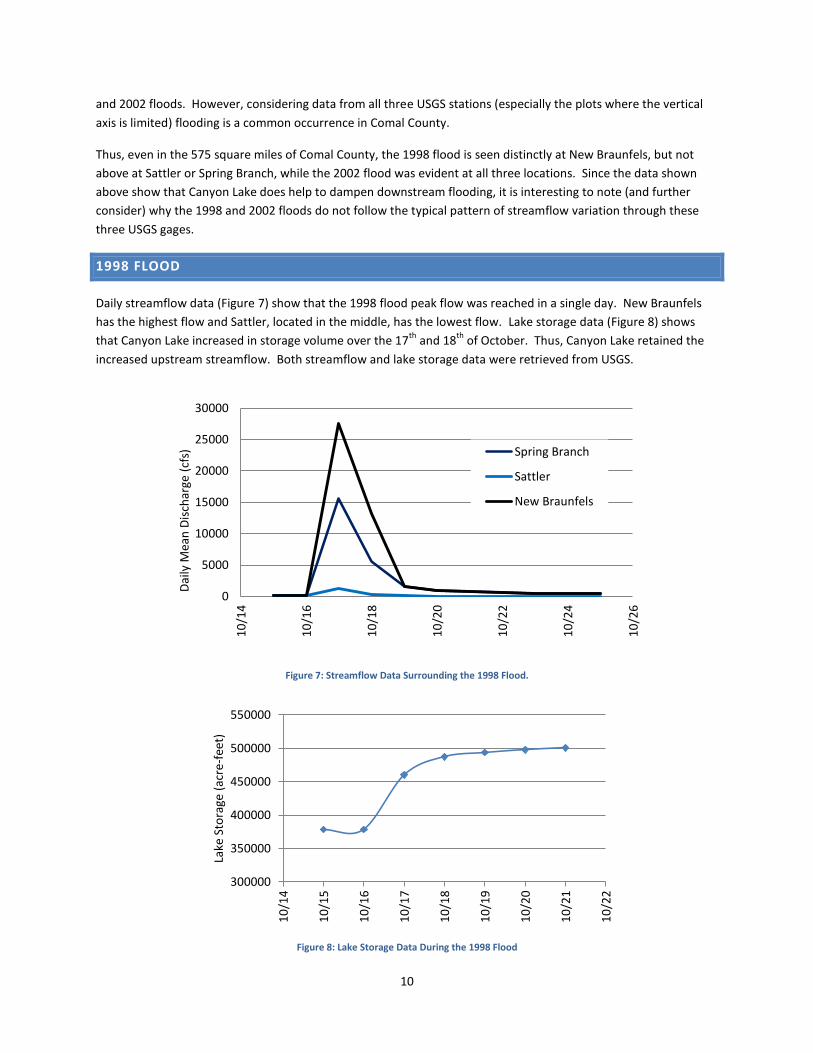
1998 FLOOD
Daily streamflow data (Figure 7) show that the 1998 flood peak flow was reached in a single day. New Braunfels
has the highest flow and Sattler, located in the middle, has the lowest flow. Lake storage data (Figure 8) shows
that Canyon Lake increased in storage volume over the 17th
and 18th
of October. Thus, Canyon Lake retained the
increased upstream streamflow. Both streamflow and lake storage data were retrieved from USGS.
Figure 7: Streamflow Data Surrounding the 1998 Flood.
Figure 8: Lake Storage Data During the 1998 Flood
0
5000
10000
15000
20000
25000
30000
10
/14
10
/16
10
/18
10
/20
10
/22
10
/24
10
/26
Dai
ly M
ean
Dis
char
ge (
cfs)
Spring Branch
Sattler
New Braunfels
300000
350000
400000
450000
500000
550000
10
/14
10
/15
10
/16
10
/17
10
/18
10
/19
10
/20
10
/21
10
/22
Lake
Sto
rage
(ac
re-f
eet)
11
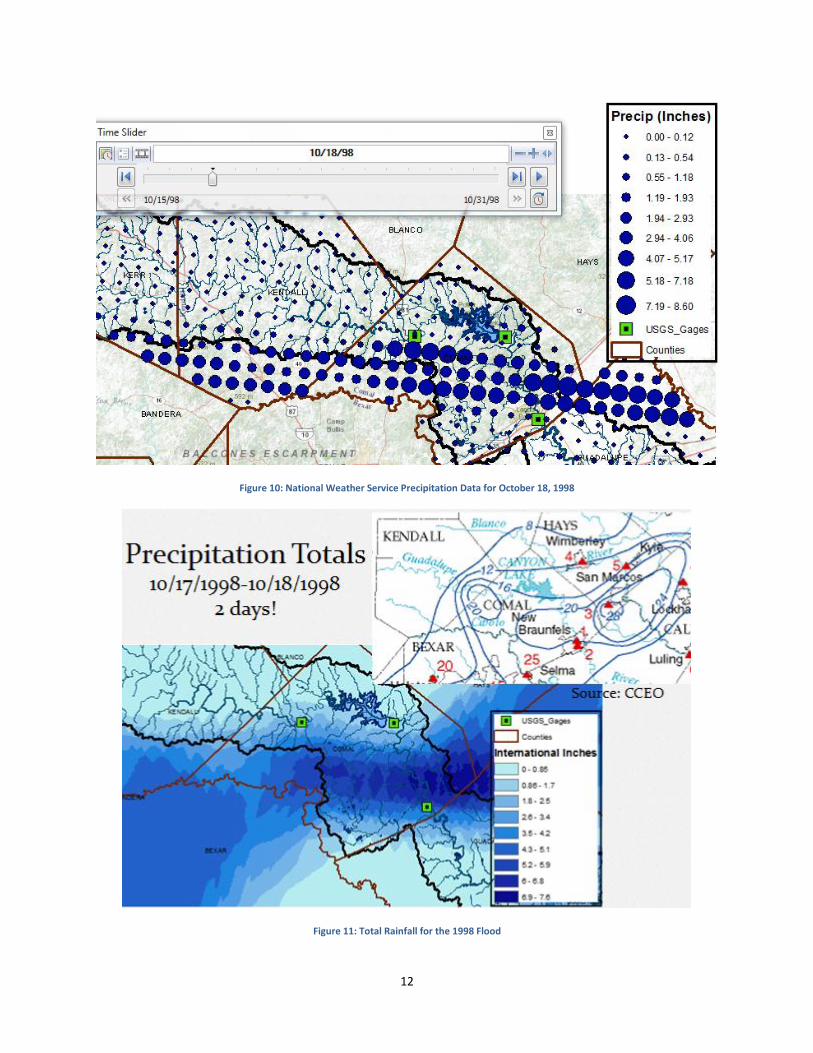
Precipitation data has been obtained using Hydrodesktop with the source as the National Weather Service West
Gulf River Forecast Center (NWS – WGRFC) from October 15, 1998 to October 22, 1998; data was obtained for
Comal County, Guadalupe County (downstream), and Kendall County (upstream). This data was imported into GIS,
displayed as XY data (with a coordinate system matching the rest of the map data), and exported to a shapefile.
The symbology of the shapefile was changed to use graduated symbols, and the time series was enabled. The time
slider was used to display the rainfall over the course of the 1998 flood. Figure 10 shows a map of rainfall on
October 18, 1998, and Figure 9 displays precipitation data over time at a point near the USGS gage in New
Braunfels. Additionally, total precipitation over the flood was calculated in excel by summing up the daily
precipitation values. This data was then imported into GIS, the XY data displayed, and a shapefile created for total
rainfall values. To show the distribution of rain over the entire flood, a Kriging interpolation was used (Figure 11).
The total rainfall isotopes produced by the Comal County Chief Engineer’s Office (CCEO) is also displayed in Figure
11 for comparison.
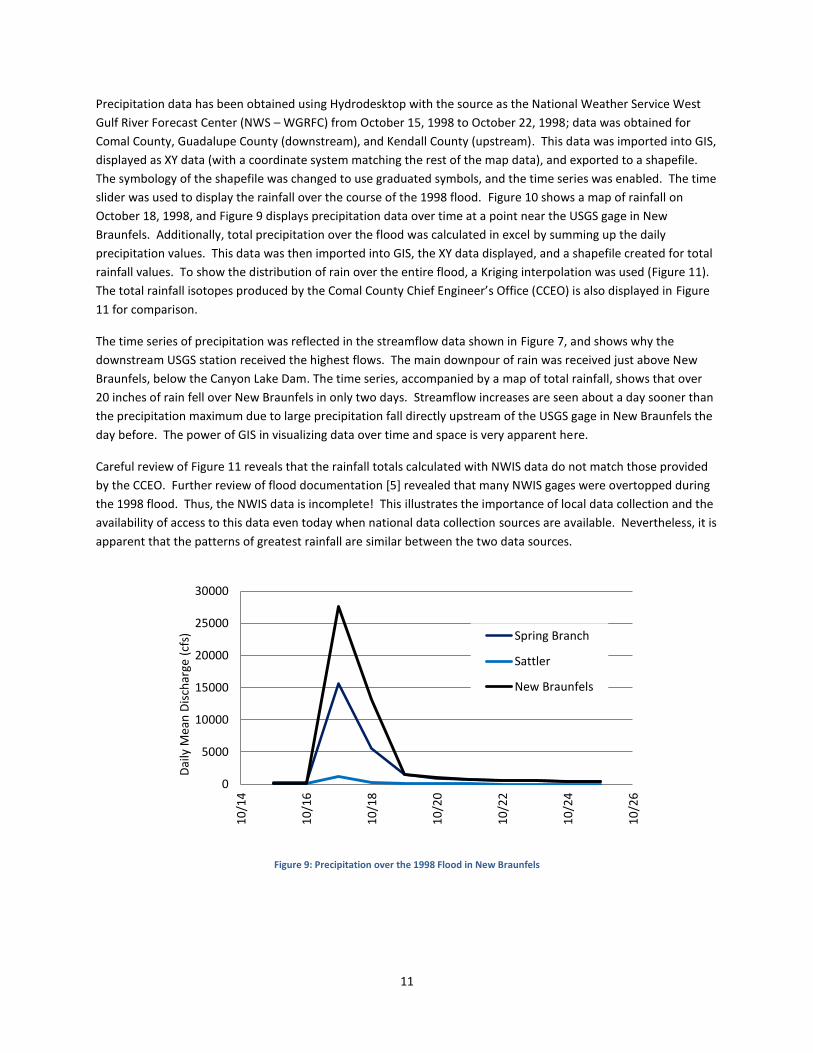
The time series of precipitation was reflected in the streamflow data shown in Figure 7, and shows why the
downstream USGS station received the highest flows. The main downpour of rain was received just above New
Braunfels, below the Canyon Lake Dam. The time series, accompanied by a map of total rainfall, shows that over
20 inches of rain fell over New Braunfels in only two days. Streamflow increases are seen about a day sooner than
the precipitation maximum due to large precipitation fall directly upstream of the USGS gage in New Braunfels the
day before. The power of GIS in visualizing data over time and space is very apparent here.
Careful review of Figure 11 reveals that the rainfall totals calculated with NWIS data do not match those provided
by the CCEO. Further review of flood documentation [5] revealed that many NWIS gages were overtopped during
the 1998 flood. Thus, the NWIS data is incomplete! This illustrates the importance of local data collection and the
availability of access to this data even today when national data collection sources are available. Nevertheless, it is
apparent that the patterns of greatest rainfall are similar between the two data sources.
Figure 9: Precipitation over the 1998 Flood in New Braunfels
0
5000
10000
15000
20000
25000
30000
10
/14
10
/16
10
/18
10
/20
10
/22
10
/24
10
/26
Dai
ly M
ean
Dis
char
ge (
cfs)
Spring Branch
Sattler
New Braunfels
12
Figure 10: National Weather Service Precipitation Data for October 18, 1998
Figure 11: Total Rainfall for the 1998 Flood
13
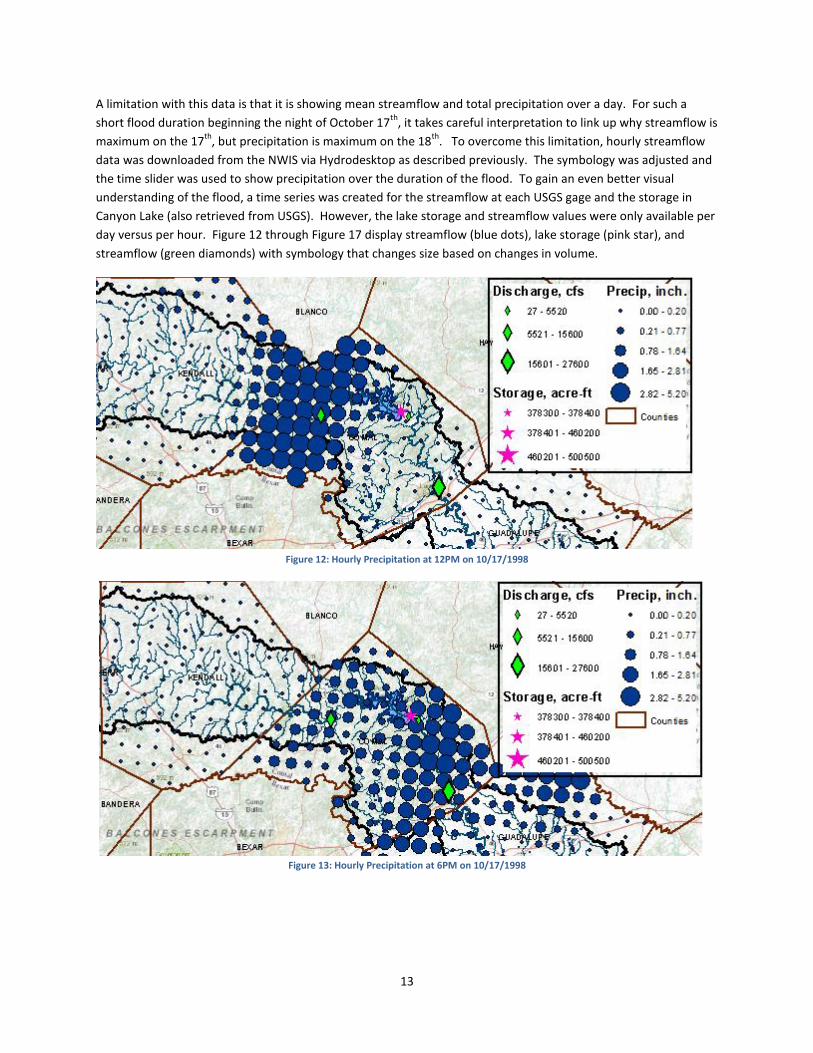
A limitation with this data is that it is showing mean streamflow and total precipitation over a day. For such a
short flood duration beginning the night of October 17th
, it takes careful interpretation to link up why streamflow is
maximum on the 17th
, but precipitation is maximum on the 18th
. To overcome this limitation, hourly streamflow
data was downloaded from the NWIS via Hydrodesktop as described previously. The symbology was adjusted and
the time slider was used to show precipitation over the duration of the flood. To gain an even better visual
understanding of the flood, a time series was created for the streamflow at each USGS gage and the storage in
Canyon Lake (also retrieved from USGS). However, the lake storage and streamflow values were only available per
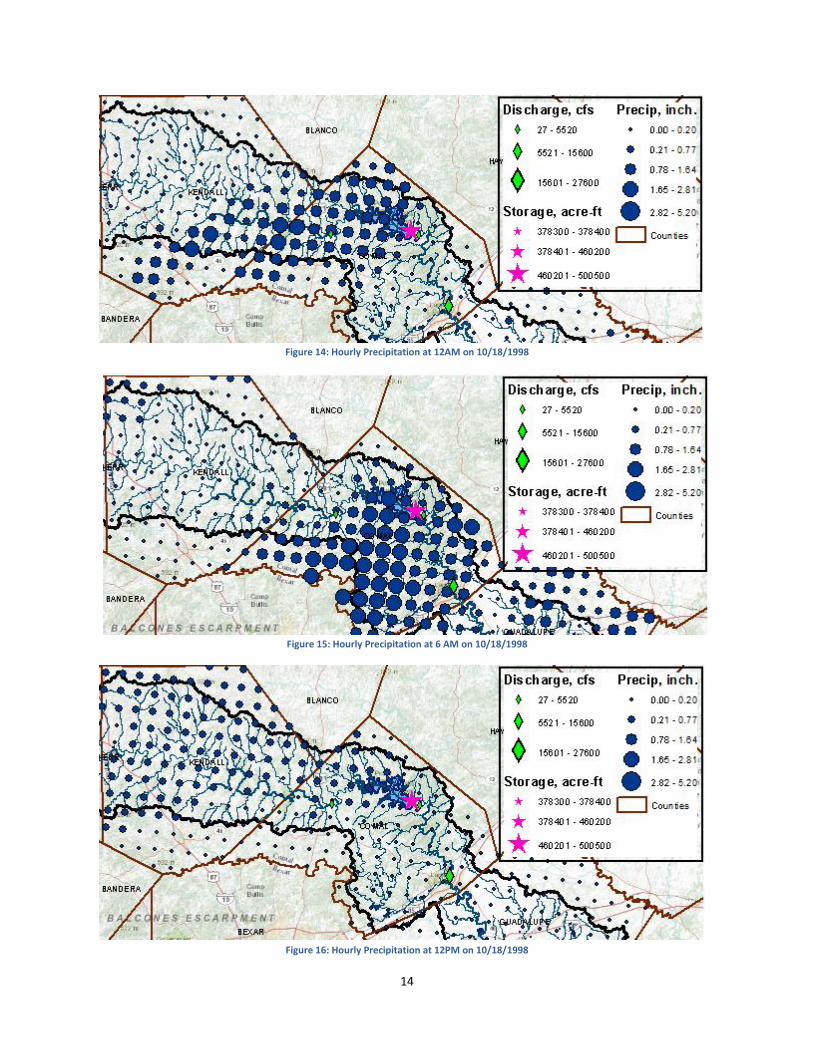
day versus per hour. Figure 12 through Figure 17 display streamflow (blue dots), lake storage (pink star), and
streamflow (green diamonds) with symbology that changes size based on changes in volume.
Figure 12: Hourly Precipitation at 12PM on 10/17/1998
Figure 13: Hourly Precipitation at 6PM on 10/17/1998
14
Figure 14: Hourly Precipitation at 12AM on 10/18/1998
Figure 15: Hourly Precipitation at 6 AM on 10/18/1998
Figure 16: Hourly Precipitation at 12PM on 10/18/1998
15
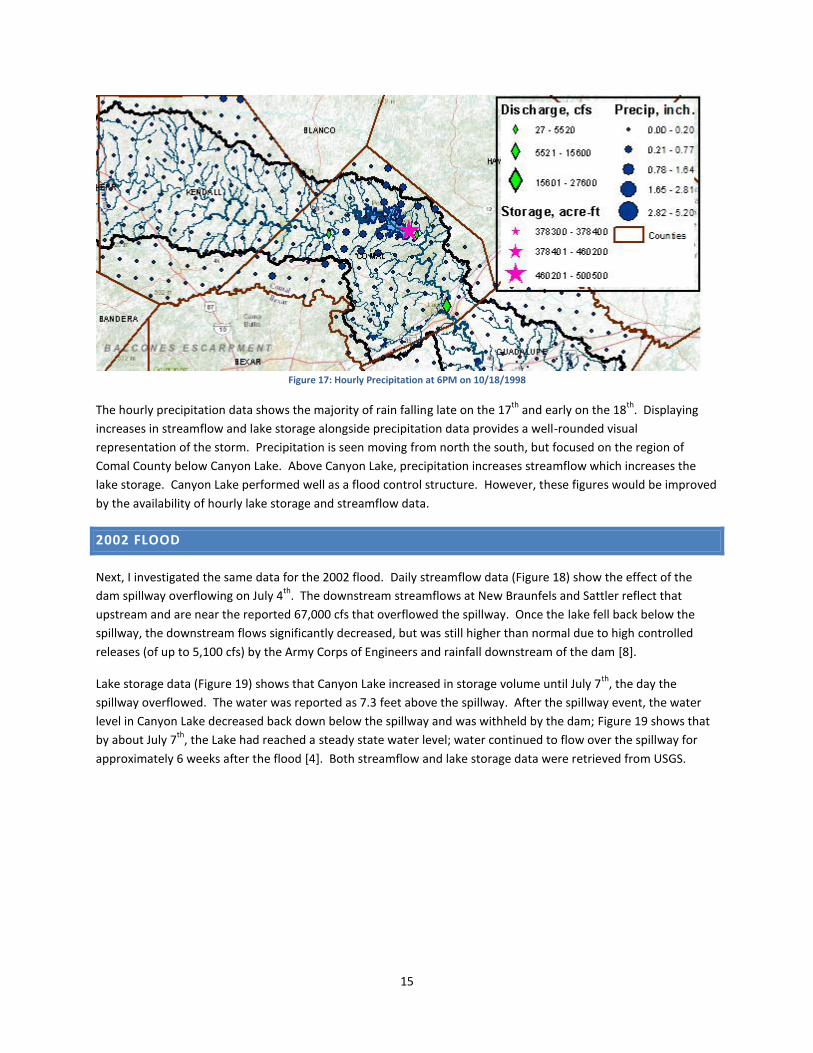
Figure 17: Hourly Precipitation at 6PM on 10/18/1998
The hourly precipitation data shows the majority of rain falling late on the 17th
and early on the 18th
. Displaying
increases in streamflow and lake storage alongside precipitation data provides a well-rounded visual
representation of the storm. Precipitation is seen moving from north the south, but focused on the region of
Comal County below Canyon Lake. Above Canyon Lake, precipitation increases streamflow which increases the
lake storage. Canyon Lake performed well as a flood control structure. However, these figures would be improved
by the availability of hourly lake storage and streamflow data.
2002 FLOOD
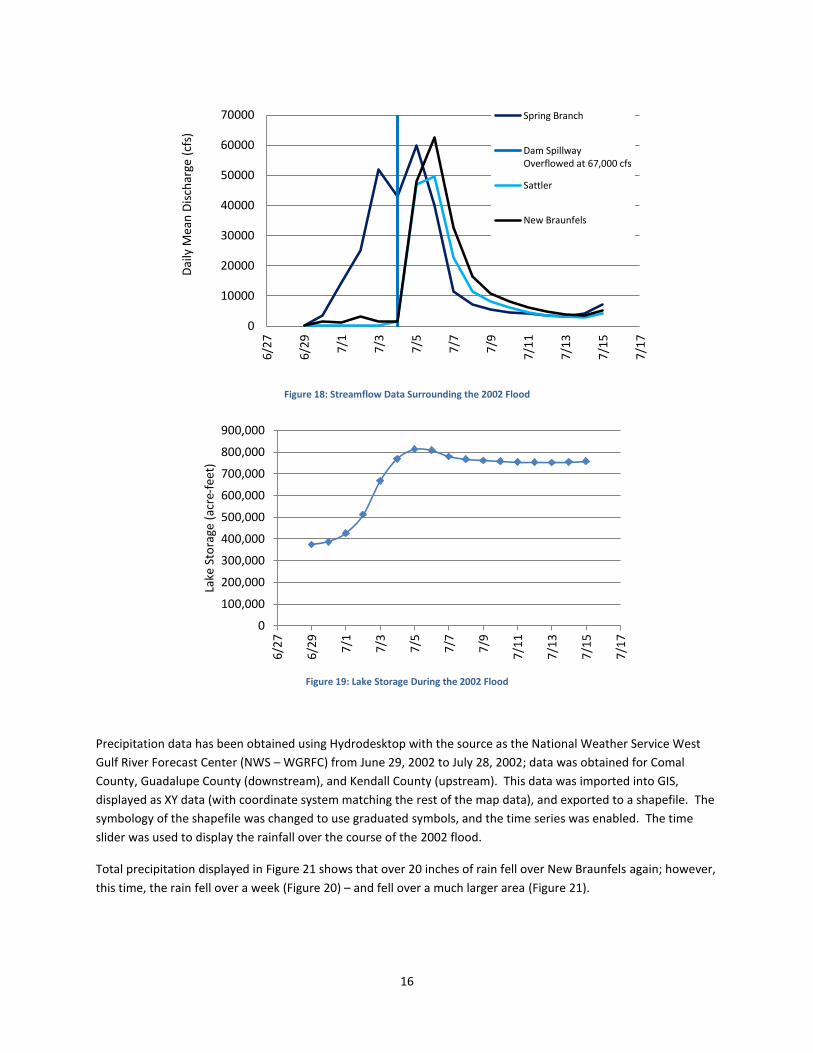
Next, I investigated the same data for the 2002 flood. Daily streamflow data (Figure 18) show the effect of the
dam spillway overflowing on July 4th
. The downstream streamflows at New Braunfels and Sattler reflect that
upstream and are near the reported 67,000 cfs that overflowed the spillway. Once the lake fell back below the
spillway, the downstream flows significantly decreased, but was still higher than normal due to high controlled
releases (of up to 5,100 cfs) by the Army Corps of Engineers and rainfall downstream of the dam [8].
Lake storage data (Figure 19) shows that Canyon Lake increased in storage volume until July 7th
, the day the
spillway overflowed. The water was reported as 7.3 feet above the spillway. After the spillway event, the water
level in Canyon Lake decreased back down below the spillway and was withheld by the dam; Figure 19 shows that
by about July 7th
, the Lake had reached a steady state water level; water continued to flow over the spillway for
approximately 6 weeks after the flood [4]. Both streamflow and lake storage data were retrieved from USGS.
16
Figure 18: Streamflow Data Surrounding the 2002 Flood
Figure 19: Lake Storage During the 2002 Flood
Precipitation data has been obtained using Hydrodesktop with the source as the National Weather Service West
Gulf River Forecast Center (NWS – WGRFC) from June 29, 2002 to July 28, 2002; data was obtained for Comal
County, Guadalupe County (downstream), and Kendall County (upstream). This data was imported into GIS,
displayed as XY data (with coordinate system matching the rest of the map data), and exported to a shapefile. The
symbology of the shapefile was changed to use graduated symbols, and the time series was enabled. The time
slider was used to display the rainfall over the course of the 2002 flood.
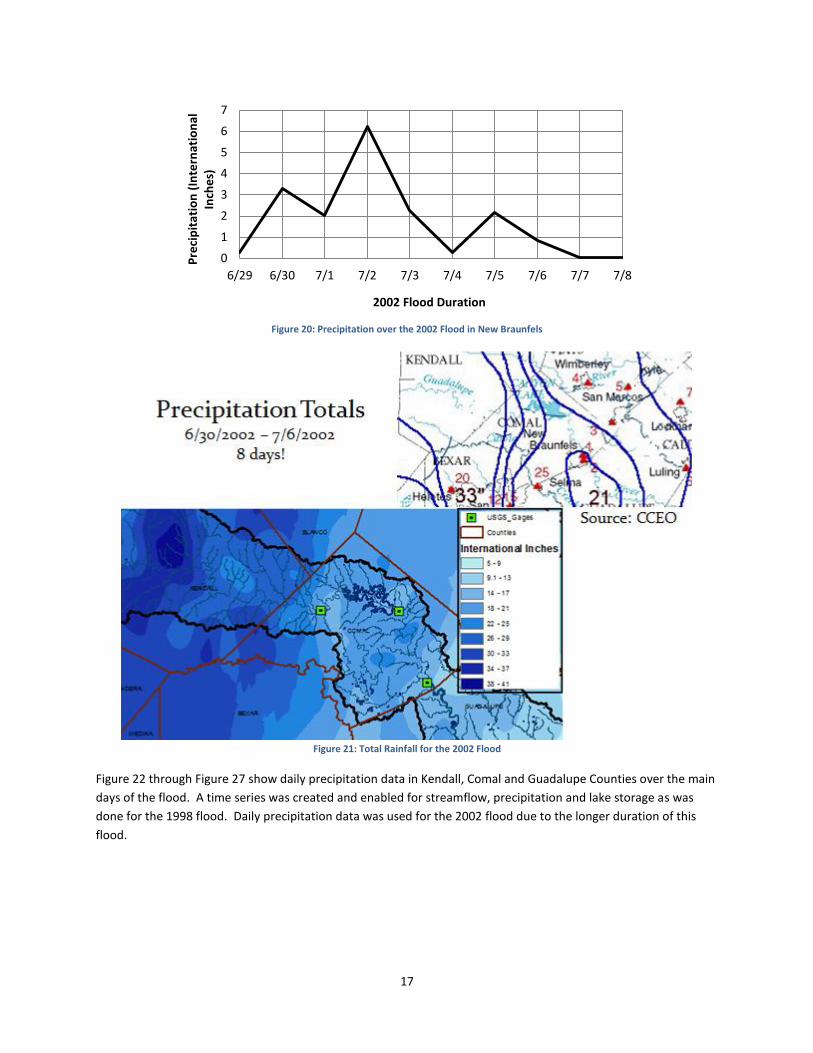
Total precipitation displayed in Figure 21 shows that over 20 inches of rain fell over New Braunfels again; however,
this time, the rain fell over a week (Figure 20) – and fell over a much larger area (Figure 21).
0
10000
20000
30000
40000
50000
60000
70000
6/2
7
6/2
9
7/1
7/3
7/5
7/7
7/9
7/1
1
7/1
3
7/1
5
7/1
7
Dai
ly M
ean
Dis
char
ge (
cfs)
Spring Branch
Dam SpillwayOverflowed at 67,000 cfs
Sattler
New Braunfels
0
100,000
200,000
300,000
400,000
500,000
600,000
700,000
800,000
900,000
6/2
7
6/2
9
7/1
7/3
7/5
7/7
7/9
7/1
1
7/1
3
7/1
5
7/1
7
Lake
Sto
rage
(ac
re-f
eet)
17
Figure 20: Precipitation over the 2002 Flood in New Braunfels
Figure 21: Total Rainfall for the 2002 Flood
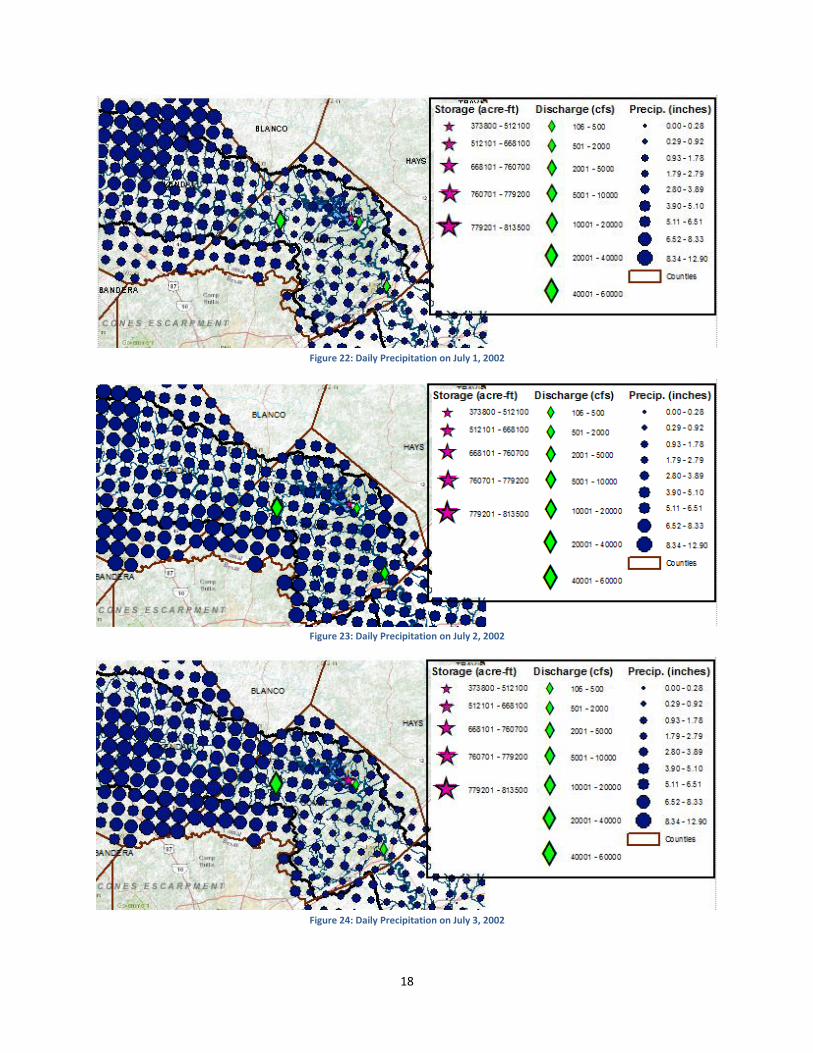
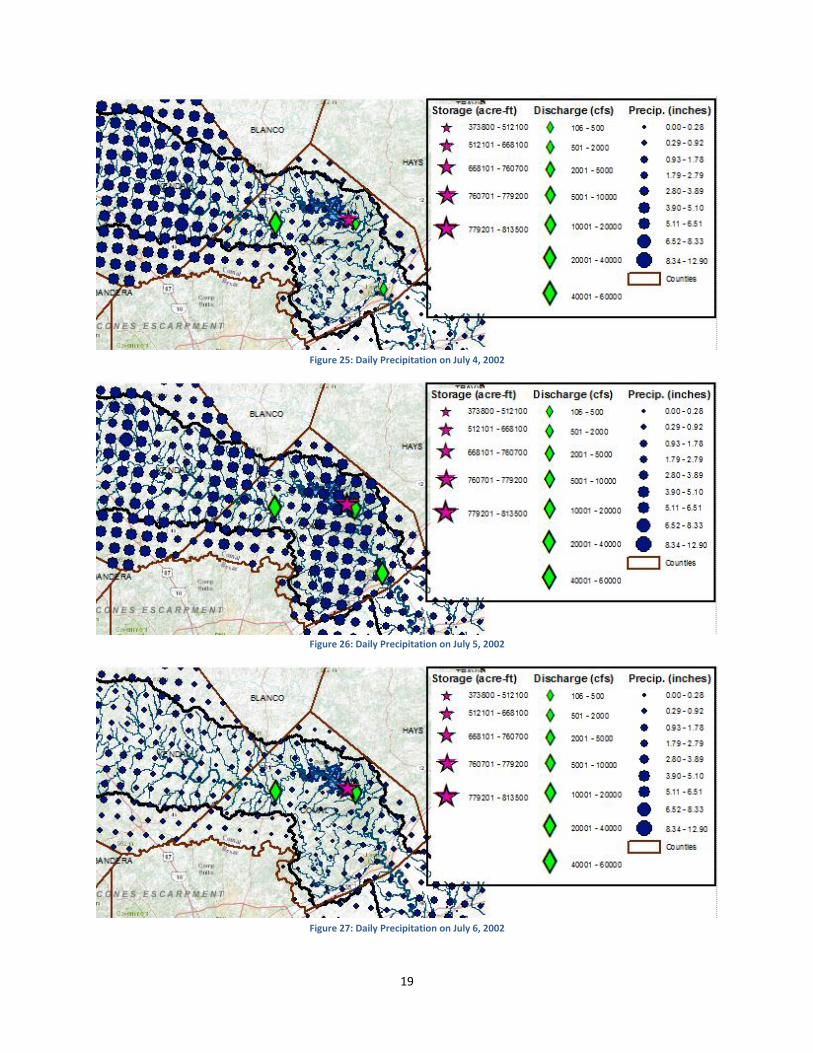
Figure 22 through Figure 27 show daily precipitation data in Kendall, Comal and Guadalupe Counties over the main
days of the flood. A time series was created and enabled for streamflow, precipitation and lake storage as was
done for the 1998 flood. Daily precipitation data was used for the 2002 flood due to the longer duration of this
flood.
0
1
2
3
4
5
6
7
6/29 6/30 7/1 7/2 7/3 7/4 7/5 7/6 7/7 7/8
Pre
cip
itat
ion
(In
tern
atio
nal
In
che
s)
2002 Flood Duration
18
Figure 22: Daily Precipitation on July 1, 2002
Figure 23: Daily Precipitation on July 2, 2002
Figure 24: Daily Precipitation on July 3, 2002
19
Figure 25: Daily Precipitation on July 4, 2002
Figure 26: Daily Precipitation on July 5, 2002
Figure 27: Daily Precipitation on July 6, 2002
20
The time series of precipitation, streamflow and lake storage shows again the role of Canyon Lake and the location
of precipitation in the 2002 flood. Lake storage is shown as increased up until it overtopped, at which point great
increases in downstream streamflow are apparent. Additionally, it is easy to see the relationship between the
upstream streamflow and the increasing lake storage prior to the overtopping of the lake.
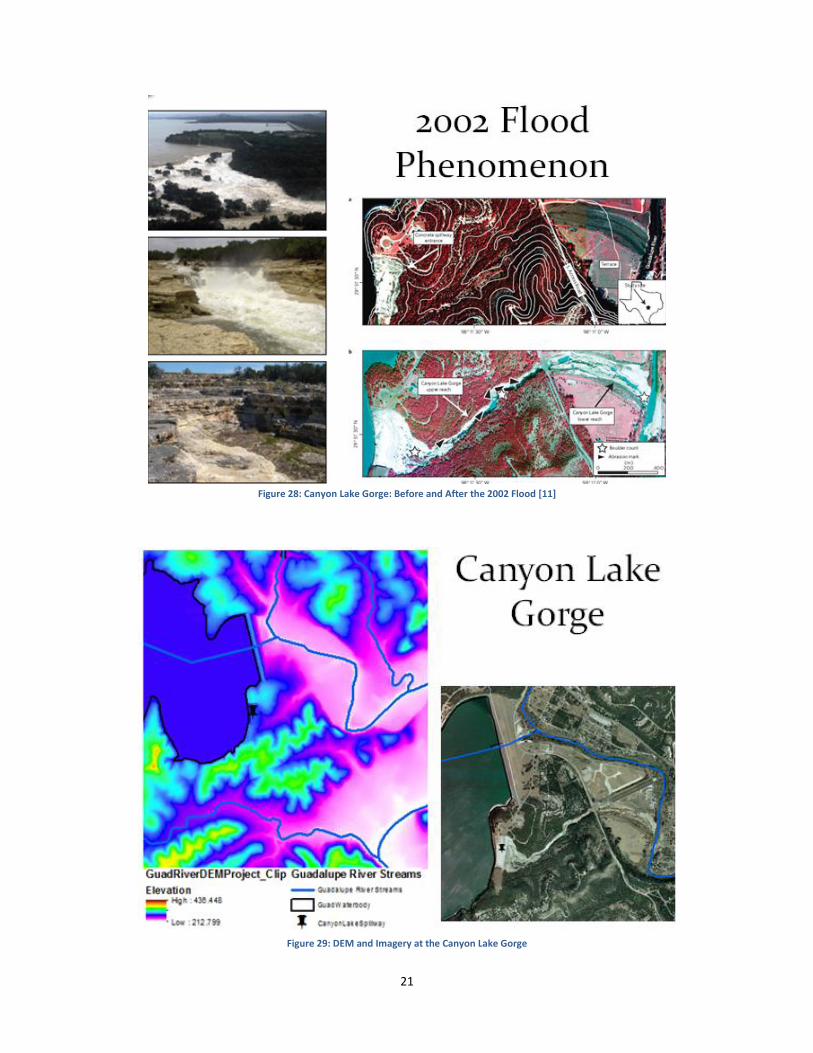
2002 FLOOD PHENOMENON – THE CANYON LAKE GORGE
On July 4th
, for the first time, Canyon Lake overflowed via the emergency spillway carving out the Canyon Lake
Gorge, and uncovering layers upon layers of history. While local citizens were quick to point fingers at the dam’s
“failure,” the Army Corps of Engineers is pleased with how well the dam worked during this event. Up until July
4th
, the dam withheld upstream floodwaters, maintaining the streamflow (Figure 18) downstream at
approximately 5,000 cfs. The dam, even at full capacity, survived without failure. The emergency spillway
designed by the Army Corps of Engineers, such that in a case as was this flood the dam would not fail, performed
exactly as it was designed. The spillway allowed flood waters to flow out of the lake instead of flowing over the
dam and possibly causing structural dam failures. Furthermore, the dam maintained downstream flows below
70,000 cfs, whereas the Army Corps of Engineers estimated without the dam, downstream flooding would have
reached 125,000 cfs. “An estimated $38.6 Million in damages were prevented” [10].
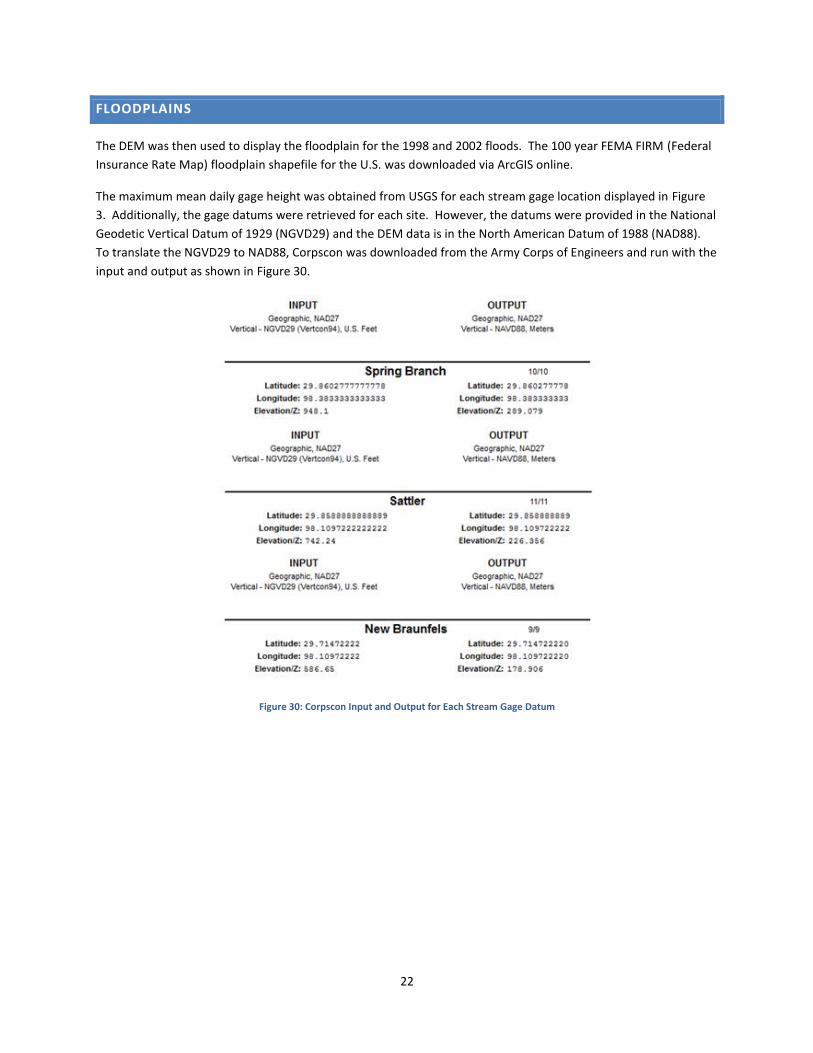
Pictures and lidar images of the gorge before, during and after the flood are shown in Figure 28, and the DEM
model focused on the Gorge accompanied by imagery of the same region are shown in Figure 29. The DEM of the
Gorge was created by clipping the DEM file to a smaller square surrounding the gorge, such that a smaller
elevation range would allow for greater visibility of changes in elevation via a graduated symbology. It is evident
that the depth of the gorge is on average 7 meters or 23 feet [11]. This is an astonishing amount of earth carved
out in less than one day!
21
Figure 28: Canyon Lake Gorge: Before and After the 2002 Flood [11]
Figure 29: DEM and Imagery at the Canyon Lake Gorge
22
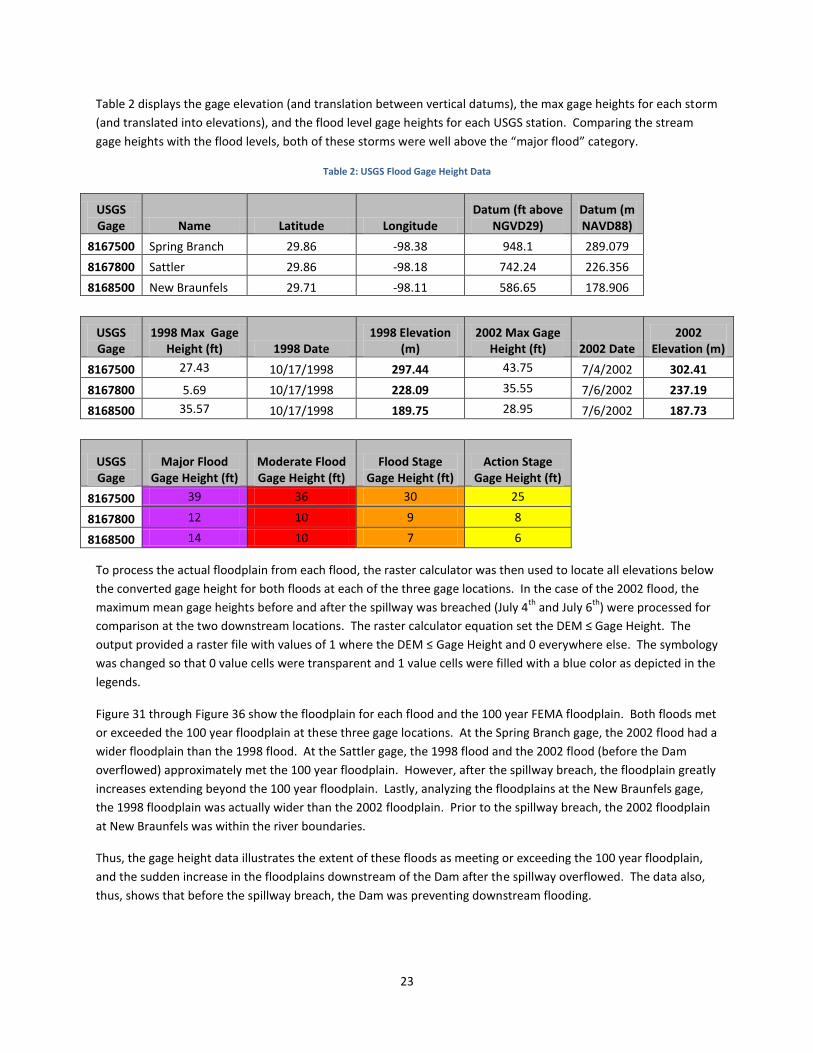
FLOODPLAINS
The DEM was then used to display the floodplain for the 1998 and 2002 floods. The 100 year FEMA FIRM (Federal
Insurance Rate Map) floodplain shapefile for the U.S. was downloaded via ArcGIS online.
The maximum mean daily gage height was obtained from USGS for each stream gage location displayed in Figure
3. Additionally, the gage datums were retrieved for each site. However, the datums were provided in the National
Geodetic Vertical Datum of 1929 (NGVD29) and the DEM data is in the North American Datum of 1988 (NAD88).
To translate the NGVD29 to NAD88, Corpscon was downloaded from the Army Corps of Engineers and run with the
input and output as shown in Figure 30.
Figure 30: Corpscon Input and Output for Each Stream Gage Datum
23
Table 2 displays the gage elevation (and translation between vertical datums), the max gage heights for each storm
(and translated into elevations), and the flood level gage heights for each USGS station. Comparing the stream
gage heights with the flood levels, both of these storms were well above the “major flood” category.
Table 2: USGS Flood Gage Height Data
USGS Gage Name Latitude Longitude
Datum (ft above NGVD29)
Datum (m NAVD88)
8167500 Spring Branch 29.86 -98.38 948.1 289.079 8167800 Sattler 29.86 -98.18 742.24 226.356 8168500 New Braunfels 29.71 -98.11 586.65 178.906
USGS Gage
1998 Max Gage Height (ft) 1998 Date
1998 Elevation (m)
2002 Max Gage Height (ft) 2002 Date
2002 Elevation (m)
8167500 27.43 10/17/1998 297.44 43.75 7/4/2002 302.41
8167800 5.69 10/17/1998 228.09 35.55 7/6/2002 237.19
8168500 35.57 10/17/1998 189.75 28.95 7/6/2002 187.73
USGS Gage
Major Flood Gage Height (ft)
Moderate Flood Gage Height (ft)
Flood Stage Gage Height (ft)
Action Stage Gage Height (ft)
8167500 39 36 30 25
8167800 12 10 9 8
8168500 14 10 7 6
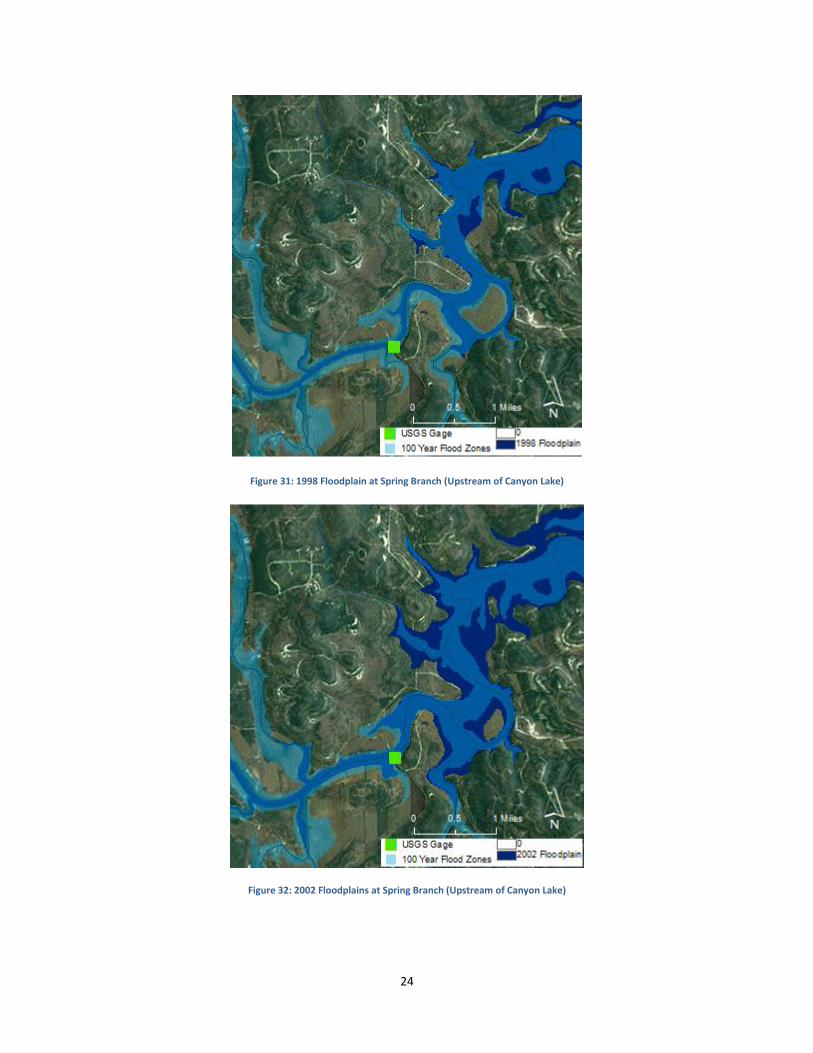
To process the actual floodplain from each flood, the raster calculator was then used to locate all elevations below
the converted gage height for both floods at each of the three gage locations. In the case of the 2002 flood, the
maximum mean gage heights before and after the spillway was breached (July 4th
and July 6th
) were processed for
comparison at the two downstream locations. The raster calculator equation set the DEM ≤ Gage Height. The
output provided a raster file with values of 1 where the DEM ≤ Gage Height and 0 everywhere else. The symbology
was changed so that 0 value cells were transparent and 1 value cells were filled with a blue color as depicted in the
legends.
Figure 31 through Figure 36 show the floodplain for each flood and the 100 year FEMA floodplain. Both floods met
or exceeded the 100 year floodplain at these three gage locations. At the Spring Branch gage, the 2002 flood had a
wider floodplain than the 1998 flood. At the Sattler gage, the 1998 flood and the 2002 flood (before the Dam
overflowed) approximately met the 100 year floodplain. However, after the spillway breach, the floodplain greatly
increases extending beyond the 100 year floodplain. Lastly, analyzing the floodplains at the New Braunfels gage,
the 1998 floodplain was actually wider than the 2002 floodplain. Prior to the spillway breach, the 2002 floodplain
at New Braunfels was within the river boundaries.
Thus, the gage height data illustrates the extent of these floods as meeting or exceeding the 100 year floodplain,
and the sudden increase in the floodplains downstream of the Dam after the spillway overflowed. The data also,
thus, shows that before the spillway breach, the Dam was preventing downstream flooding.
24
Figure 31: 1998 Floodplain at Spring Branch (Upstream of Canyon Lake)
Figure 32: 2002 Floodplains at Spring Branch (Upstream of Canyon Lake)
25
Figure 33: 1998 Floodplain at Sattler (Below the Canyon Lake Dam)
Figure 34: 2002 Floodplains at Sattler (Below the Canyon Lake Dam)
26
Figure 35: 1998 Floodplain at New Braunfels (20 miles Below the Dam)
Figure 36: 2002 Floodplains at New Braunfels (20 miles Below the Dam)
27
TURBIDITY DATA
My original proposal had planned to obtain turbidity data from the EPA for both the 1998 and 2002 floods and plot
them in GIS using graduated symbols. I expected a higher turbidity value in the 2002 flood than the 1998 flood
due to the carving of the Canyon Lake Gorge. The most frequent data collection was performed by the Guadalupe-
Brazos River Authority (GBRA) on a monthly basis. However, the collection dates in 1998 and 2002 were 2-3 weeks
after the floods. Thus, I was unfortunately not able to locate turbidity data during or soon after the flooding.
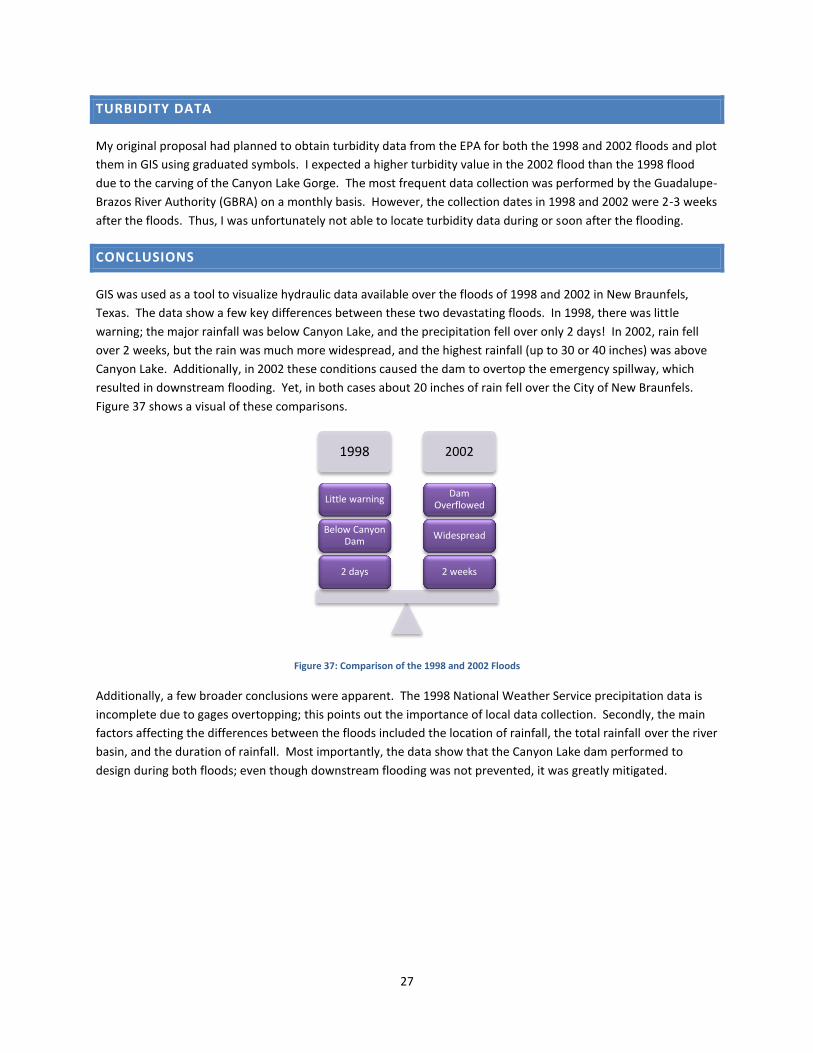
CONCLUSIONS
GIS was used as a tool to visualize hydraulic data available over the floods of 1998 and 2002 in New Braunfels,
Texas. The data show a few key differences between these two devastating floods. In 1998, there was little
warning; the major rainfall was below Canyon Lake, and the precipitation fell over only 2 days! In 2002, rain fell
over 2 weeks, but the rain was much more widespread, and the highest rainfall (up to 30 or 40 inches) was above
Canyon Lake. Additionally, in 2002 these conditions caused the dam to overtop the emergency spillway, which
resulted in downstream flooding. Yet, in both cases about 20 inches of rain fell over the City of New Braunfels.
Figure 37 shows a visual of these comparisons.
Figure 37: Comparison of the 1998 and 2002 Floods
Additionally, a few broader conclusions were apparent. The 1998 National Weather Service precipitation data is
incomplete due to gages overtopping; this points out the importance of local data collection. Secondly, the main
factors affecting the differences between the floods included the location of rainfall, the total rainfall over the river
basin, and the duration of rainfall. Most importantly, the data show that the Canyon Lake dam performed to
design during both floods; even though downstream flooding was not prevented, it was greatly mitigated.
1998 2002
2 weeks
Widespread
Dam Overflowed
2 days
Below Canyon Dam
Little warning
28
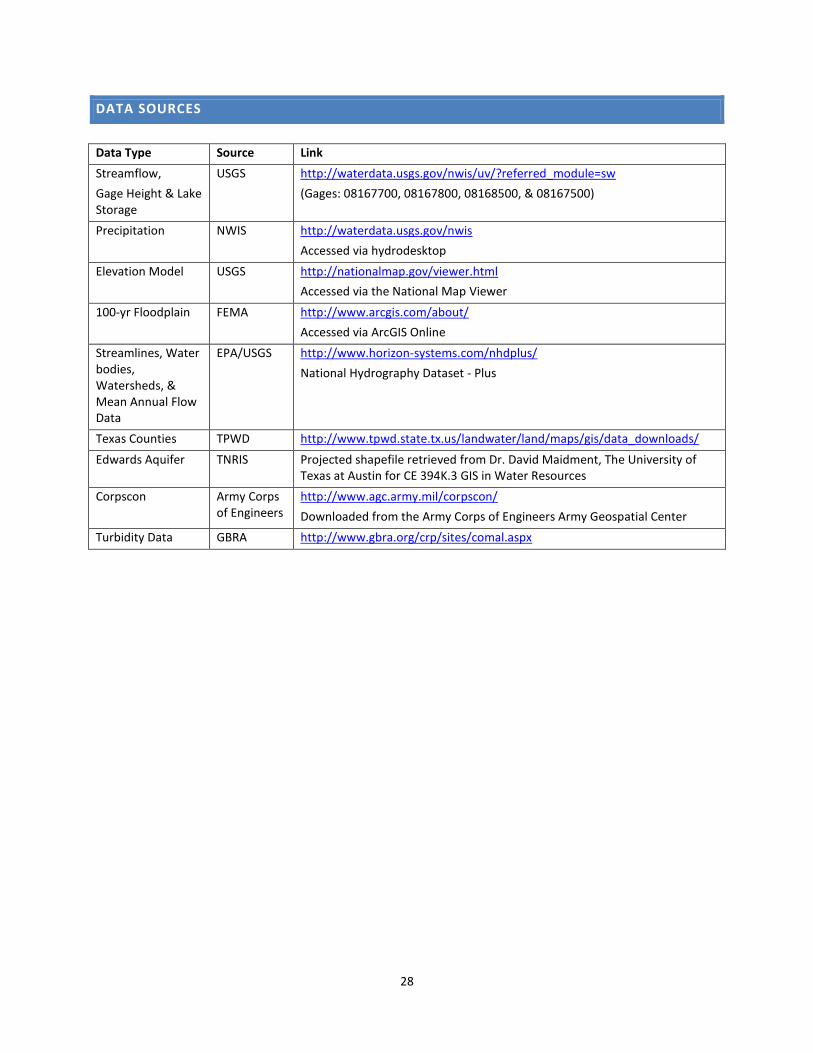
DATA SOURCES
Data Type Source Link
Streamflow,
Gage Height & Lake Storage
USGS http://waterdata.usgs.gov/nwis/uv/?referred_module=sw
(Gages: 08167700, 08167800, 08168500, & 08167500)
Precipitation NWIS http://waterdata.usgs.gov/nwis
Accessed via hydrodesktop
Elevation Model USGS http://nationalmap.gov/viewer.html
Accessed via the National Map Viewer
100-yr Floodplain FEMA http://www.arcgis.com/about/
Accessed via ArcGIS Online
Streamlines, Water bodies, Watersheds, & Mean Annual Flow Data
EPA/USGS http://www.horizon-systems.com/nhdplus/
National Hydrography Dataset - Plus
Texas Counties TPWD http://www.tpwd.state.tx.us/landwater/land/maps/gis/data_downloads/
Edwards Aquifer TNRIS Projected shapefile retrieved from Dr. David Maidment, The University of Texas at Austin for CE 394K.3 GIS in Water Resources
Corpscon Army Corps of Engineers
http://www.agc.army.mil/corpscon/
Downloaded from the Army Corps of Engineers Army Geospatial Center
Turbidity Data GBRA http://www.gbra.org/crp/sites/comal.aspx
29
WORKS CITED
[1] G. Ferniz, "Flood anniversary reminds us of drought danger," 4 July 2012. [Online]. Available:
http://www.mysanantonio.com/news/environment/article/Flood-anniversary-reminds-us-of-drought-danger-
3683128.php. [Accessed 17 November 2012].
[2] National Weather Service, "Deadly floods devastate Comal County," KXAN, 14 June 2010. [Online]. Available:
http://www.kxan.com/dpp/weather/overnight-heavy-rain-continues. [Accessed 17 November 2012].
[3] Guadalupe-Blaco River Authority (GBRA), "Staying Safe...A Guide for Flooding in the Guadalupe River Basin,"
[Online]. Available: http://www.gbra.org/documents/flood/StayingSafe.pdf. [Accessed 17 November 2012].
[4] "Canyon Lake Gorge," Canyon Lake Gorge Preservation Society, 2009-2010. [Online]. Available:
http://www.canyongorge.org/. [Accessed 17 November 2012].
[5] Comal County Engineer's Office (CCEO), "Flood Insurance Studies," 2012. [Online]. Available:
http://www.canyongorge.org/. [Accessed 17 November 2012].
[6] R. Slade and J. Patton, "Major and Catastrophic Storms and Floods in Texas," [Online]. Available:
http://pubs.usgs.gov/of/2003/ofr03-193/cd_files/USGS_Storms/2001to1975.htm. [Accessed 17 November
2012].
[7] Freese and Nichols, Inc., "Comal County Dam Feasibility Study," 6 June 2001. [Online]. Available:
www.twdb.texas.gov/publications/reports/.../doc/2000483357.pdf. [Accessed 17 November 2012].
[8] R. Gergens, "Canyon Lake Flood Emergency Operations during the Summer Flood of 2002," [Online]. Available:
http://www.hec.usace.army.mil/misc/watershed_conference/PDF_Files/Gergens_Robert.pdf. [Accessed 17
November 2012].
[9] U.S. Army Corps of Engineers, "History of Canyon Lake," 5 May 2011. [Online]. Available: http://www.swf-
wc.usace.army.mil/canyon/Information/History.asp. [Accessed 17 November 2012].
[10] Comal County Engineer's Office (CCEO), "Flood of 2002," 2012. [Online]. Available:
http://www.cceo.org/flood/flood2002.asp. [Accessed 17 November 2012].
[11] M. Lamb and M. Fonstad, "Rapid formation of a modern bedrock canyon by a single flood event," Nature
Geoscience, 20 June 2010.