flow study of medium size pipeline testing · pdf file3.3 pdms software 30 ... 4.3 pdms...
TRANSCRIPT

FLOW STUDY OF MEDIUM SIZE PIPELINE TESTING LOOP
By
TAN NI KING
A thesis submitted to the Faculty of Chemical and Natural Resources Engineering in
partial fulfillment of the requirement for the Degree of Bachelor of Engineering in
Chemical Engineering
Faculty of Chemical and Natural Resources Engineering
Universiti Malaysia Pahang
FEBRARY 2013

vi
TABLE OF CONTENTS
TITLE PAGE i
SUPERVISOR’S DECLARATION ii
DECLARATION iii
ACKNOWLEDGEMENTS v
TABLE OF CONTENTS vi
LIST OF TABLES xi
LIST OF FIGURES xii
LIST OF APPENDICES xvi
LIST OF SYMBOLS xvii
LIST OF ABBREVIATIONS xviii
ABSTRAK xix
ABSTRACT xx
CHAPTER 1 INTRODUCTION
1.1 Background of Study 1
1.2 Problem Statement 2
1.3 Research Objectives 3
1.4 Scope of Research 4
1.5 Significance of Study 5
CHAPTER 2 LITERATURE REVIEW
2.1 Chapter Overview 7
2.2 Stratified Flow Pattern 8
2.3 Annular Flow 10
2.4 Slug Flow Behaviors 11
2.5 Slug Length 12
2.6 Transition to Slug Flow 13
2.7 Slug Stability Theory 14

vii
2.8 Mathematic Model for Three Phases Flow 16
2.9 Pipeline Testing Rig 18
2.10 Summary of Flow Trends 21
2.10.1 Stratified Flow 21
2.10.2 Bubbles Flow 22
2.10.3 Wavy Flow 22
2.10.4 Plug Flow 22
2.10.5 Slug Flow 22
2.11 Comparison between Eulerian, Volume of Fluid (VOF) and
Mixture Model
23
2.12 Limitation of VOF Model 24
2.13 Lamina and Turbulent Flow of Fluid 25
2.14 VOF Time-Discretization 25
2.15 Wall Condition 26
2.16 Steady and Unsteady State 26
2.17 Surface Tension 26
2.18 Summary of Simulation Model 27
CHAPTER 3 RESEARCH METHODOLOGY 28
3.1 Introduction 28
3.2 Simulation Approach of CFD Multiphase Flow 29
3.3 PDMS Software 30
3.4 Research Procedure 31
3.5 Propose Title and Literature Review 32
3.6 Procedure of Drawing for the Pipeline Test Section 33
3.7 Operating Conditions 35
3.8 Boundary Conditions 35
3.9 Study Parameters 36
3.10 Setting up Multiphase Model 37
3.10.1 Enable VOF Multiphase Model 38
3.10.2 Specify Unsteady State Formulation 39
3.11 Define Materials 39

viii
3.12 Define Phases 40
3.13 Define Operating Conditions 42
3.14 Defining Multiphase Boundary Conditions 43
3.15 Implicit Time Discretization Formulation 44
3.16 Defining Solution Limits 45
3.17 Solution Initialization 46
CHAPTER 4 RESULTS & DISCUSSION 49
4.1 Introduction 49
4.2 Summary of CFD Simulation Results 50
4.2.1 Simulation Result for Gasoil-vapour 0.5 m/s,
Gasoil-liquid 1 m/s, and Water 1 m/s
51
4.2.2 Simulation Result for Gasoil-vapour 0.5 m/s,
Gasoil-liquid 3 m/s, and Water 3 m/s
52
4.2.3 Simulation Result for Gasoil-vapour 0.5 m/s,
Gasoil-liquid 5 m/s, and Water 5 m/s
53
4.2.4 Simulation Result for Gasoil-vapour 0.5 m/s,
Gasoil-liquid 1 m/s, and Water 4 m/s
54
4.2.5 Simulation Result for Gasoil-vapour 0.5 m/s,
Gasoil-liquid 4 m/s, and Water 1 m/s
55
4.2.6 Simulation Result for Gasoil-vapour 2.0 m/s,
Gasoil-liquid 1 m/s, and Water 1 m/s
56
4.2.7 Simulation Result for Gasoil-vapour 2.0 m/s,
Gasoil-liquid 3 m/s, and Water 3 m/s
57
4.2.8 Simulation Result for Gasoil-vapour 2.0 m/s,
Gasoil-liquid 5 m/s, and Water 5 m/s
58
4.2.9 Simulation Result for Gasoil-vapour 2.0 m/s,
Gasoil-liquid 1 m/s, and Water 4 m/s
59
4.2.10 Simulation Result for Gasoil-vapour 2.0 m/s,
Gasoil-liquid 4 m/s, and Water 1 m/s
59
4.2.11 Simulation Result for Gasoil-vapour 4.0 m/s,
Gasoil-liquid 1 m/s, and Water 1 m/s
60

ix
4.2.12 Simulation Result for Gasoil-vapour 4.0 m/s,
Gasoil-liquid 3 m/s, and Water 3 m/s
61
4.2.13 Simulation Result for Gasoil-vapour 4.0 m/s,
Gasoil-liquid 5 m/s, and Water 5 m/s
62
4.2.14 Simulation Result for Gasoil-vapour 4.0 m/s,
Gasoil-liquid 1 m/s, and Water 4 m/s
63
4.2.15 Simulation Result for Gasoil-vapour 4.0 m/s,
Gasoil-liquid 4 m/s, and Water 1 m/s
64
4.2.16 Simulation Result for Gasoil-vapour 6.0 m/s,
Gasoil-liquid 1 m/s, and Water 1 m/s
65
4.2.17 Simulation Result for Gasoil-vapour 6.0 m/s,
Gasoil-liquid 3 m/s, and Water 3 m/s
66
4.2.18 Simulation Result for Gasoil-vapour 6.0 m/s,
Gasoil-liquid 5 m/s, and Water 5 m/s
67
4.2.19 Simulation Result for Gasoil-vapour 6.0 m/s,
Gasoil-liquid 1 m/s, and Water 4 m/s
68
4.2.20 Simulation Result for Gasoil-vapour 6.0 m/s,
Gasoil-liquid 4 m/s, and Water 1 m/s
69
4.2.21 Simulation Result for Gasoil-vapour 8.0 m/s,
Gasoil-liquid 1 m/s, and Water 1 m/s
70
4.2.22 Simulation Result for Gasoil-vapour 8.0 m/s,
Gasoil-liquid 3 m/s, and Water 3 m/s
71
4.2.23 Simulation Result for Gasoil-vapour 8.0 m/s,
Gasoil-liquid 5 m/s, and Water 5 m/s
72
4.2.24 Simulation Result for Gasoil-vapour 8.0 m/s,
Gasoil-liquid 1 m/s, and Water 4 m/s
73
4.2.25 Simulation Result for Gasoil-vapour 8.0 m/s,
Gasoil-liquid 4 m/s, and Water 1 m/s
74
4.2.26 Simulation Result for Gasoil-vapour 10.0 m/s,
Gasoil-liquid 1 m/s, and Water 1 m/s
75
4.2.27 Simulation Result for Gasoil-vapour 10.0 m/s,
Gasoil-liquid 3 m/s, and Water 3 m/s
76

x
4.2.28 Simulation Result for Gasoil-vapour 10.0 m/s,
Gasoil-liquid 5 m/s, and Water 5 m/s
77
4.2.29 Simulation Result for Gasoil-vapour 10.0 m/s,
Gasoil-liquid 1 m/s, and Water 4 m/s
78
4.2.30 Simulation Result for Gasoil-vapour 10.0 m/s,
Gasoil-liquid 4 m/s, and Water 1 m/s
79
4.2.31 Analysis of Liquid Level at Outlet of Pipe 80
4.3 PDMS Drawing for Equipments 83
4.3.1 Gas, Oil, and Water Separator 84
4.3.2 Gas Compressor 85
4.3.3 Heat Exchanger 86
4.3.4 Gasoil-vapour Storage Tank 87
4.3.5 Gasoil-liquid Pump 88
4.3.6 Gasoil-liquid Tank 89
4.3.7 Gas Suction-receiver Tank 90
4.3.8 Water Pump 91
4.3.9 Water Tank 92
4.3.10 Plant Look North for Equipment Zone 93
4.3.11 Plant Look North Testing Zone Zoom In 95
CHAPTER 5 CONCLUSION & RECOMMENDATIONS 97
5.1 Conclusion 97
5.2 Recommendations 99
REFERENCES 101
APPENDICES 104
xi
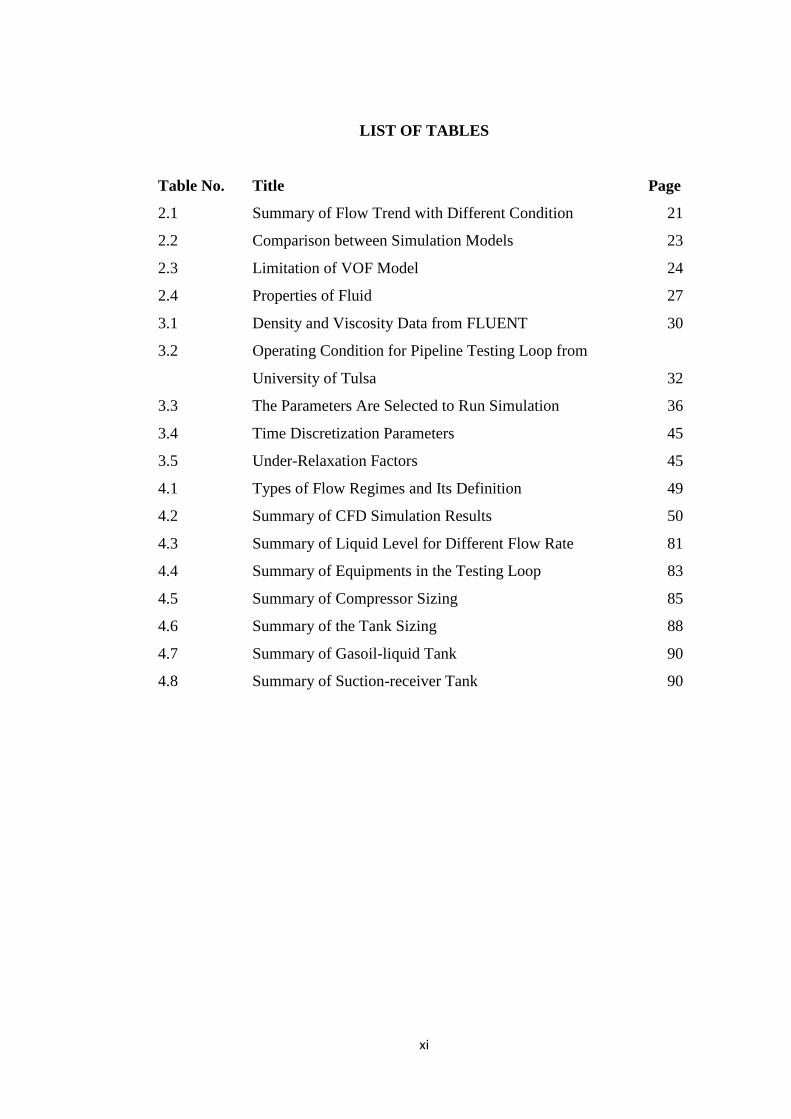
LIST OF TABLES
Table No. Title Page
2.1 Summary of Flow Trend with Different Condition 21
2.2 Comparison between Simulation Models 23
2.3 Limitation of VOF Model 24
2.4 Properties of Fluid 27
3.1 Density and Viscosity Data from FLUENT 30
3.2 Operating Condition for Pipeline Testing Loop from
University of Tulsa
32
3.3 The Parameters Are Selected to Run Simulation 36
3.4 Time Discretization Parameters 45
3.5 Under-Relaxation Factors 45
4.1 Types of Flow Regimes and Its Definition 49
4.2 Summary of CFD Simulation Results 50
4.3 Summary of Liquid Level for Different Flow Rate 81
4.4 Summary of Equipments in the Testing Loop 83
4.5 Summary of Compressor Sizing 85
4.6 Summary of the Tank Sizing 88
4.7 Summary of Gasoil-liquid Tank 90
4.8 Summary of Suction-receiver Tank 90
xii
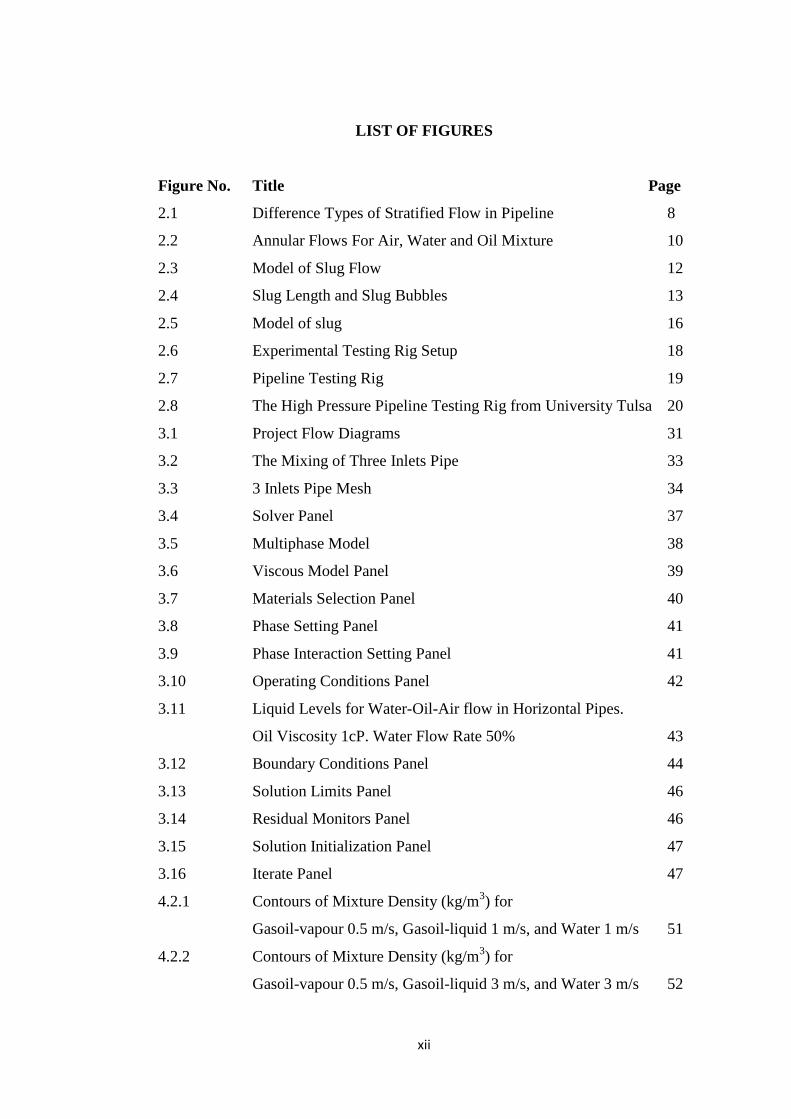
LIST OF FIGURES
Figure No. Title Page
2.1 Difference Types of Stratified Flow in Pipeline 8
2.2 Annular Flows For Air, Water and Oil Mixture 10
2.3 Model of Slug Flow 12
2.4 Slug Length and Slug Bubbles 13
2.5 Model of slug 16
2.6 Experimental Testing Rig Setup 18
2.7 Pipeline Testing Rig 19
2.8 The High Pressure Pipeline Testing Rig from University Tulsa 20
3.1 Project Flow Diagrams 31
3.2 The Mixing of Three Inlets Pipe 33
3.3 3 Inlets Pipe Mesh 34
3.4 Solver Panel 37
3.5 Multiphase Model 38
3.6 Viscous Model Panel 39
3.7 Materials Selection Panel 40
3.8 Phase Setting Panel 41
3.9 Phase Interaction Setting Panel 41
3.10 Operating Conditions Panel 42
3.11 Liquid Levels for Water-Oil-Air flow in Horizontal Pipes.
Oil Viscosity 1cP. Water Flow Rate 50%
43
3.12 Boundary Conditions Panel 44
3.13 Solution Limits Panel 46
3.14 Residual Monitors Panel 46
3.15 Solution Initialization Panel 47
3.16 Iterate Panel 47
4.2.1 Contours of Mixture Density (kg/m3) for
Gasoil-vapour 0.5 m/s, Gasoil-liquid 1 m/s, and Water 1 m/s
51
4.2.2 Contours of Mixture Density (kg/m3) for
Gasoil-vapour 0.5 m/s, Gasoil-liquid 3 m/s, and Water 3 m/s
52
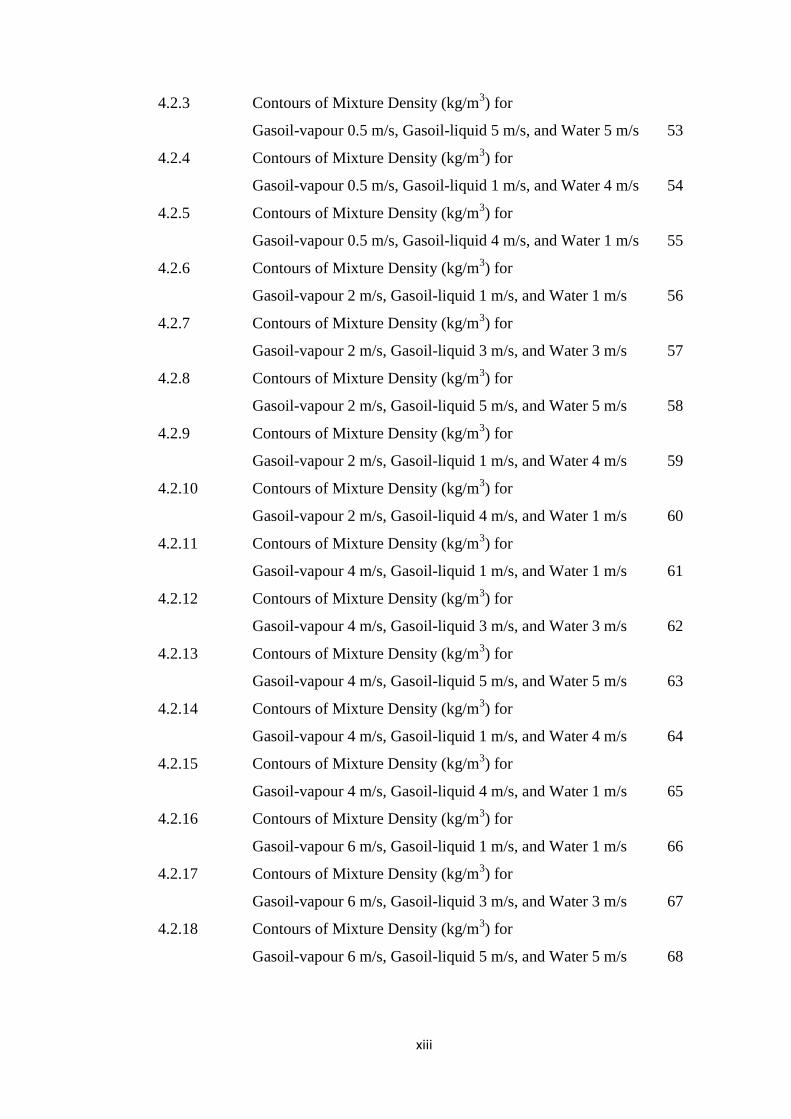
xiii
4.2.3 Contours of Mixture Density (kg/m3) for
Gasoil-vapour 0.5 m/s, Gasoil-liquid 5 m/s, and Water 5 m/s
53
4.2.4 Contours of Mixture Density (kg/m3) for
Gasoil-vapour 0.5 m/s, Gasoil-liquid 1 m/s, and Water 4 m/s
54
4.2.5 Contours of Mixture Density (kg/m3) for
Gasoil-vapour 0.5 m/s, Gasoil-liquid 4 m/s, and Water 1 m/s
55
4.2.6 Contours of Mixture Density (kg/m3) for
Gasoil-vapour 2 m/s, Gasoil-liquid 1 m/s, and Water 1 m/s
56
4.2.7 Contours of Mixture Density (kg/m3) for
Gasoil-vapour 2 m/s, Gasoil-liquid 3 m/s, and Water 3 m/s
57
4.2.8 Contours of Mixture Density (kg/m3) for
Gasoil-vapour 2 m/s, Gasoil-liquid 5 m/s, and Water 5 m/s
58
4.2.9 Contours of Mixture Density (kg/m3) for
Gasoil-vapour 2 m/s, Gasoil-liquid 1 m/s, and Water 4 m/s
59
4.2.10 Contours of Mixture Density (kg/m3) for
Gasoil-vapour 2 m/s, Gasoil-liquid 4 m/s, and Water 1 m/s
60
4.2.11 Contours of Mixture Density (kg/m3) for
Gasoil-vapour 4 m/s, Gasoil-liquid 1 m/s, and Water 1 m/s
61
4.2.12 Contours of Mixture Density (kg/m3) for
Gasoil-vapour 4 m/s, Gasoil-liquid 3 m/s, and Water 3 m/s
62
4.2.13 Contours of Mixture Density (kg/m3) for
Gasoil-vapour 4 m/s, Gasoil-liquid 5 m/s, and Water 5 m/s
63
4.2.14 Contours of Mixture Density (kg/m3) for
Gasoil-vapour 4 m/s, Gasoil-liquid 1 m/s, and Water 4 m/s
64
4.2.15 Contours of Mixture Density (kg/m3) for
Gasoil-vapour 4 m/s, Gasoil-liquid 4 m/s, and Water 1 m/s
65
4.2.16 Contours of Mixture Density (kg/m3) for
Gasoil-vapour 6 m/s, Gasoil-liquid 1 m/s, and Water 1 m/s
66
4.2.17 Contours of Mixture Density (kg/m3) for
Gasoil-vapour 6 m/s, Gasoil-liquid 3 m/s, and Water 3 m/s
67
4.2.18 Contours of Mixture Density (kg/m3) for
Gasoil-vapour 6 m/s, Gasoil-liquid 5 m/s, and Water 5 m/s
68

xiv
4.2.19 Contours of Mixture Density (kg/m3) for
Gasoil-vapour 6 m/s, Gasoil-liquid 1 m/s, and Water 4 m/s
69
4.2.20 Contours of Mixture Density (kg/m3) for
Gasoil-vapour 6 m/s, Gasoil-liquid 4 m/s, and Water 1 m/s
70
4.2.21 Contours of Mixture Density (kg/m3) for
Gasoil-vapour 8 m/s, Gasoil-liquid 1 m/s, and Water 1 m/s
71
4.2.22 Contours of Mixture Density (kg/m3) for
Gasoil-vapour 8 m/s, Gasoil-liquid 3 m/s, and Water 3 m/s
72
4.2.23 Contours of Mixture Density (kg/m3) for
Gasoil-vapour 8 m/s, Gasoil-liquid 5 m/s, and Water 5 m/s
73
4.2.24 Contours of Mixture Density (kg/m3) for
Gasoil-vapour 8 m/s, Gasoil-liquid 1 m/s, and Water 4 m/s
74
4.2.25 Contours of Mixture Density (kg/m3) for
Gasoil-vapour 8 m/s, Gasoil-liquid 4 m/s, and Water 1 m/s
75
4.2.26 Contours of Mixture Density (kg/m3) for
Gasoil-vapour 10 m/s, Gasoil-liquid 1 m/s, and Water 1 m/s
76
4.2.27 Contours of Mixture Density (kg/m3) for
Gasoil-vapour 10m/s, Gasoil-liquid 3 m/s, and Water 3 m/s
77
4.2.28 Contours of Mixture Density (kg/m3) for
Gasoil-vapour 10 m/s,Gasoil-liquid 5 m/s, and Water 5 m/s
78
4.2.29 Contours of Mixture Density (kg/m3) for
Gasoil-vapour 10 m/s, Gasoil-liquid 1 m/s, and Water 4 m/s
79
4.2.30 Contours of Mixture Density (kg/m3) for
Gasoil-vapour 10 m/s, Gasoil-liquid 4 m/s, and Water 1 m/s
80
4.2.31 Graph of Different Gas Flow Rate to Total Liquid Flow Rate
Analysis
82
4.3.1 Isometric 3 View of Gas, oil, and Water Separator 84
4.3.2 Isometric 3 View of Gas Compressor for Gasoil-vapour 85
4.3.3 Isometric 3 View of Heat Exchanger 86
4.3.3.1 Summary of Heat Exchanger Sizing 86
4.3.4 Isometric 3 View of Gasoil-vapour Storage Tank 87
4.3.5 Isometric 3 View of Gasoil-liquid Pump 88
4.3.3.2 Summary of Gasoil-liquid Pump Sizing 89

xv
4.3.6 Isometric 3 View of Gasoil-liquid Tank 89
4.3.7 Isometric View of Gas Suction-receiver Tank 91
4.3.8 Isometric View of Water Pump 91
4.3.3.3 Summary of Equipment Sizing of Water Pump 92
4.3.9 Isometric 3 View of Water Tank 93
4.3.10 Equipment Zone 94
4.3.11 Testing Zone 95

xvi
LIST OF APPENDICES
Appendix Title Page
A Mass Flow Rate Calculation 104
B Data Extracted from FLUENT 106
C PDMS Design Plant Look 123

xvii
LIST OFSYMBOLS
UGS Gas superficial velocity
F Front velocity
AL1 Area at station 1
u1 Velocity
CB Velocity
u3 Liquid velocity at station 3
Volume fraction of the gas in the slug
U3 The gas velocity at station 3
Qout Volumetric flow rate of the liquid detaching from the slug
Umix Volumetric balance between the inlet of the pipe and station 3
g Gravity
D Diameter
Inclination angle
A Cross sectional area
Shear stress acting on the wall wetted by
Shear stress acting on oil-water interface
Shear stress acting on the oil-gas interface
Shear stress acting on the wall wetted by water
Viscosity
Interfacial tension
ULS Summation of water and oil flow rate
ULW Water flow rate, m/s
ULO Oil flow rate, m/s
UOW Total liquid flow rate
h Height of Liquid in Pipe

xviii
LIST OFABBREVIATIONS
CFD Computational Fluid Dynamic
PDMS Plant Design Management System
P Pressure
W Water
O Oil
G Gas
VOF Volume of Fluid
H2S Hydrogen Sulphide
CO2 Carbon Dioxide
SWD Stratified wavy / drops
ODST Oil-Droplet Stratified Flow
SMW Stratified mixed / water layer
SMO Stratified mixed / oil layer
AO Annular Oil Flow
MMSCFD Million Metric Standard Cubic Feet per Day
BPD Barrels of Liquids per Day
cP Centipoises

xix
KAJIAN PENGALIRAN DALAM LITAR PAIP PERCUBAAN
ABSTRAK
Dalam kajian ini, sebuah litar paip percubaan telah diciptakan untuk
pengajian multifasa pengaliran dalam paip. Keseluruhan reka bagi peralatan and paip
rangkaian telah ditunjukkan dalam pengajian ini dengan menggunakan perisian
PDMS. Pengajian mutifasa pengaliran telah dijalankan dengan menggunakan
perisian CFD untuk mengenal pasti jenis trend aliran bagi gas minyak wap, gas
minyak cecair dan air yang mempunyai kadar aliran yang tidak sama dalam paip
diameter 6 inci. Matlamat utama menjalankan pengajian ini adalah untuk
menganalisis aliran multifasa untuk menyelesaikan masalah yang sering dihadapi
oleh industri dalam penghantaran campuran dari takungan minyak ke penapisan
process. Dengan rekaan litar percubaan paip ini membolehkan pengajian multifasa
pengaliran di seksyen percubaan. Litar paip percubaan ini dicipata and direka dengan
membina setiap komponen seperti, tangki, penukar haba dan pam. Litar paip telah
disambung dengan semua peralatan dengan menggunakan bebibir dan injap.
Multifasa simulasi telah dijalankan dengan 6 kadar aliran gas minyak wap dan 4
kadar aliran gas minyak cecair dan air yang tidak sama. VOF model telah dipilih
untuk menyelesaikan simulasi pengesaan permukaan.

xx
FLOW STUDY ON MEDIUM SIZE PIPELINE TESTING LOOP
ABSTRACT
In this research, a pipeline testing loop was constructed to study on the
multiphase flow behavior in pipes. A fully design of equipments and piping network
were constructed in this study by using Plant Design Management System (PDMS)
software. The multiphase flow study was done by Computational Fluid Dynamic
(CFD) software to identify the type of flow trends for different gasoil-vapour flow
rate, gasoil-liquid flow rate, and water flow rate in a 6 inches diameter of pipe. The
main purpose of this study was to perform the analysis of multiphase flow in order to
understand the flow problem that is always encountered in the industry when
transporting a mixture from reservoirs to the onshore oil production process. By
working on the model fabricated on the pipeline testing loop, the multiphase flow
study was able to be studied at the test section in the testing loop. The pipeline
testing loop was created by constructing each of the equipments places in the
pipeline such as tank, heat exchanger, and pump. The piping network was connected
to all the equipments with valves and flanges. The multiphase simulation was carried
out by six (6) different gasoil-vapour flow rates and four (4) different gasoil-liquid
and water flow rates. Volume of Fluid (VOF) model was selected as the simulation
approach to solve the surface tracking simulation.

1
CHAPTER 1
INTRODUCTION
1.1 Background of Study
Nowadays, the demand of crude oil and natural gas by the world’s ever
increasing population, especially in the developing countries. The use of petroleum
products are increasing year by year due to the development of the country and
economy. There is a drastic high demand on the production of oil and gas within the
industry. The transportation of oil and gas through pipeline is the conventional way
of transporting. During the transportation of oil and gas, there are numerous
transportation issues that arise, such as Saturated Aromatic Resins and Asphaltenes
(SARA) characteristic of crude oil which contains varying amount of wax, or
paraffin and corrosive compounds such as hydrogen sulphide (H2S) and carbon
dioxide (CO2). Other than these compounds, the crude oil also tends to deposit some
wax and paraffin residuals on the pipeline walls which will cause the reduction of the
cross-sectional area of the pipeline and increase the external pressure. The external
pressure will act as a driving force to push the oil from the offshore facility to the oil

2
production plant. Since the pipeline system plays an important role with the oil and
gas industry, it is necessary that regular maintenance be carried out.
There are a lot of pipeline testing loops such as 6’’ High Pressure Large-
Diameter Pipeline, 6’’ Low Liquid Large-Diameter Pipeline, 3’’ Hilly-Terrain
Multiphase Pipeline, 3’’ Gas/Oil/Water Flow Loop, 2’’ High Viscosity Oil/Gas Two-
phase Flow Loop (James, 1973). These facilities are used to test the flow in the
pipeline with different conditions. In addition, there are some problems like pressure
drop or multiphase flow frequently occurring in pipeline during the transportation of
oil and gas or other chemical compounds. Therefore, the pipeline testing loop is also
used to test the pressure drop for gas and liquid especially for the multiphase flow
situation.
The pipeline testing loop is also important to determine the friction
mechanism governing the flow for multiphase flow. The main focus in this research
is to conceptual build a medium size (6’’) pipeline testing rig and analyzes the
multiphase fluid flow in the pipeline. By performing this testing loop, there is more
information that would lead to further understanding about the pipe flow that is
governing the multiphase flow.
1.2 Problem Statement
The oil and gas industry always encounter multiphase flow problems such as
the presence of slug, solid particles, natural gas, oil and water. The oil and gas that

3
are produced from the reservoirs always contain sea water and sand. This formed a
mixture flow called slug flow. Slug flow creates a potential problem for the
transportation of crude oil from offshore to onshore production process. It is
unfavorable to the processing equipments downstream due to the intermittent flow of
crude inside the pipe. The flow is highly complex, unstable and hard to handle and
will create a large pressure drop and accumulation inside the pipeline which clogs the
pipeline and produces an unfriendly flow trend. This formation will definitely affect
the separation unit for oil and gas. Hence, the multiphase flow model using
Computational Fluid Dynamic (CFD) and Plant Design Management System (PDMS)
are needed to model pipeline testing loop. There are some mathematical assumptions
made and reviewed in order to form a good multiphase flow in a pipeline.
1.3 Research Objectives
The research objectives must be able to achieve the designing, simulation and
understanding of the pipeline testing loop and flow trends. Therefore, three research
objectives have been determined to achieve the goal of this research, and that are
i. To construct a testing rig for the multiphase system by using PDMS
ii. To determine the multiphase flow trend along the pipe by using CFD
iii. To determine the liquid level over diameter at the pipe outlet by using CFD

4
1.4 Scope of Research
The scope of research covers the types of flow such as slug flow, stratified
flow, plug flow, and bubbles flow. In addition, the pipeline testing rigs from different
researches are studied in order to get a suitable pipeline section and parameters for
this work. The simulation models formulation in FLUENT simulator such as
Eulerian, Volume of Fluid (VOF), and Mixture are the models that need to be studied.
PDMS software is used to design the pipeline testing loop. Slug flow stabilities
analysis is to understand the stability of slug and its structure. The behavior of slug
will affect the stability and this is the most common flow problem occur in
multiphase pipe flow. The slug length is to study the average slug length inside the
pipe with varying pipe diameters. This scope also provides the information about the
entrance conditions, flow rates of gas and liquid, and the pipe inclination affecting on
the slug length. Transition to slug flow studies is about the transition flow formation.
It also covers about the instability of a stratified flow to long wavelength
disturbances and instability of stratified flow. Pipeline testing rig for multiphase
system is the main item in this study. The testing rig is very important in order to
generate the analysis of multiphase flow by using CFD. This scope provides the
information about different testing rig with different rig structures. The main focus in
the testing rig is to understand the behaviors of the oil, gas and water flow trend of
this multiphase flow inside the test section. CFD multiphase flow model is to
understand the past researcher’s work on the multiphase flow by using CFD. The
study gives some knowledge about the model of CFD analysis and the results.
Mathematical model to simulate the multiphase flow in CFD is to study about the
velocity of the moving bubble by considering and the rate of the liquid adjoining and

5
detaching from a slug at is front and rear. This mathematical model can provide the
volumetric flow rate of the liquid detaching from the slug. Multiphase simulation
model is very important to be determined in order to obtain a better result. There are
few models such as Eulerian, VOF, and Mixture. Each of these models has different
limitation and specification. Thus, it is necessary to choose the best model among
them. Type of flow motions either lamina or turbulent flow of fluid is common types
of flow motion. In the simulation, the lamina and turbulent also need to be
determined for choosing the correct turbulent model. Either steady state or unsteady
state flow will be considered in this work. It depends on the change of properties,
velocity and temperature for the flow. If there is change in properties, velocity, and
temperature the unsteady state flow must be chosen. Boundary condition such as wall
condition, interfacial tension between the fluids, flow rate, and phases need to be
defined in the simulator. The interfacial tension is the attractive forces between
molecules in a fluid. When two fluids come into contact to each others, there must be
force acting between them. The flow rate for every phase can affect the flow trend in
the pipe. Plant Design Management System (PDMS) is classified as design software
which user can used to design chemical plant. This software is able to construct
equipments and piping network.
1.5 Significance of Study
One of major difficulties faced when transporting oil and gas through a
pipeline is the unsteady flow of the fluid in pipeline. The oil and gas production
industries have faced a lot of issues due to this unsteady flow regime inside the pipe.
6
If left uncontrolled, it will reduce the quality composition of the product greatly
which causes unwanted losses in the production process in oil and gas plant.
Therefore is it important to solve these issues by understanding the flow trending of
multiphase flow inside the pipeline in order to increase the quality of the production
of oil and gas. In order to perform this study, CFD is used to analyze the multiphase
flow in the testing rig to create a computer simulation model to solve the multiphase
flow problem. The result obtain is comparable with the real experimental results
measured with minimal errors.

7
CHAPTER 2
LITERATURE REVIEW
2.1 Chapter Overview
There are seventeen main sections in this chapter. In the first section,
stratified flow patterns have been discussed to explain about the different models of
stratified flow which can be formed under different conditions. In the second section,
the annular flow is being discussed in relation to the annular formation superficial
velocity and its characteristics. The third section discusses about slug flow behavior
by looking of the slug formation condition. Next, the slug length is also an important
scope to study the effect of pipe diameter on the slug length. Then, transitions to slug
flow and its definition have been discussed. Furthermore, the slug stability theory
with the equation related to the slug flow is being discussed. After that, comparison
also been made for the researchers use different pipeline testing rig to study about the
multiphase flow trend. Then, in the section 2.7 and 2.8 some useful mathematic
models that can link to this study have been discussed. From section 2.9 to 2.16
mainly discuss about the parameters and models need to use in the simulation. The

8
comparisons and definitions for all the parameters and models have been stated and
selected clearly and understanding.
2.2 Stratified Flow Pattern
Figure 2.1 Difference Types of Stratified Flow in Pipeline
(Source: Al-Yaaris & Abu-Sharkh, 2011)
The stratified wavy flow occurs when the phases are completely segregated
with the interface between them showing a characteristic wavy nature (Al-Yaaris &
Abu-Sharkh, 2011). The Stratified wavy / drops (SWD). On the other hand, Oil-
Droplet Stratified Flow (ODST), which is similar to the mixed flow pattern defined
by Arirachakaran et al. (1989) occurs at the higher water fraction conditions. The
entrainment of one or both phases as drops in the other has begun, the droplets being
concentrated near the interface zone (stratified wavy with mixing interface).