focus on the essentials - rational ag · 10-year overview 2013 2012 2011 2010 2009 2008 2007 2006...
TRANSCRIPT

research &
development
suppliers
sales
service
customers
production&
delivery
ANNUAL REPORT
2013
FOCUS ON THE ESSENTIALS

RATIONAL AG company profile
We are the global market and technology leader in innovative solutions for the thermal food preparation. Our primary corporate objective is as follows: “We offer the greatest possible benefit to the people preparing hot food in the professional kitchens around the world.” Our trendsetting innovations set the global standard for cooking intelligence, cooking quality, user friendliness and resource efficiency.
The SelfCookingCenter® whitefficiency® and the VarioCookingCenter MULTIFICIENCY® are able to deal with practically all cooking process-es. They can grill, steam, gratinate, bake, ferment, roast, braise, simmer, stew, poach, blanch, deep-fry, cook at low temperatures and much more. As a result, they replace virtually all conventional
cooking equipment in the professional kitchen and are winning over customers worldwide. RATIONAL maintains a presence in over 100 countries through own sales companies and independent sales partners.
Our equipment is ideal for organisations serving 30 meals a day or more. Customers include restaurants, hotels, company canteens, hospitals, schools, universities, military facilities, prisons and retire-ment homes, as well as fast-food chains, caterers, supermarkets, butchers’ shops, bakeries and snack outlets. The potential global market comprises more than 2.5 million professional kitchens, of which to date only around 30% use combi-steamer technology. 70% of all potential customers still use traditional cooking equipment.
Global presence
Key financial figuresKey figures 2013/2012 2013 2012
Sales m EUR 461.1 435.0
Gross profit m EUR 280.7 261.7
Depreciation/Amortisation m EUR 7.2 6.8
EBIT m EUR 128.3 122.7
EBIT-margin % 27.8 28.2
Return on equity (after taxes) % 38.4 42.0Return oninvested capital (ROIC) % 34.6 38.4
Equity ratio % 71.2 72.8
Cash flow from operating activities m EUR 102.8 111.4
10-year Overview 2013 2012 2011 2010 2009 2008 2007 2006 2005 2004Sales m EUR 461.1 435.0 391.7 350.1 314.4 343.0 336.6 283.7 246.4 221.8EBIT m EUR 128.3 122.7 102.2 105.8 90.5 83.1 92.6 80.5 66.9 53.3Group earnings m EUR 97.2 93.3 78.7 79.8 67.3 61.7 61.2 51.8 42.4 33.8Earnings per share EUR 8.55 8.20 6.93 7.02 5.92 5.42 5.38 4.55 3.73 2.98Cash flow from operating activities m EUR 102.8 111.4 67.7 86.9 83.2 71.0 61.1 49.1 32.8 39.2Return on invested capital (ROIC) % 34.6 38.4 33.2 33.9 35.5 40.7 48.0 49.6 40.4 32.1Balance sheet total m EUR 377.3 326.2 283.2 305.7 265.7 209.0 187.4 146.6 132.1 146.8Equity ratio % 71.2 72.8 73.1 75.3 71.4 63.9 66.2 72.2 68.1 70.9Number of employees (average) 1,320 1,258 1,184 1,058 1,031 1,090 965 864 792 742Dividend per share * EUR 6.00 5.70 5.50 9.00 3.50 1.00 4.50 3.75 3.00 5.00
* Payout in the following year, 2013 subject to approval by the General Meeting of Shareholders 2014
Sales by region in 2013
Europe 50% (2012: 50%)
(excluding Germany)
Germany 13% (2012: 14%)
Rest of the world 6% (2012: 5%)
Asia 13% (2012: 14%)
Americas 18%(2012: 17%)
Sustainable and efficient: thermal preparation of food using RATIONAL products
20092004 20062005 2007 2008 2012 20132010 2011
ebit development and ebit margin 2004 to 2013
ebit in m eur ebit margin in %
122.7128.3
102.2
53.3
66.9
80.5
92.683.1
90.5
105.8
2427
2828
24
2930
26
28 28
20092004 20062005 2007 2008 2012 20132010 2011
ebit development and ebit margin 2004 to 2013
ebit in m eur ebit margin in %
122.7128.3
102.2
53.3
66.9
80.5
92.683.1
90.5
105.8
2427
2828
24
2930
26
28 28

Key figures regarding RATIONAL shares
Financial calender 2014Balance Sheet Press Conference Fiscal Year 2013 Munich 20 Mar 2014DVFA Analyst Meeting Frankfurt 20 Mar 2014Financial figures Q1/2014 Landsberg 30 Apr 2014General Shareholders Meeting 2014 Augsburg 30 Apr 2014Financial figures Q2/2014 Landsberg 30 Jul 2014Financial figures Q3/2014 Landsberg 29 Oct 2014
RATIONAL shares – basic informationNumber of shares 1) 11,370,000
Shareholderstructure 1) Holding shares 70.8%, Free float 29.2%
ISIN DE0007010803
WKN 701 080
Market abbreviation RAA
1) Status: 20 February 2014
Key figures 2012/2011 2013 2012
Maximum price 1) EUR 269,15 221,70
Minimum price 1) EUR 200,00 166,15
Year-end closing price 1) EUR 241,10 218,00
Market capitalisation 2) m EUR 2.741,3 2.478,7
Dividend yield 3) % 2,5 2,6
Beta factor (one year) as of 31 Dec 4) 0,78 0,84
Sales per share EUR 40,56 38,26
Price-to-sales ratio 2) 5,9 5,7
Earnings per share EUR 8,55 8,20
Price-earnings ratio 2) 28,2 26,6
Cash flow per share EUR 9,05 9,80
Price-cash flow ratio 2) 26,7 22,2
1) German stock market 2) as of balance sheet date 3) in relation to the previous’ year closing price 4) in relation to the MDAX-Performance-Index
140
90
110
100
120
130
rational ag dax mdaxrational ag dax mdax
0
600
800
200
400
11 12 1310090800 01 02 03 04 05 06 07
Performance of the rational shares since the ipo 2000
Index (issue price 23.00 eur = 100); in %
Performance of rational shares in 2013
Index (30 December 2012 = 100); in %
Dec.Nov.Oct.Sept.Jan. Feb. Mar. Apr. May June July Aug.
Year-end closing price eur 241.10 Year-end closing price eur 241.10 1,200
1,000
Maximum customer benefit due to easy handling, best cooking quality and efficiency
Smart cooking: the VarioCookingCenter MULTIFICIENCY®
The SelfCookingCenter® whitefficiency® transfers the heat via steam, hot air or a combination of the two. The key unique selling proposition is cooking intelligence, which automatically determines the optimum cooking process, so that the desired result can be achieved with perfect precision every time and without any need for the cooking process to be supervised. The chef is notified as soon as the cooking process has come to an end, leaving him time for the essentials: creativity and the wellbeing of his guests.
Perfectly designed: the SelfCookingCenter® whitefficiency®
The VarioCookingCenter MULTIFICIENCY® cooks in liquids or in direct contact with heat. It is up to four times faster than comparable pro-ducts, with 40% less energy consumption. The cooking intelligence controls the cooking process fully automatically and perfectly matches it to the desired results of the dishes. The chef is notified as soon as he needs to take action himself. Nothing boils over, nothing burns. Anyone, who has experienced the benefits, will never want to go back to cooking without them.
The Executive BoardDr Peter Stadelmann, CEOErich Baumgärtner, CFO Peter Wiedemann, CTOMarkus Paschmann, CSO
Erich BaumgärtnerChief Financial OfficerPhone: +49 8191 327-209 [email protected]
Stefan ArnoldHead of Group Accounting/Investor RelationsPhone: +49 8191 327-2209 [email protected]
ContactExecutive Board and Supervisory Board
Status: 20 March 2014
The Supervisory BoardSiegfried Meister, ChairmanWalter Kurtz, Deputy ChairmanDr Hans Maerz, Deputy Chairman

in m eur 2013 2012
Change
absolute
Change
in %
Sales and earnings
Sales 461.1 435.0 +26.1 +6
Sales abroad in % 87 86 +1 –
Cost of sales 180.4 173.3 +7.1 +4
Sales and service expenses 111.2 105.8 +5.4 +5
Research and development expenses 16.7 13.6 +3.1 +23
General administration expenses 21.3 18.8 +2.5 +13
Earnings before interest and taxes (ebit) 128.3 122.7 +5.6 +5
Net Income 97.2 93.3 +3.9 +4
Return on invested capital (roic) in % 34.6 38.4 –3.8 –
Balance sheet
Balance sheet total 377.3 326.2 +51.1 +16
Working capital1) 78.9 69.8 +9.1 +13
Equity 268.8 237.4 +31.4 +13
Equity ratio in % 71.3 72.8 –1.5 –
Cash flow
Cash flow from operating activities 102.8 111.4 –8.6 –8
Investments 12.0 9.4 +2.6 +29
Free cash flow2) 90.8 102.0 –11.2 –11
Key fi gures rational share
Earnings per share (in eur) 8.55 8.20 +0.35 +4
Year-end closing price3) (in eur) 241.10 218.00 +23.10 +11
Market capitalisation 2,741.3 2,478.7 +262.6 +11
Employees
Number of employees as of 31 Dec 1,341 1,263 +78 +6
Number of employees (average) 1,320 1,258 +62 +5
Sales per employee (in keur) 349.4 345.8 +3.6 +1
1) Excluding liquid funds2) Cash flow from operating activities less investments3) German stock market
Key Figures
Follow the qr code or the link
www.rational-online.com/en/investor_relations
to the ir-Center of rational ag

FOCUS ON THE ESSENTIALS
Our consistent orientation to our clearly defi ned target group, professional kitchens, and their core
activity – the preparation of hot food – has meant that we know our customers’ wishes and needs down
to the smallest detail. We are part of their world and so are able to solve their problems better than
anyone else. We concentrate on our strengths and key skills and focus our eff orts in other areas by
means of partnerships with skilled specialists. This strategy allows us to achieve maximum benefi t
for our customers.
1 To our Shareholders
2 Foreword by the Supervisory Board
4 Letter from the Executive Board
focus on the essentials
8 Maximum customer benefi t
12 Research & development
14 Development partnerships
16 Partnership of winners
24 The production and delivery process
26 Service partners
28 40 years of rational innovations
30 frima – the VarioCookingCenter multificiency®
32 Enthusiastic employees
for maximum customer benefi t
34 rational shares
38 Corporate Governance Report
40 Declaration of Compliance of
rational Aktiengesellschaft
42 Report of the Supervisory Board
45 Group Management Report
77 Consolidated Financial Statements
118 Further information
118 10-year overview
119 Financial calendar 2014
120 Imprint
Contents
research & development
sales
service
production& delivery
suppliers
customers

Foreword by the Supervisory Board
Dear Ladies and Gentlemen,
When our company started out, some 40 years ago, it employed a mere
18 people, and no one could have foreseen just how successful it would
become. Right from the outset, our motivation was to do things better than
others and this was what shaped our entrepreneurial philosophy. Hence,
the primary question was not: “How can we maximise our profi ts?”, but
rather “How can we use innovative cooking technology to make life easier
for people working in the professional kitchens of this world?” And we
have remained true to this consistent orientation of the entire company to
maximum customer benefi t right up to the present day.
Success thanks to specialisation and focus
Specialising in the thermal preparation of food has enabled rational,
right from the outset, to expand its strengths and thus create and success-
fully occupy a completely new market.
Yet, a company can only off er maximum benefi t to its customers if it is able
to understand the wishes and needs of its target group and to develop the
right solutions for them. This works best by focusing on a clearly defi ned
group of customers. Only by concentrating forces it is possible to connect
intimately with customers and thus become part of their world.
Over the past four decades we have demonstrated that we off er maximum
customer benefi t and in doing so have gained the reputation of being one
of the best solution providers in the sector. The fact that rational is now
by far the world market leader can be ascribed to our ability time and again
to surprise customers positively with our performance. This is the criterion
for our success, and will remain so for the next 40 years, too.
New generation at the helm
Aft er 17 successful years at the helm of the Executive Board, Dr Günter
Blaschke relinquished his position as ceo of the company by mutual
agreement at the end of the 2013 fi scal year. With his entrepreneurial
foresight and commitment, he successfully drove forward the internation-
alisation of the business and made rational one of the best companies on
the German stock market.
2 To our Shareholders
Foreword by the Supervisory Board

Dr Peter Stadelmann, who joined our Executive Board in 2012, took over
as ceo on 1 January 2014. As an outstanding personality and experienced
manager he, together with his colleagues on the Executive Board, will
ensure the consistent continuation and further development of the current
corporate strategy and philosophy. I wish him and his colleagues every
success in this.
Finally, a special word of thanks should go to our employees, because
without their tireless eff orts and loyalty, the rational success story
wouldn’t be as it is today.
Siegfried Meister
Siegfried Meister
Chairman of the Supervisory Board
3To our Shareholders
Foreword by the Supervisory Board
rational Annual Report 2013

Letter from the Executive Board
Dear Shareholders, Customers and Business Partners,
2013 was characterised by diff erent economic cycles in the major regions
of the world. Whereas the emerging countries grew at an above-average
rate of around 5% and North America and Japan still posted solid growth
of 2%, economic performance in the Eurozone stagnated.
6% sales growth, 28% ebit margin
2013, rational successfully continued on its path of international growth.
As a heavily export-dependent business, the weakness of major currencies
had a negative eff ect on our sales patterns. Over the year, the Japanese
yen, the pound sterling, the us dollar and the Brazilian real all fell sharply
in value against the euro. These countries account for around one third of
our sales and, therefore, their currencies had a negative impact on overall
growth. In total, sales rose by 6% to 461 million euros in 2013. Aft er ex-
change rate adjustments, growth stood at 9%.
ebit (earnings before interest and taxes) was slightly up on last year’s
already good level at 128.3 million euros (2012: 122.7 million euros). The
ebit margin was 28% (2012: 28%).
54% global market share
By consistently focussing on customer benefi t from the outset, we have
succeeded in becoming the uncontested global market leader. Today,
every second combi-steamer sold in the world comes from rational. In the
past fi scal year we managed to further confi rm and strengthen this unique
market position.
Our products – the rational SelfCookingCenter® whiteffi ciency®,
the rational CombiMaster® Plus and the frima VarioCookingCenter
multificiency® – are superior to those of our competitors and remain the
key to our success. With these products, our customers at all times get the
best possible technology and quality at an attractive price.
Technological edge combined with maximum customer satisfaction
Our product leadership was confi rmed to us once again in 2013 by a
customer satisfaction survey conducted by tns Infratest. For 98% of the
customers surveyed, rational off ers the maximum benefi t. For us, this
is both an incentive and an obligation, not only to satisfy our customers’
expectations, but also to exceed them in future.
4 To our Shareholders
Letter from the Executive Board

Owners of the frima VarioCookingCenter multificiency® are also de-
lighted with this new technology, which is complementary to the combi-
steamer. Virtually every one of them would buy the VarioCookingCenter
multificiency® again immediately.
Sound fi nancial basis
The good sales and earnings fi gures have further consolidated our sound
balance sheet structure. An equity ratio of over 70%, combined with high
free liquidity, underscores our company’s stability and its ability to operate
eff ectively in future. Our shareholders have rewarded this with an increase
in the value of the company to over 2.7 billion euros as at the balance sheet
date.
6.00 euros dividend proposed
As every year, we would also like our shareholders to participate com-
mensurately in the company’s profi ts. The Executive Board and Supervisory
Board therefore propose to the General Meeting of Shareholders to be held
on 30 April 2014 to distribute a dividend of 6.00 euros for the 2013 fi scal
year. Based on the share price at year-end 2013, this represents a dividend
yield of 2.5%, and the payout ratio is 70%.
Corporate quality is employee quality
Key to the sustained success of the business are our over 1,300 committed
employees around the world, who think and act like Entrepreneurs in the
Company (U.i.U.®). This means they work as autonomous entrepreneurs,
master and complete their tasks, develop their working methods, make
necessary decisions and take responsibility for them.
Dr Günter Blaschke Dr Peter Stadelmann
5To our Shareholders
Letter from the Executive Board
rational Annual Report 2013

91% of all rational employees around the world are not only satisfi ed,
but are proud to work for rational. This forms the basis for continuing
maximum customer satisfaction in future, as only motivated employees
can inspire customers with their outstanding performance for the long
term.
Cautiously optimistic for the future
Current forecasts by economic experts assume a rise in global economic
output of close to 4% for 2014. Against this backdrop, and with an eye to
our superior products and services, the huge untapped customer potential
and our sound fi nancial footing, we are cautiously optimistic for 2014 and
are assuming we will continue on our successful growth path.
Our thanks, also on behalf of all Executive Board colleagues, go to our
customers and business partners and to you, our shareholders, for once
again in the year under review placing your confi dence in us.
In particular, however, we would like to thank our employees. Their high
levels of commitment have once again made a vital contribution to the
overall success of the business.
Dr Günter Blaschke
Chief Executive Offi cer of rational ag
(until 31 December 2013)
Dr Peter Stadelmann
Chief Executive Offi cer of rational ag
(since 1 January 2014)
6 To our Shareholders
Letter from the Executive Board

Management
Markus Paschmann
Chief Sales Offi cer
Born in 1966, he began his
career at Siemens ag. He then
moved to the Harting Technology
Group, where he was Head of the
Global Business Unit Electronics
and Managing Director of Hart-
ing Electronics GmbH. In 2006,
he became a member of the
Executive Board of sick ag with
responsibility for factory automa-
tion and marketing segments.
With eff ect from 1 December
2013, Markus Paschmann was
appointed as Chief Sales Offi cer
of rational ag.
Dr Peter Stadelmann
Chief Executive Offi cer
Born in 1965. Aft er his studies
and dissertation at St. Gallen
University he spent over 20
years in a va riety of managerial
functions for the Malik Manage-
ment Center St. Gallen. From
2006 to 2012 he was operational
manager for the Malik Group. In
December 2012, he joined the
Executive Board of rational ag
as Chief hr Offi cer. Since 1 Janu-
ary 2014, Dr Stadelmann is Chief
Executive Offi cer of rational ag.
Peter Wiedemann
Chief Technical Offi cer
Born in 1959, joined rational
GmbH as an engineer aft er
studying mechanical engineering
at the Technical University of
Munich in 1988. From 1990 to
1993, he was Product Manager.
Subsequently, he supported the
development of the American
subsidiary. Since January 1996,
he has been responsible for the
tech nical division as a member
of the management team. In
Sep tember 1999, he was ap-
pointed to the Executive Board
of rational ag.
Erich Baumgärtner
Chief Financial Offi cer
Born in 1954. From 1979 to 1987,
he worked in various commercial
functions at Messerschmitt-
Bölkow-Blohm GmbH. In 1988,
he moved to Digital Equipment
GmbH, Munich, where, from
1996 on, he was responsible
for commercial operations as
Managing Director. In October
1998, he came to rational.
Since December 1998, he has
been responsible for commercial
operations on the Executive
Board of rational ag.
7rational Annual Report 2013 To our Shareholders
Management

The secret of our success over the past 40 years is
particularly due to our basic principle of intelligent
diff erentiation. The German physicist and author Georg
Christoph Lichtenberg tellingly formulated this principle
around 1775 as follows:
» I cannot say whether things will get better if they change, what I can say is that they must change if they are to get better.«
rational is diff erent
If a company wants to be signifi cantly better than the oth-
ers, it fi rst has to be diff erent. And rational is diff erent.
Our business is diff erent. That diff erence starts from the
basic strategic orientation.
Our top corporate goals are not sales or profi ts – as is
generally the case – but always the maximum customer
benefi t. The only way to strengthen the attractive force
of a brand and to strengthen demand and growth is to
continuously increase the level of customer benefi t. We
are convinced that only by consistently aligning ourselves
to customer benefi t a sustained increase in the value of
the business can be achieved.
In order to meet our own objectives to the full, we
concentrate consistently on one target group – people in
the professional kitchens of the world who prepare hot
food – and off er the greatest possible benefi t: the best
products and services on the market at attractive prices.
We employ 300 trained chefs in sales and in application
consulting and development. We connect intimately with
our target group, to know their wishes and needs in detail
and are able to provide ideal solutions to their challenges
and problems.
Our own claim: maximum customer benefi t thanks
to the best technology
Providing customers the maximum benefi t can only be
achieved by off ering the best technology for the optimum
solution to their problems. The new SelfCookingCenter®
whiteffi ciency® launched in 2011 sets new standards
when it comes to cooking perfection, effi ciency, flexibility,
user-friendliness and ease of cleaning. The increasing
appeal to our customers is readily apparent from the
growing numbers of units sold every year.
The fact that maximum customer benefi t is not simply a
claim on our part but is something experienced by our
customers at fi rst hand is shown by the results of a cus-
tomer survey conducted by tns Infratest in 2013. 98% of
all rational customers confi rm that compared to all other
equipment used in the kitchen, our products off er by far
the greatest benefi t.
Our own claim: maximum customer benefi t
thanks to the best services
Our general claim in dealings with customers is:
“Every contact with rational is a positive experience
for the customer.” The experience can only be positive
if customers’ expectations are signifi cantly exceeded.
We off er our customers a wide variety of tailor-made
services before they make a purchase, but even more
so aft erwards, throughout the entire commercial
relationship.
FOCUS ON THE ESSENTIALS – MAXIMUM CUSTOMER BENEFIT
8 To our Shareholders
Focus on the Essentials

» Large amounts of food have to be served as fast as possible at the Oktoberfest. rational appliances have
never let me down.«
Pascal Heide-Nigg, Junior and Executive Chef, “Pschorr-Bräurosl”, Munich, Germany
» rational means variety. Since we have been
working with rational we became much more
attractive to our customers.«
Irina Razumovskaya, Deputy Manager, Gazprom Neft , Moskow, Russia
» No dish leaves our kitchen without having been
touched in some way by our rational units.«
Barbara Lynch, Founder & ceo, Barbara Lynch Gruppo, Massachusetts, usa
usa
9rational Annual Report 2013 To our Shareholders
Focus on the Essentials

» We just need to push a button and do always
get the same result. This cooking perfection
we can only achieve with rational.«
Nicolas Tsimidakis, Executive Chef,
Majestic Hotel Tower, Dubai, United Arab Emirates
» Aft er experiencing rational for the fi rst time I knew
what I was missing in my kitchen. I can only recommend
it – it changes your kitchen life.«
Purity Waihumbu, Director, Heritage Grill Limited, Nairobi, Kenya
europe
africa
asia
Subsidiaries
Representations
Exclusive partners
10 To our Shareholders
Focus on the Essentials

Worldwide, 76,000 visitors to our CookingLive seminars
are testimony to the high level of interest in our tech-
nologies. In a cooking demonstration lasting several
hours our rational chefs show potential customers the
advantages of our equipment. The customers can also
try things out for themselves, and so experience the
multiple benefi ts directly.
Aft er the sale we assist and support the users of our
technology via the Clubrational – in the meantime having
over 46,000 members – with numerous free services, such
as international recipes, rational soft ware updates for
improved cooking results, and much more.
In the Academy rational our chefs work with customers
aft er the sale to cook their special menus, so they can use
our technology to the full in day-to-day operations in their
kitchens.
Needless to say, we off er these services to our customers
free of charge. Hence we provide them with all the support
they need to make the very best use of their equipment
and to continuously increase their benefi t, all at no ad-
ditional cost.
In addition, since 2013 we have off ered our customers a
special service. Our homepage allows them to contact our
ceo directly and to tell him what they want, make sugges-
tions or express criticisms, if they are ever less than 100%
satisfi ed.
Our wide programme of services was singled out for
praise in 2013. Out of around 100 participating fi rms from
diff erent sectors, rational took fi rst prize for the quality of
its services. Hence we are particularly proud that our own
claim of making every contact with rational is a striking
experience for our customers was met to the highest
degree.
Our own claim: maximum customer benefi t
at attractive prices
The general economic consensus is that greater benefi t
thanks to a better product justifi es a higher price. But
rational takes a diff erent view, as this consensus is
out of step with the company’s philosophy of customer
benefi t.
As it says in our philosophy: “We are a winning team.
We play at the top level for the World Championship.”
We specialise in customer benefi t, and when it comes to
customer benefi t we won’t be beaten by anyone. Every
customer should be able to aff ord to acquire the best
product at an attractive price. Which is why in 2011 we
launched the SelfCookingCenter® whiteffi ciency® without
any increase in price.
This is how we manage to off er as many customers as
possible the maximum benefi t. The fact that we are doing
ever better with this was confi rmed by 2,000 decision-
makers in the hotel, restaurant and communal catering
sectors at the Best of Market Awards 2013 presented
by the trade magazines “fi rst class”, “gvmanager” and
“24 Stunden Gastlichkeit”. We emerged as the overall
winner with quality, service and above all the best price/
performance ratio as criteria assessed.
» The way rational turns out food
is just amazing.«
Julia Carmen Desa, Co-Owner, Tres, Delhi, India
11rational Annual Report 2013 To our Shareholders
Focus on the Essentials

Product and technology leadership has been fi rmly
entrenched in our philosophy. This states: “We promise
our customers the best possible technology and quality
at a reasonable price.”
Depth of in-house knowledge is vital for
product leadership
Permanently off ering more product benefi ts than others,
and continuously demonstrably increasing this benefi t,
calls for regular genuine innovations. The fundamental
prerequisite for being truly innovative is indepth know-
ledge combined with creativity and passion.
Indepth, in-house knowledge additionally calls for ap-
plication orientation. For us, this means fully automated
cooking. Intelligent cooking profi les allow maximum
ease of operation of the equipment. Hence we see
ourselves not primarily as excellent mechanical engi-
neers but as the company for chefs. In our research and
development organisation we therefore employ chefs,
physicists, food scientists as well as engineers in the
areas of hardware, soft ware and electronics.
By focusing the whole business on the professional
kitchens of the world and on their core activity – cooking
– we have created the ideal preconditions for inventions.
Thus we managed to revolutionize the segment of ther-
mal food preparation again and again. Starting in 1976,
the combi-steamer replaced conventional cooking equip-
ment, such as hot air appliances or boiling pans, and
the SelfCookingCenter® whiteffi ciency® is now replacing
the large installed base of older combi-steamers
additionally.
We focus on a basic human need, namely hot food away
from home. As people’s prosperity increases, this need
is steadily growing which gives us additional confi dence
for the future.
Best Innovator 2012/2013
Our special innovative strength is confi rmed regularly
in the form of numerous awards. In 2013, a.t. Kearney
and the Fraunhofer-Gesellschaft awarded us as “Best
Innovator 2012/2013” in the three categories of innova-
tion strategy, innovation process and innovation success
compared to other leading European businesses from a
variety of sectors.
FOCUS ON THE ESSENTIALS IN RESEARCH & DEVELOPMENT
sales
service
suppliers
customers
research & development
production& delivery
12 To our Shareholders
Focus on the Essentials

» By concentrating completely on cooking and thanks to our many years of
experience we have indepth expert knowledge of product development, so
we understand our customers and can translate their wishes into tailor-made
solutions. The fact that with my creative and innovative work I can make a
major contribution to our customers’ success spurs me on every day and
motivates me to achieve maximum performance.«
Andrea Jürgens, Head of Application Development at rational ag
13To our Shareholders
Letter from the Executive Board
rational Annual Report 2013

Partnerships with suppliers are fi rmly embedded in the
rational philosophy. Strong rational partners possess
innovative development and manufacturing skills which
they continuously expand.
We off er our system suppliers a long-term business
relationship, which emphasises close cooperation. Using
established tools for supplier management, such as
partner plans, we ensure cooperation that is geared to
objectives and success from the outset.
Aft er the concept phase when a concept is chosen
and thus the subsequent supplier, series develop-
ment commences. Milestones are defi ned jointly and
manufacturing is costed during development, to ensure
that any deviations from the target fi gures are identifi ed
and dealt with at an early stage. The production layout,
including the necessary testing equipment, is worked
out and furnished by the series development partner.
Tools and manufacturing resources needed are defi ned
and brought to series production.
The end result of the joint development process is an
upstream product that perfectly complements our eff orts
to always off er the maximum customer benefi t. A superior
product such as the SelfCookingCenter® whiteffi ciency®
can only come about if the individual components satisfy
the highest quality standards.
The combination of the key skills of our suppliers special-
ising in individual components with our system expertise
ultimately means we can always fully match our promise
to customers of the best technology at an attractive price.
To jointly develop and manufacture electronic modules
for the SelfCookingCenter® whiteffi ciency® we have for
many years worked successfully in a close partnership
with tq-Systems, a leading German electronics service
provider. We worked together to develop both genera-
tions of the SelfCookingCenter® equipment. By being
a dependable supplier of series modules tq-Systems
makes a major contribution to this overall success.
The basis of this long-term, successful cooperation are
reliability and trust combined with open and respectful
interaction – and of course technology that meets the
highest demands. Because of this we are able to pre-
sent tq-Systems with numerous awards at our annual
rational suppliers’ day.
FOCUS ON THE ESSENTIALS – WITH DEVELOPMENT PARTNERSHIPS
service
production& delivery
sales
suppliers
customers
research & development
14 To our Shareholders
Focus on the Essentials

» We are proud of our successful ten-year partnership with rational.
In doing so, we focus on our key skills, the development of complex
key modules and systems, and the implementation of their tailor-made
production and logistics processes. Thus we meet the demanding pro-
duct requirements for the optimum effi ciency of the SelfCookingCenter®
whiteffi ciency®.
By jointly developing sophisticated hardware and soft ware for both
generations of the SelfCookingCenter® we have set standards in terms
of effi ciency, reliability and fi tness for the future.«
Friedrich Maier, Dipl.Ing. (Univ.), tq-Systems, Plant Manager Murnau/Peißenberg
15To our Shareholders
Letter from the Executive Board
rational Annual Report 2013

The aim of our corporate philosophy of maximum
customer benefi t is not simply satisfi ed customers, but
enthusiastic customers. With this objective in mind we
have increased our attractiveness year on year, which is
the safeguard for sustained growth. The symbiosis of our
specialist partners’ proximity to the customer and market
knowledge in combination with our innovative strength
and on-site consultancy services forms the basis for
stable and successful business relationships.
Reliable partnerships
In its aim of tapping the global market, rational counts
on reliable partners, since long-term success is achieved
only with partnerships that are based on mutual trust and
in which everyone wins. They are specialist dealers and
oem partners – oem partners sell rational products as
part of their product range under their own brand – as well
as kitchen planners and service partners.
Concentration on core competences
In future, and in line with our motto “We only do things
ourselves if we can do them better than others”, we
will concentrate on developing and producing the best
equipment for the preparation of hot food in professional
kitchens. With our product and innovation leadership
we give the dealers, planners and oem partners the as-
surance that they are always getting the best and most
competitive equipment on the market. In turn, we profi t
from their proximity to the customer. Our partners know
the local markets best and can build on this to tailor sales
and marketing perfectly to customers’ needs. They are
highly skilled when it comes to planning, installing and
commissioning the equipment. They help with the selec-
tion of the right products, and aft er the sale are available
to solve problems and answer questions.
Maximum customer benefi t by pooling of resources
In this partnership of winners, each partner concentrates
on its own key skills. The mutual strengths complement
one another perfectly. By joining forces – our technology
leadership and brand awareness with the sales strength
of our partners and planners – we together succeed in
penetrating the market better. Because each party focuses
on its strengths, everyone profi ts, but customers most of
all. Customers get an optimum overall off ering that helps
them save money, improve the quality of the food and
off er their diners creative new menus. Or put another way:
the customer always wins!
excellent partners This year’s suppli-
ers’ day was held on 15 May 2013. 170
participants took up our invitation and
were updated about the latest develop-
ments at rational. The day was rounded
off by selecting the best suppliers. The top
three – punker GmbH, rawe electronic
and Stolz Aufrolltechnik – were awarded
the coveted rational trophy as the best
suppliers of the year.
Best Innovator
2012/2013
FOCUS ON THE ESSENTIALS – PARTNERSHIP OF WINNERS
rational suppliers‘ day
16 To our Shareholders
Focus on the Essentials
Industry Award 2013
– rational is
„Best of 2013“
Best of Market
Awards 2013
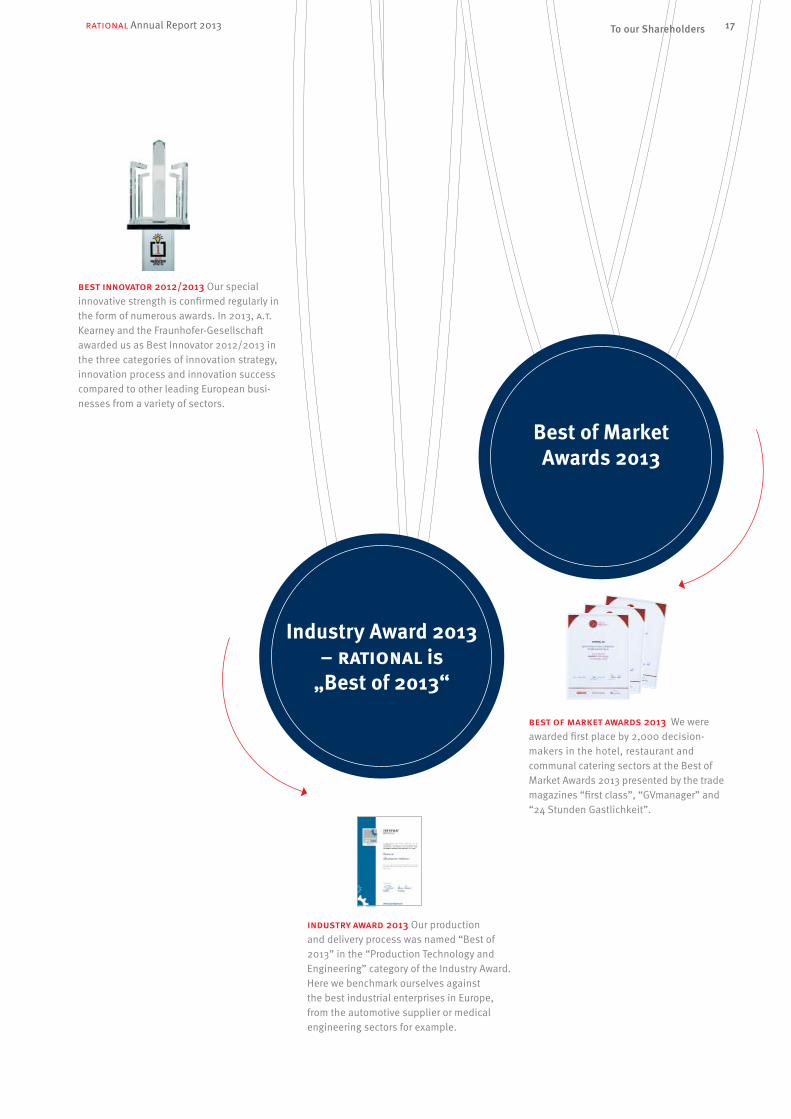
best innovator 2012/2013 Our special
innovative strength is confi rmed regularly in
the form of numerous awards. In 2013, a.t.
Kearney and the Fraunhofer-Gesellschaft
awarded us as Best Innovator 2012/2013 in
the three categories of innovation strategy,
innovation process and innovation success
compared to other leading European busi-
nesses from a variety of sectors.
industry award 2013 Our production
and delivery process was named “Best of
2013” in the “Production Technology and
Engineering” category of the Industry Award.
Here we benchmark ourselves against
the best industrial enterprises in Europe,
from the automotive supplier or medical
engineering sectors for example.
best of market awards 2013 We were
awarded fi rst place by 2,000 decision-
makers in the hotel, restaurant and
communal catering sectors at the Best of
Market Awards 2013 presented by the trade
magazines “fi rst class”, “GVmanager” and
“24 Stunden Gastlich keit”.
17To our Shareholdersrational Annual Report 2013

From the very start, rational has used a two-tier sales
channel to facilitate global market development. Sell-
ing our products through dealers gives us the room for
manoeuvre we need so that our chefs in Sales can focus
indepth on the interests of end users. In cooking demon-
strations lasting several hours they provide them with com-
prehensive advice before the sale on the benefi ts of using
our technologies. The sales process itself, the installation
and the aft er-sales service are handled by the dealers.
Our partners profi t from the technology and market leader-
ship, the quality and reliability of the products, and also
from the high brand awareness and customer satisfaction
and the customer loyalty.
In return, rational benefi ts from its business partners’
strengths, in particular their extensive customer base and
local presence, their comprehensive range of services and
their expertise in planning, installation, commissioning
and on-site technical service.
The sum of all strengths multiplies customer benefi ts and
opens up additional prospects for everyone involved. The
attractiveness and uniqueness of the SelfCookingCenter®
whiteffi ciency® are used by many partners as the ideal plat-
form for winning new customers. The special appeal of our
CookingLive Shows also gives the partners the opportunity
to present their entire range of services to new customers.
Satisfi ed rational customers also buy their other kitchen
equipment from our partners. In this way, they develop into
new, full-range customers.
In Spain since 2001 we have been working with Oms y
Viñas, a dealer specialising in professional kitchen equip-
ment for the hotel industry, restaurants and communal
catering. Through supportive activities and indepth service
to his customers, managing director Jonathan P. Gilboy
Rubio’s aim is to enable them to derive the maximum
benefi t from rational equipment. This benefi ts both
rational and Oms y Viñas, but ultimately it is the cus-
tomer who wins.
DEALER PARTNERSHIPS
service
production& delivery
sales
suppliers
customers
research & development
18 To our Shareholders
Focus on the Essentials

» With over 100 years of history and experience in the catering and tourism
sector, we deliberately specialise in this key area. This focus ensures we
off er customers much more than they expect. Customer benefi t is what
drives both rational and us. Together we achieve satisfi ed customers.«
Jonathan P. Gilboy Rubio, Managing Director of Oms y Viñas, Spain

» We know exactly the needs of our Japanese customers working in commercial kitchens.
In order to continuously fulfi l our very high quality demands with innovative products, and
based on the fact that we found more customer benefi t by having rational’s SelfCooking-
Center®, it is in our eyes much more eff ective working together with specialised partners
like rational than manufacturing everything by ourselves. We are very happy with our
sustainable successful relationship with rational for many years and look forward to
working with them in future.«
Toshinori Kumagai, President of Fujimak Corporation, Japan

The cooperation between rational and our oem partners
is based in a high level of trust. Both partners concentrate
on their respective strengths and can rely on the other one
at all times.
Our oem partners know rational always off ers the best
technology available in the market in order to be able
to off er its customers a superior solution. This is why
we concentrate on continuously further developing the
combi-steamer technology and on the production and
delivery.
In large projects, such as kitchen refi ts or renovations,
our oem partners very much help us to sell our products.
We rely on the local market knowledge and high market
reputation of our oem partners and leave it to them in this
partnership to actively market our products as part of their
product range.
In Japan we have worked for over 20 years in a close
partnership with Fujimak, one of the best known and most
successful commercial kitchen outfi tters in Japan, employ-
ing 1,200 people.
Fujimak always strives for quality improvements and
off ers best solutions at attractive prices. Because of this
extraordinarily high quality demand the company makes
on its own products, it only enters into partnerships with
the best in the sector. And the combi-steamer comes from
rational.
Owner and president Toshinori Kumagai particularly
appreciates the high level of benefi t that the SelfCook-
ingCenter® whiteffi ciency® off ers his customers. It helps
Fujimak always meet customers’ high demands in the
shape of innovative products.
In a partnership such as this, everyone wins. Fujimak’s
off ering includes the top-ranked combi-steamer, which
rounds off its total solution. Based on trustful relation-
ships rational improves its chances in commercial
kitchen projects and in calls for tender and in addition,
this gives us a major impetus to further develop our tech-
nologies. But it is customers who are the real winners,
thanks to an excellent overall off ering that helps them
save money, improve the quality of the food and off er
their diners creative new menus.
OEM PARTNERS*
service
production& delivery
sales
suppliers
customers
research & development
* Original Equipment Manufacturer; oem partners sell rational
products as part of their product range under their own brand.
21rational Annual Report 2013 To our Shareholders
Focus on the Essentials

» As independent kitchen consultants, we enjoy the trust of our customers due to
our competence and experience with innovative systems. To be able to live up to
the trust vested in us, we of course recommend only those products off ering the
greatest premium value for our customers. When it comes to culinary cooking
we therefore place our trust in the rational people and the SelfCookingCenter®
whiteffi ciency®.«
Doug Feltmate, Director – Food Service & Hospitality, wsp Group, Canada

For high-quality food to be prepared economically at all
times in a commercial kitchen, optimum kitchen planning
is vital. Kitchen planners are important, independent
opinion-leaders and decision-makers in specifying tech-
nology for large kitchens in projects and calls for tenders.
When planning kitchens in which a large number of meals
have to be served in the shortest possible time, planners’
skills and experience are invaluable. Examples include
restaurants, hotels, supermarkets, militaries, catering
facilities in schools, hospitals and nursing homes, right
through to large conference centres.
Highest demands for quality, stringent time targets,
large volumes of valuable food, power and water call for
meticulous organisation and perfectly coordinated work-
flows. Planners have the necessary expertise and wide
experience of influencing organisational and operational
structures. In addition, they are familiar with the products
and technologies available on the market that provide
optimum support for smooth, stress-free procedures
every day in the kitchen.
rational off ers planners the best technology and quality
available on the market at a reasonable price. With the
help of rational products they can put together a tailor-
made total package that will ease the burden on their
customers as much as possible – for example Finishing®.
Whether it’s 20 plates or 10,000, in less than ten minutes
the meals are cooked to perfection shortly before serving,
free from stress and rush.
In Canada, we work together, amongst others, with the
wsp Group, an experienced and well-respected kitchen
planner. One of the most challenging projects in recent
years was fi tting out the kitchen in the Ottawa Convention
Centre. Twelve SelfCookingCenter® whiteffi ciency® units
allow the kitchen and serving team to serve up to 7,000
top-quality meals in the shortest possible time.
Ultimately this cooperation benefi ts all parties. rational
gains market access through a skilled partner with great
expertise and local market knowledge. The wsp Group
delights its customers with its optimum solutions and as
a result off ers them the maximum benefi t.
KITCHEN PLANNERS
service
production& delivery
sales
suppliers
customers
research & development
23rational Annual Report 2013 To our Shareholders
Focus on the Essentials

» I’m extremely enthusiastic about my work. I’m able to focus on the essentials:
my unit! I’m proud of the high quality, and by putting my name on the identi-
fi cation plate I take personal responsibility for it.«
Stephan Pompe, rational Montage GmbH, Assembly Island 3, Landsberg

What concentrating on the essentials in manufacturing
means: we only do things ourselves if we can manufac-
ture them better or more cheaply than others, or if we
possess system-critical expertise. Everything else we buy
in from specialist, highly-skilled suppliers. The resulting
low level of complexity and tied-up capital are crucial
drivers for the maximum flexibility and success of our
business.
Concentration thanks to the “One-Piece Flow”
principle
As a company with minimal vertical integration, we
essentially handle the fi nal assembly of the appliances
in manufacturing. In line with the “One-Piece Flow”
principle an employee assembles “his” unit from the fi rst
to the last screw and puts his name on the identifi cation
plate as a guarantee of quality. This results in a high level
of identifi cation with the product and best quality.
Our customers benefi t from short lead-times. “Ordered
today, delivered tomorrow” is no empty slogan for
rational, it is the reality.
Trust-based partnership with suppliers
Following the extended workbench principle, we very
much work in close partnership with our suppliers. We
off er them a long-term, dependable partnership and in
return expect loyalty, quality, commitment, flexibility and
innovative skill.
Instead of permanently pushing for lower purchase prices,
which oft en leads to costly and risk-laden changes in sup-
plier, we collaborate with our suppliers on the basis of an-
nual partner plans to meet joint quality, productivity and
cost objectives. Over time this leads to attractive purchase
prices while encouraging long-term supplier loyalty.
At this year’s suppliers’ day, we updated 170 participants
about the latest developments at rational and awarded
the top suppliers.
Industry Award 2013 – rational is “Best of 2013”
Our production and delivery process was named “Best of
2013” in the “Production Technology and Engineering”
category of the Industry Award. Here we benchmark our-
selves against the best industrial enterprises in Europe,
from the automotive supplier or medical engineering
sectors for example.
FOCUS ON THE ESSENTIALS IN THEPRODUCTION AND DELIVERY PROCESS
service
production& delivery
sales
suppliers
customers
research & development
25rational Annual Report 2013 To our Shareholders
Focus on the Essentials

The preparation of hot food is the core activity of every
kitchen. Having the cooking equipment available at all
times is an absolute must. And so, rational appliances
are designed with reliability and durability in mind.
Our customer benefi t strategy includes our rational
service partner concept. This entails regular training,
certifi cation and enduring close cooperation with special-
ist partners who concentrate exclusively on excellent
technical service and thus ensure the smooth operation
of the equipment.
Our service partners have technical Know-how and are
characterised by their availability, fast response and
highly skilled employees. They fulfi l 80% of their orders
the same day. Engineers can access a special service
website to consult all the necessary technical information.
They are therefore always kept up to date and can immedi-
ately resolve technical problems without having to consult
anyone or carry out time-consuming research. In short:
customers can always rely on rational service.
For around eight years we have been working in the
Mexican market with ServIndustrial, a partner specialis-
ing in technical service. “Our top priority is total cus-
tomer satisfaction”, explains company founder Gregorio
González. “The only way to achieve this is by specialising
on what we can do best: fi rst-class technical service.”
What ServIndustrial gets from the partnership is the
high quality, good image and reliability of the rational
equipment. rational gains from ServIndustrial’s high rep-
utation and its good quality of service, which is a major
factor in the decision to purchase. But it is customers who
benefi t most, as they are using the best product available
on the market, the availability of which is guaranteed at
all times by a skilled partner.
Customer satisfaction surveys show that around 95% of
our customers around the world are highly satisfi ed with
the service provided by our rational service partners
and would purchase another rational product without
hesitation.
SERVICE PARTNERS
service
production& delivery
sales
suppliers
customers
research & development
26 To our Shareholders
Focus on the Essentials

» Our priority is total customer satisfaction. The only way to achieve this is by specialising
in what we can do best: fi rst-class technical service. Therefore, our customers enjoy the
benefi t of having highly competent partners. We can thus guarantee our customers a
complete high quality solution.«
Gregorio González, founder and owner of ServIndustrial, Mexico
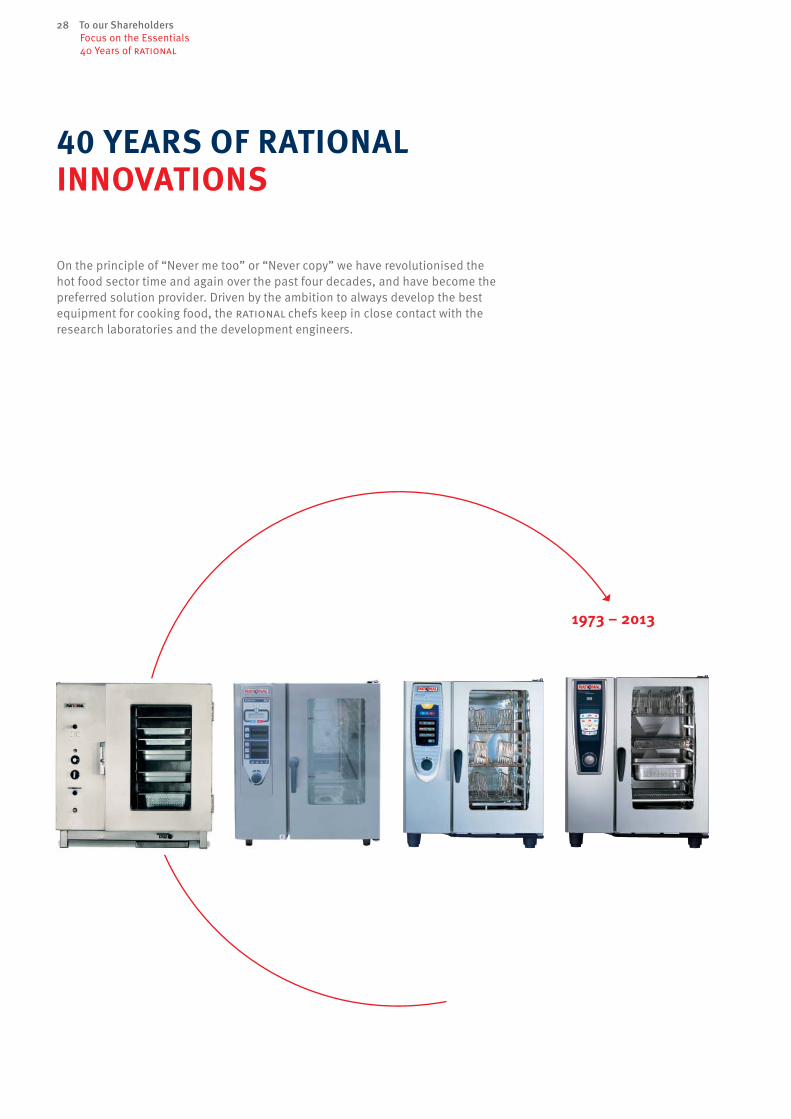
On the principle of “Never me too” or “Never copy” we have revolutionised the
hot food sector time and again over the past four decades, and have become the
preferred solution provider. Driven by the ambition to always develop the best
equipment for cooking food, the rational chefs keep in close contact with the
research laboratories and the development engineers.
1973 – 2013
40 YEARS OF RATIONALINNOVATIONS
28 To our Shareholders
Focus on the Essentials
40 Years of rational

1976
2004 2011
1997A new global market has emerged
Our success story began with the invention of the
rational combi-steamer in 1976. Looking back, for many
decades it was the biggest and most important innovation
in commercial kitchens, that changed the professional
kitchens and their production processes fundamentally.
It also marked the birth of a new global market. The
rational combi-steamer replaces around half of all tradi-
tional cooking equipment and opens up completely new
opportunities for chefs worldwide.
Maximum ease of operation –
the world’s fi rst SelfCookingCenter®
The invention of the SelfCookingCenter® sparked yet
another revolution in 2004. This spectacular rational in-
vention followed the principle of “Keep it simple”. Simple
and intuitive operation plus the fascination of cooking
immediately moved centre stage.
The SelfCookingCenter® immediately did away with the
need to set the climate, or even the cooking time, tempera-
ture or air speed in the cooking cabinet.
SelfCooking Control® automatically identifi es all product-
specifi c requirements such as size and type of food and
the load size. It delicately checks and optimises the
cooking process 60 times a minute. Without need for
supervision, the desired result is achieved with perfect
precision – repeatable at any time.
The new global standard for perfect quality of food
With the invention of ClimaPlus-Control® technology in
1997 rational created a new global standard for perfect
food quality. The basic idea was that top-quality prod-
ucts only ripen in an ideal climate. Heat and humidity
determine this climate in nature. The rational ClimaPlus-
Control® technology for the fi rst time ensured the ideal
climate specifi c to each product in the cooking cabinet.
The climate cycle from nature to plate was closed for
the fi rst time. Thanks to a previously unheard of level of
performance and cooking perfection, the global share of
the ClimaPlus Combi® for rational rose to over 70% of
total sales. The ClimaPlus Combi® thus largely replaced
the traditional combi-steamer.
Uncontested resource effi ciency with the
SelfCookingCenter® whiteffi ciency®
With the market launch of the SelfCookingCenter®
whiteffi ciency® in 2011 we took a quantum leap in re-
source effi ciency. With the patented HiDensityControl®
the SelfCookingCenter® whiteffi ciency® sets new stand-
ards. So maximum uniformity of cooking is achieved even
with a full load.
This is made possible by the use of extremely high-den-
sity energy and steam, as well as the dynamic air-mixing
technology. As a result, exactly the right amount of energy
and steam is directed to each individual food item in the
cabinet, so that they are all cooked and browned evenly.
The tremendous effi ciency of HiDensityControl® allows to
increase loads by up to 30% compared with conventional
combi-steamers that have the same size cooking cabinet.
And that is achieved while consuming up to 20% less
energy. The integrated approach to creating maximum
benefi t from every individual resource used. That is
whiteffi ciency®.
29rational Annual Report 2013 To our Shareholders
Focus on the Essentials
40 Years of rational

Our subsidiary frima focuses completely on cooking
technology that cooks food in liquid or with direct contact
heat. The VarioCooking Center® represented the develop-
ment of a completely innovative, revolutionary comple-
mentary product which was successfully established in
selected markets.
Since 2011 we launched the second product generation,
the VarioCookingCenter multificiency®. With improved
resource effi ciency and even greater ease of operation,
it off ers our customers demonstrably greater benefi t.
The VarioCookingCenter multificiency® perfectly comple-
ments the SelfCookingCenter® whiteffi ciency® and the
CombiMaster® Plus. It handles the remaining cooking
processes in a professional kitchen, such as milk dishes,
noodles, soups or goulash. Conventional cooking equip-
ment, together with pots, pans and fryers, can be largely
dispensed with.
No burning and unrivaled speed
The patented heating technology of the VarioCooking-
Center multificiency® allows heat to be transferred much
faster with a strength, precision and regularity previously
only dreamed of. Compared to traditional cooking technol-
ogy it is up to four times faster. There is no burning or
overcooking and no complicated cleaning.
FRIMAFOCUS ON THE ESSENTIALS,THE VARIOCOOKINGCENTER MULTIFICIENCY®
Chefs no longer have to put up with long waiting times and
can dispense with many monotonous routine jobs. Ability,
experience and creativity thus take their rightful place in
everyday work.
VarioCooking Control® – Intelligence
that works for the chef
VarioCooking Control® is the built-in intelligence of the
VarioCookingCenter multificiency®. It completely does
away with the need to enter conventional settings such as
temperatures, times, or complex programming. Routine
chores such as fi lling or emptying or supervising the
cooking processes are a thing of the past. Simply select
the food to be cooked and that’s it. VarioCooking Control®
monitors the cooking process fully automatically and
alerts the chef if he needs to do anything himself, such
as turning or stirring the food.
VarioCookingCenter multificiency® –
right for every customer
Customers asked for an effi cient, tailor-made table-top
version, and our experienced staff in Development and
Production managed to achieve this in close interaction
with our partners and customers.
With the motto “Small outside – Big inside” the
VarioCookingCenter multificiency® 112T off ers a maximum
of possibilities on the smallest footprint. Its compact size
greatest flexibility on small surfaces
30 To our Shareholders
Focus on the Essentials
frima – the VarioCookingCenter multificiency®

and manageability make it versatile and mean it can be
used at any time wherever the customer needs it, without
extensive reconfi guration work.
In launching this small version of the VarioCookingCenter
multificiency® we are off ering our customers a product
range comparable to the SelfCookingCenter® whiteffi ciency®.
Besides floor models, used primarily in large communal
catering operations, our new table-top model allows us to
address the needs of small and medium-sized restaurants
in particular. We have the right VarioCookingCenter
multificiency® now for every customer.
VarioCookingCenter multificiency® –
enthusiastic customers
The users of the frima VarioCookingCenter multificiency®
are enthusiastic ambassadors for this new technology.
The results of our most recent customer survey in Germany,
France and Switzerland bear this out: 96% of the owners
we surveyed would buy the VarioCookingCenter
multificiency® again at any time.
600 chefs and managers from professional kitchens
confi rmed this result at the “küche awards 2013” held
by the renowned German trade magazine “küche”. The
VarioCookingCenter multificiency® took fi rst place in the
“Cooking and Stove Technology” category.
the variocooking center multificiency® 112t can be used
anywhere: on a table, a work surface, a central cooking block,
or in production areas … wherever our customers need it.
small outside – big inside
the variocooking center multificiency® 112t
variocooking center multificiency® 112t at the intergastra trade show
in stuttgart
31rational Annual Report 2013 To our Shareholders
Focus on the Essentials
frima – the VarioCookingCenter multificiency®
Maximum customer benefi t derives from the combination
of superior products and exemplary services, all at an
attractive price. Only by specialising on our key skill, the
preparation of hot food, and by focusing on a single,
clearly defi ned target group have we succeeded over the
past 40 years in becoming one of the best problem solv-
ers in the commercial kitchen and the uncontested world
market leader in the combi-steamer sector.
The main source of our success and the foundation for
rational’s success story are enthusiastic employees,
working like Entrepreneurs in the Company (U.i.U.®)
around the globe.
Because a company cannot achieve maximum quality
unless it has passionate U.i.U.® who undertake and
complete entire tasks, take the necessary decisions,
learn from mistakes, are on a par in a business free from
hierarchical barriers and in all of this never lose sight of
the overall picture.
ENTHUSIASTIC EMPLOYEES ARE FUNDAMENTAL FOR MAXIMUM CUSTOMER BENEFIT
For all employees to think and act like U.i.U.® the right
management needs to be in place. For us, management
means jointly developing a clear notion of what we want
to achieve. Our managers regard themselves as fi rst
among equals, thereby enabling every individual to be
on a par.
rational managers behave like gardeners, who create
the right climate for the best possible personal and
professional development of their staff . They create an
environment based on trust, give their employees room
to manoeuvre and recognise success. With constructive
and positive thinking they help their employees to use
and further expand their strengths to the full. In short:
they serve their employees and create the basis for their
ability to think and act as successful U.i.U.®.
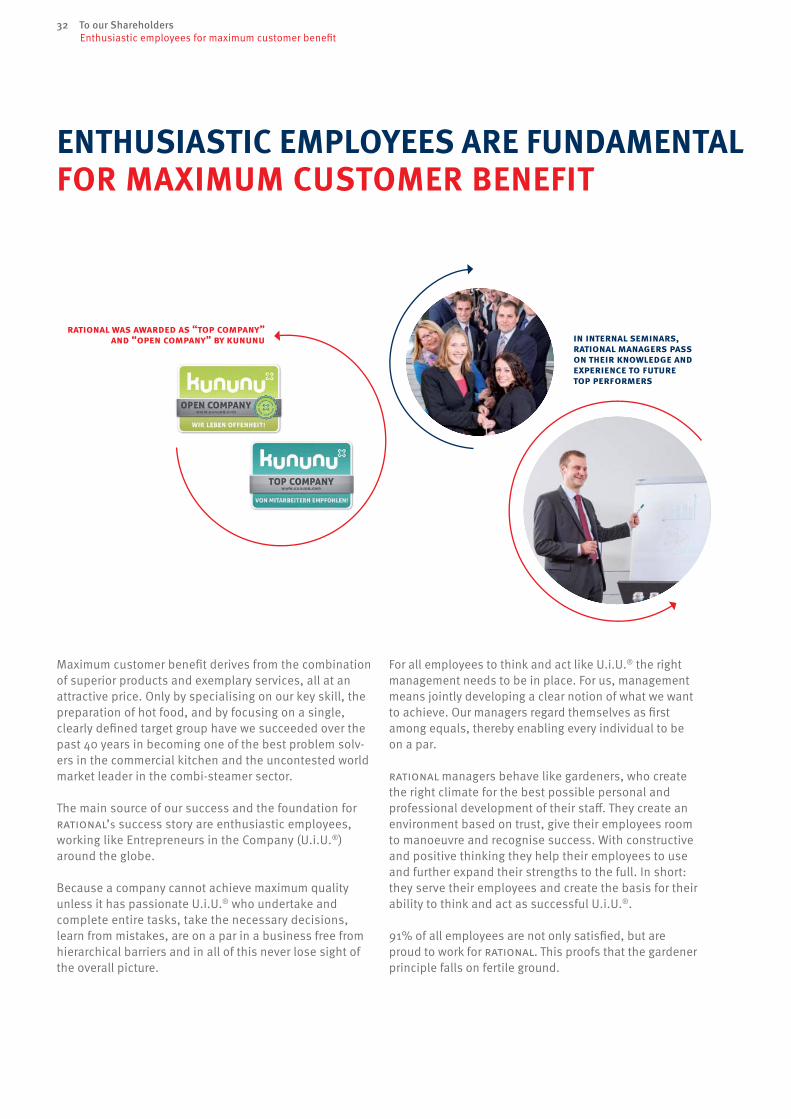
91% of all employees are not only satisfi ed, but are
proud to work for rational. This proofs that the gardener
principle falls on fertile ground.
rational was awarded as “top company” and “open company” by kununu in internal seminars,
rational managers pass on their knowledge and experience to future top performers
32 To our Shareholders
Enthusiastic employees for maximum customer benefi t

the rational trainee programme is fair and career enhancing
responsibility right from the start
long-term focus
assistance by experienced managers
fun at learning and at work
launch of the new product generation in autumn 2011
33rational Annual Report 2013 To our Shareholders
Enthusiastic employees for maximum customer benefi t

rational shares
Compared to the issue price at the time of
the ipo (Initial Public Off ering) in March
2000, rational shares have now risen
more than tenfold in value (+948%). Share-
holders of the fi rst hour, therefore, can be
delighted about an average annual price
appreciation of 19%. Taking into account
paid-out dividends, this results in an aver-
age annual return of no less than 22%.
Average annual return for rational shareholders since
the ipo (including dividends)
22% ** Related to year-end closing price 2013
34 To our Shareholders
34 To our Shareholders
rational Shares

rational shares at an all-time high
in the last fi scal year
The expansionary monetary policy of the Central Banks had
a positive impact on global share markets in the fi scal year
2013. European share markets in particular were stimulated
by the cut in base rates by the European Central Bank to a his-
toric low of 0.25%. As a result, the leading global indexes on
the share markets enjoyed a positive development across the
board. In Germany too, the leading indexes rose signifi cantly
in value (the dax was up by 25% and the mdax by 39%).
In fi scal 2013, rational shares posted large gains and
reached a new all-time high of 269.15 euros. At year-end the
shares were valued at 241.10 euros. Compared to the 2012
year-end closing price of 218.00 euros, this equates to a
price rise of 11%. Including the dividend payout of 5.70 euros,
this represents an overall return of +13% for rational share-
holders in 2013.
Stable share performance thanks to
far-sighted corporate governance
The continuous rise in value since the ipo in 2000 demon-
strates investors’ confi dence in the long-term, sustainable
corporate policy of recent years and in the company’s future
opportunities for growth. This is also evidenced by the tradi-
tionally high valuation – measured by the price-to-earnings
ratio – compared to the relevant reference indexes.
Compared to the issue price at the time of the ipo in March
2000, the price has now risen more than tenfold in value
(+948%). This corresponds to an average annual price
increase of 19%. Furthermore, dividends of 45.75 euros per
share have been paid out to shareholders since the time of
the ipo. This means that shareholders who invested in the
company right from the start are now receiving an overall
return of approximately 22% per annum.
rational marks fi ve years of mdax listing
Our shares have been listed in the “Prime Standard” since
the ipo, and are traded in all German stock exchange cen-
tres. Initially listed in the sdax, the Company has for about
the last fi ve years been quoted in the mdax. This year, too,
we have continued to hold our ground within the index.
Measured by free-float market capitalisation, rational
shares were ranked 50th at year-end (2012: 41st), and in terms
of trading volume achieved 58th place (2012: 58th). The aver-
age daily trading volume across all stock exchange centres
was 7,044 shares in 2013 (previous year: 6,085 shares).
To support the liquidity of the shares, hsbc Trinkaus &
Burkhardt ag acts as the designated sponsor.
Since September 2013, the tradability of rational shares is
being upgraded in the form of adrs (American Depositary
Receipts) for investors in the us capital market. adrs are
depository receipts for non-us shares, which can be traded
on us equities markets instead of the original securities via
a depository bank. No depository agreement exists between
rational and the Citigroup depository bank (“unsponsored
adr”). This does not give rise to any follow-up obligations for
rational.
Historical development of rational shares and relevant
benchmark indices on 30 December 2013
in % 1 year 2 years 3 years 5 years Since ipo
rational ag
(share price development) +11 +43 +49 +192 +948
rational ag (incl. dividends) 1) +13 +51 +65 +237 +1,450
dax 30 +25 +62 +38 +99 +20
mdax +39 +86 +64 +196 +288
1) Assumption: reinvestment of dividends at the opening price
of the ex-dividend date
rational ag dax mdax
0
600
800
200
400
11 12 1310090800 01 02 03 04 05 06 07
Performance of the rational shares since the ipo 2000
Index (issue price 23.00 eur = 100); in %
Year-end closing price eur 241.10 1,200
1,000
140
90
110
100
120
130
rational ag dax mdax
Performance of rational shares in 2013
Index (30 December 2012 = 100); in %
Dec.Nov.Oct.Sept.Jan. Feb. Mar. Apr. May June July Aug.
Year-end closing price eur 241.10
To our Shareholders
35rational Annual Report 2013 To our Shareholders
rational Shares

Earnings per share
At 8.55 euros profi t per share in 2013 we easily exceeded the
previous year’s fi gure of 8.20 euros. This was thanks to sales
growth over the past fi scal year and the high earning power
of the company. The number of shares issued is 11,370,000.
No dilution eff ects occurred.
Key fi gures of rational Shares
2013 2012 2011 2010 2009 2008 2007 2006 2005 2004
Subscribed capital1) (in m eur) 11.37 11.37 11.37 11.37 11.37 11.37 11.37 11.37 11.37 11.37
Number of shares1) (in million pieces) 11.37 11.37 11.37 11.37 11.37 11.37 11. 37 11.37 11.37 11.37
Maximum price2) (in eur) 269.15 221.70 193.90 170.75 118.39 142.80 161.24 167.38 109.89 64.10
Minimum price2) (in eur) 200.00 166.15 134.65 103.75 54.82 66.68 112.64 98.67 62.39 39.87
Year-end closing price2) (in eur) 241.10 218.00 168.20 161.89 115.99 82.61 137.54 138.61 109.89 63.28
Market capitalisation1) (in m eur) 2,741.3 2,478.7 1,912.4 1,840.7 1,318.8 939.3 1,563.8 1,576.0 1,249.4 719.5
Free float market capitalisation1), 2)
(in m eur) 799.5 722.9 546.7 524.5 374.8 266.9 445.9 439.0 348.3 199.3
Average trading volume2) (in pieces) 7,044 6,085 9,479 7,994 10,962 18,176 14,425 11,109 6,853 4,234
Dividend per share for fi scal year 5)
(in eur) 6.00 5.70 5.50 9.00 3.50 1.00 4.50 3.75 3.00 5.00
Dividends paid 5) (in m eur) 68.2 64.8 62.5 102.3 39.8 11.4 51.2 42.6 34.1 56.9
Dividend yield 4) 2.5% 2.6 % 3.3 % 5.6 % 3.0 % 1.2 % 3.3 % 2.7 % 2.7 % 7.9 %
Annual performance
without dividend 10.6% 29.6 % 3.9 % 39.6 % 40.4 % –39.9 % –0.8 % 26.1 % 73.7 % 53.4 %
Annual performance incl. dividend 13.2% 32.9 % 9.5 % 42.6 % 41.6 % –36.7 % 1.9 % 28.9 % 81.6 % 57.9 %
Beta factor (one year) as of 31 Dec3) 0.78 0.84 0.38 0.67 0.75 0.63 0.77 1.25 0.52 0.21
Sales per share (in eur) 40.56 38.26 34.45 30.79 27.65 30.17 29.60 24.95 21.67 19.51
Price-to-sales ratio1) 5.9 5.7 4.9 5.3 4.2 2.7 4.6 5.6 5.1 3.2
Earnings per share (in eur) 8.55 8.20 6.93 7.02 5.92 5.42 5.38 4.55 3.73 2.98
Price-earnings ratio1) 28.2 26.6 24.3 23.1 19.6 15.2 25.6 30.5 29.5 21.2
Cash flow per share (in eur) 9.05 9.80 5.96 7.64 7.32 6.24 5.37 4.32 2.88 3.45
Price-cash flow ratio1) 26.7 22.2 28.2 21.2 15.9 13.2 25.6 32.1 38.1 18.4
1) As of balance sheet date2) German stock market3) In relation to the mdax-Performance-Index4) In relation to the previousʼ year closing price5) Payout in the following year, 2013 subject to approval by shareholder meeting 2014
Source: hsbc, Bloomberg, rational
Dividend of 6.00 euros proposed
The Executive Board and Supervisory Board propose to the
General Meeting of Shareholders to distribute a dividend of
6.00 euros per share for fi scal year 2013. A total amount of
68.2 million euros has been set aside for the distribution.
The dividend yield (based on the 2013 closing price) is 2.5%.
2012 20132010 2011200920082003200220012000 2004 2005 2006 2007
Earnings/dividend per share since the ipo
in eur
Earnings per share Dividend per share Dividend, proposal
5.50
6.93
9.00
3.50
5.92
1.00
5.42 5.00
3.00
3.73 3.75
4.55 4.50
5.38 5.706.00
8.20 8.55
1.85
2.36
7.02
2.98
2.34
1.301.83
1.00
1.54
0.65
36 To our Shareholders
36 To our Shareholders
rational Shares

Stable shareholder structure
The major shareholders and founders of the Company,
together with their families, held 70.8% of the share capital
as at the balance sheet date. Free-float holdings amount to
29.2%. There are no outstanding stock option schemes or
convertible bonds that could dilute the shareholding.
Shareholder structure
Free Float
29.2%
Holding shares
70.8%
Status: 31 December 2013
Current analysts’ comments on the rational
corporate website
At present, 16 institutes publish detailed analyses on
rational ag. All equity analysts are convinced of the Com-
pany’s exceptional earning power and quality. Most analysts
recommend holding the shares at the current valuation level.
Interested investors can fi nd the latest ratings and invest-
ment recommendations under Investor Relations/Analysts’
Ratings at www.rational-online.com.
Analysts’ ratings
Status: 31 December 2013
Hold/Neutral: 11Sell/Reduce: 3
Buy/Add: 2
Capital market communication
The demand for information on the part of the capital
markets is especially high in times of stock market turbu-
lence. In response to this demand, and in line with our
own philosophy, we have committed ourselves to making
fi nancial information available openly and transparently at
all times to both professional and private investors.
In 2013, management spent 23 days at roadshows and
capital market conferences, both in Germany and abroad.
On releasing our annual fi gures, we informed the public at
an annual results press conference and an analysts’ confer-
ence. Our Investor Relations specialists, as well as members
of the Executive Board, are available at all times to answer
questions from both professional investors and private
shareholders.
rational Share – key fi gures
isin (International
Security Identifi cation
Number) de0007010803
wkn (security identifi -
cation code) 701 080
Market abbreviation raa
Stock exchange centres Frankfurt, Munich, Stuttgart, Düsseldorf,
Berlin, Hamburg/Hanover
Market segment Regulated Market
Transparency level Prime Standard
Membership of indices mdax, cdax, Classic All Share, dax Inter-
national Mid 100, daxglobal Sarasin
Sustainability Germany Index, daxplus Export
Strategy, daxplus family 30, daxplus family,
daxsector All Industrial, daxsector Indust-
rial, daxsubsector All Industrial Products &
Services, daxsubsector Indus trial Products
& Services, midcap mkt, Prime All Share
(Deutsche Börse),
BayX30 (Munich Stock Exchange)
Unsponsored adr
(American Depositary
Receipts)
Custodian: Citigroup Global Markets
dr Ticker: ratiy / dr isin: us75410b1017
End of fi scal year 31 December
Accounting principles ifrs
Flotation 3 March 2000
Designated Sponsor hsbc Trinkaus & Burkhardt AG
To our Shareholders
37rational Annual Report 2013 To our Shareholders
rational Shares

Declaration of compliance
A new version of the German Corporate Governance Code
was approved on 13 May 2013 and published in the Federal
Gazette on 10 June 2013. rational ag largely complies with
the recommendations and suggestions set out in the Code.
This has resulted in the submission of the declaration of
conformity of February 2014, which is published in the 2013
Annual Report and under Investor Relations on the rational
website www.rational-online.com.
Shareholders and General Meeting of Shareholders
Around 630 shareholders, representatives of the press and
guests attended the General Meeting of Shareholders in
Augsburg on 8 May 2013. An imputed 89.70% of the share
capital was represented. All resolutions on the agenda were
approved by the General Meeting of Shareholders with a large
majority.
The General Meeting of Shareholders is chaired by the
Chairman of the Supervisory Board or another member of
the Supervisory Board appointed by the Chairman.
Cooperation between Executive Board and
Supervisory Board
A detailed account of the cooperation between Executive
Board and Supervisory Board is provided in the Report of
the Supervisory Board and in the Declaration of Corporate
Governance on rational’s website.
Executive Board
Aft er 17 years at the helm, the previous ceo Dr Günter
Blaschke relinquished his position by mutual agreement
at the end of the 2013 fi scal year. With his entrepreneurial
foresight and commitment he successfully drove forward the
internationalisation of the business and made rational one
of the best companies on the German stock market.
With eff ect from 1 January 2014, the Supervisory Board
has appointed Dr Peter Stadelmann as the new ceo.
Dr Stadelmann has been a member of the Executive Board
since December 2012 and is responsible for HR develop-
ment and hr management. As an outstanding personality
and experienced manager he, together with his colleagues
on the Executive Board, will ensure the continuation and
further development of the current corporate strategy and
philosophy.
Corporate Governance Report
Mr Reinhard Banasch, Chief Sales Offi cer, left the company
on 31 January 2014. Mr Markus Paschmann, who was ap-
pointed to the Executive Board on 1 December 2013, will
take over his duties.
No conflicts of interest occurred in the past fi scal year.
The members of the Executive Board, Dr Peter Stadelmann
(ceo from 1 January 2014), Dr Günter Blaschke (ceo until
31 December 2013), Peter Wiedemann (Chief Technical
Offi cer), Erich Baumgärtner (Chief Financial Offi cer), Reinhard
Banasch (Chief Sales and Marketing Offi cer) and Markus
Paschmann (Chief Sales and Marketing Offi cer), do not per-
form any supervisory board duties in other listed companies.
Supervisory Board
The Supervisory Board of rational ag comprises three
members: Chairman Mr Siegfried Meister and his two depu-
ties Mr Walter Kurtz and Dr Hans Maerz.
Section 8 of the articles of association of rational ag
grants Mr Meister and Mr Kurtz a joint right of delegation.
For as long as Mr Meister and Mr Kurtz are shareholders of
rational ag, they have the joint right to appoint a member
of the Supervisory Board. The right of delegation shall be
exercised by written declaration to the Executive Board of
the company.
Supervisory Board members are proposed for election
exclusively on the basis of their special skills and qualifi ca-
tions; other attributes such as gender or national identity
have not been and will not be of any consequence for this
decision. Accordingly, the Supervisory Board of rational ag
has announced no specifi c targets in relation to its composi-
tion pursuant to number 5.4.1 (2) of the German Corporate
Governance Code.
Because it comprises so few members, the Supervisory
Board has not formed any committees. Details of the focus
of the Supervisory Board’s activities and advice in the year
under review are given in the Report by the Supervisory
Board. According to its own assessment, the Supervisory
Board has an appropriate number of independent members
who have the necessary knowledge, skills and experience
to discharge their duties. No conflicts of interest occurred in
the past fi scal year.
38 To our Shareholders
Corporate Governance Report

Stock option scheme
On 3 February 2000, rational ag launched a stock option
scheme for members of the Executive Board for a maximum
of 200,000 individual shares in the Company. The stock
options are subject to waiting periods and time limits for ex-
ercising the rights, which are decided on by the Supervisory
Board. The exercise of Option rights is linked to a specifi ed
increase in the value of the enterprise measured against
the sdax Performance Index. In 2000 and 2004, tranches
totalling 69,000 no-par value shares were issued which,
on expiry of the relevant waiting periods and time limits for
exercising the rights, were likewise settled in cash. No stock
options were issued in the year under review.
Shareholdings of the management bodies
The members of the Supervisory Board held a total of
8,048,935 shares as at 31 December 2013. This corresponds
to 70.79% of the share capital. Of these, 7,161,411 shares
corresponding to 62.99% of the share capital were held by
Mr Siegfried Meister and 887,524 shares corresponding to
7.81% of the share capital were held by Mr Walter Kurtz.
The members of the Executive Board held a total of 4,493
shares at the balance sheet date. This corresponds to less
than 1% of the share capital.
Compliance
Compliance with the law, integrity and responsible behav-
iour form the basis for the security, sound business practices
and future success of a business. To ensure compliance
throughout the Group with the requirements of the law and
with the company’s internal guidelines, rational ag began
establishing a Compliance organisation in fi scal year 2012.
The starting point for Compliance activities was the
rational ag Code of Conduct, which was compiled in the
form of rational rules of conduct in business and was
communicated throughout the company.
In 2013, the rational Compliance team was set up, and a
Compliance Manager was appointed for the entire rational
Group. The Compliance Manager was awarded “Compliance
Offi cer (tüv)” certifi cation aft er successfully completing a
tüv-Rhineland examination. Additionally, a compliance risk
analysis was performed. The rational rules of conduct in
business were specifi ed in more detail. The Compliance
organisation will undergo further development in 2014 in
accordance with the rational Compliance Program.
Accounting and auditing
On 8 May 2013, the General Meeting of Shareholders ap-
pointed PricewaterhouseCoopers ag Wirtschaft sprüfungsge-
sellschaft , Munich, as auditors of the fi nancial statements
and the consolidated fi nancial statements for fi scal year
2013. The audit engagement was awarded by the Supervisory
Board. Prior to the proposal being distributed to the General
Meeting of Shareholders, the Supervisory Board obtained a
declaration of independence from the auditors. No reasons
have been recognised, which may cause any doubts on the
auditor’s independence.
The auditors have agreed with the Supervisory Board to
inform the Head of the Supervisory Board immediately on
possible reasons for exclusion or prejudice during the audit.
The auditors are additionally required to report separately
on any major weaknesses detected during the audit in the
accounting-related internal control and risk management
system.
Dependent company report
The Executive Board issued a dependent company report
pursuant to section 312 of the Aktiengesetz (AktG, German
Stock Corporation Act). The auditors raised no objections
to the dependent company report following the audit.
Likewise, the Supervisory Board declared aft er examining
the dependent company report that there are no objections
to the declaration by the Executive Board at the end of the
dependent company report.
To our Shareholders
Corporate Governance Report
39rational Annual Report 2013

Pursuant to section 161 of the Aktiengesetz (AktG, German
Stock Corporation Act), the Executive Board and the Super-
visory Board of rational Aktiengesellschaft , Landsberg am
Lech, declare as follows:
rational Aktiengesellschaft complied with the recom-
mendations of the German Corporate Governance Code as
amended on May 15, 2012 from the time it submitted its
last declaration of compliance in February 2013 until June 9,
2013 and since June 10, 2013 with the recommendations
of the German Corporate Governance Code as amended
on May 13, 2013 published in the offi cial section of the
electronic Federal Gazette (“Code”) and also intends to
comply with the recommendations of the German Corporate
Governance Code as amended on May 13, 2013 in future,
with the following exceptions:
Numbers 4.2.4 and 4.2.5 of the Code:
Number 4.2.4: “The total compensation of each one of the
members of the Management Board is to be disclosed by
name, divided into fi xed and variable compensation com-
ponents. The same applies to promises of benefi ts that are
granted to a Management Board member in case of prema-
ture or statutory termination of the function of a Manage-
ment Board member or that have been changed during the
fi nancial year. Disclosure is dispensed with if the General
Meeting has passed a resolution to this eff ect by three-
quarters majority.”
Number 4.2.5. (1): “Disclosure shall be made in the Notes
or the Management Report. A compensation report as part
of the Management Report outlines the compensation sys-
tem for Management Board members. The outline shall be
presented in a generally understandable way.”
On May 11, 2011, the General Meeting of Shareholders of
rational Aktiengesellschaft decided to dispense with the
publication of individualised fi gures for Executive Board
compensation in accordance with section 286 (5) of the
Handelsgesetzbuch (hgb, German Commercial Code). This
resolution of the General Meeting was taken for fi ve years.
rational Aktiengesellschaft complies with the other provi-
sions of numbers 4.2.4 and 4.2.5 in full, and also intends to
do so in future.
Number 5.1.2 sentence 2 of the Code:
“When appointing the Management Board, the Supervisory
Board shall also respect diversity and, in particular, aim for
an appropriate consideration of women.”
The Supervisory Board and Executive Board expressly
welcome all eff orts to counter discrimination on the basis of
gender or any other form of discrimination and to promote
diversity in an adequate manner. When appointing Executive
Board members, the Supervisory Board focuses exclusively
on special skills and qualifi cations; for this reason, other
attributes such as gender or national identity have not been
and will not be of any consequence for this decision.
Declaration of Compliance of
rational Aktiengesellschaft
40 To our Shareholders
Corporate Governance Report

Number 5.3 of the Code (Formation of committees):
The Supervisory Board of rational Aktiengesellschaft has
not formed any committees. Forming committees of the
Supervisory Board, such as an audit committee, is not
appropriate for rational Aktiengesellschaft because the
Supervisory Board consists of only three members. For
this reason, there is no intention to form any Supervisory
Board committees in the future.
Numbers 5.4.1 (2) and (3) of the Code:
Number 5.4.1. (2): “The Supervisory Board shall specify
concrete objectives regarding its composition which,
whilst considering the specifi cs of the enterprise, take
into account the international activities of the enterprise,
potential conflicts of interest, the number of independent
Supervisory Board members within the meaning of number
5.4.2, an age limit to be specifi ed for the members of the
Supervisory Board and diversity. These concrete objectives
shall, in particular, stipulate an appropriate degree of
female representation.”
Number 5.4.1. (3): “Recommendations by the Supervisory
Board to the competent election bodies shall take these
objectives into account. The concrete objectives of the
Supervisory Board and the status of the implementation
shall be published in the Corporate Governance Report.”
The composition of the Supervisory Board of rational
Aktiengesellschaft is guided by the Company’s interests
and guarantees that the Executive Board is eff ectively
monitored and advised. The candidates for election to the
Supervisory Board will be selected exclusively on the basis
of knowledge, skills and experience. Other attributes such
as gender or national identity have not been and will not
be of any consequence. Accordingly, the Supervisory Board
of rational Aktiengesellschaft will not set any concrete
objectives for the composition of the Supervisory Board in
accordance with number 5.4.1 (2) of the Code and will not
report on this in the Corporate Governance Report.
No age limit has been set for members of the Supervisory
Board. Nominations to the General Meeting of Shareholders
are based exclusively on the knowledge, skills and experi-
ence of the candidates in question. The intention is to con-
tinue to abide by this policy in future in order to safeguard
experience and skills for the benefi t of the Company.
Number 5.4.3 (1) of the Code:
“Elections to the Supervisory Board shall be made
on an individual basis”
In order to save time, the intention is to not elect the
members of the Supervisory Board of rational Aktienge-
sellschaft on an individual basis at the ordinary General
Meeting of Shareholders 2014, but to adopt the list system
of election.
Landsberg, February 2014
rational Aktiengesellschaft
Siegfried Meister Dr Peter Stadelmann
for the Supervisory Board for the Executive Board
To our Shareholders
Corporate Governance Report
41rational Annual Report 2013

Report by the Supervisory Board
Dear Shareholders,
Once again in 2013, rational ag continued on its long-term
growth path. The focus in the year under review, given the
continuing uncertain global economic climate, was primarily
on the stability of the company as a whole and on further
improvement in the quality of the business.
Dialogue and communication as a basis
for advice and monitoring
In fi scal 2013, we performed the tasks incumbent on the
Supervisory Board by law and by the articles of association.
We regularly advised the Executive Board on the manage-
ment of the Company and monitored its activities. The Super-
visory Board was directly involved in all decisions of strategic
importance to the rational Group. Cooperation between the
Executive Board and the Supervisory Board was character-
ised by comprehensive, timely and regular communication,
both written and verbal. The Executive Board also reported
on major transactions outside the regular meetings. The
Supervisory Board received monthly and quarterly reports
on market developments, the competitive situation, and the
company’s marketing, sales and profi t trends. In addition,
the Supervisory Board and the Chairman of the Supervisory
Board took steps to ensure that at all times it was informed
about the current business situation, signifi cant transac-
tions, and important decisions by the Executive Board. With
this aim in mind, the Supervisory Board was in close and
regular contact with all members of the Executive Board to
exchange information and ideas.
Where called for by law, articles of association and rules of
procedure, the Supervisory Board voted, following detailed
consultation and scrutiny, on the reports and draft resolu-
tions of the Executive Board. All operations requiring consent
were approved. In fi scal 2013 and in 2014 to date, this in
particular related to decisions concerning product develop-
ment, expansion of the sales and marketing organisation,
further development of the management structure, global HR
development, risk management, and planning and approval
of construction work at the Landsberg site.
Consultations in the Supervisory Board
The Supervisory Board had nine meetings in 2013. In 2014,
one further meeting was held up to the time of the meeting
of the Supervisory Board on 26 February 2014 to adopt the
fi nancial statements. The members of the Supervisory Board
also consulted each other in writing and by telephone, and
met together at 12 other consultative meetings in fi scal 2013.
Where applicable, the Supervisory Board also passed resolu-
tions outside the ordinary meetings. During the past fi scal
year, the Supervisory Board regularly examined and further
improved the effi ciency of its activities, in particular the pro-
cedures and the timely provision of suffi cient information.
Key areas of consultation
The consultations with the Executive Board and the internal
discussions dealt with all relevant aspects of the develop-
ment of the business, including fi nancial, investment, and
HR planning, business trends, the economic situation of the
Company and of the consolidated group, the risk situation,
risk management, and last but not least the current cost and
earnings position. In addition, numerous individual topics
were on the agenda of the Supervisory Board meetings, and
were discussed in depth. These included:
› the departure of the former ceo Dr Günter Blaschke on
31 December 2013 and the appointment of the former Chief
hr Offi cer Dr Peter Stadelmann as the new ceo with eff ect
from 1 January 2014,
› the departure of the former Chief Sales Offi cer Mr Reinhard
Banasch on 31 January 2014 and the appointment of
Mr Markus Paschmann as Chief Sales Offi cer with eff ect
from 1 December 2013,
› appropriation of earnings and proposed dividend
› business planning for fi scal year 2014
› the strategy for tapping new markets, in particular North
and South America and China
› the key points in product development
› the further development of the Controlling organisation
› the further development of the rational Compliance
Programme
› the construction projects at the Landsberg site
At the Supervisory Board meeting to adopt the fi nancial
statements on 26 February 2014, the principal topics
included not only the audit and adoption or approval of the
annual and consolidated group fi nancial statements but
also, in particular, the draft resolutions to be proposed to
the 2014 General Meeting of Shareholders.
42 To our Shareholders
Report by the Supervisory Board

PricewaterhouseCoopers ag, Wirtschaft sprüfungsgesell-
schaft , Munich, will be proposed as auditors for the 2014
fi scal year. We also adopted the remaining draft resolutions
for the ordinary General Meeting of Shareholders.
Our duties in 2013, and, in particular, at the meeting held
on 26 February 2014 to adopt the fi nancial statements, cov-
ered not only the audit plus the entire accounting process in
rational ag and the consolidated group, but also the super-
vision of the internal control system and the eff ectiveness of
the internal audit and the risk management system.
Changes in the Executive Board
Aft er 17 years at the helm, the former ceo Dr Günter Blaschke
relinquished his post by mutual agreement at the end of
2013. With his entrepreneurial foresight and commitment
he successfully drove forward the internationalisation of the
business and made rational one of the best companies on
the German stock market.
With eff ect from 1 January 2014, the Supervisory Board
has appointed Dr Peter Stadelmann as the new ceo.
Dr Stadelmann has been a member of the Executive Board
since December 2012 and was responsible for HR develop-
ment and HR management. As an outstanding personality
and experienced manager he, together with the Executive
Board, will ensure that the current corporate strategy and
philosophy are adhered to and developed further.
Mr Reinhard Banasch, Executive Board member in charge of
Sales and Marketing, has decided to leave the company on
31 January 2014. The existing contract has been terminated
by mutual agreement. As a member of the Executive Board
with now sole responsibility for Sales and Marketing, the
Supervisory Board has appointed Mr Markus Paschmann
with eff ect from 1 December 2013.
Corporate Governance
There were no changes to the Supervisory Board of rational
ag in the 2013 fi scal year.
Since the rational ag Supervisory Board consists of just
three members, no committees have been formed.
In fi scal year 2013, the make-up of the Supervisory Board
of rational ag fully complied with the German Corporate
Governance Code recommendation that the Supervisory
Board should include what it considers to be an adequate
number of independent members.
No conflicts of interest in respect of individual Supervisory
Board members occurred in the 2013 reporting year in con-
nection with consultations, draft resolutions and the audit
engagement.
On 10 June 2013, a new version of the German Corporate
Governance Code entered into force. The Supervisory Board
has dealt in detail with the new recommendations in the Code.
Together with the Executive Board, account was rendered
for the fi scal year 2013 in the Corporate Governance Report.
rational ag largely complies with the recommendations and
suggestions set out in the German Corporate Governance
Code. This has resulted in the submission of the declaration
of conformity of February 2014. A resolution to this eff ect was
passed at the meeting of the Supervisory Board on 29 January
2014 pursuant to section 161 of the AktG. The declaration of
compliance is published in the 2013 Annual Report and under
Investor Relations on the rational website (www.rational-
online.com).
Audit of the annual fi nancial statements
and consolidated fi nancial statements
As proposed by the Supervisory Board and elected by the
General Meeting of Shareholders on 8 May 2013, Price-
waterhouseCoopers ag, Wirtschaft sprüfungsgesellschaft ,
Munich, audited the fi nancial statements of rational ag and
of the Group for fi scal year 2013. The audit engagement was
awarded by the Supervisory Board. Prior to the proposal for
election, the Supervisory Board obtained a declaration of
independence from the auditors. No reasons were apparent
to doubt the independence of the auditors. The auditors were
additionally obliged to inform us immediately of any circum-
stances which could give rise to a lack of impartiality on their
part and, where appropriate, to notify us of services which
they have performed in addition to the audit. The Supervisory
Board reported prior to and during the audit in discussions
with the auditor on the latter’s approach to the audit and the
progress of the audit.
The annual fi nancial statements for the fi scal year from 1 Jan-
uary to 31 December 2013, prepared by the Executive Board
in accordance with the provisions of the Handelsgesetzbuch
(hgb, German Commercial Code), and the Company’s man-
agement report, which also refers to the Declaration of Cor-
porate Governance on the Company’s website, were audited
by the auditors and given an unqualifi ed audit opinion. The
Executive Board drew up a consolidated fi nancial statement
for the consolidated group in accordance with the Interna-
tional Financial Reporting Standards (ifrs), supplemented
To our Shareholders
Report by the Supervisory Board
43rational Annual Report 2013

by the commercial law regulations applicable under section
315a (1) of the hgb. In addition, a Group management
report was prepared. The auditors audited the consolidated
fi nancial statements and the group management report and
issued an unqualifi ed audit opinion.
The annual fi nancial statements, the consolidated fi nancial
statements, the management reports, the auditors’ reports,
and the Executive Board’s proposal on the appropriation
of unappropriated profi ts were forwarded in good time to
all Supervisory Board members for examination. They were
the subject of intensive deliberations at the meeting of the
Supervisory Board held on 26 February 2014. In particular,
the Supervisory Board concerned itself thoroughly with the
fi ndings of the audit by the auditors.
The auditors took part in the discussion of the Company’s
annual fi nancial statements and the consolidated fi nancial
statements. They reported on the results of the audits, in par-
ticular on the points on which it was agreed the audit would
focus, and were available to the Supervisory Board for ques-
tions and supplementary information. One area on which the
auditors’ explanations concentrated was the assessment of
the accounts-related internal control and risk management
system. Both the Executive Board and the auditors answered
all our questions comprehensively and to our satisfaction.
The Supervisory Board raises no objections further to its own
fi nal results of the deliberations and its own examination.
The Supervisory Board approves the results of the audit. At
its meeting held on 26 February 2014, the Supervisory Board
approved the annual fi nancial statements, prepared by the
Executive Board, for rational ag as of 31 December 2013,
including the certifi ed version, dated 20 February 2014, of
the management report for fi scal year 2013, as well as the
consolidated fi nancial statements as of 31 December 2013
and the certifi ed version, dated 20 February 2014, of the
consolidated management report. The 2013 annual fi nancial
statements for rational ag, including the management
report, are thereby adopted in accordance with section 172
sentence 1 of the AktG
Dependent company report
The dependent company report, prepared by the Executive
Board pursuant to section 312 of the AktG, on rational ag’s
relations with associated companies was examined by the
auditor. The auditor issued the following audit opinion:
“Based on our statutory audit and our judgement, we confi rm
that the actual information in the report is correct and the
consideration the Company paid for the legal transactions
listed in the report was not inappropriately high.”
The auditors’ report on the dependent company report was
available to all members of the Supervisory Board in good
time before the meeting to approve the fi nancial statements
and was examined by us and discussed in detail with the
auditors present. Following its own examination, the Super-
visory Board concluded that there were no objections to the
report on relations with associated companies and the fi nal
statement by the Executive Board contained therein.
Appropriation of earnings
Aft er consideration of the operating environment, the situa-
tion on the global fi nancial and capital markets and the fi nan-
cial position of the Company, we approve the appropriation of
earnings proposed by the Executive Board.
From rational ag’s net retained profi ts of 177.1 million euros,
a dividend of 6.00 euros per share or a total of 68.2 million
euros should be distributed and the remainder should be
carried forward to new account.
The Supervisory Board would like to thank all managers
for their close and constructive cooperation, and the trust
they have placed in us. But our very special thanks go to all
employees. Once again in 2013, they succeeded in convincing
our customers of the high added value of rational’s products
and services, and thus in making outstanding use of the
market opportunities open to us.
Landsberg am Lech, 4 March 2014
Siegfried Meister
Chairman of the Supervisory Board
44 To our Shareholders
Report by the Supervisory Board

Group Management Report
for Fiscal Year 2013
The charts and tables on pages 45–76 are not part of the audited group management report of RATIONAL AG,
with the exception of the tables on pages 50, 55 (down) and 73.
Contents
46 The rational Group
51 Economic Report
59 Supplementary Report
59 Qualitative Strengths
60 Outlook, Opportunities and Risk Report
69 Corporate Social Responsibility as a
Fundamental Principle
75 Remuneration Report
75 Information relating to takeovers
76 Declaration of Corporate Governance
Financial Report
Group Management Report
45rational Annual Report 2013

The rational Group
Global market leader in thermal food preparation
Established in 1973, the Group is now the global market and
technology leader in thermal food preparation products for
industrial kitchens. Our primary corporate objective is as
follows:
“We off er the greatest possible benefi t to the people preparing
hot food in the professional kitchens of the world.”
To ensure that we meet these requirements, we focus all of
our resources on our core competence, the transfer of thermal
energy to all types of food. This provides us with the best
possible basis for maintaining and extending our competitive
advantage. The attractiveness of our products and services
continues to grow year on year. This is reflected in our con-
stantly increasing sales volume and revenue fi gures, our
global market leadership with a market share of more than
50% and our numerous national and international awards.
World market share
Others
46%
rational
54%
The Group’s parent company is rational Aktiengesellschaft
(rational ag), whose registered offi ce is located in Lands-
berg am Lech, Germany. We employ around 1,300 people
in 29 companies, more than 700 of them in Germany, and
market our products in all regions around the globe.
With the SelfCookingCenter® whiteffi ciency®, the CombiMaster®
Plus and the VarioCookingCenter multificiency®, we have
products that set the global technological standards in their
segment. Together, they are able to replace all conventional
cooking equipment in the professional kitchen.
Two operating segments
The rational Group is divided into two operating segments,
rational and frima, each of which is controlled as a com-
pany within a company. This organisation is reflected in the
internal reporting structures.
rational
The rational segment concentrates on products that transfer
thermal energy by means of hot air, steam or a combination of
the two, generating revenue primarily through sales of the Self-
CookingCenter® whiteffi ciency® and the CombiMaster® Plus.
We manufacture these products exclusively at our headquar-
ters in Landsberg am Lech, and market them worldwide via
our own sales companies, sales offi ces and trade partners.
frima
The frima segment generates most of its revenue
through sales of the VarioCookingCenter multificiency®,
manufactured in Wittenheim (France). This complementary
product cooks with direct contact heat or in liquid, making
it ideal for use in combination with the SelfCookingCenter®
whiteffi ciency® or the CombiMaster® Plus.
Until 2011, the VarioCookingCenter multificiency® was avail-
able only in Europe. Since the middle of 2012, we have also
been active via selected partners in overseas markets such as
Australia, Chile and Japan.
Group Management Report
46 Financial Report
Group Management Report
The rational Group

Name and registered offi ce of
rational ag subsidiaries Business Segment
Germany
LechMetall GmbH
Landsberg
am Lech Germany rational
rational
Komponenten GmbH
Landsberg
am Lech Germany rational
rational Technical
Services GmbH
Landsberg
am Lech Germany rational
rational Dienstleis-
tungsgesellschaft mbH
Landsberg
am Lech Germany rational
rational Montage GmbH
Landsberg
am Lech Germany rational
rational Großküchen-
technik GmbH
Landsberg
am Lech Germany rational
frima
Deutschland GmbH
Frankfurt
am Main Germany frima
Europe
rational uk Ltd. Luton
United
Kingdom rational
frima uk Ltd. London
United
Kingdom frima
rational France s.a.s. Wittenheim France rational
frima - t s.a.s. Wittenheim France frima
frima France s.a.s. Wittenheim France frima
rational Italia s.r.l. Mestre Italy rational
rational Ibérica Cooking
Systems, s.l. Barcelona Spain rational
rational Austria GmbH Salzburg Austria rational
rational
International ag Balgach Switzerland rational
rational Schweiz ag Balgach Switzerland rational
frima International ag Balgach Switzerland frima
rational Polen Sp. z o.o. Warsaw Poland rational
rational Scandinavia ab Malmö Sweden rational
rational rus ooo Moscow Russia rational
Americas
rational Cooking
Systems, Inc. Schaumburg usa rational
rational Canada Inc. Mississauga Canada rational
rational Mexico s.a.
de c.v. Mexico City Mexico rational
rational Brasil
Comércio E Distribuição
De Sistemas
De Cocção Ltda. São Paulo Brazil rational
Asia
rational Japan Co., Ltd. Tokyo Japan rational
rational Trading
(Shanghai) Co., Ltd. Shanghai China rational
rational International
India Private Ltd. Delhi India rational
Products and markets
The SelfCookingCenter® whiteffi ciency®
is the new global standard
The combi-steamer is a phenomenal success story. First
produced in Landsberg in 1976, it has spread throughout
Germany and Europe and is now in use all around the
world; in fact, it is diffi cult to imagine a professional kitchen
without it. There are around 100 manufacturers of combi-
steamers worldwide, but only a handful of them are major
international players. rational supplies around half of the
800,000 combi-steamers in use around the world today.
Most of our revenues are generated with the SelfCooking-
Center® whiteffi ciency®, which was launched in 2011.
The SelfCookingCenter® whiteffi ciency® is the only cooking
appliance to off er intelligent cooking processes. It replaces
between 40 and 50% of all traditional cooking appliances,
including hot air ovens, stoves and boiling pans. The heat
is transferred via steam, hot air or a combination of the two.
The key unique selling propositions of the appliances are
resource effi ciency, ease of operation, flexibility of use and
the minimum eff ort required for cleaning and maintenance.
Customers are also equally impressed by the CombiMaster®
Plus, with its straightforward operation, limitless cooking
versatility and outstanding cooking performance.
High acceptance of the frima
VarioCookingCenter multificiency®
Users of the frima VarioCookingCenter multificiency® are
also enthusiastic ambassadors of this new complementary
technology. The results of our most recent customer survey
in Germany, France and Switzerland bear this out: 96% of
users surveyed spontaneously declared that they would be
happy to purchase the VarioCookingCenter multificiency®
again at any time.
Markets and customers
We focus on a clearly defi ned target group, namely, all the
people preparing hot food in professional kitchens around
the globe. We are not only a company for chefs, but we are
also a company of chefs, with 300 chefs working in sales,
application research and consulting. We are part of their
world, so we have fi rst-hand knowledge of what they want
and need. As a consequence, we are able to fi nd the best
possible solutions to their problems.
47rational Annual Report 2013 Financial Report
Group Management Report
The rational Group

Untapped world market potential of the
SelfCookingCenter ® whitefficiency ®: 90%
Traditional cooking
technology
70%
Traditional
combi-steamer
20%
SelfCookingCenter ® 10%
Untapped world market potential of the
VarioCookingCenter multificiency ®: 100%
Traditional cooking
technology
99.5%
VarioCookingCenter 0.5%
Our equipment is ideal for any organisation that needs to
produce around 30 meals a day or more. The potential global
market comprises more than 2.5 million professional kitchens.
Around the world, approximately 30% of all potential custom-
ers currently use combi-steamer technology from rational
or competitors; in other words, 70% are still using traditional
cooking equipment, such as hot-air appliances, steam-cook-
ers or stoves. The customer base is vast, ranging from fi ne
dining and other restaurants, hotels, catering establishments
such as company canteens, hospitals, schools, universities,
military facilities, prisons and nursing homes right through
to fast-food chains, caterers, supermarkets, butchers’ shops
and, more recently, bakeries and snack outlets.
Our core market is Europe, where we generate over 60% of
our sales, and it still holds huge, untapped potential. In Eu-
rope, the SelfCookingCenter® whiteffi ciency® is already start-
ing to replace the large installed base of old combi-steamers,
in addition to conventional cooking tech nology. New markets
in the Americas and Asia, such as the United States, Canada,
Brazil, Mexico, China and India are growing in importance for
us.
Strategy and objectives
Our overriding corporate objective is to
maximise customer benefi t
The objective of everything that our employees think and do
is to off er the greatest possible benefi t to our customers at
all times. This objective is embedded as an overriding corpo-
rate objective in the guiding principles of the business. Every
action and decision is scrutinised to ensure that it provides
benefi ts for our customers.
The fi ndings of the customer satisfaction survey conducted
by market research institute tns Infratest bear witness to
the success of our strategy. 83% of all surveyed rational
customers are so delighted by our products and services that
they would not only buy further products and services at any
time, but they would also be happy to recommend them to
colleagues.
This was also confi rmed by 600 chefs and managers from
professional kitchens, who voted the products from rational
and frima as top in their respective categories at the “küche
awards 2013” run by prestigious German trade magazine
“küche”.
Customer-focused sales and marketing process
We have a tailored sales and marketing process, geared
to meet the needs of our customers. We hold product
presentations lasting a number of hours (known as rational
CookingLive and frima CookingLive), in which we work closely
with our trade partners to convince potential customers
throughout the world of the additional benefi ts of using our
equipment through hands-on demonstrations and interactive
cooking. Specialist dealers, who are able to provide local
proximity to customers around the world, are then responsi-
ble for equipment orders, delivery to the customer, fi nancing,
installation and service.
Particularly in markets where market penetration is low,
CookingLive seminars provide potential customers with
information, in turn giving them an important means of sup-
port in the process of choosing what to buy. The seminars are
also benefi cial for existing customers who want to fi nd out
more about new developments before deciding what to buy.
Finally, growing numbers of seminar participants lead to a
deferred increase in sales and revenue.
48 Financial Report
Group Management Report
The rational Group

International as well as national restaurant chains, whether
off ering fast food or commercial catering, are also enjoying
increasing importance even outside the United States. The
trend towards greater occupancy per outlet throughout the
day (day part management) means that quick-service restau-
rants are off ering an ever-expanding range of dishes for dif-
ferent target groups. As a consequence, this customer group
is also increasingly relying on combi-steamer technology to
prepare meals involving more complex cooking processes.
To tap the great potential of this market segment as ef-
fi ciently as possible, we employ staff specifi cally to serve
the needs of this target group and work with the customer to
develop tailor-made solutions.
Minimal vertical integration, maximum value added
We aim for minimal vertical integration in our manufacturing
processes and combine this approach with long-term, reli-
able partnerships with suppliers. Our objective is to achieve
maximum flexibility and excellent quality with optimal
costs and a high level of loyalty among our suppliers. We
only use our own resources if the item concerned can be
manufactured with better quality or more cost-eff ectively in-
house than by third parties or if a specifi c element of system
expertise is especially important for the future development
of our products.
We apply the “One-Piece Flow” principle in our assembly
operations. In other words, one employee assembles a
complete item of equipment and guarantees the quality of
this equipment by including the name on the identifi cation
plate. This means that the smallest economic lot size in
production is a single item of equipment. We are therefore in
a position to take a flexible approach to manufacturing and
assembling equipment to customer order and in accordance
with any customer wish with the shortest possible lead times.
If required, we can deliver just one day aft er order placement.
Because we produce to order, we have no need for the usual
warehousing of fi nished goods. This approach, in which one
employee is entirely responsible for one complete unit, ena-
bles us to make best use of our employees’ high level of skills
and training and at the same time boosts employee motiva-
tion. A system of personal working time accounts is used to
achieve day-to-day adjustment of the necessary production
capacity in line with the number of orders to be processed.
Organic growth
There is still a huge untapped potential market worldwide.
To enable us to make headway into this market effi ciently and
steadily on a long-term basis, we are expanding our global
sales and marketing network step by step, organically and
without acquisitions. In addition to higher penetration of
already well-developed markets, we are increasingly address-
ing the growing potential presented by emerging markets.
We maintain a presence in over 100 countries through own
sales companies and trade partners. To this end, the fi rst
step usually involves working together with local sales part-
ners in the respective markets. Once we have successfully
established our products, we increase market penetration
and in turn tap into the market potential more eff ectively
by setting up our own sales subsidiary in the country in
question. For example, we set up our own sales company in
India in the fi rst quarter of fi scal year 2013, to make further
headway into the market there.
Planning and controlling
We adopt a standardised planning and controlling system
throughout the rational Group, which includes the two
rational and frima segments.
Our company is organised around processes. These are
described in detail and are measured, both qualitatively and
quantitatively, by means of appropriate key fi gures. All em-
ployees in the company strive continuously to improve qual-
ity as a core task. Our strategic quality management process
deals with the implementation of our long-term corporate
quality philosophy. It aims to ensure the high quality of our
products, services and corporate processes, while actively
promoting and supporting quality improvements.
All corporate processes around the world are planned, re-
corded, analysed and subjected to key fi gure assessments in
a multi-level planning and controlling system. The results are
reported to the respective decision-makers. Any necessary
adjustments or corrective measures are determined promptly
and, then, implemented immediately.
We have to ensure and enhance the quality of our products
and services at every stage along the value chain, from sup-
pliers, to assembly and shipment operations, to installation
and technical servicing at the customer’s site. We elaborate
key quality and satisfaction indicators, analyse them and
use the results to initiate the corresponding changes to
enhance quality.
We measure performance effi ciency based on the gross
margin or the operating income. In this way we can identify
areas in which we are ineffi cient or waste resources, and
make the necessary adjustments. We continuously improve
the quality of our products and services in collaboration with
our suppliers and service partners.
49rational Annual Report 2013 Financial Report
Group Management Report
The rational Group

Our suppliers and service partners are included in the
regular process audits and are measured against the
same benchmarks as internal performance effi ciency. In
many areas, decisions intended to bring about continu-
ous improvement are based on up-to-the-minute data. If
complaints, nevertheless, are received from customers
anywhere in the world – from external or internal sources
– the problems are analysed on a daily basis as part of our
cross-process urgent quality improvement system. Eff ective
solutions are developed as quickly as possible.
The non-fi nancial kpi for the interest in our products and the
satisfaction of our customers is the number of CookingLive
participants. For us, this fi gure is an important early indica-
tor for us of future business trends, the highest quality and
the effi cient production of our products and services is key
to our success. They are crucial for customer satisfaction
and, therefore, for our ability to fulfi l our promise to provide
maximum customer benefi t at any time.
In the year under review, our technologies have continued to
enjoy a very high level of global interest. A large number of
potential customers seized the opportunity to fi nd out about
the benefi ts of our products from watching live demonstra-
tions and even trying them out for themselves. We welcomed
around 76,000 participants (2012: 70,000) to our CookingLive
seminars.
By instilling quality responsibility in all our employees,
we are in a position to improve our products and services
sustainably. This is fundamentally based on a high level of
motivation on the part of all employees and managers.
In annual employee surveys, we determine the central kpi
regarding the continuous improvement of our employee
satisfaction. In 2013, 91% of all employees were found to be
not just satisfi ed, but proud to worked for rational.
All employees across the entire value chain are highly com-
mitted to continuously working towards improving quality,
productivity and effi ciency. This is reflected in the fact that
we received over 3,300 suggestions for improvement (2012:
3,200) in 2013 alone.
Financial KPIs are volume and sales trends, gross profi t and
ebit, gross margin and ebit margin, operating expenses,
receivables management (days sales outstanding – dso)
and the development of the equity ratio.
The following table shows the KPIs relevant for
rational-Group:
Key performance indicators (KPIs)
Financial KPIs
Volume/Sales development
Gross profi t/Gross margin
Operating costs
ebit/ebit-margin
Receivables management (dso)
Development of the equity ratio
Non-fi nancial KPIs
Customer satisfaction (CookingLive-Participants)
Employee satisfaction
Innovation delivers competitive edge
The superiority of our technology forms the basis for our
fi nancial success. We place a special focus on research
and development so that we can keep launching innovative
technologies on the market at regular intervals. In 2013, in
research and development alone, we invested 16.7 million
euros (2012: 13.6 million euros) or 4% of sales (2012: 3%)
in further developing the effi ciency of our products and
services.
Our technology leadership stems from our specialisation,
our structured innovation process and the commitment of
our highly skilled employees. To further extend our leader-
ship and innovative strength, we took on more employees
to boost our development team. Our 96-strong team of
specialists (2012: 83) is one of the largest development
teams in the industry. It includes physicists for fundamental
research, chefs and nutritionists for applied research and
development, as well as engineers in various disciplines. So
in research and development too, we live up to our claim to
be the company of chefs.
Our innovations are protected by more than 470 patents,
patent applications and design patents (2012: 450).
50 Financial Report
Group Management Report
The rational Group

Economic Report
Economic conditions
Global economy continues on course
for further growth
In the past fi scal year, global economic output rose by
2.8%. China (+7.8%) in particular was a driver of growth, but
Japan and the United States also grew by around 2%, while
in Europe, the gross domestic product stagnated (source:
Deutsche Bank, January 2014).
The ifo World Economic Climate, which represents the assess-
ment of the current economic situation and future expecta-
tions by international representatives from business, science
and the capital markets, has slightly improved in the fourth
quarter of 2013. The current situation and future expectations
are again viewed in a slightly more optimistic light.
Low dependence on macroeconomic development
We focus on a basic human requirement, namely food away
from home. Our business performance is therefore clearly
less dependent on economic trends than other sectors and
companies.
Nevertheless, the catering and food service sector was not
able to completely avoid the negative trends in the year
under review. In particular in the countries of southern
Europe where debt levels and unemployment are high (Italy,
Spain, Greece and Portugal), catering and food service sup-
pliers have not yet been able to recover from the business
slowdown dating back to the start of the fi nancial crisis. Our
percentage of sales in these countries only amounts to 6%.
In overall terms, the catering and food service sector saw
cautious growth in the past fi scal year. In a primarily stable
competitive environment, we enjoyed above-average growth in
the sector and consequently further extended our market lead-
ership by a long way (source: hki-Statistik, December 2013).
Signifi cant events in fi scal year 2013
Generational shift in the
Executive Board of rational ag
Aft er 17 years at the helm, the former ceo Dr Günter Blaschke
relinquished his post by mutual agreement at the end of
2013. With his entrepreneurial foresight and commitment
he successfully drove forward the internationalisation of the
business and made rational one of the best companies on
the German stock market.
With eff ect from 1 January 2014, the Supervisory Board
has appointed Dr Peter Stadelmann as the new ceo.
Dr Stadelmann has been a member of the Executive Board
since 2012 and was responsible for hr development and hr
management. As an outstanding personality and experienced
manager he, together with the Executive Board, will ensure
that the current corporate strategy and philosophy are
adhered to and developed further.
Mr Reinhard Banasch, Chief Sales Offi cer, left the company
on 31 January 2014. Mr Markus Paschmann, who was ap-
pointed to the Executive Board of rational ag at the end of
2013, will take over his duties
International expansion continued
2013 was another year of international growth for us. In
addition to extending sales capacities in the more mature
markets in Europe we also invested in further penetrating
the signifi cant future potential of Asia and Latin America. By
expanding our sales subsidiary in Mexico and forming a new
one in India, we are in a position to gradually keep gaining
ground in these emerging markets with our technologies.
Completion of a new offi ce and
training building in Landsberg
Global growth and the expansion of our international sales
organisation require us to adapt and extend our infrastruc-
ture accordingly. For this reason, we began the construction
of a new offi ce and training building in summer 2012 at our
headquarters in Landsberg am Lech. This was completed in
April 2013 and following, the building was put into opera-
tion. By this, we are now able to simultaneously train up to
200 participants, such as customers, service partners or
employees.
Construction of a service parts centre in Landsberg
With the increased number of units installed at our custom-
ers’ sites, the service parts area has now reached its capac-
ity limits. We, therefore, started to construct a new service
parts centre at Landsberg in October 2013. Apart from
increasing our space, this new centre also gives us an op-
portunity to re-structure our processes and exploit potential
for further gains in effi ciency.
Financial Report
Group Management Report
Economic Report
51rational Annual Report 2013

Net assets, fi nancial position and
results of operations
Earnings situation
With sales of 461 million euros and earnings before interest
and taxes (ebit) of 128 million euros, the rational Group
can look back on an altogether satisfactory fi scal year 2013.
Our organic growth (before currency eff ects) reached 9%.
Taking negative currency eff ects into account, we were able
to increase our sales by 6%. ebit was 5% higher than in
2012. As in 2012, an ebit margin of 28% was achieved.
Positive order development
rational generates sales primarily through its SelfCooking-
Center® whiteffi ciency®, CombiMaster® Plus and Vario-
CookingCenter multificiency® units and through sales of
accessories, spare parts and cleaning agents.
We produce to customer order with relative short lead times.
The level of orders on hand usually reflects a range of just
three to four weeks. Therefore, there are no noteworthy dif-
ferences in the development of order intake and sales within
one fi scal year.
2013 performance – 6% growth in sales
With total sales of 461.1 million euros (2012: 435.0 million
euros), we were able to report year-on-year growth of 6%.
This increase in the overall sales fi gure is attributable almost
entirely to the growth in unit sales compared to the previous
year. Average prices remained stable in 2013.
20092004 20062005 2007 2008 2012 20132010 2011
221.8246.4
343.0314.4
435.0
350.1391.7
283.7336.6
461.1
Sales development 2004 to 2013
(m eur)
However, sales growth was hampered by negative currency
eff ects in the year under review. We generate a little over
one third of our sales in foreign currencies. Of these, the
most important currencies outside the euro are the pound
sterling (9% of sales), the us dollar (9%), the Japanese yen
(4%), the Canadian dollar (3%) and the Swedish krona (3%).
The strong development of the euro against the foreign cur-
rencies of relevance to us had a negative eff ect on our sales
growth. With stable exchange rates compared to 2012, sales
growth is 3 percentage points higher at 9%.
36% foreign currency sales in 2013
usd 9%
gbp 9%
eur 64%
Other foreign
currencies 14%
jpy 4%
Growth drivers Europe and Americas
While sales in Europe saw disappointing growth of 2% in the
fi rst six months, we were able to report a 13% increase in
the second six months. This resulted in growth of 8% for the
whole year. Aft er adjustments for negative currency eff ects,
operating growth in Europe amounted to 9%.
In the Americas, sales went up by 9% compared to the
previous year (currency-adjusted growth: +14%). Although
the growth rate aft er nine months was still 4%, we saw
growth of over 20% in the fourth quarter, attributable in
particular to strong development in the Central and Latin
American markets.
We were also able to win over the “Rest of the World” regions
(Australia, Near and Middle East, Africa) with a growth rate
of 22%.
In Germany, sales were slightly behind previous year. The
reasons for this were the reluctance on the part of our
customers to invest, and our sales teams failing to target cus-
tomers with suffi cient intensity. By stepping up our sales ac-
tivities, we saw a clear increase in the number of Cooking Live
participants in the second six-month period, which should
have a positive impact on business performance in 2014.
Due to currency eff ects, we were not able to reach previous
year’s sales level in Asia. Our performance was signifi cantly
hampered by the depreciation of the Japanese yen. Adjusted
for negative currency eff ects, growth in Asia amounted to
52 Financial Report
Group Management Report
Economic Report
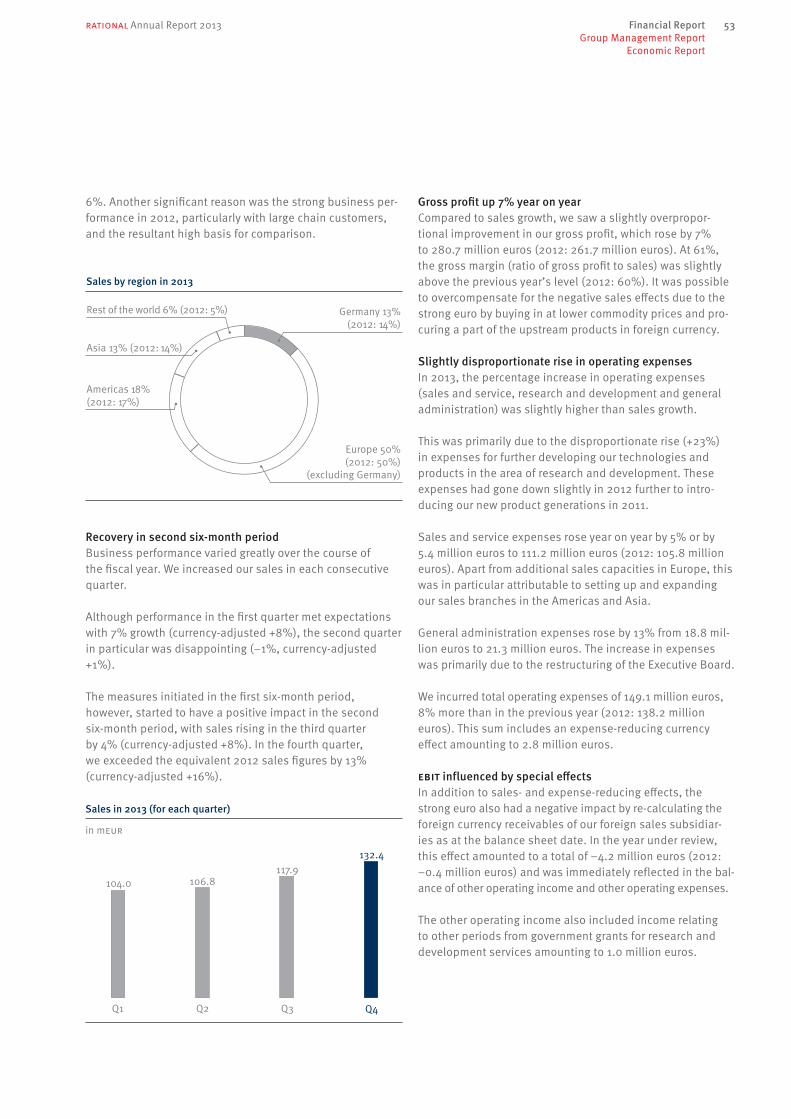
6%. Another signifi cant reason was the strong business per-
formance in 2012, particularly with large chain customers,
and the resultant high basis for comparison.
Sales by region in 2013
Europe 50%
(2012: 50%)
(excluding Germany)
Germany 13%
(2012: 14%)
Rest of the world 6% (2012: 5%)
Asia 13% (2012: 14%)
Americas 18%
(2012: 17%)
Recovery in second six-month period
Business performance varied greatly over the course of
the fi scal year. We increased our sales in each consecutive
quarter.
Although performance in the fi rst quarter met expectations
with 7% growth (currency-adjusted +8%), the second quarter
in particular was disappointing (–1%, currency-adjusted
+1%).
The measures initiated in the fi rst six-month period,
however, started to have a positive impact in the second
six-month period, with sales rising in the third quarter
by 4% (currency-adjusted +8%). In the fourth quarter,
we exceeded the equivalent 2012 sales fi gures by 13%
(currency-adjusted +16%).
Sales in 2013 (for each quarter)
in meur
Q4Q1 Q2 Q3
104.0 106.8
132.4
117.9
Gross profi t up 7% year on year
Compared to sales growth, we saw a slightly overpropor-
tional improvement in our gross profi t, which rose by 7%
to 280.7 million euros (2012: 261.7 million euros). At 61%,
the gross margin (ratio of gross profi t to sales) was slightly
above the previous year’s level (2012: 60%). It was possible
to overcompensate for the negative sales eff ects due to the
strong euro by buying in at lower commodity prices and pro-
curing a part of the upstream products in foreign currency.
Slightly disproportionate rise in operating expenses
In 2013, the percentage increase in operating expenses
(sales and service, research and development and general
administration) was slightly higher than sales growth.
This was primarily due to the disproportionate rise (+23%)
in expenses for further developing our technologies and
products in the area of research and development. These
expenses had gone down slightly in 2012 further to intro-
ducing our new product generations in 2011.
Sales and service expenses rose year on year by 5% or by
5.4 million euros to 111.2 million euros (2012: 105.8 million
euros). Apart from additional sales capacities in Europe, this
was in particular attributable to setting up and expanding
our sales branches in the Americas and Asia.
General administration expenses rose by 13% from 18.8 mil-
lion euros to 21.3 million euros. The increase in expenses
was primarily due to the restructuring of the Executive Board.
We incurred total operating expenses of 149.1 million euros,
8% more than in the previous year (2012: 138.2 million
euros). This sum includes an expense-reducing currency
eff ect amounting to 2.8 million euros.
ebit influenced by special eff ects
In addition to sales- and expense-reducing eff ects, the
strong euro also had a negative impact by re-calculating the
foreign currency receivables of our foreign sales subsidiar-
ies as at the balance sheet date. In the year under review,
this eff ect amounted to a total of –4.2 million euros (2012:
–0.4 million euros) and was immediately reflected in the bal-
ance of other operating income and other operating expenses.
The other operating income also included income relating
to other periods from government grants for research and
development services amounting to 1.0 million euros.
Financial Report
Group Management Report
Economic Report
53rational Annual Report 2013

Cost and earning structure
in m eur 2013
in %of total
sales 2012
in %of total
sales
Total Sales 461.1 435.0
Cost of Sales 180.4 39 173.3 40
Sales & Marketing 111.2 24 105.8 24
Research & Development 16.7 4 13.6 3
Administration & Others 24.6 5 19.6 5
ebit 128.3 28 122.7 28
ebit margin of 28%At 128.3 million euros (2012: 122.7 million euros), ebit was 5% up on the previous year. As in 2012, an ebit margin (ratio of ebit to sales) of 28% was achieved.
20092004 20062005 2007 2008 2012 20132010 2011
ebit development and ebit margin 2004 to 2013
ebit in m eur ebit margin in %
122.7128.3
102.2
53.3
66.9
80.5
92.683.1
90.5
105.8
2427
2828
24
2930
26
28 28
The tax ratio for the Group in 2013 stood at 24% (2012: 24%) and the absolute tax expense was 30.4 million euros (2012: 29.1 million euros).
Group earnings went up, amounting to 97.2 million euros (2012: 93.3 million euros). The net margin was 21% (2012: 21%).
Analysis of outlook attainmentIn the 2012 annual report, we forecast growth in sales and ebit in the range of growth rates generated in the previous years. This equates to a growth rate of around 10% for each.
In view of the performance of the business in the fi rst six-month period and in particular the subdued development in the second quarter, we reduced our forecast to 5% growth in sales with income remaining at the previous year’s level.
We were unable to meet the original expectations, generat-ing sales of 461.1 million euros (+6%) and an ebit amounting to 128.3 million euros (+5%). This was mainly attributable to the negative currency eff ects due to the strong performance of the euro. With stable exchange rates, we would have grown by 9% in sales in the year under review.
We were able to slightly outperform the adjusted forecasts. The main reason for this was the good business performance in the fourth quarter, which clearly exceeded expectations, especially in the Americas and Europe.
Segment report
rationalIn the year under review, the rational segment increased its sales by 6% to 435.6 million euros (2012: 412.6 million euros). ebit stood at 123.6 million euros (2012: 119.4 million euros), 4% up on the previous year. This equates to an ebit margin of 28% (2012: 29%).
frimaWith the VarioCookingCenter multificiency®, the frima segment is selling a product in an early phase of market development with above-average growth rates. As a result, despite its comparatively small size, frima has already made a signifi cant contribution to the overall growth of the rational Group.
In 2013, frima increased its sales by 10% to 28.3 million euros (2012: 25.7 million euros). ebit rose by 26% to 3.8 mil-lion euros (2012: 3.0 million euros). At 13%, the ebit margin went up one percentage point compared with the previous year (2012: 12%).
Operating segments
2013keur rational frimaSegment sales 435,561 28,269Segment result +123,614 +3,815Sales growth +6 % +10 %ebit margin 28 % 13 %
2012
keur rational frima
Segment sales 412,608 25,695
Segment result +119,409 +3,038
Sales growth +11 % +14 %ebit margin 29 % 12 %
54 Financial Report Group Management Report Economic Report

Financial position
rational was able to maintain and even strengthen its
solid fi nancial position in 2013. The liquidity ratio of 53%
(2012: 51%) on the balance sheet date underlines our
independence from lenders.
Financial strategy: putting security before return
rational’s fi nancial strategy is to safeguard its fi nancial
independence and short-term capacity to react to market
changes. Security comes before return in our investment
strategy. The key components of fi nancial management are
the management of capital structure, particularly fi nancial
assets and money deposits, currency risk management,
receivables management and the management of liquidity
for the Group as a whole.
Because we always have suffi cient liquidity, we are not de-
pendent on banks and the capital market. This enables us to
make rapid entrepreneurial decisions, especially in diffi cult
economic times. We are therefore in a position to fi nance our
growth from our own funds and keep liquidity in reserve at
all times in case of unexpected developments in the global
economy.
When it comes to investing liquid assets, we put capital
maintenance before return. For this reason, we invest almost
exclusively in euro-denominated fi xed-term and demand
deposits with short maturities at banks with good ratings.
We also ensure that our shareholders regularly participate
in the success of the company. In recent years, we have
on average paid out more than 70% of our net earnings as
dividends.
High level of operating cash flow
Because of the low level of capital intensity of our highly
profi table business model combined with low vertical inte-
gration and effi cient receivables management, we are able to
maintain our operating cash flow at a consistently high level.
During the year under review, operating cash flow reached
102.8 million euros, just below the previous year’s fi gure
(2012: 111.4 million euros), despite profi t from ordinary
activities going up by 5.2 million euros. This is mainly attrib-
utable to the higher level of receivables (+9.9 million euros)
in the year under review, whereas we were able to reduce
receivables in the previous year (2012: –5.7 million euros).
Cash flow from investing activities amounting to –27.5 mil-
lion euros (2012: -38.0 million euros) includes investments
in property, plant and equipment and intangible assets. In
the year under review, these stood at 12.0 million euros,
2.6 million more than in the previous year (2012: 9.4 million
euros). This fi gure includes expansion investments amount-
ing to 7.5 million euros for the completion of the offi ce and
training building, the commenced new construction of the
service parts centre and the modernisation and expansion
of machinery at our components factory. In the year under
review, we also invested approximately 16.0 million euros in
fi nancial assets with a maturity of more than three months.
20092004 20062005 2007 2008 2012 20132010 2011
Operating Cash Flow 2004 to 2013
in meur
39.232.8
49.1
61.1
71.0 67.7
83.2 86.9
111.4102.8
Free cash flow, comprising cash flow from operating
activities less investments in non-current assets (12.0
million euros), reached 90.8 million euros in 2013 (2012:
102.0 million euros).
The cash flow from fi nancing activities reflects the dividends
paid out, the cash inflows from borrowings, and the repay-
ments of principal and interest payments in connection with
our bank loans. In the year under review, we paid total divi-
dends of 64.8 million euros to our shareholders for the 2012
fi scal year. We borrowed 12.1 million euros for investments
in real estate and machinery. Repayments of principal in re-
spect of bank loans amounted to 3.0 million euros. In total,
the cash flow from fi nancing activities stood at –56.7 million
euros (2012: –57.2 million euros).
Cash flow 2014
in m eur 2013 2012 Change in %
Cash flow from
operational activities 102.8 111.4 –8
Cash flow from
investment activities –27.5 –38.0 –28
Cash flow from
fi nancing activities –56.7 –57.2 –1
Financial Report
Group Management Report
Economic Report
55rational Annual Report 2013

High level of liquidity
The balance of cash, cash equivalents and deposits rose by
33.7 million euros during the course of the year under review
to 200.1 million euros (2012: 166.4 million euros). Liquid
funds therefore represented 53% of total assets (2012: 51%).
This fi gure includes an amount of 10.5 million euros bor-
rowed to fi nance the new service parts centre. This aff ects
liquidity that, based on the building progress, has not yet
been used for its intended purpose and is being kept in an
account assigned to the lending bank in accordance with
the contract.
We also have unused credit lines amounting to 28.5 million
euros (2012: 27.5 million euros).
Dividend of 6.00 euros proposed
Although economic forecasts for 2014 are predicting positive
growth rates, the uncertainties generated by the interna-
tional debt crisis continue to prevail. Against this backdrop
and considering the good liquidity position, the Supervisory
Board and the Executive Board have decided to propose
payment of a dividend of 6.00 euros per share to the General
Meeting of Shareholders 2014 for fi scal year 2013 (2012:
5.70 euros). This represents a dividend yield of 2.5% based
on the closing price on 31 December 2013.
The proposed dividend entails distributing a total of
68.2 million euros. Even aft er the dividend payment, the
liquidity of the company remains at a high level.
Off -balance-sheet fi nancing instruments
rational does not shift liabilities to expressly created,
special-purpose vehicles. We do, however, make very limited
use of operating lease arrangements for technical equip-
ment, company cars and it systems, and enter into leases
for offi ce space. Over the next fi ve years, contractually fi xed
payments in connection with these leases will be 8.6 million
euros (2012: 8.5 million euros). Off -balance-sheet fi nancing
therefore has no material impact on net assets.
Long-term fi nancing measures
We generally use long-term bank loans to fi nance invest-
ments in property, plant and equipment. Accordingly, the
largest items under non-current liabilities are liabilities to
banks, which stand at 31.1 million euros (2012: 22.5 million
euros).
The year-on-year increase is attributable to taking out new
bank loans to fund the new service parts centre and to mod-
ernise our machinery at our components factory, amounting
to 12.1 million euros. This amount is off set by repayments
of loans amounting to 3.0 million euros. The funds for new
buildings have already been drawn on in full and are secured
by land charges.
The other outstanding loans were used to fund the assembly
and shipping building completed in 2008, the new offi ce
and training building completed in 2013, and the production
facilities at the components factory. Most of the amount
borrowed will mature in 2022 (19.8 million euros) or 2023
(8.5 million euros).
Net assets
rational has a very sound balance sheet structure. With
an equity ratio of 71% and current (short-term) assets
accounting for more than 82% of total assets, this gives
us maximum security and flexibility at all times.
High equity ratio
On 31 December 2013, total assets had risen by 16% from
326.2 million euros to 377.3 million euros. The principal
reason behind this increase was the dividend distribution of
64.8 million euros, which was off set against net earnings of
97.2 million euros. As a result, equity increased signifi cantly
by 13% to 268.8 million euros (2012: 237.4 million euros). At
71%, the equity ratio at the balance sheet date remained at
the previous year’s level (2012: 73%).
Non-current assets increased by around 5.6 million euros in
2013 as a result of the new investments in real estate and
machinery.
56 Financial Report
Group Management Report
Economic Report

Current assets also grew by 45.5 million euros in the year
under review. This growth was mainly driven by the increase
in liquid funds (+33.7 million euros) and trade receivables
(+9.9 million euros). Current assets accounted for 82%
(2012: 81%) of total assets as of the balance sheet date,
thus showing a slight increase.
We continuously optimise the amount of capital tied up
in trade receivables. In 2013, the average dso (days sales
outstanding) slightly reduced to 48 days (2012: 49 days) and
the proportion of overdue receivables went down to an aver-
age of 4% (2012: 6%). Our most important dealer to date in
the Austrian market went into insolvency in 2013. The eff ects
of this insolvency on the balance sheet and earnings were
kept to a relatively low level, by enforcing retention of title
rights, obtaining compensation from the credit insurer and
continuing major projects with other trade partners.
Using global trade credit insurance cover and confi rmed, ir-
revocable letters of credit and bank guarantees, we achieved
a receivables coverage ratio of 80% (2012: 86%) as of the
balance sheet date, taking into account the trade credit
insurance deductibles.
As a result of the ongoing crisis, the credit insurer was
reluctant to accept cover in the southern countries of the eu.
Our sales activities in the emerging countries are increas-
ingly directed towards young trade companies that have not
been trading long enough to have an established credit rat-
ing, making insurers less prepared to accept the risk. Against
this background, we decided in the year under review to
knowingly carry risks ourselves more widely in these regions,
which ultimately led to the drop in the risk coverage ratio.
Overall, rational working capital management is highly
eff ective. By managing receivables effi ciently, we are able to
maintain trade receivables at a low level. Because we manu-
facture to order in connection with our low level of vertical
integration, and use the kanban system for the supply of
materials in our production process, we require only minimal
amounts of fi nished goods and work in progress. In settling
supplier invoices, we make use of our terms of payment
and take full advantage of any cash discounts available.
Working capital rose by 9.1 million euros in the year under
review. This is mainly attributable to the higher level of trade
receivables (+9.9 million euros). At the end of the year, work-
ing capital stood at 78.9 million euros (2012: 69.8 million
euros) or 17% of sales (2012: 16%).
20062004 2005 2007 2008 2009 20112010 2012 2013
Working Capital 2004 to 2013
Working Capital in meur
Working Capital as a percentage of Sales
53.0
58.461.7 60.7
69.8
78.9
54.758.2
73.4
41.0
17% 17%19%
22%
18%21%
18% 18% 16% 17%
Liquid funds
53% (2012: 51%)
Non-current assets
18% (2012: 19%)
Current assets
29% (2012: 30%)
Balance sheet structure 2013
Equity
71% (2012: 73%)Current liabilities
20% (2012: 19%)
Non-current liabilities
9% (2012: 8%)
Financial Report
Group Management Report
Economic Report
57rational Annual Report 2013

20092004 20062005 2007 2008 2012 20132010 2011
Equity/liabilities
in %
Equity Liabilities
71 7264
71
29
73
27
75
25
7373
27
71
29363428
68 66
3229
Capital investment
In the year under review, we invested 12.0 million euros
in non-current assets (2012: 9.4 million euros). This fi gure
includes new investments in real estate and in machinery at
the components factory.
In the year under review, we also invested in the further
development of our innovative technologies with a view to
safeguarding our product leadership, as well as in expanding
our international sales, marketing and service organisation
and the management thereof. These investments in the
future are recognised directly as research and development
expenses (16.7 million euros), sales and service expenses
(111.2 million euros) and general administration, and are not
capitalised.
20062004 2005 2007 2008 2009 20112010 2012 2013
5.74.6
6.04.4
5.74.3
2.4
7.6
4.5
6.85.7
7.3
9.4
6.8
12.0
7.2
14.3
5.3
32.6
7.3
Capital investments Depreciation
Capital investments and depreciation
in m eur
In 2013, investments amounting to 1.5 million euros have
already been made in the construction of the new service
parts centre. The total amount to be invested stands at
around 11.5 million euros. The corresponding agreements in
this respect have been concluded with construction fi rms.
The contractually agreed investments for 2014 amount to
8.2 million euros. In addition, there are no signifi cant invest-
ment commitments for the next fi scal year that are contractu-
ally fi xed or contingent upon economic considerations.
Capacity of our manufacturing facilities currently lies at
around 70%. With this level of capacity utilisation at our
facilities, we are well placed for future growth.
58 Financial Report
Group Management Report
Economic Report

Sustained high level of earnings power
and fi nancial stability
High credit rating from banks
Our company is given a very good credit rating of a to aaa by
all lending banks. We have not raised any borrowings from
capital markets, so we do not have any external rating from a
ratings agency.
Excellent share price performance
Our share price performed in line with the positive perfor-
mance of the business during the year under review. The
share price peaked at 269.15 euros, an all-time high. The
closing price was 241.10 euros, 11% higher than in the previ-
ous year (218.00 euros).
Management’s assessment of the economic situation
Operating conditions for the business remain good in
terms of the state of the market, the performance of our
products and our general fi nancial position. There is
huge untapped market potential around the world for the
SelfCookingCenter® whiteffi ciency®, the CombiMaster® Plus
and VarioCookingCenter® multificiency® at between 90%
and 100% of the around 2.5 million addressable professional
kitchens. We are the out-and-out global market leader and
continue to receive top scores for brand awareness, cus-
tomer satisfaction and repurchase rates.
rational is also in the best possible position for the future,
given its excellent liquidity, ongoing capacity to generate
cash, sound earnings performance and signifi cant equity
base. In addition, we have already proven that we are able to
adapt rapidly and in a highly flexible manner to unexpected
situations.
Legal framework
In the year under review, there were no changes in the legal
framework with any material impact on our business.
Supplementary Report
Mr Reinhard Banasch, Chief Sales Offi cer, left the company
on 31 January 2014. Mr Markus Paschmann, who was ap-
pointed to the Executive Board of rational ag in December
2013, will take over his duties.
Mr Paschmann is ideally qualifi ed for these duties. Aft er
graduating in engineering and business administration, he
gained over 20 years of experience in the fi eld of selling
technical products. Before joining rational, he was a mem-
ber of the Executive Board of the global leader in industrial
automation solutions, with over 6,000 employees and sales
of approximately 970 million euros.
No events occured aft er the balance sheet date, that are of
material importance to the assessment of net assets, fi nan-
cial position or results of operation of the rational Group
and would be reported here.
Qualitative Strengths
Intense customer retention activity aft er purchase
The company uses a variety of approaches aimed at improving
customer loyalty and increasing the retention of end-customers
aft er a product has been sold. These include Clubrational, the
Academy rational and the rational portal.
Clubrational is our customer network and already has more
than 46,000 members around the globe. Members benefi t
from a number of free services, such as direct access to soft -
ware updates for the SelfCookingCenter® whiteffi ciency®, and
are therefore able to participate directly in the advances made
by rational cooking research. The club also enables chefs to
provide each other with expert assistance, with an extensive
recipe database and the opportunity to publish personal
recipes completing the service off ering, which is free of charge.
The Academy rational off ers our customers the opportunity to
tap into rational cooking expertise. By cooking alongside our
chefs, customers can learn to use their equipment to the very
best advantage and to derive the maximum benefi t from it.
The rational portal is a special web platform made available
to dealers, planners, service partners and sales people, and
features a comprehensive range of information and services.
Product and service information can be accessed on the
portal. It is also possible to order units, accessories, spare
parts, merchandising items and print media. Dates of trade
fairs and “rational CookingLive” events can be viewed at
any time. Everything is available on one site, is always up to
date and can be used intuitively.
59rational Annual Report 2013 Financial Report
Group Management Report
Supplementary Report
Qualitative Strengths

Using social media to demonstrate customer benefi t
rational is also represented on the virtual platforms
Facebook and Twitter, where we seek a dialogue with our
target group. Facebook and Twitter provide us with a fast,
interactive means of communication that enables us to
determine our customers' requirements directly and to
respond immediately to them.
Users on Facebook and Twitter can access practical tips
and help, information about current events, and daily news
updates. Both platforms can be used to ask questions and
send in ideas and suggestions.
We use the video platform YouTube to off er our customers
practical tips and information on various cooking applica-
tions or equipment functions, as well as ideas for preparing
food. The video format makes it easier for chefs to put the
ideas into practice in their own kitchen.
Our customers can use the Expert app to draw on the wealth
of knowledge of around 300 rational chefs. With this app,
we are changing how we communicate with our customers,
sharing our knowledge in an uncomplicated way with the
users of our equipment. In addition to reliable, practical tips
for specifi c applications, we off er creative recipe ideas. Us-
ers can also register for rational CookingLive events or join
the Academy rational free of charge.
Anybody wishing to contact rational directly has the op-
portunity to do so. The ChefLine and the service team can be
contacted by e-mail or telephone.
The positive feedback on these services and the constantly
increasing number of users, readers, customer enquiries,
online registrations, video clicks, fans and followers show
that we are today already in the best possible position to
meet future requirements.
Outlook, Opportunities and Risk Report
Outlook
Outlook assumptions
Our outlook takes into account all factors known at the
time of preparing this report, which aff ect the business
performance of the rational Group. Such factors include
relevant external market indicators and company-specifi c
circumstances.
The main market-related parameters are growth of the global
economy, movements in currency rates and commodity
prices.
Our leading market position with products that are superior
to those of our competitors, a high level of brand recogni-
tion combined with an excellent brand image and a huge
untapped global market potential are also taken into
consideration in the outlook. In addition, we have satisfi ed
customers, a consistently successful business model and a
very sound fi nancial foundation.
Internal factors are employee satisfaction and measures to
maintain and further boost their high level of commitment.
The outlook also takes into account activities that have
already been implemented and measures planned for the
future.
Global economy on growth path
Economists continue to be optimistic about the prospects for
the international economy and expect to see global growth
of 3.8% for 2014. The highest growth rates of 6% are those of
the emerging economies. But North America is growing too,
with an expected growth rate of around 3%. Europe emerged
from the longest recession since the end of the Second World
War. Experts expect economic growth in Europe for 2014 to
be around 2% (source: Deutsche Bank, January 2014).
Expected currency eff ects for 2014
The poor development of the foreign currencies of relevance
to us against the Euro had a signifi cant negative impact on
our sales and earnings performance. We do not expect this
trend to continue in 2014; in fact we expect the currencies to
remain relatively stable and to have no signifi cant impact on
our business and earnings performance.
60 Financial Report
Group Management Report
Outlook, Opportunities and Risk Report

No material impact on earnings expected
from commodity price development
We do not expect commodity price development to have any
material impact on our cost of sales and consequently on
our profi ts for 2014. In the case of the basic price of steel,
we have yearly contracts that provide us with a sound cost
basis. We have already been able to agree a slight reduction
in the basic price of steel with our suppliers for 2014.
The alloy surcharge continued to drop in the course of fi scal
year 2013, currently lying at a relatively low level of around
one euro per kilo (average 2013: almost 1.20 euros). Given
that the global economy is forecast to stabilise, we are
assuming that the price of nickel will rise slightly and that
the alloy surcharge for 2014 will be an average of around
1.30 euros.
Satisfi ed employees mean satisfi ed customers
The main requirements to ensure long-term business suc-
cess are enthusiastic customers and employees.
Aft er all, only committed and enthusiastic employees also
have satisfi ed customers. We therefore attach the highest
importance to the satisfaction levels of our employees, who
are seen as entrepreneurs in the company (U.i.U.®). For this
reason, the company is not content with its already high
level of employee satisfaction (91% are proud to work for
rational), but would like to further boost satisfaction in 2014
by carrying out targeted activities and incentive measures.
Our customers and their highest satisfaction guide what we
think and do. For only enthusiastic customers will stay loyal
to our products, keep recommending them to colleagues and
thus ensure our continued business success in the future.
We will keep investing in further developing and improving
our products and services in the future, so that our customers
can derive even more benefi t from them. We therefore want
to retain and even further improve the high level of satisfac-
tion of our customers, as confi rmed by a current customer
satisfaction survey conducted by market research institute
tns Infratest.
Development of international market potential
In 2014, we plan to invest in the expansion of our global
sales and marketing network so that we are in a position
to exploit the available opportunities. The aim is to take
advantage of opportunities presented that have not yet
been fully penetrated. Nonetheless, there are also growth
opportunities to be exploited in more developed regions.
This can be achieved by further market penetration and by
replacing older combi-steamers with the SelfCookingCenter®
whiteffi ciency®.
To this end, we are planning a marked expansion in the
number of employees in 2014. A total of around 90 new jobs
will be created, over half of them in sales and marketing.
By boosting our sales power in this way, we will be able to
spread our message of customer benefi t even more eff ec-
tively, which will translate into more people interested in our
technologies. We assume double-digit growth in the number
of people attending our CookingLive seminars.
Introduction of vcc table-top unit
In line with our top priority of always off ering customers
maximum benefi t, we have also developed a table-top
variant of the VarioCookingCenter multificiency®. This will
generate further sales potential in existing kitchens, particu-
larly in restaurants and hotels. As with the conventional floor
model, it replaces the need for pans, boiling pans, stoves
and deep fryers in the kitchen, but takes up considerably
less space.
Additional investment in Landsberg
The company’s heavy investment over recent years provides
an excellent platform for future production operations.
Our budget for capital investment in non-current assets in
2014 has been set at around 20 million euros. This covers
maintenance investment and the completion of the new
international service parts centre at the Landsberg location.
This capital expenditure will be funded both from our own
funds and from borrowings.
Financial Report
Group Management Report
Outlook, Opportunities and Risk Report
61rational Annual Report 2013

Sales and profi t forecast for 2014
Based on economic expectations and in particular the foun-
dations we have laid for successful corporate development,
we expect the moderate volume and sales to continue for
2014. Above-average growth is expected in the regions of the
Americas and Asia.
The VarioCookingCenter multificiency® is still at an early
stage on the market. Moreover, effi ciency within the frima
sales organisation signifi cantly improved aft er various
personnel measures were taken in 2013. In combination
with the positive eff ects of launching a new table-top unit on
the market, we envisage above-average growth in sales and
earnings at frima in 2014 compared with the Group.
We expect Group-wide costs of sales to increase in propor-
tion to sales. Due to this, we expect a proportional increase
of gross profi t and, therefore, our expected gross profi t
margin is at around 60%, as in 2012.
Operating expenses, as well as ebit, are expected to grow
comparable with the increase in sales. We, therefore, as-
sume that our ebit margin will range from 26 to 28%.
Sustainably solid underlying fi nancial position
Throughout 2014, we expect equity to remain the same at
around 70%, as well as a high level of available liquidity.
Liquidity requirements for current operating expenses, the
increase in working capital needed to keep pace with growth,
the necessary investment in plant and equipment, and the
planned dividend payment will be covered for the most part
by cash inflows and the net liquidity currently available.
Due to the reluctance on the part of the credit insurer to
accept cover in the emerging countries, we expect the risk
coverage ratio of our sales receivables to slightly decrease.
Our dso (Days Sales Outstanding) is assumed to stay on
previous year’s level.
Opportunities and risk report
The policy adopted at rational ag with respect to opportuni-
ties and risks aims to secure the continued existence of the
company, increase enterprise value and meet fi nancial and
strategic organisational objectives. Eff ective risk manage-
ment makes it possible to detect potential risks at an early
stage and minimise them. Identifying new opportunities
also ensures that the company can continue to develop in
a sustainably profi table way. The presented opportunities
and risks are equally relevant for the rational and frima
segments.
Overall assessment of opportunities
and risks by the Executive Board
Our business performance is aff ected by a large number of
current social trends and developments around the world,
leading to opportunities and risks that may positively or
negatively aff ect business operations. Our outlook for busi-
ness performance in 2014 as well as our long-term expecta-
tions take the factors set out below into account. Risks may
lead to negative variances in the outlook, and opportunities
to positive ones.
Opportunities for the successful performance of our busi-
ness in the future include the need to replace equipment
with innovative products in established markets and the
growing prosperity in emerging countries. Given that there
is potential in the global market, that our products head
the fi eld in terms of technology and that our market-leading
position is unchallenged, the Executive Board believes that
the opportunities for maintaining our history of success into
the future are positive.
Nonetheless, there are also risks that could jeopardise
whether we attain our corporate objectives or not. In ad-
dition to tangible, insurable risks, there are risks such as
economic turmoil, political decisions, increasing competi-
tion, fi nancial developments (e. g. currency trends) as well
as product and operational risks.
Overall, the Executive Board believes that it can control
these risks. In other words, these risks do not constitute a
threat to the existence of the business as a going concern.
Nevertheless, should any one or a combination of these
risk factors materialise, the company may fail to achieve its
corporate objectives.
62 Financial Report
Group Management Report
Outlook, Opportunities and Risk Report

Opportunities report
rational opportunities management
rational operates in a global environment off ering a wealth
of opportunities for the company. The key to successful
business activities is to identify these opportunities at an
early stage and consistently exploit them. Taking advantage
of realistic opportunities while avoiding unnecessary risks is
and remains a vital prerequisite in ensuring sustainable and
profi table growth.
Opportunities encompass external factors and trends, such
as the growing number of potential customers as a result of
increasing prosperity in the emerging markets. Opportuni-
ties also result from inherent strengths, which if optimally
leveraged will have a positive impact on the company’s
successful performance in the future. Examples include the
high level of qualifi cation of our employees, our superior
products and effi cient corporate processes.
Positive external factors and trends
Eating out as a basic human requirement
We focus on a basic human requirement, namely food away
from home. This provides us with a degree of security, even
in times of crisis.
As prosperity increases, the restaurant and catering sector
grows in signifi cance. Per capital income in the emerging
markets is rising rapidly and, therefore, the prosperity of
the growing population tangibly increases, leading to the
emergence of a new middle class and higher standard of
living, which in turn has a positive impact on demand for our
products in these markets.
Huge available potential in the global market
Only around 30% of the 2.5 million professional kitchens in
which our technology can be installed are already using com-
bi-steamer technology. The remaining 70% are still relying
on conventional cooking technologies. So far, only around
10% of all kitchens have installed a SelfCookingCenter® or
SelfCookingCenter® whiteffi ciency®. The SelfCookingCenter®
whiteffi ciency® replaces both conventional cooking technol-
ogy and standard combi-steamers, so the potential market
still available is around 90% of all the 2.5 million profes-
sional kitchens worldwide.
The global potential for the VarioCookingCenter
multificiency® is even higher. As the product has only been
on the market for a few years, market penetration is still
relatively low and the available customer potential is almost
100% of the 2.5 million professional kitchens.
This huge untapped potential still available in the market
will allow us – and indeed our competitors – to continue to
grow in the future with sales generated from further market
penetration and rising demand for replacement equipment.
Trend towards healthier eating and greater variety of food
The importance of healthy, balanced eating has been
recognised by both individuals and hot food providers,
particularly in the developed industrialised nations. This
has given rise to initiatives for healthier food to be off ered
in public facilities, such as schools and universities. A trend
towards healthier and more varied dishes is also apparent in
the hospitality industry. If our products are used to prepare
food, vitamins are conserved and fat is reduced, with the
resulting dishes will therefore be healthy.
Strengths of rational
Superior products
We enjoy a portfolio of products and services superior
to that of our competitors. Both the SelfCookingCenter®
whiteffi ciency® and the VarioCookingCenter multificiency®
are market leaders in terms of technology and applications,
even though our prices are similar to those of competitors.
This adds to the appeal of our products and services for
customers who are looking for a multifunctional product
off ering the best features, exceptional ease of operation, a
high degree of flexibility and a short payback period.
High innovative capability
To live up to our claim of off ering products with the highest
possible benefi t to customers around the globe, it is essen-
tial to bring innovative products onto the market on a regular
basis. This means we are never completely satisfi ed – we
constantly search for better solutions and take hold of the
reins of technological progress. In this way, we safeguard
the high technical standards of our products and ensure
ongoing development, which in turn enables us to not only
maintain our excellent position on the market, but also keep
extending it. We are in a position to address new customer
groups and as a result further extend the sales potential of
our products within our target group.
Financial Report
Group Management Report
Outlook, Opportunities and Risk Report
63rational Annual Report 2013

Excellent customer satisfaction
Today, the combi-steamer is considered one of the most im-
portant items of equipment in a professional kitchen. We are
perceived as a provider of innovative solutions, supplying
high-quality, reliable products accompanied by an outstand-
ing level of service quality. More than 80% of our customers
are so satisfi ed that they would buy rational products again at
any time and recommend the products to others. As a result,
we continue to enjoy our leading market position by a wide
margin. Every second combi-steamer sold around the world
is a rational product.
Successful marketing
We are frequently the trailblazers in developing new markets.
This leads to rapid brand recognition and a substantial
advantage over competitors when exploiting available market
potential. The effi cient, successful development of new mar-
kets is a lasting contributing factor in helping us to consolidate
and build on our position as the global market leader.
Resource effi ciency
The effi ciency of technologies in the use of resources is
becoming an increasingly signifi cant factor in capital spending
decisions for professional kitchens. The SelfCookingCenter®
whiteffi ciency® and the VarioCookingCenter multificiency®
signifi cantly reduce consumption of energy, water, fat, cleaner
and the use of raw materials, while taking up considerably less
space than conventional cooking technology. The time and
eff ort required to supervise cooking and carry out equipment
cleaning is also reduced, resulting in savings in working time.
Unique corporate culture
The principle of “Entrepreneur in the Company” (U.i.U.®),
which encompasses a decentralised management structure,
high levels of personal responsibility and self-organisation,
forms the basis for collaboration between employees
throughout the Group and for the self-image of all employees.
Other aspects of the corporate culture include the concept
of continuous learning – based on the motto “Learn from the
best” – and continuous improvement, as a result of which
we identify and eliminate weaknesses in the areas of work
covered by each individual employee, helping us to increas-
ingly avoid wasted eff orts in the organisation.
Group-wide process organisation ensures that we achieve the
highest possible level of effi ciency by avoiding unnecessary
interfaces between processes. This enhances motivation
and increases the extent to which each individual employee
identifi es with their end-to-end tasks and responsibilities.
Risk report
The risk report explains the principles and organisation of
risk management at rational and presents the current risk
situation. Business risk can be defi ned as the danger of not
meeting fi nancial, operational or strategic targets according
to plan. Our operations around the world expose us to a va-
riety of risks. In order to meet strategic targets and assure the
company’s success, it is essential for us to identify risks at an
early stage, analyse their causes and impact, and introduce
suitable corrective measures to prevent or contain them on
a long-term basis.
The rational risk management system
Risk management is a core task of the entire Executive Board.
The process is coordinated by the Chief Financial Offi cer.
The objective of the rational risk management system is
to exploit achievable opportunities while taking account of
existing risks.
The rational risk management system is structured so as
to ensure that key risks are systematically identifi ed, evalu-
ated, aggregated, monitored and reported to the respective
decision-maker. Its success critically depends on heightening
the awareness of risks and opportunities among employees
and on fostering a highly developed sense of entrepreneurial
responsibility among managers. To maintain the eff ectiveness
of the rational risk management system at a sustainable and
appropriately high level, there are uniform standards that ap-
ply throughout the Group. The framework conditions and re-
sponsibilities for eff ective, forward-looking risk management
are documented in a corporate guideline, which is binding
for all employees. Reflecting rational’s organisational
structure, the managers of the individual business units are
themselves responsible for the early detection, management
and communication of risks. An appropriate system has been
set up for reporting risks.
Internal and external risks are recorded and assessed for
all business units in the company as part of an annual risk
analysis. A Group-wide risk inventory was carried out in
2012. The results of this inventory were updated in the year
under review. This exercise did not identify any risks, either
individually or in combination, that could represent a threat to
the continued existence of the business as a going concern. If
the company identifi es risks that, if they were to materialise,
could impact the achievement of corporate objectives,
suitable corrective action is taken.
64 Financial Report
Group Management Report
Outlook, Opportunities and Risk Report

The rational risk early detection system allows senior man-
agement to identify material risk at an early stage, instigate
corrective action and monitor implementation of this action.
The risk management system is regularly updated by the in-
ternal audit department. In addition, the risk early detection
system is audited by the independent auditors to ensure that
the system is capable of identifying at an early stage any
developments that could constitute a threat to the continued
existence of the company as a going concern.
The main insurable risks to which the company is exposed
are covered by a global insurance strategy drawn up in
concert with external insurance brokers. The associated
Group insurance policies transfer the risk to the insurer. An
insurance deductible may still apply in each case depend-
ing on the provisions agreed. Changing risk situations for
the Group are examined regularly and insurance cover is
adjusted accordingly.
The rational Compliance team was set up in 2013, and
a Compliance Manager appointed for the entire rational
Group. The Compliance Manager was awarded “Compliance
Offi cer (tüv)” certifi cation aft er successfully completing a
tüv Rhineland examination. A compliance risk analysis was
also carried out. All material compliance risks are address
via internal measures or in cooperation with qualifi ed local
partners. The rational rules of conduct in business were
defi ned in more detail and duly implemented.
Risks
Human resources risk
Skilled and motivated employees and managers are the
cornerstone of the company’s success and future prospects,
and it is, therefore, extremely important that we are able
both to attract new, highly qualifi ed personnel and to retain
existing high achievers over the long term. The damage
resulting from low employee commitment and signifi cant
employee turnover would adversely aff ect business
performance in the long term, so the impact of this risk
is considered to be high.
We implement a number of suitable measures to strengthen
employee recruitment and retention, including challenging
tasks, appropriate remuneration, targeted human resources
development and promotion schemes and opportunities for
the employees to share directly in the company’s profi ts. We
therefore consider the chance of this risk arising to be fairly
low.
Product quality
The quality of the company’s products has continued to
improve over recent years. The launch of the new product
generations during 2011 constituted an important step in this
process, as evidenced by our consistently low warranty cost
ratio of 1.3% (2012: 1.3%) and the customer satisfaction rat-
ings returned by our regular customer surveys. We, nonethe-
less, remain fully aware of the potential risks associated with
quality problems in the products we supply to our customers.
Possible consequences of inferior quality include damage to
property and injury to persons and in particular damage to
rationalʼs reputation as a prestigious manufacturer of high-
quality products. Possible damage to property and injury to
persons are covered by insurance. High importance is attached
to any risk resulting from damage to image.
To mitigate this risk, we subject all equipment to testing
before it leaves our factory. In addition to comprehensive
tests on every single item of equipment, a random sample of
equipment also undergoes additional detailed inspections.
This enables us to ensure the absolute reliability of our
products and also to identify any possible sources of defects
at an early stage. If complaints are, nevertheless, received
from customers – or from internal sources – the problems
are analysed and immediate solutions sought as part of our
urgent quality improvement system within daily technical
processes. Damage to property or injury to persons occurring
on the customer's premises are adequately covered with the
existing product liability insurance. We take extreme steps to
avoid potential damage to our image, overcompensating for
any defect and resulting damage. We, therefore, consider the
probability of this risk occurring to be low.
Acceptance of our technologies
To maintain and further extend our lead over competitors, we
regularly launch new products onto the market, with further
developed product features and new functions. Moreover,
the VarioCookingCenter multificiency® is still at a very early
phase of market development. This gives rise to the risk of
our products not achieving the level of acceptance that we
expect and not being accepted by the market. In view of our
corporate structure with around 300 chefs working in sales
and application research, development and consulting, we
are practically part of our customers' world and are very
familiar with their needs and wishes. We are therefore in a
position to develop and off er the best possible solutions for
our customers. We rate the possible damage arising from a
lack of acceptance to be high, but the probability of such a
risk occurring is low.
Financial Report
Group Management Report
Outlook, Opportunities and Risk Report
65rational Annual Report 2013

it risk
Risks can arise in particular as a result of the ever-increasing
integration of IT systems. Networks can go down, data can
be corrupted or destroyed by operating or program errors or
as a result of external factors and system failures can cause
work to be delayed. Not having suffi cient security systems,
which prevent unauthorised access from outside parties,
might lead to the loss of critical information. The resulting
damage is deemed high.
We counter information technology risks by investing
continuously in hardware and soft ware, by encrypting e-mail
and data transfers, by using virus scanners, fi rewall systems,
admission and access controls, and by housing our systems
in a specially protected data centre. Many of our systems in-
clude backup facilities to ensure that individual failures can
be compensated quickly. We therefore consider the resulting
risk to be low.
Procurement risk
Our procurement strategy includes working in partnership with
key component and subassembly suppliers. Focusing on key
suppliers in this way enables us to improve our products and
their quality continuously and is also the most eff ective way
to protect our technological lead. It does produce a certain
degree of co-dependency, which means that the complete
loss of a supplier could lead to short-term interruptions in
production. Nonetheless, we are well aware of this risk and
the possible high level of damage, and therefore, we keep a
particularly sharp eye on business developments at our sup-
pliers and on the production processes of relevance to our own
operations. In addition, we resolved to implement various
risk reduction measures as a result of the supply chain risk
analysis conducted during the year under review. These in-
clude subjecting our key suppliers to regular risk assessments
and setting up a system for auditing upstream suppliers. We
therefore consider the probability of the risk associated with
this strategy to be low.
Risk from competition and other sector risks
There is a risk that new competitors could emerge as a result
of mergers. Besides that, there is a risk that a competitor may
be able to catch up in terms of technology or develop a new
superior technology and launch it onto the market. We rate
the damage resulting from such a risk to be moderate to high.
We monitor developments and trends in the sector and the
market strategy of our competitors constantly and factor
them into our corporate planning. We therefore consider the
probability of such a risk occurring to be low.
Economic risk
The international economic environment in which the com-
pany operates is susceptible to cyclical risk. The purchase
of rational appliances represents a signifi cant investment
for our customers and is thus subject to a capital investment
decision-making process. Based on our experience in the
past, we give a high rating to the risk of periods of economic
slowdown, which would adversely aff ect investment deci-
sions by our customers.
We monitor economic developments in our principal
markets very carefully to ensure that emerging risks are
identifi ed at an early stage and that any corrective measures
required are implemented promptly. Thanks to our flexible
cost planning and our large liquidity reserve, which gives
us adequate room to manoeuvre and the flexibility and
independence to take all necessary business decisions, we
are well prepared for currently conceivable macroeconomic
scenarios. Our focus on a basic human need and the sig-
nifi cant rationalisation eff ects from our products mean that
economic fluctuations and crises have considerably less
impact on our business than in the traditional engineering
sector, for example. We therefore consider the potential
damage that may result in this context to be moderate.
Political crises and natural disasters
The impact of political instability and natural disasters
can put product sales in the aff ected countries at risk. The
potential consequences of political instability could include
import restrictions in individual countries for example, We
give a high rating to the probability of at least temporary
import restrictions being imposed due to such a situation.
The international nature of rational’s operations and the
fact that we sell our products in all the world’s main markets
give us the opportunity to compensate for regional diffi cul-
ties through our activities in other markets. We consider the
consequences resulting from this risk to be moderate.
66 Financial Report
Group Management Report
Outlook, Opportunities and Risk Report

Financial and capital market risk
Risks arising from changes in interest and foreign currency
rates have been identifi ed as relevant fi nancial and capital
market risks for rational ag. In terms of probability and
possible damage, risks arising from changes in interest rates
are considered to be low, given the minor signifi cance of the
fi nancial consequence of such changes.
Short-term fluctuations in currency rates may aff ect the
sales and earnings performance, and in turn impact the
achievement of corporate objectives. The proportion of
total sales generated in foreign currencies was 36% in 2013
(2012: 35%). The majority of expenses are incurred in euros,
with increases in the value of the euro in relation to other
currencies depressing earnings and reductions enhancing
earnings. In recent years, exchange rate fluctuations have
increased in volatility and intensity. We give a high rating to
the probability of this risk negatively aff ecting our business
performance and the outlook for sales and earnings.
If the euro appreciates by 10% compared to the foreign
currencies of relevance to us, the Group-wide growth in sales
would reduce by around 4 percentage points and the growth
in ebit by around 10 percentage points.
To mitigate this risk, standard currency-hedging instruments
are applied, such as options or forwards. To this end, we
only work with partners holding fi rst-class ratings. The
nature and scope of the company’s hedging operations
are prescribed by internal guidelines. They are arranged at
the head offi ce by the parent company. In addition, some
procured components are denominated in Japanese yen and
us dollars (natural hedge). Our currency risk management
activities cannot fully insulate us against the impact of a
medium-term or long-term increase in the value of the euro,
but they can reduce such an impact.
Market risk and default risk
Bad debt risks on trade receivables can arise as a result of
customers not fulfi lling their payment obligations. Given
the high number of customers in the various regions of the
world, the probability of such risks occurring is high.
We protect receivables against the risk of default by means
of trade credit insurance or bank letters of credit in order to
avoid or reduce such risks. On the balance sheet date, 80%
(2012: 86%) of receivables were protected by such arrange-
ments – taking into account the deductibles that apply in the
event of a claim – and the risk of signifi cant losses as a result
of defaults on receivables has thus been largely eliminated.
The resultant level of damage is low.
Market risk relates to the loss of sales potential as the result
of the failure of a customer. We generate our sales with
several thousand individual customers, most of them operat-
ing in the catering and food service sector, so the failure of
particular customers poses no special threat to our prospects
for constant future sales growth. Because our sales and
marketing process is focused in particular on end users, the
failure of a trade customer does not automatically entail a
fall in demand from end users. In the year under review, the
proportion of total sales accounted for by the individual cus-
tomer generating the greatest sales was 2.5% (2012: 2.9%).
This customer is a long-standing, exclusive trade partner. Our
credit insurer has awarded this partner an impeccable credit
rating and we consequently see no reason to fear any inter-
ruption to our future business with this customer on grounds
of fi nancial instability. Receivables from this customer were
fully covered by credit insurance during the reporting period.
We consider the probability of the risk occurring and level of
the possible damage to be low.
Commodity prices
Manufacturing companies like ours are sensitive to changes in
commodity prices because of the way they cause our material
and production costs to fluctuate. The prices of high-grade
stainless steel and the alloy surcharge, which depends signifi -
cantly on the price of nickel, have a direct impact on the cost of
sales of our products. We therefore monitor the commodities
markets closely. We are able to reduce the price risk in respect
of high-grade stainless steel by means of corresponding con-
tracts with suppliers, but it is not possible to do this with the
alloy surcharge. Changes in the alloy surcharge consequently
have a direct eff ect, positive or negative, on our cost of sales;
however, the proportion of the total cost of sales accounted
for by variable commodity costs is minor, and therefore we
consider the resulting impact on earnings to be limited.
Financial Report
Group Management Report
Outlook, Opportunities and Risk Report
67rational Annual Report 2013

Infringement of intellectual property rights
We have been the clear leader in our field in terms of
products and technology for many years. Innovations are
protected by a variety of intellectual property rights including
patents and patent applications. Whenever an infringement
of an active patent is suspected, appropriate action is initi-
ated and this may go as far as taking the third party to court.
Patent proceedings alleging possible patent infringements
on our part are investigated by experienced patent attorneys
and defended vigorously. Currently, there are no proceedings
against us based on alleged infringement of intellectual prop-
erty rights. We consider the probability of such risks occurring
as well as the possible damage arising therefrom to be low.
Legal risk
We currently sell our products and services in more than
100 countries in all regions around the globe. Numerous
risks are entailed in the increasingly international nature
of business activities. These include in particular:
› Country-specifi c product requirements or safety regulations
aff ecting the sales of our products
› Customs provisions or import/export regulations that may
place restrictions on product imports
› Diff erent tax systems, tax obstacles aff ecting business
transactions or changing tax systems or tax rates with a
negative impact on the earnings situation
› Compliance risks, in other words the possible infringement
of local legislation by employees
To minimise such risks, we work – where necessary – with
experts in the respective local legal requirements in all mar-
kets that are of importance to us. We consider the probability
of these risks occurring and the resultant impact to be low.
Buildings and plant
We have established our on-site security system at the three
plants in Landsberg to help protect our buildings, plant
and machinery. With 24-hour security provided by our own
personnel and a central security control room on site, we
are able to guarantee a high level of security. We consider
the probability of a signifi cant claim to be low. We give a low
rating to the possible level of damage arising therefrom.
Internal control and risk management system
in relation to the accounting process
The main features of the internal control and risk management
system in relation to the (Group) accounting process can be
summarised as follows:
› The accounting processes in place at the parent company
and its subsidiaries are clearly structured in relation to
areas of responsibility and management.
› Standardised accounting practice is assured across the
Group through constantly updated guidelines that are
applied Group-wide.
› The functions of the main units (Finance, Accounting and
Controlling) involved in the accounting process are clearly
demarcated in respect of the preparation of the closing
fi nancial statements, and responsibilities are unambigu-
ously assigned.
› The actual bookkeeping process is handled centrally in
Landsberg where possible, provided this is permitted under
applicable national law. This ensures a high level of quality
throughout the Group in relation to the recording and
processing of data relevant to accounting.
› Standard soft ware is employed wherever possible for the
fi nancial systems used in the Accounting unit. Appropriate
security and authorisation concepts are deployed to protect
these systems against unauthorised access.
› The units involved in the accounting process are properly
equipped to meet requirements. The staff involved have
the necessary skills and qualifi cations and receive further
training on a continuous basis. The units involved in the ac-
counting process throughout the Group closely coordinate
their activities in regular meetings.
› Accounting-related data is subject to regular random sample
checks to ensure the data is complete and accurate.
› All key processes relevant to accounting are subject to
the universal principle that transactions must be double-
checked by a second person.
› The annual fi nancial statements of all companies are
audited by an auditor or reviewed by the Group auditor in
order to ensure that accounting practice is consistent and
complies with the law.
68 Financial Report
Group Management Report
Outlook, Opportunities and Risk Report

› All of the Group processes relevant to accounting are
regularly checked by the Internal Audit function as part of
the audit process for subsidiaries. The processes involved
at the Landsberg site are also regularly checked.
The internal control and risk management system, the main
features of which are described above, ensures that the
accounting process is effi cient. The controls in place largely
eliminate errors and make certain any errors that do occur
are detected and corrected. This ensures that accounting
practice at the company complies with the applicable
statutory regulations. The control and checking mechanisms
described above also create a structure through which busi-
ness transactions can be recorded, reported and evaluated
consistently and appropriately throughout the Group, which
enables us to make reliable and relevant information avail-
able as necessary.
Corporate Social Responsibility as a Fundamental
Principle
The topic of sustainability has played an increasingly impor-
tant role in society over the last few years. Sustainable and
future-proof development means giving equal consideration
to environmental, social and economic aspects. The aim is to
ensure that our children and grandchildren will continue to
enjoy an intact ecological, social and economic structure.
Sustainable business as a competitive advantage
Sustainable business has now become a key competi-
tive driver for companies. On the one hand, using fewer
resources translates directly into lower costs, which in turn
has a positive impact on the earnings situation. On the
other, customers and suppliers are increasingly looking for
contractual partners who adopt a responsible approach
with any resources they use. Resource-saving processes and
products, satisfi ed employees, a positive public image, loyal
suppliers and highly satisfi ed customers are therefore not
simply ends in themselves. They are in fact important drivers
for the successful development and long-term sustainability
of companies, based on responsible corporate manage-
ment. The focus rests primarily on ensuring ethical and fair
conduct, in addition to legal aspects (compliance with laws
and regulations).
Sustainable business and a responsible role in society have
been core components of our business and production
processes since rational was formed 40 years ago. This
means responsible corporate management, promoting the
respectful use of resources and conserving our environment.
Moreover, as a company, we assume responsibility for our
employees, make a positive contribution to the development
of society and work together with our customers and suppli-
ers in a spirit of long-term partnership and respect.
Corporate governance
We believe that good corporate governance means managing
the company responsibly and controlling business operations
effi ciently. This means ensuring that legal provisions are com-
plied with, conduct is inherently in keeping with the highest
ethical standards and communication is open and transpar-
ent with all interested parties. Corporate governance also
includes an eff ective system for controlling compliance with
rules, so that any risks arising therefrom can be minimised.
Compliance with legal provisions is explicitly set out for
all employees in our rules of conduct in business. Non-
compliance with laws will result in disciplinary action as well
as the possibility of criminal prosecution. The Compliance
Offi cer, who reports directly to the Executive Board, advises
the Executive Board on all matters relating to the compliance
system and is responsible for ensuring that it is effi ciently
implemented. He is also the contact point for all employees
if they have any queries about legal provisions. In the year un-
der review, we have also appointed two confi dential contact
persons to whom employees can turn if they see potential
instances of misconduct on the part of colleagues.
69rational Annual Report 2013 Financial Report
Group Management Report
Corporate Social Responsibility as a Fundamental Principle

Fairness in dealings with colleagues, customers, suppliers and
all other persons underpins our corporate culture and is set out
in writing in the company’s guiding principles. Workshops are
regularly held to convey these guiding principles to all employ-
ees, to ensure that employees are familiar with them.
A further key component of corporate governance is commu-
nicating openly, transparently and honestly with interested
parties, whether they are employees, suppliers, customers,
shareholders, local policy-makers or the general public. By
keeping in regular contact and mutually exchanging informa-
tion, ideas, wishes and areas of interest, we are able not
only to detect trends at an early stage and respond to them,
but also to minimise risks and ensure a positive image of
rational in the eyes of the general public.
Corporate governance at rational also involves managing
potential risks with the necessary care. To this end, we have
an appropriate risk management system which is further
developed on an ongoing basis. The risk management system
helps us to identify risks at an early stage and take the
necessary counter-measures. The risk report sets out the key
features of our risk management system and describes our
accounting-related internal control system.
Active environmental protection
Maximum resource effi ciency of our products
We attach particular importance to treating the environment
in a responsible manner and conserving as many resources
as possible. Resource effi ciency is becoming an increasingly
important factor in our customers’ investment decisions and
was therefore one of our key criteria in the development of
the new product generation. This philosophy is reflected in
our product names: whiteffi ciency® and multificiency®.
Our approach is to extract the maximum benefi t from every
resource used, thereby minimising the negative impact on
the environment. It starts right from product development,
with the use of recoverable components, and continues
through to environmentally certifi ed production and a system
of sales logistics which particularly targets the conservation
of resources, right through to the recovery of old appliances.
In particular, resource effi ciency applies to the day-to-day
use of our appliances in the kitchen. And it is precisely here
that our technology achieves the biggest savings. By sustain-
ably reducing the consumption of raw materials, energy,
water and cleaning chemicals, we help our customers to
save money while protecting the environment. This applies
in comparison to both traditional cooking technology and
conventional combi-steamers.
Certifi ed environmental management system
We are a company operating at an international level which
focuses on sustainability. One of our objectives is to ensure
that we incorporate environmental considerations into all
our business decisions. We maintain an environmental
management system certifi ed in accordance with iso 14001.
A committee comprising members from quality management,
product development and building and fleet management
defi nes, edits and approves the Group’s environmental ob-
jectives and monitors compliance with them. Objectives that
form part of the environmental management system include
reducing the consumption of resources and the occurrence
of waste, increasing employee awareness of environmental
issues, optimising the environment-related performance
of all business partners and ensuring the quality of waste
water. In terms of resource consumption, we set ourselves
annual targets for cutting our use of electricity, fuel, gas and
water. In 2013, we again managed to achieve most of these
targets to reduce our resource consumption in proportion to
our production volume.
Innovative energy and building systems
In recent years we have invested extensively in buildings
and plant in Landsberg. In addition to the construction of
new buildings we are also paying particular attention to high
resource effi ciency through the use of the latest building
technology and energy-effi cient building materials and
methods. For example, by using special building architecture
featuring large glass façades and self-adjusting brightness
sensors, we have managed to minimise the use of artifi cial
light. By employing triple-insulated glass panels, heat
pumps, heat recovery systems and night air cooling systems,
we have minimised the use of heating energy and energy
consumption for air-conditioning.
co2 emissions are consistently falling
By using energy-effi ciency building technology and produc-
tion systems we have managed to hold co2 emissions to
a relatively low level. Our own vehicle fleet also features
vehicles using the latest technology, thereby cutting fuel
consumption and air emissions thanks to need-based route
scheduling. Freight and logistics are handled by partner or-
ganisations holding iso 14001 certifi cations. We make best
eff orts to use methods of shipment with the lowest possible
emissions, including optimum utilisation of shipping capac-
ity and goods flow pooling. These measures have enabled us
to cut co2 emissions per unit sold by around 7% a year over
the past three years.
70 Financial Report
Group Management Report
Corporate Social Responsibility as a Fundamental Principle

Waste water virtually eliminated from production processes
Almost no waste water is generated by our production pro-
cesses. Any water that is polluted is cleaned and removed
by our own treatment plant, which is regularly tested by an
independent institute. Regular tests are conducted to check
the quality of waste water and to ensure that it is completely
harmless. In our components factory we invested in an ultra-
modern welding system in the past year. This new technology
does away with the electrochemical process previously
required to clean and polish welding seams, which used to
require considerable quantities of water. This emphasises
our approach of preferring to avoid waste and pollution in
the fi rst place, for environmental as well as fi nancial rea-
sons, rather than having to deal with it retrospectively.
Professional recycling
All processes are continuously optimised to ensure that
the volume of waste is kept as low as possible and, for any
waste that is produced, to ensure that as much of this waste
as possible is transferred to recycling systems or used as
a source of energy. In addition, the production processes
generate low volumes of hazardous material. This is removed
by a specialist waste disposal operator in accordance with
the requirements of iso 14001. An audit is carried out each
year to verify that the company is continuing to comply with
this standard.
Accolade for sustainability and resource effi ciency
In February 2014 we were awarded the Axia Award 2013 by
consultants Deloitte and Munich’s Ludwig Maximilian Uni-
versity. The Axia Award is a nationwide German competition
which each year recognises outstanding mid-sized com-
panies for their exemplary performance. The best practices
developed in these companies are shared with other com-
panies and act as a benchmark for them. Taking as its theme
“Nachhaltig denken – erfolgreich lenken” (Think sustainably
– guide successfully), Deloitte was looking for mid-sized com-
panies that were able to safeguard fi nance, brand image and
the company for themselves for the long term. The competitors
had to demonstrate that their performance in at least one of
the three categories is outstanding.
Since 2011, we have also been a member of “Umweltpakt
Bayern”, a voluntary environmental collaboration between
policymakers and business in the German state of Bavaria.
The overarching objective of the participating businesses is
to improve environmental, economic and social foundations
for current and future generations in Bavaria. The priority
is a forward-looking approach focusing on avoiding future
environmental damage.
Employees
U.i.U.® (Entrepreneur in the Company) stands for success
Satisfi ed employees help to create satisfi ed customers,
and thereby, secure the long-term success of the business.
Without highly qualifi ed and motivated employees, the
company would not have been successful in the past, nor
would it be successful in the future.
A key factor in increasing the motivation and autonomy of
our employees has been the principle of the “Entrepreneur in
the Company” (U.i.U.®). The U.i.U.® entrepreneurs operate
as independent business people within their own area of re-
sponsibility. They control and fulfi l their tasks, continue to
enhance working methods, make the necessary decisions
and take independent responsibility for them. They learn
from their mistakes in order to avoid them in future. They
are on a par with colleagues and superiors, and put forward
their own opinions. We hold regular U.i.U.® workshops to
train all our employees worldwide and receive feedback
on the quality of the way in which the U.i.U.® philosophy
is implemented in our subsidiaries and on the conduct of
managers.
We encourage the professional development all employees
in accordance with their strengths, delegate a great deal of
responsibility and promote self-determination and co-deter-
mination. The result is a high degree of staff retention and
satisfaction. According to a survey in 2013, 91% (2012: 93%)
of all employees are proud to work for rational, a result that
reflects the strong feeling of loyalty among our workforce. In
2013, 51 employees were honoured for their long service to
the company. Staff turnover is just 3% in Germany and 8%
worldwide (2012: 5% and 10% respectively).
In the past fi scal year we were awarded the “Open Company”
and “Top Company” seals by the employer evaluation portal
kununu.com, which is active in German-speaking countries.
“Open Company” is the seal of quality for proactive interaction
with kununu.com. This means that the business invites its em-
ployees to rate it on kununu, comments on ratings on kununu
and provides insight into its day-to-day work in the form of a
kununu company profi le. “Top Company” is the seal of quality
for employers rated as good on kununu.com. For this, the
company must have at least six ratings, which in total give an
average evaluation points score of at least three. rational
scores 3.89 out of a possible 5.00 points (as at early February
2014). Our employees were particularly positive about the
good cross-hierarchy cohesion among colleagues, the willing-
ness by employees to take responsibility for demanding and
diverse tasks, and the transparent communication.
Financial Report
Group Management Report
Corporate Social Responsibility as a Fundamental Principle
71rational Annual Report 2013

Skilled young talent safeguards the company’s future
If rational is to remain successful in future, it is vital to
target recruitment policies at young and talented people. To
fi nd the right young talent, we work closely with universities
in the region and develop joint strategies for a combina-
tion of theoretical learning and practical experience. For
students our program includes not only internships and work
placements, but also support with dissertations. Regional
education fairs, such as the one held in Landsberg last Sep-
tember, are also important events for getting young people
interested in vocational training at rational. At these fairs,
we showcase our company to senior-grade school students
as a training company for a range of apprenticeships.
Securing the future through training and young
talent development
In the context of the long-term development of the skills
and qualifi cations of all employees, we put great emphasis
on training within the company itself. Vocational training
is a cornerstone and a key contributing factor in ensuring
that the business is fi t for the future. Besides traditional
vocational training, dual courses of study are also becoming
increasingly important. At year end, we had 50 employees
training as industrial business managers, industrial techni-
cians, mechatronics engineers and it specialists. In addi-
tion, 13 students were on dual courses of study, combining
studies with practical experience in mechatronics, engineer-
ing, business informatics, international business and hotel
and catering management.
In addition, we off er young talent programmes for qualifi ed
university graduates in all areas of the company, aimed at
preparing young people for the management responsibilities of
the future. These employees are deployed in various targeted
processes and assume specifi c responsibility at an early stage,
enabling them to build up a broad base of expertise, identify
their strengths, and develop their character in a purposeful
manner. During this process, they receive close support from
the Executive Board and their line managers. As at 31 De-
cember 2013, this development scheme had 30 participants
employed in the various business units around the world.
In December 2013, the rational young talent programme
was rated as "particularly fair and conducive to career devel-
opment" by absolventa, a job fair for young graduates.
Singled out for mention were the early assumption of
responsibility by our young professionals at the various stages
in the programme and the support aff orded by experienced
managers, as well as the long-term focus on occupying a
management or specialist post in due course.
Employees exhibiting high potential are individually pro-
moted and developed as part of our structured succession
planning process. As a result, they are equipped to assume
key positions and management tasks at rational in the
future. In 2013 we were able to fi ll around 70% of manage-
ment vacancies with employees drawn from our own ranks.
The total number of employees in the Group rose in 2013
from 1,263 to 1,341 (as of 31 December 2013). Of these, 765
(2012: 749) were employed in Germany.
By selectively expanding capacities in our global sales and
marketing organisations (+54 employees) and in our research
and development (+12 employees) in the past fi scal year we
particularly improved our business's chances for the future.
20092004 20062005 2007 2008 20122010 2011 2013
Number of employees
Status: December 31
754
1,0081,117
1,224
9931,092
808901
1,2631,341
Transparent communication helps motivate employees
We hand our employees responsibility for as many self-con-
tained tasks as possible along the value-added chain. As a
result, they have a very good overview of the results of their
work and of their contribution to the success of the busi-
ness. In our quarterly entrepreneur forum we also update all
employees worldwide about the development of the business
in the various regions of the world, about particular events in
the business and about actions planned. All employees can
fi nd out more about the topics of the moment by visiting our
intranet portal or via rational tv.
This transparent information policy aims to provide
employees with an overall picture and to foster employee
satisfaction. This boosts the motivation and loyalty to the
business of each and every one of them, and ultimately
raises the quality of the work performed as a precondition
for maximum customer benefi t.
72 Financial Report
Group Management Report
Corporate Social Responsibility as a Fundamental Principle
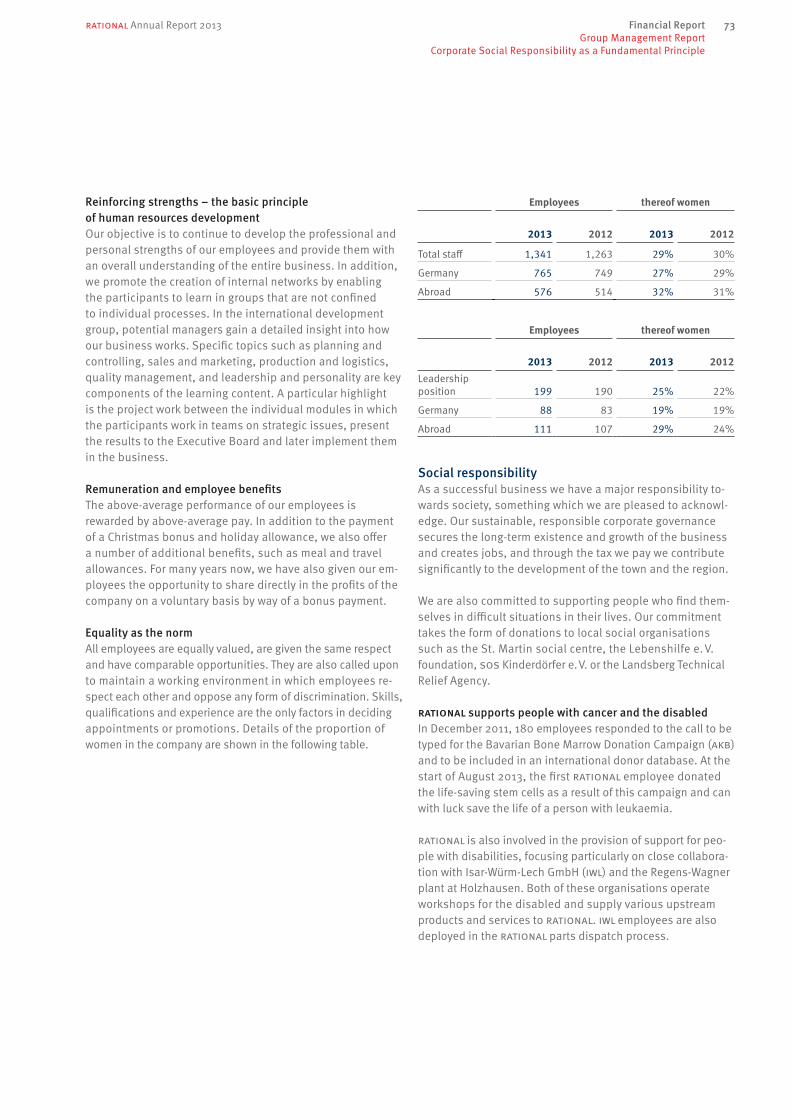
Reinforcing strengths – the basic principle
of human resources development
Our objective is to continue to develop the professional and
personal strengths of our employees and provide them with
an overall understanding of the entire business. In addition,
we promote the creation of internal networks by enabling
the participants to learn in groups that are not confi ned
to individual processes. In the international development
group, potential managers gain a detailed insight into how
our business works. Specifi c topics such as planning and
controlling, sales and marketing, production and logistics,
quality management, and leadership and personality are key
components of the learning content. A particular highlight
is the project work between the individual modules in which
the participants work in teams on strategic issues, present
the results to the Executive Board and later implement them
in the business.
Remuneration and employee benefi ts
The above-average performance of our employees is
rewarded by above-average pay. In addition to the payment
of a Christmas bonus and holiday allowance, we also off er
a number of additional benefi ts, such as meal and travel
allowances. For many years now, we have also given our em-
ployees the opportunity to share directly in the profi ts of the
company on a voluntary basis by way of a bonus payment.
Equality as the norm
All employees are equally valued, are given the same respect
and have comparable opportunities. They are also called upon
to maintain a working environment in which employees re-
spect each other and oppose any form of discrimination. Skills,
qualifi cations and experience are the only factors in deciding
appointments or promotions. Details of the proportion of
women in the company are shown in the following table.
Employees thereof women
2013 2012 2013 2012
Total staff 1,341 1,263 29% 30%
Germany 765 749 27% 29%
Abroad 576 514 32% 31%
Employees thereof women
2013 2012 2013 2012
Leadership
position 199 190 25% 22%
Germany 88 83 19% 19%
Abroad 111 107 29% 24%
Social responsibility
As a successful business we have a major responsibility to-
wards society, something which we are pleased to acknowl-
edge. Our sustainable, responsible corporate governance
secures the long-term existence and growth of the business
and creates jobs, and through the tax we pay we contribute
signifi cantly to the development of the town and the region.
We are also committed to supporting people who fi nd them-
selves in diffi cult situations in their lives. Our commitment
takes the form of donations to local social organisations
such as the St. Martin social centre, the Lebenshilfe e. V.
foundation, sos Kinderdörfer e. V. or the Landsberg Technical
Relief Agency.
rational supports people with cancer and the disabled
In December 2011, 180 employees responded to the call to be
typed for the Bavarian Bone Marrow Donation Campaign (akb)
and to be included in an international donor database. At the
start of August 2013, the fi rst rational employee donated
the life-saving stem cells as a result of this campaign and can
with luck save the life of a person with leukaemia.
rational is also involved in the provision of support for peo-
ple with disabilities, focusing particularly on close collabora-
tion with Isar-Würm-Lech GmbH (iwl) and the Regens-Wagner
plant at Holzhausen. Both of these organisations operate
workshops for the disabled and supply various upstream
products and services to rational. iwl employees are also
deployed in the rational parts dispatch process.
Financial Report
Group Management Report
Corporate Social Responsibility as a Fundamental Principle
73rational Annual Report 2013

rational is a member of the Club “Deutsches Netzwerk
Schulverpflegung e. V.” (German Network for School Catering)
Healthy, high-quality food is essential for physical and men-
tal wellbeing. The demand for healthy food exists in all types
of outside catering.
The success of the catering provided to schools depends
heavily on whether healthy and tasty meals suitable for
children can be off ered at an aff ordable price. The key to
this lies in the use of a multifunctional device such as the
SelfCookingCenter® whiteffi ciency®.
The dnsv’s objective is to improve the quality of school
meals. In close collaboration between practice and theory,
it sets itself the task of bringing together all stakeholders
(school boards, teachers, authorities, caterers, parents and
politicians) under one roof, in order to gear itself to the pre-
sent and future needs of school meals in Germany. rational
also makes its contribution, as a partner from industry and
as a member of the dnsv. In nationwide campaigns, our
chefs draw on their expertise and many years of experience
to advise and support the people who run school kitchens.
Only through a shared commitment will it be possible to
make all stakeholders even more aware of the importance of
healthy food in schools and to ensure that the practice lives
up to the theory.
rational supports young peopleʼs education
Thanks to fi nancial support from rational ag, 25 school
students from the Augsburg Region were awarded scholar-
ships for the studienkompass development programme.
studienkompass supports and assists young people from
non-academic backgrounds, to give them the opportunity to
complete their studies. The development programme thus
helps to improve educational opportunities for young people
and makes a major contribution to ensuring the supply of
skilled labour in Germany.
Cultural engagement
For many years rational has promoted cultural activities in
the Landsberg region. To mark the company’s 40th anniver-
sary, rational arranged a symphony concert in Plant 3 in July
2013. Entry was free to the around 1,300 visitors, as a mark
of our links to Landsberg and the entire region.
In addition, we provide our art-loving employees who are
members of art@rational with premises and material. For
many years the love of art has created a bond between diff er-
ent parts of the company. In the evening, aft er work is over,
they can develop their creative side together in a relaxed
atmosphere.
Long-term customer relationships
When it comes to customer relationships, sustainability
means for us long-term cooperation based on partnership.
Our philosophy lays down maximum customer benefi t as the
overriding corporate objective. Because only if we succeed
in permanently off ering our customers maximum benefi t – in
other words develop the ideal solutions to their problems –
can we bind them to our business in the long term. Maximum
customer benefi t is therefore the crucial driver for our lasting
success.
Besides market-leading products at a reasonable price and
exemplary service, it is important that we interact with our
customers appropriately. One of the fundamental claims
for interaction with customers is that every contact with
rational should be a positive experience for our customers.
The fact that we are succeeding ever better in off ering our
customers maximum benefi t is shown by the tns Infratest
customer satisfaction with 83% enthusiastic customers.
Cooperation in partnership with suppliers
For us as a company with little vertical integration, the
quality, productivity and reliability of our suppliers are par-
ticularly crucial to the success of our business. We off er our
suppliers a long-term, reliable and trusting partnership and,
in return, expect loyalty, quality, commitment, flexibility and
innovative strength. Instead of putting our suppliers under
permanent pressure to off er lower prices, we apply the ex-
tended workbench model and work in cooperation with our
suppliers on joint re-engineering projects to achieve quality,
productivity or cost-cutting targets which benefi t both sides.
74 Financial Report
Group Management Report
Corporate Social Responsibility as a Fundamental Principle

In addition to supplier certifi cation, successful cooperation
is underpinned by annual partner plans, monthly reporting
for the principal key fi gures and regular audits. The rational
supplier system separately assesses product quality and the
quality of cooperation. The best suppliers are presented with
special awards at the annual supplier day.
Remuneration Report
Section 315 (2) no. 4 of the German Commercial Code (hgb) re-
quires public companies listed on a stock exchange to disclose
information on the main features of their remuneration system.
Executive Board remuneration at rational ag is the respon-
sibility of the Supervisory Board, which sets the remunera-
tion payable to Executive Board members on the basis of the
company’s size and the global nature of its operations, its
economic and fi nancial situation and the level and structure
of Executive Board remuneration at comparable companies.
The Executive Board remuneration system was approved by
the General Meeting of Shareholders on 21 April 2010.
The Board remuneration generally comprises fi xed and
variable components.
The total compensation paid to the Executive Board for the
performance of its duties within the parent company and
its subsidiaries in fi scal 2013 was 7.2 million euros (2012:
4.3 million euros). This amount included performance-
related pay components of 2.4 million euros (2012: 1.9 mil-
lion euros) and expenses for restructuring the Executive
Board amounting to 1.7 million euros. Payments totalling
0.5 million euros were also made into the pension scheme
for Executive Board members (2010: 0.3 million euros).
No stock options were issued in 2013. The General Meeting
of Shareholders held on 11 May 2011 decided not to publish
an individual breakdown of Executive Board remuneration.
The total remuneration paid to the Supervisory Board for
2013 amounted to 0.6 million (2012: 0.6 million euros).
Information relating to Takeovers
Pursuant to section 315 (4) hgb (German Commercial Code)
companies must provide and clarify information relating to
takeovers.
Details of the composition of the share capital pursuant to
drs 20 are given in the Notes under note 21: “Equity”.
As of 31 December 2013 the company founder and Supervi-
sory Board chairman held 7,161,411 shares in rational ag. He
therefore exceeds the threshold of 10% of the voting rights.
By resolution of the General Meeting of Shareholders on
8 May 2013, section 8 of the articles of association of
rational ag was amended. The wording of the resolution
is as follows: “For as long as Mr Siegfried Meister and Mr
Walter Kurtz are shareholders of the company they shall have
the joint right to appoint a member of the Supervisory Board.
If one of the two holders of the right to appoint ceases to be
a shareholder of the company, the remaining shareholder
shall have the sole right to appoint. The right to appoint is
to be exercised by submitting a written declaration to the
Executive Board of the company.”
In the past fi scal year, the right to appoint a member of the
Supervisory Board was not exercised.
In accordance with both statutory regulations and the com-
pany’s Articles of Association, all employees of rational ag
may directly exercise the rights of control they possess as
shareholders in the same way as other shareholders.
Section 84 of the German Stock Corporation Act (AktG) stipu-
lates that the Supervisory Board is responsible for the ap-
pointment and removal of members of the Executive Board.
In relation to these powers, section 6 (2) of the articles of
association of rational ag states in more detail that the
Supervisory Board appoints the members of the Executive
Board, determines their number and allocates their duties.
The Executive Board manages the company and represents
it vis-à-vis third parties.
According to section 11 (2) of the articles of association
of rational ag, the Supervisory Board is entitled to make
amendments and additions to the Articles of Association
provided these are to the wording only. All other amend-
ments to the Articles of Association are to be made by
resolution of the General Meeting of Shareholders passed
with a simple majority of the votes unless a greater majority
is required by law. Sections 179 et seq. of the AktG apply
accordingly. The Supervisory Board made no amendments
to the Articles of Association in 2013.
75rational Annual Report 2013 Financial Report
Group Management Report
Remuneration Report
Information relating to Takeovers

The company does not hold any treasury shares. The com-
pany does not currently have authorisation from the General
Meeting of Shareholders to repurchase own shares or to
issue new shares.
rational ag has not entered into any material agreements
that are subject to the condition of a change of control fol-
lowing a takeover bid.
No agreements have been entered into with members of the
Executive Board or other employees of the company that
provide for any particular compensation or additional remu-
neration in the event of a change of control, that is to say the
assumption of the majority of voting rights in the company
by either an individual shareholder or by shareholders acting
jointly.
Declaration of Corporate Governance
A Declaration of Corporate Governance pursuant to Section
289a of the German Commercial Code (hgb) is published un-
der Corporate Governance in the Investor Relations section
of the rational website.
Landsberg am Lech, 20 February 2014
rational ag
The Executive Board
Dr Peter Stadelmann Erich Baumgärtner
Chief Executive Offi cer Chief Financial Offi cer
Peter Wiedemann Markus Paschmann
Chief Technical Offi cer Chief Sales Offi cer
76 Financial Report
Group Management Report
Declaration of Corporate Governance

Consolidated Financial Statements
Contents
78 Statement of Comprehensive Income
79 Balance Sheet
80 Cash Flow Statement
81 Statement of Changes in Equity
82 Notes
116 Responsibility Statement
117 Auditor’s Report
Financial Report
77rational Annual Report 2013

keur Note 2013 2012
Sales 1 461,148 434,981
Cost of sales 2 –180,446 –173,263
Gross profi t 280,702 261,718
Sales and service expenses 3 –111,190 –105,793
Research and development expenses 4 –16,696 –13,562
General administration expenses 5 –21,255 –18,815
Other operating income 6 6,308 5,878
Other operating expenses 7 –9,615 –6,710
Earnings before interest and taxes (ebit) 128,254 122,716
Interest and similar income 8 503 816
Interest and similar expenses 8 –1,104 –1,107
Earnings from ordinary activities (ebt) 127,653 122,425
Income taxes 9 –30,409 –29,140
Net income 97,244 93,285
Items that may be reclassifi ed to profi t and loss in the future:
Diff erences from currency translation 21 –975 –272
Items that will not be reclassifi ed to profi t and loss:
Actuarial gains and losses from defi ned benefi t obligations 21, 22 –7 0
Other comprehensive income –982 –272
Total comprehensive income 96,262 93,013
Average number of shares (undiluted/diluted) 11,370,000 11,370,000
Earnings per share (undiluted/diluted) in euros
relating to the net income and the number of shares 10 8.55 8.20
Statement of Comprehensive Income
rational Group
for the period 1 January – 31 December
78 Financial Report
Statement of Comprehensive Income

kEUR Note 31 Dec 2013 31 Dec 2012
Non-current assets 66,893 61,319 Intangible assets 12, 13 1,671 1,532 Property, plant and equipment 14 59,201 54,629 Financial assets 15 0 0 Other non-current assets 18 1,120 355 Deferred tax assets 9 4,901 4,803
Current assets 310,402 264,873 Inventories 16 27,169 26,364 Trade receivables 17 75,863 65,941 Other current assets 18 7,249 6,148 Deposits with maturities of more than 3 months 19 96,000 80,000 Cash and cash equivalents 20 104,121 86,420
Balance sheet total 377,295 326,192
kEUR Note 31 Dec 2013 31 Dec 2012
Equity 268,846 237,393Subscribed capital 21 11,370 11,370Capital reserves 21 28,058 28,058Retained earnings 21 231,994 199,559Other components of equity 21 –2,576 –1,594
Non-current liabilities 34,882 25,453Provisions for pensions 22 780 795Other non-current provisions 24 2,963 2,187Non-current liabilities to banks 25 31,139 22,471
Current liabilities 73,567 63,346Current income tax liabilities 23 11,097 7,772Current provisions 24 26,766 23,680Current liabilities to banks 25 3,236 2,817Trade accounts payables 26 11,995 10,468Other current liabilities 27 20,473 18,609
Liabilities 108,449 88,799
Balance sheet total 377,295 326,192
Assets
Equity and Liabilities
Balance Sheet RATIONAL Group
Financial ReportBalance Sheet
79RATIONAL Annual Report 2013

keur 2013 2012
Earnings from ordinary activities 127,653 122,425
Depreciation on fi xed assets 7,239 6,762
Net results from asset retirements –14 –3
Non-realised foreign currency result –38 –48
Change in derivative fi nancial instruments –27 –559
Interest income and income from fi nancial assets –503 –816
Interest expenses 1,104 1,107
Operating results before changes in working capital 135,414 128,868
Changes in
Inventories –805 –1,625
Trade accounts receivables and other assets –12,109 5,287
Provisions 3,739 4,023
Trade accounts payables and other liabilities 3,426 –1,655
Cash generated from current business activities 129,665 134,898
Income taxes paid –26,835 –23,454
Cash flow from operating activities 102,830 111,444
Investments in intangible and tangible assets –12,039 –9,367
Income from asset retirements 47 100
Purchase of fi xed deposits with maturities of more than 3 months –96,000 –80,000
Decrease in fi xed deposits with maturities of more than 3 months 80,000 50,400
Interest received 470 871
Cash flow from investing activities –27,522 –37,996
Dividends paid –64,809 –62,535
Proceeds of non-current liabilities to banks 1) 12,120 8,196
Repayment of liabilities to banks –3,033 –1,904
Interest paid –996 –947
Cash flow from fi nancing activities –56,718 –57,190
Net changes in cash and cash equivalents 18,590 16,258
Changes in cash from exchange rate fluctuations –889 –206
Changes in cash funds 17,701 16,052
Cash and cash equivalents on 1 Jan 86,420 70,368
Cash and cash equivalents on 31 Dec 1) 104,121 86,4201) Thereof pledged cash funds for specifi c purposes 10,500 2,700
Cash Flow Statement
rational Group
for the period 1 January – 31 December
80 Financial Report
Cash Flow Statement

keur
Subscribed
capital
Capital
reserves
Retained
earnings
Other
components
of equity Total
Balance on 1 Jan 2012 11,370 28,058 168,809 –1,322 206,915
Dividend – – –62,535 – –62,535
Total comprehensive income – – 93,285 –272 93,013
Balance on 31 Dec 2012 11,370 28,058 199,559 –1,594 237,393
Dividend – – –64,809 – –64,809
Total comprehensive income – – 97,244 –982 96,262
Balance on 31 Dec 2013 11,370 28,058 231,994 –2,576 268,846
Statement of Changes in Equity
rational Group
Financial Report
Statement of Changes in Equity
81rational Annual Report 2013

Fundamentals
Description and explanation of business activities
rational Aktiengesellschaft (abbreviated to rational ag in
the following text) is an Aktiengesellschaft (stock corpora-
tion) under German law with its registered offi ces at Iglinger
Strasse 62, Landsberg am Lech, Germany, entered in the
Augsburg Commercial Register under number hrb 2001.
The rational Group (referred to as “ rational” or “Group”
in the following text) is a worldwide market and tech nology
leader in the fi eld of the thermal preparation of food in
professional kitchens. Since its formation in 1973, the com-
pany’s sole activities have been the development, production
and sale of professional cooking appliances for industrial
kitchens. rational sells its products worldwide through
its own subsidiaries and through independent distribution
partners.
The shares of the company, which has been listed on the
Frankfurt Stock Exchange since March 2000, have been
admitted to the Prime Standard and are traded on the
Regulated Market in the mdax segment.
Presentation of fi nancial statements
The functional currency and the currency used in the consoli-
dated fi nancial statements is the euro. For the sake of clarity,
fi gures are shown in thousands of euros (keur). The struc-
ture of the balance sheet complies with the ias 1 guidance
regarding classifi cation and format. The presentation for the
fi scal year ending 31 December 2013 and for the previous
year is broken down by maturities of “12 months or less”
(current) and those of “more than 12 months” (non-current).
The consolidated fi nancial statements are prepared on the
basis of historical cost with the exception of derivative fi nan-
cial instruments, which are measured at fair value.
Based on the information also used by management for its
operating and strategic decisions, the disclosures in the
notes to the consolidated fi nancial statements are intended
to allow a comprehensive assessment of the company’s net
assets, fi nancial position and profi t or loss, as well as to
facilitate a full evaluation of the opportunities open to the
company and the risks to which it is exposed. For rational,
the key components of its consolidated fi nancial statements
are the statement of comprehensive income, the balance
sheet, the statement of cash flows, and the statement of
changes in equity. The specifi c notes relate to the respec-
tive captions of these fi nancial statements. Information
on accounting and consolidation methods can be found
under “Fundamental accounting principles”, “Consolidation
methods” and “Accounting and valuation methods”. The
signifi cance of fi nancial instruments is explained under
“Notes on fi nancial instruments”. Disclosures not relating
to specifi c items in the fi nancial statements can be found in
“Other Notes on the Group Financial Statements”.
The consolidated fi nancial statements were approved by the
Executive Board of rational ag on 20 February 2014. The
publication date is 20 March 2014.
Fundamental accounting principles
The consolidated fi nancial statements for fi scal year 2013
(including prior year fi gures) have been prepared in compli-
ance with the International Financial Reporting Standards
(ifrs) promulgated and published by the International
Accounting Standards Board (iasb), as adopted in the eu,
and in accordance with the supplementary rules applicable
under section 315a (1) of the German Commercial Code
(hgb).
All the eff ective and mandatory standards for fi scal year 2013
have been taken into account, with the result that a true and
fair view of the Group’s net assets, fi nancial position, and
profi t or loss has been reported.
The following new or revised standards were applied on
a mandatory basis for the fi rst time in fi scal year 2013;
rational had not applied it voluntarily in previous years.
Eff ective date
Amendment ias 1 “Presentation of Financial
Statements: Presentation of Items
of Other Comprehensive Income” 1 July 2012
Amendment ias 19 “Employee Benefi ts” 1 January 2013
Amendment ifrs 1 “First-time Adoption of
ifrs: Severe Hyperinflation and
Removal of Fixed Dates of First-
Time Adopters” 1 January 2013
Amendment ifrs 1 “First-time Adoption of ifrs:
Government Loans” 1 January 2013
Amendment ias 12 “Deferred Tax: Recovery of
Underlying Assets” 1 January 2013
Amendment ifrs 7 “Financial Instruments:
Disclosures – Off setting Financial
Assets and Financial Liabilities” 1 January 2013
Amendment Annual Improvements to ifrs
2009 – 2011 1 January 2013
New ifrs 13 “Fair Value Measurement” 1 January 2013
New ifric 20 “Stripping Costs in the
Production Phase of a Surface
Mine” 1 January 2013
Notes
82 Financial Report
Notes
Fundamentals
› Implementation of ias 1 “Presentation of Financial State-
ments: Presentation of Items of Other Comprehensive
Income” requires other comprehensive income to be
broken down into items to be reclassifi ed to profi t or
loss in subsequent periods and items to remain in other
comprehensive income.
› The amendments associated with the new version of
ias 19 “Employee Benefi ts” aff ect rational in respect of
how actuarial gains and losses are recognised in other
comprehensive income. These must now be recognised
immediately in other comprehensive income. The previous
right to choose whether to recognise them in profi t and
loss or in other comprehensive income or to defer them
using the corridor method has been abolished. rational
used to recognise actuarial gains and losses immediately
in admini stration and selling expenses in the income state-
ment. The amended standard provides for retrospective ap-
plication. Since the sums to be adjusted are insignifi cant,
rational is only applying the amendment prospectively.
› The amendments to ifrs 1 “First-time Adoption of Interna-
tional Financial Reporting Standards: Severe Hyperinflation
and Removal of Fixed Dates of First-time Adopters”
introduce an exemption for entities preparing fi nancial
statements according to ifrs for the fi rst time following a
period of severe hyperinflation. They also remove the fi xed
dates in ifrs 1 relating to the derecognition rules of ias 39
and the initial fair value measurement of certain fi nancial
assets and liabilities. These changes have no eff ect on
rational’s consolidated fi nancial statements.
› The amendment of ifrs 1 “First-time Adoption of Inter-
national Financial Reporting Standards: Government
Loans” relates to fi rst-time ifrs adopters and defi nes the
recognition of a government loan with a below-market
rate of interest. This change has no eff ect on rational’s
consolidated fi nancial statements.
› The amendment to ias 12 “Deferred Taxes: Recovery of
Underlying Assets” introduces an exemption rule for
properties held as fi nancial investments and measured at
fair value. In future, the deferred tax assets and liabilities
relating to such investment properties will no longer be
determined according to the intended use. Instead, the tax
consequences of the sale of the property must be used as
the measurement basis, unless the presumption of sale is
rebutted. This change has no eff ect on rational’s consoli-
dated fi nancial statements.
› The amendment to ifrs 7 “Financial Instruments:
Disclosures – Off setting Financial Assets and Financial
Liabilities” requires more extensive disclosures relating to
the off setting of fi nancial assets and fi nancial liabilities. As
a result of this amendment, there are new notes on off set-
ting, as explained under “Notes on fi nancial instruments”.
› Various amendments were made to a number of ifrs as
part of the “Annual Improvements 2009 – 2011”, but have
resulted in no material changes to the guidance given in
the standards. Changes were made to ifrs 1 “First-time
Adoption of International Financial Reporting Standards”,
ias 1 “Presentation of Financial Statements”, ias 16
“Property, Plant and Equipment”, ias 32 “Financial Instru-
ments: Presentation” as well as ias 34 “Interim Financial
Reporting”. These changes have no material eff ect on the
consolidated fi nancial statements.
› With the entry into force of ifrs 13 “Fair Value Measure-
ment”, the rules governing fair value measurement and
the corresponding disclosures are summarised in a single
standard. This standard aff ects rational in particular
when determining the fair value of fi nancial instruments
and in the expanded notes. When determining the fair
value, the credit risk of the contracting party is now
additionally taken into account for fi nancial assets, as
is the own credit risk for fi nancial liabilities. To this end,
rational uses the value of the respective contracting
party's credit default swap or the fair-value market interest
curve for companies with a comparable rating for own
credit risk.
› ifric 20 “Stripping Costs in the Production Phase of a
Surface Mine” considers the accounting treatment of
waste removal costs incurred in surface mining operations,
namely whether these should be recognised as inventories
or as non-current assets. This interpretation has no eff ect
on rational’s consolidated fi nancial statements.
Financial Report
Notes
Fundamentals
83rational Annual Report 2013

The following new or revised standards and interpretations
did not yet apply on a mandatory basis in fi scal year 2013
and have not been applied early:
Eff ective date in
accordance to
Standard
Amendment ias 32 “Financial Instruments:
Presentation: Off setting Financial
Assets and Financial Liabilities” 1 January 2014
Amendment ias 36 “Impairment of Assets –
Recoverable Amount of Disclo-
sures for Non-Financial-Assets” 1 January 2014
Amendment ias 39 “Financial Instruments:
Recognition and Measurement
– Novation of Derivatives and Con-
tinuation of Hedge Accounting” 1 January 2014
Amendment ias 27 “Separate Financial
Statements” 1 January 2014
Amendment ias 28 “Investments in Associates
and Joint Ventures” 1 January 2014
New ifrs 10 “Consolidated Financial
Statements” 1 January 2014
New ifrs 11 “Joint Arrangements” 1 January 2014
New ifrs 12 “Disclosures of Interests in
other Entities” 1 January 2014
Amendment ifrs 10 “Consolidated Financial
Statements”, ifrs 11 “Joint Ar-
rangements”, ifrs 12 “Disclosures
of Interests in other Entities”:
Transition Guidance 1 January 2014
Amendment ifrs 10 “Consolidated Financial
Statements”, ifrs 12 “Disclosures
of Interests in other Entities”,
ias 27 “Separate Financial State-
ments”: Investment Entities 1 January 2014
› The amendments to ias 32 “Financial Instruments: Presen-
tation: Off setting Financial Assets and Financial Liabilities”
clarify aspects on the application of the ias 32 off setting
model. These amendments are not expected to have
any material eff ect on rational’s consolidated fi nancial
statements.
› The amendment to ias 36 “Impairment of Assets – Re-
coverable Amount Disclosures for Non-Financial Assets”
restricts the disclosures to the recoverable amount of
assets and cash-generating units, for which an impairment
loss was recorded or reversed in the period. This change
will have no material eff ect on rational’s consolidated
fi nancial statements.
› The amendment to ias 39 “Financial Instruments:
Recognition and Measurement – Novation of Derivatives
and Continuation of Hedge Accounting” is prepared in re-
sponse to the more stringent regulation of the derivatives
markets and the obligation to novate derivatives to central
clearing houses. Under certain conditions, hedge account-
ing can be continued even if the hedging instrument was
transferred to a central counterparty. This change will have
no material eff ect on rational’s consolidated fi nancial
statements.
In issuing the following amendments and standards, the
iasb has published a comprehensive package aimed at
improving consolidated fi nancial reporting.
› Following the amendments made to ias 27 “Separate
Financial Statements”, this standard will in future contain
only the rules that are applicable to separate fi nancial
statements. The consolidation guidelines are now con-
tained in ifrs 10 “Consolidated Financial Statements”.
Accordingly, the name of the standard has been changed
from “Consolidated and Separate Financial Statements” to
“Separate Financial Statements”. These changes are not
expected to have a material eff ect on rational’s consoli-
dated fi nancial statements.
› With the amendment of ias 28 “Investments in Associates
and Joint Ventures”, the scope of application of ias 28 has
been extended to include joint ventures, and the title of
the standard adjusted accordingly. There are also changes
resulting from the introduction of ifrs 10 “Consolidated
Financial Statements”, ifrs 11 “Joint Arrangements” and
ifrs 12 “Disclosure of Interest in other Entities”. Joint
ventures will in future be accounted for in accordance with
the equity method now that ifrs 11 has eliminated the
use of proportionate consolidation. These changes are
not expected to have an eff ect on rational’s consolidated
fi nancial statements.
› The new ifrs 10 “Consolidated Financial Statements”
replaces the consolidation guidance previously contained
in ias 27 “Consolidated and Separate Financial State-
ments” and sic-12 “Consolidation – Special Purpose
Entities”. ifrs 10 sets out a standard consolidation model
for all corporate groups in which a parent entity controls
one or more subsidiaries. The standard also contains
guidance on assessing whether a control relationship
exists. This new standard will have no material eff ect on
rational’s consolidated fi nancial statements.
84 Financial Report
Notes
Fundamentals

› ifrs 11 “Joint arrangements” replaces ias 31 “Interests in
Joint Ventures” and SIC-13 “Jointly Controlled Entities – Non-
Monetary Contributions by Venturers”. The new standard
classifi es joint arrangements as “joint operations” or “joint
ventures”, depending on the rights and duties of the parties
involved. In addition, the use of proportionate consolida-
tion has been eliminated with the introduction of ifrs 11.
This standard is expected to have no eff ect on rational’s
consolidated fi nancial statements.
› ifrs 12 “Disclosure of Interest in Other Entities” contains
all disclosures about an entity’s interests in subsidiar-
ies, joint arrangements, associates and unconsolidated
special-purpose entities. This standard is not expected
to have any material eff ect on rational’s consolidated
fi nancial statements.
› The amendment to the transition guidance of ifrs 10
“Consolidated Financial Statements”, ifrs 11 “Joint Ar-
rangements” and ifrs 12 “Disclosure of Interests in Other
Entities” provides a clarifi cation of the transition guidance
set out in ifrs 10 and also contains further exemptions
with respect to the transition to ifrs 10, ifrs 11 and ifrs 12.
This change will have no material eff ect on rational’s
consolidated fi nancial statements.
› The amendments relating to investment entities in ifrs 10
“Consolidated Financial Statements”, ifrs 12 “Disclosure
of Interests in Other Entities” and ias 27 “Separate Finan-
cial Statements” provide for investment entities as defi ned
in ifrs 10 “Consolidated Financial Statements” to measure
their investments in subsidiaries at fair value through
profi t or loss and not to include them as fully consolidated
companies. New disclosures are also required as a result of
the amendments. These changes have no material eff ect on
rational’s consolidated fi nancial statements.
The following amended or new standards have been
published by the iasb but not yet adopted by the eu, and
therefore not applied to the consolidated fi nancial state-
ments. rational will apply these standards group-wide
interpretations and amendments once they have been
adopted as mandatory by the European Union. They are not
expected to have any material eff ect on rational’s future
consolidated fi nancial statements.
Eff ective date in
accordance to
Standard
New ifrc 21 “Levies” 1 January 2014
Amendment ias 19 “Employee Benefi ts –
Defi ned Benefi t Plans: Employee
Contribution” 1 July 2014
New Annual Improvements to ifrs
2010 – 2012 1 July 2014
New Annual Improvements to ifrs
2011 – 2013 1 July 2014
Amendment ifrs 7 and ifrs 9 “Financial
Instruments: Mandatory Eff ec-
tive Date of ifrs 9 and Transition
Disclosure” 1 January 2015
New ifrs 9 “Financial Instruments” 1 January 2015
The fi scal year for rational ag and all subsidiaries included
in the consolidated fi nancial statements corresponds to the
calendar year. The balance sheet date of the consolidated
fi nancial statements is the balance sheet date of the parent
company in accordance with ias 27.
Consolidation methods
In addition to rational ag as a parent company, all material
domestic and foreign subsidiaries under the direct or indirect
control of rational ag have been included in the consoli-
dated fi nancial statements of rational. Control is defi ned
as the ability to govern the fi nancial and operating policy of
an entity in order to obtain a corresponding benefi t. This is
generally the case if rational ag directly or indirectly holds
more than half of the voting power of an entity.
Initial capital consolidation is performed using the purchase
method in accordance with ifrs 3. The acquisition cost of
the equity investment is off set against the revalued pro rata
equity of the acquired company at the time of acquisition.
The assets, liabilities and contingent liabilities are recog-
nised at fair value at the time of acquisition, irrespective
of the extent of any non-controlling interests. Acquisition-
related costs are recognised as expenses.
Any remaining positive diff erences are capitalised as
goodwill, which must be tested for impairment annually and
more frequently if changes in circumstances indicate a pos-
sible impairment. Any resulting impairment is recognised in
the income statement.
Financial Report
Notes
Fundamentals
85rational Annual Report 2013

Non-consolidated subsidiaries are recognised at the lower
of cost or fair value.
The eff ects of intercompany transactions are eliminated.
Balances between consolidated companies are eliminated,
intercompany profi ts on inventories are eliminated, and
intercompany expenses are deducted from the corresponding
income. Deferred taxes are recognised for temporary diff er-
ences arising from consolidation measures in accordance
with ias 12.
The consolidation methods remain unchanged from those
used last year.
Consolidated companies
As of the balance sheet date, seven domestic (2012: seven)
and 21 foreign subsidiaries (2012: 20) in addition to the
parent company were included in the consolidated fi nancial
statements in compliance with ias 27 requirements. In 2013,
a sales company was established in India. It was entered in
the commercial register and its registered capital amounting
to 17,500 thousand inr (approx. 252 thousand euros) was
paid in March 2013. As of 31 December 2013 the consoli-
dated companies were as follows:
Name and registered offi ce of
rational ag subsidiaries
% capital shares/
% voting rights
Germany
LechMetall GmbH
Landsberg am
Lech Germany 100.0
rational
Komponenten GmbH
Landsberg am
Lech Germany 100.0
rational Technical
Services GmbH
Landsberg am
Lech Germany 100.0
rational Dienstleis-
tungsgesellschaft mbH
Landsberg am
Lech Germany 100.0
rational Montage GmbH
Landsberg am
Lech Germany 100.0
rational Großküchen-
technik GmbH
Landsberg am
Lech Germany 100.0
frima
Deutschland GmbH Frankfurt am Main Germany 100.0
Europe
rational uk Ltd. Luton
United
Kingdom 100.0
frima uk Ltd. London
United
Kingdom 100.0
rational France s.a.s. Wittenheim France 100.0
frima – t s.a.s. Wittenheim France 100.0
frima France s.a.s. Wittenheim France 100.0
Name and registered offi ce of
rational ag subsidiaries
% capital shares/
% voting rights
rational Italia s.r.l. Mestre Italy 100.0
rational Ibérica
Cooking Systems, s.l. Barcelona Spain 100.0
rational
Austria GmbH Salzburg Austria 100.0
rational
International ag Balgach Switzerland 100.0
rational Schweiz ag Balgach Switzerland 100.0
frima International ag Balgach Switzerland 100.0
rational
Polen Sp. z o.o. Warsaw Poland 100.0
rational
Scandinavia ab Malmö Sweden 100.0
rational rus ooo Moscow Russia 100.0
Americas
rational Cooking
Systems, Inc. Schaumburg usa 100.0
rational Canada Inc. Mississauga Canada 100.0
rational Mexico
s.a. de c.v. Mexico City Mexico 100.0
rational Brasil
Comércio E Distribuição
De Sistemas
De Cocção Ltda. São Paulo Brazil 99.9
Asia
rational
Japan Co., Ltd. Tokyo Japan 100.0
rational Trading
(Shanghai) Co., Ltd. Shanghai China 100.0
rational International
India Private Ltd. Delhi Indien 100.0
topinox s.a.r.l., Nantes, France, an ope rati onally inac-
tive subsidiary of frima – t s.a.s., is not included in the
consolidation. This is of minor importance in providing a true
and fair view of the Group’s net assets, fi nancial position
and profi t or loss. As in the previous year, the investment is
reported with a carrying amount of 0 thousand euros. This
corresponds to the fair value.
The domestic subsidiaries LechMetall GmbH, rational
Großküchentechnik GmbH, rational Technical Services
GmbH, rational Dienstleistungsgesellschaft mbH, rational
Montage GmbH and rational Komponenten GmbH are exer-
cising the option provided in section 264 (3) of the German
Commercial Code (hgb) not to prepare notes and not to
disclose their annual fi nancial statements for fi scal year 2013.
In addition, rational Großküchentechnik GmbH and rational
Komponenten GmbH are electing not to prepare a manage-
ment report in accordance with section 264 (3) of the hgb.
86 Financial Report
Notes
Fundamentals

Foreign currency translation
In the separate fi nancial statements of the subsidiaries,
foreign currency transactions are translated into the
functional currency at the exchange rate prevailing at the
time of the transaction. Profi ts and losses resulting from the
settlement of such transactions and from the translation
at the spot rate of monetary foreign currency assets and
liabilities are recognised in the income statement.
For the consolidated fi nancial statements, the fi nancial state-
ments of the foreign subsidiaries are translated into euros in
accordance with the concept of functional currency. The local
currency in each country is the functional currency for the enti-
ties based in the country concerned. rational International ag
and frima International ag, both of which have registered
offi ces in Switzerland, are exceptions to this rule and use the
euro as their functional currency. Assets and liabilities are
translated at the spot rate as of the balance sheet date and
the items in the income statement at the annual average rate.
The portions of equity to be included in the capital consolida-
tion and the accumulated profi t or loss brought forward are
translated at historical rates. Arising diff erences from this
translation are recognised under “Diff erences from currency
translation” in the statement of comprehensive income.
The following table shows the exchange rates in relation
to the euro used in the consolidated fi nancial statements,
as well as year-on-year changes:
Annual average exchange rate Exchange rate on 31 Dec
1 euro = 2013 2012
Change
in % 2013 2012
Change
in %
usd = us Dollar 1.3301 1.2927 3 1.3768 1.3186 4
jpy = Japanese yen 130.13 103.50 26 144.50 113.65 27
gbp = Pound sterling 0.8503 0.8115 5 0.8328 0.8158 2
chf = Swiss franc 1.2290 1.2042 2 1.2269 1.2073 2
cad = Canadian dollar 1.3767 1.2898 7 1.4636 1.3118 12
sek = Swedish krona 8.6691 8.6825 0 8.8263 8.5800 3
pln = Polish zloty 4.2120 4.1722 1 4.1502 4.0930 1
cny = Chinese yuan 8.1691 8.1462 0 8.3342 8.2150 1
rub = Russian rouble 42.594 40.075 6 45.252 40.249 12
brl = Brazilian real 2.8921 2.5323 14 3.2518 2.6997 20
mxn = Mexican peso 17.124 – – 18.027 – –
inr = Indian rupee 79.694 – – 85.100 – –
Accounting and valuation methods
Intangible assets and property, plant and equipment
Purchased intangible assets are recognised at cost and
amortised over three to fi ve years using the straight-line
method.
Goodwill arising from capital consolidation and other com-
pany acquisitions is tested at least annually for impairment
in compliance with ias 36. If the fair value less disposal
costs or the value in use is below the carrying amount of the
cash-generating unit or the group of cash-generating units,
an impairment loss is recognised in the income statement.
Property, plant and equipment is measured at cost less
depreciation. Production costs include all directly attribut-
able costs and appropriate portions of production-related
overheads. Depreciation is calculated on the basis of the
useful lives of the assets. Administration and production
buildings are depreciated over a period of between 25 and
36 years, while items of technical equipment and machinery
as well as operating and offi ce equipment are depreciated
over their useful lives, which range between 2 and 15 years.
The straight-line method is normally used. Depreciation is
charged pro rata in the year the asset is purchased.
Financial Report
Notes
Fundamentals
87rational Annual Report 2013

As of each balance sheet date, the Group has to assess
whether there are any indications that the carrying amount
of an intangible asset or item of property, plant and equip-
ment may be impaired. If impairment is identifi ed in excess
of depreciation, the asset is written down to its recoverable
amount. The recoverable amount is either the fair value less
disposal costs or the value in use of an asset, whichever is
higher.
Leasing
According to ias 17, leasing transactions are classifi ed as
operating leases if the lessor retains substantially all the
risks and rewards incidental to the ownership of the leased
item. The lease payments are recognised as expense in the
income statement over the lease term.
Inventories
Inventories are measured either at cost or at the net realis-
able value, whichever is lower. The net realisable value
represents the estimated selling price in the ordinary course
of business less the estimated costs of completion and the
estimated costs necessary to make the sale.
Raw materials, consumables, supplies and merchandise
are measured at cost using the moving weighted average
cost method. Price reductions such as volume and cash
discounts are taken into account when measuring cost. The
cost of inventories comprises all costs of purchase and other
costs incurred in bringing the inventories to their present
location and condition.
Work in process and fi nished goods are measured at produc-
tion costs. The production costs include all costs directly
attributable to the production process, as well as appropri-
ate portions of production-related overheads.
Financial assets
Depending on the individual case, fi nancial assets as
defi ned by ias 39 are classifi ed as fi nancial assets reported
at fair value through profi t and loss, as loans and receiva-
bles, as investments held to maturity, or as available-for-
sale fi nancial assets.
Financial assets, with the exception of derivative fi nancial
instruments, are recognised at fair value on the settlement
date, taking into account any transaction costs directly
attributable to the acquisition. The settlement date is the
date on which an asset is delivered to or by the company.
Financial assets measured at fair value through profi t and
loss relate to derivative fi nancial instruments classifi ed
as fi nancial assets held for trading. If fi nancial assets are
held to maturity, they are carried at amortised cost aft er
their initial recognition, using the eff ective interest method,
and allowance is made for impairment as appropriate.
Subsequent to initial recognition, loans and receivables
are measured at amortised cost, using the eff ective inter-
est method, less allowance for impairment. There are no
available-for-sale fi nancial assets on the balance sheet.
rational makes no use of the fair value option.
Allowances must be recognised for receivables that are to
be classifi ed as doubtful on the basis of objective criteria,
especially if the receivable has been transferred to an
external debt collection agency following sustained, unsuc-
cessful dunning activities, if insolvency proceedings have
been applied for or are ongoing, or if the receivable is being
disputed in court, and there are no indications that would
justify an alternative assessment. Any allowances that are
required are generally held in an allowance account.
A fi nancial asset is retired if the contractual right to pay-
ments from the fi nancial asset has lapsed or if the fi nancial
asset has been transferred and rational has for the most
part relinquished all risks and rewards associated with its
ownership. A receivable is also retired if it is irrecoverable.
The gains and losses arising from the retirement of fi nancial
assets are recognised in the income statement for the
period.
88 Financial Report
Notes
Fundamentals

Derivative fi nancial instruments
Derivative contracts are classifi ed as “held for trading” and
are recognised at fair value because it does not fully meet the
ias 39 requirements for hedge accounting (despite the close
alignment of the hedge with the underlying transaction).
On the day of trading, derivative fi nancial instruments are
recognised at the purchase or sale price and reported under
other assets or other liabilities in the balance sheet. Changes
in fair value between reporting dates are recognised under
other operating income or expenses in the income statement.
The recognition of derivatives at fair value is based on the zero
impact on credit-rating measurement supplied by the relevant
counterparty bank for the measurement date in question. The
banks measure fair value on the basis of market data available
as of the measurement date using recognised mathematical
methods (discounted cash flow method for forwards and
swaps, the Black-Scholes method for options).
The measurement with zero impact on credit-rating (accord-
ing to the discounted cash flow method) of forward exchange
contracts and swaps is calculated using the spot rate as
of the balance sheet date, taking account of the forward
premiums or discounts that apply for the remaining terms of
the individual contracts compared with the forward exchange
rate at the time each contract was entered into.
With currency transactions, the measurement with zero
impact on credit-rating corresponds to the price received
for the sale of an asset or the price paid for the transfer
of a liability in an orderly transaction between market
participants on the measurement date (using the modifi ed
Black-Scholes formula under the Garman-Kohlhagen model).
Any off setting eff ects from underlying transactions are
disregarded when determining the measurement with zero
impact on credit-rating.
As of fi scal year 2013, in accordance with ifrs 13 on measur-
ing the fair value of derivative fi nancial instruments, it is
necessary to take into account the risk of non-performance
(cva = credit value adjustment and dva = debit value adjust-
ment) in addition to the above measurement, which is based
on zero impact on credit-rating.
The debit value adjustment arising from an obligation for
rational to provide a payment from derivative fi nancial
instruments is determined on the basis of an interest curve
corresponding to the average value of corporate bonds with
a comparable credit-rating, aft er deducting the money market
rate. The credit value adjustment for derivative fi nancial in-
struments for which the contracting party is obliged to provide
a payment is determined taking into account the respective
contracting party's credit default swap applicable at the end
of the year.
Cash and cash equivalents
Cash and cash equivalents include cash in hand, cash in
banks, as well as short-term deposits with maturities of up
to three months calculated from the time of acquisition; they
are measured at nominal value. Cash in foreign currency is
translated at the spot rate as of the balance sheet date.
Current tax assets and tax liabilities
Current tax assets and tax liabilities for the current as
well as prior periods are measured at the amount of the
expected refund from or payment to the tax authorities. The
amount is calculated on the basis of the tax rates and tax
legislation enacted at the balance sheet date.
Deferred tax assets
Deferred tax assets are recognised in accordance with ias 12,
using the liability method for temporary diff erences between
the value of an asset or liability as shown on the balance
sheet and the tax base. Deferred tax assets and liabilities
are calculated at the tax rates expected to be eff ective in the
period in which the asset is realised or liability settled. The
tax rates used to calculate deferred taxes for the subsidiaries
are between 9% and 40% (2012: 10% and 40%). The tax
rate used to calculate deferred taxes for rational ag is 28%
(2012: 27%).
Deferred tax assets and deferred tax liabilities are reported
on a net basis if there is a corresponding enforceable legal
right to off set them and if the deferred tax assets and deferred
tax liabilities relate to taxes on income that are levied by the
same taxation authority for either the same taxable entity or
diff erent taxable entities intending to perform settlement on
a net basis.
The carrying amount of deferred tax assets is reviewed at
each balance sheet date and reduced by the amount by
which it is no longer probable that suffi cient taxable income
will be available against which at least part of the deferred
tax asset can be used.
Financial Report
Notes
Fundamentals
89rational Annual Report 2013

Provisions
The measurement of defi ned benefi t provisions for pensions
is based on the projected unit credit method stipulated in
ias 19. The actuarial gains and losses are directly recognised
in other comprehensive income The interest paid is imme-
diately recognised in the income statement under “Interest
and similar expenses”. The full amount of the defi ned
benefi t obligation is recognised in the balance sheet.
Other provisions are recognised if there is an obligation to
a third party as a result of a past event, it is probable that
the obligation will have to be settled in the future, and the
amount required to settle the obligation can be reliably esti-
mated. The carrying amount of provisions is reviewed at each
balance sheet date. If the eff ect of discounting is material,
the provision is discounted.
Financial liabilities
Depending on the individual circumstances, fi nancial liabilities
as defi ned by ias 39 are classifi ed either as fi nancial liabilities
measured at fair value through profi t and loss or as fi nancial
liabilities measured at amortised cost.
Financial liabilities measured at fair value through profi t and
loss relate to derivative fi nancial instruments classifi ed as
fi nancial liabilities held for trading.
Trade accounts payable and other liabilities are recognised
at amortised cost, using the eff ective interest method.
rational makes no use of the fair value option.
A fi nancial liability is retired if the corresponding obligation
has been paid or rescinded, or has lapsed. The gains and
losses arising from the retirement of fi nancial liabilities are
recognised in the income statement for the period.
Government grants
Government grants to cover expenses are accounted for
at fair value through profi t and loss if there is reasonable
assurance that rational will comply with any conditions
attached to the grant and the grant will be received.
Recognition of income and expense
On completion of delivery, i. e. on transfer of ownership and
risk to the customer, revenues are recognised if it is suffi ciently
likely that economic benefi ts will accrue to the consolidated
group from such service and the amount of the revenues can
be reliably determined. The revenues include the consideration
received or receivable at fair value, and are reported excluding
value-added tax, returns, rebates and discounts. Operating
expenses are recognised in the income statement when the
service is utilised or on the date the expenses are incurred.
Provisions for warranties are recognised on an individual basis
or when the corresponding revenue is recognised. Interest
income and expenses are recognised in the period in which
they accrue or are incurred. Research and development costs
are expensed as incurred. Finance costs are expensed in the
period in which they are incurred, unless they can be directly
allocated to the acquisition, construction or manufacture of a
qualifying asset.
Use of estimates and assumptions
In preparing the consolidated fi nancial statements, company
management must make certain estimates and assumptions,
particularly for intangible assets including goodwill and
for property, plant and equipment, deferred tax assets
and provisions. These estimates and assumptions may
influence the amounts reported for assets, liabilities and
fi nancial obligations as of the balance sheet date, as well as
income and expenses for the year under review. The carrying
amounts of the items in question are disclosed individually
in the relevant notes.
For intangible assets and property, plant and equipment,
the assumptions and estimates made by management relate
in particular to the expected useful life, whether there are
indications of impairment, and the estimated recoverable
amount of an impaired asset. Management is confi dent that
the assumptions and estimates made are appropriate. Any
changes to the specifi ed assumptions and estimates would
change the company’s net assets, fi nancial position and
profi t or loss.
When goodwill is tested annually for impairment, assump-
tions must be made about future earnings performance and
the resulting cash flow to be expected in the underlying
cash-generating unit or group of cash-generating units in
90 Financial Report
Notes
Fundamentals

order to determine the recoverable amount. The actual cash
flows can diff er signifi cantly from the cash flows based on
these estimates. This could lead to a change in the sales
and cash flow forecast, which would influence the com-
pany’s net assets, fi nancial position and profi t or loss.
When testing for asset impairment, the assumptions and
estimates also relate to the future sale price and volume,
as well as the costs and discount rates. Although manage-
ment is confi dent that the assumptions and estimates are
appropriate, a change in the assumptions or circumstances
could result in an additional requirement to recognise
impairment losses or to reverse such losses.
To calculate deferred tax assets, management must assess
the tax benefi ts arising from the available tax strategies and
future taxable income. The reported amount of deferred tax
could decline if the estimates of planned taxable income and
the achievable tax benefi ts are reduced or current tax legisla-
tion limits the period during which, or the extent to which,
future tax benefi ts can be utilised.
The material sources of uncertainty in respect of provisions
relate to forward-looking measurement factors, such as the
assumed rate of interest, including assumptions about the
risk situation and changes in interest rates. Any changes
to these assumptions will have an eff ect on the carrying
amounts of these items.
The warranty provision covers the Group companies’ liability
to ensure that their products are functioning. To determine
this provision, it is necessary to make assumptions about
the future expense that we may incur as a result of warranty
claims. The provision is essentially determined in respect
of historical claims and unit sales, and takes into account
a standard warranty period of two years. If future develop-
ment diff ers signifi cantly from expectations, this will aff ect
rational’s net assets, fi nancial position and profi t or loss.
Provisions for legal proceedings are recognised if the corre-
sponding requirements are met. The recognition and amount
of the provisions are subject to management judgement.
Because such court actions usually extend over a longer
period and involve complex issues, they are associated with
uncertainty. Management regularly assesses the current
status of the court cases, sometimes with the involvement
of external lawyers, in order to estimate the provisions
reliably. It is nevertheless possible that an estimate must be
adjusted, resulting in an increased provision and a negative
impact on the earnings situation.
Actual developments may, under certain circumstances, dif-
fer from the estimates and assumptions made. The principle
of the “true and fair view” is applied unreservedly when
using estimates.
Besides estimates and assumptions, there was no signifi -
cant use of management judgement in the application of
accounting and valuation methods.
Notes on fi nancial instruments
In the course of normal operating activities, companies can
enter into a large number of contractual agreements that lead
to the creation of fi nancial assets for one company and, at the
same time, fi nancial liabilities for another. Financial instru-
ments are considered at the time when rational becomes a
contractual party to the fi nancial instrument. These fi nancial
instruments can conceal specifi c risks in addition to the
ope r ational risks to the company already described in the
Management Report. These risks are divided into a number
of categories: credit risk, especially relating to receivables,
liquidity risk relating to liabilities, as well as market risk,
which consists of currency risk, interest rate risk and price risk.
rational has a risk management system which is imple-
mented worldwide, enabling it to identify and analyse oppor-
tunities and risks at an early stage, and so take appropriate
preventive action. The following elements of the rational
risk management system have particular relevance for the
opportunities and risks connected with fi nancial instruments
(see also the report on opportunities and risks in the Group
Management Report):
› The integrated planning process, which involves all com-
panies and corporate divisions worldwide, defi nes specifi c
sales and fi nancial targets, as well as detailed measures to
ensure those targets are met.
Financial Report
Notes
Fundamentals
91rational Annual Report 2013

› The reporting process ensures that the degree to which
targets are achieved in all corporate divisions is reliably
and continuously measured, analysed and commented on.
Prompt provision of information allows corrective action to
be taken quickly and flexibly if things start to go wrong.
› Benchmarks and thresholds in the area of fi nance,
especially in receivables management, help managers to
identify undesirable developments at an early stage, so
that appropriate countermeasures can be taken.
› To minimise the risk arising in connection with our receiva-
bles, we collaborate worldwide with one of the largest
trade credit insurers.
› All business processes and internal control systems are
clearly defi ned. Quality and compliance are assured
through regular training and checks. Sensitive processes,
such as the approval process for creditor invoices, are
mapped using workflows.
› Internal Audit independently and objectively records and
assesses any variances from targets. Undesirable develop-
ments are identifi ed at an early stage.
› A globally integrated treasury management system
is implemented to provide quality cash management
worldwide.
› The comprehensive insurance strategy is reviewed annu-
ally and adapted to the new risk environment.
Credit risk
rational supplies customers on all continents and in almost
all regions of the world. Products are marketed worldwide
by sales companies and independent sales partners, not
directly to the end customer but through specialised retail-
ers. Bad debt risk on trade receivables can arise as a result
of customers not fulfi lling their payment obligations. In
order to avoid or reduce bad debt risk, which could lead to
potential liquidity risk and a risk to the rational Group’s
credit rating, we submit customers of all Group companies to
credit checks performed by the credit insurance provider and
its local partner companies. The rational customer portfolio
is rated as “low risk”.
As far as possible, customer receivables are insured on the
basis of this credit check. Under the existing arrangements,
the trade credit insurance covers not only the risk of cus-
tomer insolvency, but also protracted default (non-payment
as the insured event). In the event of a claim, 90% of the
credit loss on insured receivables is usually met by the
credit insurer.
A credit policy valid for the entire Group sets out clear
rules that apply from the beginning to the end of the order
process. Training, prompt reporting and IT support ensure
that the policy is properly implemented. The credit policy
combines the “minimum credit management require-
ments” (MaCM) of the Bundesverband Credit Management
(German Credit Management Association, BvCM) with the
rational-specifi c “one-piece flow” process organisation.
As an alternative to trade credit insurance cover, other col-
lateral (such as confi rmed and irrevocable letters of credit,
bank guarantees and other customary bank collateral) or ad-
vance payments are requested, depending on the type and
value of the goods or services to be provided. The supply of
goods or services to a customer on the basis of open pay-
ment terms without adequate collateral is only considered
by the company in clearly defi ned exceptional cases. Such
cases require a documented satisfactory payment history
in the business relationship with the customer to date in
combination with third-party credit ratings and fi nancial data
provided by the customer itself (annual fi nancial statements
and management analyses).
Trade receivables from public-sector customers, on the
other hand, are not subject to any credit checks or col-
lateralisation, provided that the respective country rating is
suffi ciently high.
More information on credit risk can be found in the note on
“Trade receivables”.
rational is also exposed to signifi cant credit risk in relation
to cash deposits. This applies in particular to the possible
failure of the bank to meet its contractual obligations. For
derivative fi nancial instruments with a positive fair value,
a credit risk arises from the possible failure of the contract
partner to fulfi l its obligations.
92 Financial Report
Notes
Fundamentals

The following table indicates the securitisation of deposits
with banks and the residual net risk in the event of a failure
of the banks:
keur Book value
Protected by
deposit
protection fund Net risk
31 Dec 2013 31 Dec 2013 31 Dec 2013
Deposits with
maturities of more
than three months 96,000 90,100 5,900
Cash and cash
equivalents 104,121 85,354 18,767
Total 200,121 175,454 24,667
keur Book value
Protected by
deposit
protection fund Net risk
31 Dec 2012 31 Dec 2012 31 Dec 2012
Deposits with
maturities of more
than three months 80,000 80,000 0
Cash and cash
equivalents 86,420 70,082 16,338
Total 166,420 150,082 16,338
Further information is provided in the disclosures on cash
deposits with a maturity of more than three months, cash
and cash equivalents, market risk, and the off setting of
fi nancial instruments.
Liquidity risk
Liquidity risk refers to the possibility that at some point in
time rational may not be in a position to meet its payment
obligations in full by the relevant due dates.
Corporate Treasury assigns top priority to the monitoring and
provision of liquidity. It does so by implementing daily cash
management and rolling liquidity planning, including the
continuous monitoring and control of the Group’s incoming
and outgoing payments. The liquidity reserve also enables
the Group to respond flexibly to considerable fluctuations
in cash flow or any demand peaks that may occur, thereby
ensuring that the Group meets all its payment obligations on
time.
rational attaches great importance to internal fi nancing;
most of our global business growth over recent years has
been funded in this way. In the event that rational should
have any additional need for external fi nancing, contractu-
ally agreed, confi rmed credit lines are available from several
banks (with long-term Standard & Poor’s ratings ranging
from a– to aaa).
Banks have given rational an investment-grade rating
(a to aaa). The existing credit lines are not subject to any
covenants that could require the credit lines to be renegoti-
ated in the event of non-compliance. Furthermore, the Group
has not assigned any collateral to the banks in connection
with the existing credit line agreements; instead, a nega-
tive covenant or a banks’ “pari passu” clause has been
agreed. Under this clause, rational undertakes to treat all
banks equally in relation to the provision of any collateral
for comparable loans. As of the balance sheet date, the
total amount of the contractually agreed credit lines was
32,669 thousand euros (2012: 31,669 thousand euros).
Aft er taking into account assignments for subsidiaries
and sureties, this leaves unused credit lines amounting to
28,528 thousand euros (2012: 27,457 thousand euros).
As of the balance sheet date, the liquidity reserve from own
resources (including all existing fi xed-term deposits) amount
to a total of 200,121 thousand euros (2012: 166,420 thousand
euros). This also included currency reserves amounting to
1,470 thousand euros (2012: 2,624 thousand euros) that
were not freely convertible or were subject to strict currency
restrictions.
Further information, especially on the liquidity reserve and
on existing external loans and their maturities, can be found
in the disclosures on deposits with maturities of more than
three months, cash and cash equivalents, and liabilities to
banks.
Market risk
Because of rational’s international orientation, the fair
values or future cash flows from fi nancial instruments, taking
the form of diff erent asset and liability positions, may be
exposed to market risk arising from changes in exchange
rates, interest rates and commodity prices.
Exchange rate risk in this case relates to receivables, liabili-
ties and anticipated transactions denominated in foreign
currency. Anticipated transactions include planned cash
flows from sales company receipts denominated in foreign
currency aft er costs and other expenses in the same currency
have been deducted. The interest rate risk generally relates
to long-term loan agreements. Price risk may arise primarily
in relation to the purchase of raw materials for the manufac-
ture of products.
One of the functions of Corporate Treasury, which is a depart-
ment within the parent company, is to counter the currency
and interest risks to which transactions are exposed with
suitable instruments and corrective action. Its activities
are governed by corporate guidelines, and are supported,
Financial Report
Notes
Fundamentals
93rational Annual Report 2013

controlled and monitored by a treasury management system.
Identifi ed risks are countered by the use of derivative
fi nancial instruments, provided that this approach is deemed
appropriate and eff ective hedging instruments are available.
Contractual partners in derivative fi nancial instrument trans-
actions are always banks with good to best quality credit
ratings, i. e. with a Standard & Poor’s a-rating as a minimum.
Currency risk
One of the factors giving rise to currency risk is the possible
change in the fair value (as of the balance sheet date) of
existing balance sheet items denominated in foreign curren-
cies (other than the functional currency) owing to exchange
rate fluctuations (translation risk). This applies to existing
receivables, liabilities and cash denominated in foreign
currency. At rational, translation risk is not minimised by
the use of hedges.
Another factor giving rise to currency risk is that the future
cash flows resulting from a fi nancial instrument in a foreign
currency may diff er signifi cantly from the recoverable values
as of the balance sheet date owing to changes in exchange
rates (transaction risk). Transaction risk has an impact on
both liquidity and the income statement.
The global transaction risk faced by the rational Group is
determined, centrally pooled, and managed monthly with a
rolling six-month horizon. Where necessary, any identifi ed
transaction risks are hedged by means of derivative fi nancial
instruments. Such a hedge can relate to recognised, pending
and anticipated transactions. This applies in particular to
transactions in the freely convertible currencies of our com-
panies in Sweden, the uk, Switzerland, Poland, the United
States, Canada and Japan.
The local currencies of companies that are subject to tight
currency restrictions are either not freely convertible (Brazil
and India) or are available only for verifi ed commercial
transactions (China). To settle receivables that cannot be
settled in the local currency under the restrictions, the local
currency must be exchanged for euros. This is possible only
within the country concerned and subject to the approval
of the competent authorities. Because of the low volume,
rational does not currently hedge foreign currency transac-
tions in currencies that are not freely convertible or are freely
convertible only to a limited extent.
rational uses currency options and forward exchange
contracts to hedge foreign currency transactions in freely
convertible currencies.
By partially settling amounts payable to suppliers in the
same foreign currencies that foreign sales companies use
to recognise revenue, it is possible to reduce the existing
currency risk within the Group (natural hedge).
Interest rate risk
Interest rate risk is the risk of a possible change in fair values
or future payments of fi nancial instruments resulting from
changes to market interest rates.
rational counteracts the risk of changed interest rates for
future payments by agreeing fi xed interest rates.
For the real estate fi nancing contract concluded in 2007,
which runs until the end of 2022, a fi xed interest rate has
been agreed to the end of 2017. There is no fi xed interest rate
at present for the period from 2017 to 2022. All other fi nanc-
ing contracts stipulate fi xed interest rates for the entire term.
Price risk
In its production processes, rational uses several thousand
tonnes of high-quality stainless steel a year. The risk arising
from changes in the price of stainless steel is governed both
by the basic price of steel itself and by the fluctuations in
the price of alloys on metals markets, which are reflected in
what is known as the “alloy surcharge”.
Neither the basic price of steel nor that of alloy metals
is hedged by the use of derivative fi nancial instruments.
Concerning the basic price of steel, however, rational does
have fi xed contracts with the suppliers, under which the
purchase price is set in advance for one to two years.
Classifi cation of fi nancial instruments
The following table shows the carrying amounts and fair
values of fi nancial instruments.
94 Financial Report
Notes
Fundamentals

keur Category
Fair value
hierarchy1)
Book value
31 Dec 2013
Fair value
31 Dec 2013
Book value
31 Dec 2012
Fair value
31 Dec 2012
Assets
Trade receivables a 75,863 65,941
Other current assets 7,249 6,148
Derivatives not in a hedging relationship c Level 2 53 53 60 60
Other fi nancial assets a 735 233
Remaining other current assets
no fi nancial instr. acc.
to ifrs 7 6,461 5,855
Other non-current assets a Level 2 1,120 355
Other fi nancial assets a 86 85 355 352
Remaining other non-current assets
no fi nancial instr. acc.
to ifrs 7 1,034 –
Deposits with maturities of more than 3 months a Level 2 96,000 96,088 80,000 80,048
Cash and cash equivalents a 104,121 86,420
Financial assets b 0 0
Liabilities
Trade accounts payables d 11,995 10,468
Other current liabilities 20,473 18,609
Derivatives not in a hedging relationship e Level 2 54 54 89 89
Other fi nancial liabilities d 6,580 6,683
Remaining other current liabilities
no fi nancial instr. acc.
to ifrs 7 13,839 11,837
Liabilities from loans d Level 2 34,375 36,503 25,288 27,789
Of which: aggregated by category in accordance
with ias 39
a) Loans and receivables 276,805 276,892 232,949 232,994
b) Held-to-maturity investments 0 0 0 0
c) Financial assets held for trading 53 53 60 60
d) Financial liabilities measured at amortised cost 52,950 55,078 42,439 44,940
e) Financial liabilities held for trading 54 54 89 89
1) According to ifrs 13.72 – 13.90
Financial assets and liabilities are generally recognised in
the balance sheet at amortised cost. By way of exception,
the derivative fi nancial instruments are recognised at fair
value. The relevant balance sheet items are reconciled to the
categories of fi nancial instruments reportable under ias 39.
ifrs 13 establishes a three-Level fair value measurement hi-
erarchy for fi nancial instruments. Input factors for Level 1 are
prices quoted on active markets accessible to the company
on the measurement date for identical assets or liabilities.
Level 2 incorporates fi nancial instruments for which there
are no prices quoted on an active market accessible to the
company on the measurement date. However, it is possible
to calculate their fair value on the basis of market prices of
comparable fi nancial instruments or using models based on
input parameters observable on the market. The fair value of
Level 3 fi nancial instruments is measured using input factors
that are not observable.
As shown in the table, other non-current assets, deposits
with maturities of more than three months and liabilities
to banks are allocated to measurement hierarchy level 2
in accordance with ifrs 13, in addition to the derivative
fi nancial instruments.
For fi nancial instruments whose carrying amount is a reason-
able approximation of fair value, fair value is not disclosed
separately in accordance with ifrs 7.29a.
Financial Report
Notes
Fundamentals
95rational Annual Report 2013

During the reporting period, there were no reclassifi cations
between the measurement hierarchy levels. If circumstances
occur which call for a diff erent classifi cation, the fi nancial
instruments will be reclassifi ed at the end of the reporting
period.
The fair values of fi nancial instruments have been deter-
mined as explained below:
With current fi nancial instruments with maturities of
less than one year, the carrying amount is a reasonable
approximation of fair value, given the short remaining
maturities. This applies to both current assets (cash and
cash equivalents, trade receivables and other current assets)
and current liabilities (trade accounts payable and other
current liabilities). Exceptions are derivative fi nancial instru-
ments, deposits with a maturity of more than three months,
and short-term portions of liabilities to banks, for which a
fair value is calculated.
Other non-current assets include outstanding security
deposits with a residual maturity of more than one year.
The fair value is calculated using the discounted cash flow
method by discounting the outstanding amounts matching
the relevant maturity. The credit risks of contracting parties
are not taken into account here.
The following table shows the contract values and fair values
of the derivative fi nancial instruments, by category, as of
31 December 2013 and 31 December 2012. The contract
values do not represent the market risk, but they provide
information on the volume of transactions outstanding on
the balance sheet date.
keur Currency Contract value Positive fair value (assets) Negative fair value (liabilities)
2013 2012 2013 2012 2013 2012
Maturity < 1 Year
Currency options gbp 18,232 18,653 17 35 38 37
Currency options usd – 8,155 – 25 – 27
Currency options jpy 4,286 – 36 – 16 –
Interest rate/currency
swaps jpy – 115 – – – 25
Total 22,518 26,923 53 60 54 89
Derivatives with a maturity over one year did not exist on the
balance sheet date.
For deposits with a maturity of more than three months,
the fair value is determined using the discounted cash flow
method. To this end, the redemption amounts on the matu-
rity date have been discounted at the respective maturity-
matched discount rates, taking the credit risk of contracting
parties into account. The interest to be apportioned to past
fi scal year is included in other current assets and is therefore
no longer included here.
Investments are measured at amortised cost. As in the previ-
ous year, the investment is reported with a carrying amount
of 0 thousand euros. This corresponds to the fair value.
The fair value of liabilities to banks is determined using the
discounted cash flow method. To this end, the cash flows
of the annuity loans at the diff erent interest and repayment
dates have been discounted using the relevant maturity-
matched discount rates, taking own credit risk into account.
96 Financial Report
Notes
Fundamentals

Additional, primarily quantitative, information on fi nancial
instruments can be found in the disclosures on the relevant
balance sheet items.
The interest and net earnings by class of fi nancial instru-
ments in accordance with ias 39 include net profi ts/losses,
total interest income/expense, and expenses from value
adjustments. They are composed as follows:
keur Net results thereof:
2013
Interest earned/
paid
Value
adjustments Other
Loans and receivables –4,452 +468 –1,146 –3,774
Held-to-maturity investments – – – –
Financial assets/liabilities held for trading +724 – – +724
Financial liabilities measured at amortised cost –1,987 –932 – –1,055
keur Net results thereof:
2012
Interest earned/
paid
Value
adjustments Other
Loans and receivables –1,469 +781 –754 –1,496
Held-to-maturity investments – – – –
Financial assets/liabilities held for trading +663 – – +663
Financial liabilities measured at amortised cost –781 –905 – +124
Sensitivity analysis for fi nancial instruments
ifrs 7 requires a sensitivity analysis to be carried out to show
the hypothetical eff ects of market risk on income and equity.
This involves making assumptions with regard to company-
specifi c risk variables connected with fi nancial instruments.
As of the balance sheet date of 31 December 2013, rational
was exposed to currency risk arising from activities in vari-
ous foreign currencies. These risks are reflected in “trade
receivables”, “other assets”, “cash and cash equivalents”
as well as “trade accounts payable” and “other liabilities”.
If, on 31 December 2013, the euro had been 10% stronger
against the foreign currencies in which rational conducts its
operations, the Group earnings and the currency reserve and
thus the total equity would have been 6,381 thousand euros
lower (2012: 3,935 thousand euros lower). If the euro had
been 10% weaker, the amount reported in functional cur-
rency would have been 7,302 thousand euros higher (2012:
4,288 thousand euros higher).
The hypothetical impact on income of –6,381/+7,302 thousand
euros is primarily the result of the following signifi cant currency
sensitivities:
Hypothetical
impact on profi t
Revaluation of euro
+10%
Hypothetical
impact on profi t
Devaluation of euro
-10%
keur 2013 2013
eur/gbp –1,689 1,657
eur/usd –1,584 1,847
eur/cad –900 1,101
eur/jpy –430 525
eur/mxn –402 491
eur/brl –361 441
Financial Report
Notes
Fundamentals
97rational Annual Report 2013

Off setting of fi nancial instruments
The following fi nancial assets and liabilities are set off in the
balance sheet or are subject to a legally enforceable global
netting agreement or similar agreements.
Financial assets:
keur
Gross amounts
of recognised
fi nancial assets
Gross amounts
of recognised
fi nancial
liabilities set off
in the balance
sheet
Net amounts of
fi nancial assets
presented in the
balance sheet
Related amounts not set off in
the balance sheet Net amounts
2013
Financial
instruments
Cash
collateral
Derivatives 53 – 53 16 – 37
Deposits with maturities of more than
3 months, cash and cash equivalents 200,121 – 200,121 34,375 – 165,746
Trade receivables 80,277 –4,414 75,863 – – 75,863
Total 280,451 –4,414 276,037 34,391 – 241,646
keur
Gross amounts
of recognised
fi nancial assets
Gross amounts
of recognised
fi nancial
liabilities set off
in the balance
sheet
Net amounts of
fi nancial assets
presented in the
balance sheet
Related amounts not set off in
the balance sheet Net amounts
2012
Financial
instruments
Cash
collateral
Derivatives 60 – 60 60 – 0
Deposits with maturities of more than
3 months, cash and cash equivalents 166,420 – 166,420 25,288 – 141,132
Trade receivables 70,778 –4,837 65,941 – – 65,941
Total 237,258 –4,837 232,421 25,348 – 207,073
Financial liabilities:
keur
Gross amounts
of recognised
fi nancial
liabilities
Gross amounts
of recognised
fi nancial assets
set off in the
balance sheet
Net amounts of
fi nancial liabili-
ties presented
in the balance
sheet
Related amounts not set off in
the balance sheet Net amounts
2013
Financial
instruments
Cash
collateral
Derivatives 54 – 54 17 – 37
Liabilities from banks 34,375 – 34,375 34,375 – 0
Liabilities from business partners 9,270 –4,414 4,856 – – 4,856
Total 43,699 –4,414 39,285 34,392 – 4,893
98 Financial Report
Notes
Fundamentals

keur
Gross amounts
of recognised
fi nancial
liabilities
Gross amounts
of recognised
fi nancial assets
set off in the
balance sheet
Net amounts of
fi nancial liabili-
ties presented
in the balance
sheet
Related amounts not set off in
the balance sheet Net amounts
2012
Financial
instruments
Cash
collateral
Derivatives 89 – 89 60 – 29
Liabilities from banks 25,288 – 25,288 25,288 – 0
Liabilities from business partners 9,893 –4,837 5,056 – – 5,056
Total 35,270 –4,837 30,433 25,348 – 5,085
The gross amounts used in the fi nancial assets and liabili-
ties that have not led to any off -set are derived from global
netting agreements or similar agreements. Off setting is
therefore only possible in the event of insolvency of one of
the parties.
Notes on the Statement of Comprehensive Income
1. Sales
In fi scal year 2013, rational generated worldwide revenue
of 461,148 thousand euros (2012: 434,981 thousand euros),
of which 77% (2012: 77%) was attributable to appliance
sales. The remaining 23% (2012: 23%) was generated from
the sale of accessories, spare parts and care products.
The regional breakdown of revenue by customer location
was as follows:
keur 2013 % of total 2012 % of total
Germany 60,831 13 61,520 14
Europe (excluding
Germany) 231,459 50 214,824 50
Americas 82,213 18 75,314 17
Asia 61,424 13 62,675 14
Rest of the world* 25,221 6 20,648 5
Total 461,148 100 434,981 100
* Australia, New Zealand, Near/Middle East, Africa
Since fi scal year 2013, sales with customers in Turkey have
been allocated to “Europe” instead of to “Rest of the world”.
The 2012 fi gures were adjusted accordingly.
Further revenue breakdowns appear in the segment
reporting.
2. Cost of sales
Cost of sales is calculated on the basis of direct costs for
materials and production as well as overheads for materials
and production.
In 2013, the cost of sales was 180,446 thousand euros
(2012: 173,263 thousand euros). The cost of materials
included in this fi gure was 153,394 thousand euros (2012:
147,707 thousand euros). This rise was attributable primarily
to the increased sales volume.
3. Sales and service expenses
Sales and service expenses are made up of sales organisa-
tion costs for offi ce-based and fi eld sales, shipping costs,
and costs for marketing, application consultancy and aft er-
sales service. In 2013, there was an approximately propor-
tional increase in sales and service expenses in comparison
to the growth in sales.
4. Research and development expenses
Research and development activities at rational largely
consist of projects focusing on application research and
the development of new products to secure the company’s
technological edge and thus its long-term success. The
costs are fully expensed and reported under “research and
development expenses” in the income statement, as the
prerequisites for the capitalisation of development costs in
accordance with ias 38.57 are not met.
99rational Annual Report 2013 Financial Report
Notes
Fundamentals
Notes on the Statement of Comprehensive Income

In 2012, research and development expenses amounting to
13,562 thousand euros had gone down slightly, as signifi cant
pre-investments had been made in 2011 with the introduc-
tion of new product generations. As a result, research and
development expenses amounting to 16,696 thousand euros
in the past fi scal year increased disproportionately compared
with revenue.
5. General administration expenses
General administration expenses include business adminis-
tration costs, such as human resources, fi nance, it, account-
ing and controlling as well as a certain proportion of executive
management costs.
6. Other operating income
keur 2013 2012
Exchange gains 3,242 4,586
Income from government grants 1,396 –
Insurance recoveries 920 934
Income from value adjusted and depreci-
ated accounts receivables 370 163
Income from refund of taxes 184 44
Other (< 100 thousand euros in each case) 196 151
Total 6,308 5,878
Exchange gains were primarily generated by fluctuations in
the exchange rate between origination and payment dates,
and by measuring balance sheet items at the spot rate.
Exchange gains include income from fi nancial instruments
measured at fair value through profi t or loss amounting to
222 thousand euros (2012: 1,409 thousand euros).
In the year under review, the “insurance recoveries” item
included income of 623 thousand euros (2012: 622 thousand
euros) from the payment of claims by credit insurers relating to
receivables defaults.
The income from government grants item includes grants for
research and development services. The services pertain to
fi scal years 2010 to 2013. The awarding of grants could be
established in 2013.
7. Other operating expenses
keur 2013 2012
Exchange losses 7,436 5,023
Value adjustments on accounts receivables 1,516 917
Other taxes 367 345
Donations 189 333
Other (< 100 thousand euros in each case) 107 92
Total 9,615 6,710
Exchange losses were primarily generated by fluctuations in
the exchange rate between origination and payment dates,
and by measuring balance sheet items at the spot rate.
Exchange losses include expenses for fi nancial instruments
measured at fair value through profi t or loss amounting to
195 thousand euros (2012: 850 thousand euros).
8. Financial results
Interest and similar income result primarily from short-term
cash deposits. Interest and similar expenses include
mainly the interest expenses for real estate and machinery
fi nancing contracts amounting to 923 thousand euros
(2012: 897 thousand euros) and expenses from the com-
pounding of interests on long-term provisions amounting to
108 thousand euros (2012: 160 thousand euros).
9. Taxes on income
The following table shows the reconciliation from expected
to reported tax expense. A combined income tax rate of
27.73% (2012: 27.09%) was applied to profi t from ordinary
activities to calculate expected tax expense for 2013. This tax
rate is composed of a corporate income tax rate of 15.0% and
100 Financial Report
Notes
Notes on the Statement of Comprehensive Income
a solidarity surcharge of 5.5% levied on corporate income
tax, as well as a municipal trade tax multiplier of 340%
(2012: 320%), as applied to the parent company. Deferred
taxes recognised at Group level have been measured on the
basis of each country-specifi c income tax rate.
keur 2013 2012
Earnings before taxes (ebt) 127,653 122,425
Expected tax rate in percent 27.73 27.09
Expected income taxes 35,398 33,165
Variations in local tax rates in the
subsidiaries –6,441 –4,919
Tax refunds from previous years –55 –89
Tax expenses relating to previous years 265 79
Non-tax-deductible expenses 1,242 904
Reported income taxes 30,409 29,140
The deferred taxes reported in fi scal year 2013 amount to
4,901 thousand euros, compared with 4,803 thousand euros
as at the 2012 balance sheet date. The deferred tax income
attributable to 2013 was therefore 98 thousand euros (2012:
443 thousand euros). The current income tax expense thus
amounted to 30,507 thousand euros (2011: 29,583 thousand
euros).
The deferred taxes recognised for fi scal years 2013 and 2012
are attributable to the following balance sheet items:
keur Eff ect on net income
2013 2012 2013 2012
Inventories 4,570 4,456 114 240
Provisions 626 484 142 95
Trade receivables 54 61 –7 261
Other –349 –198 –151 –153
Total 4,901 4,803 98 443
Deferred tax assets of 4,555 thousand euros (2012:
4,519 thousand euros) are expected to have a maturity of
less than one year. Of the reported amounts, 346 thousand
euros (2012: 284 thousand euros), are non-current. Current
deferred taxes result from various temporary diff erences
between the ifrs values and the tax base as well as from
consolidation measures, while non-current deferred taxes
are based on measurement diff erences for provisions and
non-current assets. The “Others” item includes deferred tax
liabilities. These tax liabilities are off set against deferred tax
assets relating to diff erent balance sheet items.
Deferred taxes relating to items to be recognised directly
in the equity are explained in note 21 on Equity (“Other
equity”).
10. Earnings per share
Earnings per share are calculated as stipulated by ias 33 by
dividing Group earnings by the weighted average number of
shares outstanding during the fi scal year.
Calculated on the basis of 11,370,000 shares (2012:
11,370,000 shares) and Group earnings of 97,244 thousand
euros (2012: 93,285 thousand euros), basic and diluted
earnings per share for fi scal year 2013 were 8.55 euros
(2012: 8.20 euros).
11. Dividend per share
For fi scal year 2012, the dividend of 5.70 euros per share
proposed by the Executive Board and Supervisory Board
of rational ag was approved by a majority at the General
Meeting of Shareholders on 8 May 2013. Total dividends of
64,809 thousand euros were paid in May 2013.
The Executive Board and Supervisory Board propose to the
General Meeting of Shareholders 2014 that a dividend of
6.00 euros per share be paid for fi scal year 2013, the total
distribution in this case being 68,220 thousand euros.
101rational Annual Report 2013 Financial Report
Notes
Notes on the Statement of Comprehensive Income

in excess of depreciation, the asset is written down to its
recoverable amount. In fi scal year 2013, as in the previous
year, no impairment losses were recognised on intangible
assets. There are no pledges or restrictions on disposal.
Exchange rate diff erences can occur when foreign-currency-
denominated intangible assets held by the subsidiaries are
translated into the functional currency.
Amortisation of intangible assets is allocated to the follow-
ing functional areas:
keur 2013 2012
Production 11 10
Sales and service 79 83
Research and development 47 22
General administration 469 345
Total 606 460
13. Goodwill
A net carrying amount of 424 thousand euros (2012: 424 thou-
sand euros) for goodwill was reported under intangible
assets as of the balance sheet date. This goodwill arose from
rational’s acquisition of frima-t s.a.s., Wittenheim, in 1993.
At the end of 2013, this goodwill was subjected to an
impairment test using the discounted cash flow method. The
frima business segment was identifi ed as a cash-generating
unit. The recoverable amount is determined on the basis of
the value in use. Future cash flows were estimated on the
assumption that the assets would continue to be used, and
using the management’s current fi nancial and business
plans for the next four years, based on past experience.
Growth in earnings was calculated on the same basis, using
a contribution margin model. This model assumes 1% (2012:
1%) growth in earnings from the fi ft h year onward. In accord-
ance with ias 36, no allowance was made for any future
restructuring and associated increases in earning power. The
applied discount rate of 6.6% aft er tax, which equated to
8.3% before tax (2012: 6.8% aft er tax and 8.1% before tax)
took appropriate account of present market forecasts regard-
ing the time value of money and risk estimates in relation to
assets. The present value calculated under this method was
substantially higher than the carrying amount of the busi-
ness segment. No impairment was therefore identifi ed and
there was consequently no requirement to recognise any
impairment loss in respect of the goodwill.
Notes on the Balance Sheet – assets
12. Intangible assets
keur
Industrial and
similar rights Goodwill Total
Acquisition cost
Balance on 1 Jan 2013 5,860 424 6,284
Currency diff erences –2 – –2
Additions 746 – 746
Disposals –101 – –101
Balance on
31 Dec 2013 6,503 424 6,927
Amortisation
Balance on 1 Jan 2013 4,752 – 4,752
Currency diff erences –1 – –1
Additions 606 – 606
Disposals –101 – –101
Balance on
31 Dec 2013 5,256 – 5,256
Book Values
Balance on
31 Dec 2013 1,247 424 1,671
Acquisition cost
Balance on 1 Jan 2012 5,125 424 5,549
Additions 735 – 735
Disposals – – –
Balance on
31 Dec 2012 5,860 424 6,284
Amortisation
Balance on 1 Jan 2012 4,292 – 4,292
Additions 460 – 460
Disposals – – –
Balance on
31 Dec 2012 4,752 – 4,752
Book Values
Balance on
31 Dec 2012 1,108 424 1,532
Intangible assets comprise industrial and similar rights
recognised at cost, as well as goodwill. Self-created assets
are not included. There were no capitalisable development
costs as defi ned by ias 38.57. If impairment is identifi ed
102 Financial Report
Notes
Notes on the Balance Sheet – assets

14. Property, plant and equipment
keur
Land and
buildings
Technical
equipment,
machinery
Operating
and offi ce
equipment Total
Acquisition cost
Balance on
1 Jan 2013 62,451 26,459 19,171 108,081
Currency diff erences –36 –2 –195 –233
Additions 4,813 2,667 3,812 11,292
Disposals –195 –102 –810 –1,107
Balance on
31 Dec 2013 67,033 29,022 21,978 118,033
Amortisation
Balance on
1 Jan 2013 23,710 15,621 14,121 53,452
Currency diff erences –17 –2 –160 –179
Additions 2,121 2,447 2,065 6,633
Disposals –194 –98 –782 –1,074
Balance on
31 Dec 2013 25,620 17,968 15,244 58,832
Book values
Balance on
31 Dec 2013 41,413 11,054 6,734 59,201
Acquisition cost
Balance on
1 Jan 2012 58,801 24,250 17,609 100,660
Currency diff erences –4 –1 –78 –83
Additions 3,654 2,763 2,215 8,632
Disposals – –553 –575 –1,128
Balance on
31 Dec 2012 62,451 26,459 19,171 108,081
Amortisation
Balance on
1 Jan 2012 21,635 13,843 12,768 48,246
Currency diff erences –3 –1 –68 –72
Additions 2,078 2,303 1,921 6,302
Disposals – –524 –500 –1,024
Balance on
31 Dec 2012 23,710 15,621 14,121 53,452
Book values
Balance on
31 Dec 2012 38,741 10,838 5,050 54,629
Property, plant and equipment is recognised at cost less
depreciation. If impairment is identifi ed in excess of
depreciation, the asset is written down to its recoverable
amount. As in 2012, no impairment losses were recognised
in fi scal year 2013. A land charge of 33,500 thousand euros
(2012: 23,000 thousand euros) is registered for land and
buildings in Landsberg. There are no restrictions on disposal.
Exchange rate diff erences can occur when foreign-currency-
denominated carrying amounts for property, plant and
equipment held by the subsidiaries are translated into the
functional currency.
Additions under acquisition costs for land and buildings
mainly result from the construction of a new offi ce and
training building in Landsberg, which was purchased in
April 2013.
Depreciation of property, plant and equipment is allocated to
the following functional areas:
keur 2013 2012
Production 3,397 3,192
Sales and service 1,421 1,457
Research and development 940 799
General administration 875 854
Total 6,633 6,302
15. Financial assets
The acquisition cost of the fi nancial assets amounted to
30 thousand euros (2012: 30 thousand euros), and accumu-
lated depreciation of 30 thousand euros was recognised,
as in 2012. The carrying amount of the fi nancial assets as of
31 December 2013 thus remained unchanged at 0 thousand
euros.
16. Inventories
keur 31 Dec 2013 31 Dec 2012
Raw materials, consumables and supplies 10,412 10,275
Work in progress 536 570
Finished goods and goods for resale 16,221 15,519
Total 27,169 26,364
The procurement of raw materials, consumables, supplies
and merchandise, and the production of units were based on
orders.
The carrying amount of the inventories measured at fair value
less selling costs is 3,092 thousand euros (2012: 1,356 thou-
sand euros). In fi scal year 2013, write-downs on inventories
of 728 thousand euros (2012: 293 thousand euros) were
expensed as cost of sales.
As in the previous year, the inventories were not subject to
any restrictions on disposal or pledges as at the balance
sheet date.
Financial Report
Notes
Notes on the Balance Sheet – assets
103rational Annual Report 2013

17. Trade accounts receivable
keur 31 Dec 2013 31 Dec 2012
Trade receivables, not impaired 75,649 64,973
Trade receivables, impaired 610 1,315
Impairment –396 –347
Total 75,863 65,941
As in the previous year, all receivables are due within one
year.
The following table shows the breakdown of non-impaired
trade receivables by days overdue:
keur Overdue
Trade receivables not impaired Total Not due
1–60
days
61–90
days
91–120
days
> 120
days
Balance on 31 Dec 2013 75,649 69,804 5,058 461 43 283
Balance on 31 Dec 2012 64,973 58,542 5,613 321 99 398
For trade receivables that are neither due nor subject to im-
pairments, there are no indications as of the balance sheet
date that the customers will be unable to meet their payment
obligations.
The following table shows the development of impairments
on trade receivables:
keur
Impairment for doubtful accounts receivables
Balance on
1 Jan
Currency
eff ect
Consump-
tion Reversal Additions
Balance on
31 Dec
2013 347 –8 –100 –152 309 396
2012 260 –2 –106 –152 347 347
Adequate allowances are recognised for identifi able credit
risk on receivables. Receivables written off in fi scal year 2013
amounted to 1,077 thousand euros (2012: 733 thousand
euros). This fi gure does not include any claims settled by or
payments expected from the credit insurer, which amounted
to 623 thousand euros (2012: 622 thousand euros).
rational uses trade credit insurance and irrevocable,
confi rmed bank letters of credit to minimise the credit risk
on trade receivables. The following table indicates the secu-
ritisation of trade receivables and the residual, unsecured
credit risk:
keur 31 Dec 2013 31 Dec 2012
Trade receivables 75,863 65,941
thereof credit-insured receivables1) 52,121 45,375
thereof receivables secured by letters
of credit / bank guarantees 2,661 5,032
thereof receivables against
public-sector entities2) 106 75
Maximum net credit risk 20,975 15,459
less refundable value-added tax2) 5,985 5,913
Unsecured credit risk 14,990 9,546
Risk coverage ratio 80% 86%1) assessed with contractual insured percentage2) precondition: perfect country rating
104 Financial Report
Notes
Notes on the Balance Sheet – assets

The residual credit risk not covered by the securities shown
includes concentration risk amounting to 4,984 thousand
euros (2012: 1,746 thousand euros), distributed over 15
(2012: seven) customers. Unsecured receivables with a nomi-
nal value of more than 100 thousand euros per individual
customer are considered when assessing concentration risk.
For customers with regular outstanding receivables of more
than 100 thousand euros, yearly revenues in the seven-digit
range can be assumed. Thereby these customers can be
classifi ed to the segment of a-customers and are in direct
attention of the company’s management.
Where customers have long-term payment diffi culties, the
Group enters into instalment agreements where possible
or initiates collection via the credit insurer or external col-
lection agencies. As of the balance sheet date, instalment
agreements were in place for a receivables volume of less
than 100 thousand euros (2012: 100 thousand euros).
18. Other assets
keur
31 Dec
2013
31 Dec
2012
Security deposits 392 454
Receivables from interest 307 32
Fair value of derivative fi nancial
instruments 118 85
Other (< 100 thousand euros in each case) 57 77
Total other fi nancial assets 874 648
Value-added tax refund claims 3,934 3,331
Receivables from government grants 1,396 –
Accruals 905 1,131
Income tax refund claims 557 904
Advances to employees 450 301
Advance payments 104 121
Other (< 100 thousand euros in each case) 149 67
Total other assets 8,369 6,503
Of the other assets shown in the table, assets worth
7,249 thousand euros (2012: 6,148 thousand euros) are
classifi ed as current.
Security deposits include a non-current component with
a value of 86 thousand euros (2012: 355 thousand euros).
These non-current fi nancial assets have a fair value of
85 thousand euros (2012: 352 thousand euros). For reasons
of materiality, these assets were not reported at their
fair values, but at cost.
A non-current proportion amounting to 1,034 thousand euros
(2012: 0 thousand euros) was recognised under “Receiva-
bles from government grants”, which was included in “Other
non-current assets” in the balance sheet.
19. Deposits with maturities of more than
three months
As of the balance sheet date, the Group reported German
fi xed-term deposits with total maturities of up to twelve
months and amounting to a total of 96,000 thousand euros
(2012: 80,000 thousand euros). The longest maturity is until
June 2014. None of these deposits has been pledged as
collateral.
rational places greater emphasis on capital retention than
on returns and therefore considers it imperative to protect
its deposits adequately. The majority of fi xed-term deposits
at the end of 2013 are protected by the German deposit
protection fund (for details, see section on “Credit risk”).
rational only makes deposits with banks that have a Stand-
ard & Poor's long-term rating of at least A-. To diversify the
risk, all fi xed-term deposits were distributed over six banks
at the end of the year.
20. Cash and cash equivalents
Corporate Treasury manages the Group’s cash and cash
equivalents worldwide, other than in countries where this
is prevented by restrictions on capital movements, such as
Brazil, China or India.
The largest proportion of cash and cash equivalents is
concentrated at the parent company in Germany. The total
amount is distributed over several banks. Deposits at Ger-
man banks are usually protected by the deposit protection
fund (for details, see section on “Credit risk”). At rational,
cash and cash equivalents in Germany include not only
balances on current accounts but also all fi xed-term deposits
and demand deposits.
Cash and cash equivalents of 104,121 thousand euros
(2012: 86,420 thousand euros) were reported as of the bal-
ance sheet date. Deposits in foreign currencies are measured
at the rate applicable on the balance sheet date.
As at the end of the year, an amount of 10,500 thousand
euros in a separate bank account had been pledged as
collateral. This resulted from new real estate fi nancing
taken out and fully drawn down in fi scal year 2013. Based
on the building progress, it is not yet possible to verify use
in accordance with the intended purpose. In 2012, a bank
deposit pledged as collateral for a diff erent real estate
fi nancing project in a comparable situation had amounted to
2,700 thousand euros.
Financial Report
Notes
Notes on the Balance Sheet – assets
105rational Annual Report 2013

keur Currency 31 Dec 2013 31 Dec 2012
Fixed-term deposits with
maturities of up to 3 months eur 15,000 –
Deposits incl.
demand deposits eur 40,495 55,983
Deposits incl.
demand deposits usd 14,708 5,447
Deposits incl.
demand deposits gbp 14,482 12,514
Deposits incl.
demand deposits cad 8,190 3,947
Deposits incl.
demand deposits mxn 2,195 42
Deposits incl.
demand deposits chf 1,711 941
Deposits incl.
demand deposits sek 1,281 1,129
Deposits pln 344 284
Deposits jpy 2,668 3,247
Deposits rub 1,718 747
Deposits cny 676 715
Deposits brl 434 1,333
Deposits inr 97 28
Deposits other currencies
and cash in hand various 122 63
Total 104,121 86,420
Notes on the Balance Sheet – equity and liabilities
21. Equity
Changes in equity are reported in the statement of changes
in equity.
Subscribed capital
rational ag's subscribed capital as of 31 December 2013
remained unchanged at 11,370 thousand euros divided
into 11,370,000 no-par-value bearer shares, each with a
nominal value of 1.00 euro. Each share carries one vote and
is necessary for entitlement to a share of profi ts. There are
currently no restrictions aff ecting voting rights or the transfer
of shares. The subscribed capital is fully paid in.
Conditional capital amounts to 200 thousand euros and
relates to option rights for members of the Executive Board
to purchase up to 200,000 no-par-value shares. Of these,
69,000 no-par-value shares have already been issued; op-
tion rights to 131,000 no-par-value shares currently remain
available. The conditional capital increase is dependent on
the extent to which the options granted are exercised by
their holders. The stock option plan is described in the note
on stock option plans.
Capital reserves
Capital reserves consist mainly of the premium from the
initial public off ering less the costs associated with the
initial public off ering. Capital reserves also include income
and expenses taken directly to equity and which resulted
primarily from the entitlements under the stock option plan
dated 3 February 2000 paid out in previous years as cash
compensation to members of the Executive Board.
Retained earnings
The legal reserves included under retained earnings and
recognised in accordance with section 150 of the German
Stock Corporation Act (AktG) amount to 514 thousand euros,
as in the previous year. The Group's earnings in the period
under review and past earnings of companies included in the
consolidated fi nancial statements continue to be included in
retained earnings unless they have been distributed as divi-
dends. The reason behind the variation in retained earnings
compared with 2012 is the positive net income amounting to
97,244 thousand euros (2012: 93,285 thousand euros) and
the dividend distribution of 64,809 thousand euros (2012:
62,535 thousand euros) in May 2013.
Other equity
Other components of equity are divided into income and
expenses and the income tax incurred with respect to the
following items:
keur 31 Dec 2013
before
Income tax Income tax
aft er
Income tax
Diff erences from
currency translation –2,569 0 –2,569
Actuarial gains
and losses –10 3 –7
Total –2,579 3 –2.576
keur 31 Dec 2012
before
Income tax Income tax
aft er
Income tax
Diff erences from
currency translation –1,594 – –1,594
Total –1,594 – –1,594
106 Financial Report
Notes
Notes on the Balance Sheet – assets
Notes on the Balance Sheet – equity and liabilities

Notes on capital management
rational’s aim is to secure the company’s equity base
and operating activities in the long term. In this context,
rational is not bound by any capital requirements under its
articles of association. The capital structure is monitored
through the company’s reporting process with a particular
focus on the equity ratio, and the prevailing economic
situation is the key determining factor in its management.
The equity ratio indicates the ratio of equity shown on the
balance sheet to the company’s total capital.
rational’s equity ratio as of 31 December 2013 was 71.3%
(2012: 72.8%).
22. Provisions for pensions
rational ag has given pension commitments to a former
director and a former company secretary. The benefi ts
amount to a fi nal salary scheme. The scheme is funded
exclusively by pension provisions, which rose in fi scal year
2013 to 780 thousand euros (2012: 795 thousand euros).
Both pension recipients are already receiving payments.
Payments amounting to 50 thousand euros are expected for
2014. For reasons of immateriality, this short-term provision
is not shown separately on the balance sheet. The pension
obligation has an average maturity of 19 years.
The present value of the defi ned benefi t obligation changed
as follows:
keur 2013 2012
Defi ned benefi t obligations 1 Jan 795 681
Interest expense 25 32
Paid obligations –50 –49
Recognised actuarial losses 10 131
Defi ned benefi t obligations 31 Dec 780 795
The actuarial losses in 2013 result from experienced adjust-
ments based on the diff erence between the expected and
actual change in the pension obligation.
The calculations were based on the following actuarial
assumptions:
Discount rate: 3.30% (2012: 3.30%)
Pension progression rate: 1.75% (2012: 1.75%)
Prof. K. Heubeck’s mortality tables (2005 G version) were
used as the biometric basis for the calculations. The valua-
tion is based on an actuarial expert opinion.
The following sensitivity analysis shows how the pension
provisions would be aff ected by changes in discount rate,
pension progression rate and life expectancy:
› If the discount rate had been 0.5% lower, the pension pro-
vision would have gone up by 41 thousand euros, provided
that all other assumptions remain unchanged.
› If the discount rate had been 0.5% higher, the pension
provision would have gone down by 38 thousand euros,
provided that all other assumptions remain unchanged.
› If the pension progression rate had been 0.5% higher, the
pension provision would have gone up by 39 thousand
euros, provided that all other assumptions remain
unchanged.
› If the life expectancy had been one year longer, the pen-
sion provision would have gone up by 28 thousand euros,
provided that all other assumptions remain unchanged.
The sensitivity analysis does not take into account the fact
that dependencies exist between the actuarial assumptions.
The amount of the pension progression rate selected and
of the discount rate is also aff ected by the expected rate of
inflation.
107rational Annual Report 2013 Financial Report
Notes
Notes on the Balance Sheet – equity and liabilities

23. Liabilities for current tax
2013
keur
Balance on
1 Jan
Currency
diff erences
Con-
sumption Additions
Balance on
31 Dec
Income tax liabilities 7,772 –187 –7,585 11,097 11,097
2012
keur
Balance on
1 Jan
Currency
diff erences
Con-
sumption Additions
Balance on
31 Dec
Income tax liabilities 3,238 –55 –3,183 7,772 7,772
24. Other provisions
2013
keur
Balance on
1 Jan
Currency
diff erences
Con-
sumption Additions
Interest
expense
Balance on
31 Dec
Thereof
non-current
Personnel 10,799 –250 –9,943 11,969 7 12,582 768
Trade bonuses 5,006 –174 –4,832 6,104 – 6,104 –
Warranty 7,525 – –5,779 6,057 76 7,879 2,149
Others 2,537 –52 –2,421 3,100 – 3,164 46
Total 25,867 –476 –22,975 27,230 83 29,729 2,963
2012
keur
Balance on
1 Jan
Currency
diff erences
Con-
sumption Additions
Interest
expense
Balance on
31 Dec
Thereof
non-current
Personnel 9,036 –32 –8,543 10,279 59 10,799 663
Trade bonuses 3,436 –12 –3,424 5,006 – 5,006 –
Warranty 6,558 – –5,143 6,040 70 7,525 1,477
Others 2,768 –8 –2,654 2,431 – 2,537 47
Total 21,798 –52 –19,764 23,756 129 25,867 2,187
Provisions for personnel obligations primarily comprise
estimated expenses for variable remuneration components.
The provision for trade bonuses is recognised for outstand-
ing discounts yet to be granted as of the balance sheet date.
The warranty provision covers the Group’s liability to ensure
its products are fully functioning. The “Other” item includes
provisions for a number of items, each of which is valued at
an amount below the materiality threshold.
The personnel provisions recognised as of 31 December 2013,
together with the provisions for trade bonuses and other
provisions, will mainly be used in the fi rst six months of
2014. The warranty provisions are normally used within two
years. For reasons of materiality, the country-specifi c rules
on the discounting of provisions have still been applied in
the consolidated fi nancial statements.
108 Financial Report
Notes
Notes on the Balance Sheet – equity and liabilities

25. Liabilities to banks
As of the end of the year, liabilities to banks totalled
34,375 thousand euros (2012: 25,288 thousand euros).
The assignment of rights to third parties has been
contractually restricted.
In fi scal years 2012 and 2013, rational entered into multi-
year loan agreements to fi nance the acquisition of new
production facilities. Fixed interest rates were agreed for the
entire term of the agreements. The last repayment of prin-
cipal will be made in 2017. At the end of the fi scal year, the
remaining liabilities in connection with these loans amount-
ed to 2,254 thousand euros (2012: 1,319 thousand euros).
Other liabilities to banks relate to loan agreements, secured
by land charges, to fund the construction of new buildings
and the acquisition of a site in Landsberg. New fi nancing
for a further new building construction project was agreed
in 2013. Fixed interest rates apply to the entire term of all
except two of these agreements. These two agreements
have fi xed interest rates until the end of 2017, and both
are scheduled to expire at the end of 2022. At the end
of the year, the remaining liabilities in connection with
real estate fi nancing amounted to 32,121 thousand euros
(2012: 23,969 thousand euros).
Of the liabilities to banks, the following interest payments
and repayments of principal will become due in subsequent
periods:
keur 2014 2015 – 2018 From 2019
Payments as of
31 December 2013 4,253 19,851 15,245
keur 2013 2014 – 2017 From 2018
Payments as of
31 December 2012 3,703 13,444 12,929
For payments to be made aft er the fi xed interest period has
ended, it has been assumed that the terms and conditions
will remain unchanged.
26. Trade accounts payable
As a result of the good liquidity position, payables to suppli-
ers are settled so that advantage can be taken of discounts
granted by suppliers. The following table shows a breakdown
of maturities for trade accounts payable and the resulting
expected cash outflows, based on the payment terms agreed
with suppliers:
keur Due dates
Total
Up to 30
days
30 – 60
days › 60 days
Balance on
31 Dec 2013 11,995 11,806 185 4
Balance on
31 Dec 2012 10,468 10,296 172 0
27. Other liabilities
keur 31 Dec 2013 31 Dec 2012
Liabilities from business partners 4,856 5,056
Liabilities for consulting and auditing
services 1,480 1,305
Liabilities from wages, salaries and
other personnel costs 244 322
Other (< 100 thousand euros in each case) 54 89
Total other fi nancial liabilities 6,634 6,772
Liabilities from value-added tax 5,829 4,482
Vacation payment accruals 3,851 3,588
Liabilities from PAYE and church taxes 2,402 2,173
Social security liabilities 1,381 1,305
Advance payments received 233 145
Other taxes 125 116
Other (< 100 thousand euros in each case) 18 28
Totel other liabilities 20,473 18,609
Other liabilities are current fi nancial liabilities and are usu-
ally settled within a few months of the balance sheet date.
Financial Report
Notes
Notes on the Balance Sheet – equity and liabilities
109rational Annual Report 2013

Notes on the Cash Flow Statement
28. Cash flow statement
The cash flow statement shows the changes in rational’s
cash and cash equivalents during the year under review. In
compliance with ias 7, the statement of cash flows reports
the cash flows classifi ed by operating, investing and fi nanc-
ing activities.
Cash and cash equivalents include items subject to restric-
tions on disposal. These restrictions on disposal relate to
an amount of 1,470 thousand euros (2012: 2,624 thousand
euros). Cash and cash equivalents increased from
86,420 thousand euros at the start of the fi scal year to
104,121 thousand euros as of 31 December 2013. In addi-
tion, rational has fi xed-term deposits as of the balance
sheet date amounting to 96,000 thousand euros (2012:
80,000 thousand euros). These deposits have maturities of
more than three months from the date of deposit, and are
not therefore included in cash and cash equivalents.
Other notes on the Group Financial Statements
29. Employees and personnel costs
Average number of
employees 2013 % of total 2012 % of total
Production and
Dispatch 330 25 331 26
Sales and
Marketing 561 43 532 42
Technical Customer
Service 143 11 134 11
Research and
Development 96 7 83 7
Administration 190 14 178 14
Total 1,320 1,258
Thereof abroad 555 42 515 41
Personnel costs comprise the following items:
Angaben in teur 2013 2012
Salaries and wages 85,544 78,360
Social security 15,670 14,745
Thereof expenses for defi ned
contribution plans 7,173 6,708
Total 101,214 93,105
30. Contingent liabilities and other fi nancial
obligations
Contingent liabilities
Contingent liabilities are, fi rstly, possible obligations whose
existence will be confi rmed only by the occurrence of one or
more uncertain future events not wholly within the control
of the company. Secondly, they are present obligations
where it is not probable that an outflow of resources will be
required to settle the obligation or where the amount of the
obligation cannot be measured with suffi cient reliability.
There were no contingent liabilities in fi scal years 2013
and 2012.
110 Financial Report
Notes
Notes on the Cash Flow Statement
Other notes on the Group Financial Statements
Other fi nancial obligations
As of the balance sheet date, rational’s other fi nancial
obligations amounted to 20,966 thousand euros (2012:
17,088 thousand euros). This item relates mainly to future
payments under rental and leasing contracts, and purchase
commitments for property, plant and equipment, and for
intangible assets.
The rental and leasing contracts treated as operating leases
in accordance with ias 17 are predominantly for the rental
of offi ce space and leasing of production facilities, vehicles,
IT equipment, and miscellaneous offi ce equipment. Some
of the leases have fi xed terms, others are for an indefi nite
period. They include the following future minimum rental
and leasing payments:
Obligations for operating leases
keur
31 Dec
2013
31 Dec
2012
Up to 1 year 4,484 4,968
1 – 5 years 4,159 3,534
> 5 years 777 0
Total 9,420 8,502
Fair Value 9,270 8,451
There are no restrictions included in any of the rental and
leasing contracts. The rental and leasing expenses recog-
nised in the income statement for fi scal year 2013 amount
to 5,923 thousand euros (2012: 6,095 thousand euros).
The obligations to purchase property, plant and equipment
amount to 8,130 thousand euros (2012: 7,487 thousand euros)
and those to purchase intangible assets amount to
67 thousand euros (2012: 44 thousand euros).
31. Operating segments
The Group is exclusively concerned with the thermal prepa-
ration of food in professional kitchens. In accordance with
the requirements of ifrs 8, segment reporting represents
the rational and frima operating segments and thus
reflects the Group's reporting structure for management
purposes.
Operating segments are organisational units for which in-
formation is passed to management so that it can measure
performance and allocate resources. The Executive Board is
the body with primary responsibility for making operating
decisions.
rational concentrates on cooking processes in which
heat is transferred via steam, hot air or a combination of
the two. It generates most of its revenue from sales of the
SelfCookingCenter® whiteffi ciency® and CombiMaster® Plus.
frima focuses on cooking applications in which food is
cooked in liquid or with direct contact heat. Most of its
revenue is generated from sales of the VarioCookingCenter
multificiency®.
Both segments incorporate departments with responsibil-
ity for research and development, production, sales and
marketing, service and administration.
Segment sales include both sales revenue from third parties
and intercompany sales generated between Group compa-
nies across the segments. Intercompany sales and revenue
are always based on arm's length prices. Segment earnings
correspond to earnings before interest and taxes of the
respective segments. Besides segment sales, this includes
all segment expenses except for taxes on earnings and the
fi nancial result.
As in the previous year, no more than 10% of sales were
generated with any one customer.
For a further breakdown of sales, see the sales disclosures.
Segment depreciation and amortisation relates to intangible
assets and property, plant and equipment. No other mate-
rial non-cash expenses reportable under ifrs 8.23 were
incurred in either 2013 or the previous year.
The reconciliation column mainly reflects the eff ects of con-
solidation. It also includes diff erences between the internal
reports submitted to management and the fi gures reported
externally.
Financial Report
Notes
Other notes on the Group Financial Statements
111rational Annual Report 2013

Operating segments 2013
keur rational frima Total of segments Reconciliation Group
External sales 433,727 25,933 459,660 +1,488 461,148
Intercompany sales 1,834 2,336 4,170 –4,170 –
Segment sales 435,561 28,269 463,830 –2,682 461,148
Segment result +123,614 +3,815 +127,429 +825 +128,254
Financial result – – – – –601
Earnings before taxes – – – – +127,653
Segment depreciation 6,716 523 7,239 – 7,239
Operating segments 2012
keur rational frima Total of segments Reconciliation Group
External sales 411,008 23,824 434,832 +149 434,981
Intercompany sales 1,600 1,871 3,471 –3,471 –
Segment sales 412,608 25,695 438,303 –3,322 434,981
Segment result +119,409 +3,038 +122,447 +269 +122,716
Financial result – – – – –291
Earnings before taxes – – – – +122,425
Segment depreciation 6,262 500 6,762 – 6,762
Of the property, plant and equipment and intangible assets,
57,335 thousand euros (2012: 52,477 thousand euros) are
reported in Germany, while 3,537 thousand euros (2012:
3,684 thousand euros) are attributable to third countries.
32. Related parties
Related parties of rational ag include the subsidiaries,
the members of the Executive Board and the members of
the Supervisory Board, and their related persons as well as
companies in which these persons own shares. Mr Siegfried
Meister, the Chairman of the Supervisory Board, has a
controlling interest because he owns the majority of shares
in rational ag.
Transactions with consolidated subsidiaries are eliminated
during consolidation.
Members of the Supervisory Board hold shares in companies
from which the company purchases goods or services.
The expense for these goods and services amounted to
1,703 thousand euros in 2013 (2012: 1,621 thousand euros).
As of 31 December 2013, outstanding trade accounts pay-
able to these companies amounted to 18 thousand euros
(2012: 0 thousand euros).
All of the transactions described were concluded at arm’s
length conditions. No further signifi cant transactions
occurred during the year under review with companies or
individuals in any way related to rational ag.
112 Financial Report
Notes
Other notes on the Group Financial Statements

33. Supervisory Board and Executive Board
The members of the Supervisory Board are as follows:
Siegfried Meister, entrepreneur
Chairman of the Supervisory Board
Walter Kurtz, entrepreneur
Deputy Chairman of the Supervisory Board
Dr Hans Maerz, auditor
Deputy Chairman of the Supervisory Board
Total compensation for the Supervisory Board
amounted to 644 thousand euros in fi scal year 2013 (2012:
621 thousand euros). The breakdown by Supervisory Board
member is as follows:
2013
keur Fixed
Perfor-
mance-
related Others Total
Siegfried Meister 150 64 24 238
Walter Kurtz 125 64 19 208
Dr Hans Maerz 125 64 9 198
Total 400 192 52 644
2012
keur Fest
Perfor-
mance-
related Others Total
Siegfried Meister 150 61 24 235
Walter Kurtz 125 61 19 205
Dr Hans Maerz 117 61 3 181
Total 392 183 46 621
As of the balance sheet date, Supervisory Board compensa-
tion of 608 thousand euros (2012: 580 thousand euros) was
included in other liabilities.
As of December 31, 2013, the members of the Supervisory
Board held a total of 8,048,935 shares in rational ag (2012:
8,049,262 shares), of which Mr Siegfried Meister held
7,161,411 shares (2012: 7,161,411 shares).
The members of the Supervisory Board are also represented
in the following supervisory and controlling committees:
Dr Maerz is the Chairman of the Supervisory Board of fwu
ag, Munich, and is Chairman of an Audit Committee formed
in accordance with section 324 of the German Commercial
Code (hgb) at fwu Provisions-Factoring GmbH, Munich,
Germany.
The Executive Board comprises the following members:
Dr Peter Stadelmann, Dipl.-Volkswirt
Chief Executive Offi cer,
Chief Human Resources Offi cer (until 31 December 2013)
Dr Günter Blaschke, Dipl.-Kaufmann
Chief Executive Offi cer (until 31 December 2013)
Erich Baumgärtner, Dipl.-Betriebswirt
Chief Financial Offi cer
Peter Wiedemann, Dipl.-Ingenieur
Chief Technical Offi cer
Markus Paschmann, Dipl.-Wirtschaft singenieur
Chief Sales Offi cer
Reinhard Banasch, Dipl.-Betriebswirt
Chief Sales Offi cer (until 31 January 2014)
With eff ect from 1 January 2014, Dr Peter Stadelmann was
appointed as Chief Executive Offi cer by the Supervisory
Board. Dr Günter Blaschke relinquished his position as
Chief Executive Offi cer by mutual agreement at the end of the
year 2013.
Financial Report
Notes
Other notes on the Group Financial Statements
113rational Annual Report 2013

Mr Reinhard Banasch, Chief Sales Offi cer, left the company
on 31 January 2014. His duties were taken over by Mr Markus
Paschmann, who was appointed to the Executive Board of
rational ag with eff ect from 1 December 2013.
The General Meeting of Shareholders held on 11 May 2011
resolved in accordance with section 314 (2) sentence 2
hgb not to disclose separately the compensation paid to
individual members of the Executive Board.
The total compensation paid to the Executive Board for the
performance of its duties within the parent company and its
subsidiaries in fi scal year 2013 was 7,204 thousand euros
(2012: 4,284 thousand euros). This amount includes a per-
formance-related salary component of 2,419 thousand euros
(2012: 1,931 thousand euros). Also included are expenses in
connection with restructuring the Executive Board, amount-
ing to 1,690 thousand euros. Payments into the pension
scheme totalling 486 thousand euros (2012: 310 thou-
sand euros) were also made.
As of the balance sheet date, the members of the Executive
Board together held 4,493 shares in rational ag (2012:
5,793 shares).
The members of the Executive Board are also repre-
sented in the following supervisory boards and controlling
committees:
Dr Stadelmann is Vice President of the Administrative Board
of Malik Management Zentrum St. Gallen ag, St. Gallen,
Switzerland and a member of the Administrative Board of ksp
Krieg Schlupp Partner Werbeagentur ag, Zurich, Switzerland.
34. Stock option plans
On 3 February 2000, rational ag launched a stock option
plan for the company’s Executive Board members. The plan
is designed to off er Board members additional incentives to
secure the company’s economic success in the medium and
long term and, in the interests of the shareholders, to work
toward increasing the value of the company.
It was decided initially to grant benefi ciaries of the plan
the option to buy a total of 200,000 no-par-value shares in
the company in up to fi ve tranches, representing a notional
share of the company’s share capital of 200 thousand euros.
Only the Supervisory Board is competent to conclude option
agreements, and is also responsible for deciding who is
eligible among the members of the Executive Board.
The option rights may have terms of up to fi ve years from the
dates of issue of the individual tranches. When individual
lock-up periods expire, the option rights are only exercisable
within certain periods. The periods during which options can
be exercised start in each case on the second and end on the
sixth trading day following a regular shareholders’ meeting
of the company or the publication of a quarterly report.
The exercise price for option rights issued before the compa-
ny’s shares were fi rst listed on the Frankfurt Stock Exchange
at the time of the company’s ipo in 2000 corresponds to the
off ering price per share set at that time. For option rights
issued at a later date, the exercise price corresponds to the
average (arithmetic mean) closing price of the company’s
shares on the Frankfurt Stock Exchange on the last fi ve trad-
ing days prior to the Supervisory Board’s resolution to issue
the particular portion of option rights.
To date, two tranches have been issued with a total of
69,000 option rights, which were drawn on in 2002 and
2006 in the form of cash payments equivalent to 100% of
the value of a company share minus the exercise price. As of
31 December 2013, option rights to a maximum of 131,000
no-par-value shares in rational ag still remained in the
stock option plan. No options were issued as of the balance
sheet date 31 December 2013.
35. Declaration on the Corporate Governance Code
The Executive Board and the Supervisory Board of
rational ag have issued a declaration in accordance with
section 161 of the German Stock Corporation Act (AktG)
detailing which recommendations of the Government
Commission for a German Corporate Governance Code were
and are being complied with. This declaration was based
on the German Corporate Governance Code as amended on
13 May 2013. The declaration is permanently available on
rational ag’s website: www. rational-online.com.
36. Subsequent events
Dr Günter Blaschke relinquished his position as Chief
Executive Offi cer by mutual agreement at the end of the year
2013. Dr Peter Stadelmann was appointed as his successor
with eff ect from 1 January 2014.
Mr Reinhard Banasch, Chief Sales Offi cer, left the company
on 31 January 2014. His duties were taken over by Mr Markus
Paschmann, who was appointed to the Executive Board of
rational ag with eff ect from 1 December 2013.
114 Financial Report
Notes
Other notes on the Group Financial Statements

37. Auditor's fee
By resolution of the General Meeting of Shareholders held
on 8 May 2013, PricewaterhouseCoopers ag Wirtschaft sprü-
fungsgesellschaft , Munich, was appointed as auditor for
fi scal year 2013.
The auditor's fee, including reimbursement of ex-
penses, amounted to a total of 220 thousand euros (2012:
211 thousand euros), which was broken down as follows:
An amount of 220 thousand euros (2012: 176 thousand
euros) for the auditing of separate and consolidated fi nan-
cial statements and 0 thousand euros (2012: 35 thousand
euros) for other services.
Landsberg am Lech, 20 February 2014
rational ag
The Executive Board
Dr Peter Stadelmann Erich Baumgärtner
Chief Executive Offi cer Chief Financial Offi cer
Peter Wiedemann Markus Paschmann
Chief Technical Offi cer Chief Sales Offi cer
Financial Report
Notes
Other notes on the Group Financial Statements
115rational Annual Report 2013

To the best of our knowledge, and in accordance with the
applicable reporting principles, the consolidated fi nancial
statements give a true and fair view of the assets, liabilities,
fi nancial position and profi t or loss of the group, and the
group management report includes a fair review of the devel-
opment and performance of the business and the position of
the group, together with a description of the principal oppor-
tunities and risks associated with the expected development
of the group.
Landsberg am Lech, 20 February 2014
rational ag
The Executive Board
Responsibility Statement
Dr Peter Stadelmann Erich Baumgärtner
Chief Executive Offi cer Chief Financial Offi cer
Peter Wiedemann Markus Paschmann
Chief Technical Offi cer Chief Sales Offi cer
116 Financial Report
Responsibility Statement

We have audited the consolidated fi nancial statements pre-
pared by the Parent Company rational Aktiengesellschaft ,
comprising the statement of fi nancial position, the state-
ment of comprehensive income, statement of changes in
equity, cash flow statement and the notes to the con-
solidated fi nancial statements, together with the group
management report for the business year from 1 January
to 31 December 2013. The preparation of the consolidated
fi nancial statements and the group management report
in accordance with ifrs, as adopted by the eu, and the
additional requirements of German commercial law pursu-
ant to section 315a (1) of the hgb (Handelsgesetzbuch:
German Commercial Code) is the responsibility of the Parent
Company’s Executive Board. Our responsibility is to express
an opinion on the consolidated fi nancial statements and on
the group management report based on our audit.
We conducted our audit of the consolidated fi nancial
statements in accordance with section 317 of the hgb
and German generally accepted standards for the audit
of fi nancial statements promulgated by the Institut der
Wirtschaft sprüfer (Institute of Public Auditors in Germany)
(idw). Those standards require that we plan and perform
the audit such that misstatements materially aff ecting the
presentation of the net assets, fi nancial position and results
of operations in the consolidated fi nancial statements in
accordance with the applicable fi nancial reporting frame-
work and in the group management report are detected
with reasonable assurance. Knowledge of the business
activities and the economic and legal environment of the
Group and expectations as to possible misstatements are
taken into account in the determination of audit procedures.
The eff ectiveness of the accounting-related internal control
system and the evidence supporting the disclosures in the
consolidated fi nancial statements and the group manage-
ment report are examined primarily on a test basis within
the framework of the audit. The audit includes assessing
the annual fi nancial statements of those entities included
in consolidation, the determination of the entities to be
included in consolidation, the accounting and consolida-
tion principles used and signifi cant estimates made by the
Executive Board, as well as evaluating the overall presenta-
tion of the consolidated fi nancial statements and the group
management report. We believe that our audit provides a
reasonable basis for our opinion.
Our audit has not led to any reservations.
In our opinion based on the fi ndings of our audit the con-
solidated fi nancial statements comply with ifrs as adopted
by the eu and the additional requirements of German
commercial law pursuant to section 315a (1) of the hgb and
give a true and fair view of the net assets, fi nancial posi-
tion and results of operations of the Group in accordance
with these requirements. The group management report is
consistent with the consolidated fi nancial statements and
as a whole provides a suitable view of the Group’s position
and suitably presents the opportunities and risks of future
development.
Munich, 20 February 2014
PricewaterhouseCoopers
Aktiengesellschaft
Wirtschaft sprüfungsgesellschaft
Dietmar Eglauer ppa. Stefan Rossmeisl
Wirtschaft sprüfer Wirtschaft sprüfer
(German Public Auditor) (German Public Auditor)
Auditor’s Report
117rational Annual Report 2013 Financial Report
Auditor’s Report

10-year Overview
2013 2012 2011 2010 2009 2008 2007 2006 2005 2004
Earnings situation
Sales m eur 461.1 435.0 391.7 350.1 314.4 343.0 336.6 283.7 246.4 221.8
Sales abroad % 87 86 85 84 83 84 84 84 83 84
Gross profi t m eur 280.7 261.7 234.4 217.0 191.6 203.7 199.9 173.8 149.7 131.5
ebitda m eur 135.5 129.5 109.5 112.6 98.1 90.4 97.9 84.8 71.2 57.9
Depreciation/Amortisation m eur 7.2 6.8 7.3 6.8 7.6 7.3 5.3 4.3 4.3 4.6
ebit m eur 128.3 122.7 102.2 105.8 90.5 83.1 92.6 80.5 66.9 53.3
Financial results m eur –0.6 –0.3 0.3 –0.2 –0.4 0.4 0.9 0.6 0.3 0.5
ebt m eur 127.7 122.4 102.5 105.6 90.1 83.5 93.5 81.1 67.2 53.9
Group earnings m eur 97.2 93.3 78.7 79.8 67.3 61.7 61.2 51.8 42.4 33.8
Earnings per share (undiluted) eur 8.55 8.20 6.93 7.02 5.92 5.42 5.38 4.55 3.73 2.98
Gross margin % 60.9 60.2 59.8 62.0 60.9 59.4 59.4 61.3 60.8 59.3
ebitda-margin % 29.4 29.8 28.0 32.2 31.2 26.4 29.1 29.9 28.9 26.1
ebit-margin % 27.8 28.2 26.1 30.2 28.8 24.2 27.5 28.4 27.2 24.0
ebt-margin % 27.7 28.1 26.2 30.2 28.7 24.4 27.8 28.6 27.3 24.3
Net margin % 21.1 21.4 20.1 22.8 21.4 18.0 18.2 18.3 17.2 15.2
Return on equity (aft er taxes) % 38.4 42.0 35.4 38.0 41.6 47.9 53.3 52.9 43.7 34.7
Return on invested capital (roic) % 34.6 38.4 33.2 33.9 35.5 40.7 48.0 49.6 40.4 32.1
Dividend* m eur 68.2 64.8 62.5 102.3 39.8 11.4 51.2 42.6 34.1 56.9
Dividend per share* eur 6.00 5.70 5.50 9.00 3.50 1.00 4.50 3.75 3.00 5.00
Asset situation
Fixed assets m eur 60.9 56.2 53.7 55.4 57.6 63.1 38.0 29.2 28.1 28.1
Current assets (including deferred tax assets
and other non-current assets) m eur 316.4 270.0 229.5 250.3 208.1 145.9 149.4 117.4 104.0 118.7
Inventories m eur 27.2 26.4 24.7 19.3 17.8 20.6 18.6 15.5 16.2 14.3
Trade accounts receivable m eur 75.9 65.9 71.7 58.7 51.4 57.7 61.4 53.1 46.1 36.7
Cash and cash equivalents
(including fi xed deposits) m eur 200.1 166.4 120.8 163.1 131.6 57.1 62.3 40.6 34.8 59.9
Balance sheet total m eur 377.3 326.2 283.2 305.7 265.7 209.0 187.4 146.6 132.1 146.8
Equity m eur 268.8 237.4 206.9 230.3 189.8 133.6 124.0 105.8 89.9 104.1
Liabilities m eur 108.5 88.8 76.3 75.4 75.9 75.4 63.4 40.8 42.2 42.7
Provisions
(including liabilities for current tax) m eur 41.6 34.4 25.7 28.2 24.0 22.1 19.7 21.8 21.3 22.0
Liabilities to banks m eur 34.4 25.3 19.0 21.3 31.6 25.8 18.0 – 2.5 2.2
Trade accounts payable m eur 12.0 10.5 10.1 9.2 7.0 10.9 9.3 6.8 5.4 5.8
Other liabilities m eur 20.5 18.6 21.5 16.7 13.3 16.6 16.4 12.2 13.0 12.7
Liabilities from fi nance leasing
agreements m eur 0.0 0.0 0.0 0.5 1.3 2.1 2.9 4.0 5.8 5.6
Other liabilities m eur 20.5 18.6 21.5 16.2 12.0 14.5 13.5 8.2 7.2 7.1
Equity ratio % 71.2 72.8 73.1 75.3 71.4 63.9 66.2 72.2 68.1 70.9
Debt ratio % 28.8 27.2 26.9 24.7 28.6 36.1 33.8 27.8 31.9 29.1
Equity-to-fi xed-assets ratio % 441.4 422.4 385.3 415.7 329.5 211.7 326.3 362.3 320.0 370.5
Invested capital (average) m eur 283.7 245.0 239.7 238.0 192.7 153.8 128.1 104.7 105.7 106.4
Working Capital (excluding liquid funds) m eur 78.9 69.8 73.4 58.2 54.7 60.7 61.7 58.4 53.0 41.0
as a percentage of sales % 17.1 16.0 18.7 16.6 17.4 17.7 18.3 20.6 21.5 18.5
Cash flow/Investments
Cash flow from operating activities m eur 102.8 111.4 67.7 86.9 83.2 71.0 61.1 49.1 32.8 39.2
Cash flow from investing activities m eur –27.5 –38.0 61.4 –23.4 –72.2 –38.4 –30.2 –1.8 –3.7 –4.6
Cash flow from fi nancing activities m eur –56.7 –57.2 –106.0 –52.2 –7.7 –45.4 –26.0 –38.4 –42.3 –37.3
Investments m eur 12.0 9.4 5.7 4.5 2.4 32.6 14.3 5.7 6.0 5.7
Employees
Number of employees (average) 1,320 1,258 1,184 1,058 1,031 1,090 965 864 792 742
Personnel expenses m eur 101.2 93.1 84.7 74.3 71.1 72.3 63.7 57.0 53.4 47.7
Sales per employee keur 349.3 345.8 330.8 330.9 304.9 314.6 348.8 328.4 311.1 298.9
* Payout in the following year, 2013 subject to approval by the General Meeting of Shareholders 2014
118 Further Information
10-year Overview

119Further Information
Financial Calender 2014
Contact
Contact
rational Aktiengesellschaft
Iglinger Strasse 62
86899 Landsberg am Lech
Germany
Erich Baumgärtner
Chief Financial Offi cer
Phone: +49 8191 327-209
Fax: +49 8191 327-272
E-Mail: [email protected]
Stefan Arnold
Head of Group Accounting/Investor Relations
Phone: +49 8191 327-2209
Fax: +49 8191 327-722209
E-Mail: [email protected]
Financial Calender 2014
Balance Sheet Press Conference
Fiscal Year 2013 Munich 20 Mar 2014
DVFA Analyst Meeting Frankfurt 20 Mar 2014
Financial fi gures Q1/2014 Landsberg 30 Apr 2014
General Shareholders Meeting 2014 Augsburg 30 Apr 2014
Financial fi gures Q2/2014 Landsberg 30 Jul 2014
Financial fi gures Q3/2014 Landsberg 29 Oct 2014
rational Annual Report 2013

120 Further Information
Imprint
Editor
rational Aktiengesellschaft
Iglinger Strasse 62
86899 Landsberg am Lech
Germany
Phone: +49 8191 327-0
E-Mail: [email protected]
Concept, design, text and realisation
Kirchhoff Consult ag, Hamburg, Germany
Printing
f&w Mediencenter GmbH, Kienberg, Germany
This report was published on 20 March 2014.
Imprint


rational ag
Iglinger Strasse 62
86899 Landsberg am Lech
Germany
Phone: +49 8191 327-0
Fax: +49 8191 327-272
www.rational-online.com