forecasting influenza outbreaks in boroughs and neighborhoods … · 2016-12-14 · use them in...
TRANSCRIPT

RESEARCH ARTICLE
Forecasting Influenza Outbreaks in
Boroughs and Neighborhoods of New York
City
Wan Yang1*, Donald R. Olson2, Jeffrey Shaman1
1 Department of Environmental Health Sciences, Mailman School of Public Health, Columbia University,
New York, New York, United States of America, 2 New York City Department of Health and Mental Hygiene,
New York, New York, United States of America
Abstract
The ideal spatial scale, or granularity, at which infectious disease incidence should be mon-
itored and forecast has been little explored. By identifying the optimal granularity for a given
disease and host population, and matching surveillance and prediction efforts to this scale,
response to emergent and recurrent outbreaks can be improved. Here we explore how
granularity and representation of spatial structure affect influenza forecast accuracy within
New York City. We develop network models at the borough and neighborhood levels, and
use them in conjunction with surveillance data and a data assimilation method to forecast
influenza activity. These forecasts are compared to an alternate system that predicts influ-
enza for each borough or neighborhood in isolation. At the borough scale, influenza epi-
demics are highly synchronous despite substantial differences in intensity, and inclusion of
network connectivity among boroughs generally improves forecast accuracy. At the neigh-
borhood scale, we observe much greater spatial heterogeneity among influenza outbreaks
including substantial differences in local outbreak timing and structure; however, inclusion
of the network model structure generally degrades forecast accuracy. One notable excep-
tion is that local outbreak onset, particularly when signal is modest, is better predicted with
the network model. These findings suggest that observation and forecast at sub-municipal
scales within New York City provides richer, more discriminant information on influenza
incidence, particularly at the neighborhood scale where greater heterogeneity exists, and
that the spatial spread of influenza among localities can be forecast.
Author Summary
Influenza, or the flu, causes significantmorbidity and mortality during both seasonal andpandemic outbreaks. Recently developed influenza forecast systems have the potential toaid public health planning for and mitigation of the burden of this disease. However, cur-rent forecasts are often generated at spatial scales (e.g. national level) that are coarser thanthe scales at which public health measures and interventions are implemented (e.g.
PLOS Computational Biology | DOI:10.1371/journal.pcbi.1005201 November 17, 2016 1 / 19
a11111
OPENACCESS
Citation: Yang W, Olson DR, Shaman J (2016)
Forecasting Influenza Outbreaks in Boroughs and
Neighborhoods of New York City. PLoS Comput
Biol 12(11): e1005201. doi:10.1371/journal.
pcbi.1005201
Editor: Justin Lessler, Johns Hopkins Bloomberg
School of Public Health, UNITED STATES
Received: May 5, 2016
Accepted: October 5, 2016
Published: November 17, 2016
Copyright: This is an open access article, free of all
copyright, and may be freely reproduced,
distributed, transmitted, modified, built upon, or
otherwise used by anyone for any lawful purpose.
The work is made available under the Creative
Commons CC0 public domain dedication.
Data Availability Statement: The ILI syndrome ED
data used for the forecasts are subject to
restrictions and used under permission from the
New York City Department of Health and Mental
Hygiene. Data at the borough level are publicly
available from https://a816-healthpsi.nyc.gov/
epiquery/Syndromic/index.html
Funding: This work was supported by US NIH
grants GM100467, GM110748, and ES009089,
and Defense Threat Reduction Agency contract
HDTRA1-15-C-0018. The funders had no role in
study design, data collection and analysis, decision
to publish, or preparation of the manuscript.
community level). Here we build and test influenza forecast systems at county and com-munity levels, which either include spatial connectivity among locations or are run in iso-lation. We test these four flu forecast systems (i.e. 2 models × 2 spatial scales) using datacollected from 2008 to 2013, including the 2009 pandemic, for the five boroughs (corre-sponding to county level) and 42 neighborhoods (corresponding to community level) inNew York City. We compare the performance of the four forecast systems in predictingthe onset, duration, and intensity of flu outbreaks and found that the performance variedby spatial scale (borough vs. neighborhood), season (non-pandemic vs. pandemic) andmetric (onset, duration, and intensity). In general, the inclusion of spatial network connec-tivity in the forecast model improves forecast accuracy at the borough scale but degradesaccuracy at the neighborhood scale.
Introduction
Each year, influenza epidemics in the U.S. lead to between 3,000 and 49,000 deaths and cost anestimated $87 billion [1,2]. These significant costs motivate development of forecast systems topredict the epidemic growth of this disease to aid the implementation of more proactive coun-termeasures. Recent efforts have developed a number of forecast systems for predicting influ-enza epidemics [3–9]. The skill of each of these systems depends on a number of factors,including: (1) the accuracy and richness of available observational data; (2) the ability of thediseasemodel to capture disease dynamics (should a diseasemodel be part of the forecast sys-tem); and (3) the effectiveness of the statistical method used to estimate the data and/or modelepidemic features prior to forecast (either statistical characteristics of the epidemic curve oroptimizedmodel state-space). Addressing the last factor, our previous work [10] compared theperformance of six statistical methods—three ensemble filters and three particle type filters—for the forecast of seasonal influenza epidemics in the US, using the same influenza epidemicmodel, and revealed key differences among those methods. The model employed for that studydepicted influenza transmission dynamics at the municipal scale and had no spatial compo-nent. Here we examine whether the inclusion of spatial dynamics improves influenza forecast.In addition, the effect of observation scale, i.e. granularity, on forecast performance is alsoexplored.
Mechanistic models used for disease forecast systems fall into two general categories—com-partmental and agent based. Compartmental diseasemodels divide a population into differentgroups (e.g., susceptible, infected, and removed) according to relevant disease states and applya set of ordinary differential equations to compute the flow of simulated people among thosecompartments. In contrast, agent basedmodels simulate the activity and infection state of indi-viduals within a synthetic population based on prescribed schemes of individual behaviors andinteractions.While agent basedmodels are more computationally expensive and their modelcomplexity limits their generalizability, compartmental models are often criticized for oversim-plifying system dynamics. In particular, compartmental models assume that the entire popula-tion (e.g. a country, state, or city) is perfectlymixed; however, even within a city there may beconsiderable spatial heterogeneity leading to differing disease dynamics at different sub-popu-lations and locations.
Such heterogeneities are evident in S1 Movie, which shows how influenza-like illness (ILI)incidence, as estimated by syndromic surveillance [11], varies in space and time in the 42neighborhoodsof New York City (NYC). Both epidemic intensity and timing differ consider-ably among the neighborhoods, as disease dynamics are likely driven by both local
Forecasting Influenza Outbreaks in Boroughs and Neighborhoods of New York City
PLOS Computational Biology | DOI:10.1371/journal.pcbi.1005201 November 17, 2016 2 / 19
Competing Interests: JS discloses partial
ownership of SK Analytics. The authors report no
other potential conflicts of interest.

transmission and inter-locale interaction. Indeed, past studies have shown that commuterflows contribute to the between-state progression of interpandemic influenza epidemics in theUS and drive the spatial synchrony among states [12]. As such, the ability of a model to capturespatial connectivity could be an important factor for developing accurate predictive models, ashas been demonstrated for a number of infectious diseases [13].
In this study, we investigate how the inclusion of spatial heterogeneity affects the accuracyof influenza forecast for different geospatial scales. Specifically, we address two questions: (1) atwhat spatial scale (i.e. granularity) of simulation does inclusion of spatial connection improveforecast performance; and (2) whether forecast performance differs between interpandemicand pandemic seasons given the differing transmissibility of influenza strains. To address thesequestions, we build a forecast system using a patch network epidemic model [14], in conjunc-tion with the ensemble adjustment Kalman filter (EAKF) [15]. The patch networkmodel incor-porates spatial connectivity among subpopulations, and each subpopulation is describedby acompartmental model. The EAKF data assimilation method is used to optimize the modelprior to generating a forecast.
Previous studies have suggested that the product of the ILI consultation rate and laboratory-confirmed influenza positive rate, termed ILI+, provides a more accurate measure of influenzaactivity and allows more accurate prediction of influenza epidemics [16,17]. Here we test ournetwork forecast system at borough and neighborhood spatial resolutions using ILI+ data col-lected in NYC from January 2008 to September 2013, including the 2009 pandemic. For eachspatial scale, we report the performance of this network model forecast system in comparisonto forecasts run in isolation for each locality (referred to as the “isolation” model hereafter).
Materials and Methods
Data
Influenza-like illness (ILI) data were collectedby the emergency department (ED) syndromic sur-veillance system of the New York City Department of Health andMental Hygiene (DOHMH)[11]. This dataset includes weekly ILI syndrome ED visit counts and all-cause ED visit counts atthe patient zip-code level, from the week ending 1/12/2008 to the week ending 9/21/2013. ILI syn-drome ED visits were defined for patient chief complaints containing a mention of fever andcough, fever and sore throat, or an influenza term [11], analogous to the traditional surveillancedefinition of ILI as patient presentation with fever�37.8°C, a cough or sore throat without aknown cause other than influenza [18]. In Staten Island, one of the five NYC boroughs, the major-ity of ILI syndrome ED visits were recorded only when a visit resulted in hospitalization; as such,ILI syndrome ED visit counts in Staten Island are biased low relative to other boroughs.
As these ILI counts are sparse for each zip-code area, we aggregated the ILI data by boroughas well as by United Hospital Fund (UHF) neighborhood,which are similar to communityplanning district boundaries, and each contain approximately 200,000 people. During thestudy period, there were 42 UHF neighborhoods in NYC [19]. ILI proportions were calculatedas ILI syndrome ED visits divided by total ED visits. Because ILI may include diseases otherthan influenza, we multiplied the neighborhoodor borough ILI proportions by the influenzavirus isolation rates for the same week to obtain a more specificmeasure for influenza (termedILI+) [16,17]. Influenza virus isolation rates were provided by theWorld Health Organizationand National Respiratory and Enteric Virus Surveillance System (WHO-NREVSS) for Healthand Human Service (HHS) Region 2, which includes NYC [20].
The ILI+ time series here include three full inter-pandemic seasons (i.e. fromWeek 40 toWeek 20 of the next year for seasons 2010–11, 2011–12, and 2012–13), two half seasons (datafor the 2007–08 season beginningWeek 2 of 2008 and for the 2008–09 season truncated at
Forecasting Influenza Outbreaks in Boroughs and Neighborhoods of New York City
PLOS Computational Biology | DOI:10.1371/journal.pcbi.1005201 November 17, 2016 3 / 19
Week 16 of 2009 due to the pandemic), and two pandemic waves (Weeks 14–33 in 2009 for thespring wave andWeek 31 in 2009 throughWeek 20 in 2010 for the fall wave). Note the mainepidemic course was captured for both of the two half seasons.
SIRS-network model
In our previous studies, we used a humidity forced susceptible-infected-removed-susceptible(SIRS) model to simulate the transmission of influenza in US cities [4,10,17,21]. Here we usedthe same model for simulations in individual boroughs or neighborhoods.The network modelincludes transmission of influenza within individual locales (either boroughs or neighbor-hoods) per the humidity forced SIRS model and inter-locale transmission per a gravity typemodel. Specifically, the network-SIRSmodel is describedby the following equations:
dSi
dt¼
Ni � Si � IiL
� Si
Xn
j
bjðtÞcjibI j
bNj
� a ð1Þ
dIidt¼ Si
Xn
j
bjðtÞcjibI j
bNj
þ a �IiD
ð2Þ
where Si, Ii and Ni are, respectively, the numbers of susceptible, infected, and total residents inlocale i; n is the total number of locales (5 for the borough-levelmodel and 42 for the neighbor-hood-levelmodel in this study); α is transmission from outside the network domain and isnominally set to 1 per 10 days for all locales;D is the infectious period and L is the immuneperiod; cji is the proportion of residents of locale i visiting locale j (given in detail below); bNi isthe number of people present in locale i (i.e. including local residents and visitors) and is calcu-
lated as bNi ¼Xj¼n
j¼1cijNj. Similarly, bI i is the number of infected people present in locale i. For
influenza, viral shedding can start before symptom onset and even after symptom onset, peoplemay continue to travel (e.g. to work); in addition, asymptomatic infection is common [22–24].Consequently, we assumed that those infected have the same mobility as others and calculatedbI i asbI i ¼
Xj¼n
j¼1cijIj.
The basic reproductive number at time t, R0(t), is computed using a humidity forcing func-tion [4]:
R0ðtÞ ¼ e� 180qðtÞðR0max � R0minÞ þ R0min ð3Þ
with q(t) as the specific humidity at time t, and R0max and R0min as the maximum and mini-mum daily basic reproductive number. The same R0(t) values were used for all locales of NYC,as the spatial variability of daily humidity is not great across the city, particularly relative tosynoptic and seasonal fluctuations. Further, as daily specific humidity is not available for real-time forecast, we instead used daily climatological specific humidity averaged over 1979–2002[17,25], which captures the average seasonal cycle, both duringmodel optimization andforecast.
R0 is linked to the transmission rate, β, through the expression β(t) = R0(t)/D. To accountfor potential differences in transmission rates among locales (e.g. due to differences in mixingpatterns), we multiplied the citywide value by an adjustment factor, fi for the ith locale, to com-pute the locale-specific transmission rate βi = fi β(t).
In NYC, working commuters comprise the main flow of population among boroughs, andthis flow changes over time [26]. Accordingly, we formulated the connections between
Forecasting Influenza Outbreaks in Boroughs and Neighborhoods of New York City
PLOS Computational Biology | DOI:10.1371/journal.pcbi.1005201 November 17, 2016 4 / 19
locations based on commuter flow patterns. Commuter flows are much lower at night on week-days as well as during the weekend [26]; therefore, for these low-flow time periods, we set cij to0 (for all i6¼j) and cii to 1, which reduces the network model to a simple SIRS construct for eachlocale. During weekday daytime whenmass work commute is in effect, we computed cij usingthe following formula:
cij ¼pt1i pt2
j =drij
Xi¼n
i¼1
pt1i pt2
j =dr
ij
ð4Þ
where pi is the population density in locale i; dij is the distance between locales i and j (i6¼j); fori = j, i.e. within localemobility, dii is calculated as
ffiffiffiffiffiffiffiffiffiffiffiffiffiffiffiffiffiffiffiffiffiffiffiffiffiffiffiffiffiffiffiffiffiffiffiffiffiffiðArea of locale iÞ=p
p, a proxy of the radius
for locale i; the exponents τ1, τ2, and ρ together determine the connectivity between any twolocales [12,27].
In the network model, the distances (dij’s), population sizes and densities for the NYC bor-oughs and neighborhoods are computed based on data from [28,29]. The state variables Si andIi (i = 1 to 5 for borough-level simulation or 1 to 42 for neighborhood-level), the citywideparametersD, L, R0max, R0min, τ1, τ2, and ρ, as well as locale-specificparameters fi (the adjustingfactor used to calculate βi for each borough or neighborhood)were estimated by the ensembleadjustment Kalman filter (EAKF) as described below.
Mapping ILI+ measures to model simulated influenza incidence rates
As described in the Data section above, the ILI+ observationswere measured as the propor-tions of ILI+ ED consultations among all-cause ED consultations. It is thus not a measure ofper capita incidence rate, as simulated by the model. To compute the model-counterpart ofILI+, dILIþ , we divided the model-simulated incidence rate by a scaling factor γ. This scalingfactor represents the relative likelihood a person seeks medical attention for any cause to thatfor influenza infection and achieves the conversion per Bayes’ theorem; the scaling factor wasestimated by the EAKF in this study. For detailed derivation of this conversion, please refer to[17,21].
Network-SIRS-EAKF forecast system
In our influenza forecast system, the dynamic model is optimized prior to the generation of aforecast. This optimization, or ‘training’, process is performed using the EAKF [15], a dataassimilation method. In practice, an ensemble of model simulations (m = 500 in this study) isinitialized at the beginning of an integration (see details below); the model ensemble is thennumerically integrated forward per the network-SIRSmodel equations to compute dILIþ , themodel estimate of ILI+ for the first week (i.e. the prior); the dILIþ prior is then updated usingthe first observed ILI+ per the EAKF algorithm. Specifically, the mean of the observedvariableensemble, �xk;post , is first updated using the following formula:
�xk;post ¼s2
k;obs
s2k;obs þ s2
k;prior�xk;prior þ
s2k;prior
s2k;obs þ s2
k;priorzk ð5Þ
where the subscript k denotes week, and obs, prior, and post, denote the observation, prior andposterior, respectively; z is the observedweekly incidence, i.e. ILI+ in this study; x is theobservedvariable, i.e., dILIþ ; �xk;post and �xk;prior are, respectively, the posterior and prior ensemblemean; σ2 is variance. Each ensemble member, xm
k;post , is then adjusted towards the ensemble
Forecasting Influenza Outbreaks in Boroughs and Neighborhoods of New York City
PLOS Computational Biology | DOI:10.1371/journal.pcbi.1005201 November 17, 2016 5 / 19
mean as follows:
xmk;post ¼ �xk;post þ
ffiffiffiffiffiffiffiffiffiffiffiffiffiffiffiffiffiffiffiffiffiffiffiffiffiffis2
k;obs
s2k;obs þ s2
k;prior
s
ðxmk;prior � �xk;priorÞ ð6Þ
Further, all unobserved state variables and parameters are updated according to their co-variability with the observed state variable [30]. After the update, the ensemble is integrated tothe end of Week 2 and then is updated again using theWeek 2 observation of ILI+. This pre-diction-update filtering process is repeated up to the last observation prior to the generation offorecast. In so doing, the EAKF recursively optimizes the model system to obtain more truthfulestimates of model states and parameters. Following any weekly update, a forecast can be gen-erated by integrating the optimized ensemble of model simulations, i.e. the posterior, to theend of the influenza season.
The model-filter system was initialized by assigning the model variables and parameterswith values randomly drawn from the following distributions: Si~Unif [30%Ni, 100%Ni];Ii~Norm (ILI+ for locale i at Week 1, 9s2
1;obs), with negative numbers reset to 0;D~Unif [1.5, 7]in days; L~Unif [200, 3650] in days; R0max~Unif [1.3, 4]; R0min~Unif [0.8, 1.2]; fi~Unif[0.8, 1.2]; γ~Unif [3.3, 10] for locales in Staten Island, where only hospitalized ILI ED visitswere recorded and γ~Unif [1.7, 3.3] for all other locales; τ1~Unif [1, 2]; τ2~Unif [0.2, 1]; andρ~Unif [2, 8]. The model (either SIRS or SIRS-network) was numerically integrated forwardusing a 1-day time step; all parameters were specified on a daily time-scale and updated weeklythrough the EAKF data assimilation process.
The system was run discontinuously for each flu season, i.e., the system was initialized atthe beginning of each season and “trained” using observations for the current season up to theweek of forecast. For all interpandemic seasons but 2007–08, this initialization occurred atWeek 40; the incomplete 2007–08 season was initialized at Week 2; the pandemic waves wereinitializedwhen influenza transmission occurred out-of-season. Once the first 4 weeks ofobservations had been assimilated, forecasts were generated weekly until the end of the season(i.e. Week 20 of the next year for interpandemic seasons or four weeks prior to the last observa-tion for the 2008–09 season and the spring pandemic wave). To account for stochasticity inmodel initialization, 20 separate ensemble simulations were initialized and used to generateweekly forecasts for each season.
Baseline forecast
For comparison, we developed an additional set of forecasts using an analogmethod as baseline.Briefly, the Pearson correlation coefficientsbetween the ILI+ time series for the current season upto latest observationand the same periodof each historical seasonwere computed. These correla-tion coefficients represent the similarity in epidemic timing and intensity between the current sea-son and historical seasons. A prediction of ILI+ for the remainder of the seasonwas thencomputed as the weighted average of the historical time series that correlated positively with thecurrent season (weights are proportional to the correlation coefficients and summed to 1). For real-time forecast, only available historical record can be used; however, as our study period includedonly seven outbreaks, here we used records for all seven outbreaks to generate the forecasts, regard-less of temporal sequence.Due to the small number of locales at the borough scale (i.e. 5) and out-breaks (i.e. 7), we performed this comparison only at the UHF neighborhoodscale (i.e. 42 in total).We developed the weighted average in two ways—one using historical records for the same neigh-borhood (corresponding to the “isolation” model for the EAKF forecasts) and one using recordsfrom all neighborhoods (corresponding to the networkmodel for the EAKF forecasts).
Forecasting Influenza Outbreaks in Boroughs and Neighborhoods of New York City
PLOS Computational Biology | DOI:10.1371/journal.pcbi.1005201 November 17, 2016 6 / 19
Forecast evaluation
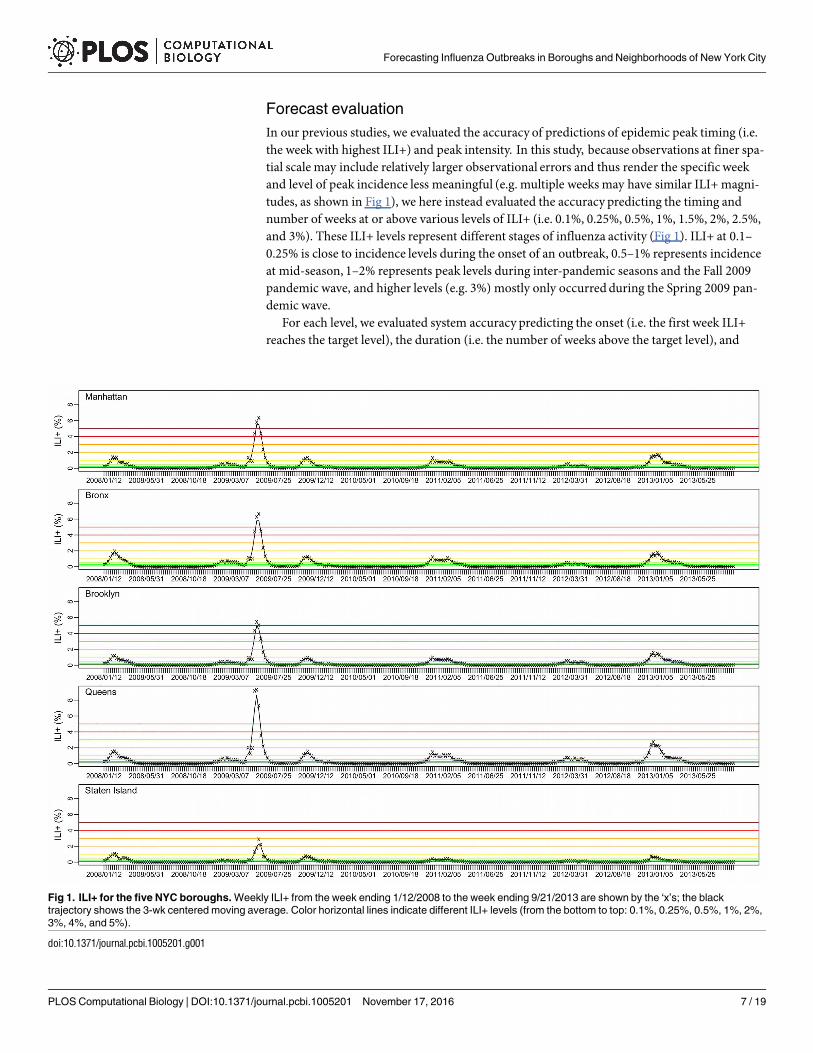
In our previous studies, we evaluated the accuracy of predictions of epidemic peak timing (i.e.the week with highest ILI+) and peak intensity. In this study, because observations at finer spa-tial scale may include relatively larger observational errors and thus render the specific weekand level of peak incidence less meaningful (e.g. multiple weeks may have similar ILI+magni-tudes, as shown in Fig 1), we here instead evaluated the accuracy predicting the timing andnumber of weeks at or above various levels of ILI+ (i.e. 0.1%, 0.25%, 0.5%, 1%, 1.5%, 2%, 2.5%,and 3%). These ILI+ levels represent different stages of influenza activity (Fig 1). ILI+ at 0.1–0.25% is close to incidence levels during the onset of an outbreak, 0.5–1% represents incidenceat mid-season, 1–2% represents peak levels during inter-pandemic seasons and the Fall 2009pandemic wave, and higher levels (e.g. 3%) mostly only occurredduring the Spring 2009 pan-demic wave.
For each level, we evaluated system accuracy predicting the onset (i.e. the first week ILI+reaches the target level), the duration (i.e. the number of weeks above the target level), and
Fig 1. ILI+ for the five NYC boroughs. Weekly ILI+ from the week ending 1/12/2008 to the week ending 9/21/2013 are shown by the ‘x’s; the black
trajectory shows the 3-wk centered moving average. Color horizontal lines indicate different ILI+ levels (from the bottom to top: 0.1%, 0.25%, 0.5%, 1%, 2%,
3%, 4%, and 5%).
doi:10.1371/journal.pcbi.1005201.g001
Forecasting Influenza Outbreaks in Boroughs and Neighborhoods of New York City
PLOS Computational Biology | DOI:10.1371/journal.pcbi.1005201 November 17, 2016 7 / 19
cumulative ILI+ over the duration. To account for observational noise in the data, we com-puted the 3-week centered moving average for each ILI+ time series and used those movingaverages to evaluate the forecasts (referred to as reference hereafter), rather than use the rawILI+ observations. For onset, a forecast within ±1 week of the reference onset was deemedaccurate; for duration, a forecast with a predicted onset within ±1 week of the reference onsetand a predicted duration within ±2 weeks of the reference duration was deemed accurate; forcumulative ILI+, a forecast with a predicted onset within ±1 week of the reference onset and apredicted ILI+ sum over the predicted duration within ±20% of the reference value was deemedaccurate. Note that the evaluation of duration and cumulative ILI+ takes into account the pre-dicted epidemic timing, in addition to the time span or magnitude; for instance, a forecast witha predicted onset at Week 1 and a predicted duration of 10 weeks will be deemed inaccurate ifthe observed epidemic started fromWeek 3 and lasted 10 weeks.
These new forecast metrics will provide users (e.g. public health officials) additional infor-mation on the progression of an epidemic that we believemay be more relevant for planning atthe local scale. For each metric, we focus our evaluation at shorter leads from 5 weeks (i.e. theevent is predicted to occur 5 weeks ahead of the forecast week) to -5 weeks (i.e. the event is pre-dicted to have passed 5 weeks prior to the forecast week). Note forecast accuracy at negativeleads is important as well, as it indicates the forecast system is not generating false predictions.
Results
Spatial temporal characteristics of influenza activity within New York
City
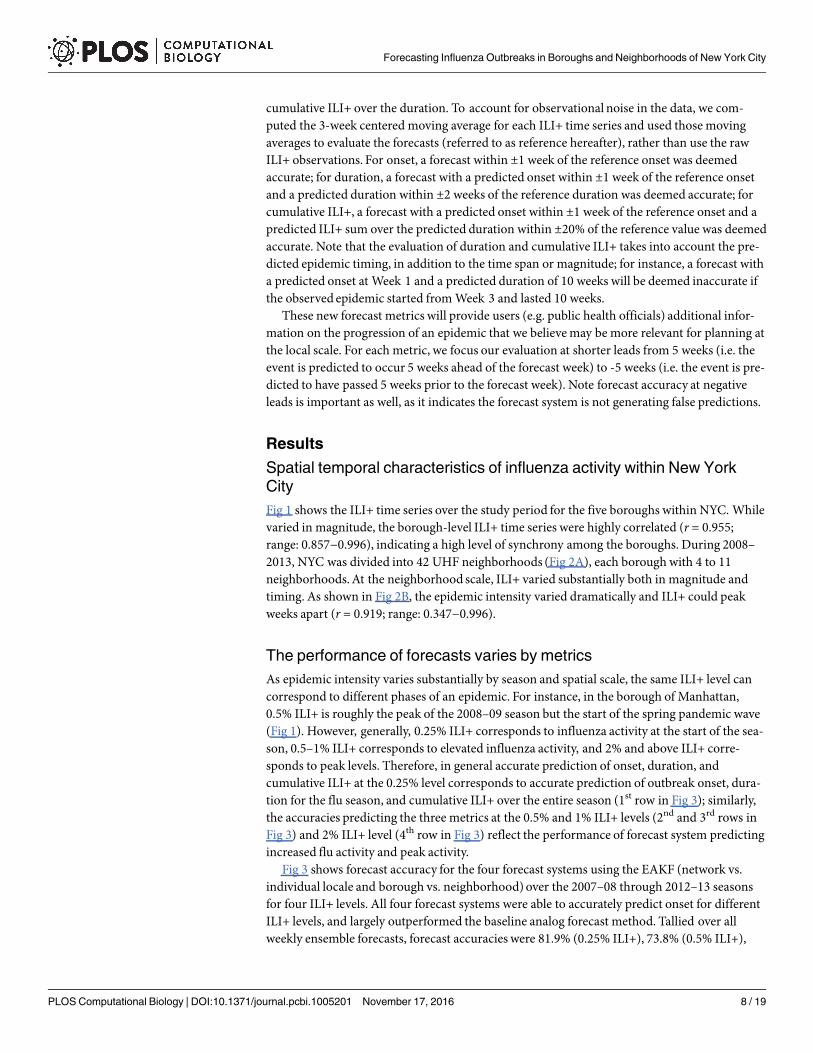
Fig 1 shows the ILI+ time series over the study period for the five boroughs within NYC. Whilevaried in magnitude, the borough-level ILI+ time series were highly correlated (r = 0.955;range: 0.857−0.996), indicating a high level of synchrony among the boroughs. During 2008–2013, NYC was divided into 42 UHF neighborhoods (Fig 2A), each borough with 4 to 11neighborhoods.At the neighborhood scale, ILI+ varied substantially both in magnitude andtiming. As shown in Fig 2B, the epidemic intensity varied dramatically and ILI+ could peakweeks apart (r = 0.919; range: 0.347−0.996).
The performance of forecasts varies by metrics
As epidemic intensity varies substantially by season and spatial scale, the same ILI+ level cancorrespond to different phases of an epidemic. For instance, in the borough of Manhattan,0.5% ILI+ is roughly the peak of the 2008–09 season but the start of the spring pandemic wave(Fig 1). However, generally, 0.25% ILI+ corresponds to influenza activity at the start of the sea-son, 0.5–1% ILI+ corresponds to elevated influenza activity, and 2% and above ILI+ corre-sponds to peak levels. Therefore, in general accurate prediction of onset, duration, andcumulative ILI+ at the 0.25% level corresponds to accurate prediction of outbreak onset, dura-tion for the flu season, and cumulative ILI+ over the entire season (1st row in Fig 3); similarly,the accuracies predicting the three metrics at the 0.5% and 1% ILI+ levels (2nd and 3rd rows inFig 3) and 2% ILI+ level (4th row in Fig 3) reflect the performance of forecast system predictingincreased flu activity and peak activity.
Fig 3 shows forecast accuracy for the four forecast systems using the EAKF (network vs.individual locale and borough vs. neighborhood)over the 2007–08 through 2012–13 seasonsfor four ILI+ levels. All four forecast systems were able to accurately predict onset for differentILI+ levels, and largely outperformed the baseline analog forecast method. Tallied over allweekly ensemble forecasts, forecast accuracies were 81.9% (0.25% ILI+), 73.8% (0.5% ILI+),
Forecasting Influenza Outbreaks in Boroughs and Neighborhoods of New York City
PLOS Computational Biology | DOI:10.1371/journal.pcbi.1005201 November 17, 2016 8 / 19
55.3% (1% ILI+), and 28.5% (2% ILI+) 1 week prior to the predicted onset (i.e. 1 week lead),increased to 97.3%, 91.9%, 86.0%, and 84.9%, respectively, for the four ILI+ levels at 0 lead, andstayed at similar high accuracies at negative leads (i.e. when the onset is predicted to be in thepast).
In comparison, forecast accuracy for duration at each level was lower, specifically, with43.8% (0.25% ILI+), 49.3% (0.5% ILI+), 71.2% (1% ILI+), and 77.1% (2% ILI+) of forecastsaccurate at the week the epidemic was predicted to have reached the midpoint of the time-interval ILI+ was above the target level (i.e. 0 lead). Such lower accuracies are not surprising asprediction of duration depends on the ability to predict both the onset and the end point abovea given ILI+ level; prediction of the end point is challenging, in particular for low ILI+ levels(e.g., 0.25%) for which the duration could last over 20 weeks (S1 Fig). For the two higherILI+ levels (i.e. 1% and 2%), for which the outbreak duration tended to be shorter, accuracieswere much higher. However, forecast accuracy at all levels improved over time and reached64.9%, 77.8%, 82.7%, and 84.9% for the four ILI+ levels 5 weeks after the predictedmidpointfor the corresponding ILI+ level, which for many localities and seasons was still in advance ofthe end of the outbreak.
Fig 2. Spatial structure and heterogeneity of ILI+ within New York City. (A) NYC UHF neighborhoods. Borough boundaries are shown in black and UHF
neighborhood boundaries are shown in grey. (B) ILI+ intensity relative to the seasonal maximum. Relative ILI+ is computed as the local ILI+ divided by the
maximal ILI+ among all neighborhoods for each season/pandemic wave. Each colored square shows relative ILI+ for each UHF neighborhood (x-axis) in
each week of the study period (y-axis). Vertical dashed black lines indicate borough divisions.
doi:10.1371/journal.pcbi.1005201.g002
Forecasting Influenza Outbreaks in Boroughs and Neighborhoods of New York City
PLOS Computational Biology | DOI:10.1371/journal.pcbi.1005201 November 17, 2016 9 / 19

Fig 3. Comparison of forecast accuracy among forecast systems. The six lines in each panel show forecasts made using the borough-level network
model and the EAKF (solid red line), the borough-level isolation model and the EAKF (dashed red line), the neighborhood-level network model and the EAKF
(solid blue line), the neighborhood-level isolation model and the EAKF (dashed blue line), the baseline analog model with historical records from all localities
(solid green line), and the baseline analog model with local historical records (dashed green line). Each row shows the forecast accuracy for different
epidemic intensity levels (i.e. 0.25%, 0.5%, 1%, and 2% ILI+) at different leads (x-axis); each column shows the accuracy predicting onset, duration, and
cumulative incidence. For onset predictions, the leads are relative to the predicted onset, e.g., 5 weeks in the future (lead = 5), or 5 weeks in the past (lead =
−5); for duration or cumulative incidence predictions, the leads are relative to the midpoint of predicted onset and ending. For onset, a predicted value within
±1 week of observed onset was deemed accurate; for duration, a prediction with an onset within ±1 week of observed onset and a duration within ±2 week of
observed duration was deemed accurate; for cumulative incidence, a prediction with an onset within ±1 week of observed onset and cumulative incidence
over the predicted duration within ±20% of observed cumulative incidence was deemed accurate.
doi:10.1371/journal.pcbi.1005201.g003
Forecasting Influenza Outbreaks in Boroughs and Neighborhoods of New York City
PLOS Computational Biology | DOI:10.1371/journal.pcbi.1005201 November 17, 2016 10 / 19
Similarly, forecast accuracy for cumulative ILI+ was lower than for onset. Forecasts ofcumulative ILI+ for the duration above a given level had accuracies of 54.18% (0.25% ILI+),44.8% (0.5% ILI+), 41.3% (1% ILI+), and 40.8% (2% ILI+) at the week the epidemic was pre-dicted to have reached the midpoint of time above target ILI+ level (i.e. 0 lead). These accura-cies increased steadily over time and reached 80.1%, 76.2%, 63.0%, 63.9%, respectively, for thefour ILI+ levels 5 weeks after the predictedmidpoint.
The impact of spatial connection on forecast performance varies by
spatial scale
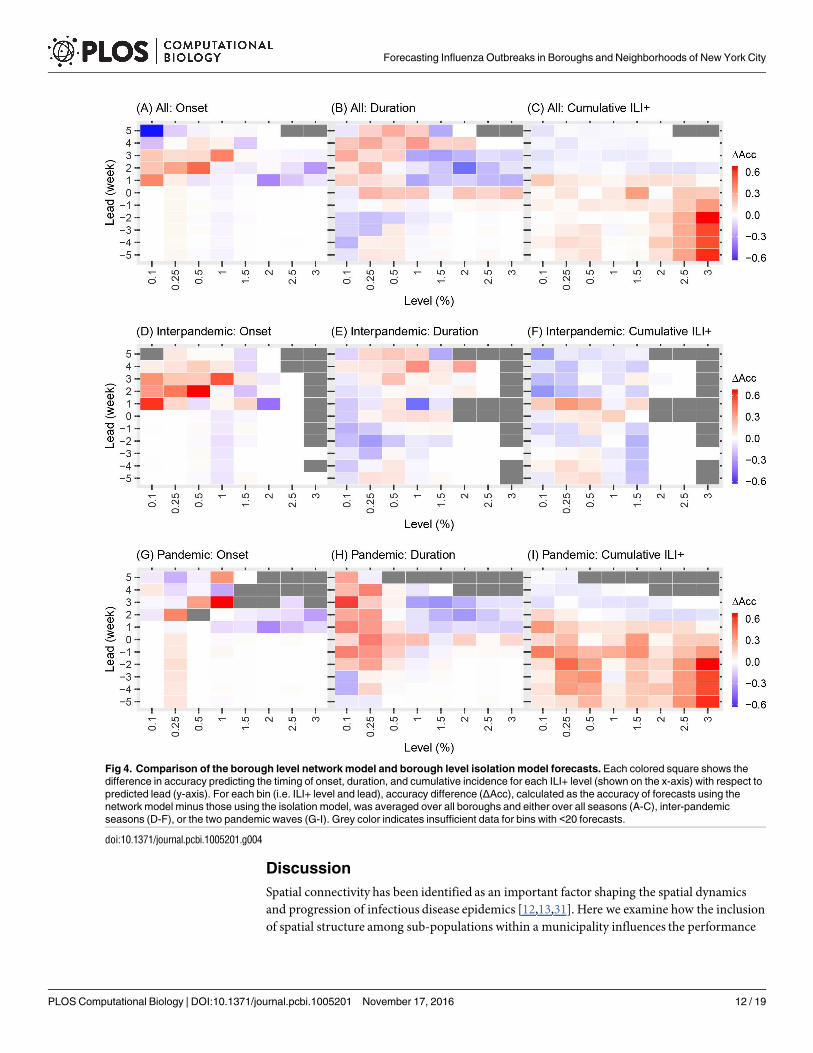
The network model was better than the isolation model for generating accurate lead predic-tions of onset at lower ILI+ levels (Fig 3 first column and red regions in Fig 4A and 4D and Fig5A and 5D) at both spatial scales. Inclusion of network structure at the borough level signifi-cantly improved forecast accuracy for onset (1.8% higher than those by the forecasts in isola-tion over all seasons, paired t-test, P = 1.92e-7; Table 1) and cumulative ILI+ (1.8% higher,paired t-test, P = 0.018) and slightly improved the accuracy for duration (0.9% higher, paired t-test, P = 0.116).
The differences in forecast accuracy at borough scale over different leads are further demon-strated in Fig 4. Tallied over all seasons, prospective forecasts (i.e. positive leads) for onset andduration at lower ILI+ levels (0.1–1%) generated by the borough network model forecast sys-tem were more accurate than those generated by the isolation model forecast system (the redregions in Fig 4A and 4B). However, for higher ILI+ levels (1.5–3%), the isolation model fore-cast system outperformed the network version (blue regions in Fig 4A and 4B). For forecasts ofcumulative ILI+ at all levels evaluated, the borough network model forecast system was moreaccurate at -5 to 1 week leads while the isolation model forecast system was more accurate at 2to 5 week leads (Fig 4C).
In contrast, the inclusion of network structure at the neighborhood scale in the epidemicmodel significantly reduced forecast accuracy for most leads and metrics (Fig 5 and Table 1).The main improvement facilitated by inclusion of the network connection among neighbor-hoods was seen for prospective prediction of onset at the 0.1–1% ILI+ levels (the red region inFig 5A).
The impact of spatial connectivity on forecast accuracy differs between
interpandemic and pandemic seasons
We additionally examined how the inclusion of network structure in the model affects forecastaccuracy during interpandemic seasons and the two pandemic waves. While the inclusion ofnetwork structure at the borough scale substantially improved forecast accuracy for duration(8.3%; confidence interval: [5.6%, 11.1%], at -5 to 5 week leads, Table 1 and S2 Fig) and cumu-lative ILI+ (13.7% [10.5%, 16.9%] at -5 to 5 week leads) during the two pandemic waves, itdegraded forecast accuracy for these two metrics during interpandemic seasons (-3.6% [-5.2%,-2.0%] and -5.4% [-7.2%, -3.6%] at -5 to 5 week leads, respectively). In addition, at the boroughscale, the network model consistently outperformed the isolation model when predicting onsetduring both the interpandemic seasons and the two pandemic waves. At the neighborhoodscale, the inclusion of network connection significantly improved forecast accuracy for the tim-ing of onset during interpandemic seasons (7.4% [6.8%, 8.0%] at -5 to 5 week leads and 13.9%[12.8%, 14.9%] at 0 to 5 week leads, Table 1 and S2 Fig), despite its generally inferior perfor-mance in most other instances (Table 1 and S2J–S2R Fig).
Forecasting Influenza Outbreaks in Boroughs and Neighborhoods of New York City
PLOS Computational Biology | DOI:10.1371/journal.pcbi.1005201 November 17, 2016 11 / 19
Discussion
Spatial connectivity has been identified as an important factor shaping the spatial dynamicsand progression of infectious disease epidemics [12,13,31]. Here we examine how the inclusionof spatial structure among sub-populations within a municipality influences the performance
Fig 4. Comparison of the borough level network model and borough level isolation model forecasts. Each colored square shows the
difference in accuracy predicting the timing of onset, duration, and cumulative incidence for each ILI+ level (shown on the x-axis) with respect to
predicted lead (y-axis). For each bin (i.e. ILI+ level and lead), accuracy difference (ΔAcc), calculated as the accuracy of forecasts using the
network model minus those using the isolation model, was averaged over all boroughs and either over all seasons (A-C), inter-pandemic
seasons (D-F), or the two pandemic waves (G-I). Grey color indicates insufficient data for bins with <20 forecasts.
doi:10.1371/journal.pcbi.1005201.g004
Forecasting Influenza Outbreaks in Boroughs and Neighborhoods of New York City
PLOS Computational Biology | DOI:10.1371/journal.pcbi.1005201 November 17, 2016 12 / 19
of an influenza forecast system.We applied a patch network model in conjunction with theensemble adjustment Kalman filter (EAKF), and weekly ILI+ observations at both the boroughand neighborhood levels in NYC and forecast both seasonal and pandemic influenza outbreaksat those two granularities.
The network connection in our forecast system was formulated as a combination of thegravity model [12] and the radiation model [32] (seeMethods). In essence, this network con-nectionmodel computes the raw connections between sub-region pairs (e.g. between bor-oughs) using a gravity-type formula and further normalizes these raw quantities over the entireregion (i.e. all of NYC), which resembles the radiation model. In previous work, we applied thisnetwork connectionmodel to sub-regions delineated by population size and area, and used itto compute the spatial connection and infer the transmission network of the 2014–2015 Ebolaepidemic in Sierra Leone [14]. Here, we used population density instead of population size asmodel input. This choice was motivated by the high variability of population density withinNYC. For example, population density in Manhattan, the borough that attracts the largestnumber of commuters [26], is 2.58 times of the city average, even though its residents onlymake up 19.4% of the city’s population. Using this configuration, our model was able to gener-ate commuter flows similar to those revealed in census data [26] for the majority of boroughs.To test further the impact of potential misrepresentation of the network connectivity, we usedcommuter census data for the five boroughs in NYC [26] to configure the network connectionsin the forecast system (see Supplementary Material). The forecasts made using this alternativenetwork configuration had similar accuracy to those made without the commuter census data(paired t-test, P = 0.2954, Supplementary Material). This finding suggests that our networkmodel is able to capture the impact of spatial connectivity on influenza transmission dynamicsin NYC at the borough scale. In addition, the model parameters estimated using the networkmodel were in general consistent with those reported previously for U.S. cities [21] (see Supple-mentaryMaterial and S3 Fig).
The effects of spatial connectivity on disease transmission are usually two fold—it can intro-duce a disease into new regions during the early phase of an epidemic [33,34], and it can syn-chronize disease progression among regions over the course of an epidemic [12,35]. Here weexamined both effects in the context of influenza forecast. We found that inclusion of spatialconnectivity within a city improved the accuracy of prospective forecast of epidemic onset, par-ticularly during interpandemic seasons. This finding underscores the importance of spatial
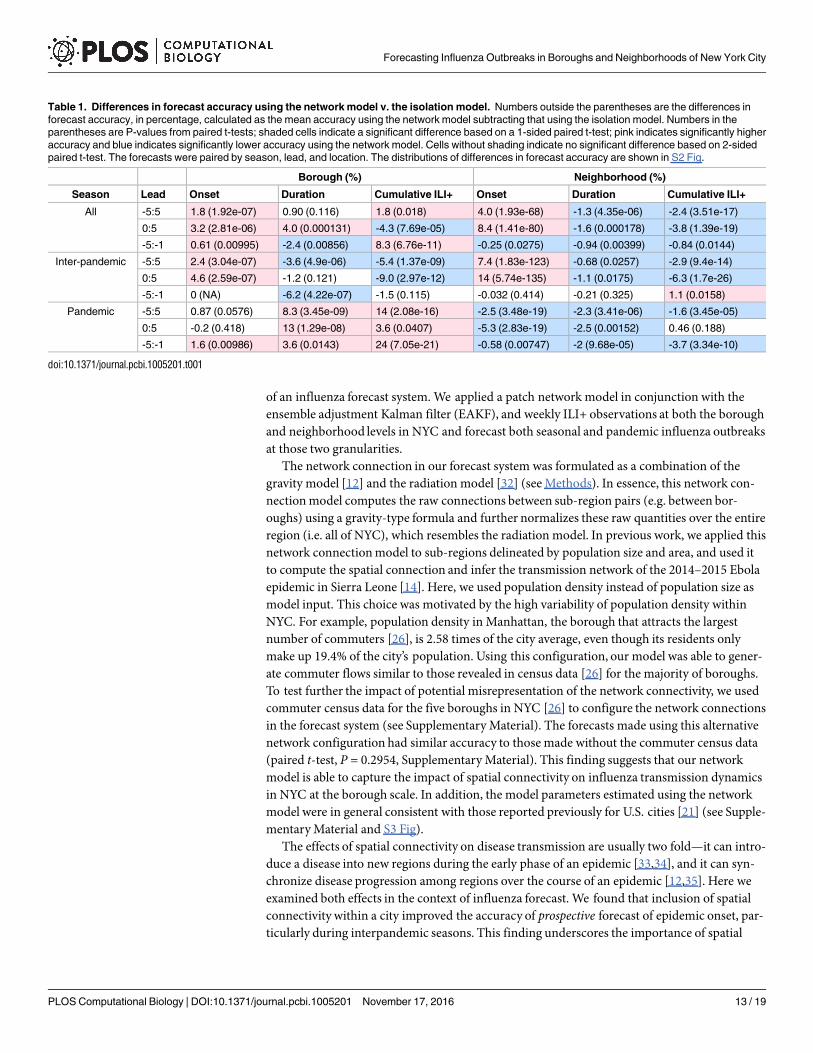
Table 1. Differences in forecast accuracy using the network model v. the isolation model. Numbers outside the parentheses are the differences in
forecast accuracy, in percentage, calculated as the mean accuracy using the network model subtracting that using the isolation model. Numbers in the
parentheses are P-values from paired t-tests; shaded cells indicate a significant difference based on a 1-sided paired t-test; pink indicates significantly higher
accuracy and blue indicates significantly lower accuracy using the network model. Cells without shading indicate no significant difference based on 2-sided
paired t-test. The forecasts were paired by season, lead, and location. The distributions of differences in forecast accuracy are shown in S2 Fig.
Borough (%) Neighborhood (%)
Season Lead Onset Duration Cumulative ILI+ Onset Duration Cumulative ILI+
All -5:5 1.8 (1.92e-07) 0.90 (0.116) 1.8 (0.018) 4.0 (1.93e-68) -1.3 (4.35e-06) -2.4 (3.51e-17)
0:5 3.2 (2.81e-06) 4.0 (0.000131) -4.3 (7.69e-05) 8.4 (1.41e-80) -1.6 (0.000178) -3.8 (1.39e-19)
-5:-1 0.61 (0.00995) -2.4 (0.00856) 8.3 (6.76e-11) -0.25 (0.0275) -0.94 (0.00399) -0.84 (0.0144)
Inter-pandemic -5:5 2.4 (3.04e-07) -3.6 (4.9e-06) -5.4 (1.37e-09) 7.4 (1.83e-123) -0.68 (0.0257) -2.9 (9.4e-14)
0:5 4.6 (2.59e-07) -1.2 (0.121) -9.0 (2.97e-12) 14 (5.74e-135) -1.1 (0.0175) -6.3 (1.7e-26)
-5:-1 0 (NA) -6.2 (4.22e-07) -1.5 (0.115) -0.032 (0.414) -0.21 (0.325) 1.1 (0.0158)
Pandemic -5:5 0.87 (0.0576) 8.3 (3.45e-09) 14 (2.08e-16) -2.5 (3.48e-19) -2.3 (3.41e-06) -1.6 (3.45e-05)
0:5 -0.2 (0.418) 13 (1.29e-08) 3.6 (0.0407) -5.3 (2.83e-19) -2.5 (0.00152) 0.46 (0.188)
-5:-1 1.6 (0.00986) 3.6 (0.0143) 24 (7.05e-21) -0.58 (0.00747) -2 (9.68e-05) -3.7 (3.34e-10)
doi:10.1371/journal.pcbi.1005201.t001
Forecasting Influenza Outbreaks in Boroughs and Neighborhoods of New York City
PLOS Computational Biology | DOI:10.1371/journal.pcbi.1005201 November 17, 2016 13 / 19

connectivity to disease invasion during the very early phase of an epidemic. In contrast, theeffect of inclusion of network structure in the forecast system was mixed in predicting the dura-tion and cumulative ILI+, two later phase metrics. For forecast during the pandemic at the bor-ough scale, the network structure improved prediction accuracy for cumulative ILI+. Influenzamoved rapidly through the city during the pandemic, leading to more synchronized dynamicsamong locales; these synchronized observations probably reinforced the inference and furtheroptimized the system prior to the generation of forecast. However, the network structure
Fig 5. Comparison of the neighborhood level network model and neighborhood level isolation model forecasts. Same notations as in
Fig 4.
doi:10.1371/journal.pcbi.1005201.g005
Forecasting Influenza Outbreaks in Boroughs and Neighborhoods of New York City
PLOS Computational Biology | DOI:10.1371/journal.pcbi.1005201 November 17, 2016 14 / 19

degraded the accuracy of cumulative ILI+ for interpandemic events. This finding indicates thatthe influence of spatial connectivity wanes over the course of a seasonal influenza epidemicand that once the epidemic is established in a locality it is fueled primarily by local transmissiondynamics.
The inclusion of network structure and additional data streams in general improved forecastaccuracy at the borough level but lowered the accuracy at the neighborhood level. The inferiorperformance at the neighborhood level may be attributed to two factors: (1) the network modelfailed to capture the connectivity among neighborhoods, i.e. how local dynamics and heteroge-neities propagate across neighborhoods; and (2) assimilation of data streams from outsideneighborhoods amplified observational noise, which in turn degraded forecast accuracy. Forthe former, heterogeneities in epidemic progression at the neighborhood level not only comefrom differing rates of population mixing (for which the network structure is primarilydesigned), but also from other factors such as population demographics (e.g. different age-structure and school-age populations) and healthcare seeking behaviors, which affect the num-ber of cases recorded by the surveillance system. These heterogeneities, as captured in theobserved ILI records (S1 Movie), likely reflect local dynamics that, in contrast to our networkmodel specification, do not propagate outside the neighborhood.Work to investigate thenature of these neighborhood level heterogeneities is underway.
To test the impact of the latter factor, i.e. confounding from outside signals through dataassimilation, we generated forecasts for the 3-wk and 5-wk centered moving averages of theneighborhood ILI+ time series. These smoothed signals are less erratic than the raw observa-tions so that the signal from connected neighboring localities is more stable over time. Indeed,the forecast accuracies for these two smoothed time series were substantially higher than thosefor the raw observations, and forecasts generated using the network model-EAKF forecast sys-tem were more comparable to those run in isolation (S4 Fig).
Together, these findings suggest that the heterogeneities captured in the neighborhood leveldataset represent local dynamics or observational biases that do not impinge upon the signal ofother neighborhoods.As a result, forecasting at the neighborhood scale is more accurate wheneach neighborhood is run independently in isolation. In contrast, at the borough scale, theseheterogeneities are aggregated and homogenized; our network model, capturing the connectiv-ity via commuter flow, likely reflects the primary inter-connections among boroughs and thusto some extent improved forecast accuracy. For these reasons, our findings here do not entirelydismiss inclusion of spatial heterogeneity among subpopulations in forecast models. Rather, itsuggests that to improve the forecast model, the network structure should represent spatialconnectivity at the appropriate scale. Indeed, the lack of forecast improvement at the neighbor-hood scale may simply indicate that alternate, more detailedmodeling approaches are needed.Such approaches would need to be supported by richer observation at an appropriate granular-ity so that critical epidemiological processes, in addition to populationmobility, could be repre-sented and optimized.
We recognize a number of limitations in this study. Our conclusions were drawn based ononly seven outbreaks; a more robust evaluation is warranted as more observations become avail-able. We did not include age-structure in our model, an important demographic factor shapinginfluenza transmission dynamics. The ED ILI counts were recorded by age group; however, age-grouped ILI ED counts were too low at the UHF neighborhood level to allowmeaningfully analy-sis. Future work using data from other surveillance systems may resolve this issue. Anotherpotential confounder stemmed from the ED ILI data for Staten Island, one of the five NYC bor-oughs, which only included hospitalized cases. To address this issue, we used a different prior dis-tribution of scaling factor (γ) for localities within Staten Island (seeMethods). Our previous work
Forecasting Influenza Outbreaks in Boroughs and Neighborhoods of New York City
PLOS Computational Biology | DOI:10.1371/journal.pcbi.1005201 November 17, 2016 15 / 19
[21] showed that this scaling factor is able to compensate for missing data; it thus may to someextent mitigate adverse impacts on the network model.
Due to a lack of city-specific data, we used influenza viral isolation rates reported for HHSRegion 2 to compute the ILI+ for NYC. As viral testing practice may vary by geographical loca-tion, the viral isolation rates used here may not be representative of those for NYC and mayintroduce systematic biases into the ILI+ data. In addition, the ILI+ data used here were basedon ED ILI visits and hence may not be representative of influenza activity among the generalpopulation. Nevertheless, forecast of ED ILI+ in itself is important as it could provide healthprofessionals at EDs advanced lead-time to plan for changes in influenza-related visits.
In summary, we have developed a network model-filter forecast system for the forecast ofinfluenza at borough and neighborhoodgeospatial scales.When tested using data for NYC,this network forecast system was able to improve forecast accuracy at the borough level, forwhich spatial connection is linked primarily via commuter flow. In contrast, it degraded fore-cast accuracy at the neighborhood scale. NYC is a large municipality with a sizeable geographicextent and many neighborhoods; however, even within smaller cities, community and neigh-borhood heterogeneity may lead to variable disease transmission dynamics. Local public healthmeasures implemented at sub-municipal scales would therefore benefit from surveillance andforecast enacted at those more local scales. Future work should continue to explore spatialgranularity and identify the optimal scales for disease surveillance, forecast and intervention.In so doing, the network model forecast system should be extended to other cities and geo-graphic units (e.g. states) to examine its utility in these different settings and spatial scales.
Supporting Information
S1 Text. Supplementary analyses and results.(DOCX)
S1 Movie. Weekly influenza-like illness (ILI) emergencydepartment visit rates for theUnited Hospital Fund neighborhoodswithin New York City during of the 2008–2009influenza season.(MP4)
S1 Fig. Distributions of the duration above each ILI+ level and cumulative ILI+ over thatduration at the borough (red) and neighborhood (blue) scales.(TIF)
S2 Fig. Distributions of differences in forecast accuracybetween the networkmodel andthe isolationmodel.Each subplot (A-R) shows the difference in forecast accuracy (in percent-age) for forecasts made for the same spatial scale and metric using the network model v. theisolation model, for -5 to 5 week leads (in orange), 0 to 5 week leads (in green) and -5 to -1week leads (in blue). The forecasts are grouped by season, lead, and location as in Table 1; eachsubplot corresponds to one cell in Table 1. The numbers (in percentage) in each subplot showthe mean and 95% confidence intervals for each of the three lead times.(TIF)
S3 Fig. Parameter estimatesmade using the four forecast systems: the borough-levelnet-work model-EAKF (dark green), the UHF neighborhood-levelnetworkmodel-EAKF(lightgreen), the borough-level isolationmodel-EAKF(blue), and the UHF-level isolationmodel-EAKF(light blue).(TIF)
Forecasting Influenza Outbreaks in Boroughs and Neighborhoods of New York City
PLOS Computational Biology | DOI:10.1371/journal.pcbi.1005201 November 17, 2016 16 / 19
S4 Fig. Comparison of forecasts at the neighborhoodscale using the raw observations, and3-wk- and 5-wk-moving average ILI+ time series. Same notations as in Fig 3.(TIF)
Acknowledgments
We thank RobertMathes and Ramona Lall of the Syndromic SurveillanceUnit of the Bureauof Communicable Disease, New York City Department of Health and Mental Hygiene for pre-paring the emergency department (ED) visit data.
Author Contributions
Conceptualization:WY JS.
Data curation:DRO.
Formal analysis:WY.
Funding acquisition: JS.
Methodology:WY.
Validation: WY JS.
Writing – original draft:WYDRO JS.
Writing – review& editing:WYDRO JS.
References1. Thompson M, Shay D, Zhou H, Bridges C, Cheng P, et al. (2010) Estimates of deaths associated with
seasonal influenza—United States, 1976–2007. MMWR Morbidity and mortality weekly report 59:
1057–1062. PMID: 20798667
2. Molinari N-AM, Ortega-Sanchez IR, Messonnier ML, Thompson WW, Wortley PM, et al. (2007) The
annual impact of seasonal influenza in the US: Measuring disease burden and costs. Vaccine 25:
5086–5096. doi: 10.1016/j.vaccine.2007.03.046 PMID: 17544181
3. Viboud C, Boelle PY, Carrat F, Valleron AJ, Flahault A (2003) Prediction of the spread of influenza epi-
demics by the method of analogues. American Journal of Epidemiology 158: 996–1006. PMID:
14607808
4. Shaman J, Karspeck A (2012) Forecasting seasonal outbreaks of influenza. Proc Natl Acad Sci U S A
109: 20425–20430. doi: 10.1073/pnas.1208772109 PMID: 23184969
5. Brooks LC, Farrow DC, Hyun S, Tibshirani RJ, Rosenfeld R (2015) Flexible Modeling of Epidemics
with an Empirical Bayes Framework. PLoS Comput Biol 11: e1004382. doi: 10.1371/journal.pcbi.
1004382 PMID: 26317693
6. Nsoesie E, Mararthe M, Brownstein J (2013) Forecasting peaks of seasonal influenza epidemics.
PLoS currents 5.
7. Nsoesie EO, Brownstein JS, Ramakrishnan N, Marathe MV (2013) A systematic review of studies on
forecasting the dynamics of influenza outbreaks. Influenza Other Respir Viruses doi: 10.1111/irv.
12226 PMID: 24373466
8. Chretien JP, George D, Shaman J, Chitale RA, McKenzie FE (2014) Influenza forecasting in human
populations: a scoping review. Plos One 9: e94130. doi: 10.1371/journal.pone.0094130 PMID:
24714027
9. Axelsen JB, Yaari R, Grenfell BT, Stone L (2014) Multiannual forecasting of seasonal influenza dynam-
ics reveals climatic and evolutionary drivers. Proc Natl Acad Sci U S A 111: 9538–9542. doi: 10.1073/
pnas.1321656111 PMID: 24979763
10. Yang W, Karspeck A, Shaman J (2014) Comparison of filtering methods for the modeling and retro-
spective forecasting of influenza epidemics. PLoS Comput Biol 10: e1003583. doi: 10.1371/journal.
pcbi.1003583 PMID: 24762780
Forecasting Influenza Outbreaks in Boroughs and Neighborhoods of New York City
PLOS Computational Biology | DOI:10.1371/journal.pcbi.1005201 November 17, 2016 17 / 19
11. Olson DR, Heffernan RT, Paladini M, Konty K, Weiss D, et al. (2007) Monitoring the impact of influenza
by age: emergency department fever and respiratory complaint surveillance in New York City. PLoS
Med 4: e247. doi: 10.1371/journal.pmed.0040247 PMID: 17683196
12. Viboud C, Bjornstad ON, Smith DL, Simonsen L, Miller MA, et al. (2006) Synchrony, waves, and spatial
hierarchies in the spread of influenza. Science 312: 447–451. doi: 10.1126/science.1125237 PMID:
16574822
13. Tildesley MJ, House TA, Bruhn MC, Curry RJ, O’Neil M, et al. (2010) Impact of spatial clustering on
disease transmission and optimal control. Proc Natl Acad Sci USA 107: 1041–1046. doi: 10.1073/
pnas.0909047107 PMID: 19955428
14. Yang W, Zhang W, Kargbo D, Yang R, Chen Y, et al. (2015) Transmission network of the 2014–2015
Ebola epidemic in Sierra Leone. J R Soc Interface 12: 20150536. doi: 10.1098/rsif.2015.0536 PMID:
26559683.
15. Anderson JL (2001) An Ensemble Adjustment Kalman Filter for Data Assimilation. Mon Weather Rev
129: 2884–2903.
16. Goldstein E, Cobey S, Takahashi S, Miller JC, Lipsitch M (2011) Predicting the epidemic sizes of influ-
enza A/H1N1, A/H3N2, and B: a statistical method. PLoS Med 8: e1001051. doi: 10.1371/journal.
pmed.1001051 PMID: 21750666
17. Shaman J, Karspeck A, Yang W, Tamerius J, Lipsitch M (2013) Real-time influenza forecasts during
the 2012–2013 season. Nat Commun 4: 2837. doi: 10.1038/ncomms3837 PMID: 24302074
18. Centers for Disease Control and Prevention (2013) FluView. http://www.cdc.gov/flu/weekly/
19. New York City Department of Health and Mental Hygiene New York City United Hospital Fund (UHF)
Neighborhoods and NYC ZIP Code Areas. https://www1.nyc.gov/assets/doh/downloads/pdf/survey/
uhf_map_100604.pdf
20. Centers for Disease Control and Prevention (2015) Fluview: National and Regional Level Outpatient Ill-
ness and Viral Surveillance. http://gis.cdc.gov/grasp/fluview/fluportaldashboard.html
21. Yang W, Lipsitch M, Shaman J (2015) Inference of seasonal and pandemic influenza transmission
dynamics. Proc Natl Acad Sci U S A 112: 2723–2728. doi: 10.1073/pnas.1415012112 PMID:
25730851
22. Carrat F, Vergu E, Ferguson NM, Lemaitre M, Cauchemez S, et al. (2008) Time lines of infection and
disease in human influenza: a review of volunteer challenge studies. Am J Epidemiol 167: 775–785.
doi: 10.1093/aje/kwm375 PMID: 18230677
23. Lau LLH, Cowling BJ, Fang VJ, Chan KH, Lau EHY, et al. (2010) Viral Shedding and Clinical Illness in
Naturally Acquired Influenza Virus Infections. Journal of Infectious Diseases 201: 1509–1516. doi: 10.
1086/652241 PMID: 20377412
24. Hayward AC, Fragaszy EB, Bermingham A, Wang L, Copas A, et al. (2014) Comparative community
burden and severity of seasonal and pandemic influenza: results of the Flu Watch cohort study. Lancet
Respir Med 2: 445–454. doi: 10.1016/S2213-2600(14)70034-7 PMID: 24717637
25. Cosgrove BA, Lohmann D, Mitchell KE, Houser PR, Wood EF, et al. (2003) Real-time and retrospec-
tive forcing in the North American Land Data Assimilation System (NLDAS) project. J Geophys Res-
Atmos 108.
26. Moss ML, Qing C (2012) The Dynamic Population of Manhattan. https://wagner.nyu.edu/files/
rudincenter/dynamic_pop_manhattan.pdf
27. Balcan D, Colizza V, Goncalves B, Hu H, Ramasco JJ, et al. (2009) Multiscale mobility networks and
the spatial spreading of infectious diseases. Proc Natl Acad Sci USA 106: 21484–21489. doi: 10.
1073/pnas.0906910106 PMID: 20018697
28. New York City Department of Health and Mental Hygiene (2015) EpiQuery: NYC Interactive Health
Data. https://a816-healthpsi.nyc.gov/epiquery/
29. New York City Department of Health and Mental Hygiene (2015) GIS Data Files for Download. https://
www1.nyc.gov/html/doh/html/data/gis-shapefiles.shtml
30. Anderson JL (2010) A non-Gaussian ensemble filter update for data assimilation. Mon Weather Rev
138: 4186–4198.
31. Riley S (2007) Large-Scale Spatial-Transmission Models of Infectious Disease. Science 316: 1298–
1301. doi: 10.1126/science.1134695 PMID: 17540894
32. Simini F, Gonzalez MC, Maritan A, Barabasi AL (2012) A universal model for mobility and migration
patterns. Nature 484: 96–100. doi: 10.1038/nature10856 PMID: 22367540
33. Gog JR, Ballesteros S, Viboud C, Simonsen L, Bjornstad ON, et al. (2014) Spatial Transmission of
2009 Pandemic Influenza in the US. PLoS Comput Biol 10: e1003635. doi: 10.1371/journal.pcbi.
1003635 PMID: 24921923
Forecasting Influenza Outbreaks in Boroughs and Neighborhoods of New York City
PLOS Computational Biology | DOI:10.1371/journal.pcbi.1005201 November 17, 2016 18 / 19

34. Brockmann D, Helbing D (2013) The Hidden Geometry of Complex, Network-Driven Contagion Phe-
nomena. Science 342: 1337–1342. doi: 10.1126/science.1245200 PMID: 24337289
35. Xia Y, Bjornstad ON, Grenfell BT (2004) Measles metapopulation dynamics: a gravity model for epide-
miological coupling and dynamics. The American naturalist 164: 267–281. doi: 10.1086/422341
PMID: 15278849
Forecasting Influenza Outbreaks in Boroughs and Neighborhoods of New York City
PLOS Computational Biology | DOI:10.1371/journal.pcbi.1005201 November 17, 2016 19 / 19