fourth quarter 2018 - cision · 2019-02-06 · nordea fourth quarter 2018 1 q4 fourth quarter and...
TRANSCRIPT
Fourth Quarter 2018

Nordea Fourth Quarter 2018
1
Q4
Fourth Quarter and Full Year Results 2018CEO Casper von Koskull’s comments on the results:“2018 has been characterised by key deliveries in our transformation journey: Nordea is now a more focused, simpler and resilient bank – operating in the banking union – with a much improved risk and compliance platform following considerable investments. We are also delivering on the cost efficiency plans; credit quality remains strong and the balance sheet is robust. Thus, we are prepared to manage the bank successfully through the cycle.
At the same time, the results for 2018 are not where we want them to be, featuring a challenging revenue development; driven by margin pressure in household lending, muted volume growth, and pressure on savings and market making revenues. Towards the end of the year, margins stabilised, but the difficult market conditions in the fourth quarter further impacted our asset management and net fair value revenues negatively.
The Nordea Bank Board is going to propose a dividend per share of EUR 0.69.
For 2019, our priorities are very clear. We are now well placed to intensify our client efforts and increase business momentum while at the same time continuing to drive structural cost efficiency. It is now all about execution.”
Full year 2018 vs. Q4 2018 vs.
Full year 2017 Q4 2017
Total op. income, chg % -5 -6Chg in local currency, % -3 -4
Total expenses, chg % -4 2Chg in local currency, % -2 3
Operating profit, chg % -1 -13Chg in local currency, % 1 -13
CET 1 capital ratio, % 15.5 19.5 15.5 19.5
C/I ratio, % 54 54 66 61
Loan loss ratio, bps 7 12 5 9
ROE, % 9.7 9.5 6.1 7.7
Diluted EPS, EUR 0.76 0.75 0.12 0.15
Summary key figuresQ4 Q3 Local Q4 Local Jan-Dec Jan-Dec Local
2018 2018 Chg % curr. % 2017 Chg % curr. % 2018 2017 Chg % curr. %EURmNet interest income 1,126 1,072 5 6 1,109 2 3 4,324 4,666 -7 -5Total operating income 2,103 2,046 3 3 2,228 -6 -4 9,005 9,469 -5 -3Profit before loan losses 719 910 -21 -21 867 -17 -16 4,126 4,367 -6 -4Net loan losses -30 -44 -32 -32 -71 -58 -57 -173 -369 -53 -51Operating profit 689 866 -20 -20 796 -13 -13 3,953 3,998 -1 1Diluted earnings per share, EUR 0.12 0.17 0.15 0.76 0.75ROE, % 6.1 8.7 7.7 9.7 9.5Exchange rates used for Q4 2018 for income statement items are for DKK 7.4533, NOK 9.6033 and SEK 10.2608.
For further information:Casper von Koskull, President and Group CEO, +358 503 821 391Christopher Rees, Group CFO, +45 5547 2377
Rodney Alfvén, Head of Investor Relations, +46 72 235 05 15Sara Helweg-Larsen, Head of Group Communications, +45 2214 0000
3,953
Total operating profit, FY 2018 (EURm)
We build strong and close relationships through our engagement with customers and society. Whenever people strive to reach their goals and realise their dreams, we are there to provide relevant financial solutions. We are the largest bank in the Nordic region and among the ten largest financial groups in Europe in terms of total market capitalisation with around 11 million customers. The Nordea share is listed on the Nasdaq Helsinki, Nasdaq Copenhagen and Nasdaq Stockholm exchanges. Read more about us on nordea.com.
0.69Dividend per share that the
Nordea Bank Board is going to propose

Nordea Fourth Quarter 2018
2
Q4
CEO comment The macro development in the Nordics has been relatively healthy in 2018 but there are clear signs of increased uncertainty, especially Sweden that gradually lost steam on the back of uncertainty on housing market impacting investment and sluggish private consumption. In recent years, Nordea has proactively de-risked the bank, re-focused on core Nordic activities and maintained strict underwriting discipline in lending. This, combined with a record-strong balance sheet, makes us comfortable we can manage the bank successfully through the cycle. 2018 featured challenging revenue development. Net interest income was down 7% in 2018 compared to 2017 driven mainly by margin pressure and the deconsolidation of the Baltic operations. In recent quarters, the level has stabilised, and towards the end of the year, we saw volume growth and stabilising blended margins. The market making trading environment has been challenging throughout the year, and the worsening market conditions in the fourth quarter further weighted on net fair value as well as fees and commission.We continue to deliver on our cost efficiency plans with costs below EUR4.8bn for 2018, excluding the goodwill impairment in Russia of EUR 141m. We are well on track to reach our 2021 target to reduce costs* by 3% compared to 2018 and in 2019 the target is to have lower costs than in 2018, adjusted for non-recurring costs in 2018 and 2019**. Credit quality remains strong and loan losses were 5bps in the fourth quarter 2018. Common Equity Tier 1 capital ratio was 15.5%, in line with our expectations and well above the required level of 13.9%. The Board is going to propose an increase in dividend per share from EUR 0.68 to EUR 0.69, in line with the capital policy.Net profit for 2018 increased compared to 2017, also including the goodwill impairment in Russia. Sustainability and responsible banking is at the heart of what Nordea wants to be and we are integrating sustainability into our day-to-day business at an increasing pace. Together with the United Nations and 27 other banks from around the world, Nordea was co-founder of the Principles for Responsible Banking, launched in Paris in November. For the second year in a row, Nordea was ranked as one of the top 100 most sustainable corporations in the world by the specialised media and investment research firm Corporate Knights and was the only Nordic bank to qualify among the top 100.In 2018 we have made progress in Personal Banking in terms of increasing customer satisfaction particularly in Sweden where it has gone up to 67 from 60 during 2018. We also see a continued positive trend in both Private Banking and Business Banking, and we retain our very strong position in the large corporate sector.In 2016–2018, Nordea carried out a significant transformation programme in line with the strategic priorities l communicated when I was appointed CEO in H2 2015. The transformation consisted of four key elements.1. Risk and compliance – During the last three years, Nordea has invested more than EUR 730m within risk and compliance and resilience, recruited approximately 1,300 compliance professionals, and in 2018 12,000 front office staff members received 110,000 hours of training. These investments have significantly strengthened the risk and compliance platform and provide vital support to our financial crime prevention efforts, making Nordea a safer and more trusted bank.
2. Simplification – Nordea has created a streamlined legal structure with a Finnish parent company, with fully owned product companies and significant branches in the other Nordic countries. With this structure, we became a simpler bank and easier to scale. In the digital factory, Nordea has a completely new Group Common Data platform, all SEPA payments are now on a new platform with instant payments and significant progress has been made with the new Core Banking Platform. Our robots have now the same capacity as 1,500 FTEs. Following divestments of our non-Nordic private banking operations and the ongoing divesting of our Baltic operations, and a significant reduction in Russian and non-Nordic Shipping, Oil and Offshore lending, Nordea is now a more focused, simpler and resilient bank – operating in the banking union – with a much improved risk and compliance platform.3. Digitalisation – In 2016–2018, Nordea invested above EUR 200m in digital solutions making us easier to deal with and accessible to even more customers. The most important outcomes of these investments are; a new mobile bank platform, a fully digital trade finance solution (We trade), online advisory meetings and launches of Apple Pay (as the only Nordic bank), Google Pay and Samsung Pay. We launched a new digital advisor, Nora, who has more than 115,000 advisory meetings in 2018 and around 30,000 advisory meetings in just January 2019. Corporate and Business Banking has also launched a new Digital Corporate Bank and in our Open Banking platform there are approximately 2,500 external developers forming part of our digital ecosystem, creating ideas and solutions for our customers.4. Cost and capital efficiency – While the transformation undoubtedly led to cost increases in 2016–2017, Nordea now has a foundation for long-term cost efficiency improvement. Between 2017 and 2021, costs are expected to be reduced by 7% in constant currencies. In the same period, combined cash costs on both the profit & loss accounts and the balance sheet are expected to come down by approximately 15–20% in constant currencies. There is also potential to reduce costs beyond 2021 when the new Core Banking Platform is implemented, and we can start decommissioning the legacy systems. We also note that currently, the Nordic banking sector is phasing out relatively high cost inflation, driven by the same kind of investments made by Nordea in 2016–2017. Also, during 2016–2018, we created one of the strongest capitalised balance sheets in Europe.For 2019, our priorities are very clear. We are now well placed to intensify our client efforts and increase business momentum while at the same time continuing to drive structural cost efficiency. Each business area has identified a number of initiatives to drive client value and revenue growth. Examples include investments in Private Banking in Norway and Sweden, acquisition of Gjensidige Bank, new distribution channels within Asset Management and Wholesale Banking and clear plans to regain momentum on mortgages where we already start to see results. On the cost side, we continue to drive operational excellence, frontline efficiency and simplification. At the end of the day, it is now all about execution.
Casper von Koskull
President and Group CEO
*Excluding EUR 141m in goodwill impairment in 2018 related to Russia** EUR141m in goodwill impairment related to Russia in 2018 and approximately EUR 90m related to divestment of Luminor-shares and acquisition of Gjensidige Bank in 2019
Nordea Fourth Quarter 2018
3
Q4
OutlookThroughout Nordea we are intensifying our efforts to increase business momentum and each business area has identified a number of initiatives to drive client value and revenue growth. Examples include investments in Private Banking in Norway and Sweden, acquisition of Gjensidige Bank, new distribution channels within Asset Management and Wholesale Banking and clear plans to regain momentum on mortgages where we already start to see results.
The key drivers behind the structural cost efficiency are increased usage of automation and robotics, ongoing ramp-up in Poland and Estonia and outsourcing of Group Technology mainframe to IBM. We are also simplifying through harmonizing products and services and leveraging scale by further consolidating common units, for instance global operations and services. At the end of the day, it is all about execution.
CostFor 2021, we expect the cost base in constant currencies to be approximately 3% below the 2018 cost base excluding items affecting comparability in 2018* and cash costs are expected to be down 5-10% in constant currencies over the same period.
Costs for 2019 are expected to be lower in constant currencies compared to 2018 excluding items affecting comparability in 2018 and 2019** and total cash cost expected to be lower in constant currencies over the same period.
Credit qualityOur expectation for the coming quarters is that net losses will remain low and around the average level for 2018.
Capital policyGiven the implementation of transitional arrangements agreed with the ECB following Nordea’s transfer to the Banking Union and with the aim to maintain the same nominal management buffer, Nordea Board of Directors decided to adjust the Groups capital policy to reflect the transitional capital regime on the meeting on 5 February 2019. The management buffer has been adjusted from 50-150bps to a range of 40 – 120 bps. This is mainly a technical adjustment therefore the management buffer remains largely unchanged in nominal EUR amounts. The current level of the management buffer is approximately EUR 2.5bn (160bps). The ambition is to achieve a yearly increase in the dividend per share, while maintaining a strong capital position in line with the capital policy.
*EUR141m in goodwill impairment in 2018 related to Russia**EUR141m in goodwill impairment related to Russia in 2018 and approximately EUR 90m related to divestment of Luminor-shares and acquisition of Gjensidige Bank in 2019

Nordea Fourth Quarter 2018
4
Q4
Income statementQ4 Q3 Local Q4 Local Jan-Dec Jan-Dec Local
2018 2018 Chg % curr. % 2017 Chg % curr. % 2018 2017 Chg % curr. %EURmNet interest income 1,126 1,072 5 6 1,109 2 3 4,324 4,666 -7 -5Net fee and commission income 720 703 2 2 839 -14 -13 2,993 3,369 -11 -9Net result from items at fair value 182 205 -11 -13 235 -23 -21 1,088 1,328 -18 -16Profit from associated undertakings and jointventures accounted for under the equity method 15 48 -69 -71 16 -6 -13 124 23 439 435Other operating income 60 18 233 211 29 107 103 476 83 473 490Total operating income 2,103 2,046 3 3 2,228 -6 -4 9,005 9,469 -5 -3
Staff costs -744 -726 2 2 -861 -14 -12 -2,998 -3,212 -7 -5Other expenses -390 -323 21 20 -425 -8 -7 -1,399 -1,622 -14 -11Depreciation, amortisation and impairmentcharges of tangible and intangible assets -250 -87 187 185 -75 233 235 -482 -268 80 84Total operating expenses -1,384 -1,136 22 21 -1,361 2 3 -4,879 -5,102 -4 -2
Profit before loan losses 719 910 -21 -21 867 -17 -16 4,126 4,367 -6 -4
Net loan losses -30 -44 -32 -32 -71 -58 -57 -173 -369 -53 -51Operating profit 689 866 -20 -20 796 -13 -13 3,953 3,998 -1 1
Income tax expense -197 -182 8 9 -167 18 28 -872 -950 -8 -5Net profit for the period 492 684 -28 -28 629 -22 -23 3,081 3,048 1 2
Business volumes, key items131 Dec 30 Sep Local 31 Dec Local
2018 2018 Chg % curr. % 2017 Chg % curr. %EURbnLoans to the public 308.3 316.5 -3 -2 310.2 -1 1Loans to the public, excl. repos 291.6 291.7 0 1 293.9 -1 1Deposits and borrowings from the public 165.0 174.2 -5 -5 172.4 -4 -3Deposits from the public, excl. repos 160.2 160.5 0 0 165.4 -3 -2Total assets 551.4 572.8 -4 581.6 -5Assets under management 282.6 311.5 -9 330.4 -14Equity 32.9 32.6 1 33.3 -1
Ratios and key figures2Q4 Q3 Q4 Jan-Dec Jan-Dec
2018 2018 Chg % 2017 Chg % 2018 2017 Chg %Diluted earnings per share, EUR 0.12 0.17 -29 0.15 -20 0.76 0.75 1EPS, rolling 12 months up to period end, EUR 0.76 0.79 -4 0.75 1 0.76 0.75 1Share price1, EUR 7.30 9.40 -22 10.09 -28 7.30 10.09 -28Total shareholders' return, % -17.5 20.2 -187 -5.0 250 -19.5 3.6 -642Equity per share1, EUR 8.15 8.08 1 8.21 -1 8.15 8.21 -1Potential shares outstanding1, million 4,050 4,050 0 4,050 0 4,050 4,050 0Weighted average number of diluted shares, mn 4,037 4,037 0 4,039 0 4,037 4,039 0 Return on equity, % 6.1 8.7 -30 7.7 -21 9.7 9.5 2Cost/income ratio, % 66 56 19 61 8 54 54 0Loan loss ratio, basis points3 5 8 -38 9 -44 7 12 -42Common Equity Tier 1 capital ratio1,4,5, % 15.5 20.3 -24 19.5 -21 15.5 19.5 -21Tier 1 capital ratio1,4,5, % 17.3 22.6 -23 22.3 -22 17.3 22.3 -22Total capital ratio1,4,5, % 19.9 26.3 -24 25.2 -21 19.9 25.2 -21Tier 1 capital1,4, EURbn 27.0 27.3 -1 28.0 -4 27.0 28.0 -4Risk exposure amount4, EURbn 156 121 29 126 24 156 126 24Number of employees (FTEs)1 28,990 29,056 0 30,399 -5 28,990 30,399 -5Economic capital1, EURbn 26.6 26.3 1 26.7 0 26.6 26.7 01 End of period.2 For more detailed information regarding ratios and key figures defined as Alternative performance measures, see www.nordea.com/en/investor-relations/.3 Including Loans to the public reported in Assets held for sale in Q1 2018.4 Including the result for the period.5 Changes to the applicable capital requirements regime (for more details, please see chapter Other information).

Nordea Fourth Quarter 2018
5
Q4
Income statement Excluding items affecting comparability1,2
Q4 Q3 Local Q4 Local Jan-Dec Jan-Dec Local 2018 2018 Chg % curr. % 2017 Chg % curr. % 2018 2017 Chg % curr. %
EURmNet interest income 1,126 1,072 5 6 1,109 2 3 4,324 4,666 -7 -5Net fee and commission income 720 703 2 2 839 -14 -13 2,993 3,369 -11 -9Net result from items at fair value 132 205 -36 -36 235 -44 -42 903 1,328 -32 -30Profit from associated undertakings and jointventures accounted for under the equity method 15 48 -69 -71 16 -6 -13 124 23Other operating income 24 18 33 21 29 -17 -21 91 83 10 15Total operating income 2,017 2,046 -1 -1 2,228 -9 -8 8,435 9,469 -11 -9
Staff costs -744 -726 2 2 -861 -14 -12 -2,998 -3,212 -7 -5Other expenses -390 -323 21 20 -425 -8 -7 -1,399 -1,622 -14 -11Depreciation, amortisation and impairmentcharges of tangible and intangible assets -109 -87 25 25 -75 45 47 -341 -268 27 30Total operating expenses -1,243 -1,136 9 9 -1,361 -9 -7 -4,738 -5,102 -7 -5
Profit before loan losses 774 910 -15 -14 867 -11 -10 3,697 4,367 -15 -14
Net loan losses -30 -44 -32 -32 -71 -58 -57 -173 -369 -53 -51Operating profit 744 866 -14 -14 796 -7 -5 3,524 3,998 -12 -10
Income tax expense -185 -182 2 3 -167 11 20 -830 -950 -13 -10Net profit for the period 559 684 -18 -18 629 -11 -12 2,694 3,048 -12 -11
Ratios and key figures1,2Q4 Q3 Q4 Jan-Dec Jan-Dec
2018 2018 Chg % 2017 Chg % 2018 2017 Chg %Diluted earnings per share, EUR 0.14 0.17 -18 0.15 -7 0.67 0.75 -11EPS, rolling 12 months up to period end, EUR 0.67 0.68 -1 0.75 -11 0.67 0.75 -11Return on equity, % 7.0 8.7 -20 7.7 -9 8.5 9.5 -11Cost/income ratio, % 62 56 11 61 1 56 54 4ROCAR, % 8.3 10.2 -19 9.2 -10 10.0 11.1 -101 Excl. items affecting comparability in Q4 2018: EUR 50m gain from revaluation of Euroclear, EUR 38m after tax, EUR 36m gain related to sale of Ejendomme and EUR 141m loss from impairment of goodwill in Russia. Q2 2018: tax free gain related to divestment of shares in UC EUR 87m and tax free gain related to the sale of Nordea Liv & Pension Denmark EUR 262m. In Q1 2018: EUR 135m gain from valuation model update in Denmark, EUR 105m after tax.2 For more detailed information regarding ratios and key figures defined as Alternative performance measures, see www.nordea.com/en/investor-relations/.
Nordea Fourth Quarter 2018
6
Q4
Table of contentsMacroeconomy and financial markets ...........................................................................................7
Group results and performance
Fourth quarter 2018..................................................................................................................8
Net interest income............................................................................................................................8
Net fee and commission income......................................................................................................9
Net result from items at fair value..................................................................................................10
Total operating income ...................................................................................................................10
Total expenses.................................................................................................................................11
Net loan losses and credit portfolio...............................................................................................12
Profit.................................................................................................................................................. 13
Full year 2018 compared to full year 2017........................................................................................................13
Other information................................................................................................................................................ 14
Capital position and risk exposure amount (REA)..........................................................................14
Regulatory developments .................................................................................................................14
Changes to the applicable capital requirements regime due to Nordea’s
re-domiciliation to Finland ................................................................................................................15
Balance sheet .....................................................................................................................................16
Nordea’s funding and liquidity operations ......................................................................................16
Market risk ..........................................................................................................................................16
Nordea share and ratings ..................................................................................................................16
Nordea’s re-domiciliation to the Banking Union .............................................................................17
Dividend ..............................................................................................................................................17
Profit sharing and Long- term incentives ........................................................................................17
Performance related salaries ............................................................................................................17
Quarterly result development, Group ...............................................................................................................19
Business areas
Financial overview by business area................................................................................................................20
Personal Banking................................................................................................................................................ 21
Commercial & Business Banking......................................................................................................................28
Wholesale Banking .............................................................................................................................................32
Asset & Wealth Management.............................................................................................................................35
Group Functions and other................................................................................................................................39
Financial statements
Nordea Group...................................................................................................................................................... 41
Notes to the financial statements......................................................................................................................45
Nordea Bank Abp ............................................................................................................................................... 64

Nordea Fourth Quarter 2018
7
Q4
Macroeconomy and financial markets While the third quarter saw some positive developments in global trade with the replacement of the North American Free Trade Agreement, the US remained at the centre of attention in the fourth quarter as trade negotiations with China continued. Following a cancelled meeting in September between US and Chinese officials, ultimately, at a post-G20 summit meeting in Buenos Aires in December, President Trump and President Xi agreed to a 90-day halt of new tariffs. The truce, however, was not enough to calm the quarter-long global equity rout, resulting in one of the worst years for equities since the onset of the financial crisis. Over the fourth quarter, S&P 500 and the German DAX index both fell by 14%, while the Japanese Nikkei index was down 17%. In line with its previous communication, following continued strong growth in the US (3.4% ann. q/q in Q3) and inflation in the range of 2.7–2.2%, the Federal Reserve Bank raised its interest rate to 2.50% at the December meeting. Ending an eventful quarter, the US government went into shut-down at the end of December as the Senate failed to agree on additional funding for a border wall between the US and Mexico. In Europe, the Italian government avoided EU sanctions as it ultimately reached a compromise with the European Commission to bring down the 2019 budget deficit target to 2.04% from 2.40% of GDP. The Italian 10-year government bond yield fell to 2.74% from 3.29% during the quarter. Over the same period, the German 10-year yield fell from 0.47% to 0.24%. The general decrease in yields came in the wake of a general slowing trend in global economic growth, and a European core inflation that continued to hover around the 1% mark. Despite the slowdowns, citing continued underpinning of inflation expectations from underlying demand, the ECB announced as expected the end of its asset purchase programme as per end of 2018. In Q4 we saw only limited movements in EURUSD as it fell slightly from 1.158 to 1.144. Oil dropped by 39% from 85 USD/bbl to 52 USD/bbl on the back of increased production in Saudi Arabia, the US selling from its reserves and spill-over from the risk-off mood in global equity markets.
DenmarkIn Q3 2018 Danish GDP increased by 2.3% compared to the same period last year. Private consumption was the main driver (up by 3.2% y/y) but also net exports made a positive contribution. Leading indicators pointed to mixed outlook for 2019. Consumer confidence has weakened and business confidence in manufacturing has fallen. On the other hand, employment continued to increase, led by the healthy expansion in the domestic part of the Danish economy. The number of employees was at an all-time high. In Q3, prices of single-family houses increased by 3.0% (y/y), while owner-occupied flats were up by 3.4% (y/y). However, the latest monthly data showed signs of falling prices. The Danish central bank maintained its -0.65% deposit rate in Q4 2018 but in December they bought a total of DKK 11.6bn to strengthen the DKK against the EUR. This was the first intervention in the FX market since March 2017. Danish equities fell by 11.1% during the quarter while the 10-year swap rate decreased by 15bps to 0.97%.
FinlandThe Finnish economy expanded by 2.4% (y/y) in the third quarter of 2018, but the growth was mainly driven by rapid accumulation of inventories. Thus, the risk of slowdown in the near term has increased and growth outlook has weakened faster than expected. Export growth decreased by -1.3% (y/y) in the third quarter of 2018, down from 2.1% (y/y) at the second quarter of 2018. Private consumption declined by 0.5% (q/q) in the third quarter and consumer confidence continued to fall. Inflation increased slightly to 1.3% (y/y), up from 1.2% (y/y) in the third quarter of 2018. Finnish equity markets dropped by 15% and the Finnish 10-year government bond yield ended 16bps lower at 0.54% in the fourth quarter.
NorwayThe Norwegian economy grew by 0.3% q/q in Q3, down from the trend of 0.6–0.7% over the last quarters. Growth was dragged lower by temporary factors. For instance, agricultural production was heavily affected by the dry summer. Forward-looking indicators pointed towards growth of around 0.75% (q/q) in Q4. Employment increased at an annual rate of 1.5% during the quarter, in line with the recent trend, while registered unemployment continued to decrease. Higher energy prices reduced household purchasing power, resulting in slightly weaker private consumption growth. Mainland export industries benefited from a weaker NOK and the oil companies were still expecting a large increase in oil investments in 2019. House prices were stable in the fourth quarter. Norges Bank kept its key policy rate at 0.75% at its December meeting, as widely anticipated, and the central bank confirmed its plan to gradually hike rates over the coming years. The 2-year swap rate decreased by 3bps to 1.53% in Q4, while the 10-year swap rate decreased by 22bps to 2.10%. The NOK was 5% weaker in trade-weighted terms in Q4 and equities were down by 14.8%.
SwedenSwedish GDP fell by 0.2% q/q in the third quarter of 2018 and was up by a mere 1.6% over the year. Private consumption decreased by 1% q/q, partly explained by temporary factors. However, there are reasons to believe that the consumption trend will be relatively weak going forward. Fixed investments rose in Q3 but much suggested that falling housing investments will weigh on investment growth during the coming quarters. Exports have been sluggish for most of 2018, reflecting stagnating demand from trading partners. The labour market continued to improve in 2018, despite the slowing GDP growth. The unemployment rate stood at 6.1% on average for October and November, 0.5% point lower than a year earlier. Higher energy prices continued to boost CPIF inflation, which stood at 2.1% (y/y) in November. The Riksbank hiked its rate for the first time in eight years in December, by 25bps to -0.25%. However, the Riksbank lowered the rate path and signalled fewer rate hikes, and the next rate hike was postponed to the second half of 2019. The trade-weighted SEK was unchanged, while Swedish equities fell by 18% during the third quarter. The 10-year government bond yield declined to 0.45% in Q3, 18bps lower than the previous quarter.

Nordea Fourth Quarter 2018
8
Q4
Group results and performanceFourth quarter 2018 Net interest incomeNet interest income in local currencies was up 6% from the previous quarter. Lending volumes continue to improve and contributed positively, while lending margins remain under pressure mainly in the household segment. We observe volume growth in Norway whereas in other countries volume growth remains subdued. Deposit margins were up, and Resolution fees and Deposit Guarantee fees decreased in the fourth quarter.
Net interest income for Personal Banking was up 5% in local currencies from the previous quarter, mainly due to a correction of deposit guarantee fees in the quarter. Lending volumes were stable from the previous quarter while lending margins continued to be under pressure especially in Finland and Norway.
Net interest income for Commercial & Business Banking was up 5% in local currencies from the previous quarter, driven by lower Deposit Guarantee fees. Deposit margins improved while lending margins came down. We saw volume growth and deposit volumes were also up 4% from the previous quarter.
Net interest income in Wholesale Banking was broadly unchanged in local currencies from the previous quarter. Margins were stable in the quarter as well as deposit volumes and lending volumes increased excluding repos.
Net interest income in Asset & Wealth Management was down EUR 2m from the previous quarter mainly due to the divestment of the International Private Banking.
Net interest income in Group Functions and Other was EUR 43m compared to EUR 27m in the previous quarter mostly driven by reduced Resolution fees.
Lending volumesLoans to the public in local currencies, excluding repos, were 1% up from the previous quarter. Average lending volumes in local currencies increased in Personal Banking mainly driven by higher volumes in Norway. In Commercial & Business Banking, volumes increased mainly driven by Business Banking Norway. In Wholesale Banking, average lending volumes are unchanged with increased Nordic volumes offsetting somewhat lower volumes in Banking Russia.
Deposit volumesTotal deposits from the public in local currencies, excluding repos were unchanged from the previous quarter. Average deposit volumes in both Personal Banking and Asset & Wealth Management decreased while the volumes in Commercial & Business Banking increased. Deposit volumes in Wholesale Banking were stable.
Net interest income per business area Local currency
Q418 Q318 Q218 Q118 Q417 Q4/Q3 Q4/Q4 Q4/Q3 Q4/Q4EURmPersonal Banking 520 497 510 528 561 5% -7% 5% -5%Commercial & Business Banking 333 315 318 308 313 6% 6% 5% 8%Wholesale Banking 215 216 219 204 193 0% 11% -1% 13%Asset & Wealth Management 15 17 18 16 19 -12% -21% -12% -21%Group Functions and other 43 27 8 -3 23 - - - -Total Group 1,126 1,072 1,073 1,053 1,109 5% 2% 6% 3%
Change in Net interest income
Q4/Q3Jan-Dec
18/17EURmNII beginning of period 1,072 4,666Margin driven NII -2 -253 Lending margin -8 -288 Deposit margin 6 35Volume driven NII 6 12 Lending volume 6 23 Deposit volume 0 -11Day count 0 0Other1,2,3 50 -101NII end of period 1,126 4,3241 of which FX -9 -1032 of which Baltics - -1202 of which RF & DGS 59 5

Nordea Fourth Quarter 2018
9
Q4
Net fee and commission income Net fee and commission income increased by 2% in local currencies. Brokerage & Corporate finance picked up after a weak third quarter of 2018. Payment and Cards fees are down due to normal seasonality. Lending-related fees were down mainly due to a change in accounting where expenses of EUR 10m were moved to net fee and commission income from net results from items at fair value.
Savings and investment commissionsNet fee and commission income from savings and investments increased from the previous quarter to EUR 500m due to higher brokerage and corporate finance fees.
Assets under Management (AuM) decreased by EUR 28.9bn to EUR 282.6bn at the end of the quarter. Performance related fees were EUR 3m (EUR 21m in Q4 2017).
The decrease was mainly due to the turmoil on the equity markets (EUR 17bn), divestment of the International Private Banking (EUR 10bn), market depreciation and net outflow of EUR 1.9bn (compared to EUR -0.6bn in the previous quarter).
Payments and cards and lending-related commissionsLending-related net fee and commission income decreased from the previous quarter to EUR 114m. Payments and cards net fee and commission income decreased to EUR 121m from the previous quarter.
Net fee and commission income per business area Local currency
Q418 Q318 Q218 Q118 Q417 Q4/Q3 Q4/Q4 Q4/Q3 Q4/Q4EURmPersonal Banking 157 164 177 173 176 -4% -11% -5% -10%Commercial & Business Banking 109 107 108 113 124 2% -12% 3% -11%Wholesale Banking 108 91 152 120 131 19% -18% 18% -15%Asset & Wealth Management 354 352 368 369 411 1% -14% 1% -14%Group Functions and other -8 -11 -5 -5 -3 - - - -Total Group 720 703 800 770 839 2% -14% 2% -13%
Net fee and commission income per category Local currency
Q418 Q318 Q218 Q118 Q417 Q4/Q3 Q4/Q4 Q4/Q3 Q4/Q4EURmSavings and investments, net 500 447 510 485 547 12% -9% 12% -8%Payments and cards, net 121 130 139 130 124 -7% -2% -7% -1%Lending-related, net 114 129 142 129 147 -12% -22% -12% -21%Other commissions, net -15 -3 9 26 21 - - - -Total Group 720 703 800 770 839 2% -14% 2% -13%
Assets under Management (AuM), volumes and net inflowNet
inflowQ418 Q318 Q218 Q118 Q417 Q418
EURbnNordic Retail funds 56.3 61.1 60.0 58.6 61.5 -0.6Private Banking 80.7 98.0 96.3 96.1 98.9 0Institutional sales 98.3 101.6 100.9 92.5 96.2 -1.2Life & Pensions 47.3 50.8 49.8 72.9 73.8 -0.1Total 282.6 311.5 307.0 320.1 330.4 -1.9
Nordea Fourth Quarter 2018
10
Q4
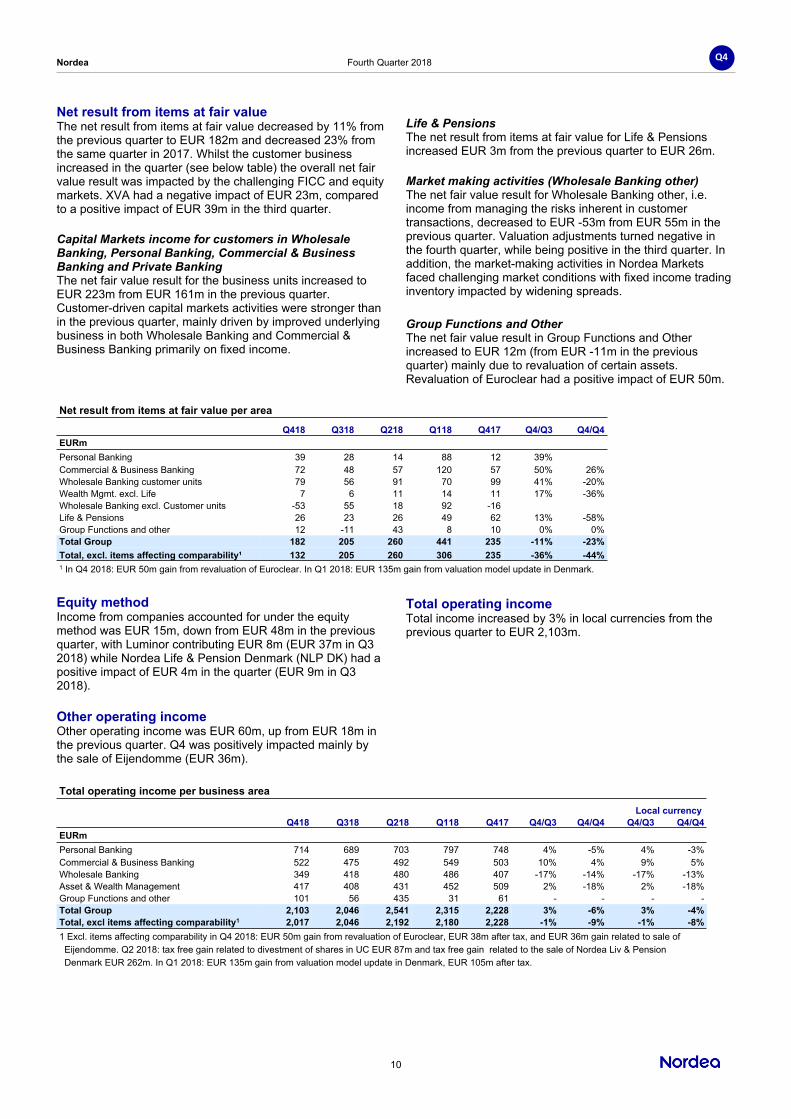
Net result from items at fair value The net result from items at fair value decreased by 11% from the previous quarter to EUR 182m and decreased 23% from the same quarter in 2017. Whilst the customer business increased in the quarter (see below table) the overall net fair value result was impacted by the challenging FICC and equity markets. XVA had a negative impact of EUR 23m, compared to a positive impact of EUR 39m in the third quarter.
Capital Markets income for customers in Wholesale Banking, Personal Banking, Commercial & Business Banking and Private BankingThe net fair value result for the business units increased to EUR 223m from EUR 161m in the previous quarter. Customer-driven capital markets activities were stronger than in the previous quarter, mainly driven by improved underlying business in both Wholesale Banking and Commercial & Business Banking primarily on fixed income.
Life & PensionsThe net result from items at fair value for Life & Pensions increased EUR 3m from the previous quarter to EUR 26m.
Market making activities (Wholesale Banking other)The net fair value result for Wholesale Banking other, i.e. income from managing the risks inherent in customer transactions, decreased to EUR -53m from EUR 55m in the previous quarter. Valuation adjustments turned negative in the fourth quarter, while being positive in the third quarter. In addition, the market-making activities in Nordea Markets faced challenging market conditions with fixed income trading inventory impacted by widening spreads.
Group Functions and OtherThe net fair value result in Group Functions and Other increased to EUR 12m (from EUR -11m in the previous quarter) mainly due to revaluation of certain assets. Revaluation of Euroclear had a positive impact of EUR 50m.
Net result from items at fair value per area
Q418 Q318 Q218 Q118 Q417 Q4/Q3 Q4/Q4EURmPersonal Banking 39 28 14 88 12 39% 225%Commercial & Business Banking 72 48 57 120 57 50% 26%Wholesale Banking customer units 79 56 91 70 99 41% -20%Wealth Mgmt. excl. Life 7 6 11 14 11 17% -36%Wholesale Banking excl. Customer units -53 55 18 92 -16Life & Pensions 26 23 26 49 62 13% -58%Group Functions and other 12 -11 43 8 10 0% 0%Total Group 182 205 260 441 235 -11% -23%Total, excl. items affecting comparability¹ 132 205 260 306 235 -36% -44%1 In Q4 2018: EUR 50m gain from revaluation of Euroclear. In Q1 2018: EUR 135m gain from valuation model update in Denmark.
Equity method Income from companies accounted for under the equity method was EUR 15m, down from EUR 48m in the previous quarter, with Luminor contributing EUR 8m (EUR 37m in Q3 2018) while Nordea Life & Pension Denmark (NLP DK) had a positive impact of EUR 4m in the quarter (EUR 9m in Q3 2018).
Other operating incomeOther operating income was EUR 60m, up from EUR 18m in the previous quarter. Q4 was positively impacted mainly by the sale of Eijendomme (EUR 36m).
Total operating incomeTotal income increased by 3% in local currencies from the previous quarter to EUR 2,103m.
Total operating income per business area
Local currencyQ418 Q318 Q218 Q118 Q417 Q4/Q3 Q4/Q4 Q4/Q3 Q4/Q4
EURmPersonal Banking 714 689 703 797 748 4% -5% 4% -3%Commercial & Business Banking 522 475 492 549 503 10% 4% 9% 5%Wholesale Banking 349 418 480 486 407 -17% -14% -17% -13%Asset & Wealth Management 417 408 431 452 509 2% -18% 2% -18%Group Functions and other 101 56 435 31 61 - - - -Total Group 2,103 2,046 2,541 2,315 2,228 3% -6% 3% -4%Total, excl items affecting comparability1 2,017 2,046 2,192 2,180 2,228 -1% -9% -1% -8%1 Excl. items affecting comparability in Q4 2018: EUR 50m gain from revaluation of Euroclear, EUR 38m after tax, and EUR 36m gain related to sale of Eijendomme. Q2 2018: tax free gain related to divestment of shares in UC EUR 87m and tax free gain related to the sale of Nordea Liv & Pension Denmark EUR 262m. In Q1 2018: EUR 135m gain from valuation model update in Denmark, EUR 105m after tax.

Nordea Fourth Quarter 2018
11
Q4
Total expenses Total expenses in the fourth quarter amounted to EUR 1,384m, up 21% in local currencies from the previous quarter and up 3% from the fourth quarter of 2017 in local currencies. The fourth quarter included a goodwill impairment of EUR 141m related to Russia and a transformation costs of EUR 24m (EUR 8m in Q3 2018). Excluding the goodwill impairment, total expenses are up 9% in local currencies from the previous quarter and down 7% from the fourth quarter of 2017 in local currencies.
Staff costs were up 2% in local currencies from the previous quarter and down 12% from the same period in 2017 in local currencies. The fourth quarter included transformation costs of EUR 18m compared to EUR 6m in the previous quarter.
Other expenses were up 20% in local currencies from the previous quarter due to seasonality. The fourth quarter included higher administrative expenses from several projects and year-end effects. Transformation costs were EUR 6m mainly related to branch closures (EUR 3m in the previous quarter).
Depreciation was up 185% in local currencies from the previous quarter and up 235% from the same quarter of 2017, driven mainly by the goodwill impairment related to Russia (EUR 141m) and higher depreciations due to high allocated costs in previous years.
The number of employees (FTEs) at the end of the fourth quarter was 28,990, largely unchanged from the previous quarter and down 3% from the same quarter of 2017 adjusted for the deconsolidation of the Baltics operations and sale of Nordea Life & Pension Denmark (NLP DK).
Expenses related to Group-related projects, Compliance and Risk that affected the P&L were EUR 124m, compared to EUR 106m in the previous quarter. In addition, EUR 67m was capitalised from Group projects up from EUR 51m in the previous quarter.
The cost/income ratio was up to 66% in the fourth quarter (up to 62% excluding the goodwill impairment), compared to 56% in the previous quarter and 61% in the fourth quarter of 2017.
Total operating expenses
Local currencyQ418 Q318 Q218 Q118 Q417 Q4/Q3 Q4/Q4 Q4/Q3 Q4/Q4
EURmStaff costs -744 -726 -730 -798 -861 2% -14% 2% -12%Other expenses -390 -323 -350 -336 -425 21% -8% 20% -7%Depreciations -250 -87 -74 -71 -75 187% 233% 185% 235%Total Group -1,384 -1,136 -1,154 -1,205 -1,361 22% 2% 21% 3%Total, excl. items affecting comparability¹ -1,243 -1,136 -1,154 -1,205 -1,361 9% -9% 9% -7%1 Excl. items affecting comparability in Q4 2018: EUR 141m loss from impairment of goodwill in Russia.
Total operating expenses per business area Local currency
Q418 Q318 Q218 Q118 Q417 Q4/Q3 Q4/Q4 Q4/Q3 Q4/Q4EURmPersonal Banking -440 -451 -448 -455 -472 -2% -7% -3% -6%Commercial & Business Banking -277 -268 -282 -292 -343 3% -19% 4% -17%Wholesale Banking -230 -221 -208 -242 -249 4% -8% 3% -6%Asset & Wealth Management -194 -182 -180 -203 -217 7% -11% 7% -10%Group Functions and other -243 -14 -36 -13 -80 - - - -Total Group -1,384 -1,136 -1,154 -1,205 -1,361 22% 2% 21% 3%Total, excl. items affecting comparability¹ -1,243 -1,136 -1,154 -1,205 -1,361 9% -9% 9% -7%1 Excl. items affecting comparability in Q4 2018: EUR 141m loss from impairment of goodwill in Russia.
Currency fluctuation effects
Q4/Q3 Q4/Q4Jan-Dec
18/17%-pointsIncome 0 -1 -2Expenses 0 -2 -2Operating profit -1 -1 -2Loan and deposit volumes -1 -1 -1

Nordea Fourth Quarter 2018
12
Q4
Net loan losses Credit quality remained solid with positive net rating migration in Q4 in the retail portfolio and a minor negative rating migration in the corporate portfolio.
Net loan provisions decreased in Q4 to EUR 30m and the loan loss ratio decreased to 5bps (EUR 44m and 8bps in the previous quarter). Loan losses in Q4 were partly due to large provisions for two corporate customers in the retail segment, off-set by lowered management judgement related to the better outlook on US sanctions towards Russia based on available information at the end of Q4.
Under IFRS 9 all performing exposures are classified aseither Stage 1 or 2. Stage 1 if credit quality is unchanged for the exposure and Stage 2 if it has deteriorated into higher risk but is still performing. All exposures in Stages 1 and 2 are subject to statistically calculated provisions. Impaired loans are classified as Stage 3. Provisions for larger Stage 3 exposures are measured on an individual basis, while provisions for smaller exposures in Stage 3 are calculated using a statistical model similar to that used for Stages 1 and 2.
Net loan losses for Stage 3 were EUR 69m and the net loan loss ratio was 12bps (0bps in the previous quarter). Exposures in Stages 1 and 2 had net reversals at EUR -39m and the net loan loss ratio ended at -7bps for Stages 1 and 2 (8bps in the previous quarter).
Overall loan portfolio quality and outlook remain stable. Brexit is expected to have a limited impact on the credit losses for Nordea. Our expectation for the coming quarters is that net losses will remain low and around the average level for 2018.
Mortgage lending in Denmark is measured at fair value and hence, according to IFRS13, not included in net loan losses but adjusted under fair value items. Net loan losses for Personal Banking Denmark thus primarily refers to consumer finance volumes.
Credit portfolioTotal lending to the public, excluding reverse repurchase agreements, is largely unchanged at EUR 291.6bn from EUR 291.7bn in the previous quarter. In local currencies, total lending was unchanged from the previous quarter.
Loans measured at fair value to the public excluding repos were EUR 57bn (EUR 57bn in the previous quarter). This includes Danish mortgage lending at EUR 53bn, which is measured at fair value.
Lending to the public measured at amortised cost was unchanged at EUR 234bn (EUR 234bn in the previous quarter). Of this portfolio EUR 4.6bn is impaired loans in Stage 3 (EUR 4.7bn in the previous quarter). The decrease from the previous quarter was 4%, partly due to customers written-off during the quarter.
The gross impairment rate (Stage 3) was 182bps for loans at amortised cost (188bps in the previous quarter) and 126bps for fair value lending (115bps in the previous quarter). Allowances in relation to impaired loans (Stage 3) for loans measured at amortised cost were 35% (34% in the previous quarter).
Loan loss ratios and impaired loans
Q418 Q318 Q218 Q118 Q417Basis points of loans1,2
Loan loss ratiosannualised, Group 5 8 10 7 9
of which Stage 1 and 2 -7 8 7 -14 -11of which Stage 3 12 0 3 21 20
Personal Banking total 8 3 11 7 2Banking Denmark1 102 54 93 75 -8Banking Finland 12 -2 20 11 2Banking Norway 0 1 3 0 0Banking Sweden 5 5 1 1 3
Commercial & BusinessBanking 17 25 -17 -10 15
BB Denmark 139 265 10 102 2BB Finland 28 15 -12 -65 43BB Norway -15 -4 -55 -27 27BB Sweden 8 10 -9 -2 17BBD Nordic 3 7 3 0 -23
Wholesale Banking1 -11 4 53 31 20Corporate & InvestmentBanking (CIB) 3 13 -8 39 37
of which C&IB excl. SOO 23 14 -22 23 24of which Shipping, Offshore & Oil Services (SOO) -20 -1 14 16 13
Banking Russia -305 -118 1236 -70 -871 Including loans at fair value until Q4 2017. The change mainly relates to PeB DK, BB DK, Wholesale Banking and Nordea Group ratio. Stage 3 figures for Q417 and earlier are individual losses defined under IAS39 as individual. Stages 1 & 2 figures for Q417 and earlier are collective losses defined under IAS39.2 Negative amount are net reversals.

Nordea Fourth Quarter 2018
13
Q4
ProfitOperating profitOperating profit decreased to EUR 689m, down 20% in local currencies, compared to the previous quarter, and down 13% in local currencies compared to the same quarter of 2017.
TaxesIncome tax expense was EUR 197m compared to EUR 182m in the previous quarter. The effective tax rate was 28.9%, compared to 21.1% in the previous quarter and 21.0% in the fourth quarter last year.
Net profitNet profit decreased 28% in local currencies from the previous quarter to EUR 492m. Return on equity was 6.1%, down from 8.7% in the previous quarter.
Diluted earnings per share were EUR 0.12 (EUR 0.17 in the previous quarter).
Operating profit per business area
Local currencyQ418 Q318 Q218 Q118 Q417 Q4/Q3 Q4/Q4 Q4/Q3 Q4/Q4
EURmPersonal Banking 252 229 226 323 268 10% -6% 10% -3%Commercial & Business Banking 218 167 237 274 131 31% 66% 27% 63%Wholesale Banking 132 192 207 210 123 -31% 7% -31% 10%Asset & Wealth Management 219 226 251 249 292 -3% -25% -3% -24%Group Functions and other -132 52 407 14 -18 - - - -Total Group 689 866 1,328 1,070 796 -20% -13% -20% -13%Total, excl. items affecting comparability¹ 744 866 979 935 796 -14% -7% -14% -5%1 Excl. items affecting comparability in Q4 2018: EUR 50m gain from revaluation of Euroclear, EUR 38m after tax, EUR 36m gain related to sale of Ejendomme and EUR 141m loss from impairment of goodwill in Russia. Q2 2018: tax free gain related to divestment of shares in UC EUR 87m and tax free gain related to the sale of Nordea Liv & Pension Denmark EUR 262m. In Q1 2018: EUR 135m gain from valuation model update in Denmark, EUR 105m after tax.
Full year 2018 compared to full year 2017 Total income was down 3% in local currencies and down 5% in EUR from the prior year and operating profit was up 1% in local currencies and down 1% in EUR from the previous year.
IncomeNet interest income was down 5% in local currencies and 7% in EUR from 2017. Average lending volumes in business areas in local currencies were down by 3% compared to 2017 driven by Wholesale Banking. Average deposit volumes were down by 4% predominantly in Wholesale Banking.
Net fee and commission income decreased 9% in local currencies and 11% in EUR from the previous year.
Net result from items at fair value decreased in local currencies by 16% and by 18% in EUR from 2017.
ExpensesTotal expenses were down 2% in local currencies and 4% in EUR from the previous year and amounted to EUR 4,879m. Staff costs were down 5% in local currencies and down 7% in EUR.
Net loan lossesNet loan loss provisions decreased to EUR 173m (down from EUR 369m in 2017), corresponding to a loan loss ratio of 7bps (down from 12bps in 2017). The decrease is related to less new/increased provisions in 2018 for Stage 3 whereas the realized loan losses are on unchanged level (2018 at EUR 479m and 2017 at EUR 435m). Lower provisions compared to 2017 is related to corporate portfolios, where Shipping, Oil and Offshore has the highest decrease with net loan losses being almost 80% lower in 2018 compared to 2017. The impact from IFRS9 implementation has been limited over the year.
Net profitNet profit increased 2% in local currencies and 1% in EUR and amounted to EUR 3,081m.
Currency fluctuation impactCurrency fluctuations had a negative effect of 2%-points on income, expenses and operating profits compared to a year ago. For the loan and deposit volumes, the currency fluctuations had a negative effect of 1%-point compared to a year ago.

Nordea Fourth Quarter 2018
14
Q4
Other information Capital position and risk exposure amount (REA) Nordea Group’s common equity tier 1 (CET1) capital ratio decreased to 15.5% at the end of Q4 2018 compared to 20.3% at the end of the third quarter 2018. Risk exposure amount (REA) increased by EUR 35.1bn mainly due to the implementations of the Swedish mortgage floor in Pillar I and the ECB permission for continued use of the internal models1 (“IRB floors”) - see more details and impact under capital requirements under Changes to the applicable capital requirements regime due to Nordea’s re-domiciliation to Finland. CET1 capital decreased by EUR 0.3bn, mainly driven by FX effects in retained earnings and dividend accrual.
The tier 1 capital ratio decreased to 17.3% from 22.6% compared to the previous quarter and the total capital ratio decreased to 19.9% from 26.3% compared to the previous quarter.
At the end of the fourth quarter 2018, the CET1 capital was EUR 24.1bn, the Tier 1 capital was EUR 27.0bn and the Own Funds were EUR 31.0bn.
The CRR leverage ratio increased to 5.1%, compared to 4.9% in the previous quarter.
Economic Capital (EC) was EUR 26.6bn at the end of the fourth quarter, an increase by EUR 0.3bn compared to the third quarter of the year. Increased PI Credit risk, PI Market risk and Nordea Life & Pension were somewhat offset by decreasing PII Credit risk and Prudent valuation. Capital ratios
Q418 Q318 Q218 Q118 Q417%CRR/CRDIVCET 1 cap. ratio 15.5 20.3 19.9 19.8 19.5Tier 1 capital ratio 17.3 22.6 22.2 22.3 22.3Total capital ratio 19.9 26.3 25.4 25.2 25.2
Regulatory developmentsOn 20 December, the Board of the Finnish FSA decided to remove the status of Nordea as globally important institution (G-SII) from 1 January 2020. The decision is based on the earlier removal from G-SIB list by the Financial Stability Board (FSB). This is not expected to impact the capital requirements due to the implementation of Other Systemic Important Institution (O-SII) buffer in Q1 2019 and the systemic risk buffer in Q3 2019.
The Norwegian Ministry of Finance, on 13 December, decided to raise the countercyclical buffer rate from 2% to 2.5%. The amended buffer enters into force on 31 December 2019.
In Finland, the implementation of EU Creditor Hierarchy Directive (2017/2399) has been finalised and the changes in legislation was approved on 9 November 2018. The changes enable Nordea to issue so-called senior non-preferred (SNP) in statutory format, i.e. in the Terms & Conditions referring the ranking of SNP directly to the Finnish law. As a result of the changes in legislation, Nordea has aligned the SNP issued earlier in contractual format to statutory format.
Risk exposure amount, REA (EURbn), quarterly
Common equity tier 1 (CET 1) capital ratio, changes in the quarter
1 https://www.nordea.com/en/press-and-news/news-and-press-releases/press-releases/2018/08-17-13h40-nordea-has-received-permission-for-continued-use-of-existing-internal-models-from-the-ecb.html

Nordea Fourth Quarter 2018
15
Q4
Changes to the applicable capital requirements regime due to Nordea’s re-domiciliation to Finland When Nordea Group, on 1 October 2018, changed the domicile of its parent company to Finland, the overall supervisory responsibility for the Nordea Group moved to the European Central Bank (ECB). As part of the ECB permission for continued use of the internal models for calculation of risk exposure amounts (REA), Nordea was required to migrate parts of the previous Pillar 2 add-ons into Pillar 1 REA and impose limitations to certain models within Credit and Market risk. The ECB decision included an updated PD-scale to include add-ons in the calculation imposed by the Swedish FSA. As a result, REA increased by approx. EUR 35.8bn while the CET1 capital add-ons in pillar 2 decreased approximately EUR 3.8bn. Consequently, the regulatory CET1 capital requirement including Pillar 2 decreased from 18.0% in Q3 2018 to 11.1% in Q4 2018. The regulatory CET1 capital requirement will increase by 2% in Q1 2019 when Finland will introduce a 2% buffer for systemic risk (O-SII). The CET1 capital requirement will further increase by 1% in Q3 2019 when the 3% systemic risk buffer (SRB) is implemented.
Due to the uncertainty on the future capital requirements for Nordea, also considering that Finland has not yet fully introduced the systemic risk buffer, Nordea has voluntarily committed to comply with nominal capital requirements from the 2018 Supervisory Review and Evaluation Process (SREP) until the ECB has issued its SREP decision in 2019. This commitment amounts to EUR 27.8bn in total capital and 21.7bn in CET1 capital or 13.9% of REA. Nordea expect to receive ECB’s decision establishing prudential requirements in late 2019, effective from Q1 2020.
Development of Nordea’s CET1 capital requirements
18,0%16,4%
14,0%
11,0% 11,0% 11,1% 11,1%
13,9%
0,10%
2,8%
1,6%
2,4%
3,0%
0%
2%
4%
6%
8%
10%
12%
14%
16%
18%
20%
Q3 2018 Migration ofrisk weightfloors to P1
Other itemsmoved from
P2 to P1
Temporaryreduction insystemic risk
Increase inCCyB
RegulatoryCET1
requirementQ4 2018
Nordea CET1additional
committment
CET1 capitalcommittment
Q4 2018

Nordea Fourth Quarter 2018
16
Q4
Balance sheet Total assets in the balance sheet in the quarter were EUR 22bn lower than in the previous quarter and amounted to EUR 551bn. Both loans to credit institutions and to the public as well as other assets were lower than in the previous period, while the asset values of derivatives and interest-bearing securities were unchanged compared to the previous quarter.
Loans to the public were EUR 8bn lower in the quarter and amounted to EUR 308bn compared to EUR 316bn in the previous quarter.
Other assets decreased by EUR 10bn to EUR 119bn from the previous quarter.
Balance sheet data Q418 Q318 Q218 Q118 Q417
EURbnLoans to credit institutions 11 16 13 17 9Loans to the public 308 316 315 311 310Derivatives 37 37 44 42 46Interest-bearing securities 76 75 75 73 75Other assets 119 129 123 137 142Total assets 551 573 570 580 582
Deposits from credit inst. 42 52 50 50 40Deposits from the public 165 174 176 174 172Debt securities in issue 190 187 178 175 179Derivatives 40 39 45 38 43Other liabilities 81 88 89 112 114Total equity 33 33 32 31 33Total liabilities and equity 551 573 570 580 582
Nordea’s funding and liquidity operationsNordea issued approx. EUR 0.9bn in long-term funding in the fourth quarter excluding Danish covered bonds and subordinated notes, of which approx. EUR 0.7bn representedissuance of Swedish and Norwegian covered bonds in domestic markets.
Nordea’s long-term funding portion of total funding at the end of the fourth quarter was approx. 77%.
In December, Nordea was awarded Financial Issuer of the Year and Covered Bond of the year by International Financing Review.
Short-term liquidity risk is measured using several metrics and the Liquidity Coverage Ratio (LCR) is one such metric.The LCR for the Nordea Group was, according to the CRR LCR definition, 185% at the end of the fourth quarter. The LCR in EUR was 257% and in USD 214% at the end of the fourth quarter. The liquidity buffer is composed of highly liquid central bank eligible securities and cash with characteristics like CRD IV high-quality liquid assets and amounted to EUR 104bn at the end of the fourth quarter (EUR 108bn at the end of the third quarter). The long-term liquidity risk is measured as Net Stable Funding Ratio (NSFR). At the end of the fourth quarter 2018, Nordea’s NSFR was 104.1% (Q3 107,1%). Funding and liquidity data*
Q418 Q318 Q218 Q118 Q417Long-term funding portion 77% 79% 84% 83% 81%LCR total 185% 209% 147% 174% 147%LCR EUR 257% 253% 154% 192% 257%LCR USD 214% 240% 160% 180% 170%*LCR figures calculated based on EU DA LCR starting from Q118; previous figures based on Swe LCR
Market risk From Q3, the reporting of the Trading Book uses the enhanced model in which several additional risk factors in the Value-at-Risk (VaR) model are used to calculate the regulatory capital requirement.
Total market risk, measured as Value at Risk, in the trading book was EUR 18m, an increase from the previous quarter (EUR 15m) mainly driven by interest rate risk and credit spread risk, primarily from market risk in Europe and Scandinavia.
Trading bookQ418 Q318 Q218 Q118 Q417
EURmTotal risk, VaR 18 15 12 13 11Interest rate risk, VaR 16 15 11 13 10Equity risk, VaR 2 4 2 1 3Foreign exchange risk, VaR 2 2 2 2 5Credit spread risk, VaR 6 3 4 4 4Inflation risk 2 1 - - -Diversification effect 38% 43% 40% 39% 50%
Total market risk, measured as Value at Risk, in the banking book decreased to EUR 38m (EUR 49m in the previous quarter) driven by lower interest rate exposure on the liquidity buffer.
Banking bookQ418 Q318 Q218 Q118 Q417
EURmTotal risk, VaR 38 49 38 37 46Interest rate risk, VaR 39 49 38 38 47Equity risk, VaR 5 5 3 5 3Foreign exchange risk, VaR 1 2 1 3 3Credit spread risk, VaR 1 1 1 1 1Diversification effect 20% 13% 11% 20% 15%
Nordea share and ratingsNordea’s share price and ratings as at the end of Q4 2018.
Nasdaq STO (SEK)
Nasdaq COP (DKK)
Nasdaq HEL (EUR)
3/31/2017 102.30 79.90 10.726/30/2017 107.20 83.15 11.149/30/2017 110.40 85.15 11.44
12/31/2017 99.30 75.20 10.103/31/2018 89.10 63.12 8.616/30/2018 86.28 61.38 8.259/30/2018 96.86 70.02 9.46
12/31/2018 74.58 54.23 7.27
Moody's Standard&Poor's FitchShort Long Short Long Short LongP-1 Aa3 A-1+ AA- F1+ AA-

Nordea Fourth Quarter 2018
17
Q4
Nordea’s re-domiciliation to the Banking Union On 1 October 2018, Nordea executed the re-domiciliation of the parent company to Finland, a European banking union member state. The decision was part of Nordea’s overall strategic direction, enabling us to operate in an environment that offers stability, predictability and a level playing field. At time of the decision, Nordea expected the net present value of the savings related to resolution fees, deposit guarantees and other transitional effects arising from the re-domiciliation to Finland to be approximately EUR 0.9 -1.2bn.
To the best of Nordea’s knowledge, Nordea still expects the financial impact to be largely at the same level. The discussions with the regulators in the Single Supervisory Mechanism (SSM), also point to that the regulatory environment in the banking union offers stability, predictability and a level playing field.
DividendThe Board of Directors is going to propose to the AGM a dividend of EUR 0.69 per share (EUR 0.68) and furthermore that the record date for dividend should be 1 April 2019. The dividend corresponds to a payout ratio of 91% of net profit. The total proposed dividend amounts to EUR 2,788m.
The ex-dividend date for the Nordea share is 29 March 2019. The dividend payments are scheduled to be made on 8 April 2019.
Update on the sale of LuminorIn 2018, Nordea and DNB entered into an agreement to jointly sell 60 per cent of Luminor to a consortium led by private equity funds managed by Blackstone (“Blackstone”) at a valuation of 1.0x P/BV.
The decision for Nordea to sell the shares in Luminor is pursuant to Nordea’s overall ambition to simplify and focus its operations to the Nordic core markets and become an even better bank for its customers. The sale is the natural next step following the establishment of Luminor in 2017 whereby Nordea and DNB created the third largest bank in the region.
The transaction is, inter alia, subject to customary regulatory approvals and is expected to close during H1 2019. Following the transaction, each of Nordea and DNB will hold approx. 20 per cent of Luminor and maintain ongoing representation on Luminor’s Board of Directors. Nordea and Blackstone have additionally entered into a forward sale agreement for the sale of Nordea’s remaining 20 per cent stake, carried out at a valuation of 0.9x P/BV. The forward sale is subject to certain conditions but is expected to complete over three financial years after completion of the transaction.
The final purchase price and financial impact will be settled upon closing, based on a locked box principle, and is therefore subject to the business performance in Luminor up until then. It is currently expected that the loss on closing will amount to approx. EUR 75m (driven by, in order of magnitude, the write down on the remaining equity stake, transaction costs related to the Luminor merger and sale to Blackstone and the business performance). The upfront sale is expected to have a positive impact on Nordea’s Common Equity Tier 1 (“CET1”) ratio of approx. 20bps upon completion of the transaction. Pro-forma for the complete sale of Nordea’s ownership in Luminor under the forward sale agreement and after Luminor has returned its funding to
Nordea, the positive impact on Nordea’s CET1 ratio is expected to be approx. 45bps.
Update on the acquisition of GjensidigeOn 2 July 2018, Nordea entered into an agreement to acquire all shares in Gjensidige Bank. The acquisition has been approved by the Norwegian Competition Authority, but the approval from the Norwegian Ministry of Finance is still pending. The plan is to transition Gjensidige Bank customers to Nordea during this year.
Profit sharing and Long-term incentivesThe three decided criteria for the outcome of the profit share programme 2018 are; Return on Capital at Risk (ROCAR), Development of Return on Equity (ROE) against competitors and Customer Net Promoter Score (NPS). If performance criteria are fully met, the cost will amount to approx. EUR 93m.
The provision for Nordea’s profit-sharing scheme and the LTIPs was EUR 57m compared to EUR 27m in 2017. The 2018 amount includes EUR 10m referring to a too low accrual in 2017 due to a higher than estimated NPS.
Performance related salariesPerformance-related salaries at Nordea include bonuses, variable salary parts and the executive incentive programmes. In order to attract and retain expertise in areas directly exposed to international competition – Capital Markets, Corporate & Investment Banking, Asset Management, Treasury and ALM – Nordea offers performance-related salaries in the form of bonuses to selected staff groups in these areas.
Nordea’s ambition is to have competitive, but not market-leading, total remuneration offering.
The provisions for bonus in 2018 decreased to EUR 125m from EUR 181m in 2017. The decrease is mainly explained by lower performance in Capital Markets. The payout ratio – total staff costs including fixed salaries and bonuses in relation to total income – for the areas with bonus programmes was 14.0% in 2018 compared to 11.9% in 2017. The increase in payout ratio is related to both a generally lower income level as well as a changed income set-up in TALM where more income is distributed to business areas. The bonus in relation to total income decreased to 3.3% in 2018 compared to 3.6% in 2017.
Variable salary parts in other areas or units increased to EUR 73m in 2018 from EUR 59m in 2017. Nordea variable salary parts are capped – normally to 3 months’ fixed salary.The provisions in 2018 for executive incentive programmes amounted to EUR 40m (EUR 44m in 2017). The provisions for performance-related salaries in the fourth quarter amounted to EUR 54m, (EUR 56m in the third quarter).

Nordea Fourth Quarter 2018
18
Q4
Closing of sale of Nordea EjendommeThe sale of Nordea Ejendomme to the property management company DEAS A/S was closed in Q4 2018. The transaction resulted in a capital gain of approximately EUR 36m, recognised in the line item Other operating income.
Defined benefit pension plansThe discount rate used when discounting future pension payments is determined by reference to investment-grade corporate bonds, where a deep enough market for such bonds exists. Covered bonds are in this context considered to be corporate bonds. In countries where no such market exists, the discount rate is determined by reference to government bond yields. In Sweden, Norway and Denmark the discount rate is determined with reference to covered bonds and in Finland with reference to corporate bonds. The discount rates used at the end of the fourth quarter were 2.17% for Sweden, 2.82% for Norway, 1.58% for Finland and 1.80% for Denmark. The total re-measurement loss on other comprehensive income amounted to EUR 115m before income tax in the fourth quarter.
Update on the sale of collection portfoliosIn Q4 2017 Nordea signed an agreement to divest a portfolio of non-performing loans in Denmark. The portfolio consists of around 40,000 claims, the principal value amounts to approximately EUR 500m and the transaction is expected to generate a capital gain of roughly EUR 40-50m. In Q4 2018, the financial impact was EUR 10m and recognised in “Net result from items at fair value”.
Furthermore, Nordea has in Q4 2018 entered into an agreement with the Norwegian company B2Holding to sell a portfolio of non-performing loans. A total of 12,000 non-performing customer accounts will be transferred to B2Holding, which operates the debt collection company Nordic Debt Collection in Denmark. The portfolio of close to 12,000 customer accounts represents total debt of EUR 388m. The transfer took place on 31 October 2018, and also meant that six employees were transferred to Nordic Debt Collection at 1 December 2018. Upon completion of the transaction, Nordea is expected to generate a capital gain of approximately EUR 35-45m which will be included in the financial statements for 2019 as the loan documentation is transferred to the buyer.
Nordea has furthermore signed an agreement to divest a Swedish non-performing loans portfolio. The transaction generated a capital gain of approx. EUR 6m in Q4 2018.
Goodwill impairment following de-risking of Russian portfolioNordea has, as part of a conscious de-risking of the bank, reduced its loan book in Russia by more than 60% since 2014, including a divestment of the household loan book. As a consequence of this de-risking, Nordea has in the fourth quarter of 2018 impaired the goodwill related to Russia of EUR 141m, which will be reported as depreciation.
The goodwill impairment will not impact the cash flow or the Common Equity Tier 1 ratio and will have a marginally positive impact on the bank’s Return on Equity from 2019 onwards.
This goodwill impairment is excluded from Nordea’s guidance for 2018.
Update on the sale of Nordea's Luxembourg-based International private banking business The sale of Nordea’s Luxembourg-based International private banking business to UBS was closed in Q4 2018. Assets and liabilities held for sale were consequently derecognised. The capital impact on closing was close to zero after transaction costs and the impact on the CET1 ratio marginally positive.
Update on outsourcing of mainframe computer operations to IBM On 8 January 2019, Nordea and IBM entered a USD 540m Multi-Year Services Pact. A total of 117 Nordea employees in Sweden, Denmark, Finland, Norway and Poland will move as the bank outsources its IBM Z operations. In this highly specialised field of infrastructure technology, we foresee challenges recruiting in the long run. By outsourcing we are securing our operations over time. We believe that IBM, with their service model, can run the systems efficiently. IBM has the size, expertise and is currently a trusted supplier already.
Update on the ongoing Asset Quality review (AQR) Nordea is currently undergoing an Asset Quality Review (AQR) which is standard practice for any new banks entering the eurozone. The purpose of the AQR is transparency, build confidence and identify any corrective actions needed, as well as building the new relationship with Nordeas new regulator. The focus of the asset review is on complex and high-risk instruments as well as provisioning levels for credit exposures in terms of processes, credit files and models. Furthermore, an additional stress test is performed where focus is on analysis of solvency ratio given the Comprehensive Assessment scenarios. The AQR is currently ongoing and is expected to be finalized during H1-2019.
Annual General MeetingThe Annual General Meeting (AGM) will be held on Thursday 28 March at Finlandia Hall, Mannerheimintie 13 e, Helsinki at 13.00 EET.

Nordea Fourth Quarter 2018
19
Q4
Quarterly development, GroupQ4 Q3 Q2 Q1 Q4 Jan-Dec Jan-Dec
2018 2018 2018 2018 2017 2018 2017EURmNet interest income 1,126 1,072 1,073 1,053 1,109 4,324 4,666Net fee and commission income 720 703 800 770 839 2,993 3,369Net result from items at fair value 182 205 260 441 235 1,088 1,328Profit from associated undertakings and joint ventures accounted for under the equity method 15 48 33 28 16 124 23Other operating income 60 18 375 23 29 476 83Total operating income 2,103 2,046 2,541 2,315 2,228 9,005 9,469
General administrative expenses:Staff costs -744 -726 -730 -798 -861 -2,998 -3,212Other expenses -390 -323 -350 -336 -425 -1,399 -1,622
Depreciation, amortisation and impairment charges of tangible and intangible assets -250 -87 -74 -71 -75 -482 -268Total operating expenses -1,384 -1,136 -1,154 -1,205 -1,361 -4,879 -5,102
Profit before loan losses 719 910 1,387 1,110 867 4,126 4,367
Net loan losses -30 -44 -59 -40 -71 -173 -369Operating profit 689 866 1,328 1,070 796 3,953 3,998
Income tax expense -197 -182 -243 -250 -167 -872 -950Net profit for the period 492 684 1,085 820 629 3,081 3,048
Diluted earnings per share (DEPS), EUR 0.12 0.17 0.27 0.20 0.15 0.76 0.75DEPS, rolling 12 months up to period end, EUR 0.76 0.79 0.83 0.74 0.75 0.76 0.75
Nordea Fourth Quarter 2018
20
Q4
Business areasPersonal Banking
Commercial & Business Banking
Wholesale Banking
Asset & Wealth Management
Group Functions, Other and
Eliminations Nordea GroupQ4 Q3 Q4 Q3 Q4 Q3 Q4 Q3 Q4 Q3 Q4 Q3
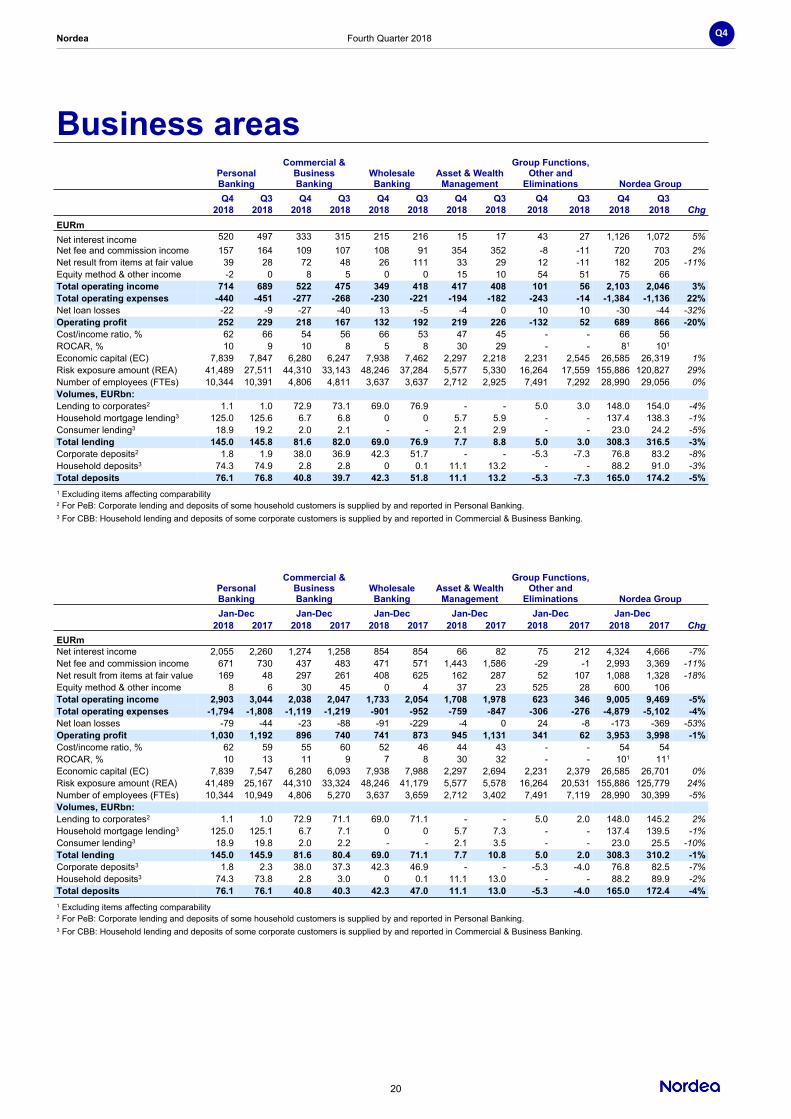
2018 2018 2018 2018 2018 2018 2018 2018 2018 2018 2018 2018 ChgEURmNet interest income 520 497 333 315 215 216 15 17 43 27 1,126 1,072 5%Net fee and commission income 157 164 109 107 108 91 354 352 -8 -11 720 703 2%Net result from items at fair value 39 28 72 48 26 111 33 29 12 -11 182 205 -11%Equity method & other income -2 0 8 5 0 0 15 10 54 51 75 66Total operating income 714 689 522 475 349 418 417 408 101 56 2,103 2,046 3%Total operating expenses -440 -451 -277 -268 -230 -221 -194 -182 -243 -14 -1,384 -1,136 22%Net loan losses -22 -9 -27 -40 13 -5 -4 0 10 10 -30 -44 -32%Operating profit 252 229 218 167 132 192 219 226 -132 52 689 866 -20%Cost/income ratio, % 62 66 54 56 66 53 47 45 - - 66 56ROCAR, % 10 9 10 8 5 8 30 29 - - 81 101
Economic capital (EC) 7,839 7,847 6,280 6,247 7,938 7,462 2,297 2,218 2,231 2,545 26,585 26,319 1%Risk exposure amount (REA) 41,489 27,511 44,310 33,143 48,246 37,284 5,577 5,330 16,264 17,559 155,886 120,827 29%Number of employees (FTEs) 10,344 10,391 4,806 4,811 3,637 3,637 2,712 2,925 7,491 7,292 28,990 29,056 0%Volumes, EURbn:Lending to corporates2 1.1 1.0 72.9 73.1 69.0 76.9 - - 5.0 3.0 148.0 154.0 -4%Household mortgage lending3 125.0 125.6 6.7 6.8 0 0 5.7 5.9 - - 137.4 138.3 -1%Consumer lending3 18.9 19.2 2.0 2.1 - - 2.1 2.9 - - 23.0 24.2 -5%Total lending 145.0 145.8 81.6 82.0 69.0 76.9 7.7 8.8 5.0 3.0 308.3 316.5 -3%Corporate deposits2 1.8 1.9 38.0 36.9 42.3 51.7 - - -5.3 -7.3 76.8 83.2 -8%Household deposits3 74.3 74.9 2.8 2.8 0 0.1 11.1 13.2 - - 88.2 91.0 -3%Total deposits 76.1 76.8 40.8 39.7 42.3 51.8 11.1 13.2 -5.3 -7.3 165.0 174.2 -5%1 Excluding items affecting comparability2 For PeB: Corporate lending and deposits of some household customers is supplied by and reported in Personal Banking.3 For CBB: Household lending and deposits of some corporate customers is supplied by and reported in Commercial & Business Banking.
Personal Banking
Commercial & Business Banking
Wholesale Banking
Asset & Wealth Management
Group Functions, Other and
Eliminations Nordea GroupJan-Dec Jan-Dec Jan-Dec Jan-Dec Jan-Dec Jan-Dec
2018 2017 2018 2017 2018 2017 2018 2017 2018 2017 2018 2017 ChgEURmNet interest income 2,055 2,260 1,274 1,258 854 854 66 82 75 212 4,324 4,666 -7%Net fee and commission income 671 730 437 483 471 571 1,443 1,586 -29 -1 2,993 3,369 -11%Net result from items at fair value 169 48 297 261 408 625 162 287 52 107 1,088 1,328 -18%Equity method & other income 8 6 30 45 0 4 37 23 525 28 600 106Total operating income 2,903 3,044 2,038 2,047 1,733 2,054 1,708 1,978 623 346 9,005 9,469 -5%Total operating expenses -1,794 -1,808 -1,119 -1,219 -901 -952 -759 -847 -306 -276 -4,879 -5,102 -4%Net loan losses -79 -44 -23 -88 -91 -229 -4 0 24 -8 -173 -369 -53%Operating profit 1,030 1,192 896 740 741 873 945 1,131 341 62 3,953 3,998 -1%Cost/income ratio, % 62 59 55 60 52 46 44 43 - - 54 54ROCAR, % 10 13 11 9 7 8 30 32 - - 101 111
Economic capital (EC) 7,839 7,547 6,280 6,093 7,938 7,988 2,297 2,694 2,231 2,379 26,585 26,701 0%Risk exposure amount (REA) 41,489 25,167 44,310 33,324 48,246 41,179 5,577 5,578 16,264 20,531 155,886 125,779 24%Number of employees (FTEs) 10,344 10,949 4,806 5,270 3,637 3,659 2,712 3,402 7,491 7,119 28,990 30,399 -5%Volumes, EURbn:Lending to corporates2 1.1 1.0 72.9 71.1 69.0 71.1 - - 5.0 2.0 148.0 145.2 2%Household mortgage lending3 125.0 125.1 6.7 7.1 0 0 5.7 7.3 - - 137.4 139.5 -1%Consumer lending3 18.9 19.8 2.0 2.2 - - 2.1 3.5 - - 23.0 25.5 -10%Total lending 145.0 145.9 81.6 80.4 69.0 71.1 7.7 10.8 5.0 2.0 308.3 310.2 -1%Corporate deposits3 1.8 2.3 38.0 37.3 42.3 46.9 - - -5.3 -4.0 76.8 82.5 -7%Household deposits3 74.3 73.8 2.8 3.0 0 0.1 11.1 13.0 - - 88.2 89.9 -2%Total deposits 76.1 76.1 40.8 40.3 42.3 47.0 11.1 13.0 -5.3 -4.0 165.0 172.4 -4%1 Excluding items affecting comparability2 For PeB: Corporate lending and deposits of some household customers is supplied by and reported in Personal Banking.3 For CBB: Household lending and deposits of some corporate customers is supplied by and reported in Commercial & Business Banking.

Nordea Fourth Quarter 2018
21
Q4
Personal BankingNordea has the largest customer base of any bank in the Nordic region. In Personal Banking around 10,000 people are working every day to deliver greater customer experiences to more than 9 million household customers. We do this through a combination of physical and digital channels offering a full range of financial services and solutions.
The Personal Banking business area includes advisory and service staff, channels, product units, back office, digital development and IT under a common strategy, operating model and governance across markets.
Through strong engagement and valuable advice, the aim is that Personal Banking customers entrust Nordea with all their banking business. Reflecting the rapid changes in customer preferences, Personal Banking’s relationship banking concept also encapsulates and integrates digital channels through constantly expanding the mobile offering.
In Personal Banking, we want to be the leading personal bank in the Nordics. We want to be known for being safe and trusted, by customers, partners and society at large alike. We leverage our Nordic presence and we continue to develop our agile ways of working. On the back of this, we aim to become the best among Nordic peers, on both profitability, customer satisfaction and employee satisfaction.
Business developmentPersonal Banking continues its significant transformation both in the distribution network and by means of an agile development operating model, to deliver on customers’ expectations regarding digitalisation and service.
The influence of digitalisation changes what is expected from us, and we aim to deliver easy banking for our customers, seamlessly through multiple channels – anywhere, anytime, digitally and in person, while providing the most relevant and competent advisory service.
During 2018, we launched an array of new services and solutions for our customers, in addition to improving availability and accessibility. For instance, we have: Improved our digital daily banking experience for customers
via the launch of the completely redesigned mobile banking app in Finland and in Sweden in 2018. Denmark and Norway will follow in 2019. With the new app, the bank is available anywhere, any time and personalised to the customer’s preferences. Within a month of the introduction in Sweden, 35% of mobile users had migrated to the new app. In Finland, 100% all mobile users now have the new user experience.
Provided our customers with easy payment solutions. Our strong mobile payment suite now includes both Apple Pay and Google Pay – a Nordic first in the payment services landscape.
Our service robot Nova helps our customers to instantly chat with their bank now in all markets. Robotics are also used widely in our backend functions, giving customers a smoother experience. For example, loan commitments are given to customers within minutes in Norway.
Leveraged our scale and quality of solutions. Seamless and fully digitalised customer experiences enabled by the new Core Banking Platform have been introduced, now with 800 000 Finnish savings accounts up and running on the new platform. Continuously provided relevant and competent advisory in
all channels – now also with our digital advisor Nora in all markets, allowing customers to receive investment advice on their own at any time. We have also developed digital and automated solutions to make it easier for our customers to manage their finances, for instance with a new finances calculator that enables a quick overview of the customer’s financial situation.

Nordea Fourth Quarter 2018
22
Q4
Priorities for 2019We will increase business momentum though improved
customer satisfaction, and by focusing on three key initiatives:- Winning home owners in each market- Increasing savings business with our Premium customers - Accelerating digitalisation and substantially increasing momentum within consumer finance
We will also drive structural cost efficiency though:- Leveraging cost-efficient digital touchpoints for service and sales- Further automating and simplifying processes
ResultTotal income increased 4% from the previous quarter, mainly driven by net interest income and net result from items at fair value. Net interest income was up 5% in local currencies compared to the previous quarter, mainly due to a correction of deposit guarantee fees in the fourth quarter.
Lending volumes in local currency were stable from the previous quarter and have increased 1% since last year, not least driven by solid growth in Norway. After a challenging beginning to the year in Sweden, mortgage lending returned to a slightly positive trend in the second half of the year leaving end year volumes at the same level as at the end of 2017. Denmark and Finland also showed a stable performance through 2018.
Net fee and commission income decreased 5% in local currencies compared to the previous quarter. This was driven by lower savings income due to turmoil in equities and lower payments income. The increase in items at fair value in the fourth quarter this year stemmed primarily from items affecting comparability.
Total expenses decreased 3% in local currencies from the previous quarter, 6% compared to the same period last year, in line with the continuous rightsizing of the organisation. The fourth quarter of 2017 thus carried a significant amount of transformation costs, compared to the same quarter this year.
Loan losses increased from the previous quarter due to a reversal in Finland in the third quarter. Compared to the same period last year loan losses appear significantly higher, due to model changes following from implementation of IFRS9 and IFRS13 at the beginning of the year, affecting significantly both Denmark and Finland.
Personal Banking DenmarkTotal income decreased 2% compared to the previous quarter, primarily related to net fee and commission income. The development relates to a lower level of assets under management, reflecting unstable market rates, but also a reversal of card fees related to the implementation of the daily banking customer offering. Compared to the same period last year net fee and commission income is furthermore affected by the sale of Nordea Life & Pension in 2018.
Net interest income increased 3% from the previous quarter related to the correction of regulatory fees in the fourth quarter. Mortgage lending volume was stabilised and showed a positive trend over the year while consumer lending decreased due to low customer demand.
Total expenses were slightly down compared to previous period but ended 2% above the same period last year due to transformation costs booked throughout 2018.
Loan loss provisions were realised at a higher level than 2017, following from the implementation of IFRS 13. Actual loan losses remain at a low level.
In the fourth quarter, availability to serve customers’ needs was expanded as the bank is now open for complex advisory from 8 a.m.–8 p.m. on weekdays and from 10 a.m.–6 p.m. at weekends. Furthermore, several new user-friendly customer solutions have been launched, e.g. Google pay and a service enabling customers to easily handle their subscriptions.
Personal Banking FinlandTotal income increased 4% from the previous quarter, while decreasing 6% from the same period last year. Net interest income was up 3% mainly due to lower regulatory fees in the fourth quarter. Lending volumes were stable compared to the previous quarter and decreased 1% compared to the same period last year. The year ended on a positive trend for new sales of housing loans.
Other income increased compared to the previous quarter, mainly driven by a higher result on items at fair value.
Total expenses increased 2% from the previous quarter due to investments in improved service availability as well as customer communication. Total expenses decreased 8% compared to the same period last year due to transformation costs booked in 2017.
Loan losses were back to normal levels after reversals in the previous quarter.
Personal Banking NorwayTotal income in local currency was up 2% in the fourth quarter, driven mainly by higher net interest income. Net interest income in local currency was up 7% due to change of fund transfer price, increased lending volumes, deposit margins and regulatory fees. Lending volumes were up 5% over the year. The growth was mainly driven by improved demand for mortgage lending.
Net fee and commission income in local currency decreased by 5% compared to the previous quarter on lower payment income and lower savings income due to turmoil in equities. Net result on items at fair value was down due to items affecting comparability booked in the previous quarter.
Total expenses in local currency decreased significantly by 14% from the previous quarter due to transformation costs booked in the third quarter primarily.
Loan losses were very low in the quarter and credit quality remained high.
Preparations for the closing of the acquisition of Gjensidige Bank continued according to plan.

Nordea Fourth Quarter 2018
23
Q4
Personal Banking SwedenTotal income in local currency increased 7% from the previous quarter.
Net interest income in local currency was up 7% compared to the previous quarter following higher lending margins and lower regulatory fees as lending volumes remained stable.
Other income increased compared to the previous quarter, mainly driven by a higher result on items at fair value.
Compared to the same period last year total income was down 4 % in local currency, following lower deposit and lending margins, reflecting the general price pressure on the Swedish mortgage market. Commission income in local currency increased by 4 % due to higher payment income.
Total expenses in local currency were up in the fourth quarter due to higher cost of anti-fraud and marketing campaigns.
The cost level was still lower than the same period last year though, as transformation costs were booked in 2017.
Loan losses remained stable and on a low level.
Green mortgage loans were implemented during the autumn.
Distribution agreement with Asset & Wealth Management The result excluding the distribution agreement with Asset & Wealth Management is according to the principle that all income, expense, and capital are allocated to the customer-responsible unit. This principle aligns with the internal management reporting and with the principle applied to all other product units in the group. Country results below are shown including the distribution agreement.

Nordea Fourth Quarter 2018
24
Q4
Personal Banking totalLocal curr. Jan-Dec 18/17
Q418 Q318 Q218 Q118 Q417 Q4/Q3 Q4/Q4 Q4/Q3 Q4/Q4Jan-
Dec 18Jan-
Dec 17 EUR LocalEURmNet interest income 520 497 510 528 561 5% -7% 5% -5% 2,055 2,260 -9% -6%Net fee and commission income 157 164 177 173 176 -4% -11% -5% -10% 671 730 -8% -6%Net result from items at fair value 39 28 14 88 12 39% 31% 169 48Equity method & other income -2 0 2 8 -1 8 6Total income incl. allocations 714 689 703 797 748 4% -5% 4% -3% 2,903 3,044 -5% -2%Total expenses incl. allocations -440 -451 -448 -455 -472 -2% -7% -3% -6% -1,794 -1,808 -1% 1%Profit before loan losses 274 238 255 342 276 15% -1% 16% 3% 1,109 1,236 -10% -7%Net loan losses -22 -9 -29 -19 -8 -79 -44Operating profit 252 229 226 323 268 10% -6% 10% -3% 1,030 1,192 -14% -10%Cost/income ratio, % 62 66 64 57 63 62 59ROCAR, % 10 9 9 13 11 10 13Economic capital (EC) 7,839 7,847 7,705 7,636 7,547 0% 4% 1% 6% 7,839 7,547 4% 6%Risk exposure amount (REA) 41,489 27,511 27,245 26,888 25,167 51% 65% 53% 67% 41,489 25,167 65% 67%Number of employees (FTEs) 10,344 10,391 10,518 10,678 10,949 0% -6% 0% -6% 10,344 10,949 -6% -6%Volumes, EURbn:Lending to corporates1 1.1 1.0 0.8 1.0 1.0 10% 10% 0% 0% 1.1 1.0 10% -10%Household mortgage lending 125.0 125.6 124.4 123.6 125.1 0% 0% 0% 1% 125.0 125.1 0% 1%Consumer lending 18.9 19.2 19.4 19.5 19.8 -2% -5% -1% -4% 18.9 19.8 -5% -4%Total lending 145.0 145.8 144.6 144.1 145.9 -1% -1% 0% 1% 145.0 145.9 -1% 1%Corporate deposits1 1.8 1.9 2.5 2.4 2.3 -5% -22% -5% -25% 1.8 2.3 -22% -25%Household deposits 74.3 74.9 74.7 73.2 73.8 -1% 1% 0% 2% 74.3 73.8 1% 2%Total deposits 76.1 76.8 77.2 75.6 76.1 -1% 0% -1% 1% 76.1 76.1 0% 1%1 Corporate lending and deposits of some household customers in Personal Banking (PeB) is served and reported in PeB.
Personal Banking total excl. Distribution agreement with Wealth ManagementLocal curr. Jan-Dec 18/17
Q418 Q318 Q218 Q118 Q417 Q4/Q3 Q4/Q4 Q4/Q3 Q4/Q4Jan-
Dec 18Jan-
Dec 17 EUR LocalEURmNet interest income 522 495 510 528 561 5% -7% 5% -5% 2,055 2,256 -9% -7%Net fee and commission income 283 298 310 318 322 -5% -12% -5% -10% 1,209 1,317 -8% -6%Net result from items at fair value 38 29 14 88 12 169 50Equity method & other income -1 0 2 7 -1 8 7Total income incl. allocations 842 822 836 941 894 2% -6% 2% -4% 3,441 3,630 -5% -3%Total expenses incl. allocations -467 -478 -475 -484 -500 -2% -7% -3% -6% -1,904 -1,922 -1% 0%Profit before loan losses 375 344 361 457 394 9% -5% 9% -2% 1,537 1,708 -10% -6%Net loan losses -23 -8 -30 -18 -9 -79 -45Operating profit 352 336 331 439 385 5% -9% 5% -6% 1,458 1,663 -12% -8%Cost/income ratio, % 55 58 57 51 56 55 53ROCAR, % 13 13 12 17 15 14 17Economic capital (EC) 8,212 8,218 8,095 8,092 7,980 0% 3% 1% 5% 8,212 7,980 3% 5%Risk exposure amount (REA) 41,489 27,511 27,245 26,888 25,167 51% 65% 53% 67% 41,489 25,167 65% 67%Number of employees (FTEs) 10,344 10,391 10,517 10,678 10,949 0% -6% 0% -6% 10,344 10,949 -6% -6%Volumes, EURbn:Lending to corporates1 1.1 1.0 0.8 1.0 1.0 10% 10% 0% 0% 1.1 1.0 10% -10%Household mortgage lending 125.0 125.6 124.4 123.6 125.1 0% 0% 0% 1% 125.0 125.1 0% 1%Consumer lending 18.9 19.2 19.4 19.5 19.8 -2% -5% -1% -4% 18.9 19.8 -5% -4%Total lending 145.0 145.8 144.6 144.1 145.9 -1% -1% 0% 1% 145.0 145.9 -1% 1%Corporate deposits1 1.8 1.9 2.5 2.4 2.3 -5% -22% -5% -25% 1.8 2.3 -22% -25%Household deposits 74.3 74.9 74.7 73.2 73.8 -1% 1% 0% 2% 74.3 73.8 1% 2%Total deposits 76.1 76.8 77.2 75.6 76.1 -1% 0% -1% 1% 76.1 76.1 0% 1%1 Corporate lending and deposits of some household customers in Personal Banking (PeB) is served and reported in PeB.
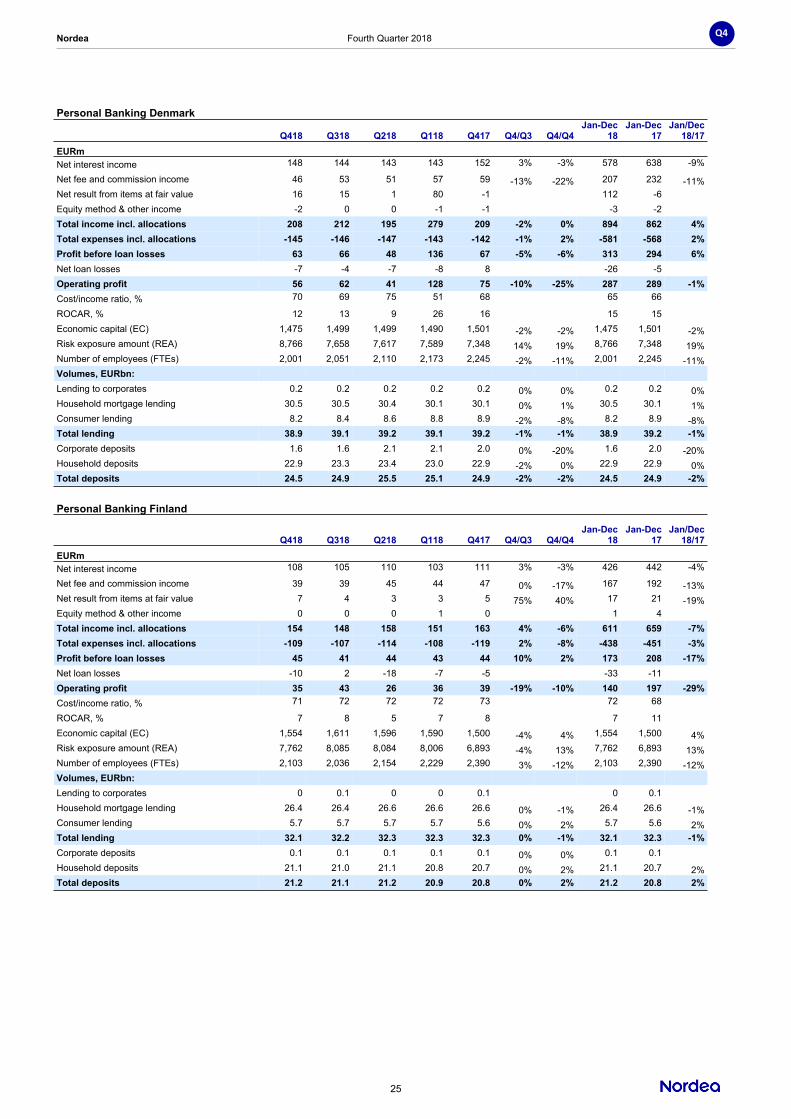
Nordea Fourth Quarter 2018
25
Q4
Personal Banking Denmark
Q418 Q318 Q218 Q118 Q417 Q4/Q3 Q4/Q4Jan-Dec
18Jan-Dec
17Jan/Dec
18/17EURmNet interest income 148 144 143 143 152 3% -3% 578 638 -9%
Net fee and commission income 46 53 51 57 59 -13% -22% 207 232 -11%Net result from items at fair value 16 15 1 80 -1 112 -6Equity method & other income -2 0 0 -1 -1 -3 -2Total income incl. allocations 208 212 195 279 209 -2% 0% 894 862 4%Total expenses incl. allocations -145 -146 -147 -143 -142 -1% 2% -581 -568 2%Profit before loan losses 63 66 48 136 67 -5% -6% 313 294 6%Net loan losses -7 -4 -7 -8 8 -26 -5Operating profit 56 62 41 128 75 -10% -25% 287 289 -1%Cost/income ratio, % 70 69 75 51 68 65 66
ROCAR, % 12 13 9 26 16 15 15Economic capital (EC) 1,475 1,499 1,499 1,490 1,501 -2% -2% 1,475 1,501 -2%Risk exposure amount (REA) 8,766 7,658 7,617 7,589 7,348 14% 19% 8,766 7,348 19%Number of employees (FTEs) 2,001 2,051 2,110 2,173 2,245 -2% -11% 2,001 2,245 -11%Volumes, EURbn:Lending to corporates 0.2 0.2 0.2 0.2 0.2 0% 0% 0.2 0.2 0%Household mortgage lending 30.5 30.5 30.4 30.1 30.1 0% 1% 30.5 30.1 1%Consumer lending 8.2 8.4 8.6 8.8 8.9 -2% -8% 8.2 8.9 -8%Total lending 38.9 39.1 39.2 39.1 39.2 -1% -1% 38.9 39.2 -1%Corporate deposits 1.6 1.6 2.1 2.1 2.0 0% -20% 1.6 2.0 -20%Household deposits 22.9 23.3 23.4 23.0 22.9 -2% 0% 22.9 22.9 0%Total deposits 24.5 24.9 25.5 25.1 24.9 -2% -2% 24.5 24.9 -2%
Personal Banking Finland
Q418 Q318 Q218 Q118 Q417 Q4/Q3 Q4/Q4Jan-Dec
18Jan-Dec
17Jan/Dec
18/17EURmNet interest income 108 105 110 103 111 3% -3% 426 442 -4%
Net fee and commission income 39 39 45 44 47 0% -17% 167 192 -13%Net result from items at fair value 7 4 3 3 5 75% 40% 17 21 -19%Equity method & other income 0 0 0 1 0 1 4Total income incl. allocations 154 148 158 151 163 4% -6% 611 659 -7%Total expenses incl. allocations -109 -107 -114 -108 -119 2% -8% -438 -451 -3%Profit before loan losses 45 41 44 43 44 10% 2% 173 208 -17%Net loan losses -10 2 -18 -7 -5 -33 -11Operating profit 35 43 26 36 39 -19% -10% 140 197 -29%Cost/income ratio, % 71 72 72 72 73 72 68
ROCAR, % 7 8 5 7 8 7 11Economic capital (EC) 1,554 1,611 1,596 1,590 1,500 -4% 4% 1,554 1,500 4%Risk exposure amount (REA) 7,762 8,085 8,084 8,006 6,893 -4% 13% 7,762 6,893 13%Number of employees (FTEs) 2,103 2,036 2,154 2,229 2,390 3% -12% 2,103 2,390 -12%Volumes, EURbn:Lending to corporates 0 0.1 0 0 0.1 0 0.1Household mortgage lending 26.4 26.4 26.6 26.6 26.6 0% -1% 26.4 26.6 -1%Consumer lending 5.7 5.7 5.7 5.7 5.6 0% 2% 5.7 5.6 2%Total lending 32.1 32.2 32.3 32.3 32.3 0% -1% 32.1 32.3 -1%Corporate deposits 0.1 0.1 0.1 0.1 0.1 0% 0% 0.1 0.1Household deposits 21.1 21.0 21.1 20.8 20.7 0% 2% 21.1 20.7 2%Total deposits 21.2 21.1 21.2 20.9 20.8 0% 2% 21.2 20.8 2%

Nordea Fourth Quarter 2018
26
Q4
Personal Banking NorwayLocal curr. Jan-Dec 18/17
Q418 Q318 Q218 Q118 Q417 Q4/Q3 Q4/Q4 Q4/Q3 Q4/Q4Jan-
Dec 18Jan-
Dec 17 EUR LocalEURmNet interest income 100 95 95 93 97 5% 3% 7% 3% 383 385 -1% 2%Net fee and commission income 21 22 22 18 20 -5% 5% -5% 5% 83 82 1% 5%Net result from items at fair value 2 5 6 2 2 15 10 50% 50%Equity method & other income 0 0 1 2 0 3 1Total income incl. allocations 123 122 124 115 119 1% 3% 2% 3% 484 478 1% 4%Total expenses incl. allocations -55 -64 -61 -66 -60 -14% -8% -14% -8% -246 -245 0% 3%Profit before loan losses 68 58 63 49 59 17% 15% 20% 16% 238 233 2% 4%Net loan losses 0 -1 -2 0 0 -3 -4Operating profit 68 57 61 49 59 19% 15% 22% 16% 235 229 3% 5%Cost/income ratio, % 45 53 49 57 50 51 51ROCAR, % 13 11 12 11 13 11 13Economic capital (EC) 1,609 1,590 1,551 1,490 1,392 1% 16% 7% 17% 1,609 1,392 16% 17%Risk exposure amount (REA) 8,378 5,144 4,993 4,801 4,414 63% 90% 71% 92% 8,378 4,414 90% 92%Number of employees (FTEs) 805 839 824 824 855 -4% -6% -2% -6% 805 855 -6% -6%Volumes, EURbn:Lending to corporates 0 0 0 0.1 0 0 0Household mortgage lending 26.9 27.9 27.3 26.3 25.8 -4% 4% 1% 5% 26.9 25.8 4% 5%Consumer lending 1.5 1.5 1.5 1.4 1.4 0% 7% 0% 7% 1.5 1.4 7% 7%Total lending 28.4 29.4 28.8 27.8 27.2 -3% 4% 1% 5% 28.4 27.2 4% 5%Corporate deposits 0.1 0.1 0.2 0.1 0.1 0% 0% 0% 0% 0.1 0.1 0% 0%Household deposits 8.0 8.6 8.8 8.1 8.1 -7% -1% -2% 0% 8.0 8.1 -1% 0%Total deposits 8.1 8.7 9.0 8.2 8.2 -7% -1% -1% 1% 8.1 8.2 -1% 1%
Personal Banking SwedenLocal curr. Jan-Dec 18/17
Q418 Q318 Q218 Q118 Q417 Q4/Q3 Q4/Q4 Q4/Q3 Q4/Q4Jan-
Dec 18Jan-
Dec 17 EUR LocalEURmNet interest income 172 160 167 190 199 8% -14% 7% -9% 689 796 -13% -8%Net fee and commission income 55 58 56 57 56 -5% -2% -5% 4% 226 231 -2% 4%Net result from items at fair value 12 4 4 3 6 23 20 15% 20%Equity method & other income 0 0 0 5 0 5 1Total income incl. allocations 239 222 227 255 261 8% -8% 7% -4% 943 1,048 -10% -4%Total expenses incl. allocations -120 -114 -117 -122 -125 5% -4% 3% 1% -473 -504 -6% 0%Profit before loan losses 119 108 110 133 136 10% -13% 11% -7% 470 544 -14% -8%Net loan losses -6 -6 -2 -4 -5 -18 -17Operating profit 113 102 108 129 131 11% -14% 10% -9% 452 527 -14% -9%Cost/income ratio, % 50 51 52 48 48 50 48ROCAR, % 12 11 12 14 14 12 14Economic capital (EC) 2,963 2,897 2,721 2,738 2,838 2% 4% 2% 9% 2,963 2,838 4% 9%Risk exposure amount (REA) 15,428 5,393 4,767 4,781 4,889 15,428 4,889Number of employees (FTEs) 1,891 1,890 1,929 1,941 1,945 0% -3% 0% -3% 1,891 1,945 -3% -3%Volumes, EURbn:Lending to corporates 0.7 0.7 0.6 0.7 0.7 0% 0% 14% 33% 0.7 0.7 0% 33%Household mortgage lending 41.2 40.8 40.1 40.6 42.6 1% -3% 0% 1% 41.2 42.6 -3% 1%Consumer lending 3.6 3.6 3.6 3.6 3.9 0% -8% -3% -8% 3.6 3.9 -8% -8%Total lending 45.5 45.1 44.3 44.9 47.2 1% -4% 0% 0% 45.5 47.2 -4% 0%Corporate deposits 0.1 0.1 0.1 0.1 0.1 0% 0% 0% 0% 0.1 0.1 0% 0%Household deposits 22.2 22.0 21.4 21.3 22.1 1% 0% 0% 4% 22.2 22.1 0% 4%Total deposits 22.3 22.1 21.5 21.4 22.2 1% 0% 0% 4% 22.3 22.2 0% 4%

Nordea Fourth Quarter 2018
27
Q4
Personal Banking Other
Q418 Q318 Q218 Q118 Q417 Q4/Q3 Q4/Q4Jan-Dec
18Jan-Dec
17Jan/Dec
18/17EURmNet interest income -8 -7 -5 -1 2 -21 -1
Net fee and commission income -4 -8 3 -3 -6 -12 -7Net result from items at fair value 2 0 0 0 0 2 3Equity method & other income 0 0 1 1 0 2 2Total income incl. allocations -10 -15 -1 -3 -4 -29 -3Total expenses incl. allocations -11 -20 -9 -16 -26 -56 -40Profit before loan losses -21 -35 -10 -19 -30 -85 -43Net loan losses 1 0 0 0 -6 1 -7Operating profit -20 -35 -10 -19 -36 -84 -50Economic capital (EC) 238 250 338 328 316 238 316
Number of employees (FTEs) 3,544 3,575 3,501 3,511 3,514 -1% 1% 3,544 3,514 1%

Nordea Fourth Quarter 2018
28
Q4
Commercial & Business BankingCommercial & Business Banking consists of Business Banking, Transaction Banking and Nordea Finance and has a leading market position in the Nordic region. We employ 4,800 people and serve more than 550,000 corporate customers through a mix of physical and digital channels by delivering banking services from Nordea and partners to our corporate clients. We provide value and contribute to society by offering our ecosystem to entrepreneurs and scale-ups to make people and businesses succeed with their Nordic ideas and to make a sustainable impact.
In Business Banking, large and medium-sized corporates are served in a relationship-driven model securing high availability and ability to solve complex customer needs. Small corporates are served in a remote set-up in Business Banking Direct with a high level of flexibility to ensure fast response to changes in customer demand and market development.
Transaction Banking serves all Nordea’s customer segments, providing payment and transaction services as well as driving Open Banking, and Blockchain/DLT initiatives across all platforms in the bank. Transaction Banking consists of Cards, Trade Finance, Cash Management and Mobile- & E-Commerce & co-Innovation and is an integral part of the Nordea ecosystem as a provider of the latest digital innovations to enable business beyond banking.
Nordea Finance provides a wide range of products and services, spanning the simplest unsecured financing needs for household customers to complex supply chain financing solutions for large corporates. Nordea Finance is responsible for the sales finance business and asset-based lending in Nordea covering three different product groups – investment credits, working capital and consumer credits.
Business developmentThe pace of change in the banking industry is increasing. In 2018, we both affirmed our regular product offerings and led the way in the adoption of new and innovative solutions, thereby expanding our ecosystem to provide Business Beyond Banking.
Business BankingCommercial & Business Banking has launched an enhanced Corporate Netbank called Nordea Business. Swedish customers are currently being invited and the roll-out continues in 2019. Nordea Business will be the primary channel to serve our corporate customers remotely and will enable easy access to an eco-system of products and solutions for self-service.
We have launched pre-approved limits enabling customers to go straight through the credit application process as well as an initial version of the Online Finance Application in Sweden, enabling easy banking through quicker and smoother handling of customer enquiries.
Our expansion of tailored advice to startups and high-growth companies was extended from Finland to Denmark, Norway and Sweden in 2018. The concept has been well-received by our customers and we rapidly built a strong foundation in the market. The units also play a key role in supporting our social agenda, partnering with entities such as Norrsken, Maria01 and Cph Fintech. The units are an example of our strong belief that we need to be business partners and that employees who are happy and dedicated improve customer satisfaction. A milestone in our sustainability effort was reached whenNordea, as the first bank in the Nordics, launched a GreenCorporate Loan Product to small and medium-sizedcorporates.
Nordea Fourth Quarter 2018
29
Q4
Transaction BankingCash management has performed strongly with increasing customer activity. We have won several major customer deals and have a strong pipeline.
We delivered on our ambition to make payments moreconvenient and easy for our customers by improving existing solutions and introducing multiple new solutions in the second half of 2018.Nordea Connect was launched in Finland and Sweden earlier this year and we are now ramping up our efforts to further enhance our solution to deliver greater customer experience.
We launched Google Pay, adding to our existing set of mobile solutions such as Nordea Wallet and Apple Pay, to name a few. These solutions provide a seamless and secure mobile spending experience whereby customers can use both private and corporate cards connected to our mobile solutions as a means of payment and enabling us to maintain a leading position in the digital payment area.
The development of Nordea’s Open Banking platform is progressing, and we are now live in Finland, Sweden and Denmark. Throughout 2018 we saw increasing interest in Open Banking among corporate customers and are working on solutions together with them.
Nordea FinanceWe have seen high activity in working capital, with demand for receivable finance remaining strong with an improved inflow of new deals for large corporates. 2018 also saw renewals of major agreements with car dealerships.
We have launched the Alfa Nordea Finance Leasing platform – a new and improved system that reduces complexity by harmonising processes and products focusing on leasing,hire purchase and loans. The Nordic roll-out of the platform is continuing through 2019–2020.
Car loans via the bank channel have been launched inDenmark, as well as an unsecured loan solution in Norway.Both initiatives provide faster and easier access to financing for consumer customers.
Priorities for 2019- Develop and improve our business partner concept for Business Banking customers and our remote service offering for Business Banking Direct customers
- Further improve our compliance and credit processes
- Digital development of scalable solutions such as the Nordea Business net bank and the Alfa leasing platform
- Continuously improve and innovate in the payment- and mobile solutions space leveraging partnerships and customer co-creation
ResultTotal income increased by 9% in local currencies compared to the third quarter, driven by Net result from items at fair value and Net interest income.
Net interest income increased by 5% in local currencies from the previous quarter. Lending volumes decreased slightly due to changes in exchange rates but increased in local currency. Compared to the fourth quarter last year lending increased 3% in local currencies. Deposit volumes increased 3% from the previous quarter
Net fee and commission income increased by 3% in local currencies from the third quarter while Net result from items at fair value increased 49% in local currencies as customer activity picked up in all countries, particularly in hedging and foreign exchange
Total expenses increased by 4% in local currencies from the previous quarter but decreased by 17% in local currencies from the same quarter last year, which included transformation costs of EUR 51m.
FTE declined slightly compared to the third quarter and by 9% compared to the same quarter last year.
Loan losses decreased by 33% from the third quarter which included provisions related to the summer drought. Operating profit increased by 27% in local currencies from the third quarter and 63% from the same quarter last year.
ROCAR increased 2% points compared to previous quarter.
Credit qualityThe loan loss ratio was 17bps, down from 25bps in the third quarter. As expected and provisioned for in the third quarter, the fourth quarter saw increased risk in agriculture. Overall credit quality remained solid.
Distribution agreement with Asset & Wealth ManagementThe result excluding the distribution agreement with Asset & Wealth Management is according to the principle that all income, expense and capital are allocated to the customer responsible unit. This principle aligns with the internal management reporting and with the principle applied to all other product units in the Group.

Nordea Fourth Quarter 2018
30
Q4
Commercial & Business Banking total Local curr. Jan-Dec 18/17
Q418 Q318 Q218 Q118 Q417 Q4/Q3 Q4/Q4 Q4/Q3 Q4/Q4Jan-
Dec 18Jan-
Dec 17 EUR LocalEURmNet interest income 333 315 318 308 313 6% 6% 5% 8% 1,274 1,258 1% 4%Net fee and commission income 109 107 108 113 124 2% -12% 3% -11% 437 483 -10% -8%Net result from items at fair value 72 48 57 120 57 50% 26% 49% 27% 297 261 14% 17%Equity method & other income 8 5 9 8 9 30 45Total income incl. allocations 522 475 492 549 503 10% 4% 9% 5% 2,038 2,047 0% 2%Total expenses incl. allocations -277 -268 -282 -292 -343 3% -19% 4% -17% -1,119 -1,219 -8% -6%Profit before loan losses 245 207 210 257 160 18% 53% 16% 51% 919 828 11% 13%Net loan losses -27 -40 27 17 -29 -23 -88Operating profit 218 167 237 274 131 31% 66% 27% 63% 896 740 21% 23%Cost/income ratio, % 54 56 57 53 68 55 60ROCAR, % 10 8 12 14 7 11 9Economic capital (EC) 6,280 6,247 6,250 6,139 6,093 1% 3% 2% 0% 6,280 6,093 3% 0%Risk exposure amount (REA) 44,310 33,143 33,097 33,069 33,324 34% 33% 35% 28% 44,310 33,324 33% 28%Number of employees (FTEs) 4,806 4,811 4,858 5,099 5,270 0% -9% 0% -9% 4,806 5,270 -9% -9%Volumes, EURbn:Lending to corporates 72.9 73.1 71.8 71.0 71.1 0% 3% 1% 4% 72.9 71.1 3% 4%Household mortgage lending1 6.7 6.8 7.0 7.1 7.1 -1% -6% -1% -4% 6.7 7.1 -6% -4%Consumer lending1 2.0 2.1 2.1 2.1 2.2 -5% -9% -3% -7% 2.0 2.2 -9% -7%Total lending 81.6 82.0 80.9 80.2 80.4 0% 1% 0% 3% 81.6 80.4 1% 3%Corporate deposits 38.0 36.9 37.4 36.3 37.3 3% 2% 4% 4% 38.0 37.3 2% 4%Household deposits1 2.8 2.8 3.0 2.9 3.0 0% -7% 0% -8% 2.8 3.0 -7% -8%Total deposits 40.8 39.7 40.4 39.2 40.3 3% 1% 4% 3% 40.8 40.3 1% 3%1 Household lending and deposits of some corporate customers is supplied by and reported in Commercial & Business Banking.
Commercial & Business Banking excl. Distribution agreement with Wealth Management Local curr. Jan-Dec 18/17
Q418 Q318 Q218 Q118 Q417 Q4/Q3 Q4/Q4 Q4/Q3 Q4/Q4Jan-
Dec 18Jan-
Dec 17 EUR LocalEURmNet interest income 332 315 318 307 313 5% 6% 5% 8% 1,272 1,257 1% 4%Net fee and commission income 136 133 135 159 170 2% -20% 2% -19% 563 659 -15% -13%Net result from items at fair value 72 48 57 120 57 50% 26% 49% 27% 297 261 14% 17%Equity method & other income 6 5 10 9 9 30 45Total income incl. allocations 546 501 520 595 549 9% -1% 9% 1% 2,162 2,222 -3% 0%Total expenses incl. allocations -285 -274 -287 -303 -354 4% -19% 4% -18% -1,149 -1,264 -9% -7%Profit before loan losses 261 227 233 292 195 15% 34% 15% 35% 1,013 958 6% 8%Net loan losses -27 -40 27 17 -29 -23 -87Operating profit 234 187 260 309 166 25% 41% 25% 42% 990 871 14% 16%Cost/income ratio, % 52 55 55 51 65 53 57ROCAR, % 11 9 12 15 8 12 10Economic capital (EC) 6,414 6,380 6,378 6,422 6,376 1% 1% 1% -3% 6,414 6,376 1% -3%Risk exposure amount (REA) 44,310 33,143 33,097 33,069 33,324 34% 33% 35% 28% 44,310 33,324 33% 28%Number of employees (FTEs) 4,806 4,858 4,858 5,099 5,271 -1% -9% 0% -9% 4,806 5,271 -9% -9%Volumes, EURbn:Lending to corporates 72.9 73.1 71.9 71.1 71.1 0% 3% 1% 4% 72.9 71.1 3% 4%Household mortgage lending1 6.7 6.8 6.9 7.0 7.1 -1% -6% -1% -4% 6.7 7.1 -6% -4%Consumer lending1 2.0 2.1 2.1 2.1 2.2 -5% -9% -3% -7% 2.0 2.2 -9% -7%Total lending 81.6 82.0 80.9 80.2 80.4 0% 1% 0% 3% 81.6 80.4 1% 3%Corporate deposits 38.0 36.9 37.4 36.3 37.3 3% 2% 4% 4% 38.0 37.3 2% 4%Household deposits1 2.8 2.8 3.0 2.9 3.0 0% -7% 0% -8% 2.8 3.0 -7% -8%Total deposits 40.8 39.7 40.4 39.2 40.3 3% 1% 4% 3% 40.8 40.3 1% 3%1 Household lending and deposits of some corporate customers is supplied by and reported in Commercial & Business Banking.

Nordea Fourth Quarter 2018
31
Q4
Business BankingLocal curr. Jan-Dec 18/17
Q418 Q318 Q218 Q118 Q417 Q4/Q3 Q4/Q4 Q4/Q3 Q4/Q4Jan-Dec
18Jan-Dec
17 EUR LocalEURm
Net interest income, EURm Business Banking Denmark 76 76 75 76 78 0% -3% 0% -1% 303 325 -7% -6% Business Banking Finland 61 60 58 56 55 2% 11% 2% 11% 235 215 9% 9% Business Banking Norway 72 67 67 68 70 7% 3% 8% 4% 274 281 -2% 0% Business Banking Sweden 61 60 59 54 54 2% 13% 3% 21% 234 210 11% 19% Business Banking Direct 54 48 53 51 54 13% 0% 10% 0% 206 216 -5% -4%Other 9 4 6 3 2 22 11
Net loan losses, EURm Business Banking Denmark -18 -29 -1 -13 -1 -38% -38% -61 -4 Business Banking Finland -9 -5 4 21 -14 80% -36% 80% -36% 11 -28 Business Banking Norway 6 2 22 10 -10 40 -38 Business Banking Sweden -4 -4 4 1 -8 0% -50% 0% -50% -3 -18 -83% -83% Business Banking Direct -1 -1 -1 0 7 0% 0% -3 10Other -1 -3 -1 -2 -3 -7 -10
Lending, EURbn Business Banking Denmark 21.7 21.4 21.2 21.2 21.3 1% 2% 1% 2% 21.7 21.3 2% 2% Business Banking Finland 13.3 13.5 13.3 13.0 12.8 -1% 4% -1% 4% 13.3 12.8 4% 4% Business Banking Norway 15.8 16.2 15.8 15.3 15.0 -2% 5% 3% 7% 15.8 15.0 5% 7% Business Banking Sweden 19.0 19.1 18.4 18.6 19.0 -1% 0% -1% 4% 19.0 19.0 0% 4% Business Banking Direct 11.7 11.9 12.1 12.2 12.2 -2% -4% -1% -3% 11.7 12.2 -4% -3%Other 0.1 -0.1 0.1 -0.1 0.1 0.1 0.1
Deposits, EURbn Business Banking Denmark 6.1 6.2 6.1 6.1 6.4 -2% -5% 0% -3% 6.1 6.4 -5% -3% Business Banking Finland 7.8 7.4 7.8 7.1 6.9 5% 13% 5% 13% 7.8 6.9 13% 13% Business Banking Norway 6.6 6.7 6.6 6.5 6.6 -1% 0% 5% 0% 6.6 6.6 0% 0% Business Banking Sweden 9.1 8.6 9.0 8.8 9.3 6% -2% 6% 2% 9.1 9.3 -2% 2% Business Banking Direct 11.2 10.8 11.0 10.7 11.1 4% 1% 5% 2% 11.2 11.1 1% 2%Other 0 0 -0.1 0 0 0 0

Nordea Fourth Quarter 2018
32
Q4
Wholesale BankingWholesale Banking is servicing Nordea’s large corporate and institutional customers. Service offering includes a focused range of financing, cash management and payment services, investment banking, capital markets products and securities services.
Wholesale Banking is the Nordic leader in sustainable finance and has the leading Large Corporate and Institutional customer franchise in the Nordics. Through Nordea Markets, a broad range of Nordea customers in Commercial & Business Banking, Asset & Wealth Management and Personal Banking are also serviced.
Business developmentCustomer activity picked up in the quarter compared to the previous quarter, which is reflected in both increased lending volume and income growth. Lending margins were largely in line with the previous quarter.
Large corporate lending increased compared to 2017, reflecting increased activity and ambition levels within our C&IB service offering. Conscious de-risking of our large corporate lending portfolio is also coming to an end.
Wholesale Banking was recognised for its leading large corporate and institutional customer satisfaction, and the strong performance is underpinned by an all-time high score in customer satisfaction for Nordic large corporates with a no. 1 ranking from Prospera in 2018 including no. 1 local country rankings in both Denmark and Finland.
Wholesale Banking’s focus areas remained unchanged with continued prioritisation within capital optimisation and progression was made within digitalisation, robotics as well as sustainability, e.g. green bonds and loans.
Corporate and Investment BankingIn addition to the Nordic Prospera no. 1 ranking among our large corporates, Nordea was recognised for its strong performance through no. 1 position in Nordic Leveraged Finance. In line with the rest of the world, the Nordic financial markets were relatively weak in the second half of the year and there were fewer IPOs and less M&A than in the first half. Despite this, we are very proud that Nordea ended the year as the leading Nordic Investment Bank, having secured the no. 1 Nordic position in the 2018 league tables for M&A, ECM, Corporate Bonds and Syndicated Loans.
This reflects Wholesale Banking’s strong strategic position with a full product- and service-offering of debt, equity and advisory. Examples of this include servicing as advisor and financing provider for Mekonomen and Ahlström Munksjö in the fourth quarter.
Customer activity in the shipping business increased in the quarter as a result of higher activity in the industry in general, while it remained relatively low in the offshore business.
In Russia, we continued with our de-risking and customer activity remained moderate. Corporate lending portfolio was reduced further both in FY 2018 and in Q4 2018.
Capital MarketsCustomer activity in Markets related products picked up in the fourth quarter and became the second strongest customer driven NFV income quarter in Markets for the year.

Nordea Fourth Quarter 2018
33
Q4
The fourth quarter was otherwise very challenging for any trading related activity and significantly affected by negative valuation adjustments due to higher funding costs and widening credit spreads. The difficult market environment accelerated toward the end of the quarter and has been visible throughout 2018 with negative impact from new regulation, negative interest rates, fierce competition, geopolitical turbulence and low market volatility, in especially Fixed Income. Difficult market conditions and negative valuation adjustments overshadowed in total the strong customer activity in the 4th quarter.
Nordea Markets has continued its journey with its transformation process in co-creating a more efficient and customer-centric organisation. Furthermore, as an important part of the transformation process, the focus is on shaping a dynamic and inclusive work environment with a strong diversity and well-being profile.
Priorities 2019Wholesale Banking’s four focus areas are Customer Centricity, People Dedication, Business Optimisation and Society Engagement. With that outset, Wholesale Banking’s aim is to strengthen its market-leading customer satisfaction through a high degree of cross-selling in a combination with a continued focus on attracting and retaining the right people and making sure they grow, building a culture with the right behaviour to support business momentum.
Business optimisation will be driven by leveraging digital and automation opportunities and relevant use of the balance sheet to drive structural cost efficiency throughout 2019. In addition, Wholesale Banking has a focus on society engagement by developing and driving our Green offering in order to be the Nordic leader in sustainable finance.
ResultTotal income was EUR 349m, down 17% in local currencies from Q4 2017, solely driven by Net Fair Value.
Net interest income was on a par with the previous quarter and up 13% in local currencies compared with Q4 2017 including IFRS 15 impact (positive impact year-on-year).
Net fee and commission improved 18% from the previous quarter driven by a pickup in especially brokerage and advisory driven customer activity. NCI was flat compared to 2017 for both Q4 2018 and FY 2018 adjusted for the divestment of NLP Denmark and IFRS 15 (negative impact year-on-year).
Net result on items at fair value down 69% in the fourth quarter from Q4 2017 mainly driven by negative valuation adjustments and difficult trading environment. Customer driven NFV activity picked up strongly from the previous quarter.
End of period Q4 large corporate lending volume was up EUR 1.1bn, or 2.3% from EOP Q3.
Total expenses decreased by 8% in the 4th quarter compared with same quarter last year and by 5% for the FY 2018 compared with FY 2017 driven by continued focus on structural cost efficiency.
Operating profit was EUR 132m, up EUR 9m compared to Q4 2017 with FY 2018 business area ROCAR at 7%, 1%-point lower from the FY 2017.
Credit qualityCredit quality continued to improve with net loan losses down due to net reversals for the Russian portfolio and to declining loan losses in the Nordic corporate and institutional portfolio for the fourth quarter. The loan loss ratio was -8bps in the quarter, down from 3bps in the previous quarter.
Wholesale Banking totalLocal curr. Jan-Dec 18/17
Q418 Q318 Q218 Q118 Q417 Q4/Q3 Q4/Q4 Q4/Q3 Q4/Q4Jan-
Dec 18Jan-
Dec 17 EUR LocalEURmNet interest income 215 216 219 204 193 0% 11% -1% 13% 854 854 0% 4%Net fee and commission income 108 91 152 120 131 19% -18% 18% -15% 471 571 -18% -14%Net result from items at fair value 26 111 109 162 83 -77% -69% -76% -69% 408 625 -35% -35%Equity method & other income 0 0 0 0 0 0 4Total income incl. allocations 349 418 480 486 407 -17% -14% -17% -13% 1,733 2,054 -16% -13%Total expenses incl. allocations -230 -221 -208 -242 -249 4% -8% 3% -6% -901 -952 -5% -3%Profit before loan losses 119 197 272 244 158 -40% -25% -39% -23% 832 1,102 -25% -23%Net loan losses 13 -5 -65 -34 -35 -91 -229Operating profit 132 192 207 210 123 -31% 7% -31% 10% 741 873 -15% -13%Cost/income ratio, % 66 53 43 50 61 52 46ROCAR, % 5 8 8 8 5 7 8Economic capital (EC) 7,938 7,462 7,741 7,669 7,988 6% -1% 7,938 7,988 -1%Risk exposure amount (REA) 48,246 37,284 39,196 38,529 41,179 29% 17% 48,246 41,179 17%Number of employees (FTEs) 3,637 3,637 3,591 3,589 3,659 0% -1% 3,637 3,659 -1%Volumes, EURbn:Lending to corporates 69.0 76.9 76.0 74.7 71.1 -10% -3% 69.0 71.1 -3%Lending to households 0 0 0 0 0 0 0Total lending 69.0 76.9 76.0 74.7 71.1 -10% -3% -10% -3% 69.0 71.1 -3% -3%Corporate deposits 42.3 51.7 48.6 52.5 46.9 -18% -10% 42.3 46.9 -10%Household deposits 0 0.1 0.1 0.1 0.1 -100% -100% 0 0.1 -100%Total deposits 42.3 51.8 48.7 52.6 47.0 -18% -10% -18% -9% 42.3 47.0 -10% -9%
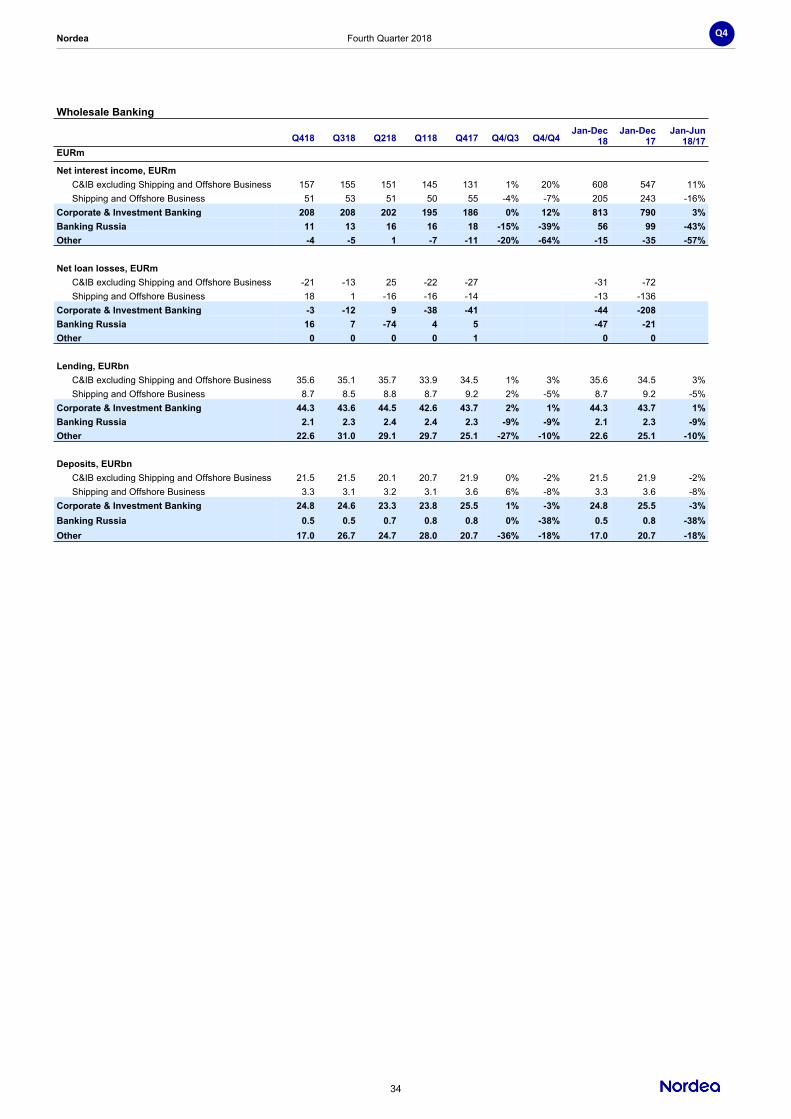
Nordea Fourth Quarter 2018
34
Q4
Wholesale Banking
Q418 Q318 Q218 Q118 Q417 Q4/Q3 Q4/Q4Jan-Dec
18Jan-Dec
17Jan-Jun
18/17EURm
Net interest income, EURm C&IB excluding Shipping and Offshore Business 157 155 151 145 131 1% 20% 608 547 11% Shipping and Offshore Business 51 53 51 50 55 -4% -7% 205 243 -16%Corporate & Investment Banking 208 208 202 195 186 0% 12% 813 790 3%Banking Russia 11 13 16 16 18 -15% -39% 56 99 -43%Other -4 -5 1 -7 -11 -20% -64% -15 -35 -57%
Net loan losses, EURm C&IB excluding Shipping and Offshore Business -21 -13 25 -22 -27 -31 -72 Shipping and Offshore Business 18 1 -16 -16 -14 -13 -136Corporate & Investment Banking -3 -12 9 -38 -41 -44 -208Banking Russia 16 7 -74 4 5 -47 -21Other 0 0 0 0 1 0 0
Lending, EURbn C&IB excluding Shipping and Offshore Business 35.6 35.1 35.7 33.9 34.5 1% 3% 35.6 34.5 3% Shipping and Offshore Business 8.7 8.5 8.8 8.7 9.2 2% -5% 8.7 9.2 -5%Corporate & Investment Banking 44.3 43.6 44.5 42.6 43.7 2% 1% 44.3 43.7 1%Banking Russia 2.1 2.3 2.4 2.4 2.3 -9% -9% 2.1 2.3 -9%Other 22.6 31.0 29.1 29.7 25.1 -27% -10% 22.6 25.1 -10%
Deposits, EURbn C&IB excluding Shipping and Offshore Business 21.5 21.5 20.1 20.7 21.9 0% -2% 21.5 21.9 -2% Shipping and Offshore Business 3.3 3.1 3.2 3.1 3.6 6% -8% 3.3 3.6 -8%Corporate & Investment Banking 24.8 24.6 23.3 23.8 25.5 1% -3% 24.8 25.5 -3%Banking Russia 0.5 0.5 0.7 0.8 0.8 0% -38% 0.5 0.8 -38%Other 17.0 26.7 24.7 28.0 20.7 -36% -18% 17.0 20.7 -18%

Nordea Fourth Quarter 2018
35
Q4
Asset & Wealth ManagementAsset & Wealth Management provides high-quality investment, savings and risk management solutions. It manages customers’ assets and provides financial advice to high net worth individuals and institutional investors. The area consists of the three businesses: Private Banking serving customers from 67 branches in the Nordics; Asset Management responsible for actively managed investment funds and mandates and for serving institutional asset management customers; Life & Pensions serving customers with a full range of pension, endowment and risk products. Asset & Wealth Management is the largest Nordic private bank, Life & Pensions provider and asset manager.
Business developmentVolatility and uncertainty in the markets spike in the quarter leading to customers withdrawing money against the backdrop of a significant downturn in financial markets. The European fund industry suffered the biggest outflow since the financial crisis driven by concerns over slowing growth and continued geopolitical uncertainty.
Asset & Wealth Management focused on its stable and sustainable track while increasing customer centricity and introduced new digital tools and solutions in the quarter.
Nordea’s Assets under Management (AuM) decreased to EUR 283bn, down EUR 30bn or 9% from the previous quarter, and down 14% from the same quarter last year. The decrease in AuM in the fourth quarter was mainly due to the divestment of our Private Banking International branch, market depreciation and net outflow of EUR 2.8bn.
Following a thorough strategic review, it was decided that the International Private Banking activities should be divested and concentrate Nordea’s private banking activities in the Nordics. The aim is to better improve risk management, focus the business and deliver even better value to clients. Consequently, a part of the Luxembourg-based private banking business was sold to UBS in 2018. The transaction was successfully completed in October 2018.
Private Banking continues to focus on customer acquisition as well as optimising the service and advisory model to the needs of customers and regulatory changes in the market. Net flow for Nordic Private Banking was flat in Q4 2018.We continued our re-focus of the business, transferring below-threshold customers to Personal Banking. We are sharpening our value proposition to better target growth segments such us (ultra) high net worth clients. The enhance focus on the Nordic markets enables Private Banking to further strengthen efforts in Nordic markets with large growth potential.
In Nordic Private Banking 4Q income was EUR 79m – a 7% increase compared to the same quarter last year, when income was limited by internal customer transfers and focus on regulatory requirements. Underlying business growth was satisfactory, and the cost decrease of 12% compared to same quarter last year can largely be attributed to prudent cost control and focus on Nordic synergies. Operating profit stands at EUR 27m and ROCAR at 19%.
In Asset Management, AuM was impacted by high market volatility that resulted in negative market movements as well as negative net flows of EUR 1.4bn. Negative net flow in Third Party Fund Distribution amounted to EUR 1.4bn and was mainly related to the Stable Return fund. Institutional Distribution had a slight positive net flow of EUR 0.2bn. Net flow in retail sales channels was negative in the amount of EUR 0.6bn and was mainly related to Sweden and Norway.
Investment performance in 2018 was negatively impacted by high market volatility, especially in equities, but long-term performance remains strong with 67% of all composites outperforming benchmarks over three years.
Life & Pensions’ gross written premiums reached EUR 961m, 44% lower than same quarter of 2017 but 3% higher than the previous quarter. The sale of Nordea Life & Pension Denmark in April 2018 lowered the gross written premiums received in the quarter, compared to previous quarters when Nordea Life

Nordea Fourth Quarter 2018
36
Q4
& Pension Denmark was included. The Nordea distribution network generated 91% of Market return premium sales.
Market return- and risk products accounted for 98% of total gross written premiums compared to 91% in the same quarter previous year. Market return products amounted to 76% of total AUM in Life & Pensions up from 63% in the previous year.
Priorities for 2019In 2019, Asset & Wealth Management has set out clear priorities to increase our presence in Norway and Sweden particularly in Private Banking and Life & Pensions. Asset Management is launching new products with a focus on building our presence in ESG, while exploring new partnerships to further strengthen international distribution channels. We are continuing our digital transformation and releasing new services such as sustainable pension advice through our robo advisor NORA and a new mobile savings offering across the Nordics.
ResultFourth quarter income was EUR 417m, up 2% from the previous quarter and down 18% compared to the same quarter last year. The increase was mainly due to end of year fees.
Costs increased 7% from the previous quarter and were down 11% from the same quarter last year due to higher staff and research costs in Asset Management as well as one-off costs related to the establishment of functions in Luxembourg.
Operating profit in the fourth quarter was EUR 219m, down 3% from the previous quarter.
Private BankingTotal income was EUR 79m during the fourth quarter, which is 7% higher than the same period last year. Costs were flat compared to the previous quarter and down 12% compared to the same period last year. Operating profit stands at EUR 27m and ROCAR at 19%.
Asset ManagementAsset Management income was EUR 229m in the fourth quarter, up 5% from the previous quarter and down 14% from the same quarter last year. The decrease from last year was mainly due to lower average AuM as well as in performance fees. Operating profit was EUR 150m, up 2% from the previous quarter and down 23% from the same quarter last year due to both lower income and higher costs.
Life & PensionsTotal income was EUR 111m, up 5% from the previous quarter and 27% down from same quarter in 2017, excluding the EUR 262m gain from selling Nordea Life & Pensions DK. Operating profit was EUR 78m, up 5% from the previous quarter and down 24% from the same quarter in 2017.
Asset & Wealth Management otherAsset & Wealth Management other consists of income and costs related to the Asset & Wealth Management business area, but not allocated to the business units.
Asset & Wealth Management totalLocal curr. Jan-Dec 18/17
Q418 Q318 Q218 Q118 Q417 Q4/Q3 Q4/Q4 Q4/Q3 Q4/Q4Jan-
Dec 18Jan-
Dec 17 EUR LocalEURmNet interest income 15 17 18 16 19 -12% -21% -12% -21% 66 82 -20% -18%Net fee and commission income 354 352 368 369 411 1% -14% 1% -14% 1,443 1,586 -9% -9%Net result from items at fair value 33 29 37 63 73 14% -55% 14% -55% 162 287 -44% -42%Equity method & other income 15 10 8 4 6 37 23Total income incl. allocations 417 408 431 452 509 2% -18% 2% -18% 1,708 1,978 -14% -13%Total expenses incl. allocations -194 -182 -180 -203 -217 7% -11% 7% -10% -759 -847 -10% -10%Profit before loan losses 223 226 251 249 292 -1% -24% -1% -23% 949 1,131 -16% -15%Net loan losses -4 0 0 0 0 -4 0Operating profit 219 226 251 249 292 -3% -25% -3% -24% 945 1,131 -16% -14%Cost/income ratio, % 47 45 42 45 43 44 43ROCAR, % 30 29 32 29 33 30 32Economic capital (EC) 2,297 2,218 2,452 2,386 2,694 4% -15% 4% -15% 2,297 2,694 -15% -15%Risk exposure amount (REA) 5,577 5,330 5,518 5,525 5,578 5% 0% 5% 0% 5,577 5,578 0% 0%Number of employees (FTEs) 2,712 2,925 2,948 3,463 3,402 -7% -20% -7% -20% 2,712 3,402 -20% -20%Volumes, EURbn:AuM 282.6 311.5 307.0 320.1 330.4 -9% -14% -9% -14% 282.6 330.4 -14% -14%Total lending 7.7 8.8 8.9 9.0 10.8 -13% -29% -13% -29% 7.7 10.8 -29% -29%Total deposits 11.1 13.2 13.0 12.5 13.0 -16% -15% -16% -15% 11.1 13.0 -15% -15%
Assets under Management (AuM), volumes and net inflowQ418 Q318 Q218 Q118 Q417 Q418 Net inflow
EURbn
Nordic Retail funds 56.3 61.1 60.0 58.6 61.5 -0.6Private Banking 80.7 98.0 96.3 96.1 98.9 0Institutional sales 98.3 101.6 100.9 92.5 96.2 -1.2Life & Pensions 47.3 50.8 49.8 72.9 73.8 -0.1Total* 282.6 311.5 307.0 320.1 330.4 -1.9* The divestment of 45 % stake in Nordea Life & Pensions Denmark has reduced Assets under Management by EUR 11bn in Q2 2018.
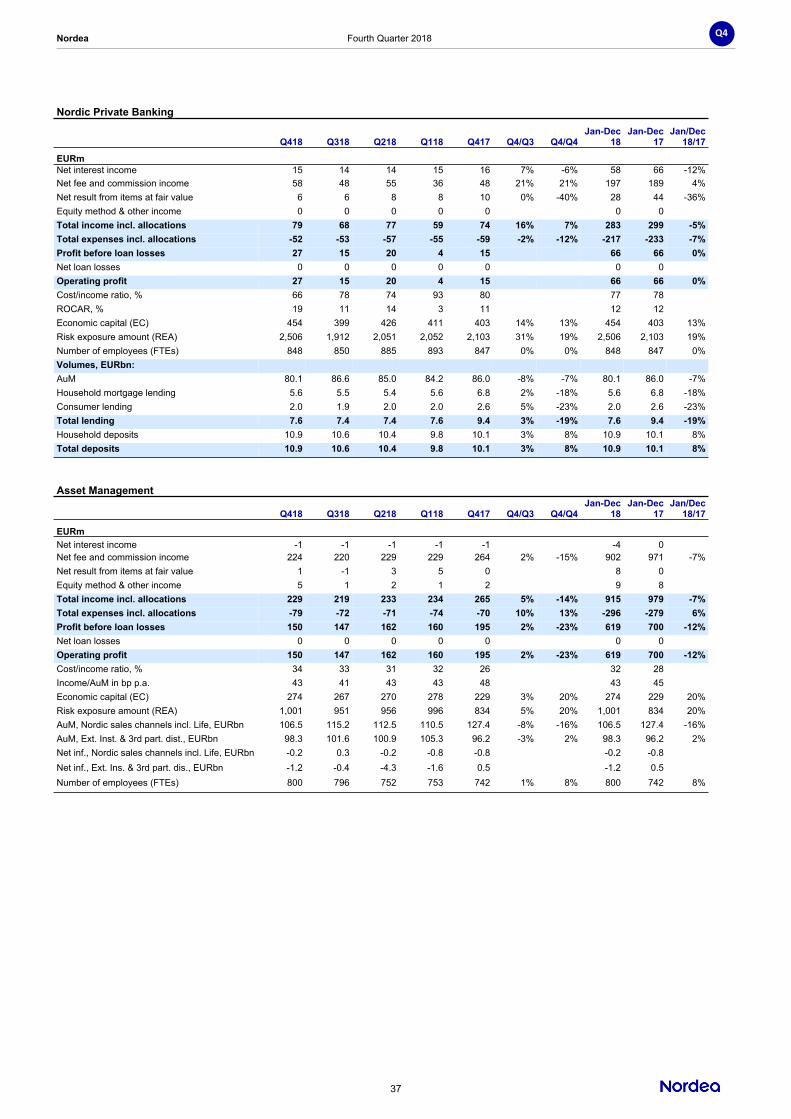
Nordea Fourth Quarter 2018
37
Q4
Nordic Private Banking
Q418 Q318 Q218 Q118 Q417 Q4/Q3 Q4/Q4Jan-Dec
18Jan-Dec
17Jan/Dec
18/17EURmNet interest income 15 14 14 15 16 7% -6% 58 66 -12%Net fee and commission income 58 48 55 36 48 21% 21% 197 189 4%Net result from items at fair value 6 6 8 8 10 0% -40% 28 44 -36%Equity method & other income 0 0 0 0 0 0 0Total income incl. allocations 79 68 77 59 74 16% 7% 283 299 -5%Total expenses incl. allocations -52 -53 -57 -55 -59 -2% -12% -217 -233 -7%Profit before loan losses 27 15 20 4 15 66 66 0%Net loan losses 0 0 0 0 0 0 0Operating profit 27 15 20 4 15 66 66 0%Cost/income ratio, % 66 78 74 93 80 77 78ROCAR, % 19 11 14 3 11 12 12Economic capital (EC) 454 399 426 411 403 14% 13% 454 403 13%Risk exposure amount (REA) 2,506 1,912 2,051 2,052 2,103 31% 19% 2,506 2,103 19%Number of employees (FTEs) 848 850 885 893 847 0% 0% 848 847 0%Volumes, EURbn:AuM 80.1 86.6 85.0 84.2 86.0 -8% -7% 80.1 86.0 -7%Household mortgage lending 5.6 5.5 5.4 5.6 6.8 2% -18% 5.6 6.8 -18%Consumer lending 2.0 1.9 2.0 2.0 2.6 5% -23% 2.0 2.6 -23%Total lending 7.6 7.4 7.4 7.6 9.4 3% -19% 7.6 9.4 -19%Household deposits 10.9 10.6 10.4 9.8 10.1 3% 8% 10.9 10.1 8%Total deposits 10.9 10.6 10.4 9.8 10.1 3% 8% 10.9 10.1 8%
1 1 1 1 1 1 1 1 1 1
Asset Management
Q418 Q318 Q218 Q118 Q417 Q4/Q3 Q4/Q4Jan-Dec
18Jan-Dec
17Jan/Dec
18/17
EURmNet interest income -1 -1 -1 -1 -1 0% -4 0 0%Net fee and commission income 224 220 229 229 264 2% -15% 902 971 -7%Net result from items at fair value 1 -1 3 5 0 8 0Equity method & other income 5 1 2 1 2 9 8Total income incl. allocations 229 219 233 234 265 5% -14% 915 979 -7%Total expenses incl. allocations -79 -72 -71 -74 -70 10% 13% -296 -279 6%Profit before loan losses 150 147 162 160 195 2% -23% 619 700 -12%Net loan losses 0 0 0 0 0 0% 0% 0 0Operating profit 150 147 162 160 195 2% -23% 619 700 -12%Cost/income ratio, % 34 33 31 32 26 32 28Income/AuM in bp p.a. 43 41 43 43 48 43 45Economic capital (EC) 274 267 270 278 229 3% 20% 274 229 20%Risk exposure amount (REA) 1,001 951 956 996 834 5% 20% 1,001 834 20%AuM, Nordic sales channels incl. Life, EURbn 106.5 115.2 112.5 110.5 127.4 -8% -16% 106.5 127.4 -16%AuM, Ext. Inst. & 3rd part. dist., EURbn 98.3 101.6 100.9 105.3 96.2 -3% 2% 98.3 96.2 2%Net inf., Nordic sales channels incl. Life, EURbn -0.2 0.3 -0.2 -0.8 -0.8 0% -0.2 -0.8Net inf., Ext. Ins. & 3rd part. dis., EURbn -1.2 -0.4 -4.3 -1.6 0.5 0% -1.2 0.5Number of employees (FTEs) 800 796 752 753 742 1% 8% 800 742 8%

Nordea Fourth Quarter 2018
38
Q4
Life & Pensions
Q418 Q318 Q218 Q118 Q417 Q4/Q3 Q4/Q4Jan-Dec
18Jan-Dec
17Jan/Dec
18/17EURmNet interest income 0 0 0 0 0 0 0Net fee and commission income 75 75 76 92 86 0% -13% 318 373 -15%Net result from items at fair value 26 23 26 49 62 13% -58% 124 229 -46%Equity method & other income 10 8 5 3 5 26 19Total income incl. allocations 111 106 107 144 153 5% -27% 468 621 -25%Total expenses incl. allocations -33 -32 -34 -52 -50 3% -34% -151 -208 -27%Profit before loan losses 78 74 73 92 103 5% -24% 317 413 -23%Net loan losses 0 0 0 0 0 0 0Operating profit 78 74 73 92 103 5% -24% 317 413 -23%Cost/income ratio, % 30 30 32 36 32 32 33Return on Equity, % 19 18 16 17 19 18 19Equity 1,524 1,448 1,576 1,526 1,810 1,524 1,810AuM, EURbn 41.9 45.0 44.0 67.3 68.0 -7% -38% 41.9 68.0 -38%Premiums 961 932 987 1,867 1,731 3% -44% 961 1,731 -44%Risk exposure amount (REA) 1,815 1,823 1,802 1,802 1,793 0% 1% 1,815 1,793 1%Number of employees (FTEs) 616 689 700 1,184 1,164 -11% -47% 616 1,164 -47%Profit driversProfit Traditional products 5 0 -1 18 28 0% 0% 22 90 -76%Profit Market Return products 52 56 53 63 61 -7% -15% 224 252 -11%Profit Risk products 18 18 18 23 20 0% -10% 77 84 -8%Total product result 75 74 70 104 109 1% -31% 323 426 -24%Return on Shareholder equity, other profits and group adj. 3 0 3 -12 -6 0% 0% -6 -13Operating profit 78 74 73 92 103 5% -24% 317 413 -23%
Asset & Wealth Management Other
Q418 Q318 Q218 Q118 Q417 Q4/Q3 Q4/Q4Jan-Dec
18Jan-Dec
17Jan/Dec
18/17EURmNet interest income 1 4 5 2 4 12 16Net fee and commission income -3 9 8 12 13 26 53Net result from items at fair value 0 1 0 1 1 2 14Equity method & other income 0 1 1 0 -1 2 -4Total income incl. allocations -2 15 14 15 17 42 79Total expenses incl. allocations -30 -25 -18 -22 -38 -95 -127Profit before loan losses -32 -10 -4 -7 -21 -53 -48Net loan losses -4 0 0 0 0 -4 0Operating profit -36 -10 -4 -7 -21 -57 -48Economic capital (EC) 45 104 180 171 252 45 252Number of employees (FTEs) 448 590 611 633 649 -24% -31% 448 649 -31%Volumes, EURbn:Total lending 0.1 1.4 1.5 1.4 1.4 0.1 1.4Total deposits 0.2 2.6 2.6 2.7 2.9 0.2 2.9

Nordea Fourth Quarter 2018
39
Q4
Group Functions and other Together with the results in the business areas, the results of Group Functions and other add up to the reported result for the Group. The main income originates from Group Treasury & ALM together with Capital Account Centre, through which capital is allocated to business areas.
Business developmentThe structural liquidity risk of Nordea is measured and limited through an internal model which conceptually resembles the proposed Net Stable Funding Ratio (NSFR), but applies internal-based assumptions for the stability of assets and liabilities. The structure of the balance sheet is considered conservative and well-balanced and appropriately adapted to the current economic and regulatory environment, also in terms of structural liquidity risk.
Short-Short-term liquidity risk is measured using several metrics and the Liquidity Coverage Ratio (LCR) is one such metric. The LCR for the Nordea Group was, according to the CRR LCR definition, 185% at the end of the fourth quarter. The LCR in EUR was 257% and in USD 214% at the end of the fourth quarter. The liquidity buffer is composed of highly liquid central bank eligible securities and cash with characteristics like CRD IV high-quality liquid assets and amounted to EUR 104bn at the end of the fourth quarter (EUR 108bn at the end of the third quarter).
The long-term liquidity risk is measured as Net Stable Funding Ratio (NSFR). At the end of the fourth quarter2018, Nordea’s NSFR was 104.1% (Q3 107,1%).
Nordea issued approx. EUR 0.9bn in long-term funding in the fourth quarter excluding Danish covered bonds and subordinated notes, of which approx. EUR 0.7bn representedissuance of Swedish and Norwegian covered bonds in domestic markets.
Nordea’s long-term funding portion of total funding at the end of the fourth quarter was approx. 77%.
Nordea received awards as Financial Issuer of the Year and for Covered Bond of the Year by International Financing Review in December.
The market risk on Group Treasury & ALM’s interest-rate positions, calculated as average VaR, was EUR 39m in the fourth quarter. The risk related to equities (VaR) was EUR 5m and the risk related to credit spreads (VaR) was EUR 1m. Interest rate risk decreased whereas equity and credit spread risk increased slightly compared to the third quarter.
ResultTotal operating income was EUR 101m in the fourth quarter, up from EUR 56m in the previous quarter. Net interest income increased to EUR 43m in the fourth quarter compared to EUR 27m in the previous quarter. The net result from items at fair value increased to EUR 12m compared to EUR -11m in the previous quarter. Operating profit in Q4 was EUR -132m (EUR 52m in Q3) due mainly to goodwill impairment in Russia.
Total operating expenses increased to EUR 243m (EUR 14m in the previous quarter) due mainly to goodwill impairment in Russia. The transformation costs were EUR 14m.

Nordea Fourth Quarter 2018
40
Q4
Group functions, Other & Eliminations
Q418 Q318 Q218 Q118 Q417 Q4/Q3 Q4/Q4Jan-Dec
18Jan-Dec
17EURmNet interest income 43 27 8 -3 23 75 212Net fee and commission income -8 -11 -5 -5 -3 -29 -1Net result from items at fair value 12 -11 43 8 10 52 107Equity method & other income 54 51 389 31 31 525 28Total operating income 101 56 435 31 61 623 346Total operating expenses -243 -14 -36 -13 -80 -306 -276Profit before loan losses -142 42 399 18 -19 317 70Net loan losses 10 10 8 -4 1 24 -8Operating profit -132 52 407 14 -18 341 62Economic capital (EC) 2,231 2,545 2,386 2,394 2,379 2,231 2,379Risk exposure amount (REA) 16,264 17,559 17,512 18,668 20,531 16,264 20,531Number of employees (FTEs) 7,491 7,292 7,356 7,253 7,119 3% 5% 7,491 7,119

Nordea Fourth Quarter 2018
41
Q4
Income statementQ4 Q4 H2 H2 Jan-Dec Jan-Dec
Note 2018 2017 2018 2017 2018 2017EURm
Operating incomeInterest income 1,858 1,834 3,707 3,749 7,253 7,575Interest expense -732 -725 -1,509 -1,455 -2,929 -2,909Net interest income 1,126 1,109 2,198 2,294 4,324 4,666Fee and commission income 969 1,063 1,875 2,082 3,846 4,232Fee and commission expense -249 -224 -452 -429 -853 -863Net fee and commission income 3 720 839 1,423 1,653 2,993 3,369Net result from items at fair value 4 182 235 387 592 1,088 1,328Profit from associated undertakings and joint ventures accounted forunder the equity method 15 16 63 19 124 23Other operating income 60 29 78 43 476 83Total operating income 2,103 2,228 4,149 4,601 9,005 9,469
Operating expensesGeneral administrative expenses:
Staff costs -744 -861 -1,470 -1,618 -2,998 -3,212Other expenses 5 -390 -425 -713 -802 -1,399 -1,622
Depreciation, amortisation and impairment charges of tangible and intangible assets
-250 -75 -337 -145 -482 -268Total operating expenses -1,384 -1,361 -2,520 -2,565 -4,879 -5,102
Profit before loan losses 719 867 1,629 2,036 4,126 4,367
Net loan losses 6 -30 -71 -74 -150 -173 -369Operating profit 689 796 1,555 1,886 3,953 3,998
Income tax expense -197 -167 -379 -425 -872 -950Net profit for the period 492 629 1,176 1,461 3,081 3,048
Attributable to:Shareholders of Nordea Bank Abp 492 624 1,176 1,452 3,070 3,031Additional Tier 1 capital holders - - 0 - 7 -Non-controlling interests - 5 0 9 4 17Total 492 629 1,176 1,461 3,081 3,048
Basic earnings per share, EUR 0.12 0.15 0.29 0.36 0.76 0.75Diluted earnings per share, EUR 0.12 0.15 0.29 0.36 0.76 0.75
Statement of comprehensive incomeQ4 Q4 H2 H2 Jan-Dec Jan-Dec
2018 2017 2018 2017 2018 2017EURm
Net profit for the period 492 629 1,176 1,461 3,081 3,048Items that may be reclassified subsequently to the income statementCurrency translation differences during the period -188 -254 -118 -225 -240 -511Tax on currency translation differences during the period 0 4 -1 1 -2 3Hedging of net investments in foreign operations:
Valuation gains/losses during the period 83 95 51 69 67 175Tax on valuation gains/losses during the period -21 -19 -14 -14 -19 -37
Fair value through other comprehensive income:1Valuation gains/losses during the period, net of recycling -35 - -56 - -58 -Tax on valuation gains/losses during the period 8 - 13 - 13 -
Available for sale investments:1Valuation gains/losses during the period, net of recycling - -24 - -15 - 31Tax on valuation gains/losses during the period - 5 - 3 - -8
Cash flow hedges:Valuation gains/losses during the period, net of recycling 34 1 24 -2 44 -107Tax on valuation gains/losses during the period -8 0 -6 0 -10 24
Items that may not be reclassified subsequently to the income statementChanges in own credit riks related to liabilities classified as fair value option:
Valuation gains/losses during the period 8 - 11 - 20 -Tax on valuation gains/losses during the period -1 - -2 - -4 -
Defined benefit plans:Remeasurement of defined benefit plans -115 -172 -173 -115 -173 -115Tax on remeasurement of defined benefit plans 24 37 37 24 36 25
Other comprehensive income, net of tax -211 -327 -234 -274 -326 -520
Total comprehensive income 281 302 942 1,187 2,755 2,528
Attributable to:Shareholders of Nordea Bank Abp 281 297 942 1,178 2,744 2,511Additional Tier 1 capital holders - - - - 7 -Non-controlling interests - 5 - 9 4 17Total 281 302 942 1,187 2,755 2,5281 Valuation gains/losses related to hedged risks under fair value hedge accounting are accounted for directly in the income statement.

Nordea Fourth Quarter 2018
42
Q4
Balance sheet31 Dec 31 Dec
Note 2018 2017EURm
AssetsCash and balances with central banks 41,578 43,081Loans to central banks 7 7,642 4,796Loans to credit institutions 7 11,320 8,592Loans to the public 7 308,304 310,158Interest-bearing securities 76,222 75,294Financial instruments pledged as collateral 7,568 6,489Shares 12,452 17,180Assets in pooled schemes and unit-linked investment contracts 24,583 25,879Derivatives 37,025 46,111Fair value changes of the hedged items in portfolio hedge of interest rate risk 169 163Investments in associated undertakings and joint ventures 1,601 1,235Intangible assets 4,035 3,983Property and equipment 546 624Investment properties 1,607 1,448Deferred tax assets 164 118Current tax assets 284 121Retirement benefit assets 246 250Other assets 14,749 12,441Prepaid expenses and accrued income 1,313 1,463Assets held for sale 12 - 22,186Total assets 551,408 581,612
LiabilitiesDeposits by credit institutions 42,419 39,983Deposits and borrowings from the public 164,958 172,434Deposits in pooled schemes and unit-linked investment contracts 25,653 26,333Liabilities to policyholders 18,230 19,412Debt securities in issue 190,422 179,114Derivatives 39,547 42,713Fair value changes of the hedged items in portfolio hedge of interest rate risk 1,273 1,450Current tax liabilities 414 389Other liabilities 23,315 28,515Accrued expenses and prepaid income 1,696 1,603Deferred tax liabilities 706 722Provisions 321 329Retirement benefit obligations 398 281Subordinated liabilities 9,155 8,987Liabilities held for sale 12 - 26,031Total liabilities 518,507 548,296
EquityAdditional Tier 1 capital holders 750 750Non-controlling interests 6 168
Share capital 4,050 4,050Share premium reserve - 1,080Invested unrestricted equity 1,080 -Other reserves -1,876 -1,543Retained earnings 28,891 28,811Total equity 32,901 33,316
Total liabilities and equity 551,408 581,612
Assets pledged as security for own liabilities 171,899 198,973Other assets pledged 4,788 4,943Contingent liabilities 17,819 19,020Credit commitments1 73,287 74,545Other commitments 1,192 2,4871 Including unutilised portion of approved overdraft facilities of EUR 29,626m (31 Dec 2017: EUR 29,956m).

Nordea Fourth Quarter 2018
43
Q4
Statement of changes in equityAttributable to shareholders of Nordea Bank Abp
Other reserves:
Share capital1
Share premium reserve/ Invested
un- restricted
equity
Trans-lation of foreign opera-
tions
Cash flow
hedges
Fair value
through other
compre- hensive income2
Defined benefit
plans
Changes in own
credit risk related to liabilities
classified as fair value
optionRetained earnings Total
Addi-tionalTier 1
capital holders
Non-cont-
rolling interests
Total equity
EURmBalance at 1 Jan 2018 4,050 1,080 -1,720 -46 103 120 - 28,811 32,398 750 168 33,316Restatement due to changedaccounting policy3 - - - - 1 - -8 -237 -244 - - -244Restated openingbalance at 1 Jan 2018 4,050 1,080 -1,720 -46 104 120 -8 28,574 32,154 750 168 33,072Net profit for the period - - - - - - - 3,070 3,070 7 4 3,081Other comprehensiveincome, net of tax - - -194 34 -45 -137 16 - -326 - - -326
Total comprehensive income - - -194 34 -45 -137 16 3,070 2,744 7 4 2,755Paid interest on AT1 capital - - - - - - - - - -7 - -7Dividend 2017 - - - - - - - -2,747 -2,747 - - -2,747Purchase of own shares4 - - - - - - - -6 -6 - - -6Change in non-controlling interests5
- - - - - - - - - - -166 -166Balance at 31 Dec 2018 4,050 1,080 -1,914 -12 59 -17 8 28,891 32,145 750 6 32,901
Attributable to shareholders of Nordea Bank AbpOther reserves:
Share capital1
Share premium
reserve
Trans-lation of foreign opera-
tions
Cash flow
hedges
Available for sale invest-ments
Defined benefit
plansRetained earnings Total
Addi-tional Tier 1
capital holders
Non-cont-
rolling interests
Total equity
EURmBalance at 1 Jan 2017 4,050 1,080 -1,350 37 80 210 28,302 32,409 - 1 32,410Net profit for the period - - - - - - 3,031 3,031 - 17 3,048Other comprehensive income, net of tax - - -370 -83 23 -90 - -520 - - -520
Total comprehensiveincome - - -370 -83 23 -90 3,031 2,511 - 17 2,528Issuance of additionalTier 1 capital - - - - - - -6 -6 750 - 744Dividend for 2016 - - - - - - -2,625 -2,625 - - -2,625Purchase of own shares4 - - - - - - -12 -12 - - -12Change in non-controlling interests5
- - - - - - 121 121 - 150 271Balance at 31 Dec 2017 4,050 1,080 -1,720 -46 103 120 28,811 32,398 750 168 33,3161 Total shares registered were 4,050 million (31 Dec 2017: 4,050 million).2 Due to implementation of IFRS9 the Available for sale (AFS) category do no longer exists and the assets are instead classified as Fair value throught other comprehensive income (FVOCI). Hence, the opening balance 2018 for the FVOCI-reserve is the closing balance 2017 for the AFS-reserve. 3 Related to IFRS 9 and IFRS 15. See Note 1 for more information. 4 Refers to the change in the holding of own shares related to the Long Term Incentive Programme (LTIP), trading portfolio and Nordea's shares within portfolio schemes in Denmark. The number of own shares were 15.2 million (31 Dec 2017: 13.7 million). The total holding of own shares related to LTIP were 9.6 million (31 Dec 2017: 10.2 million).5 Of which EUR -172m (EUR 150m) refers to the sale of Nordea Liv & Pension, Livforsikringsselskab A/S in Denmark.

Nordea Fourth Quarter 2018
44
Q4
Cash flow statement, condensed Jan-Dec Jan-Dec
2018 2017EURm
Operating activitiesOperating profit 3,953 3,998Adjustments for items not included in cash flow 1,238 3,514Income taxes paid -1,024 -950Cash flow from operating activities before changes in operating assets and liabilities 4,167 6,562Changes in operating assets and liabilities -1,536 5,712Cash flow from operating activities 2,631 12,274
Investing activitiesAcquisition/sale of business operations 646 228Acquisition/sale of associated undertakings and joint ventures 9 -937Acquisition/sale of property and equipment -18 -118Acquisition/sale of intangible assets -608 -643Net investments in debt securities, held to maturity - -8Acquisition/sale of other financial fixed assets - -21Cash flow from investing activities 29 -1,499
Financing activitiesIssued/amortised subordinated liabilities -28 -750Divestment/repurchase of own shares including change in trading portfolio -6 -12Dividend paid -2,747 -2,625Issued additional tier 1 capital - 750Paid interest on additional tier 1 capital -7 -Cash flow from financing activities -2,788 -2,637
Cash flow for the period -128 8,138
Cash and cash equivalents 31 Dec 31 Dec2018 2017
EURmCash and cash equivalents at beginning of the period 46,213 41,860Translation difference -76 -3,785Cash and cash equivalents at end of the period 46,009 46,213Change -128 8,138
The following items are included in cash and cash equivalents: Cash and balances with central banks 41,578 43,081Loans to central banks 2,759 2,004Loans to credit institutions 1,672 779Assets held for sale - 349Total cash and cash equivalents 46,009 46,213
Cash comprises legal tender and bank notes in foreign currencies. Balances with central banks consist of deposits in accounts with central banks and postal girosystems under government authority, where the following conditions are fulfilled:- the central bank or the postal giro system is domiciled in the country where the institution is established.- the balance on the account is readily available at any time.
Loans to credit institutions, payable on demand include liquid assets not represented by bonds or other interest-bearing securities.

Nordea Fourth Quarter 2018
45
Q4
Notes to the financial statementsNote 1 Accounting policies
The consolidated interim financial statements are presented in accordance with IAS 34 “Interim Financial Reporting”, as endorsed by the EU commission.
The accounting policies and methods of computation are unchanged in comparison with the Annual Report 2017, except from changed accounting policies and presentation described below in the section “Changed accounting policies and presentation”. For more information see Note G1 in the Annual Report 2017.
Changed accounting policies and presentationThe following new and amended standards were implemented by Nordea 1 January 2018:
IFRS 9 ”Financial instruments”The new standard IFRS 9 “Financial instruments” covers classification and measurement, impairment and general hedge accounting and replaces the earlier requirements covering these areas in IAS 39. The classification, measurement and impairment requirements in IFRS 9 were implemented by Nordea as from 1 January 2018. Nordea has elected, as a policy choice permitted under IFRS 9, to continue to apply hedge accounting in accordance with the carve out version of IAS 39.
The total negative impact on equity from IFRS 9 amounts to EUR 183m after tax and was recognised as an opening balance adjustment 1 January 2018. For more information about the IFRS 9 transition impact on 1 January 2018, and the accounting principles applied by Nordea as from 1 January 2018 for classification, measurement and impairment of financial instruments, see Note G49 in the Annual Report for 2017. Nordea has not restated the comparative figures for 2017.
IFRS 15 “Revenue from Contracts with Customers”The new standard IFRS 15 “Revenue from Contracts with Customers” outlines a single comprehensive model of accounting for revenue arising from contracts with customers and supersedes earlier revenue recognition standards and interpretations within IFRS, such as IAS 18 “Revenue”. The standard does not apply to financial instruments, insurance contracts or lease contracts.
The standard was implemented by Nordea as from 1 January 2018 using the modified retrospective approach, meaning that the cumulative effect of the change was recognised as an adjustment to equity in the opening balance 2018. Comparable figures for 2017 are not restated.
The new standard had an impact on Nordea’s accounting policies for loan origination fees, as such fees are amortised as part of the effective interest of the loans to a larger extent than before. The total negative impact on equity from IFRS 15 amounts to EUR 61m after tax and was recognised as an opening balance adjustment 1 January 2018.
Nordea earns commission income from different services provided to customers. The recognition of commission income depends on the purpose for which the fees are received.
The major part of the revenues classified as “Commission income” constitutes revenue from contracts with customers according to IFRS 15. Fee income is recognised either when or as performance obligations are satisfied.
Asset management commissions are generally recognised over time as services are performed and are normally based on assets under management. These fees are recognised based on the passage of time as the amount, and the right to the fee, corresponds to the value received by the customer. Variable fees that are based on relative performance compared with a benchmark are in asset management rare and they are normally fixed and recognised at least each reporting date. Variable fees that are not fixed at the reporting date cannot generally be recognised as the outcome is uncertain and subject to market development.
Life & Pension commission income includes fee income, referred to as expense loading, from insurance contracts and investment contracts with policyholders. Investments contracts are contracts that do not include enough insurance risk to be classified as insurance contracts. The expense loading is the part of the premium income considered to be compensation for the contract administration. The fee income is recognised over time when the services are performed. These contracts do generally not include any up-front fees.
Fees categorised as Deposit Products, Brokerage, securities issues and corporate finance, Custody and issuer service and Payment commissions are recognised both over time and at a point of time dependent on when the performance obligations are satisfied. Card fees are categorised as interchange fees that are recognised at a point of time, when the customer uses the services, and cardholder fees that are recognised over time or at a point of time if the fee is transaction based.
Lending fees that are not part of the effective interest of a financial instrument are recognised at a point of time. The amount of loan syndication fees, as well as other transaction-based fees, received are recognised at a point when the performance obligation is satisfied, i.e. when the syndication or transaction has been performed. Fees received on bilateral transactions are generally amortised as part of the effective interest of the financial instruments recognised.
Income from issued financial guarantees, and expenses for bought financial guarantees, are amortised over the duration of the instruments and classified as “Fee and commission income” and “Fee and commission expense” respectively. Other fee income is generally transaction based.
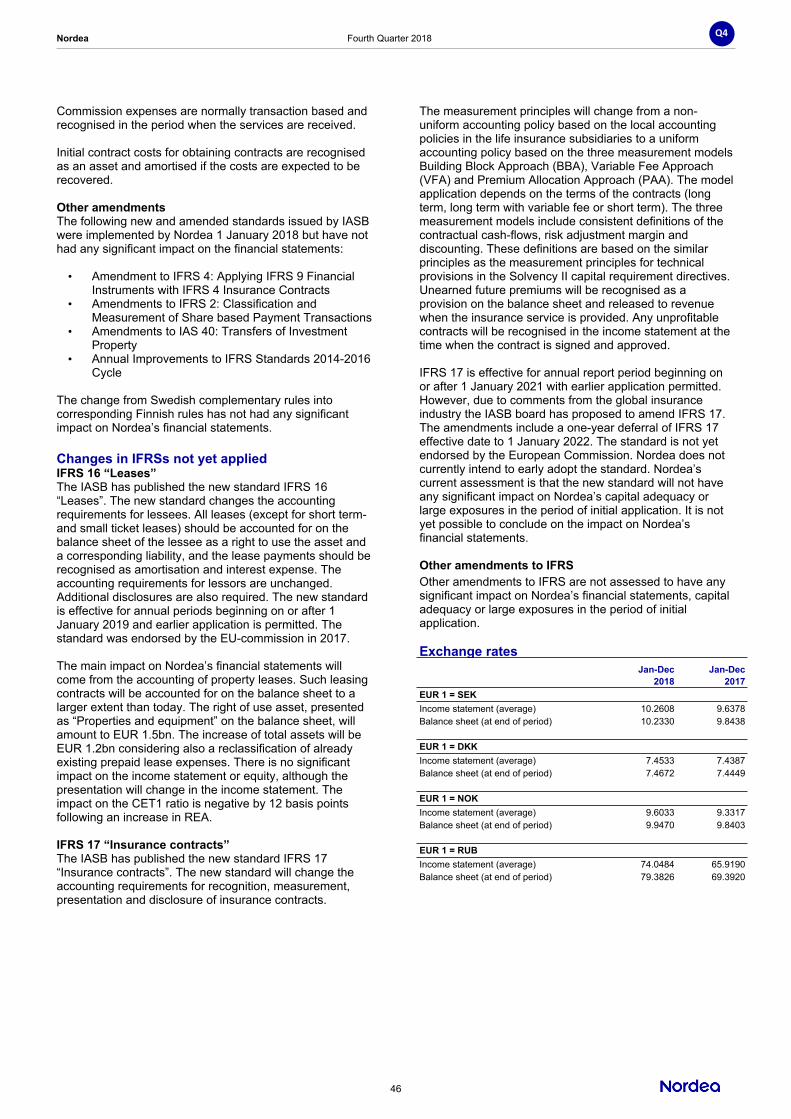
Nordea Fourth Quarter 2018
46
Q4
Commission expenses are normally transaction based and recognised in the period when the services are received.
Initial contract costs for obtaining contracts are recognised as an asset and amortised if the costs are expected to be recovered.
Other amendments The following new and amended standards issued by IASB were implemented by Nordea 1 January 2018 but have not had any significant impact on the financial statements:
• Amendment to IFRS 4: Applying IFRS 9 Financial Instruments with IFRS 4 Insurance Contracts
• Amendments to IFRS 2: Classification and Measurement of Share based Payment Transactions
• Amendments to IAS 40: Transfers of Investment Property
• Annual Improvements to IFRS Standards 2014-2016 Cycle
The change from Swedish complementary rules into corresponding Finnish rules has not had any significant impact on Nordea’s financial statements.
Changes in IFRSs not yet appliedIFRS 16 “Leases”The IASB has published the new standard IFRS 16 “Leases”. The new standard changes the accounting requirements for lessees. All leases (except for short term- and small ticket leases) should be accounted for on the balance sheet of the lessee as a right to use the asset and a corresponding liability, and the lease payments should be recognised as amortisation and interest expense. The accounting requirements for lessors are unchanged. Additional disclosures are also required. The new standard is effective for annual periods beginning on or after 1 January 2019 and earlier application is permitted. The standard was endorsed by the EU-commission in 2017.
The main impact on Nordea’s financial statements will come from the accounting of property leases. Such leasing contracts will be accounted for on the balance sheet to a larger extent than today. The right of use asset, presented as “Properties and equipment” on the balance sheet, will amount to EUR 1.5bn. The increase of total assets will be EUR 1.2bn considering also a reclassification of already existing prepaid lease expenses. There is no significant impact on the income statement or equity, although the presentation will change in the income statement. The impact on the CET1 ratio is negative by 12 basis points following an increase in REA.
IFRS 17 “Insurance contracts”The IASB has published the new standard IFRS 17 “Insurance contracts”. The new standard will change the accounting requirements for recognition, measurement, presentation and disclosure of insurance contracts.
The measurement principles will change from a non-uniform accounting policy based on the local accounting policies in the life insurance subsidiaries to a uniform accounting policy based on the three measurement models Building Block Approach (BBA), Variable Fee Approach (VFA) and Premium Allocation Approach (PAA). The model application depends on the terms of the contracts (long term, long term with variable fee or short term). The three measurement models include consistent definitions of the contractual cash-flows, risk adjustment margin and discounting. These definitions are based on the similar principles as the measurement principles for technical provisions in the Solvency II capital requirement directives. Unearned future premiums will be recognised as a provision on the balance sheet and released to revenue when the insurance service is provided. Any unprofitable contracts will be recognised in the income statement at the time when the contract is signed and approved.
IFRS 17 is effective for annual report period beginning on or after 1 January 2021 with earlier application permitted. However, due to comments from the global insurance industry the IASB board has proposed to amend IFRS 17. The amendments include a one-year deferral of IFRS 17 effective date to 1 January 2022. The standard is not yet endorsed by the European Commission. Nordea does not currently intend to early adopt the standard. Nordea’s current assessment is that the new standard will not have any significant impact on Nordea’s capital adequacy or large exposures in the period of initial application. It is not yet possible to conclude on the impact on Nordea’s financial statements.
Other amendments to IFRSOther amendments to IFRS are not assessed to have any significant impact on Nordea’s financial statements, capital adequacy or large exposures in the period of initial application. Exchange rates
Jan-Dec Jan-Dec2018 2017
EUR 1 = SEKIncome statement (average) 10.2608 9.6378Balance sheet (at end of period) 10.2330 9.8438
EUR 1 = DKKIncome statement (average) 7.4533 7.4387Balance sheet (at end of period) 7.4672 7.4449
EUR 1 = NOKIncome statement (average) 9.6033 9.3317Balance sheet (at end of period) 9.9470 9.8403
EUR 1 = RUBIncome statement (average) 74.0484 65.9190Balance sheet (at end of period) 79.3826 69.3920
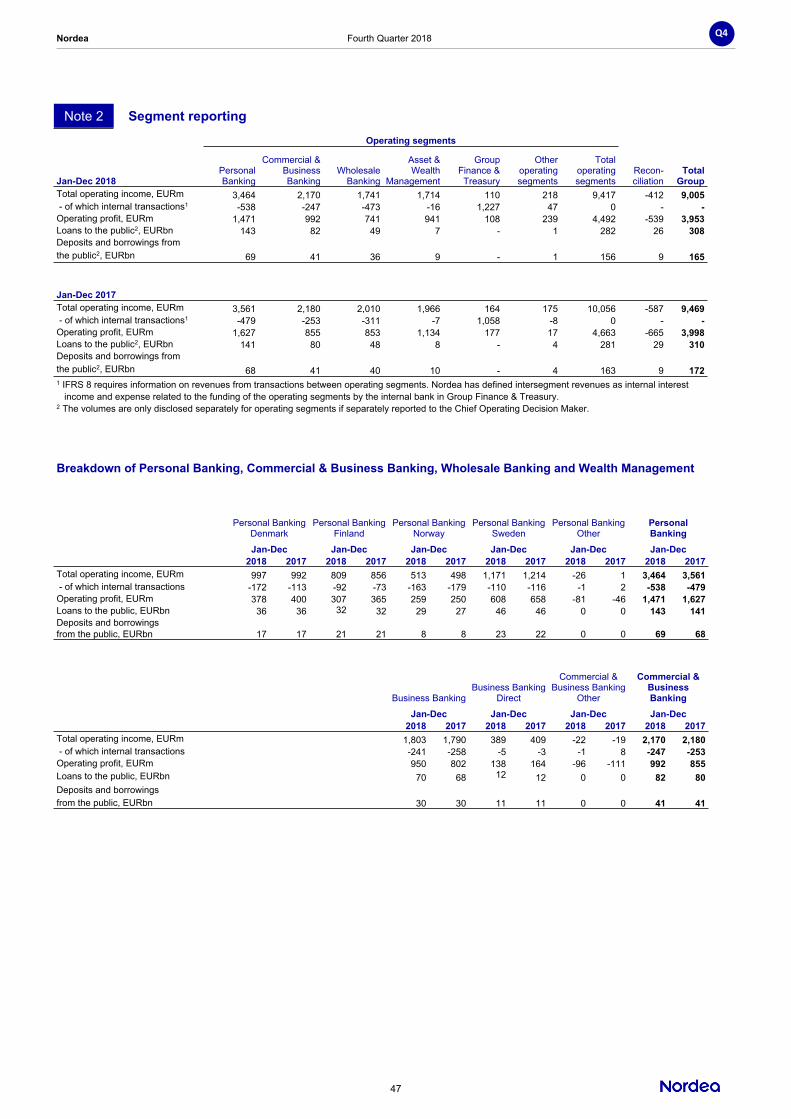
Nordea Fourth Quarter 2018
47
Q4
Note 2 Segment reportingOperating segments
Jan-Dec 2018Personal Banking
Commercial & Business Banking
Wholesale Banking
Asset & Wealth
Management
Group Finance &
Treasury
Other operating segments
Total operating segments
Recon-ciliation
Total Group
Total operating income, EURm 3,464 2,170 1,741 1,714 110 218 9,417 -412 9,005 - of which internal transactions1 -538 -247 -473 -16 1,227 47 0 - -Operating profit, EURm 1,471 992 741 941 108 239 4,492 -539 3,953Loans to the public2, EURbn 143 82 49 7 - 1 282 26 308Deposits and borrowings fromthe public2, EURbn 69 41 36 9 - 1 156 9 165
Jan-Dec 2017Total operating income, EURm 3,561 2,180 2,010 1,966 164 175 10,056 -587 9,469 - of which internal transactions1 -479 -253 -311 -7 1,058 -8 0 - -Operating profit, EURm 1,627 855 853 1,134 177 17 4,663 -665 3,998Loans to the public2, EURbn 141 80 48 8 - 4 281 29 310Deposits and borrowings fromthe public2, EURbn 68 41 40 10 - 4 163 9 1721 IFRS 8 requires information on revenues from transactions between operating segments. Nordea has defined intersegment revenues as internal interest income and expense related to the funding of the operating segments by the internal bank in Group Finance & Treasury.2 The volumes are only disclosed separately for operating segments if separately reported to the Chief Operating Decision Maker.
Breakdown of Personal Banking, Commercial & Business Banking, Wholesale Banking and Wealth Management
Personal Banking Denmark
Personal Banking Finland
Personal Banking Norway
Personal Banking Sweden
Personal Banking Other
Personal Banking
Jan-Dec Jan-Dec Jan-Dec Jan-Dec Jan-Dec Jan-Dec2018 2017 2018 2017 2018 2017 2018 2017 2018 2017 2018 2017
Total operating income, EURm 997 992 809 856 513 498 1,171 1,214 -26 1 3,464 3,561 - of which internal transactions -172 -113 -92 -73 -163 -179 -110 -116 -1 2 -538 -479Operating profit, EURm 378 400 307 365 259 250 608 658 -81 -46 1,471 1,627Loans to the public, EURbn 36 36 32 32 29 27 46 46 0 0 143 141Deposits and borrowingsfrom the public, EURbn 17 17 21 21 8 8 23 22 0 0 69 68
Business BankingBusiness Banking
Direct
Commercial & Business Banking
Other
Commercial & Business Banking
Jan-Dec Jan-Dec Jan-Dec Jan-Dec2018 2017 2018 2017 2018 2017 2018 2017
Total operating income, EURm 1,803 1,790 389 409 -22 -19 2,170 2,180 - of which internal transactions -241 -258 -5 -3 -1 8 -247 -253Operating profit, EURm 950 802 138 164 -96 -111 992 855Loans to the public, EURbn 70 68 12 12 0 0 82 80Deposits and borrowingsfrom the public, EURbn 30 30 11 11 0 0 41 41

Nordea Fourth Quarter 2018
48
Q4
Note 2 Continued
Corporate & Investment
Banking
Financial Institutions & International
Banks Banking RussiaCapital Markets
unallocated Wholesale
Banking OtherWholesale Banking
Jan-Dec Jan-Dec Jan-Dec Jan-Dec Jan-Dec Jan-Dec2018 2017 2018 2017 2018 2017 2018 2017 2018 2017 2018 2017
Total operating income, EURm 1,359 1,316 296 334 79 123 49 256 -42 -19 1,741 2,010 - of which internal transactions -314 -256 -42 -41 -54 -66 -58 55 -5 -3 -473 -311Operating profit, EURm 840 628 85 108 -13 52 -77 130 -94 -65 741 853Loans to the public, EURbn 45 44 2 2 2 2 - - - - 49 48Deposits and borrowings from thepublic, EURbn 25 27 10 12 1 1 - - - - 36 40
Private BankingAsset
ManagementLife & Pension
unallocated
Asset & Wealth Management
OtherAsset & Wealth
Management Jan-Dec Jan-Dec Jan-Dec Jan-Dec Jan-Dec
2018 2017 2018 2017 2018 2017 2018 2017 2018 2017Total operating income, EURm 533 594 918 975 470 614 -207 -217 1,714 1,966 - of which internal transactions -13 -8 1 2 0 0 -4 -1 -16 -7Operating profit, EURm 151 165 622 698 311 409 -143 -138 941 1,134Loans to the public, EURbn 7 8 - - - - - - 7 8Deposits and borrowings from the public, EURbn 9 10 - - - - - - 9 10
Reconciliation between total operating segments and financial statements
Operating profit, EURm
Loans to the public, EURbn
Deposits and borrowings
from the public, EURbn
Jan-Dec Jan-Dec Jan-Dec2018 2017 2018 2017 2018 2017
Total operating segments 4,492 4,663 282 281 156 163Group functions1 -139 -203 - - - -Unallocated items 137 86 29 28 11 9Differences in accounting policies2 -537 -548 -3 1 -2 0Total 3,953 3,998 308 310 165 1721 Consists of Group Risk Management, Group Internal Audit, Chief of staff office, Group Corporate Centre and Group Compliance.2 Impact from different classification of assets/liabilities held for sale, plan exchange rates and internal allocation principles used in the segment reporting.
Measurement of operating segments' performanceThe measurement principles and allocation between operating segments follow the information reported to the Chief Operating Decision Maker (CODM), as required by IFRS 8. In Nordea the CODM has been defined as Group Executive Management. The main differences compared to the section "Business areas" in this report are that the information for CODM is prepared using plan exchange rates and to that different allocation principles between operating segments have been applied.
Financial results are presented for the main business areas Personal Banking, Commercial & Business Banking, Wholesale Banking and Wealth Management, with a further breakdown on operating segments, and the operating segment Group Finance & Treasury. Other operating segments below the quantitative thresholds in IFRS 8 are included in Other operating segments. Group functions (and eliminations) as well as the result that is not fully allocated to any of the operating segments, are shown separately as reconciling items.
Changes in basis of segmentationDuring the second quarter changes to the basis of segmentation were made following the decision to reorganise the segment Business & Commercial Banking into new operating segments and to merge Shipping into CIB. Business & Commercial Banking consists of the two new operating segments Business Banking and Business Banking Direct, instead of the earlier operating segments Commercial Banking and Business Banking. These changes are reflected in the reporting to the Chief Operating Decision Maker (CODM) and are consequently part of the segment reporting in Note 2. Comparative figures have been restated accordingly.

Nordea Fourth Quarter 2018
49
Q4
Note 3 Net fee and commission incomeQ4 Q3 Q4 H2 H2 Jan-Dec Jan-Dec
2018 2018 2017 2018 2017 2018 2017EURmAsset management commissions 360 358 394 718 769 1,440 1,543Life & Pensions 64 54 83 118 160 258 313Deposit Products 7 6 6 13 13 23 27Brokerage, securities issues and corporate finance 53 21 45 74 100 173 224Custody and issuer services 15 10 19 25 29 49 59Payments 72 73 73 145 148 302 307Cards 49 57 51 106 113 218 228Lending Products 92 98 115 190 228 399 465Guarantees 22 31 32 53 68 116 143Other -14 -5 21 -19 25 15 60Total 720 703 839 1,423 1,653 2,993 3,369
Break-down Jan-Dec 2018
Personal Banking
Commercial & Business
BankingWholesale Banking
Asset & Wealth
Management
Group Finance
and Treasury
Other and elimination
Nordea Group
EURmAsset management commissions 160 34 11 1,235 0 0 1,440Life & Pensions 51 22 4 181 0 0 258Deposit Products 11 11 1 0 0 0 23Brokerage, securities issues and corporate finance 25 20 102 31 -5 0 173Custody and issuer services 8 7 35 9 -10 0 49Payments 88 163 55 0 -4 0 302Cards 181 22 15 0 0 0 218Lending Products 118 100 181 0 0 0 399Guarantees 6 40 70 0 0 0 116Other 23 18 -3 -13 -1 -9 15Total 671 437 471 1,443 -20 -9 2,993
Note 4 Net result from items at fair valueQ4 Q3 Q4 H2 H2 Jan-Dec Jan-Dec
2018 2018 2017 2018 2017 2018 2017EURmEquity related instruments 52 19 45 71 414 226 370Interest related instruments and foreign exchange gains/losses 119 136 101 255 20 684 712Other financial instruments (including credit and commodities) -16 28 26 12 51 55 20Investment properties 0 1 1 1 -1 0 -3Life insurance1 27 21 62 48 108 123 229Total 182 205 235 387 592 1,088 1,3281 Internal transactions not eliminated against other lines in the Note. The line Life insurance consequently provides the true impact from the Life insurance operations.
Break-down of life insuranceQ4 Q3 Q4 H2 H2 Jan-Dec Jan-Dec
2018 2018 2017 2018 2017 2018 2017EURmEquity related instruments -605 147 516 -458 715 -515 1,344Interest related instruments and foreign exchange gains/losses -82 64 96 -18 395 -65 715Other financial instruments 0 0 3 0 3 0 4Investment properties 36 26 49 62 100 125 195Change in technical provisions1 295 -164 -646 131 -1,165 20 -2,056Change in collective bonus potential 373 -63 103 310 104 512 7Insurance risk income 16 16 44 32 95 91 177Insurance risk expense -6 -5 -103 -11 -139 -45 -157Total 27 21 62 48 108 123 2291 Premium income amounts to EUR 72m for Q4 2018 and EUR 840m for Jan-Dec 2018 (Q4 2017: EUR 674m, Jan-Dec 2017: EUR 2,833m).

Nordea Fourth Quarter 2018
50
Q4
Note 5 Other expensesQ4 Q3 Q4 H2 H2 Jan-Dec Jan-Dec
2018 2018 2017 2018 2017 2018 2017EURmInformation technology -120 -122 -128 -242 -279 -484 -565Marketing and representation -26 -11 -21 -37 -35 -60 -66Postage, transportation, telephone and office expenses -20 -19 -24 -39 -48 -83 -101Rents, premises and real estate -83 -71 -84 -154 -156 -312 -309Other -141 -100 -168 -241 -284 -460 -581Total -390 -323 -425 -713 -802 -1,399 -1,622
Note 6 Net loan lossesQ4 Q3 Jan-Dec
20181 20181 20181
EURmNet loan losses, stage 1 21 -38 -16Net loan losses, stage 2 18 -5 51Net loan losses, non-defaulted 39 -43 35
Stage 3, defaultedNet loan losses, individually assessed, collectively calculated 2 20 -45Realised loan losses -129 -115 -479Decrease of provisions to cover realised loan losses 81 50 293Recoveries on previous realised loan losses 13 8 44New/increase in provisions -150 -158 -554Reversals of provisions 114 194 533Net loan losses, defaulted -69 -1 -208
Net loan losses -30 -44 -173
Key ratiosQ4 Q3 Jan-Dec
20181 20181 20181
Loan loss ratio, basis points 5 8 7- of which stage 1 -4 7 1- of which stage 2 -3 1 -2- of which stage 3 12 0 8
Q4 Jan-Dec20172 20172
EURmRealised loan losses -102 -435Decrease of provisions to cover realised loan losses 66 309Recoveries on previous realised loan losses 13 54New/increase in provisions -268 -1,001Reversal of provisions 220 704Net loan losses -71 -369
Key ratiosQ4 Jan-Dec
20172 20172
Loan loss ratio, basis points 9 12- of which individual 20 15- of which collective -11 -3
1 Based on IFRS 9.2 Based on IAS 39.

Nordea Fourth Quarter 2018
51
Q4
Note 7 Loans and impairmentTotal
31 Dec 30 Sep 31 Dec20181 20181 20172
EURmLoans measured at fair value 77,521 89,373 76,766Loans measured at amortised cost, not impaired (stage 1 and 2) 247,204 247,307 243,045Impaired loans (stage 3) 4,581 4,748 6,068
- of which servicing 2,097 2,310 3,593- of which non-servicing 2,484 2,438 2,475
Loans before allowances 329,306 341,428 325,879-of which central banks and credit institution 18,977 22,827 13,389
Allowances for individually assessed impaired loans (stage 3) -1,599 -1,631 -1,936-of which servicing -720 -781 -1,103-of which non-servicing -879 -850 -833
Allowances for collectively assessed impaired loans (stage 1 and 2) -441 -478 -397Allowances -2,040 -2,109 -2,333-of which central banks and credit institution -15 -2 -1
Loans, carrying amount 327,266 339,319 323,546
Exposures measured at amortised cost and fair value through OCI, before allowances31 Dec 20181 31 Dec
Stage 1 Stage 2 Stage 3 20172
EURmLoans to central banks, credit institutions and the public 232,687 14,517 4,581 249,113Interest-bearing securities3 36,951 - - 39,434Total 269,638 14,517 4,581 288,547
Allowances and provisions31 Dec 20181 31 Dec
Stage 1 Stage 2 Stage 3 20172
EURmLoans to central banks, credit institutions and the public -146 -295 -1,599 -2,333Interest-bearing securities -2 - - -Provisions for off balance sheet items -18 -41 -62 -91Total allowances and provisions -166 -336 -1,661 -2,424
Movements of allowance accounts for loans measured at amortised costStage 1 Stage 2 Stage 3 Total
EURmBalance as at 1 Jan 20181 -133 -360 -1,816 -2,309Changes due to origination and acquisition -33 -21 -9 -63Changes due to change in credit risk (net) -1 48 -72 -25Changes due to repayments and disposals 20 37 37 94Write-off through decrease in allowance account - - 280 280Other changes 1 - -23 -22Translation differences - 1 4 5Balance as at 30 Dec 2018 -146 -295 -1,599 -2,040
Key ratios4 31 Dec20181
Impairment rate (stage 3), gross, basis points 182Impairment rate (stage 3), net, basis points 118Total allowance rate (stage 1, 2 and 3), basis points 81Allowances in relation to impaired loans (stage 3), % 35Allowances in relation to loans in stage 1 and 2, basis points 1
31 Dec20172
Impairment rate, gross, basis points 186Impairment rate, net, basis points 127Total allowance rate, basis points 72Allowances in relation to impaired loans, % 32Total allowances in relation to impaired loans, % 38Non-servicing, not impaired, EURm 2531 Based on IFRS 9. EUR 177m reclassified from allowances on loans held at amortised cost at transition to IFRS 9. Remeasurement (increase) under IFRS 9 EUR 153m.2 Based on IAS 39. Comparative figures for 2017 include impaired loans and allowances for loans measured at fair value. For 2018, these are not disclosed as impaired loans or allowances but rather as adjustment to fair value through "Net result from on items at fair value" in the income statement.3 Including financial instruments pledged as collateral4 For definitions, see Glossary.

Nordea Fourth Quarter 2018
52
Q4
Note 8 Classification of financial instruments
Fair value through profit or loss (FVPL)
Amortised cost (AC) Mandatorily
Designated at fair value
through profit or loss (Fair
value option)
Derivatives used for hedging
Fair value through
other com-prehensive
income (FVOCI) Total
EURmFinancial assetsCash and balances with central banks 41,578 - - - - 41,578Loans to central banks 6,446 1,196 - - - 7,642Loans to credit institutions 8,827 2,493 - - - 11,320Loans to the public 234,471 73,833 - - - 308,304Interest-bearing securities 3,384 32,682 7,134 - 33,022 76,222Financial instruments pledged as collateral - 7,026 - - 542 7,568Shares - 12,452 - - - 12,452Assets in pooled schemes and unit-linkedinvestment contracts - 24,272 153 - - 24,425Derivatives - 33,915 - 3,110 - 37,025Fair value changes of the hedged items inportfolio hedge of interest rate risk 169 - - - - 169Other assets 955 12,473 - - - 13,428Prepaid expenses and accrued income 989 - - - - 989Total 31 Dec 2018 296,819 200,342 7,287 3,110 33,564 541,122
Total 1 Jan 20181 295,746 208,039 8,331 1,696 36,342 550,154
Fair value through profit or loss (FVPL)
Amortised cost (AC) Mandatorily
Designated at fair value
through profit or loss (Fair
value option)
Derivatives used for hedging Total
EURmFinancial liabilitiesDeposits by credit institutions 33,933 8,486 - - 42,419Deposits and borrowings from the public 158,433 6,525 - - 164,958Deposits in pooled schemes and unit-linkedinvestment contracts - - 25,653 - 25,653Liabilities to policyholders - - 3,234 - 3,234Debt securities in issue 135,644 - 54,778 - 190,422Derivatives - 38,624 - 923 39,547Fair value changes of the hedged items inportfolio hedge of interest rate risk 1,273 - - - 1,273Other liabilities 989 17,828 - - 18,817Accrued expenses and prepaid income 273 - - - 273Subordinated liabilities 9,155 - - - 9,155Total 31 Dec 2018 339,700 71,463 83,665 923 495,751
Total 1 Jan 20181 333,435 81,008 86,451 1,106 502,0001 In Note G49 "Classification of asset and liabilities under IFRS 9" in the Annual report 2017, the assets and liabilities per 1 January 2018 were presented in accordance with IFRS 9 and as stated the classification of the decrease of net tax liabilities of EUR 46m due to IFRS 9 on assets and liabilities remained to be confirmed. The correct classification has now been determined and resulted in an increase of Deferred tax assets and Deferred tax liabilities, both classified as non financial asset/liabilities, of EUR 41m compared to the amounts presented in Note G49. In addition, the effect on the opening balance 1 January 2018 due to IFRS 15 has been added and resulted in a decrease of Loans classified at amortised cost of EUR 79m, an increase of Deferred tax assets of EUR 15m and a decrease of Deferred tax liabilities of EUR 3m, both classified as non financial assets/liabilities, compared to the amounts presented in Note G49.

Nordea Fourth Quarter 2018
53
Q4
Note 9 Fair value of financial assets and liabilities
31 Dec 2018 31 Dec 2017Carrying amount Fair value
Carrying amount Fair value
EURmFinancial assetsCash and balances with central banks 41,578 41,578 43,081 43,081Loans 327,435 330,681 323,709 325,372Interest-bearing securities 76,222 76,334 75,294 75,473Financial instruments pledged as collateral 7,568 7,568 6,489 6,489Shares 12,452 12,452 17,180 17,180Assets in pooled schemes and unit-linked investment contracts 24,425 24,425 25,728 25,728Derivatives 37,025 37,025 46,111 46,111Other assets 13,428 13,428 11,795 11,795Prepaid expenses and accrued income 989 989 999 999Total 541,122 544,480 550,386 552,228
Financial liabilitiesDeposits and debt instruments 408,227 409,014 401,968 403,488Deposits in pooled schemes and unit-linked investment contracts 25,653 25,653 26,333 26,333Liabilities to policyholders 3,234 3,234 3,486 3,486Derivatives 39,547 39,547 42,713 42,713Other liabilities 18,817 18,817 27,254 27,254Accrued expenses and prepaid income 273 273 246 246Total 495,751 496,538 502,000 503,520
The determination of fair value is described in the Annual report 2017, Note G40 "Assets and liabilities at fair value".

Nordea Fourth Quarter 2018
54
Q4
Note 10 Financial assets and liabilities held at fair value on the balance sheet
Categorisation into the fair value hierarchy
Quoted prices in
active markets for
the same instruments
(Level 1)Of which
Life
Valuation technique
using observable
data (Level 2)
Of which Life
Valuation technique
using non-observable
data (Level 3)
Of which Life Total
EURmAssets at fair value on the balance sheet1
Loans to central banks - - 1,196 - - - 1,196Loans to credit institutions - - 2,493 - - - 2,493Loans to the public - - 73,833 - - - 73,833Interest-bearing securities2 30,947 3,896 49,130 3,393 329 4 80,406Shares 10,159 8,381 596 595 1,697 916 12,452Assets in pooled schemes and unit-linked investment contracts 24,167 20,692 227 227 31 31 24,425
Derivatives 70 - 35,917 89 1,038 - 37,025Other assets - - 12,399 - 74 40 12,473Total 31 Dec 2018 65,343 32,969 175,791 4,304 3,169 991 244,303
Total 31 Dec 2017 65,590 32,575 185,703 8,283 3,454 1,123 254,747
Liabilities at fair value on the balance sheet1
Deposits by credit institutions - - 8,486 - - - 8,486Deposits and borrowings from the public - - 6,525 - - - 6,525Deposits in pooled schemes and unit-linked investment contracts
- - 25,653 21,689 - - 25,653Liabilities to policyholders - - 3,234 3,234 - - 3,234Debt securities in issue 12,405 - 39,746 - 2,627 - 54,778Derivatives 42 - 38,482 80 1,023 - 39,547Other liabilities 7,192 - 10,622 - 14 - 17,828Total 31 Dec 2018 19,639 - 132,748 25,003 3,664 - 156,051
Total 31 Dec 2017 26,746 - 136,752 25,519 5,067 - 168,5651 All items are measured at fair value on a recurring basis at the end of each reporting period. 2 Of which EUR 7,568m relates to the balance sheet item Financial instruments pledged as collateral.
Determination of fair values for items measured at fair value on the balance sheetNordea has during the year, in comparison with the description in Note G40 in the Annual Report for 2017, changed the margin reset frequency assumption in the fair value model covering a mortgage loan portfolio in Denmark. The change generated a pre-tax gain of EUR 135m accounted for as “Net result from items at fair value” in the income statement. For more information about valuation techniques and inputs used in the fair value measurement, see the Annual report 2017, Note G40 "Assets and liabilities at fair value".
Transfers between Level 1 and 2 During the period, Nordea transferred interest-bearing securities (including such financial instruments pledged as collateral) of EUR 6,778m from Level 1 to Level 2 and EUR 3,169m from Level 2 to Level 1 of the fair value hierarchy. Nordea has also transferred debt securities in issue of EUR 7,534m from Level 1 to Level 2 and EUR 384m from Level 2 to Level 1. In addition, Nordea has transferred derivative assets of EUR 4m and derivative liabilities of EUR 2m from Level 2 to Level 1. Further Nordea transferred other liabilities from Level 1 to Level 2 of EUR 1,494m and EUR 128m from Level 2 to Level 1. The reason for the transfers from Level 1 to Level 2 was that the instruments ceased to be actively traded during the period and fair values have now been obtained using valuation techniques with observable market inputs. The reason for the transfer from Level 2 to Level 1 was that the instruments have again been actively traded during the period and reliable quoted prices are obtained in the market. Transfers between levels are considered to have occurred at the end of the reporting period.

Nordea Fourth Quarter 2018
55
Q4
Note 10 Continued
Movements in Level 3 Fair value
gains/losses recognised in
the income statement
during the year
1 JanRea-lised
Un-realised
Recog-nised
in OCIPurchases/
Issues SalesSettle-ments
Transfers into
Level 3
Transfers out of
Level 3Reclass-ification
Transla-tion diff-erences 31 Dec
EURmIntererest-bearing securities 168 -2 2 - 169 -9 2 - - - -1 329- of which Life 5 - - - - - - - - - -1 4Shares 1,584 130 66 - 317 -333 -64 5 - -3 -5 1,697- of which Life 927 84 12 - 103 -135 -64 5 - - -16 916Assets in pooled schemes andunit-linked investment contracts 191 4 -8 - -61 -86 -3 - - - -6 31- of which Life 191 4 -8 - -61 -86 -3 - - - -6 31Derivatives (net) 453 -264 -431 - - 18 246 3 -10 - 0 15Other assets - - - - 6 - - 68 - - - 74- of which Life - - - - - - - 40 - - - 40Debt securities in issue 4,009 3 -585 -23 437 - -1,215 1 - - - 2,627Other liabilities - - - - - - - 14 - - - 14Total 2018, net -1,613 -135 214 23 -6 -410 1,396 61 -10 -3 -12 -495
Total 2017, net 4,411 -108 68 - 609 -605 104 76 -54 - -12 4,489
Unrealised gains and losses relate to those assets and liabilities held at the end of the reporting period. The reason for the transfer out of Level 3 was that observable market data became available. The reason for the transfer into Level 3 was that observable market data was no longer available. Transfers between levels are considered to have occurred at the end of the reporting period. Fair value gains and losses in the income statement during the period are included in "Net result from items at fair value". Assets and liabilities related to derivatives are presented net.
The valuation processes for fair value measurements in Level 3For information about valuation processes for fair value measurement in Level 3, see the Annual report 2017 Note G40 "Assets and liabilities at fair value".
Deferred day 1 profitThe transaction price for financial instruments in some cases differs from the fair value at initial recognition measured using a valuation model, mainly due to that the transaction price is not established in an active market. If there are significant unobservable inputs used in the valuation technique (Level 3), the financial instrument is recognised at the transaction price and any difference between the transaction price and fair value at initial recognition measured using a valuation model (Day 1 profit) is deferred. For more information see the Annual report 2017 Note G1 "Accounting policies". The table below shows the aggregated difference yet to be recognised in the income statement at the beginning and end of the period and a reconciliation of how this aggregated difference has changed during the period (movement of deferred Day 1 profit).
Deferred day 1 profit - Derivatives, net2018 2017
EURmOpening balance at 1 Jan 58 23Deferred profit on new transactions 62 89Recognised in the income statement during the period1 -39 -54Closing balance at 31 Dec 81 581 Of which EUR -m (EUR -2m) due to transfers of derivatives from Level 3 to Level 2.

Nordea Fourth Quarter 2018
56
Q4
Note 10 Continued
Valuation techniques and inputs used in the fair value measurements in Level 3
Fair value Of which
Life1 Valuation techniques Unobservable inputRange of fair
value4
EURmInterest-bearing securities Mortgage and other credit institutions2 323 - Discounted cash flows Credit spread -32/32Corporates 6 4 Discounted cash flows Credit spread 0/0Total 31 Dec 2018 329 4 -32/32
Total 31 Dec 2017 168 5 -1/1
Shares Private equity funds 745 457 Net asset value3 -84/84Hedge funds 102 83 Net asset value3 -6/6Credit funds 398 176 Net asset value/market consensus3 -33/33Other funds 292 183 Net asset value/Fund prices3 -26/26Other5 191 48 - -16/16Total 31 Dec 2018 1,728 947 -165/165
Total 31 Dec 2017 1,775 1,118 -152/152
Derivatives, netInterest rate derivatives 259 - Option model Correlations -13/14
VolatilitiesEquity derivatives -25 - Option model Correlations -12/8
VolatilitiesDividends
Foreign exchange derivatives -13 - Option model Correlations -0/0Volatilities
Credit derivatives -212 - Credit derivative model Correlations -34/33VolatilitiesRecovery rates
Other 6 - Option model Correlations -0/0Volatilities
Total 31 Dec 2018 15 - -59/55
Total 31 Dec 2017 453 - -41/33
Debt securities in issueIssued structured bonds 2,627 - Credit derivative model Correlations -13/13
Recovery ratesVolatilities
Total 31 Dec 2018 2,627 - -13/13
Total 31 Dec 2017 4,009 - -20/20
Other, net
Other assets and Other liabilities, net 60 40 - - -7/7
Total 31 Dec 2018 60 40 -7/7
Total 31 Dec 2017 - - -1 Investments in financial instruments is a major part of the life insurance business, acquired to fulfil the obligations behind the insurance- and investments contracts. The gains or losses on these instruments are almost exclusively allocated to policyholders and do consequently not affect Nordea's equity.2 Of which EUR 155m is priced at a credit spread (the difference between the discount rate and LIBOR) of 1.45% and a reasonable change of this credit spread would not affect the fair value due to callability features.3 The fair values are based on prices and net asset values delivered by external suppliers/custodians. The prices are fixed by the suppliers/custodians on the basis of the development in assets behind the investments. For private equity funds the dominant measurement methodology used by the suppliers/ custodians is consistent with the International Private Equity and Venture Capital Valuation (IPEV) guidelines issued by Invest Europe (formerly called EVCA). Approximately 40% of the private equity fund investments are internally adjusted/valued based on the IPEV guidelines. These carrying amounts are in a range of 5% to 100% compared to the values received from suppliers/custodians.4 The column "Range of fair value" shows the sensitivity of Level 3 financial instruments to changes in key assumptions. For more information see the Annual Report 2017, Note G40 "Assets and liabilities at fair value".5 Of which EUR 31m related to assets in pooled schemes and unit-linked investment.
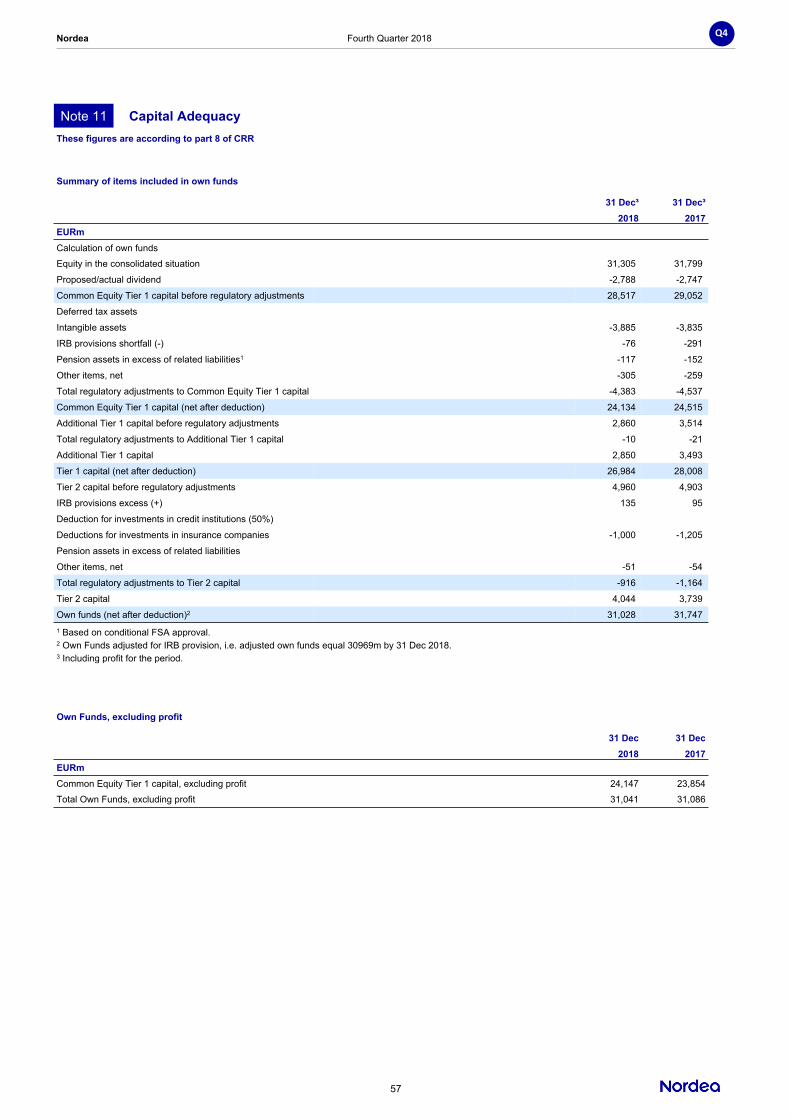
Nordea Fourth Quarter 2018
57
Q4
Note 11 Capital AdequacyThese figures are according to part 8 of CRR
Summary of items included in own funds
31 Dec³ 31 Dec³2018 2017
EURmCalculation of own fundsEquity in the consolidated situation 31,305 31,799
Proposed/actual dividend -2,788 -2,747
Common Equity Tier 1 capital before regulatory adjustments 28,517 29,052
Deferred tax assets 0
Intangible assets -3,885 -3,835
IRB provisions shortfall (-) -76 -291
Pension assets in excess of related liabilities1 -117 -152
Other items, net -305 -259
Total regulatory adjustments to Common Equity Tier 1 capital -4,383 -4,537
Common Equity Tier 1 capital (net after deduction) 24,134 24,515
Additional Tier 1 capital before regulatory adjustments 2,860 3,514
Total regulatory adjustments to Additional Tier 1 capital -10 -21
Additional Tier 1 capital 2,850 3,493
Tier 1 capital (net after deduction) 26,984 28,008
Tier 2 capital before regulatory adjustments 4,960 4,903
IRB provisions excess (+) 135 95
Deduction for investments in credit institutions (50%)
Deductions for investments in insurance companies -1,000 -1,205
Pension assets in excess of related liabilities
Other items, net -51 -54
Total regulatory adjustments to Tier 2 capital -916 -1,164
Tier 2 capital 4,044 3,739
Own funds (net after deduction)2 31,028 31,7471 Based on conditional FSA approval.2 Own Funds adjusted for IRB provision, i.e. adjusted own funds equal 30969m by 31 Dec 2018.3 Including profit for the period.
Own Funds, excluding profit
31 Dec 31 Dec2018 2017
EURmCommon Equity Tier 1 capital, excluding profit 24,147 23,854Total Own Funds, excluding profit 31,041 31,086

Nordea Fourth Quarter 2018
58
Q4
Note 11 Continued
Minimum capital requirement and REA
31 Dec¹ 31 Dec¹ 31 Dec 31 Dec
2018 2018 2017 2017
Minimum Capital requirement REA
Minimum Capital requirement REA
EURmCredit risk 9,678 120,969 8,219 102,743 - of which counterparty credit risk 534 6,671 488 6,096
IRB 8,611 107,635 7,104 88,808 - sovereign 149 1,869 - corporate 5,749 71,868 4,560 57,004 - advanced 4,850 60,626 3,774 47,173 - foundation 899 11,242 786 9,831 - institutions 477 5,953 493 6,163 - retail 2,078 25,979 1,671 20,888 - secured by immovable property collateral 1,369 17,118 934 11,678 - other retail 709 8,861 737 9,210 - items representing securitisation positions 132 1,648 68 850 - other 175 2,187 163 2,034
Standardised 1,067 13,334 1,115 13,935- central governments or central banks 48 600 22 281- regional governments or local authorities 7 86 1 7- public sector entities 0 2 0 3- multilateral development banks- international organisations - institutions 20 248 14 171- corporate 312 3,904 261 3,264- retail 259 3,243 258 3,225- secured by mortgages on immovable properties 79 984 197 2,458- in default 28 344 47 592- associated with particularly high risk 65 811 60 754- covered bonds - institutions and corporates with a short-term credit assessment - collective investments undertakings (CIU) - equity 198 2,472 208 2,598- other items 51 640 47 582
Credit Value Adjustment Risk 74 931 96 1,207
Market risk 485 6,064 282 3,520 - trading book, Internal Approach 351 4,388 196 2,444 - trading book, Standardised Approach 86 1,070 86 1,076 - banking book, Standardised Approach 48 606
Operational risk 1,319 16,487 1,345 16,809Standardised 1,319 16,487 1,345 16,809
Additional risk exposure amount related to Finnish RW floor due to Article 458 CRR 53 657Additional risk exposure amount related to Swedish RW floor due to Article 458 CRR 850 10,626
Additional risk exposure amount due to Article 3 CRR 12 152 120 1,500
Sub total 12,471 155,886 10,062 125,779
Adjustment for Basel I floorAdditional capital requirement according to Basel I floor 6,132 76,645Total 12,471 155,886 16,194 202,424
1. Includes ECB decision on temporary tolerance for continued use of the internal models. For more information see under Other information.

Nordea Fourth Quarter 2018
59
Q4
Note 11 ContinuedMinimum Capital Requirement & Capital Buffers
Capital Buffers Minimum
Capital requirement CCoB CCyB SII SRB
Capital Buffers total1 Total
PercentageCommon Equity Tier 1 capital 4.5 2.5 0.9 3.4 7.9Tier 1 capital 6.0 2.5 0.9 3.4 9.4Own funds 8.0 2.5 0.9 3.4 11.4
EURm
Common Equity Tier 1 capital 7,015 3,897 1,421 5,318 12,333Tier 1 capital 9,353 3,897 1,421 5,318 14,671Own funds 12,471 3,897 1,421 5,318 17,7891 Only the maximum of the SRB and SII is used in the calculation of the total capital buffers.Common Equity Tier 1 available to meet Capital Buffers
31 Dec¹ 31 Dec¹2018 2017
Percentage points of REACommon Equity Tier 1 capital 11.0 15.01 Including profit for the period.
Capital ratios31 Dec 31 Dec
Percentage 2018 2017Common Equity Tier 1 capital ratio, including profit 15.5 19.5Tier 1 capital ratio, including profit 17.3 22.3Total capital ratio, including profit 19.9 25.2Common Equity Tier 1 capital ratio, excluding profit 15.5 19.0Tier 1 capital ratio, excluding profit 17.3 21.7Total capital ratio, excluding profit 19.9 24.7
Leverage Ratio 31 Dec¹ 31 Dec¹2018 2017
Tier 1 capital, transitional definition, EURm 26,984 28,008Leverage ratio exposure, EURm 528,163 538,338Leverage ratio, percentage 5.1 5.21 Including profit for the period.
Capital requirements for market risk
Trading book, IM Trading book, SA Banking book, SA Total
REACapital
requirement REACapital
requirement REACapital
requirement REACapital
requirementEURmInterest rate risk & other1 967 77 652 52 1,619 129Equity risk 89 7 370 30 459 37Foreign exchange risk 132 11 606 48 738 59Commodity risk 32 3 32 3Settlement risk 16 1 16 1Diversification effect -464 -37 -464 -37Stressed Value-at-Risk 2,173 174 2,173 174Incremental Risk Measure 1,066 85 1,066 85Comprehensive Risk Measure 425 34 425 34Total 4,388 351 1,070 86 606 48 6,064 4851 Interest rate risk Trading book IM includes both general and specific interest rate risk, elsewhere referred to as interest rate VaR and credit spread VaR.

Nordea Fourth Quarter 2018
60
Q4
Note 11 Continued
Credit risk exposures for which internal models are used, split by rating gradeOn-balance
exposure, EURmOff-balance
exposure, EURmExposure value (EAD), EURm1
of which EAD for off-balance, EURm
Exposure-weighted average risk weight
Corporate, foundation IRB: 10,604 3,629 19,182 275 58.6of which - rating grades 6 1,348 177 4,096 5 26.0- rating grades 5 3,478 965 6,230 95 44.8- rating grades 4 3,503 1,407 6,054 117 74.3- rating grades 3 1,570 816 2,024 53 98.7- rating grades 2 250 77 281 1 147.9- rating grades 1 74 34 76 2 184.3- unrated 261 104 250 2 113.5- defaulted 120 49 171 0 26.9
Corporate, advanced IRB: 97,891 52,077 121,183 25,636 50.0of which- rating grades 6 14,344 5,264 16,879 2,675 15.9- rating grades 5 26,918 23,162 38,752 11,994 35.7- rating grades 4 39,618 18,377 47,751 8,670 61.5- rating grades 3 9,685 3,592 10,710 1,723 67.7- rating grades 2 2,011 529 2,002 259 105.6- rating grades 1 691 116 638 52 149.9- unrated 886 530 947 263 79.3- defaulted 3,738 507 3,504 105.5
Institutions, foundation IRB: 35,712 2,209 41,309 767 14.4of which- rating grades 6 14,300 535 15,971 336 8.5- rating grades 5 20,172 570 23,346 210 13.7- rating grades 4 1,005 702 1,656 105 52.7- rating grades 3 103 238 181 79 131.8- rating grades 2 56 111 59 25 227.8- rating grades 1 0 3 1 1 167.9- unrated 76 50 95 11 153.5- defaulted
Retail, of which secured by real estate: 137,683 11,538 145,827 8,144 11.7of which- scoring grades A 96,434 9,583 103,377 6,942 7.7- scoring grades B 25,985 1,191 26,718 733 11.0- scoring grades C 9,750 533 10,082 333 18.0- scoring grades D 2,690 187 2,791 100 34.0- scoring grades E 781 17 795 15 62.1- scoring grades F 744 17 760 16 94.2- not scored 33 3 34 1 34.6- defaulted 1,266 7 1,270 4 173.3
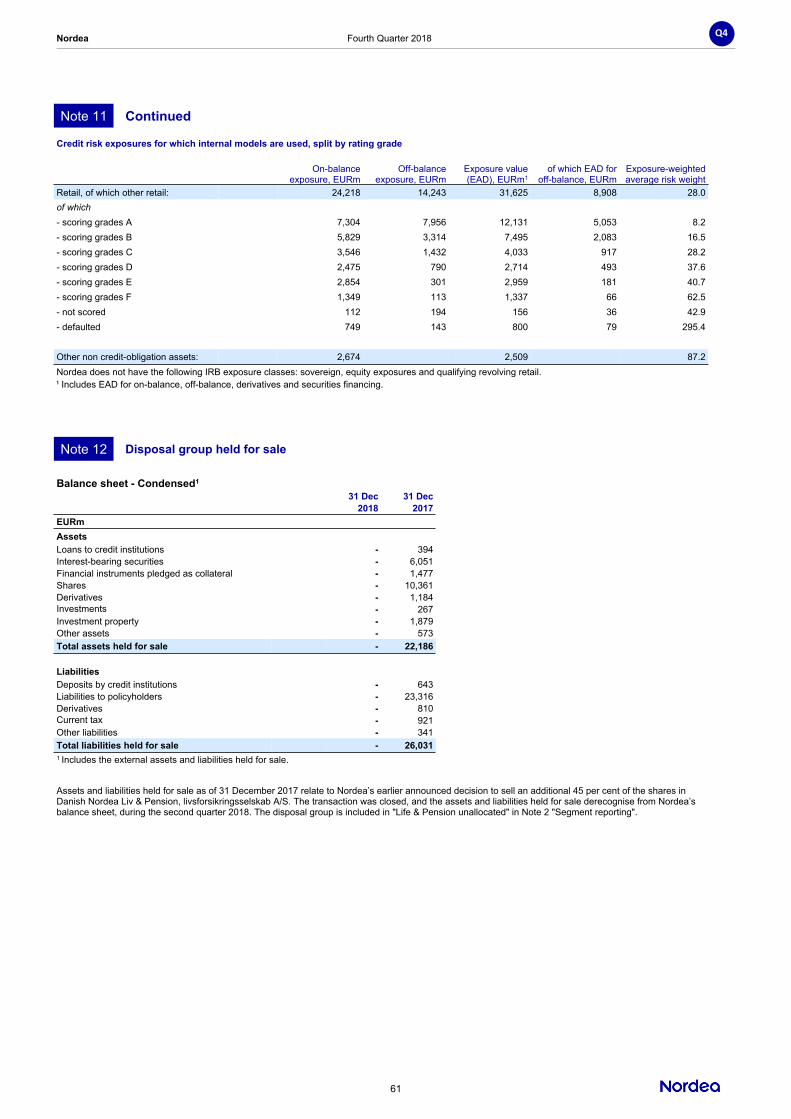
Nordea Fourth Quarter 2018
61
Q4
Note 11 Continued
Credit risk exposures for which internal models are used, split by rating grade
On-balance exposure, EURm
Off-balance exposure, EURm
Exposure value (EAD), EURm1
of which EAD for off-balance, EURm
Exposure-weighted average risk weight
Retail, of which other retail: 24,218 14,243 31,625 8,908 28.0of which- scoring grades A 7,304 7,956 12,131 5,053 8.2- scoring grades B 5,829 3,314 7,495 2,083 16.5- scoring grades C 3,546 1,432 4,033 917 28.2- scoring grades D 2,475 790 2,714 493 37.6- scoring grades E 2,854 301 2,959 181 40.7- scoring grades F 1,349 113 1,337 66 62.5- not scored 112 194 156 36 42.9- defaulted 749 143 800 79 295.4
Other non credit-obligation assets: 2,674 2,509 87.2Nordea does not have the following IRB exposure classes: sovereign, equity exposures and qualifying revolving retail.¹ Includes EAD for on-balance, off-balance, derivatives and securities financing.
Note 12 Disposal group held for sale
Balance sheet - Condensed1
31 Dec 31 Dec2018 2017
EURmAssetsLoans to credit institutions - 394Interest-bearing securities - 6,051Financial instruments pledged as collateral - 1,477Shares - 10,361Derivatives - 1,184Investments in associated undertakings
- 267Investment property - 1,879Other assets - 573Total assets held for sale - 22,186 LiabilitiesDeposits by credit institutions - 643Liabilities to policyholders - 23,316Derivatives - 810Current tax liabilities
- 921Other liabilities - 341Total liabilities held for sale - 26,0311 Includes the external assets and liabilities held for sale.
Assets and liabilities held for sale as of 31 December 2017 relate to Nordea’s earlier announced decision to sell an additional 45 per cent of the shares in Danish Nordea Liv & Pension, livsforsikringsselskab A/S. The transaction was closed, and the assets and liabilities held for sale derecognise from Nordea’s balance sheet, during the second quarter 2018. The disposal group is included in "Life & Pension unallocated" in Note 2 "Segment reporting".

Nordea Fourth Quarter 2018
62
Q4
Note 13 Risks and uncertainties
Nordea is subject to various legal regimes and requirements, including those of the Nordic countries, the European Union and the United States. Governmental authorities that administer and enforce those regimes regularly conduct investigations with regards to Nordea’s regulatory compliance, including the compliance with anti-money laundering (AML) and economic sanctions requirements. The supervisory authorities have conducted ongoing investigations with regards to Nordea’s compliance in several areas, e.g. investment advice, AML, external tax rules, competition law and governance and control. The Nordea Group is also responding to inquiries from US governmental authorities regarding historical compliance with certain US financial sanctions during 2008–2014. The outcome of some investigations is pending and it cannot be excluded that these investigations could lead to criticism or sanctions. In June 2015 the Danish Financial Supervisory Authority investigated how Nordea Bank Danmark A/S had followed the regulations regarding anti-money laundering (AML).
The outcome has resulted in criticism and the matter was, in accordance with Danish administrative practice, handed over to the police for further handling and possible sanctions. Nordea has made significant investments to address the deficiencies highlighted by the investigations. Amongst other Nordea established in 2015 the Financial Crime Change Programme and has strengthened the organisation significantly to enhance the AML and sanction management risk frameworks. Nordea has also established the Business Ethics and Values Committee and a culture transformation programme to embed stronger ethical standards into our corporate culture. In addition, the group is investing in enhanced compliance standards, processes and resources in both the first and second lines of defence.
The Danish tax authorities are in addition investigating whether there is a basis for raising a claim for damages against Nordea relating to Nordea's assistance to a foreign bank in connection with the said bank's reclaim of dividend tax on behalf of one of its customers. At this point in time, it is not possible to assess the potential risk related to the case.

Nordea Fourth Quarter 2018
63
Q4
GlossaryReturn on equityNet profit for the period as a percentage of average equity for the year. Additional Tier 1 capital, accounted for in equity, is in the calculation considered as being classified as a financial liability. Net profit for the period excludes non-controlling interests and interest expense on Additional Tier 1 capital (discretionary interest accrued). Average equity includes net profit for the period and dividend until paid, and excludes non-controlling interests and Additional Tier 1 capital.
Total shareholders return (TSR)Total shareholders return measured as growth in the value of a shareholding during the year, assuming the dividends are reinvested at the time of the payment to purchase additional shares.
Tier 1 capitalThe Tier 1 capital of an institution consists of the sum of the Common Equity Tier 1 capital and Additional Tier 1 capital of the institution. Common Equity Tier 1 capital includes consolidated shareholders’ equity excluding investments in insurance companies, proposed dividend, deferred tax assets, intangible assets in the banking operations, the full expected shortfall deduction (the negative difference between expected losses and provisions) and finally other deductions such as cash flow hedges.
Tier 1 capital ratioTier 1 capital as a percentage of Risk Exposure Amount. The Common Equity Tier 1 capital ratio is calculated as Common Equity Tier 1 capital as a percentage of Risk Exposure Amount.
Loan loss ratioNet loan losses (annualised) divided by quarterly closing balance of loans to the public (lending) measured at amortised cost.
Impairment rate (Stage 3), grossImpaired loans (Stage 3) before allowances divided by total loans measured at amortised cost before allowances.
Impairment rate (Stage 3), netImpaired loans (Stage 3) after allowances divided by total loans measured at amortised cost before allowances.
Total allowance rate (Stage 1, 2 and 3)Total allowances divided by total loans measured at amortised cost before allowances.
Allowances in relation to credit impaired loans (stage 3)Allowances for impaired loans (stage 3) divided by impaired loans measured at amortised cost (stage 3) before allowances.
Allowance in relation to loans in stage 1 and 2Allowances for not impaired loans (stage 1 and 2) divided by not impaired loans measured at amortised cost (stage 1 and 2) before allowances.
Economic capitalEconomic Capital is Nordea’s internal estimate of required capital and measures the capital required to cover unexpected losses in the course of its business with a certain probability. EC uses advanced internal models to provide a consistent measurement for Credit Risk, Market Risk, Operational Risk, Business Risk and Life Insurance Risk arising from activities in Nordea’s various business areas. The aggregation of risks across the group gives rise to diversification effects resulting from the differences in risk drivers and the improbability that unexpected losses occur simultaneously.
ROCARROCAR, % (Return on Capital at Risk) is defined as Net profit excluding items affecting comparability, in percentage of Economic capital. For Business areas it is defined as Operating profit after standard tax in percentage of Economic Capital.
For a list of further Alternative Performance Measures and business definitions, http://www.nordea.com/en/investor-relations/reports-and-presentations/select-reports-and-presentations/ and the Annual Report.

Nordea Fourth Quarter 2018
64
Q4
Nordea Bank Abp
Income statementReported
Pre- decessor
Com- bined
Pre- decessor
Com- bined
Pre- decessor
Q4 15 months Q4 H2 H2 Jan-Dec Jan-Dec
20181 20181 2017 2018 2017 2018 2017
EURm
Operating incomeInterest income 1,116 1,116 996 2,215 2,052 4,203 4,155Interest expense -474 -474 -410 -930 -821 -1,730 -1,618Net interest income 642 642 586 1,285 1,231 2,473 2,537
Fee and commission income 584 584 602 1,102 1,175 2,244 2,409Fee and commission expense -157 -157 -116 -262 -209 -457 -408Net fee and commission income 427 427 486 840 966 1,787 2,001
Net result from securities trading and foreign exchange dealing 199 199 152 353 407 868 974Net result from securities classified at fair value through other comprehensive income
8 8 9 14 13 25 0Net result from hedge accounting -55 -55 12 -24 55 -61 133Net result from investment properties 0 0 -1 1 -1 -1 -3Dividends 1,167 1,167 2,624 1,539 2,624 1,735 3,346Other operating income 94 94 116 183 278 377 470Total operating income 2,482 2,482 3,984 4,191 5,573 7,203 9,458
Operating expensesStaff costs -616 -616 -715 -1,215 -1,331 -2,478 -2,636Other administrative expenses -274 -274 -308 -498 -592 -980 -1,197Other operating expenses -100 -100 -136 -238 -250 -539 -581Depreciation, amortisation and impairment charges of tangible and intangible assets
-115 -115 -78 -205 -149 -355 -277Total operating expenses -1,105 -1,105 -1,237 -2,156 -2,322 -4,352 -4,691
Net loan losses -12 -12 -61 -54 -116 -122 -299Impairment on financial assets -21 -21 -377 -240 -381 -239 -380Operating profit 1,344 1,344 2,309 1,741 2,754 2,490 4,088
Income tax expense -211 -211 -210 -327 -316 -514 -555Net profit for period 1,133 1,133 2,099 1,414 2,438 1,976 3,533
1 Nordea Bank Abp's financial period started 21 September 2017, with no business activities until 1 October 2018.
Nordea Bank Abp reports under Finnish GAAP. The columns labelled "Predecessor" include restated income statements of the former parent company Nordea Bank AB (publ). The columns labelled "Combined" include combinations of Nordea Bank Abp's reported income statements and restated income statements for the former parent company Nordea Bank AB (publ). When the former parent company Nordea Bank AB (publ)'s income statements have been restated to comply with Finnish GAAP, adjustments have been made so that the pension plans in Sweden are accounted for under IFRS, that changes to own credit risk on financial liabilities designated at fair value is recognised in Other comprehensive income, as well as to that the presentation of the income statementcomplies with Finnish requirements.

Nordea Fourth Quarter 2018
65
Q4
Nordea Bank AbpBalance sheet
Reported Predecessor31 Dec 31 Dec
20181 2017EURm
AssetsCash and Balances with central banks 39,562 42,637Debt securities eligible for refinancing with central banks 70,162 68,781Loans to credit institutions 64,772 59,765Loans to the public 154,419 152,766Interest-bearing securities 4,405 5,093Shares and participations 4,813 7,906Investments in associated undertakings and joint ventures 1,049 1,036Investments in group undertakings 12,175 12,532Derivatives 37,221 47,688Fair value changes of the hedged items in portfolio hedge of interest rate risk 72 85Intangible assets 2,331 2,114Tangible assets Properties and equipment 338 384 Investment properties 4 2Deferred tax assets 130 84Current tax assets 234 58Retirement benefit assets 243 258Other assets 15,681 15,287Prepaid expenses and accrued income 1,111 1,128Total assets 408,722 417,604
LiabilitiesDeposits by credit institutions and central banks 51,427 51,735Deposits and borrowings from the public 171,102 176,231Debt securities in issue 82,667 72,460Derivatives 40,591 46,118Fair value changes of the hedged items in portfolio hedge of interest rate risk 536 552Current tax liabilities 249 158Other liabilities 21,257 28,720Accrued expenses and prepaid income 1,330 1,196Deferred tax liabilities 223 189Provisions 352 412Retirement benefit obligations 349 254Subordinated liabilities 9,157 8,987Total liabilities 379,240 387,012
EquityShare capital 4,050 4,050Addional Tier 1 capital holders 750 750Invested unrestricted equity 1,080 1,080Other reserves -150 1,235Retained earnings 22,619 19,944Profit or loss for the period2 1,133 3,533Total equity 29,482 30,592
Total liabilities and equity 408,722 417,604
Off balance sheet commitmentsCommitments given to a third party on behalf of customers Guarantees and pledges 50,026 52,558 Other 1,406 1,572Irrevocable commitments in favour of customers Securities repurchase commitments - - Other 80,102 77,8701 Nordea Bank Abp's financial period started 21 September 2017, with no business activities until 1 October 2018.2 Including anticipated dividends of EUR 436m from its subsidiaries.
Nordea Bank Abp reports under Finnish GAAP. The column labelled "Predecessor" includes a restated balance sheet of the former parentcompany Nordea Bank AB (publ). When the former parent company Nordea Bank AB (publ)'s balance sheet has been restated to comply withFinnish GAAP, adjustments have been made so that the pension plans in Sweden are accounted for under IFRS, that changes to own creditrisk on financial liabilities designated at fair value is recognised in other comprehensive income, as well as to that the presentation of the
balance sheet complies with Finnish requirements.

Nordea Fourth Quarter 2018
66
Q4
Nordea Bank AbpNote 1 Accounting policies
The financial statements for the parent company, Nordea Bank Abp, are as from 1 October 2018 prepared in accordance with the the Finnish Accounting Act, the Finnish Credit Institutions Act, the Decision of the Ministry of Finance on the financial statements and consolidated financial statements of credit institutions as well as Finnish Financial Supervision Authority’s Regulations.
International Financial Reporting Standards (IFRS) as endorsed by the EU commission have been applied to the the extent possible within the framework of Finnish accounting legislation and considering the close tie between financial reporting and taxation.
Before 1 October 2018, the financial statements for the former parent company, Nordea Bank AB (publ), were prepared in accordance with the Swedish Annual Act for Credit Institutions and Securities Companies (1995:1559), the accounting regulations of the Swedish Financial Supervisory Authority (FFFF 2008:25 including amendments) and the accounting recommendation RFR 2 Accounting for legal entities issued by the Swedish Financial Reporting Board.
The change from SGAAP (Swedish Generally Accepted Accounting Principles) had not any significant impact on accounting or presentation of the parent's company financial statements.
Nordea Bank Abp and its financial statementsNordea Bank Abp was established 21 September 2017 and had no business activities before the merger date 1 October 2018. Nordea Bank Abp is the parent company of the Nordea Group.
The income statement figures presented in the financial statements and in the notes to the financial statements refer to the period October-December 2018. No comparison figures are disclosed as Nordea Bank Abp started its banking operations 1 October 2018. The official accounting period of Nordea Bank Abp is 21 September 2017 - 31 December 2018 with no business activities until the merger date 1 October 2018.
An illustrative income statement of the former parent, Nordea Bank AB (publ), and the present parent company, Nordea Bank Abp, is disclosed in the Financial statements for the parent company Nordea Bank Abp, page 64. Nordea Bank AB’s (publ) figures cover the period January-September 2018 and Nordea Bank Abp’s the period October-December 2018, respectively. The balance sheet comparison figures for the year 2017 disclosed in the note on page 65 refer to Nordea Bank AB’s (publ) adjusted balance sheet.
Changed accounting policies and presentationInformation on new and amended IFRS standards implemented by Nordea on 1 January 2018 can be found in the section “Changed accounting policies and presentation” in Note 1 for the Group. The conclusions within this section are also, where applicable, relevant for the parent company.
Changes in IFRSs not yet appliedInformation on forthcoming changes in IFRS not yet implemented can be found in the section “Changes in IFRSs not yet applied” in Note 1 for the Group. The conclusions within this section are also, where applicable, relevant for the parent company. However, IFRS 16 “Leases” will not be applied in the parent company.
Other amendmentsOther new and amended standards issued by IASB were implemented by Nordea 1 January 2018 but have not had any significant impact on the financial statements of Nordea Bank Abp.

Nordea Fourth Quarter 2018
67
Q4
Note 2 Capital AdequacyThese figures are according to part 8 of CRR
Summary of items included in own funds
31 Dec2018
EURmCalculation of own fundsEquity in the consolidated situation 26,869
Proposed/actual dividend
Common Equity Tier 1 capital before regulatory adjustments 26,869
Deferred tax assets
Intangible assets -2,331
IRB provisions shortfall (-)
Deduction for investments in credit institutions (50%)
Pension assets in excess of related liabilities1 -116
Other items, net -363
Total regulatory adjustments to Common Equity Tier 1 capital -2,810
Common Equity Tier 1 capital (net after deduction) 24,059
Additional Tier 1 capital before regulatory adjustments 2,860
Total regulatory adjustments to Additional Tier 1 capital -11
Additional Tier 1 capital 2,849
Tier 1 capital (net after deduction) 26,908
Tier 2 capital before regulatory adjustments 4,960
IRB provisions excess (+) 111
Deduction for investments in credit institutions (50%)
Deductions for investments in insurance companies -1,000
Pension assets in excess of related liabilities
Other items, net -51
Total regulatory adjustments to Tier 2 capital -940
Tier 2 capital 4,020
Own funds (net after deduction)2 30,9281 Based on conditional FSA approval.2 Own Funds adjusted for IRB provision, i.e. adjusted own funds equal 30817m by 31 Dec 2018
Own Funds, including profit
31 Dec2018
EURmCommon Equity Tier 1 capital, including profit 24,027Total Own Funds, including profit 30,896

Nordea Fourth Quarter 2018
68
Q4
Note 2 Continued
Minimum capital requirement and REA
31 Dec¹ 31 Dec
2018 2018
Minimum Capital
requirement REAEURmCredit risk 9,899 123,740 - of which counterparty credit risk 539 6,741
IRB 7,089 88,619 - sovereign - corporate 5,359 66,992 - advanced 4,875 60,935 - foundation 484 6,057 - institutions 493 6,164 - retail 1,104 13,803 - secured by immovable property collateral 449 5,617 - other retail 655 8,186 - items representing securitisation positions - other 133 1,660
Standardised 2,810 35,121- central governments or central banks 36 452- regional governments or local authorities 6 76- public sector entities- multilateral development banks- international organisations- institutions 1,061 13,259- corporate 366 4,567- retail 4 45- secured by mortgages on immovable properties 1 9- associated with particularly high risk 63 793- covered bonds 49 617- institutions and corporates with a short-term credit assessment- collective investments undertakings (CIU)- equity 1,223 15,285- other items 1 18
Credit Value Adjustment Risk 73 922
Market risk 995 12,433 - trading book, Internal Approach 351 4,387 - trading book, Standardised Approach 87 1,084 - banking book, Standardised Approach 557 6,962
Operational risk 1,039 12,986Standardised 1,039 12,986
Additional risk exposure amount related to Finnish RW floor due to Article 458 CRRAdditional risk exposure amount related to Swedish RW floor due to Article 458 CRR 10 123
Additional risk exposure amount due to Article 3 CRR 5 62
Total 12,021 150,2661. Includes ECB decision on temporary tolerance for continued use of the internal models. For more Information see under Other models.
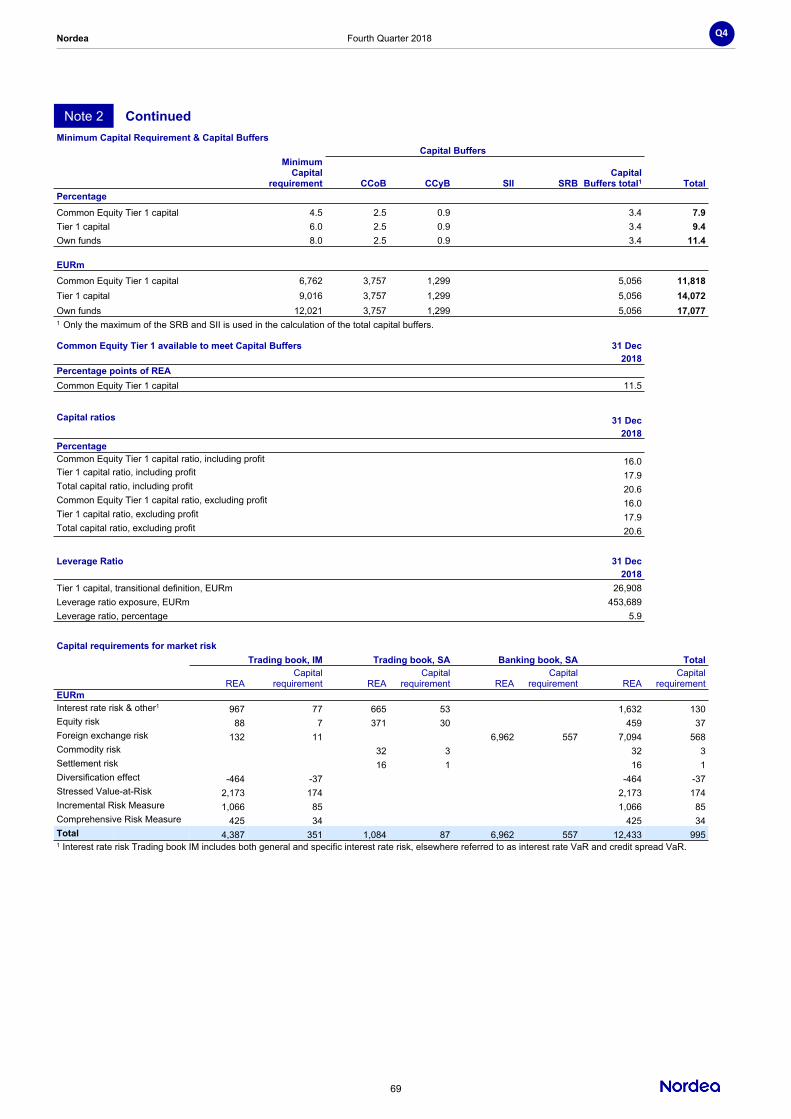
Nordea Fourth Quarter 2018
69
Q4
Note 2 ContinuedMinimum Capital Requirement & Capital Buffers
Capital Buffers Minimum
Capital requirement CCoB CCyB SII SRB
Capital Buffers total1 Total
PercentageCommon Equity Tier 1 capital 4.5 2.5 0.9 3.4 7.9Tier 1 capital 6.0 2.5 0.9 3.4 9.4Own funds 8.0 2.5 0.9 3.4 11.4
EURmCommon Equity Tier 1 capital 6,762 3,757 1,299 5,056 11,818Tier 1 capital 9,016 3,757 1,299 5,056 14,072Own funds 12,021 3,757 1,299 5,056 17,0771 Only the maximum of the SRB and SII is used in the calculation of the total capital buffers.
Common Equity Tier 1 available to meet Capital Buffers 31 Dec2018
Percentage points of REACommon Equity Tier 1 capital 11.5
Capital ratios 31 Dec2018
PercentageCommon Equity Tier 1 capital ratio, including profit 16.0Tier 1 capital ratio, including profit 17.9Total capital ratio, including profit 20.6Common Equity Tier 1 capital ratio, excluding profit 16.0Tier 1 capital ratio, excluding profit 17.9Total capital ratio, excluding profit 20.6
Leverage Ratio 31 Dec2018
Tier 1 capital, transitional definition, EURm 26,908Leverage ratio exposure, EURm 453,689Leverage ratio, percentage 5.9
Capital requirements for market riskTrading book, IM Trading book, SA Banking book, SA Total
REACapital
requirement REACapital
requirement REACapital
requirement REACapital
requirementEURmInterest rate risk & other1 967 77 665 53 1,632 130Equity risk 88 7 371 30 459 37Foreign exchange risk 132 11 6,962 557 7,094 568Commodity risk 32 3 32 3Settlement risk 16 1 16 1Diversification effect -464 -37 -464 -37Stressed Value-at-Risk 2,173 174 2,173 174Incremental Risk Measure 1,066 85 1,066 85Comprehensive Risk Measure 425 34 425 34Total 4,387 351 1,084 87 6,962 557 12,433 9951 Interest rate risk Trading book IM includes both general and specific interest rate risk, elsewhere referred to as interest rate VaR and credit spread VaR.

Nordea Fourth Quarter 2018
70
Q4
Note 2 Continued
Credit risk exposures for which internal models are used, split by rating grade
On-balance exposure, EURm
Off-balance exposure, EURm
Exposure value (EAD), EURm1
of which EAD for off-balance, EURm
Exposure-weighted average risk weight
Corporate, foundation IRB: 2,185 2 10,484 1 57.8of which - rating grades 6 790 0 3,479 0 31.4- rating grades 5 1,085 2 3,414 1 51.9- rating grades 4 249 2,764 0 83.4- rating grades 3 13 627 104.9- rating grades 2 42 83 143.2- rating grades 1 4 200.3- unrated 6 45 127.5- defaulted 68 67.8
Corporate, advanced IRB: 78,273 62,275 110,458 34,098 55.2of which - rating grades 6 6,389 6,017 9,733 3,415 20.5- rating grades 5 20,836 25,714 34,901 14,063 36.0- rating grades 4 36,960 22,973 49,021 12,567 64.5- rating grades 3 8,038 5,230 10,537 3,150 74.7- rating grades 2 1,651 718 1,842 444 115.6- rating grades 1 599 167 601 103 157.8- unrated 684 650 932 356 88.3- defaulted 3,116 806 2,891 102.2
Institutions, foundation IRB: 33,958 2,304 40,098 1,310 15.4of which - rating grades 6 12,840 548 14,534 359 9.3- rating grades 5 20,082 561 23,255 209 13.7- rating grades 4 818 804 1,983 618 55.6- rating grades 3 87 226 172 86 130.9- rating grades 2 56 111 59 25 227.8- rating grades 1 0 3 1 1 167.9- unrated 75 51 94 12 153.9- defaulted
Retail, of which secured by real estate: 28,727 4,247 30,409 1,682 18.5of which - scoring grades A 17,543 3,111 18,744 1,201 14.6- scoring grades B 6,803 672 7,083 280 13.3- scoring grades C 2,655 316 2,792 137 19.6- scoring grades D 1,036 133 1,091 55 35.2- scoring grades E 70 4 72 2 52.4- scoring grades F 164 3 166 2 97.8- not scored 22 2 23 1 38.1- defaulted 434 6 438 4 181.7

Nordea Fourth Quarter 2018
71
Q4
Note 2 Continued
Credit risk exposures for which internal models are used, split by rating grade
On-balance exposure, EURm
Off-balance exposure, EURm
Exposure value (EAD), EURm1
of which EAD for off-balance, EURm
Exposure-weighted average risk weight:
Retail, of which other retail: 15,757 22,125 32,450 18,030 25.2of which - scoring grades A 4,994 12,920 15,566 10,716 9.4- scoring grades B 4,108 5,117 7,935 4,189 17.8- scoring grades C 2,300 2,192 3,631 1,745 30.9- scoring grades D 1,378 908 1,770 640 41.5- scoring grades E 1,748 437 2,009 336 43.9- scoring grades F 717 191 799 158 68.8- not scored 43 126 97 46 43.0- defaulted 469 234 643 200 307.3
Other non credit-obligation assets: 1,970 1,970 84.2Nordea does not have the following IRB exposure classes: sovereign, equity exposures and qualifying revolving retail.¹ Includes EAD for on-balance, off-balance, derivatives and securities financing

Nordea Fourth Quarter 2018
72
Q4
For further information A conference call for media, investors and equity
analysts will be held on 6 February at 09.00 EET (08.00 CET), at which Casper von Koskull, President and Group CEO, will present the results.
To participate in to the conference call (starting at 09:00 EET) and participate in the following Q&A session (starting at approximately 09.30) with Casper von Koskull, President and Group CEO, Christopher Rees, Group CFO and Rodney Alfvén, Head of Investor Relations; please use the webcast link or dial +44 333 300 0804 or +46 8 566 426 51 or +358 9 817 103 10 or +45 35 44 55 77 PIN code 44582087# no later than 08.50 EET.
After the call an indexed on-demand replay will be available here. A replay will also be available until 28 February by dialing +44 333 300 0819 or +46 8 519 993 85 or +358 9 817 105 15 or +45 82 33 31 90, pin code 301275902#.
An analyst and investor presentation will be held in London on 8 February at 08.00 local time at J.P. Morgan, Victoria Embankment, London EC4Y 0JP in which Casper von Koskull, President and Group CEO, and Rodney Alfvén, Head of Investor Relations will participate.
The presentation, including Q&A, is expected to last approximately one hour.
To attend please contact: Carolina Brikho at Nordea via e-mail: [email protected]
This interim report, an investor presentation and a fact book are available on www.nordea.com.
ContactsCasper von KoskullPresident and Group CEO+358 503 821 391
Christopher ReesGroup CFO +45 55 47 23 77
Rodney AlfvénHead of Investor Relations+46 72 235 05 15
Sara Helweg-LarsenHead of Group Communications+45 22 14 00 00
Financial calendarIn week 9 – Annual report 2018 release, including the Board of Director’s report and financial statements. The annual report will be available at www.nordea.com/ir 30 April 2019 – First Quarter Report 2019 (silent period starts 2 April 2019)18 July – Second Quarter Report 2019 (silent period starts 5 July 2019)24 October 2019 – Third Quarter Report 2019 (silent period starts 7 October 2019)
Helsinki 6 February 2019
Casper von KoskullPresident and Group CEO

Nordea Fourth Quarter 2018
73
Q4
Nordea Bank Abp • Hamnbanegatan 5 • 00020 Helsinki • www.nordea.com/ir • Tel. +358 200 70000 • Business ID 2858394-9
This financial statement has not been subject to review by the Auditors.
This financial statement is published in one additional language version, in Swedish. In the event of any inconsistencies between the Swedish language version and this English version, the English version shall prevail.
This financial statement contains forward-looking statements that reflect management’s current views with respect to certain future events and potential financial performance. Although Nordea believes that the expectations reflected in such forward-looking statements are reasonable, no assurance can be given that such expectations will prove to have been correct. Accordingly, results could differ materially from those set out in the forward-looking statements as a result of various factors. Important factors that may cause such a difference for Nordea include, but are not limited to: (i) the macroeconomic development, (ii) change in the competitive climate, (iii) change in the regulatory environment and other government actions and (iv) change in interest rate and foreign exchange rate levels. This financial statement does not imply that Nordea has undertaken to revise these forward-looking statements, beyond what is required by applicable law or applicable stock exchange regulations if and when circumstances arise that will lead to changes compared to the date when these statements were provided.