freescale mpc5xx & mpc8xx on-chip emulation · terminology and concepts defined and explained...
TRANSCRIPT

_ V9.12. 225
Technical Notes
Freescale MPC5xx & MPC8xx On-Chip Emulation
iSYSTEM, May 2015 1/24
This document is intended to be used together with the CPU reference manual provided by the silicon vendor. This document assumes knowledge of the CPU functionality and the terminology and concepts defined and explained in the CPU reference manual. Basic knowledge of winIDEA is also necessary. This document deals with specifics and advanced details and it is not meant as a basic or introductory text.
Contents
Contents 1
1 Introduction 2
2 Emulation Options 3 2.1 Hardware Options 3 2.2 Initialization Sequence 4
3 CPU Setup 4 3.1 General Options 4 3.2 Debugging Options 6
4 Nexus Options 8 4.1 Advanced Options 9 4.2 Exceptions 10
5 Access Breakpoints 10
6 MPC56x Nexus Trace 11 6.1 Nexus Trace Configuration 13 6.1.1 Trigger Configuration 13 6.1.2 Qualifier Configuration 14 6.2 Trace Troubleshooting Scenarios 15 6.2.1 Nexus Trace 15 6.2.2 Nexus RTR Trace 20
7 Profiler 22
8 Coverage 22
9 Getting Started 22
10 Troubleshooting 22

iSYSTEM, May 2015 2/24
1 Introduction
The MPC5xx/8xx use a BDM style debug interface. A Nexus interface on the MPC56x provides faster development access and, more importantly, instruction and data trace.
The debug interface of the PowerArchitecture MPC56x core uses the BDM or Nexus development port, which is a dedicated port that needs none or minimal of the regular system interfaces. System activity can be controlled from the development port when the core is in debug mode. The development port is a relatively inexpensive interface that allows the development system to operate at a lower frequency than the core’s frequency (except for Nexus that operates at the core’s frequency). In debug mode, the core fetches all instructions from the development port. Data can be read from or written to the development port. This allows memory and registers to be read and modified by a development tool (emulator) connected to the development port.
The Nexus/READI module interfaces to the MPC56x processor and internal buses to provide development support as per the IEEE-ISTO 5001 - 1999. The development features supported are program trace, data trace, watchpoint trace, ownership trace, run-time access to the MCU’s internal memory map, and access to RCPU internal registers during halt, via the Nexus auxiliary port.
Debug Features
4 hardware breakpoints
Access breakpoints
Unlimited software breakpoints
Fast flash programming
Real-time memory access (MPC56x Nexus port only)
Trace (MPC56x)
Profiler (MPC56x)
Execution Coverage (MPC56x)

iSYSTEM, May 2015 3/24
2 Emulation Options
2.1 Hardware Options
Emulation options, Hardware pane (Debug iCARD)
Emulation options, Hardware pane (iTRACE, iTRACE PRO, iTRACE GT)
Debug I/O levels
The development system can be configured in a way that the debug BDM signals are driven at 3.3V, 5V or target voltage level (Vref).
When 'Vref' Debug I/O level is selected, a voltage applied to the belonging reference voltage pin on the target debug connector is used as a reference voltage for voltage follower, which

iSYSTEM, May 2015 4/24
powers buffers, driving the debug BDM signals. The user must ensure that the target power supply is connected to the Vref pin on the target BDM connector and that it is switched on before the debug session is started. If these two conditions are not meet, it is highly probably that the initial debug connection will fail already. However in some cases it may succeed but then the system will behave abnormal.
Sampling threshold levels (iTRACE PRO/GT only)
Voltage levels of the debug input and output signals are set according to the setting.
2.2 Initialization Sequence
Before the flash programming or download can take place, the user must ensure that the memory is accessible. This is very important since there are many applications using memory resources (e.g. external RAM, external flash), which are not accessible after the CPU reset. In that case, the debugger must execute after the CPU reset a so called initialization sequence, which configures necessary CPU chip selects and then the download or flash programming can actually take place. The user must set up the initialization sequence based on his application. Detailed information may be found in the Initialization Sequence help topic.
3 CPU Setup
3.1 General Options The CPU Setup, Options page provides some emulation settings, common to most CPU families and all emulation modes. Settings that are not valid for currently selected CPU or emulation mode are disabled. If none of these settings is valid, this page is not shown.
General Options

iSYSTEM, May 2015 5/24
Cache downloaded code only (do not load to target)
When this option is checked, the download files will not propagate to the target using standard debug download but the Target download files will.
In cases, where the application is previously programmed in the target or it's programmed through the flash programming dialog, the user may uncheck 'Load code' in the 'Properties' dialog when specifying the debug download file(s). By doing so, the debugger loads only the necessary debug information for high level debugging while it doesn't load any code. However, debug functionalities like ETM and Nexus trace will not work then since an exact code image of the executed code is required as a prerequisite for the correct trace program flow reconstruction. This applies also for the call stack on some CPU platforms. In such applications, 'Load code' option should remain checked and 'Cache downloaded code only (do not load to target)' option checked instead. This will yield in debug information and code image loaded to the debugger but no memory writes will propagate to the target, which otherwise normally load the code to the target.
iSYSTEM, May 2015 6/24
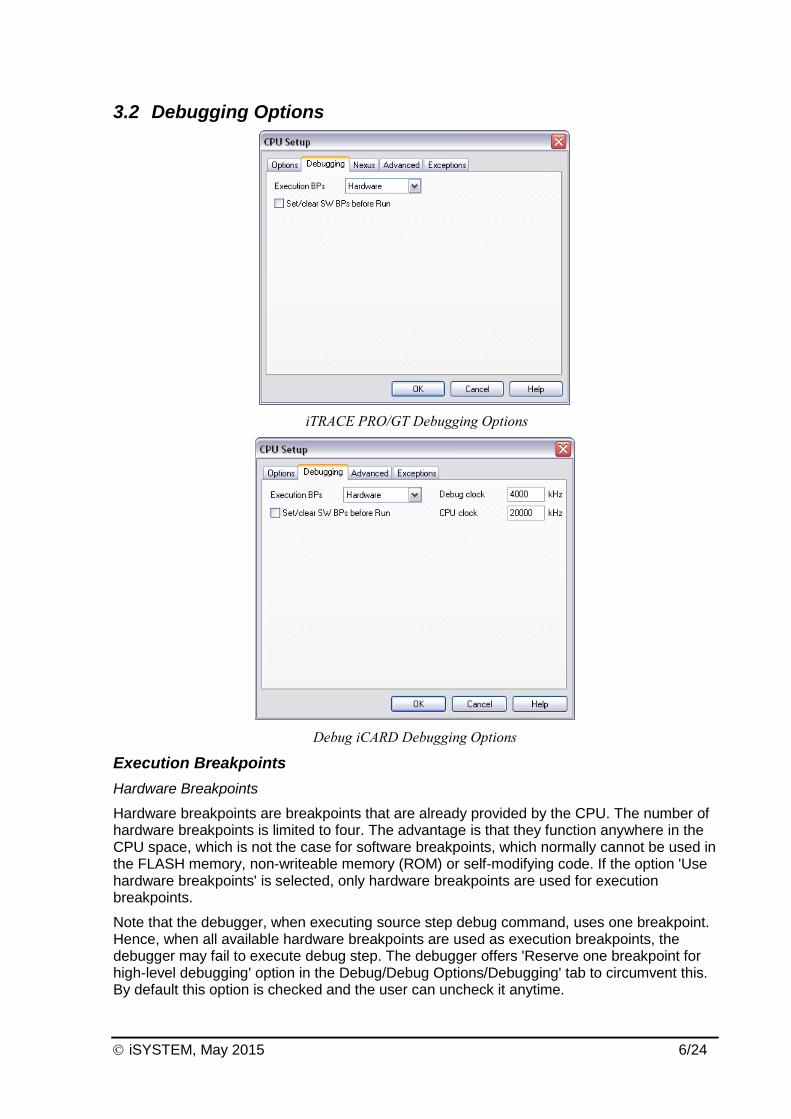
3.2 Debugging Options
iTRACE PRO/GT Debugging Options
Debug iCARD Debugging Options
Execution Breakpoints
Hardware Breakpoints
Hardware breakpoints are breakpoints that are already provided by the CPU. The number of hardware breakpoints is limited to four. The advantage is that they function anywhere in the CPU space, which is not the case for software breakpoints, which normally cannot be used in the FLASH memory, non-writeable memory (ROM) or self-modifying code. If the option 'Use hardware breakpoints' is selected, only hardware breakpoints are used for execution breakpoints.
Note that the debugger, when executing source step debug command, uses one breakpoint. Hence, when all available hardware breakpoints are used as execution breakpoints, the debugger may fail to execute debug step. The debugger offers 'Reserve one breakpoint for high-level debugging' option in the Debug/Debug Options/Debugging' tab to circumvent this. By default this option is checked and the user can uncheck it anytime.

iSYSTEM, May 2015 7/24
Software Breakpoints
Available hardware breakpoints often prove to be insufficient. Then the debugger can use unlimited software breakpoints to work around this limitation.
When a software breakpoint is being used, the program first attempts to modify the source code by placing a break instruction into the code. If setting software breakpoint fails, a hardware breakpoint is used instead.
Set/clear SW BPs before Run
When the option is checked, then a software breakpoint is not set/cleared immediately, but is just remembered. Only when the CPU is set to running are the breakpoints committed. This way several breakpoints can be changed but only one re-FLASH operation takes place. This is especially noticeable in testIDEA operation with many stubs and also during a regular debugging session when several breakpoints are set/cleared within the same flash erase block.
Debug Clock
Debug clock frequency must be selected between 4 and 16 MHz. Note however, that the clock generation is using a discrete divider from a 48 MHz source. This, for example, means that selected 10 MHz clock will in fact be set to 9.6 MHz. Choose the debug clock frequency wisely, especially at power-on. Typically, CPUs wake up at some lower system frequency that is then switched up with application software or via initialization script. In general, the debug clock frequency must be no greater than 1/3 of the system frequency. Note that MPC509 with 4 MHz clock source wakes up at 3 MHz system clock. Set the debug clock to 1MHz.
CPU Clock
This setting applies for MPC555 device only. A special divider is present on the CPU to ensure the correct programming frequency for the FLASH module, which is generated from the CPU clock. Since the CPU clock cannot be automatically detected, it must be set in this dialog. Note that this setting affects internal FLASH programming only.

iSYSTEM, May 2015 8/24
4 Nexus Options
iTRACE PRO/GT Nexus Options
Nexus MDO width
This setting is available only for the development system supporting Nexus on-chip trace.
Nexus signals are located on the CPU pins, which can be configured for different alternate functions. The CPU allows configuring Nexus MDO port either as 2 or 8-bit port. An 8-bit MDO implementation ensures optimum Nexus operation. A 2-bit MDO implementation requires less CPU signals than the 8-bit MDO but the Nexus throughput is decreased, which is a crucial factor for correct trace operation. Note that the trace displays errors when the CPU doesn’t manage to send out complete Nexus messages to the external development system. It’s highly probably that 2-bit MDO port will result in trace errors while 8-bit MDO port will function flawlessly.

iSYSTEM, May 2015 9/24
4.1 Advanced Options
Advanced Options
Override Startup Register Values
If required, the Emulator can change the checked register after the CPU is released from reset. These settings have typically to do with setting the default program starting point and disabling the watchdog.
Allow Non-Restartable Break
In general, stopping the processor is possible and breakpoints are recognized in the core only when the RI bit in the MSR register is set, which guarantees machine restartability after a breakpoint or stop. In this working mode, breakpoints are masked. There are times when it is preferable to enable breakpoints even when the RI bit is clear, even though there is a risk of causing a non-restartable machine state. Checking this option, for example, allows stopping the CPU from an endless loop, even if the RI bit is clear.
For more info on the RI bit, please see the User Manual of your processor.

iSYSTEM, May 2015 10/24
4.2 Exceptions
Exceptions menu
The 5xx/8xx BDM debug unit allows the debug mode (the processor is stopped) to be entered upon the selected CPU exceptions.
5 Access Breakpoints
Hardware Breakpoints

iSYSTEM, May 2015 11/24
The debug interface of the MPC5xx/8xx families include two L-Address Comparators and two L-Data Comparators Supporting Equal, Not Equal, Greater Than, and Less Than. The comparators can be used in several different ways:
2 address-only compares
2 data-only compares
2 address & data compares
1 address range (inside or outside)
1 data range (inside or outside)
1 address & data ranges
The following is a brief walkthrough of the configurable items.
First, select a desired address comparison type. Supported are: disabled, =, <, >, !=, Inside, Outside. Select the address from the list (the '...' button) or type the number in directly. Use the 0x prefix for hexadecimal numbers. For arrays you can flag the Cover entire object option. The address comparison type will be automatically set to Inside. Next, select the access type, read, write, R/W for read or write.
For data, identical comparison types are supported: disabled, =, <, >, !=, Inside, Outside. Check the Signed checkbox to treat fixed-point numbers as signed values. Select the access width, 8, 16, or 32-bit. Check the Mask Bytes checkboxes to ignore selected bytes in a data comparison. The included two event counters (Skip) further extend above capabilities.
Please refer also to the Development Capabilities and Interface section of the respective CPU manual.
A beep can be issued and/or a message displayed indicating that an access breakpoint has occurred.
Wizard…
Use Wizard (button in the left bottom corner) in case of problems understanding and configuring the access breakpoints dialog. It helps setting simple a breakpoint on data access.
6 MPC56x Nexus Trace
Nexus is a message based asynchronous protocol. In contrast to an In-Circuit Emulation where all buses are visible to the emulator and allow implementation of various analyzer features, a Nexus based tool is limited by the information provided through the Nexus port.
For tracking the sequence of program instructions, the Nexus port broadcasts only information related to instructions that cause a change to the normal sequential execution of instructions. With knowledge of the source code, which is programmed in the CPU flash, the debugger can reconstruct the path of execution through many instructions from the recorded change-of-flow information.
The MPC56x CPUs provide Nexus 2+ level on-chip trace.
Nexus Trace features (iTRACE PRO / GT):
Compliant with Nexus standard
External trace buffer
Instruction, Data and OTM Trace
On-chip trigger and qualifier

iSYSTEM, May 2015 12/24
Advanced external trigger and qualifier
Time Stamps
AUX inputs
Profiler
Execution Coverage
MPC56x Nexus doesn’t report full 32-bit instruction address but only lower 25-bits. It is necessary to specify the address offset in the ‘Hardware/Analyzer Setup/PowerPC’ tab when the code runs at offset address exceeding the 25-bit address space. For instance, if the address offset is not set properly (e.g. set to 0), the profiler, trace and execution coverage will work correctly while running at one address (e.g. 0x800000) and incorrectly when the code is running at e.g. 0xFFF00000.
Nexus doesn’t report the size of the data transfer. Instead it is guessed according to the number of bits transferred in the data field but this may not work always. As an example when the algorithm fails, 16-bit data access is displayed as 8-bit access.

iSYSTEM, May 2015 13/24
6.1 Nexus Trace Configuration
6.1.1 Trigger Configuration
Recording is stopped after the trigger event occurs and the trace buffer fills up. Number of samples recorded before and after the trigger condition can be selected with Trigger Position setting.
The Buffer Size determines the depth of the trace buffer. If possible, always use smaller buffer sizes. This will decrease the loading time and size of the Analyzer file.
With each sample recorded the snapshot of the free-running timer is also saved. The period of this timer can be selected in Time Stamp box. Time stamp of the trigger sample is always zero. Samples before trigger are marked with negative values; samples after trigger are marked with positive values. If you select a clock cycle then the CPU cycle counter is recorded.
The Trigger condition can be simple or complex. Select 'Anything' if you want recording to begin immediately. When the trace buffer is filled the recording will stop.
In continuous mode the recording is stopped only after CPU has been stopped or the user has manually selected stop recording in the trace window.
It is not possible to set an arbitrary trigger condition. The MPC5xx BDM/Nexus has limited resources that are common to trigger and hardware breakpoints. This means that if too many resources have been used for the breakpoints less will be available in the trigger and vice versa.
Select ‘Execute instruction’ to trigger when CPU executes instruction from the address defined in the Address field.
Trigger may also be set on a specific ‘Data access’. The debug/trace interface of the MPC56x family include two L-Address Comparators and two L-Data Comparators Supporting

iSYSTEM, May 2015 14/24
Equal, Not Equal, Greater Than, and Less Than. The comparators can be used in several different ways:
2 address-only compares
2 data-only compares
2 address & data compares
1 address range (inside or outside)
1 data range (inside or outside)
1 address & data ranges
First, select a desired address comparison type. Supported are: disabled, =, <, >, !=, Inside, Outside. Select the address from the list (the '...' button) or type the number in directly. Use the 0x prefix for hexadecimal numbers. For arrays you can flag the Cover entire object option. The address comparison type will be automatically set to Inside. Next, select the access type, read, write, R/W for read or write.
For data, identical comparison types are supported: disabled, =, <, >, !=, Inside, Outside. Check the Signed checkbox to treat fixed-point numbers as signed values. Select the access width, 8, 16, or 32-bit. Check the Mask Bytes checkboxes to ignore selected bytes in a data comparison.
6.1.2 Qualifier Configuration
The qualifier may be set only for data accesses. It may be set to None, All or in selected memory areas.
Option ‘None’ effectively disables the Data Trace, thus only execution trace is enabled.
With ‘All’ all read-write, read-only or write-only data accesses are traced. Please use this option with caution, because Nexus Data trace FIFO inside the CPU may quickly overflow.

iSYSTEM, May 2015 15/24
Using the third option ‘In memory areas’ it is possible to narrow down the data access recording by defining two memory areas. In the above example, one area for global variables, and the other for stack trace.
6.2 Trace Troubleshooting Scenarios
6.2.1 Nexus Trace
‘Nexus’ must be selected in the ‘Hardware/Analyzer Setup’ dialog.
Default trace configuration is used to record the continuous program flow either from the program start on or up to the moment, when the program stops.
The trace can start recording on the initial program start from the reset or after resuming the program from the breakpoint location. The trace records and displays program flow from the start until the trace buffer fulfills.
As an alternative, the trace can stop recording on a program stop. ‘Continuous mode’ allows roll over of the trace buffer, which results in the trace recording up to the moment when the application stops. In practice, the trace displays the program flow just before the program stops, for instance, due to a breakpoint hit or due to a stop debug command issued by the user.
Example: Trace records the CPU execution until the CPU is stopped by either the user or the program itself in case of a problem originating from the application.
Set the Recorder in ‘Continuous Mode’.
Set Qualifier settings to ‘Record Instructions’, ‘Record Ownership trace messages’ and ‘Record Data accesses’. In Record Data accesses section select to record all read and write operations.
With these settings, the trace records program flow, while the user’s program runs. After the user’s program stops, trace stops recording and displays the program flow before the CPU was stopped.
Example: Trace triggers on a function Func3. Using trace, the program flow before the trigger event and after the trigger event can be inspected.
Set Recorder to start ‘On Trigger’ and set the trigger position to ‘Center’.

iSYSTEM, May 2015 16/24
On Trigger page set trigger on ‘Executed Instruction’ and enter the address.
Now, define a qualifier – condition, which defines the CPU cycles to be recorded by the trace. Select Qualifier tab and check ‘Record Instructions’. You may check ‘Record All Data accesses’ as well.

iSYSTEM, May 2015 17/24
Now, execute CPU reset, start trace and run the program. After Func3 is executed for the first time, winIDEA displays program flow before and after the entry to function Func3.
This is a very often used scenario. Trace triggers on a specific function or source line and the user can inspect the program execution before and after the trigger event.
Example: The user gets incorrect writes to a particular address/variable. This example demonstrates how to locate the code writing faulty value (0x560A) to a word variable wTestWord.
Open Trigger configuration dialog by pressing the ‘Configure…’ button and define a trigger event.
Select trigger on ‘Data Access’, enter the address, select write access type, enter 0x560A in the data field and select 16-bit data size. Make sure you always set correct data size. It must match with the variable size. Otherwise, trace may behave strangely.

iSYSTEM, May 2015 18/24
Trigger set on a variable write “wTestWord==0x560A”
Below is a trigger configuration, where trace triggers on any write to the wTestWord, having different value than 0x5600 - 0x56A0.
Likewise, trigger can be set on any write to the wTestWord, having value within 0x5600 - 0x56A0 range by selecting ‘Inside’ item in the associated combo box.
Trigger set on a variable write “wTestWord<0x5600 or wTestWord>0x56A0 ”
Now, define a qualifier. Check ‘Record Instructions’ and ‘Record All Data accesses’.
Execute CPU reset, start the trace and run the program. When faulty write occurs, a trace trigger event occurs simultaneously. The trace buffer fills up and the program flow is reconstructed and displayed. Since pre-trigger history is visible, the user can easily locate the code writing 0x560A to the wTestWord variable and fix the problem.
Trigger event can be used as a breakpoint source as well. Check the ‘On trigger break execution’ option in the Trace configuration dialog. This may provide additional help to the

iSYSTEM, May 2015 19/24
user as he can inspect the target application after “problematic” trigger event, using debug windows (memory, watch, SFR, call stack, etc…).
Example: In this example, tracing of so-called Ownership trace messages will be explained. The MPC56x devices have a dedicated register, the Ownership Trace Register (OTR) located at address 0x38 002C. It is write-only register (by the application). The trace can then trace all write cycles to this specific register. In general the trace cannot trace accesses to any other internal CPU register.
Let’s define OTR in our application as following:
#define OTR *(volatile unsigned long *)0x38002C
Now the user can write to the OTR anywhere in the application by simply adding following source line:
OTR = 0x5;
or
OTR = otrRecursionEntry;
Such add may help out the user while debugging his application without disturbing the program execution vitally. While the application writes various values to the OTR, the trace records and displays all OTR writes.
Set Recorder to start ‘Immediately’.
Next, select ‘Record Ownership trace messages’ in the Qualifier tab. Additionally, the user may check ‘Record Instructions’ and/or ‘Record Data accesses’.

iSYSTEM, May 2015 20/24
Execute CPU reset, start the trace and run the program. All user’s writes to the OTR are marked as OTM (Ownership Trace Messages) in the trace window. The address value at OTM cycles should be ignored.
.
6.2.2 Nexus RTR Trace
The MPC56x development system offers advanced trace features, which are based on iSYSTEM Nexus RTR technology and restricted to the program execution bus:
3-Level Trigger
Unlimited Qualifier
Watchdog Trigger
Duration Tracker
‘RTR Execution’ must be selected in the Hardware/Analyzer Setup dialog to use these features.
Note: Nexus RTR is implemented on iTRACE GT development system only and for 8-bit MDO (CPU Nexus port) implementation only.

iSYSTEM, May 2015 21/24
For more information on these trace functionalities and use refer to winIDEA Contents Help describing Bus Trace in details.

iSYSTEM, May 2015 22/24
7 Profiler
Refer to winIDEA Contents Help, Profiler Concepts section for Profiler theory and background.
Refer to winIDEA Contents Help, Analyzer Window section (or alternatively to the standalone Analyzer.pdf document) for information on Profiler user interface and use.
8 Coverage
Refer to winIDEA Contents Help, Coverage Concepts section for Coverage theory and background.
Refer to winIDEA Contents Help, Analyzer Window section (or alternatively to the standalone Analyzer.pdf document) for information on Coverage user interface and use.
9 Getting Started
Before powering on check the Power supply setting in Emulation Options/Hardware. Default is 3.3V, note however that certain newer devices operate at lower voltages and may no longer be 3.3V-tolerant. Use ‘Target’ setting in such case. Target board should provide its I/O reference voltage on the debug connector.
Disable watchdog with the option described above. Usually the watchdog timer will timeout after just a few seconds after reset is released, leaving very little time for user intervention. At the same time, don’t forget to disable or adequately service the watchdog timer in your software.
To enable code download user should provide some minimum memory access configuration. This can be trivial by merely setting the appropriate chip-select registers for flash or SRAM, or complicated and lengthy for DRAM. Note that there’s no need for that with the 5xx/8xx that have internal RAM sufficient for small test code.
See notes above for setting debug clock and reset delay.
In case the debugger won’t start, disable initialization and all configurable options except disabling the watchdog. Check if the CPU stops at reset vector 0xFFF00100, or 0x100 if MSRIP is 0.
It is recommended that CPU clock PLL is not modified in the initialization sequence as this may cause CPU debug port to fail. Instead, user code should do this in any case.
Under Emulation Options/CPU Setup check all exceptions that don’t have a handler in your code. This is a good means to detect early when your code strays away.
10 Troubleshooting
Q: We noticed that our MPC565 application is running faster when the debugger is connected than when it's running in stand-alone. We are using iTRACE PRO/GT Nexus development system. What could be the reason for this behavior? A: Most probably your application doesn't set the ISCT_SER field of the ICTRL (debug) special purpose register. After reset, the microcontroller runs fully serialized and show cycles are performed for all fetched instructions (ISCT_SER = b000). When the debugger is connected, following ISCT_SER values are set:

iSYSTEM, May 2015 23/24
- 5 to facilitate 565 Nexus trace operation, before chip revision D - 6 to facilitate 565 Nexus trace operation, with and after revision D - 7 for all MPC5xx/8xx BDM and Nexus without trace In your case, the application (e.g. startup code) should set ISCT_SER to 7. Refer to the Development Support chapter in the 565 Reference Manual for more details on the ISCT_SER field.
When attaching an emulator to the MPC5xx/8xx, some specific considerations are called for:
1. Actively drive the DBGC (D9,D10) and DBPC (D11,D12), Hard Reset Configuration Word bits onto the bus to select the Multifunction I/O pin selection for target and Development Port. The values required to be driven onto these pins are based on the signals that have been routed to the 10-pin BDM connector. This doesn't apply to MPC505/509.
2. There are two BDM 'Freeze' signal schemes. Option A is recommended for Trace option. But, Option B may also be used as an alternative when target design uses PCMCIA Port B. Option B requires that the bit SIUMCR.FRC=0. For BDM operation alone it is irrelevant what option is used. With the exception of MPC505/509 the emulator uses BDM software command to establish CPU's run status.
3. Physically locate the 10-pin connector as close as possible to the processor to minimize trace length and crosstalk onto the BDM signals. Do not run high-speed clocks or signals adjacent to the BDM communication signals.
4. Ensure that the emulator /HRESET connector pin is connected directly to the /HRESET signal of the processor. This will provide the ability for the emulator to drive and sense the status of /HRESET. The target design should only drive the /HRESET with open collector or open drain type devices.
5. /HRESET should not be tied to /PORESET. The emulator drives the /HRESET and DSCK to enable BDM operation.
6. To guarantee that the JTAG Mode is not accidentally invoked, connect a pull down (~10K) resistor on the /TRST signal and a pull-up (~10K) on the TMS signal. When the MPC’s development port (BDM) is used, JTAG functionality is disabled. Designs that require both, should have a Reset configuration scheme to support the two modes. We use 10k pull-down on a '245 buffer that drives DBPC=00 and enables BDM functionality. And if a JTAG tester is connected it overcomes the pull-down to a logic high and the DBPC=11 enabling JTAG pins.
Known Issues
Problem: Download fails with verify errors.
Solution: For example, program segments A, B and C are linked together in a download file. But the B segment is mapped to a non-existent memory region. This in turn, causes failure in writing the first 8 bytes of the segment C. Of course, the solution is to always check the Load Map and make sure that the program is linked to valid memory regions.
Problem: I’m trying to inspect the floating-point registers. How do I do that?
Solution: Open the SFR window and expand the Floating Point Register group. If the MSR.FP floating point enable bit is zero, all floating-point registers will display zero.
Problem: Nexus trace doesn’t display properly 16-bit data write access in terms of data size.
iSYSTEM, May 2015 24/24
Explanation: Nexus doesn’t report the size of the data transfer. Instead it is guessed according to the number of bits transferred in the data field but this may not work always. As an example when the algorithm fails, 16-bit data access is displayed as 8-bit access.
Disclaimer: iSYSTEM assumes no responsibility for any errors which may appear in this document, reserves the right to change devices or specifications detailed herein at any time without notice, and does not make any commitment to update the information herein.
iSYSTEM. All rights reserved.