fritz terörde chairman elg haniel - home - issf: international stainless steel · pdf...
TRANSCRIPT

1
Stainless Steel RecyclingStainless Steel RecyclingData and Scenarios Data and Scenarios Availability of ScrapAvailability of Scrap
Fritz TerördeChairman
ELG Haniel
March 2006
2
Business Profile
• ELG is a major supplier of raw material to the stainless steel industry. The company is market and technology leader in the worldwide scrap recycling industry with a global market share of more than 25%. ELG operates 34 recycling sites, which process about 1.6m tonnes of scrap.
• ELG enjoys a strong relationship with the leading stainless steel producers worldwide, who value its ability to provide them with the desired quality (Ni, Cr content) of scrap metal on a timely basis. This is based on ELG’s unique ability to source large quantities of scrap metal through its global supply network.
• For sourcing, ELG operates an extensive collection network. It sources from small and medium sized scrap collectors, scrapyards as well as from large-scale industrial sources.

2
3
The Recycling Circle
Small & medium size
collectors
Industrial arisings
•Collect
•Analyse
•Process
Consumers
500-5000 tonne
per shipment
5-25 tonne per shipment
15 major customers
ELG is an integrated part of the recycling circle.
4
Operations within Europe
Rotterdam, NL
Processing YardsFeeder Yards
Sheffield, GB
Dresden, D
Moskau, RUS
Paris, F
Lyon, F
Rogeno, I
Basel, CH
Karlsruhe, D
Dortmund/Duisburg/Düsseldorf, D
Steinebach, D
Toulouse, F

3
5
Operations within North America
Los Angeles, CA
Mobile, AL
Chicago,IL
Darlington, SC
Louisville, KY
Pittsburgh, PA
Houston, TX
Greenville, PA
San Francisco, CA
Office
Yard
6
Operations within Asia & Australasia
China
Russia
Kaohsiung, Taiwan
Office
Yard
Melbourne
Sydney
JSP JVOyama-City, JapanKitakyushu,JapanOsaka,Japan
Shanghai, China
Australia
Incheon SKorea

4
7
Stainless Steel Blends
Stainless Steel in the form of Ingots, Billets,
Bar, Coil etc.100t 304 Type Stainless Steel:
8.5% Ni 17% Cr
50t Cr Fe 7.5t 37/18: 7.5t Inco 600: 35t Cast Cr:
15% Cr 37% Ni 18% Cr 76% Ni 15% Cr 23% Cr
Alloy scrap in many different physical forms
& analyses.
8
W. World Usage of Stainless Steel & Scrap, Nickel & Chrome
100
300
500
700
900
1,100
1,300
1,500
1,700
1,900
2,100
2,300
2,500
2,700
1960 1965 1970 1975 1980 1985 1990 1995 2000 2005
in Index Points
External Stainless ScrapG. R.: 8.0%
Stainless SteelG. R.: 5.1%
ChromeG. R.: 4.6%
NickelG. R.: 3.4%

5
9
-15
-10
-5
0
5
10
in %
*)Benchmark Nickel Price = 95% LME 3 Months
2003 2004
*) BenchmarkPrice
2005200220012000
LME Price
EuropeUSA
Average Prices in US$/lb Discount
LME 3 Months: 4.42
European Valuation: 4.10 7.2USA Valuation: 4.05 8.4
2000 - Q3 2005Nickel Benchmark Prices
10
World Crude Stainless Output
2004 2005 f 2006 f
USA 2,400 2,230 2,300
W. Europe (incl. S. Africa) 9,475 8,900 9,400
Japan 4,200 4,100 4,100
China 2,800 3,750 4,400
S. Korea / Taiwan / India 5,470 5,340 5,720
Others 600 550 600
Total 24,945 24,870 26,520
% Change 9.0 -0.3 6.6
in ´000 t (rounded)

6
11
Regional Stainless Scrap Availability
2004 Change 2006Year 1st HY 2nd HY Total ´05/04 Q 1
in % in ‘000 t
USA 1,304 712 583 1,295 -0.7 290
Japan 963 452 448 900 -6.5 235
W. Europe 2,427 1,263 982 2,245 -7.5 580
China 753 459 421 880 16.9 230
Asia 646 373 267 640 -0.9 150
Exports from East*) 660 340 260 600 -9.1 130
Others 469 253 248 460 -1.9 120
Total 7,222 3,852 3,210 7,060 -2.2 1,735
*) Eastern Europe, FSU and Blended / Re-melt Scrap
2005
in ‘000 t
12
Stainless Steel Scrap Availability
Recycling Recycling -- TimeTime
InternalInternalScrapScrap
3 3 daysdays --3 3 monthsmonths
Industrial Industrial ScrapScrap
ca. ca. 6 6 monthsmonths
ReclaimedReclaimedScrapScrap
15 15 -- 20 20 yearsyears
Internal Scrap
Industrial Scrap
Reclaimed Scrap
discarded during production
discarded during manufacturing
old consumer / industrial goods
7
13
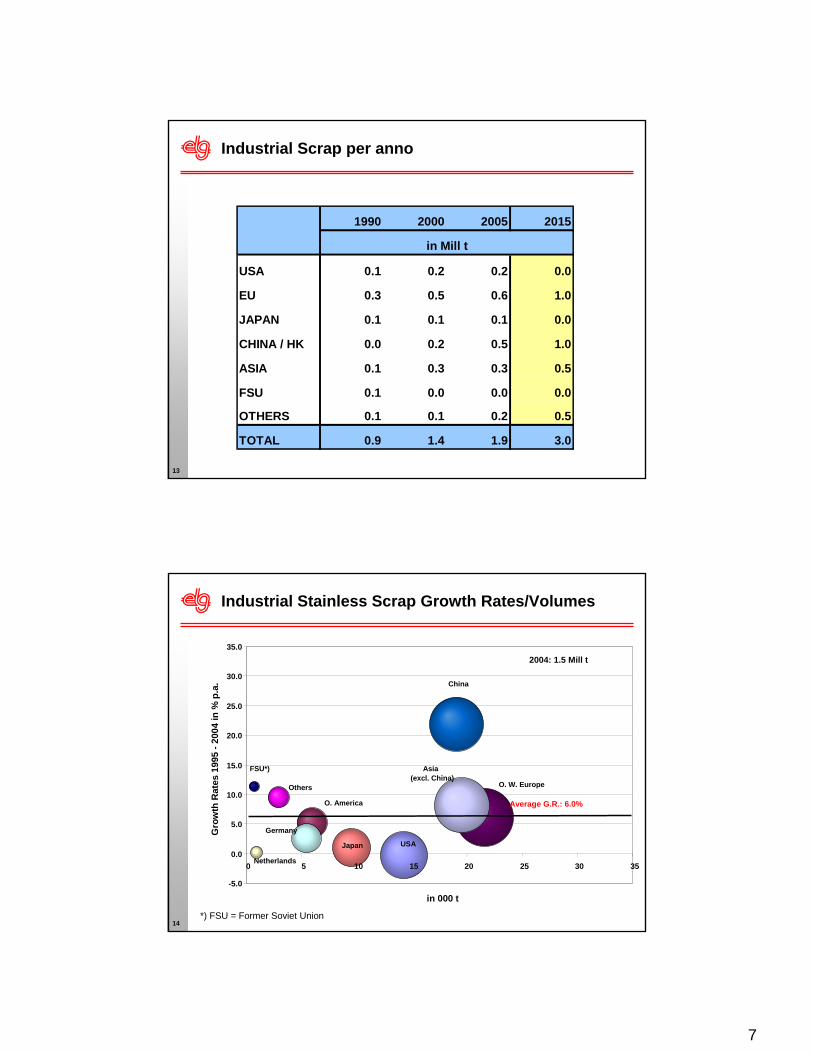
Industrial Scrap per anno
1990 2000 2005 2015
USA 0.1 0.2 0.2 0.0
EU 0.3 0.5 0.6 1.0
JAPAN 0.1 0.1 0.1 0.0
CHINA / HK 0.0 0.2 0.5 1.0
ASIA 0.1 0.3 0.3 0.5
FSU 0.1 0.0 0.0 0.0
OTHERS 0.1 0.1 0.2 0.5
TOTAL 0.9 1.4 1.9 3.0
in Mill t
14
Industrial Stainless Scrap Growth Rates/Volumes
*) FSU = Former Soviet Union
-5.0
0.0
5.0
10.0
15.0
20.0
25.0
30.0
35.0
0 5 10 15 20 25 30 35
in 000 t
Gro
wth
Rat
es 1
995
-200
4 in
% p
.a.
2004: 1.5 Mill t
Others
O. America
Netherlands
Japan USA
O. W. Europe
Average G.R.: 6.0%
Germany
China
FSU*) Asia(excl. China)

8
15
Reclaimed Stainless Scrap Growthrates/Volumes
*) FSU = Former Soviet Union
-5.0
0.0
5.0
10.0
15.0
20.0
25.0
0 5 10 15 20 25 30 35
in ´000 t
Gro
wth
Rat
es 1
995
-200
4 in
% p
.a.
2004: 3.5 Mill t
Others
O. America
Netherlands JapanUSA
O. W. Europe
Average G.R.: 6.0%
Germany
China
FSU*)
Asia(excl. China)
16
Blended Stainless Scrap Growthrates/Volumes
*) FSU = Former Soviet Union
-5.0
0.0
5.0
10.0
15.0
20.0
25.0
30.0
35.0
0 5 10 15 20 25 30 35
in ´000 t
Gro
wth
Rat
es 1
995
-200
4 in
% p
.a.
2004: 2.0 Mill t
Others
O. AmericaNetherlands
JapanUSA
O. W. Europe Average G.R.: 6.0%Germany
China
FSU*)Asia(excl. China)

9
17
Reclaimed / Blended Scrap
1990 2000 2005 2015
USA 0.7 0.6 1.1 1.5
EU 0.5 1.1 1.6 3.0
JAPAN 0.3 0.5 0.8 1.0
CHINA / HK 0.0 0.1 0.4 1.5
ASIA 0.0 0.2 0.3 1.0
FSU 0.0 0.6 0.5 0.5
OTHERS 0.1 0.3 0.4 1.0
TOTAL 1.6 3.5 5.1 9.5
in Mill t
18
Total Stainless Scrap Availability per Quarter
-5.0
0.0
5.0
10.0
15.0
20.0
25.0
30.0
0 5 10 15 20 25
in ´000 t
Gro
wth
Rat
es 1
995
-200
4 in
% p
.a.
2004: 7.1 Mill t
Others
O. America
Netherlands JapanUSA
O. W. Europe
Average G.R.: 6.0%
Germany
China
FSU*) Asia(excl. China)
*) FSU = Former Soviet Union

10
19
Stainless Scrap Market vs. LME Nickel Prices
9001,0001,1001,2001,3001,4001,5001,6001,7001,8001,9002,000
1999 2000 2001 2002 2003 2004 2005 2006(f)
Scra
p A
vaila
bilit
y, '0
00t
0.00
1.00
2.00
3.00
4.00
5.00
6.00
7.00
8.00
LME C
ash Nickel Price, U
S$/lb
Scrap Availability
LME Cash Nickel Price
20
35.0
36.0
37.0
38.0
39.0
40.0
41.0
42.0
43.0
44.0
Q1 Q2 Q3 Q4 Q1 Q2 Q3 Q4 Q1 Q2 Q3 Q4 Q1 Q2 Q3 Q4 Q1 Q2 Q3
Exte
rnal
Aus
teni
tic S
crap
Rat
io in
%
0
2,000
4,000
6,000
8,000
10,000
12,000
14,000
16,000
18,000
LME Nickel Price C
ash US$/t
2001 2002 2003 2004 2005
LME Nickel Price Cash US$/t
External Austenitic Scrap Ratio
Correlation: 0.87
External Scrap Ratio vs. Nickel Price

11
21
External Austenitic Stainless Steel Scrap Consumption 2004
45
42
39
36
33
30
27
24
21
18
15
12
9
6
3
00 10 20 30 40 50 60 70 80 90 100
*) inc. Canada, Brazil, South AfricaShare of Total in %
Average Growth Rate 1995 - 2004: 7.0%
Gro
wth
Rat
e 19
95 -
200
4 in
% p
.a.
China
EuropeUSA
Japan
Others*)
Other Asia(excl. China
& Japan)
22
Lifetime Ratios1980-1990 Globally 16,5years low 60 high 80pct
2000-2006Distintive Regional Differences
USA 10 Years 60 – 80% (blending)
EU 13 Years 60 – 95% (blending)
Japan 20 Years 60 – 85%
China 10 Years 20 – 40%
(High Export Finishedproducts, Construction)
Asien 10 Years 25 – 50% (like China)
Lifetime Recycling Ratios ModelsScrap market changes through recycling technology

12
• USA• EU• Japan• China / Hong Kong• Asia• FSU• Others
• USA• EU• Japan• China / Hong Kong• Asia• FSU• Others
Comparing the actual scrap consumptionsand estimated lifetime/recycling ratios to achieve a forecast
24
USA - Stainless Steel Scrap Availability
0
500
1,000
1,500
2,000
2,500
1960 1966 1972 1978 1984 1990 1996 2002 2008 2014
in ´0
00 t
Actual Availability (Austenitic)Recycling Ratio 50%Recycling Ratio 80%
Nickel Shortage
Nickel Shortage
Nic
kel P
rice
Expl
osio
n
Actual Forecast

13
25
USA – Scrap Reserve
0
10,000
20,000
30,000
40,000
50,000
60,000
70,000
1950 1955 1960 1965 1970 1975 1980 1985 1990 1995 2000 2005 2010 2015
in ´0
00 t
Scrap Reserve
Consumption of Austentic Stainless Steel
Recycled Scrap
26
1990 2000 2005 2015
Cumulated SS Net. Consumption 22.8 36.3 43.3 62.3
Cumulated Scrap Consumption 9.5 16.1 20.7 33.0Scrap Reserve 13.3 20.2 22.5 29.3
Scrap Availability 0.8 0.8 1.3 1.7
Industrial Scrap 0.1 0.2 0.2 0.2Reclaimed / Blended Scrap 0.7 0.6 1.1 1.5
in Mill t
USA – Austenitic Stainless Scrap Market Parameters

14
27
EU - Stainless Steel Scrap Availability
0
500
1,000
1,500
2,000
2,500
3,000
3,500
4,000
4,500
1980 1986 1992 1998 2004 2010
in ´0
00 t
Actual Scrap Availability (Austenitic)Recycling Ratio 40-60%Recycling Ratio 60-95%
Actual Forecast
28
EU – Scrap Reserve
0
20,000
40,000
60,000
80,000
100,000
120,000
140,000
1950 1955 1960 1965 1970 1975 1980 1985 1990 1995 2000 2005 2010 2015
in ´0
00 t
Scrap Reserve
Consumption of Austentic Stainless Steel

15
29
1990 2000 2005 2015
Cumulated SS Net. Consumption 29.0 54.6 72.0 119.7
Cumulated Scrap Consumption 11.7 25.5 36.3 69.8Scrap Reserve 17.3 29.0 35.7 49.9
Scrap Availability 0.8 1.6 2.1 4.0
Industrial Scrap 0.3 0.5 0.6 0.8Reclaimed / Blended Scrap 0.5 1.1 1.6 3.3
in Mill t
EU – Austenitic Stainless Scrap Market Parameters
30
JAPAN - Stainless Steel Scrap Availability
0
200
400
600
800
1,000
1,200
1,400
1980 1986 1992 1998 2004 2010
in ´0
00 t
Actual Scrap Availability (Austenitic)Recycling Ratio 40-60%Recycling Ratio 60-85%
Actual Forecast

16
31
JAPAN – Scrap Reserve
0
10,000
20,000
30,000
40,000
50,000
60,000
1950 1955 1960 1965 1970 1975 1980 1985 1990 1995 2000 2005 2010 2015
in ´0
00 t
Scrap Reserve
Consumption of Austentic Stainless Steel
32
1990 2000 2005 2015
Cumulated SS Net. Consumption 17.2 29.5 36.5 53.5
Cumulated Scrap Consumption 3.5 9.2 13.9 25.6Scrap Reserve 13.7 20.3 22.6 27.9
Scrap Availability 0.4 0.6 0.9 1.1
Industrial Scrap 0.1 0.1 0.1 0.2Reclaimed / Blended Scrap 0.3 0.5 0.8 0.9
in Mill t
JAPAN – Austenitic Stainless Scrap Market Parameters

17
33
CHINA / HK - Stainless Steel Scrap Availability
0
500
1,000
1,500
2,000
2,500
3,000
1980 1983 1986 1989 1992 1995 1998 2001 2004 2007 2010 2013
in ´0
00 t
Actual Scrap Availability (Austenitic)Recycling Ratio 15-20%Recycling Ratio 35-40%
Actual Forecast
34
0
10,000
20,000
30,000
40,000
50,000
60,000
70,000
80,000
90,000
1970 1975 1980 1985 1990 1995 2000 2005
in ´0
00 t
Scrap Reserve
Consumption of Austentic Stainless Steel
CHINA / HK – Scrap Reserve

18
35
1990 2000 2005 2015
Cumulated SS Net. Consumption 2.4 9.9 24.0 80.3
Cumulated Scrap Consumption 0.6 2.7 6.0 24.8Scrap Reserve 1.8 7.2 18.0 55.5
Scrap Availability 0.1 0.3 0.9 2.5
Industrial Scrap 0.0 0.2 0.5 1.0Reclaimed / Blended Scrap 0.0 0.1 0.4 1.5
in Mill t
CHINA / HK – Austenitic Stainless Scrap Market Parameters
36
0
200
400
600
800
1,000
1,200
1,400
1,600
1980 1983 1986 1989 1992 1995 1998 2001 2004 2007 2010 2013
in ´0
00 t
Recycling Ratio 15-25%
Recycling Rato 50%
Actual Scrap Availability (Austenitic)
Actual Forecast
Asian Finacial Crisis
ASIA - Stainless Steel Scrap Availability

19
37
ASIA – Scrap Reserve
0
10,000
20,000
30,000
40,000
50,000
60,000
70,000
1980 1985 1990 1995 2000 2005 2010 2015
in ´0
00 t
Scrap ReserveConsumption of
Austentic Stainless Steel
Recycled Stainless Scrap
Taiwan, S. Korea, India, Thailand, Indonesia, Malaysia, Singapore, Philippines, Ohters (= Vietnam, Bangladesh)
38
Asia- Austenitic Stainless Scrap Market Parameters
1990 2000 2005 2015
Cumulated SS Net. Consumption 6.1 21.3 32.1 60.1
Cumulated Scrap Consumption 1.6 7.1 11.8 24.3Scrap Reserve 4.5 14.1 20.3 35.8
Scrap Availability 0.1 0.5 0.6 1.3
Industrial Scrap 0.1 0.3 0.3 0.4Reclaimed / Blended Scrap 0.0 0.2 0.3 0.8
in Mill t
Taiwan, S. Korea, India, Thailand, Indonesia, Malaysia, Singapore, Philippines, Ohters (= Vietnam, Bangladesh)

20
39
FSU - Stainless Scrap Internal Usage & Exports
0
100
200
300
400
500
600
700
1970 1975 1980 1985 1990 1995 2000 2005 2010 2015
in ´0
00 t
ActualForecast
Exports
Exports
Communist Period Transition Phase Capitalist System
Consumption in FSU
40
FSU – Scrap Reserve
0
5,000
10,000
15,000
20,000
25,000
30,000
35,000
1970 1975 1980 1985 1990 1995 2000 2005 2010 2015
in ´0
00 t
Consumption of Austentic Stainless Steel
Scrap Reserve
Communist Period Transition Phase Capitalist System
Recycled Stainless Scrap

21
41
FSU – Austenitic Stainless Scrap Market Parameters
1990 2000 2005 2015
Cumulated SS Net. Consumption 22.3 25.9 27.0 30.2
Cumulated Scrap Consumption 1.5 4.5 7.0 12.8Scrap Reserve 20.8 21.5 20.0 17.3
Scrap Availability 0.1 0.6 0.5 0.5
Industrial Scrap 0.1 0.0 0.0 0.1Reclaimed / Blended Scrap 0.0 0.6 0.5 0.5
in Mill t
42
0
200
400
600
800
1,000
1,200
1,400
1980 1983 1986 1989 1992 1995 1998 2001 2004 2007 2010 2013
in ´0
00 t
Actual Scrap Availability (Austenitic)Recycling Ratio 30-50%Recycling Ratio 50-70%
Actual Forecast
OTHERS - Stainless Steel Scrap Availability

22
43
OTHERS – Scrap Reserve
0
5,000
10,000
15,000
20,000
25,000
30,000
35,000
40,000
1975 1980 1985 1990 1995 2000 2005 2010 2015
in ´0
00 t
Scrap ReserveConsumption of Austentic Stainless Steel
Recycled Stainless Scrap
Other America, Other W. Europe, Middle East, Africa, Australasia
44
1990 2000 2005 2015
Cumulated SS Net. Consumption 6.6 13.0 18.1 33.6
Cumulated Scrap Consumption 2.0 5.1 7.5 16.4Scrap Reserve 4.6 7.9 10.6 17.2
Scrap Availability 0.2 0.4 0.6 1.1
Industrial Scrap 0.1 0.1 0.2 0.3Reclaimed / Blended Scrap 0.1 0.3 0.4 0.8
in Mill t
OTHERS – Austenitic Stainless Scrap Market Parameters
Other America, Other W. Europe, Middle East, Africa, Australasia

23
45
Cumulated Austenitic Stainless Steel Consumption*
1990 2000 2005 2015
USA 22.8 36.3 43.3 62.0
EU 29.0 54.6 72.0 120.0
JAPAN 17.2 29.5 36.5 54.0
CHINA / HK 2.4 9.9 24.0 80.0
ASIA 6.1 21.3 32.1 60.0
FSU 22.3 25.9 27.0 30.0
OTHERS 6.6 13.0 18.1 34.0
TOTAL 106.4 190.6 253.0 440.0
in Mill t
* after deduction of Industrial Scrap
46
Cumulated External Scrap Consumption
1990 2000 2005 2015
USA 9.5 16.1 20.7 33.0
EU 11.7 25.5 36.3 70.0
JAPAN 3.5 9.2 13.9 26.0
CHINA / HK 0.6 2.7 6.0 25.0
ASIA 1.6 7.1 11.8 24.0
FSU 1.5 4.5 7.0 13.0
OTHERS 2.4 5.5 7.9 17.0
TOTAL 30.8 70.7 103.7 208.0
in Mill t

24
47
Scrap Reserve
1990 2000 2005 2015
USA 13.3 20.2 22.5 29.0
EU 17.3 29.0 35.7 50.0
JAPAN 13.7 20.3 22.6 28.0
CHINA / HK 1.8 7.2 18.0 56.0
ASIA 4.5 14.1 20.3 36.0
FSU 20.8 21.5 20.0 17.0
OTHERS 4.2 7.5 10.2 17.0
TOTAL 75.6 119.9 149.3 233.0
in Mill t
48
TOTAL - Scrap Reserve
0
50,000
100,000
150,000
200,000
250,000
300,000
350,000
400,000
450,000
500,000
1950 1955 1960 1965 1970 1975 1980 1985 1990 1995 2000 2005 2010 2015
in ´0
00 t
Scrap Reserve
Consumption of Austentic Stainless Steel
Recycled Stainless Scrap

25
49
Scrap Availability
1990 2000 2005 2015
USA 0.8 0.8 1.3 2.0
EU 0.8 1.6 2.1 4.0
JAPAN 0.4 0.6 0.9 1.0
CHINA / HK 0.1 0.3 0.9 3.0
ASIA 0.1 0.5 0.6 1.0
FSU 0.1 0.6 0.5 1.0
OTHERS 0.2 0.4 0.6 1.0
TOTAL 2.5 4.8 7.0 13.0
in Mill t