fy2019 doi aviation safety summary and annual report
TRANSCRIPT
Published by: Office of
Aviation Services (OAS)
HTTPS://WWW.DOI.GOV/AVIATION
FY2019 DOI Annual Aviation Safety Summary
Page 2
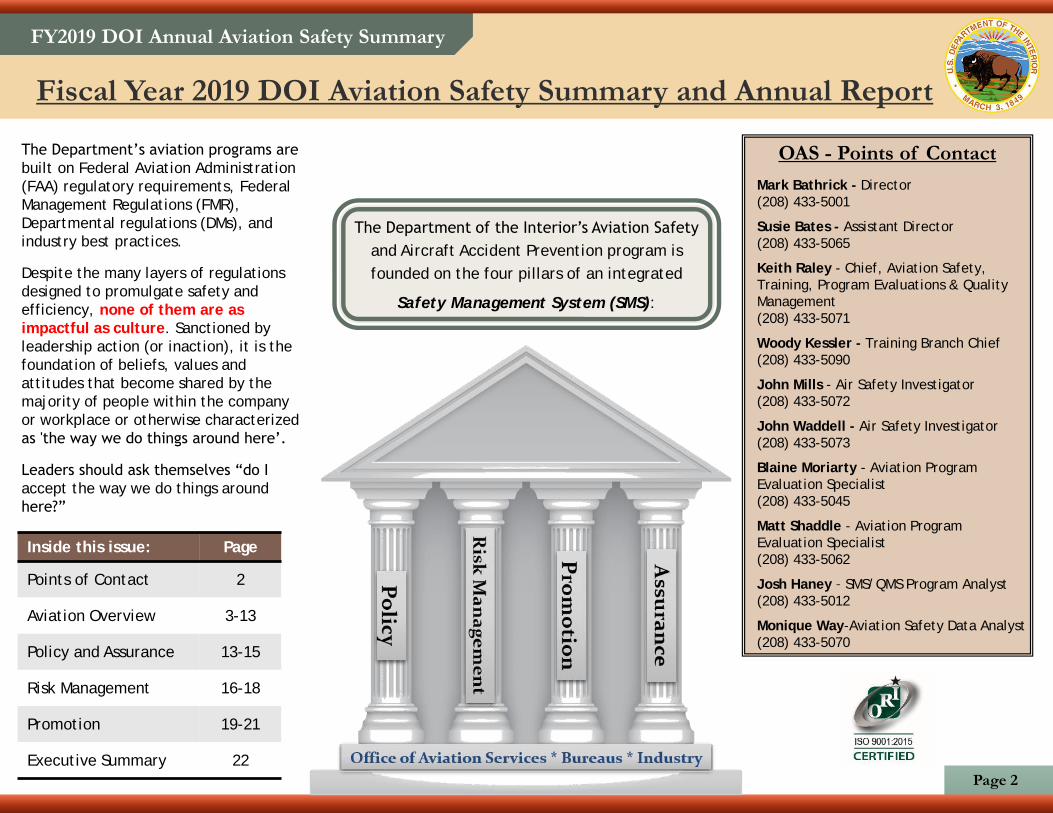
The Department of the Interior’s Aviation Safety
and Aircraft Accident Prevention program is
founded on the four pillars of an integrated
Safety Management System (SMS):
Inside this issue: Page
Points of Contact 2
Aviation Overview 3-13
Policy and Assurance 13-15
Risk Management 16-18
Promotion 19-21
Executive Summary 22
The Department’s aviation programs are
built on Federal Aviation Administration
(FAA) regulatory requirements, Federal
Management Regulations (FMR),
Departmental regulations (DMs), and
industry best practices.
Despite the many layers of regulations
designed to promulgate safety and
efficiency, none of them are as
impactful as culture. Sanctioned by
leadership action (or inaction), it is the
foundation of beliefs, values and
attitudes that become shared by the
majority of people within the company
or workplace or otherwise characterized
as 'the way we do things around here’.
Leaders should ask themselves “do I
accept the way we do things around
here?”
Fiscal Year 2019 DOI Aviation Safety Summary and Annual Report
OAS - Points of Contact
Mark Bathrick - Director
(208) 433-5001
Susie Bates - Assistant Director
(208) 433-5065
Keith Raley - Chief, Aviation Safety,
Training, Program Evaluations & Quality
Management
(208) 433-5071
Woody Kessler - Training Branch Chief
(208) 433-5090
John Mills - Air Safety Investigator
(208) 433-5072
John Waddell - Air Safety Investigator
(208) 433-5073
Blaine Moriarty - Aviation Program
Evaluation Specialist
(208) 433-5045
Matt Shaddle - Aviation Program
Evaluation Specialist
(208) 433-5062
Josh Haney – SMS/QMS Program Analyst
(208) 433-5012
Monique Way-Aviation Safety Data Analyst
(208) 433-5070
FY2019 DOI Annual Aviation Safety Summary
Page 3
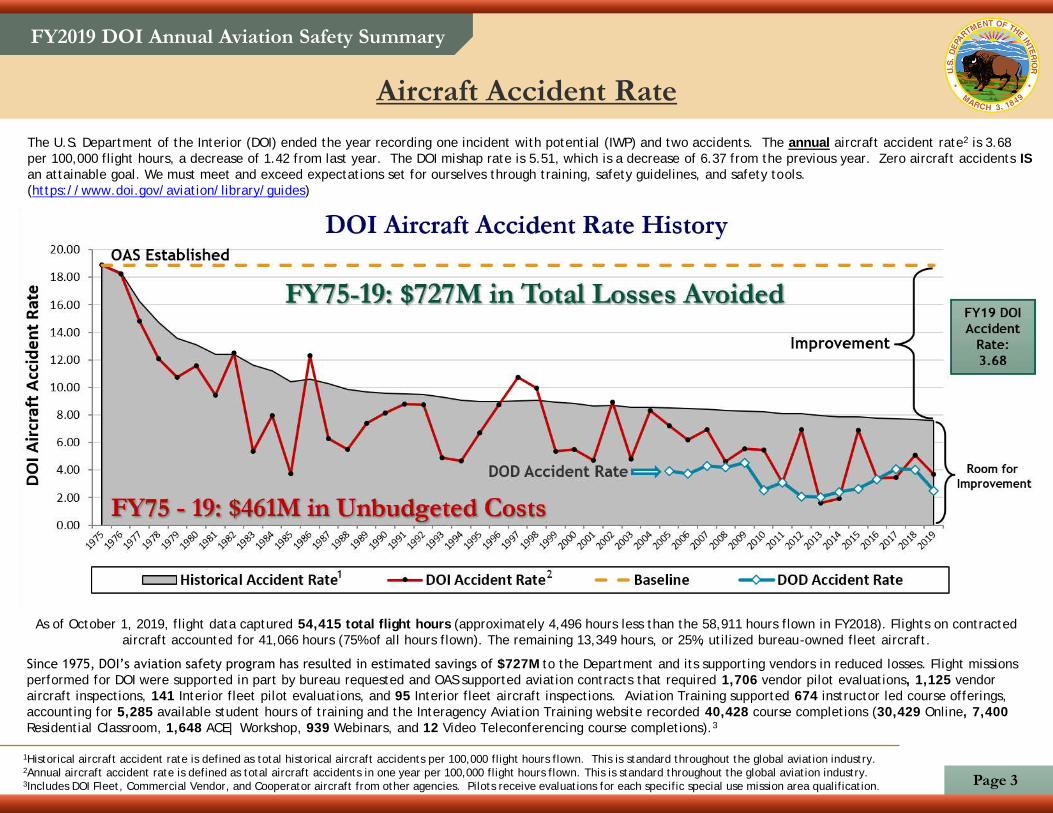
The U.S. Department of the Interior (DOI) ended the year recording one incident with potential (IWP) and two accidents. The annual aircraft accident rate2 is 3.68
per 100,000 flight hours, a decrease of 1.42 from last year. The DOI mishap rate is 5.51, which is a decrease of 6.37 from the previous year. Zero aircraft accidents IS
an attainable goal. We must meet and exceed expectations set for ourselves through training, safety guidelines, and safety tools.
(https://www.doi.gov/aviation/library/guides)
As of October 1, 2019, flight data captured 54,415 total flight hours (approximately 4,496 hours less than the 58,911 hours flown in FY2018). Flights on contracted
aircraft accounted for 41,066 hours (75% of all hours flown). The remaining 13,349 hours, or 25%, utilized bureau-owned fleet aircraft.
Since 1975, DOI’s aviation safety program has resulted in estimated savings of $727M to the Department and its supporting vendors in reduced losses. Flight missions
performed for DOI were supported in part by bureau requested and OAS supported aviation contracts that required 1,706 vendor pilot evaluations, 1,125 vendor
aircraft inspections, 141 Interior fleet pilot evaluations, and 95 Interior fleet aircraft inspections. Aviation Training supported 674 instructor led course offerings,
accounting for 5,285 available student hours of training and the Interagency Aviation Training website recorded 40,428 course completions (30,429 Online, 7,400
Residential Classroom, 1,648 ACE| Workshop, 939 Webinars, and 12 Video Teleconferencing course completions).3
1Historical aircraft accident rate is defined as total historical aircraft accidents per 100,000 flight hours flown. This is standard throughout the global aviation industry. 2Annual aircraft accident rate is defined as total aircraft accidents in one year per 100,000 flight hours flown. This is standard throughout the global aviation industry. 3Includes DOI Fleet, Commercial Vendor, and Cooperator aircraft from other agencies. Pilots receive evaluations for each specific special use mission area qualification.
Aircraft Accident Rate
FY2019 DOI Annual Aviation Safety Summary
Page 4
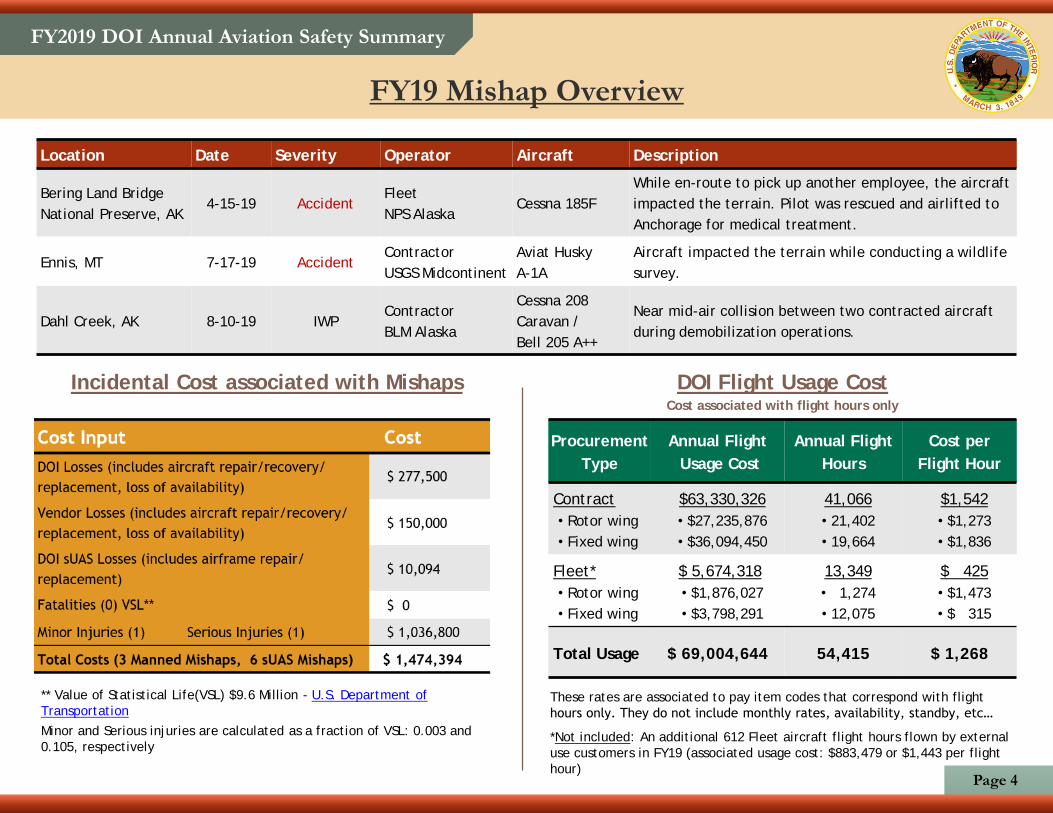
FY19 Mishap Overview
Incidental Cost associated with Mishaps
Location Date Severity Operator Aircraft Description
Bering Land Bridge
National Preserve, AK4-15-19 Accident
Fleet
NPS AlaskaCessna 185F
While en-route to pick up another employee, the aircraft
impacted the terrain. Pilot was rescued and airlifted to
Anchorage for medical treatment.
Ennis, MT 7-17-19 AccidentContractor
USGS Midcontinent
Aviat Husky
A-1A
Aircraft impacted the terrain while conducting a wildlife
survey.
Dahl Creek, AK 8-10-19 IWPContractor
BLM Alaska
Cessna 208
Caravan /
Bell 205 A++
Near mid-air collision between two contracted aircraft
during demobilization operations.
** Value of Statistical Life(VSL) $9.6 Million - U.S. Department of
Transportation
Minor and Serious injuries are calculated as a fraction of VSL: 0.003 and
0.105, respectively
DOI Flight Usage CostCost associated with flight hours only
These rates are associated to pay item codes that correspond with flight
hours only. They do not include monthly rates, availability, standby, etc…
*Not included: An additional 612 Fleet aircraft flight hours flown by external
use customers in FY19 (associated usage cost: $883,479 or $1,443 per flight
hour)
Procurement
Type
Annual Flight
Usage Cost
Annual Flight
Hours
Cost per
Flight Hour
Contract
• Rotor wing
• Fixed wing
$63,330,326
• $27,235,876
• $36,094,450
41,066
• 21,402
• 19,664
$1,542
• $1,273
• $1,836
Fleet*
• Rotor wing
• Fixed wing
$ 5,674,318
• $1,876,027
• $3,798,291
13,349
• 1,274
• 12,075
$ 425
• $1,473
• $ 315
Total Usage $ 69,004,644 54,415 $ 1,268

FY2019 DOI Annual Aviation Safety Summary
Page 5
DOI FY19 Mishap Overview
(Manned) Mishaps = Accidents + IWPs (sUAS) Mishaps = Accidents + IWPs + Aircraft loss
Accident Rate (manned aircraft)
*Accidents are defined by 49 CFR 830.2 and are determined by the NTSB. An Incident With Potential (IWP) is an incident that narrowly misses being an accident and is determined
by OAS. sUAS uses slightly different criteria due to lower flight hours and aircraft losses that don’t meet either criteria. Mishaps include accidents, IWP’s and incidents.
In FY19, the DOI accident rate decreased to 3.68 accidents for every 100,000 hours flown, a 28% decrease from the previous year.

FY2019 DOI Annual Aviation Safety Summary
Page 6
Department of the Interior Fleet Aircraft, Pilots, and Inspectors
Note: Fleet aircraft and pilots occasionally move their home base location. For the latest information on
current locations, please contact the L48 Fleet Maintenance Manager at 208-433-5082 or the Alaska Fleet
Maintenance Manager at 907-271-6104. Aircraft locations can also be found at the following link:
https://sites.google.com/a/ibc.doi.gov/aviation-resources/doi-fleet

FY2019 DOI Annual Aviation Safety Summary
Page 7
DOI Fleet Inventory
DOI Fleet Aircraft: 87(average age: 23 years old - six years less than
the average federal operation aircraft age of 29)
DOI Fleet Pilots: 89
# of
AircraftType of Aircraft
1 Aerospatiale AS350
1 Aviat A-1B Husky
2 Beechcraft BE200 King Air
2 Bell 206 B-3
2 Bell 206 L-3
2 Bell 412
3 Cessna 182
13 Cessna 185
21 Cessna 206
20 Cub Crafters CC-18 Top Cub
2 DHC2 MK1 Beaver
1 DHC-6-300 Twin Otter
6 Found FBA 2C
1 Partenavia P-68 Observer
1 Pilatus PC-12
1 Piper PA-18 Super Cub
8 Quest Kodiak 100
FY2019 DOI Annual Aviation Safety Summary
Page 8
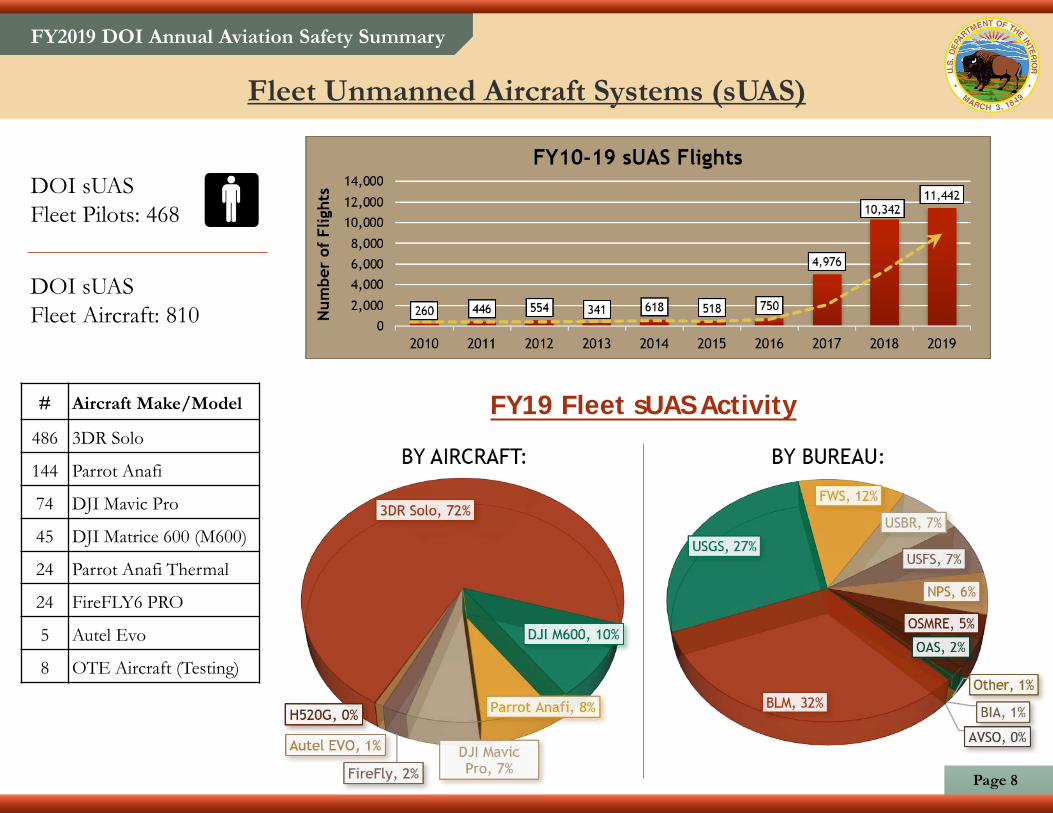
Fleet Unmanned Aircraft Systems (sUAS)
# Aircraft Make/Model
486 3DR Solo
144 Parrot Anafi
74 DJI Mavic Pro
45 DJI Matrice 600 (M600)
24 Parrot Anafi Thermal
24 FireFLY6 PRO
5 Autel Evo
8 OTE Aircraft (Testing)
DOI sUAS
Fleet Aircraft: 810
DOI sUAS
Fleet Pilots: 468
FY19 Fleet sUAS Activity
FY2019 DOI Annual Aviation Safety Summary
Page 9
Manned
Aircraft
Annual
Flight Hours
Annual Flight
Usage Cost
Cost per
Flight Hour
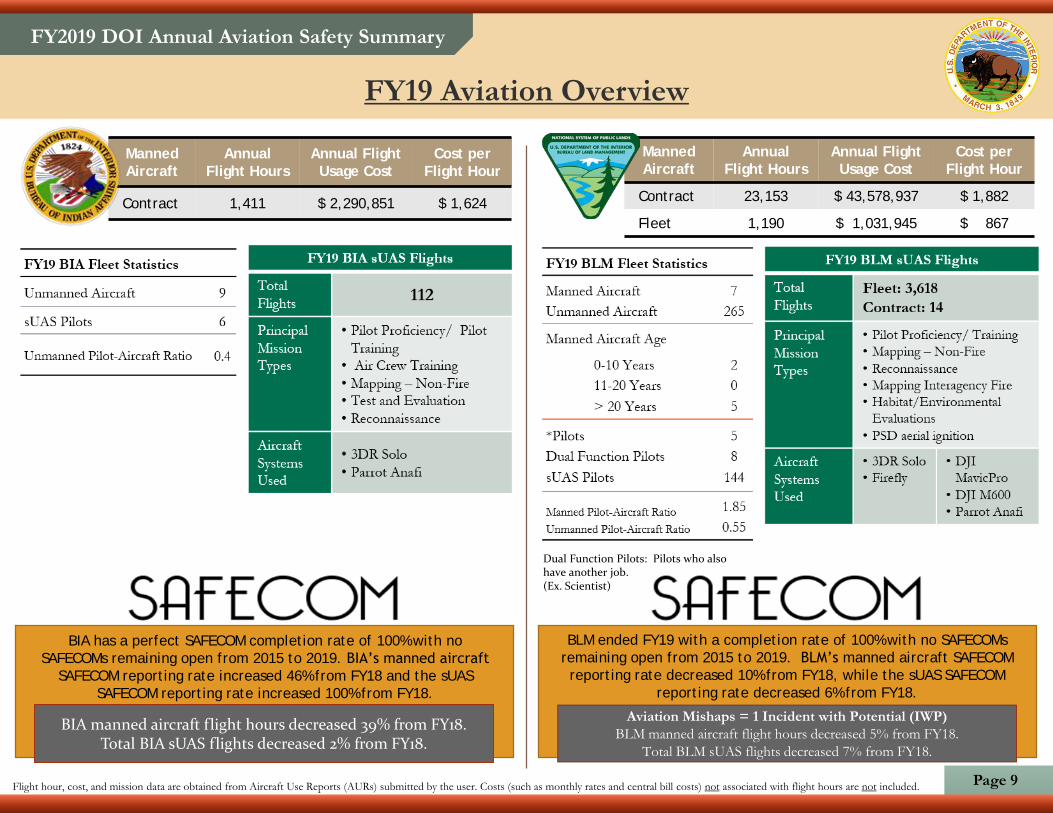
Contract 1,411 $ 2,290,851 $ 1,624
FY19 Aviation Overview
Manned
Aircraft
Annual
Flight Hours
Annual Flight
Usage Cost
Cost per
Flight Hour
Contract 23,153 $ 43,578,937 $ 1,882
Fleet 1,190 $ 1,031,945 $ 867
Dual Function Pilots: Pilots who also have another job. (Ex. Scientist)
Flight hour, cost, and mission data are obtained from Aircraft Use Reports (AURs) submitted by the user. Costs (such as monthly rates and central bill costs) not associated with flight hours are not included.
BIA has a perfect SAFECOM completion rate of 100% with no
SAFECOMs remaining open from 2015 to 2019. BIA’s manned aircraft
SAFECOM reporting rate increased 46% from FY18 and the sUAS
SAFECOM reporting rate increased 100% from FY18.
BLM ended FY19 with a completion rate of 100% with no SAFECOMs
remaining open from 2015 to 2019. BLM’s manned aircraft SAFECOM
reporting rate decreased 10% from FY18, while the sUAS SAFECOM
reporting rate decreased 6% from FY18.
BIA manned aircraft flight hours decreased 39% from FY18.Total BIA sUAS flights decreased 2% from FY18.
Aviation Mishaps = 1 Incident with Potential (IWP)
BLM manned aircraft flight hours decreased 5% from FY18.
Total BLM sUAS flights decreased 7% from FY18.
FY2019 DOI Annual Aviation Safety Summary
Page 10
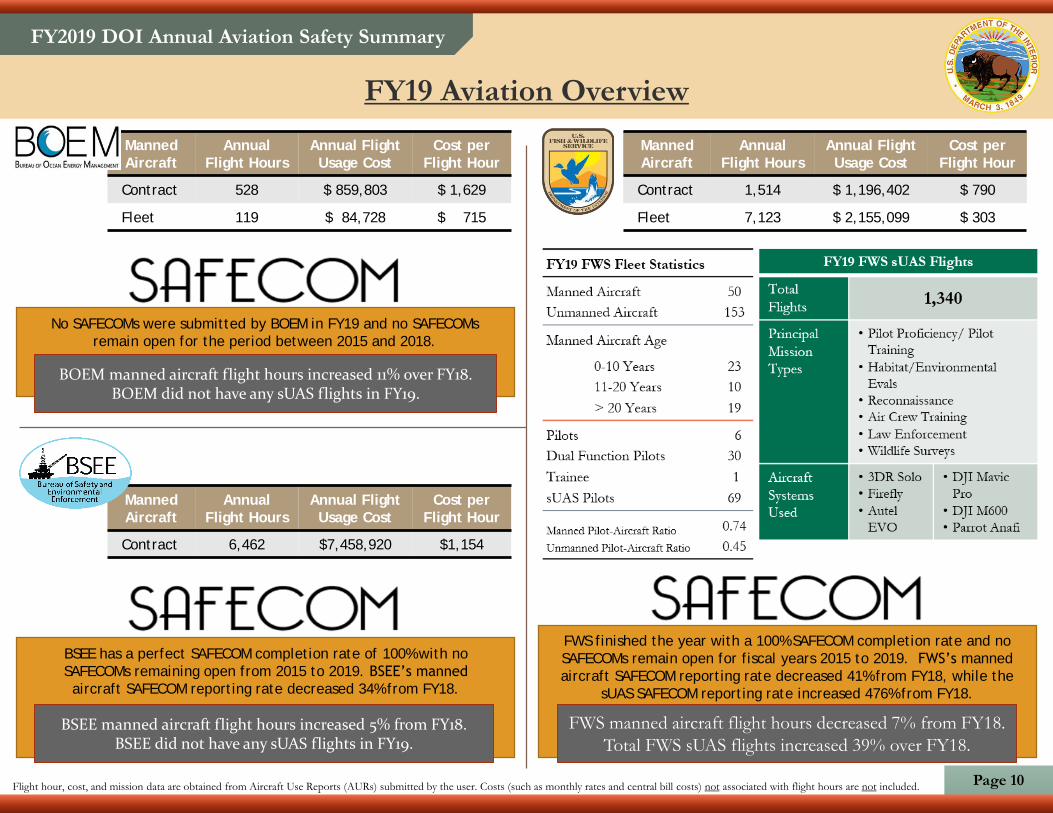
FY19 Aviation Overview
Manned
Aircraft
Annual
Flight Hours
Annual Flight
Usage Cost
Cost per
Flight Hour
Contract 1,514 $ 1,196,402 $ 790
Fleet 7,123 $ 2,155,099 $ 303
Flight hour, cost, and mission data are obtained from Aircraft Use Reports (AURs) submitted by the user. Costs (such as monthly rates and central bill costs) not associated with flight hours are not included.
FWS finished the year with a 100% SAFECOM completion rate and no
SAFECOMs remain open for fiscal years 2015 to 2019. FWS’s manned
aircraft SAFECOM reporting rate decreased 41% from FY18, while the
sUAS SAFECOM reporting rate increased 476% from FY18.
FWS manned aircraft flight hours decreased 7% from FY18.
Total FWS sUAS flights increased 39% over FY18.
BSEE has a perfect SAFECOM completion rate of 100% with no
SAFECOMs remaining open from 2015 to 2019. BSEE’s manned
aircraft SAFECOM reporting rate decreased 34% from FY18.
No SAFECOMs were submitted by BOEM in FY19 and no SAFECOMs
remain open for the period between 2015 and 2018.
BOEM manned aircraft flight hours increased 11% over FY18.BOEM did not have any sUAS flights in FY19.
BSEE manned aircraft flight hours increased 5% from FY18.BSEE did not have any sUAS flights in FY19.
Manned
Aircraft
Annual
Flight Hours
Annual Flight
Usage Cost
Cost per
Flight Hour
Contract 528 $ 859,803 $ 1,629
Fleet 119 $ 84,728 $ 715
Manned
Aircraft
Annual
Flight Hours
Annual Flight
Usage Cost
Cost per
Flight Hour
Contract 6,462 $7,458,920 $1,154

FY2019 DOI Annual Aviation Safety Summary
Page 11
FY19 Aviation Overview
Manned
Aircraft
Annual
Flight Hours
Annual Flight
Usage Cost
Cost per
Flight Hour
Contract 6,149 $ 6,607,762 $ 1,075
Fleet 4,270 $ 2,113,846 $ 495
Manned
Aircraft
Annual
Flight Hours
Annual Flight
Usage Cost
Cost per
Flight Hour
Contract 16 $ 8,313 $ 510
Appraisal and Valuation
Services Office (AVSO)
Manned Aircraft
Annual
Flight Hours
Annual Flight
Usage Cost
Cost per
Flight Hour
Contract 5 $ 3,797 $ 730
Flight hour, cost, and mission data are obtained from Aircraft Use Reports (AURs) submitted by the user. Costs (such as monthly rates and central bill costs) not associated with flight hours are not included.
No SAFECOMs were submitted by AVSO
in FY19 and none remain open from
2015 to 2019.AVSO did not have any manned aircraft flight hours or
sUAS flights prior to FY19.
NPS has a SAFECOM completion rate of 72% with 17 SAFECOMs
remaining open from 2015 to 2019. NPS manned aircraft SAFECOM
reporting rate decreased 41% from the previous year, while the sUAS
SAFECOM reporting rate decreased 66%.
Aviation Mishaps = 1 Accident
NPS manned aircraft flight hours decreased 17% from FY18.
Total NPS sUAS flights increased 46% over FY18.
OSMRE manned aircraft hours decreased 23% from
FY18. Total sUAS flights increased 404% over FY18.
OSMRE submitted 0 SAFECOMs in FY19. Their
manned aircraft SAFECOM reporting rate
remained unchanged from the previous year,
while their sUAS SAFECOM reporting rate
decreased 100%.
FY2019 DOI Annual Aviation Safety Summary
Page 12
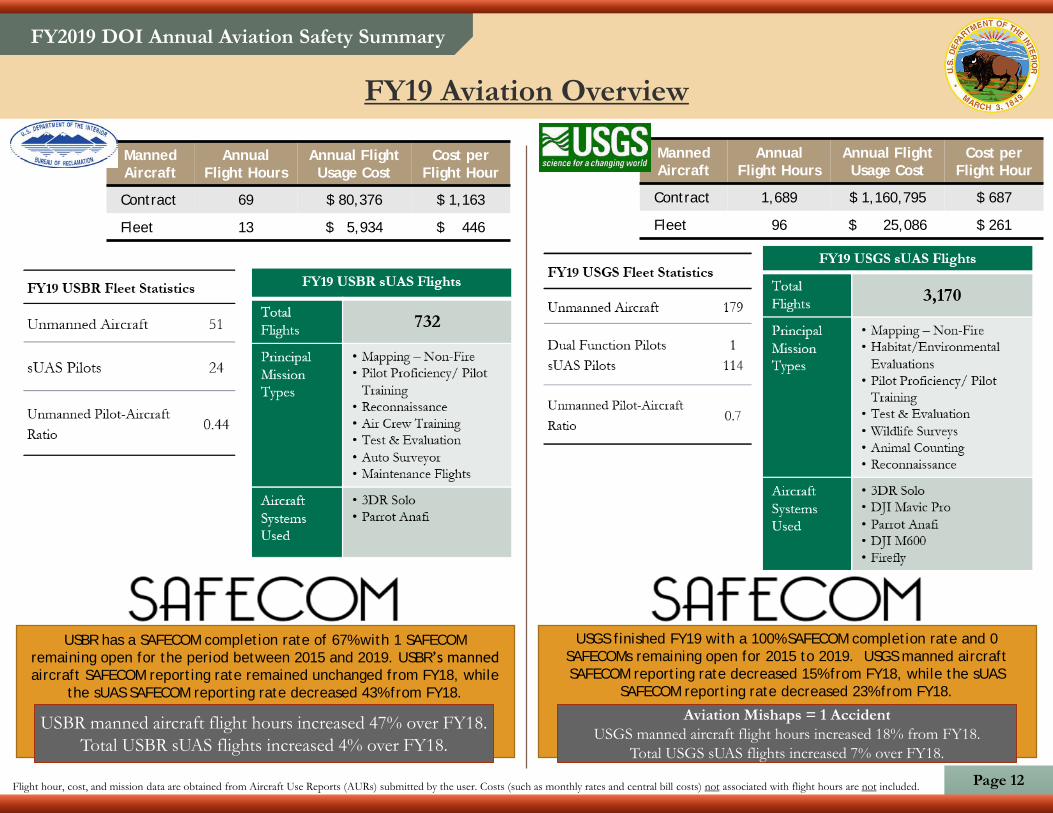
FY19 Aviation Overview
Flight hour, cost, and mission data are obtained from Aircraft Use Reports (AURs) submitted by the user. Costs (such as monthly rates and central bill costs) not associated with flight hours are not included.
USBR has a SAFECOM completion rate of 67% with 1 SAFECOM
remaining open for the period between 2015 and 2019. USBR’s manned
aircraft SAFECOM reporting rate remained unchanged from FY18, while
the sUAS SAFECOM reporting rate decreased 43% from FY18.
USGS finished FY19 with a 100% SAFECOM completion rate and 0
SAFECOMs remaining open for 2015 to 2019. USGS manned aircraft
SAFECOM reporting rate decreased 15% from FY18, while the sUAS
SAFECOM reporting rate decreased 23% from FY18.
USBR manned aircraft flight hours increased 47% over FY18.
Total USBR sUAS flights increased 4% over FY18.
Aviation Mishaps = 1 Accident
USGS manned aircraft flight hours increased 18% from FY18.
Total USGS sUAS flights increased 7% over FY18.
Manned
Aircraft
Annual
Flight Hours
Annual Flight
Usage Cost
Cost per
Flight Hour
Contract 69 $ 80,376 $ 1,163
Fleet 13 $ 5,934 $ 446
Manned
Aircraft
Annual
Flight Hours
Annual Flight
Usage Cost
Cost per
Flight Hour
Contract 1,689 $ 1,160,795 $ 687
Fleet 96 $ 25,086 $ 261
FY2019 DOI Annual Aviation Safety Summary
Page 13
FY19 Aviation Overview Performance & Safety Updates
Office of Aviation ServicesPERFORMANCE
Office of Aviation ServicesManned
Aircraft
Annual
Flight Hours
Annual Flight
Usage Cost
Cost per
Flight Hour
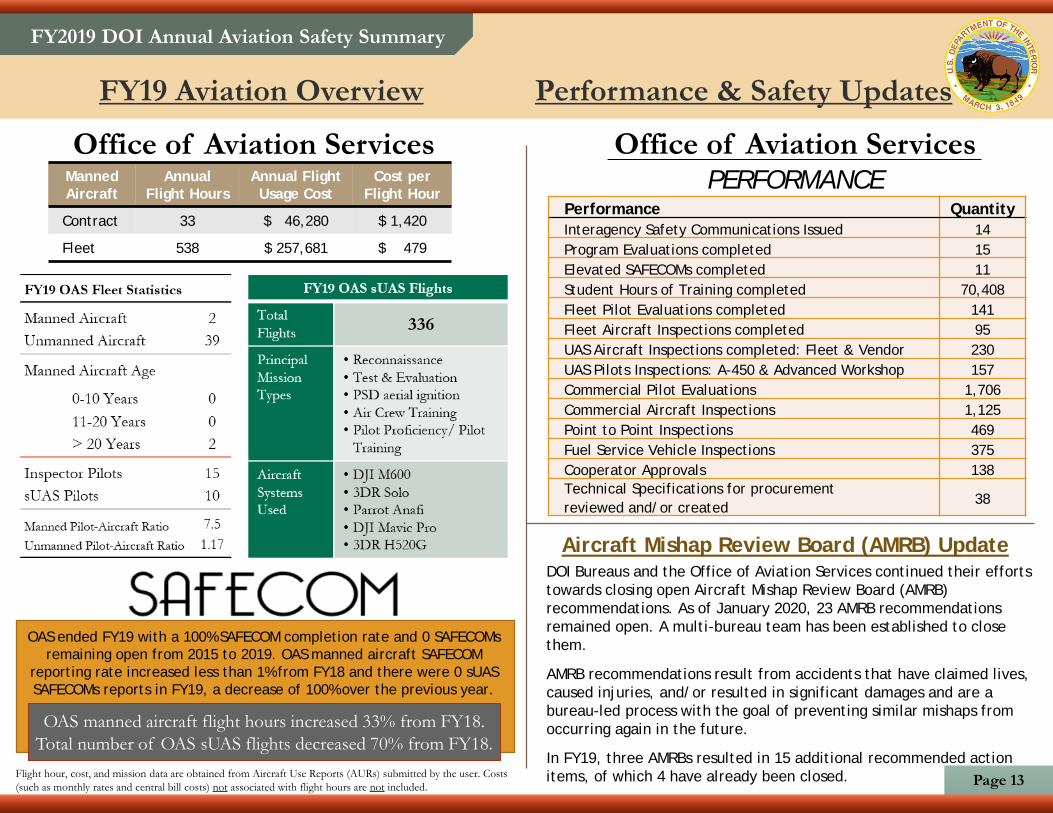
Contract 33 $ 46,280 $ 1,420
Fleet 538 $ 257,681 $ 479
Performance Quantity
Interagency Safety Communications Issued 14
Program Evaluations completed 15
Elevated SAFECOMs completed 11
Student Hours of Training completed 70,408
Fleet Pilot Evaluations completed 141
Fleet Aircraft Inspections completed 95
UAS Aircraft Inspections completed: Fleet & Vendor 230
UAS Pilots Inspections: A-450 & Advanced Workshop 157
Commercial Pilot Evaluations 1,706
Commercial Aircraft Inspections 1,125
Point to Point Inspections 469
Fuel Service Vehicle Inspections 375
Cooperator Approvals 138
Technical Specifications for procurement
reviewed and/or created38
Flight hour, cost, and mission data are obtained from Aircraft Use Reports (AURs) submitted by the user. Costs
(such as monthly rates and central bill costs) not associated with flight hours are not included.
OAS ended FY19 with a 100% SAFECOM completion rate and 0 SAFECOMs
remaining open from 2015 to 2019. OAS manned aircraft SAFECOM
reporting rate increased less than 1% from FY18 and there were 0 sUAS
SAFECOMs reports in FY19, a decrease of 100% over the previous year.
OAS manned aircraft flight hours increased 33% from FY18.
Total number of OAS sUAS flights decreased 70% from FY18.
Aircraft Mishap Review Board (AMRB) UpdateDOI Bureaus and the Office of Aviation Services continued their efforts
towards closing open Aircraft Mishap Review Board (AMRB)
recommendations. As of January 2020, 23 AMRB recommendations
remained open. A multi-bureau team has been established to close
them.
AMRB recommendations result from accidents that have claimed lives,
caused injuries, and/or resulted in significant damages and are a
bureau-led process with the goal of preventing similar mishaps from
occurring again in the future.
In FY19, three AMRBs resulted in 15 additional recommended action
items, of which 4 have already been closed.

FY2019 DOI Annual Aviation Safety Summary
Page 14
FY19 Safety & Training Updates
Aviation Program Evaluation Update
Aviation program evaluations are an essential means of providing feedback related
to the operations, process, and outcomes of aviation programs with a focus on
program enhancement. This quality assurance system assesses aviation safety,
ensures efficiency, and provides a means for sharing best practices.
Departmental Aviation Program Evaluations are conducted via a systematic process
for analyzing and reporting information regarding aviation programs within the
bureaus and their respective units. These assessments are tailored to meet
departmental and bureau needs in terms of regulatory compliance and continual
improvement. The evaluations also provide feedback regarding OAS’s
effectiveness in communicating and implementation of DOI aviation policies, while
identifying potential improvements to support the needs of the field.
FY19 Results & Top 5 Findings
In FY19, OAS conducted 15 aviation program evaluations amongst 8 bureaus
resulting in a total of 82 findings and no material weaknesses. Findings, corrective
actions, and aviation program enhancements were collaborated with bureau
aviation managers. 36 Best Practices were observed and identified within
evaluation final reports.
Top 5 Findings, 2015-2019
1. Aviation training requirements not met (per OPM-04 or more restrictive bureau
requirements) » 82%
2. Inadequate project planning, including Project Aviation Safety Plan completion
in accordance with OPM-06 » 71%
3. Incomplete, inaccurate and/or out of date Aviation Management Plans » 53%
4. Aviation Life Support Equipment (ALSE) inspection and tracking below
Interagency ALSE Standard requirements » 49%
5. Flight Hazard Maps lacking or inadequate » 30%
Inadequate Aviation Management Plans and Project Aviation Safety Plans (PASPs)
continue to account for a significant number of aviation program evaluation
findings across the department. These deficiencies were also found in 34% of
departmental aviation accidents and Incidents With Potential (IWPs) during this
same period (2015-2019).
Operational Procedure Memorandum-06 (OPM-06) identifies National Aviation
Management Plan standards, standardizes PASPs, and identifies management
approval requirements for both types of plans. OPM-06 in conjunction with bureau
specific National, Regional/State, and Local requirements should be utilized to
address planning deficiencies and facilitate aviation safety
improvements across the department.
OAS Training Division Update
IAT.GOV
In FY19, the OAS Training Branch successfully hosted 2 Aviation Centered
Training events. The events were held in Vancouver, WA and Minneapolis, MN
and averaged 113 students per event. In total, the OAS Training Branch
supported 674 instructor led course offerings accounting for 5,285 available
student hours of training and the Interagency Aviation Training website recorded
40,428 course completions:
▪ 30,429 Online
▪ 7,400 Residential Classroom
▪ 1,648 ACE| Workshop
▪ 939 Webinars
▪ 12 Video Teleconferencing
OAS Training has begun revising and updating the complete library of online
courses. Newly updated versions of A-100 Basic Aviation Safety, A-110 Aviation
Transportation of Hazardous Materials, and M-3 DOI Aviation Management
Training for Supervisors are in the final stages of approval. Other updating
efforts have been initiated on A-103 FAA NOTAM Systems, A-115 Automated
Flight Following, A-203 Basic Airspace, A-204 Aircraft Capabilities and
Limitations and A-207 Aircraft Flight Following.
Other OAS Training initiatives include the continuous improvements to the IAT
website. In 2019, we added several bureau specific training plans that
supplement Departmental requirements. Additionally, we also made significant
progress on the instructor qualification functionality that will enable users to
locate qualified instructors as well as allow instructors to view their own
qualifications.
ACE: Aviation Centered Education events continue to be a big success thanks to
all of those who participate as students and as instructors! ACE allows DOI
bureau and interagency partner personnel to acquire in one week required
training that would otherwise take many months to complete. DOI employees
and partner agencies will have two opportunities to attend ACE in FY20. The
first event will be held in Anchorage, AK March 9-13 and the second opportunity
will be in Phoenix, AZ April 13-17.
Be on the lookout for the FY21 ACE events to be announced in the near future.
FY2019 DOI Annual Aviation Safety Summary
Page 15
Project Aviation Safety Plans (PASPs)
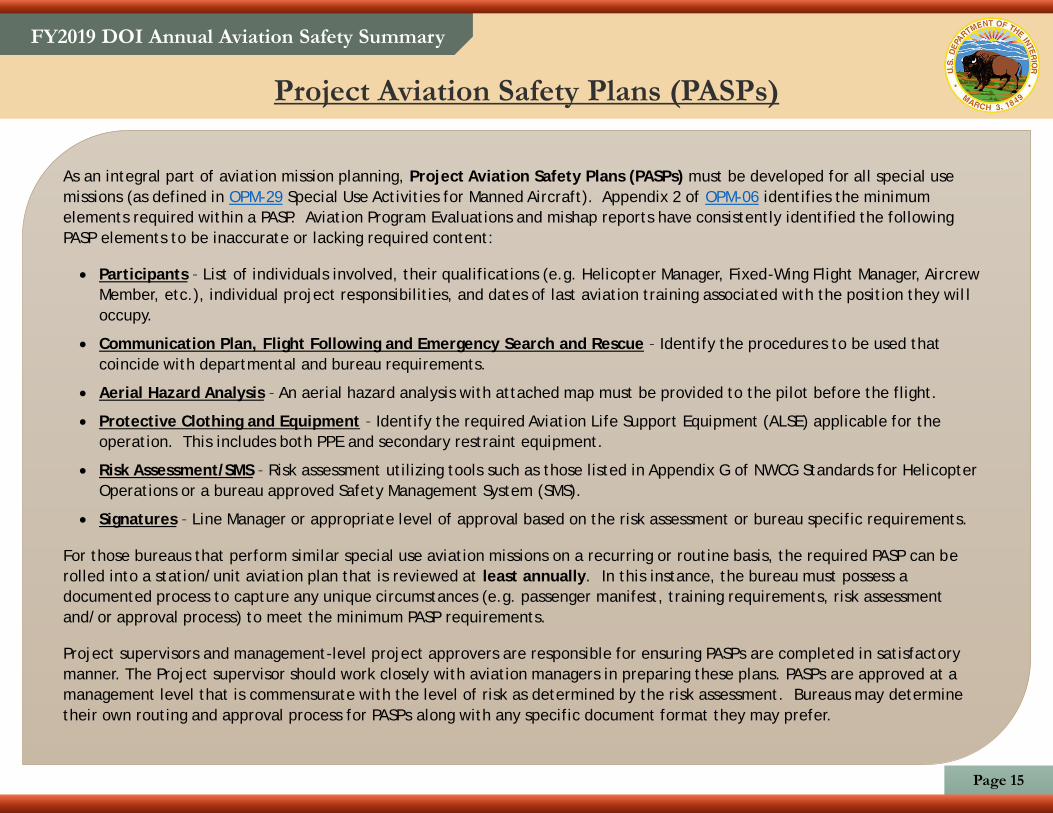
As an integral part of aviation mission planning, Project Aviation Safety Plans (PASPs) must be developed for all special use
missions (as defined in OPM-29 Special Use Activities for Manned Aircraft). Appendix 2 of OPM-06 identifies the minimum
elements required within a PASP. Aviation Program Evaluations and mishap reports have consistently identified the following
PASP elements to be inaccurate or lacking required content:
• Participants – List of individuals involved, their qualifications (e.g. Helicopter Manager, Fixed-Wing Flight Manager, Aircrew
Member, etc.), individual project responsibilities, and dates of last aviation training associated with the position they will
occupy.
• Communication Plan, Flight Following and Emergency Search and Rescue – Identify the procedures to be used that
coincide with departmental and bureau requirements.
• Aerial Hazard Analysis – An aerial hazard analysis with attached map must be provided to the pilot before the flight.
• Protective Clothing and Equipment – Identify the required Aviation Life Support Equipment (ALSE) applicable for the
operation. This includes both PPE and secondary restraint equipment.
• Risk Assessment/SMS – Risk assessment utilizing tools such as those listed in Appendix G of NWCG Standards for Helicopter
Operations or a bureau approved Safety Management System (SMS).
• Signatures – Line Manager or appropriate level of approval based on the risk assessment or bureau specific requirements.
For those bureaus that perform similar special use aviation missions on a recurring or routine basis, the required PASP can be
rolled into a station/unit aviation plan that is reviewed at least annually. In this instance, the bureau must possess a
documented process to capture any unique circumstances (e.g. passenger manifest, training requirements, risk assessment
and/or approval process) to meet the minimum PASP requirements.
Project supervisors and management-level project approvers are responsible for ensuring PASPs are completed in satisfactory
manner. The Project supervisor should work closely with aviation managers in preparing these plans. PASPs are approved at a
management level that is commensurate with the level of risk as determined by the risk assessment. Bureaus may determine
their own routing and approval process for PASPs along with any specific document format they may prefer.
FY2019 DOI Annual Aviation Safety Summary
Page 16
FY19 SAFECOM Overview
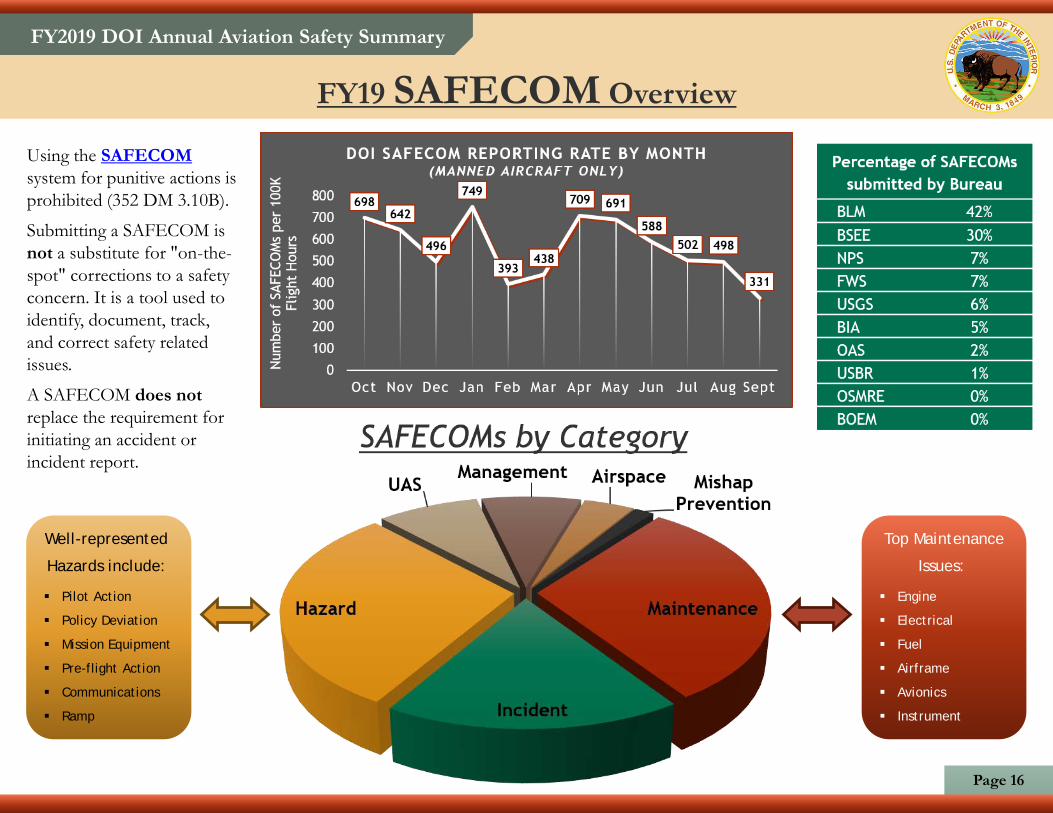
Using the SAFECOM
system for punitive actions is
prohibited (352 DM 3.10B).
Submitting a SAFECOM is
not a substitute for "on-the-
spot" corrections to a safety
concern. It is a tool used to
identify, document, track,
and correct safety related
issues.
A SAFECOM does not
replace the requirement for
initiating an accident or
incident report.
Well-represented
Hazards include:
▪ Pilot Action
▪ Policy Deviation
▪ Mission Equipment
▪ Pre-flight Action
▪ Communications
▪ Ramp
Top Maintenance
Issues:
▪ Engine
▪ Electrical
▪ Fuel
▪ Airframe
▪ Avionics
▪ Instrument

FY2019 DOI Annual Aviation Safety Summary
Page 17
FY19 SAFECOM Overview
Chart 1 – Mishap prevention efforts are more effective when reporting rates are high, as you only know what’s being reported. Although USGS and NPS both suffered an accident in FY19, the USGS mishap rate was much higher as a result of their lower flight hours. In FY19,BSEE had the highest SAFECOM reporting rate, submitting one SAFECOM for every 73 hours flown.
Chart 2 – Six Bureaus (BIA, BLM, BSEE, FWS, USGS, and OAS) finished the year with a 100% SAFECOM completion rate by Bureau Management! The overallDOI SAFECOM completion rate increased 1% over the previous year, with 97% of all SAFECOMs reviewed and completed by Bureau Management. However, the DOI SAFECOM reporting rate decreased 21% this year.
Chart 3 – We continue to see an inverse correlation between SAFECOM reporting and DOI’s accident rate.SAFECOM reporting for the period between 2000 and 2019 has increased 11% while the accident rate has decreased by 33%.

FY2019 DOI Annual Aviation Safety Summary
Page 18
FY17-19 SAFECOM Trends
Manned aircraft SAFECOM reporting: As shown in chart 3 on
the previous page, as SAFECOM reporting goes up, accidents go
down. The opposite is also true. The graph above demonstrates this
relationship. Between FY17 and FY19, the Department of the
Interior’s manned aircraft SAFECOM Reporting Rate has decreased
by 22% while the accident rate has increased by 6%.
sUAS SAFECOM reporting: Between FY17 and FY19, the 111%
increase in the number of sUAS flights substantially outpaced the
21% increase in the number of sUAS SAFECOMs. As a result, the
overall DOI sUAS SAFECOM reporting and mishap rates decreased
by 43% and 59%, respectively.
Importance of SAFECOM reporting: The SAFECOM system is
an essential tool in the Department’s efforts to reduce aviation
mishaps. Early identification, correction, and reporting of hazards
can save time, money, and most importantly, lives. The trend in lower
SAFECOM reporting rates we’ve seen in recent years may indicate
that managers may not know what hazards aren’t being reported. In
order to maintain an effective safety culture, the Department of the
Interior continues to depend on input from aviation users.
If you see something, say something.
FY2019 DOI Annual Aviation Safety Summary
Page 19
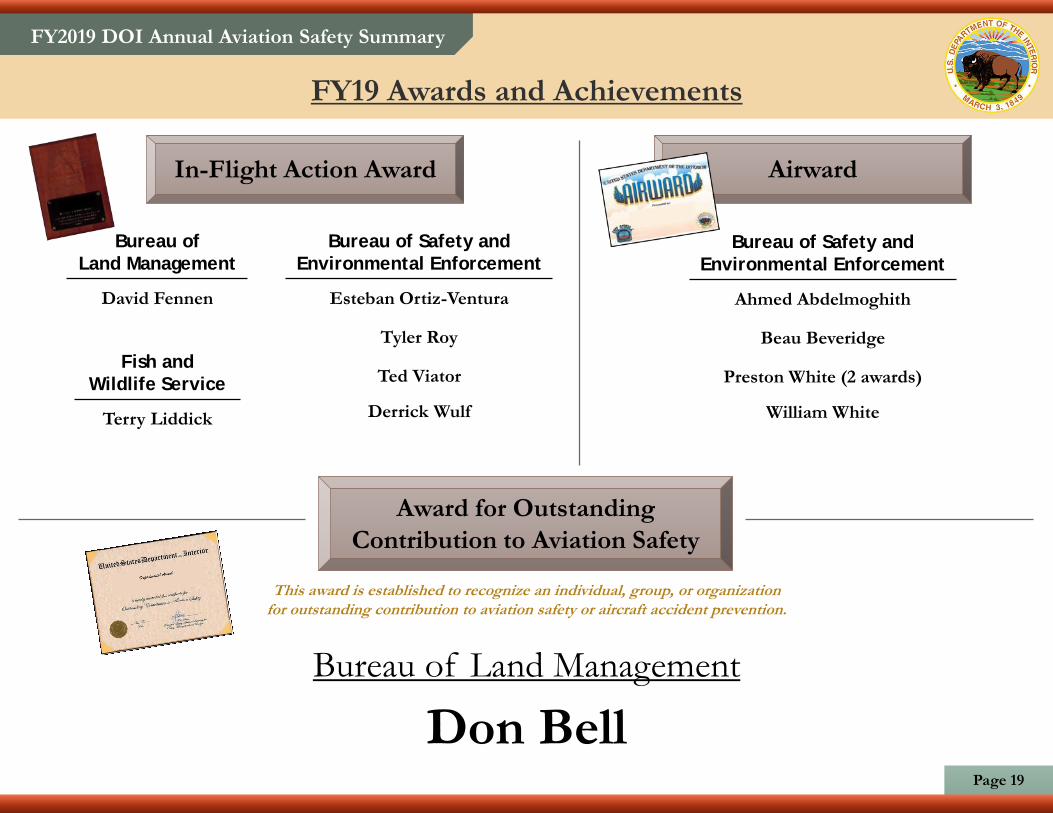
FY19 Awards and Achievements
Award for Outstanding
Contribution to Aviation Safety
Bureau of Safety and
Environmental Enforcement
Ahmed Abdelmoghith
Beau Beveridge
Preston White (2 awards)
William White
Bureau of
Land Management
David Fennen
In-Flight Action Award Airward
Fish and
Wildlife Service
Terry Liddick
Bureau of Safety and
Environmental Enforcement
Esteban Ortiz-Ventura
Tyler Roy
Ted Viator
Derrick Wulf
This award is established to recognize an individual, group, or organization for outstanding contribution to aviation safety or aircraft accident prevention.
Bureau of Land Management
Don Bell
FY2019 DOI Annual Aviation Safety Summary
Page 20
Bell, Steven
Capra, Jim
Enzfelder, Glen
Goodwin, Fred
Grenda, Adam
Hamon, Troy
Howell, Galen
Hummel, James
Larsen, Amy
Nigus, Brett
Richotte, Rich
Sample, Scott
Taylor, Scott
Thompson, Nick
Welty, Don
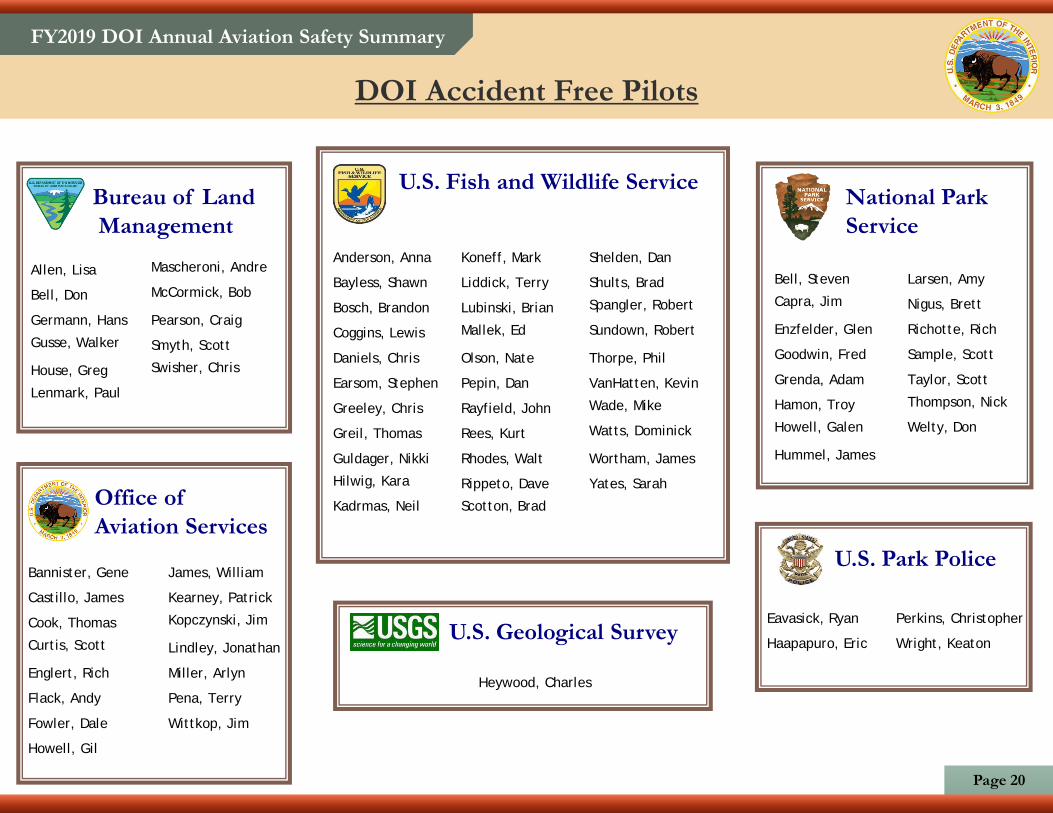
DOI Accident Free Pilots
Bureau of Land
Management
Office of
Aviation Services
U.S. Fish and Wildlife Service
U.S. Geological Survey
National Park
Service
U.S. Park Police
Heywood, Charles
Bannister, Gene
Castillo, James
Cook, Thomas
Curtis, Scott
Englert, Rich
Flack, Andy
Fowler, Dale
Howell, Gil
James, William
Kearney, Patrick
Kopczynski, Jim
Lindley, Jonathan
Miller, Arlyn
Pena, Terry
Wittkop, Jim
Anderson, Anna
Bayless, Shawn
Bosch, Brandon
Coggins, Lewis
Daniels, Chris
Earsom, Stephen
Greeley, Chris
Greil, Thomas
Guldager, Nikki
Hilwig, Kara
Kadrmas, Neil
Koneff, Mark
Liddick, Terry
Lubinski, Brian
Mallek, Ed
Olson, Nate
Pepin, Dan
Rayfield, John
Rees, Kurt
Rhodes, Walt
Rippeto, Dave
Scotton, Brad
Shelden, Dan
Shults, Brad
Spangler, Robert
Sundown, Robert
Thorpe, Phil
VanHatten, Kevin
Wade, Mike
Watts, Dominick
Wortham, James
Yates, Sarah
Allen, Lisa
Bell, Don
Germann, Hans
Gusse, Walker
House, Greg
Lenmark, Paul
Mascheroni, Andre
McCormick, Bob
Pearson, Craig
Smyth, Scott
Swisher, Chris
Eavasick, Ryan
Haapapuro, Eric
Perkins, Christopher
Wright, Keaton
FY2019 DOI Annual Aviation Safety Summary
Page 21
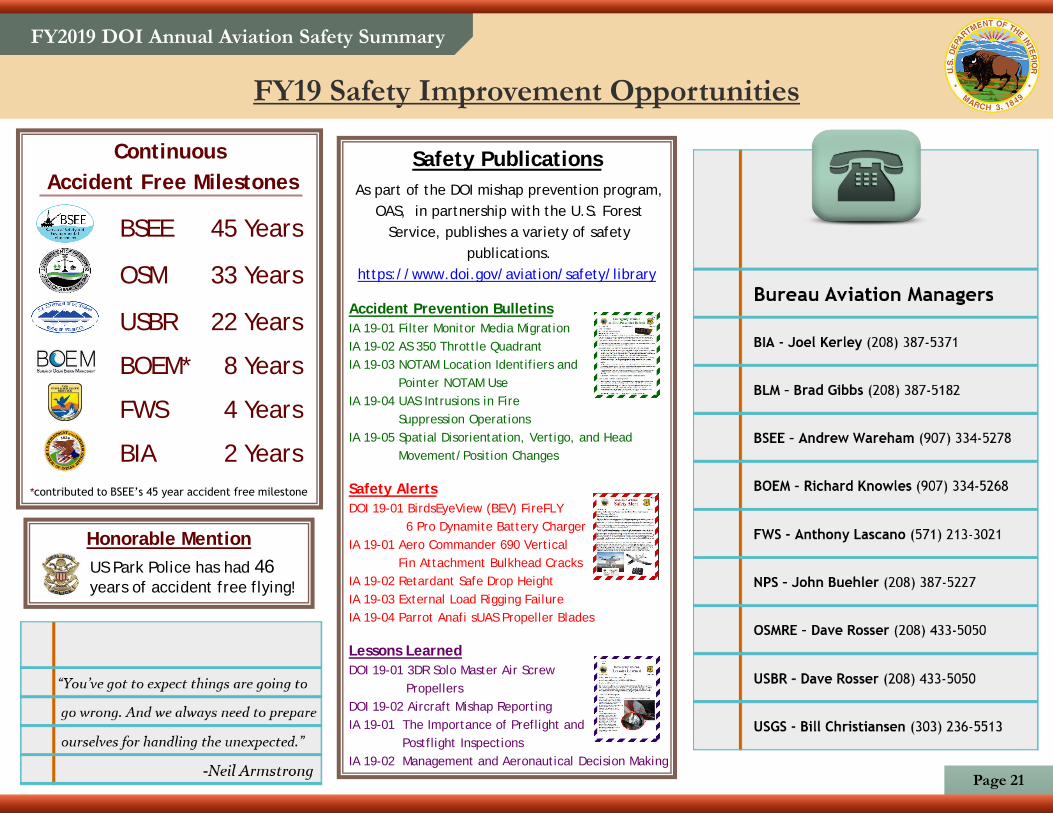
Safety Publications
As part of the DOI mishap prevention program,
OAS, in partnership with the U.S. Forest
Service, publishes a variety of safety
publications.
https://www.doi.gov/aviation/safety/library
Accident Prevention Bulletins
IA 19-01 Filter Monitor Media Migration
IA 19-02 AS 350 Throttle Quadrant
IA 19-03 NOTAM Location Identifiers and
Pointer NOTAM Use
IA 19-04 UAS Intrusions in Fire
Suppression Operations
IA 19-05 Spatial Disorientation, Vertigo, and Head
Movement/Position Changes
Safety Alerts
DOI 19-01 BirdsEyeView (BEV) FireFLY
6 Pro Dynamite Battery Charger
IA 19-01 Aero Commander 690 Vertical
Fin Attachment Bulkhead Cracks
IA 19-02 Retardant Safe Drop Height
IA 19-03 External Load Rigging Failure
IA 19-04 Parrot Anafi sUAS Propeller Blades
Lessons Learned
DOI 19-01 3DR Solo Master Air Screw
Propellers
DOI 19-02 Aircraft Mishap Reporting
IA 19-01 The Importance of Preflight and
Postflight Inspections
IA 19-02 Management and Aeronautical Decision Making
FY19 Safety Improvement Opportunities
Continuous
Accident Free Milestones
BSEE 45 Years
OSM 33 Years
USBR 22 Years
BOEM* 8 Years
FWS 4 Years
BIA 2 Years
*contributed to BSEE’s 45 year accident free milestone
Honorable Mention
US Park Police has had 46years of accident free flying!
FY2019 DOI Annual Aviation Safety Summary
Page 22
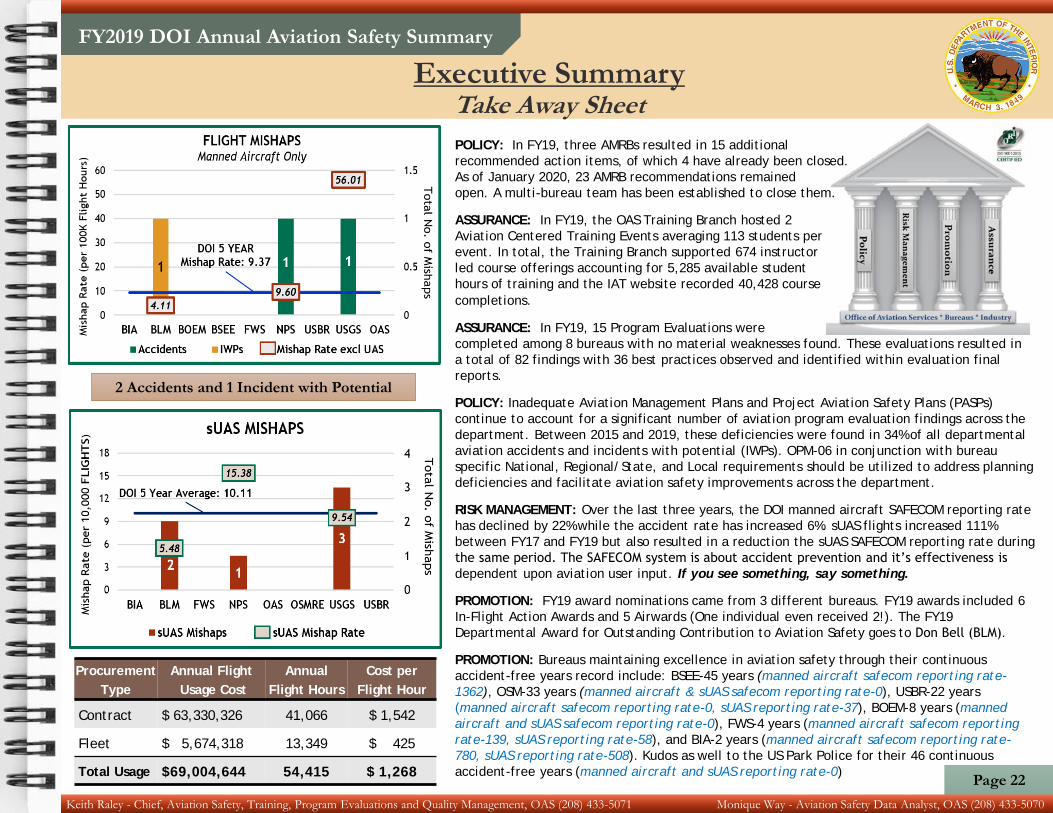
POLICY: In FY19, three AMRBs resulted in 15 additional
recommended action items, of which 4 have already been closed.
As of January 2020, 23 AMRB recommendations remained
open. A multi-bureau team has been established to close them.
ASSURANCE: In FY19, the OAS Training Branch hosted 2
Aviation Centered Training Events averaging 113 students per
event. In total, the Training Branch supported 674 instructor
led course offerings accounting for 5,285 available student
hours of training and the IAT website recorded 40,428 course
completions.
ASSURANCE: In FY19, 15 Program Evaluations were
completed among 8 bureaus with no material weaknesses found. These evaluations resulted in
a total of 82 findings with 36 best practices observed and identified within evaluation final
reports.
POLICY: Inadequate Aviation Management Plans and Project Aviation Safety Plans (PASPs)
continue to account for a significant number of aviation program evaluation findings across the
department. Between 2015 and 2019, these deficiencies were found in 34% of all departmental
aviation accidents and incidents with potential (IWPs). OPM-06 in conjunction with bureau
specific National, Regional/State, and Local requirements should be utilized to address planning
deficiencies and facilitate aviation safety improvements across the department.
RISK MANAGEMENT: Over the last three years, the DOI manned aircraft SAFECOM reporting rate
has declined by 22% while the accident rate has increased 6%. sUAS flights increased 111%
between FY17 and FY19 but also resulted in a reduction the sUAS SAFECOM reporting rate during
the same period. The SAFECOM system is about accident prevention and it’s effectiveness is
dependent upon aviation user input. If you see something, say something.
PROMOTION: FY19 award nominations came from 3 different bureaus. FY19 awards included 6
In-Flight Action Awards and 5 Airwards (One individual even received 2!). The FY19
Departmental Award for Outstanding Contribution to Aviation Safety goes to Don Bell (BLM).
PROMOTION: Bureaus maintaining excellence in aviation safety through their continuous
accident-free years record include: BSEE-45 years (manned aircraft safecom reporting rate-
1362), OSM-33 years (manned aircraft & sUAS safecom reporting rate-0), USBR-22 years
(manned aircraft safecom reporting rate-0, sUAS reporting rate-37), BOEM-8 years (manned
aircraft and sUAS safecom reporting rate-0), FWS-4 years (manned aircraft safecom reporting
rate-139, sUAS reporting rate-58), and BIA-2 years (manned aircraft safecom reporting rate-
780, sUAS reporting rate-508). Kudos as well to the US Park Police for their 46 continuous
accident-free years (manned aircraft and sUAS reporting rate-0)
Executive SummaryTake Away Sheet
Keith Raley - Chief, Aviation Safety, Training, Program Evaluations and Quality Management, OAS (208) 433-5071 Monique Way - Aviation Safety Data Analyst, OAS (208) 433-5070
2 Accidents and 1 Incident with Potential
Procurement
Type
Annual Flight
Usage Cost
Annual
Flight Hours
Cost per
Flight Hour
Contract $ 63,330,326 41,066 $ 1,542
Fleet $ 5,674,318 13,349 $ 425
Total Usage $69,004,644 54,415 $ 1,268