fy21 unaudited results
TRANSCRIPT
FY21 Unaudited Results
Joe Fitzgerald, Acting Group Chief Financial Officer
7 July 2021

Executive Chairman Introduction
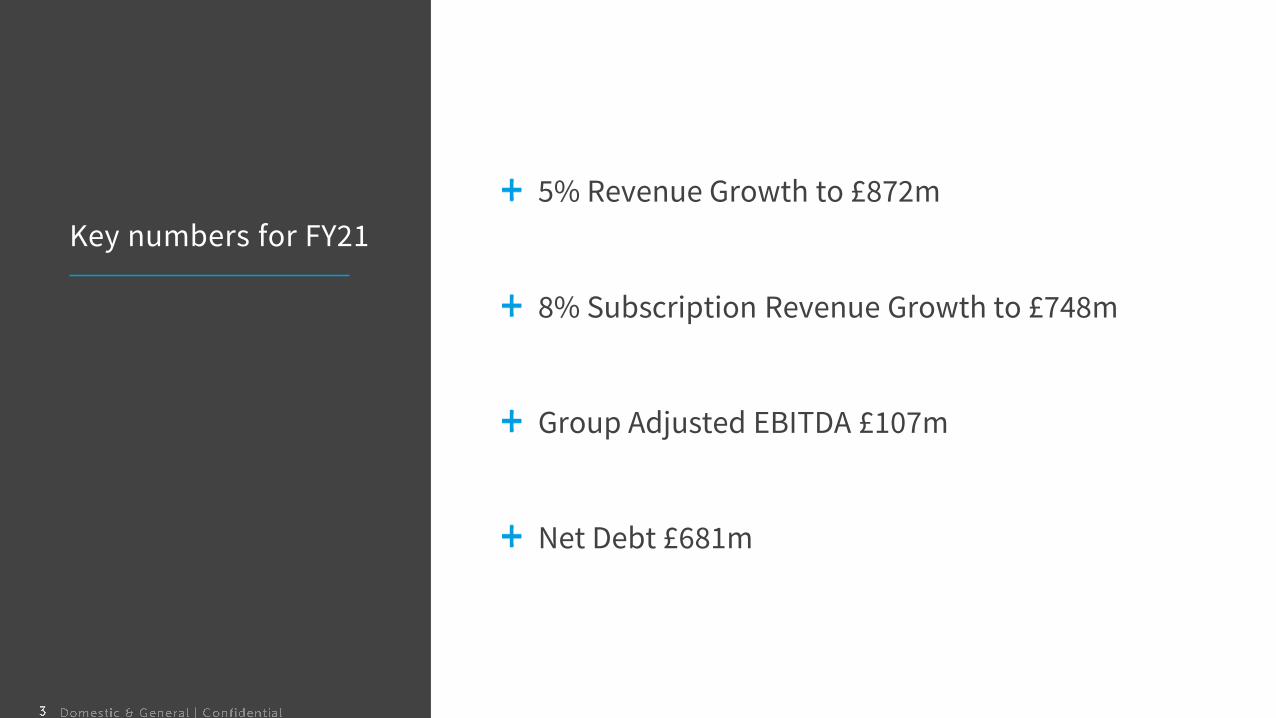
Key numbers for FY21
5% Revenue Growth to £872m
8% Subscription Revenue Growth to £748m
Group Adjusted EBITDA £107m
Net Debt £681m
About D&G
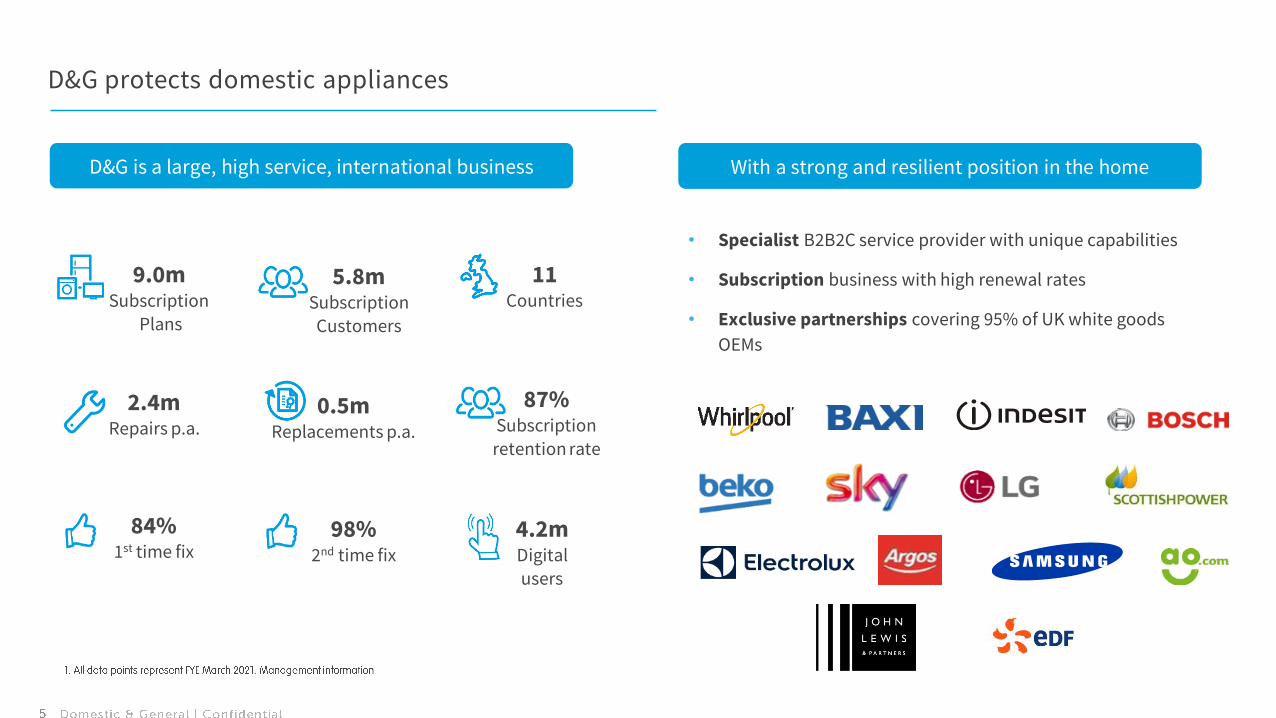
• Specialist B2B2C service provider with unique capabilities
• Subscription business with high renewal rates
• Exclusive partnerships covering 95% of UK white goods
OEMs
D&G protects domestic appliances
D&G is a large, high service, international business With a strong and resilient position in the home
9.0mSubscription
Plans
5.8mSubscription
Customers
11Countries
0.5mReplacements p.a.
2.4mRepairs p.a.
98% 2nd time fix
4.2m Digital users
87% Subscription retention rate
84%1st time fix
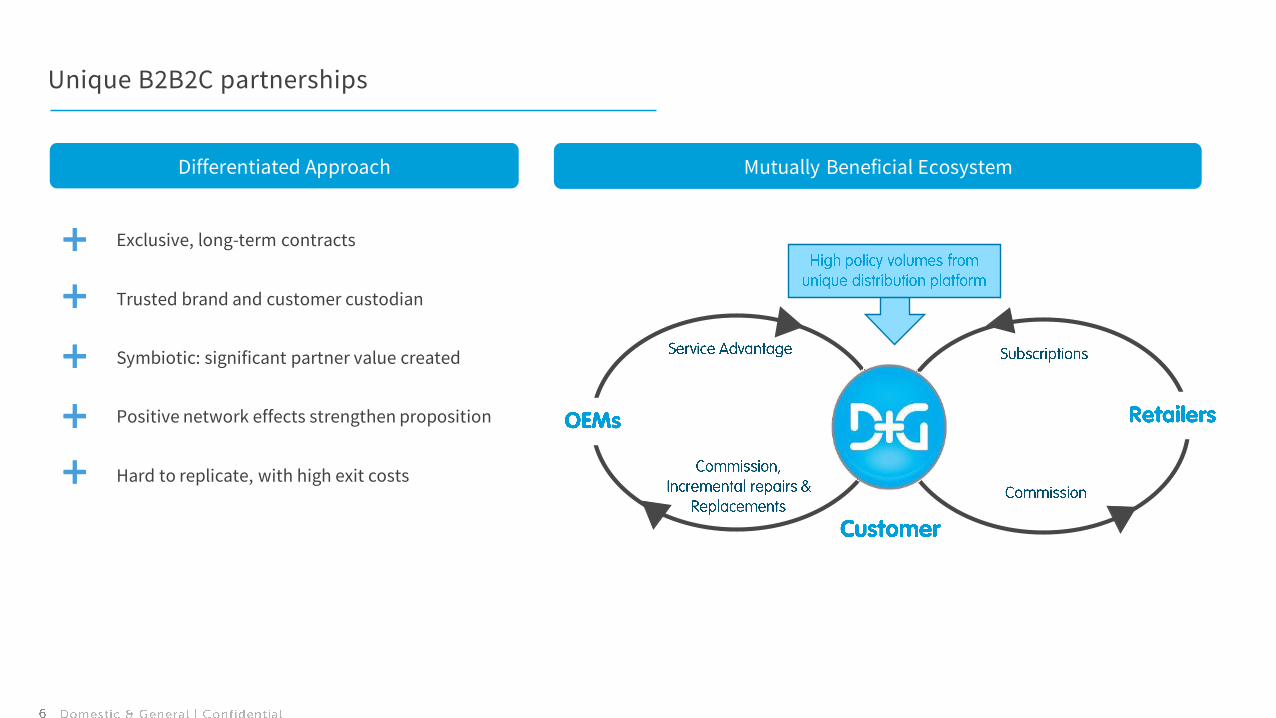
• Exclusive, long-term contracts
• Trusted brand and customer custodian
• Symbiotic: significant partner value created
• Positive network effects strengthen proposition
• Hard to replicate, with high exit costs
Unique B2B2C partnerships
Differentiated Approach Mutually Beneficial Ecosystem
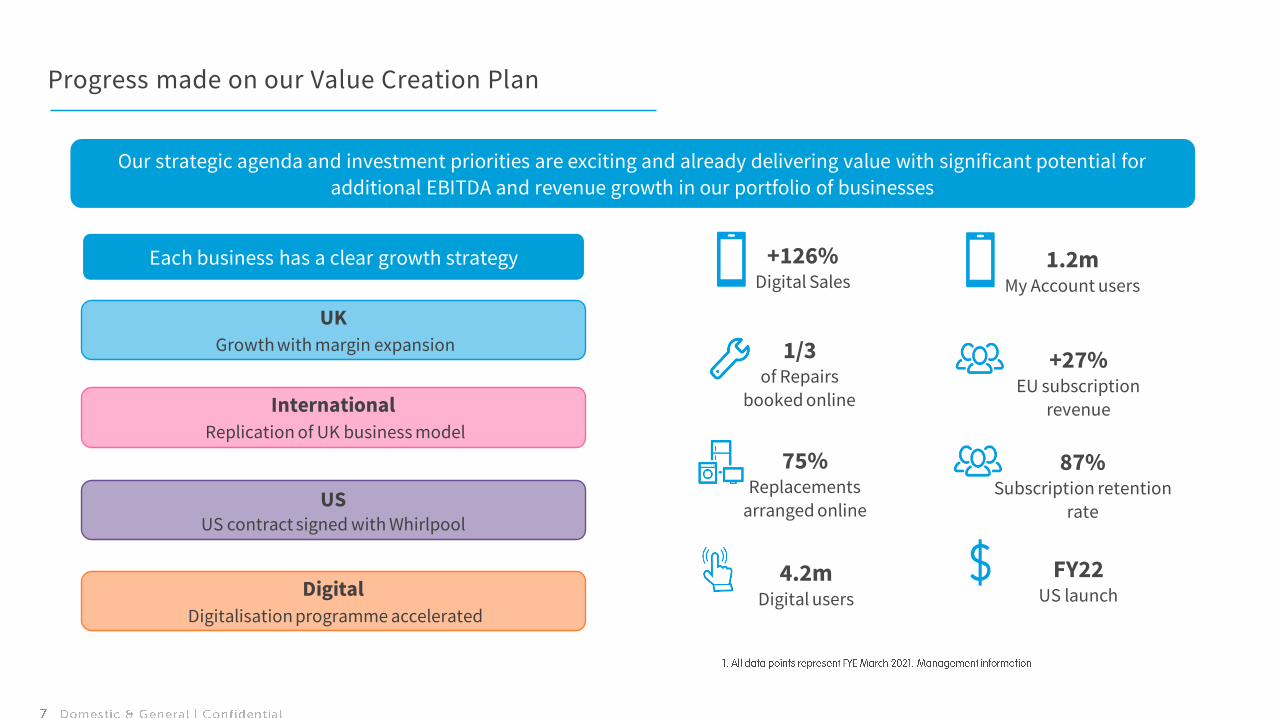
Progress made on our Value Creation Plan
Our strategic agenda and investment priorities are exciting and already delivering value with significant potential for
additional EBITDA and revenue growth in our portfolio of businesses
+126%Digital Sales
FY22US launch
1.2mMy Account users
+27%EU subscription
revenue
1/3of Repairs
booked online
4.2m Digital users
87% Subscription retention
rate
75%Replacements
arranged online
UKGrowth with margin expansion
InternationalReplication of UK business model
USUS contract signed with Whirlpool
DigitalDigitalisation programme accelerated
Each business has a clear growth strategy
FY21
Further growth and resilience
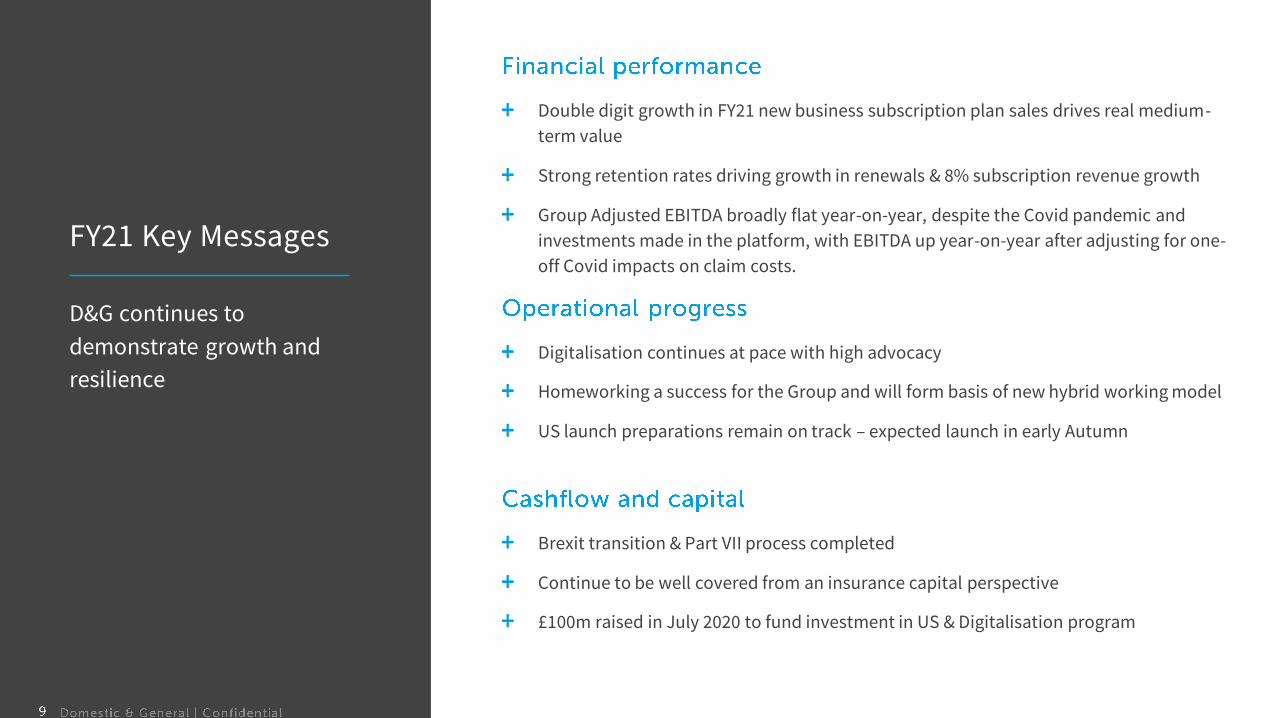
FY21 Key Messages
D&G continues to
demonstrate growth and
resilience
Double digit growth in FY21 new business subscription plan sales drives real medium-
term value
Strong retention rates driving growth in renewals & 8% subscription revenue growth
Group Adjusted EBITDA broadly flat year-on-year, despite the Covid pandemic and
investments made in the platform, with EBITDA up year-on-year after adjusting for one-
off Covid impacts on claim costs.
Digitalisation continues at pace with high advocacy
Homeworking a success for the Group and will form basis of new hybrid working model
US launch preparations remain on track – expected launch in early Autumn
Brexit transition & Part VII process completed
Continue to be well covered from an insurance capital perspective
£100m raised in July 2020 to fund investment in US & Digitalisation program
Brexit
We have safely transitioned the
business and have a platform
for growth
Part VII transfer from DGI to DGIEU successfully completed on 31 December 2020
Group capital coverage ratio and cash (distributable reserves) reduced by Part VII
transfer, reflecting investment to capitalise German regulated entity.
Strong capital coverage ratios in both DGI and DGIEU
Mitigated effects of “non-equivalence” on our solvency position
Platform to continue growth in our European territories
Covid
Strong and resilient
performance whilst delivering
excellent service
Our service model is industry leading - full service maintained throughout the
pandemic
Incurred costs to maintain service (supply chain issues)
Customer retention levels - strong throughout the year
Homeworking a great success and will form the basis of a hybrid working model in
future
Our business model allowed us to take advantage of the change in customer buying
habits and the move to online
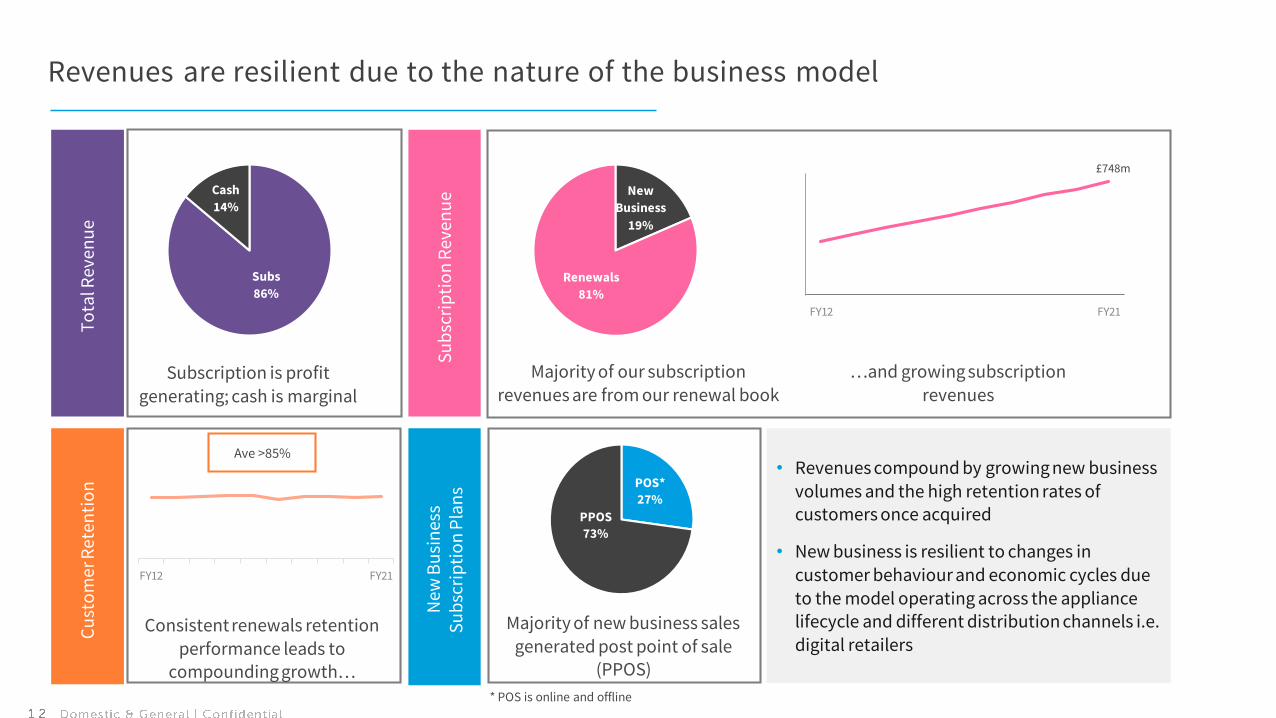
Revenues are resilient due to the nature of the business model
Su
bsc
rip
tio
n R
even
ue
Cu
sto
mer
Ret
enti
on
New
Bu
sin
ess
Su
bsc
rip
tio
n P
lan
s
Subscription is profit generating; cash is marginal
To
tal R
even
ue
New
Business
19%
Renewals
81%
• Revenues compound by growing new business volumes and the high retention rates of customers once acquired
• New business is resilient to changes in customer behaviour and economic cycles due to the model operating across the appliance lifecycle and different distribution channels i.e. digital retailers
Majority of our subscription revenues are from our renewal book
…and growing subscription revenues
Consistent renewals retention performance leads to
compounding growth…
Majority of new business sales
generated post point of sale (PPOS)
Ave >85%
Subs
86%
Cash
14%
FY12 FY21
FY12 FY21
PPOS
73%
POS*
27%
* POS is online and offline
£748m
Q1 Q2 Q3 Q4 FY
FY20 FY21
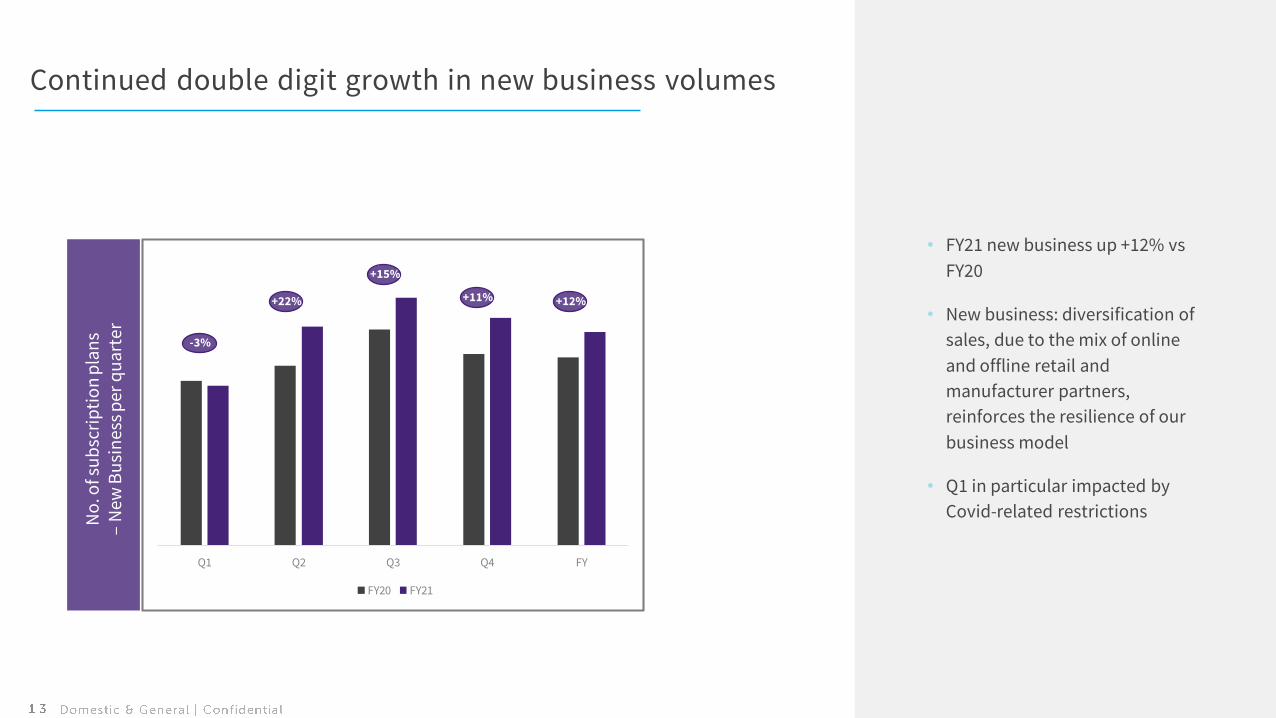
Continued double digit growth in new business volumes
• FY21 new business up +12% vs
FY20
• New business: diversification of
sales, due to the mix of online
and offline retail and
manufacturer partners,
reinforces the resilience of our
business model
• Q1 in particular impacted by
Covid-related restrictionsNo
. of s
ub
scri
pti
on
pla
ns
–N
ew B
usi
nes
s p
er q
uar
ter
-3%
+22%
+15%
+11% +12%
Q1 Q2 Q3 Q4 FY
FY20 FY21
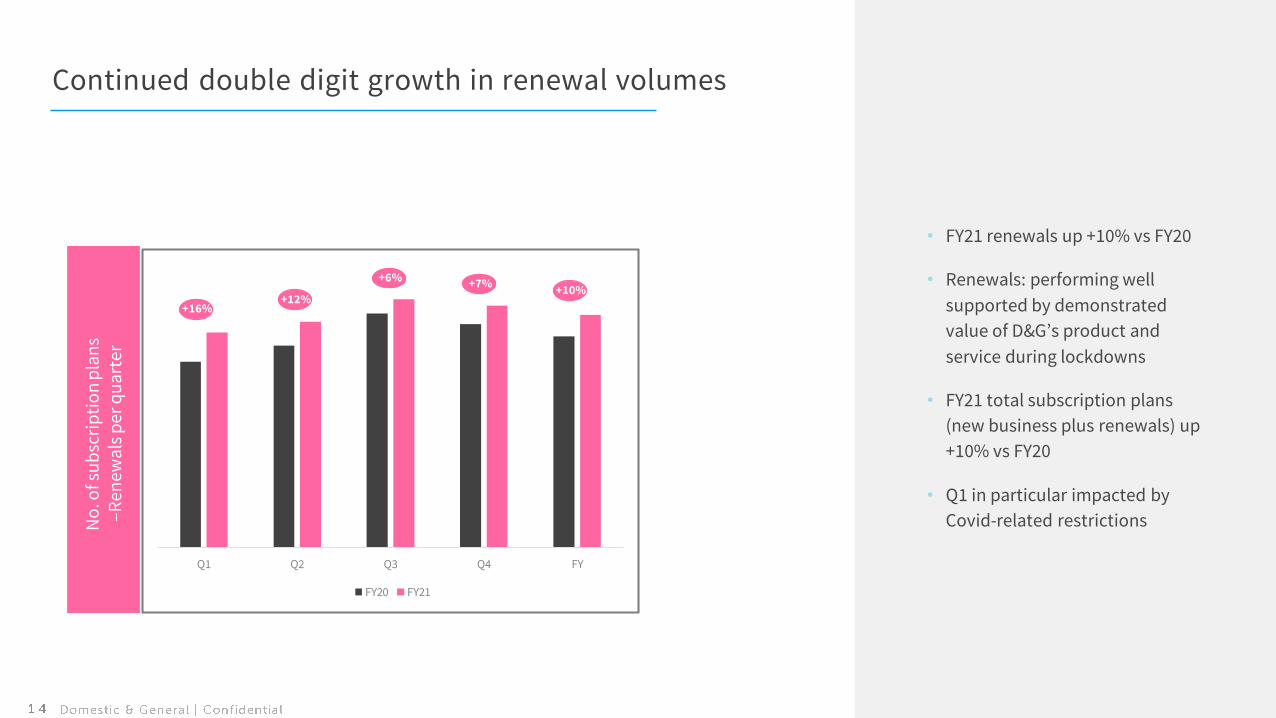
Continued double digit growth in renewal volumes
• FY21 renewals up +10% vs FY20
• Renewals: performing well
supported by demonstrated
value of D&G’s product and
service during lockdowns
• FY21 total subscription plans
(new business plus renewals) up
+10% vs FY20
• Q1 in particular impacted by
Covid-related restrictionsNo
. of s
ub
scri
pti
on
pla
ns
–Ren
ewa
ls p
er q
ua
rter
+16%+12%
+6% +7%+10%
Q1 Q2 Q3 Q4 FY
FY20 FY21
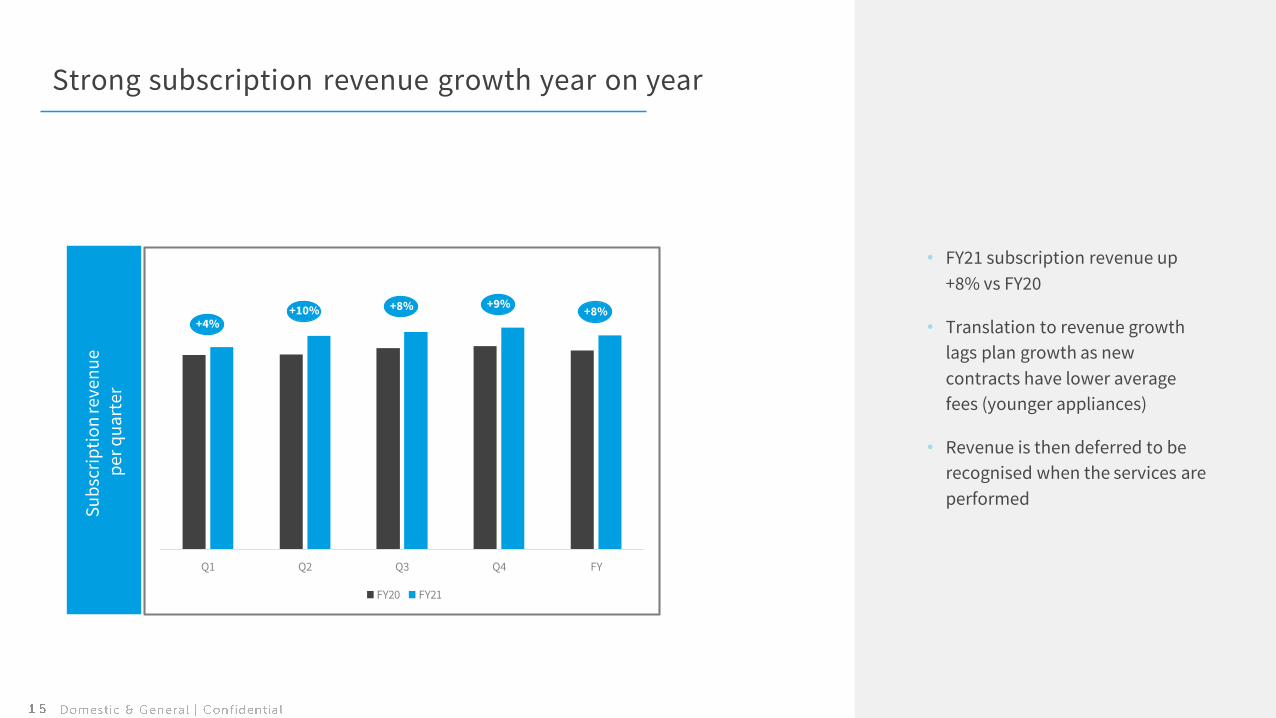
Strong subscription revenue growth year on year
• FY21 subscription revenue up
+8% vs FY20
• Translation to revenue growth
lags plan growth as new
contracts have lower average
fees (younger appliances)
• Revenue is then deferred to be
recognised when the services are
performed
Su
bsc
rip
tio
n re
ven
ue
per
qu
art
er
+4%+10% +8% +9%
+8%
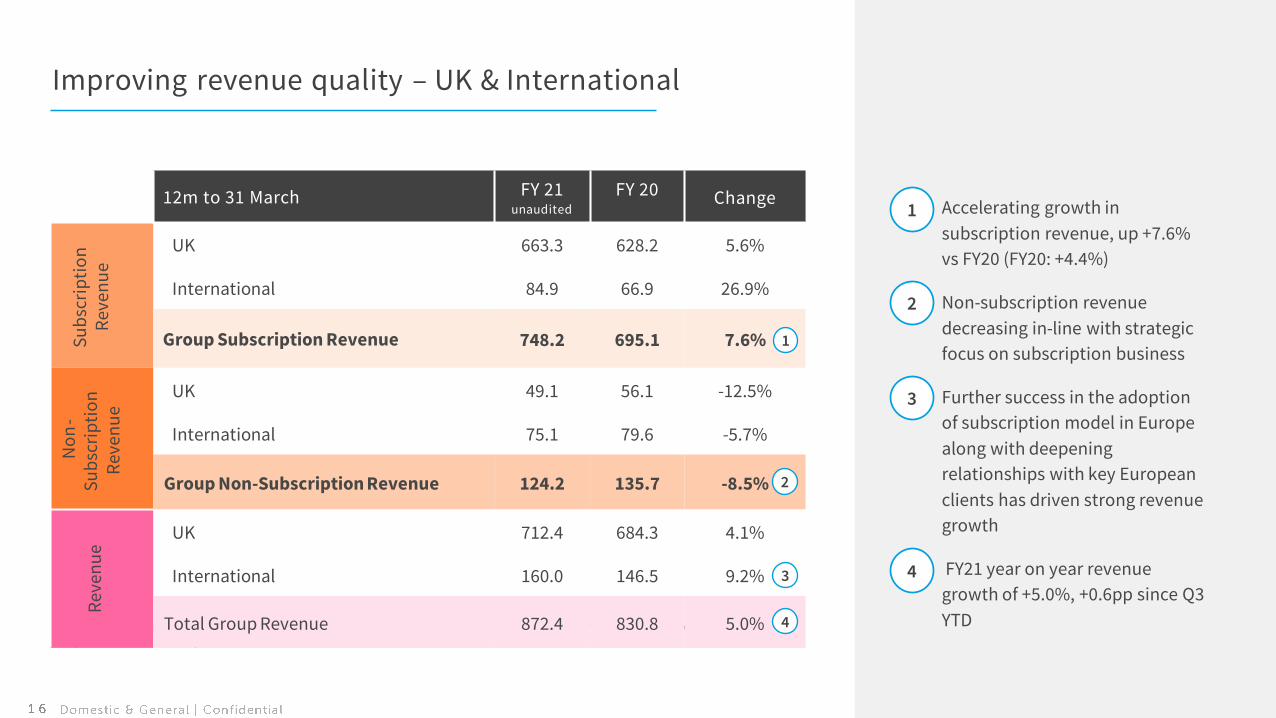
Improving revenue quality – UK & International
*Distributable reserves comprise net income of Regulated Business before significant items and as adjusted for changes in capital requirements and Solvency II valuation differences
12m to 31 March FY 21unaudited
FY 20 Change
Su
bsc
rip
tio
n
Rev
enu
e
UK 663.3 628.2 5.6%
International 84.9 66.9 26.9%
Group Subscription Revenue 748.2 695.1 7.6%
No
n-
Su
bsc
rip
tio
n
Rev
enu
e
UK 49.1 56.1 -12.5%
International 75.1 79.6 -5.7%
Group Non-Subscription Revenue 124.2 135.7 -8.5%
Rev
enu
e
UK 712.4 684.3 4.1%
International 160.0 146.5 9.2%
Total Group Revenue 872.4 830.8 5.0%
• Accelerating growth in
subscription revenue, up +7.6%
vs FY20 (FY20: +4.4%)
• Non-subscription revenue
decreasing in-line with strategic
focus on subscription business
• Further success in the adoption
of subscription model in Europe
along with deepening
relationships with key European
clients has driven strong revenue
growth
• FY21 year on year revenue
growth of +5.0%, +0.6pp since Q3
YTD
1
2
3
4
1
2
3
4
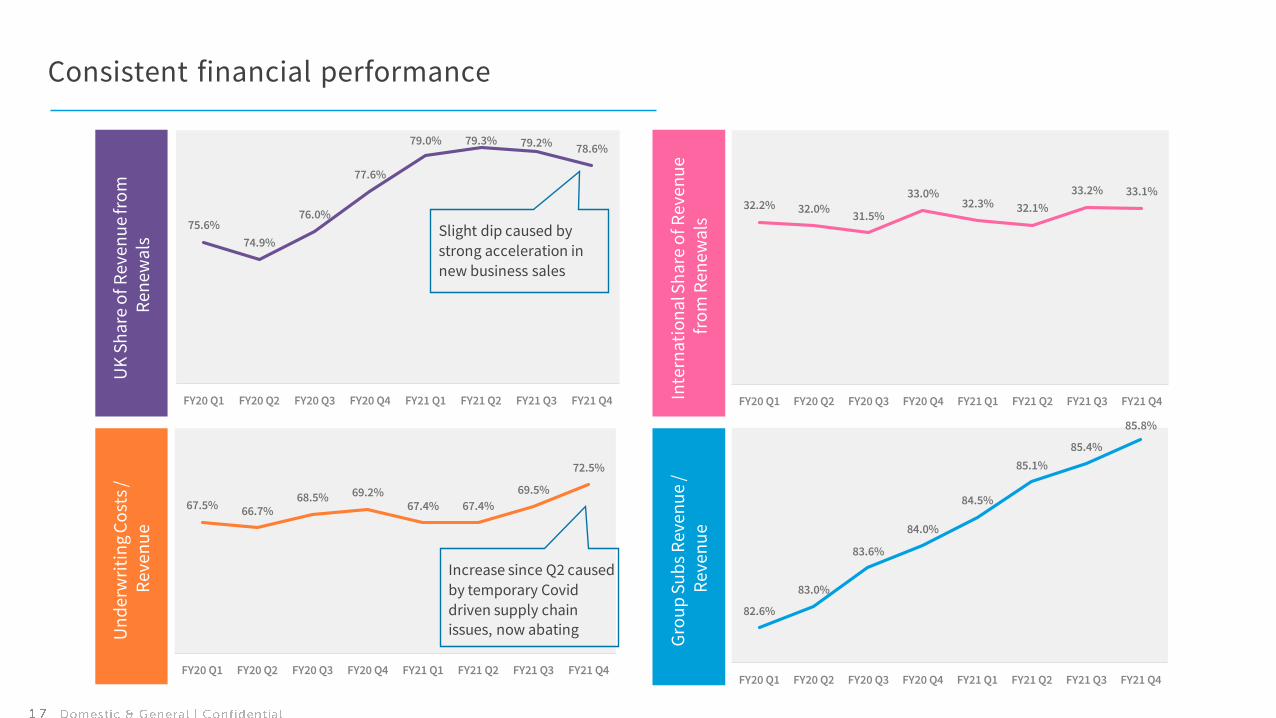
Consistent financial performance
UK
Sh
are
of R
even
ue
fro
m
Ren
ewal
s
Inte
rna
tio
na
l Sh
are
of R
even
ue
fro
m R
enew
als
Un
der
wri
tin
g C
ost
s /
Rev
enu
e
Gro
up
Su
bs
Rev
enu
e /
Rev
enu
e
75.6%
74.9%
76.0%
77.6%
79.0% 79.3% 79.2% 78.6%
FY20 Q1 FY20 Q2 FY20 Q3 FY20 Q4 FY21 Q1 FY21 Q2 FY21 Q3 FY21 Q4
32.2% 32.0%31.5%
33.0%32.3% 32.1%
33.2% 33.1%
FY20 Q1 FY20 Q2 FY20 Q3 FY20 Q4 FY21 Q1 FY21 Q2 FY21 Q3 FY21 Q4
67.5% 66.7%68.5% 69.2%
67.4% 67.4%
69.5%
72.5%
FY20 Q1 FY20 Q2 FY20 Q3 FY20 Q4 FY21 Q1 FY21 Q2 FY21 Q3 FY21 Q4
82.6%
83.0%
83.6%
84.0%
84.5%
85.1%
85.4%
85.8%
FY20 Q1 FY20 Q2 FY20 Q3 FY20 Q4 FY21 Q1 FY21 Q2 FY21 Q3 FY21 Q4
Slight dip caused by
strong acceleration in
new business sales
Increase since Q2 caused
by temporary Covid
driven supply chain issues, now abating
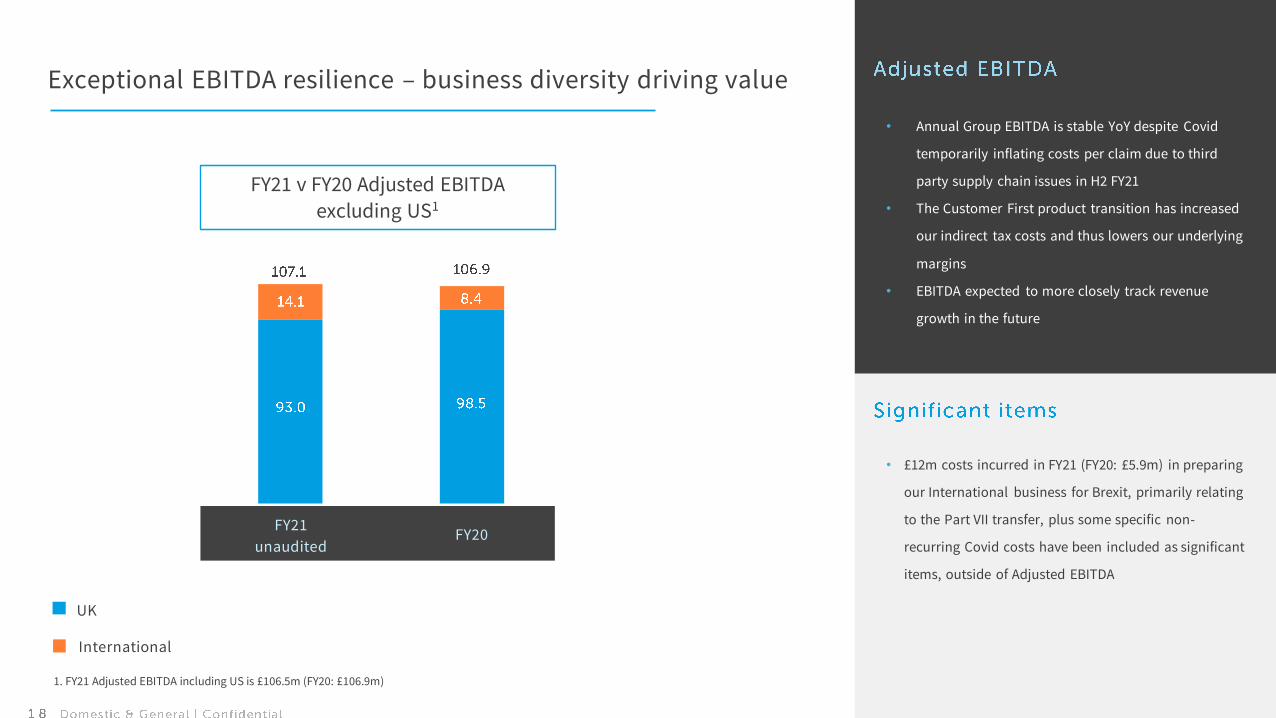
Exceptional EBITDA resilience – business diversity driving value
• Annual Group EBITDA is stable YoY despite Covid
temporarily inflating costs per claim due to third
party supply chain issues in H2 FY21
• The Customer First product transition has increased
our indirect tax costs and thus lowers our underlying
margins
• EBITDA expected to more closely track revenue
growth in the future
• £12m costs incurred in FY21 (FY20: £5.9m) in preparing
our International business for Brexit, primarily relating
to the Part VII transfer, plus some specific non-
recurring Covid costs have been included as significant
items, outside of Adjusted EBITDA
FY21 v FY20 Adjusted EBITDA
excluding US1
FY21
unauditedFY20
UK
International
1. FY21 Adjusted EBITDA including US is £106.5m (FY20: £106.9m)

Cashflow
& capitalisation
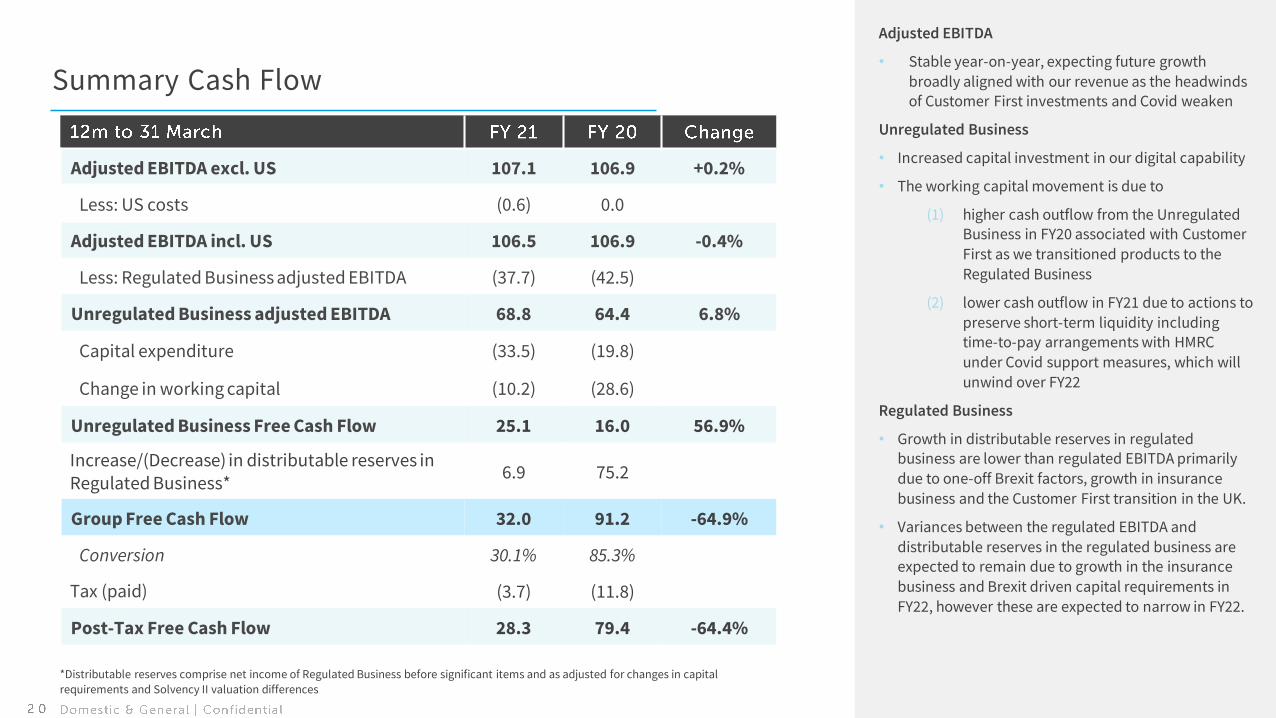
Summary Cash Flow
Adjusted EBITDA excl. US 107.1 106.9 +0.2%
Less: US costs (0.6) 0.0
Adjusted EBITDA incl. US 106.5 106.9 -0.4%
Less: Regulated Business adjusted EBITDA (37.7) (42.5)
Unregulated Business adjusted EBITDA 68.8 64.4 6.8%
Capital expenditure (33.5) (19.8)
Change in working capital (10.2) (28.6)
Unregulated Business Free Cash Flow 25.1 16.0 56.9%
Increase/(Decrease) in distributable reserves inRegulated Business*
6.9 75.2
Group Free Cash Flow 32.0 91.2 -64.9%
Conversion 30.1% 85.3%
Tax (paid) (3.7) (11.8)
Post-Tax Free Cash Flow 28.3 79.4 -64.4%
Adjusted EBITDA
• Stable year-on-year, expecting future growth
broadly aligned with our revenue as the headwinds of Customer First investments and Covid weaken
Unregulated Business
• Increased capital investment in our digital capability
• The working capital movement is due to
(1) higher cash outflow from the Unregulated Business in FY20 associated with Customer
First as we transitioned products to the
Regulated Business
(2) lower cash outflow in FY21 due to actions to
preserve short-term liquidity including time-to-pay arrangements with HMRC
under Covid support measures, which will
unwind over FY22
Regulated Business
• Growth in distributable reserves in regulated business are lower than regulated EBITDA primarily
due to one-off Brexit factors, growth in insurance
business and the Customer First transition in the UK.
• Variances between the regulated EBITDA and
distributable reserves in the regulated business are expected to remain due to growth in the insurance
business and Brexit driven capital requirements in
FY22, however these are expected to narrow in FY22.
*Distributable reserves comprise net income of Regulated Business before significant items and as adjusted for changes in capital requirements and Solvency II valuation differences
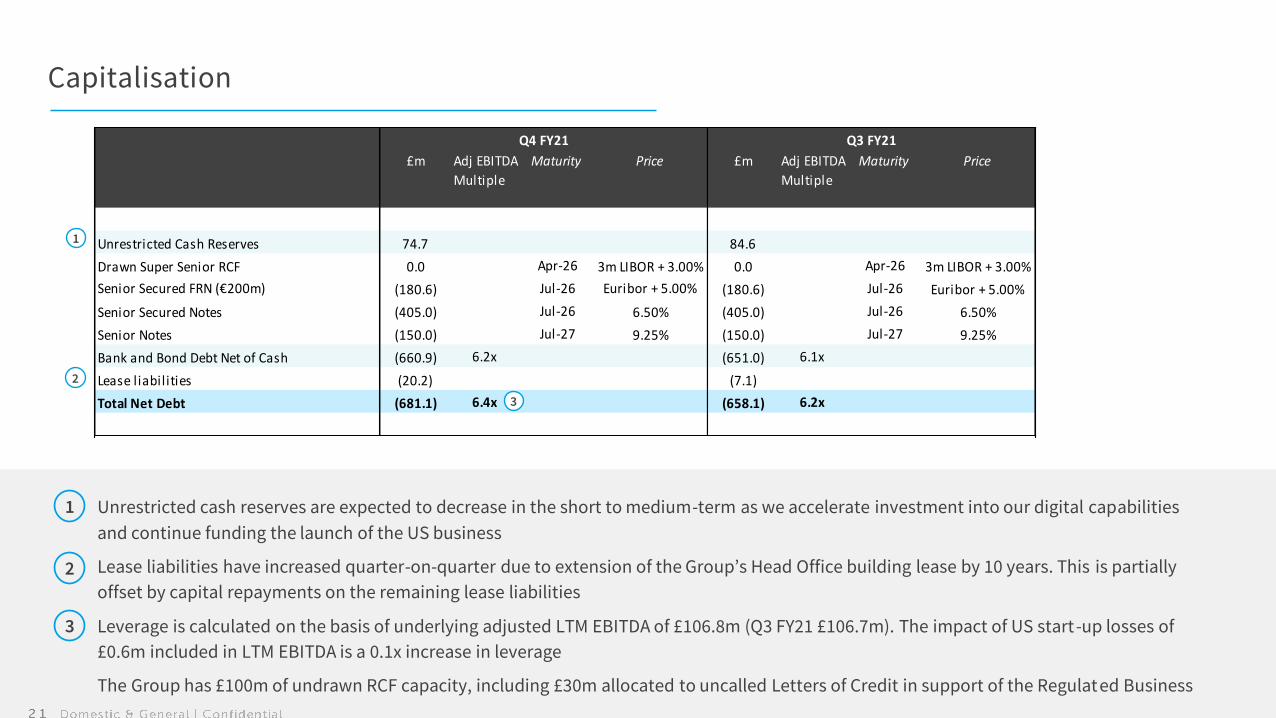
Adj EBITDA
Multiple
Adj EBITDA
Multiple
Unrestricted Cash Reserves 74.7 84.6
Drawn Super Senior RCF 0.0 Apr-26 3m LIBOR + 3.00% 0.0 Apr-26 3m LIBOR + 3.00%
Senior Secured FRN (€200m) (180.6) Jul-26 Euribor + 5.00% (180.6) Jul-26 Euribor + 5.00%
Senior Secured Notes (405.0) Jul-26 6.50% (405.0) Jul-26 6.50%
Senior Notes (150.0) Jul-27 9.25% (150.0) Jul-27 9.25%
Bank and Bond Debt Net of Cash (660.9) 6.2x (651.0) 6.1x
Lease liabilities (20.2) (7.1)
Total Net Debt (681.1) 6.4x (658.1) 6.2x
Maturity
Q4 FY21 Q3 FY21
£m £m Price Maturity Price
Capitalisation
Unrestricted cash reserves are expected to decrease in the short to medium-term as we accelerate investment into our digital capabilities
and continue funding the launch of the US business
Lease liabilities have increased quarter-on-quarter due to extension of the Group’s Head Office building lease by 10 years. This is partially
offset by capital repayments on the remaining lease liabilities
Leverage is calculated on the basis of underlying adjusted LTM EBITDA of £106.8m (Q3 FY21 £106.7m). The impact of US start-up losses of
£0.6m included in LTM EBITDA is a 0.1x increase in leverage
The Group has £100m of undrawn RCF capacity, including £30m allocated to uncalled Letters of Credit in support of the Regulat ed Business
1
2
1
2
3
3
FY21 Summary
A positive year where the
resilience and strength of our
business model allowed us to
grow our revenues and we
made significant progress on
our strategic agenda
Strong new business and retention rates enabled +10% subscription plan
sales growth
International growth particularly encouraging
Stable EBITDA in the face of headwinds
Significant progress on our digital programme
Expected US launch in FY22
Well capitalised with significant headroom
Appendix
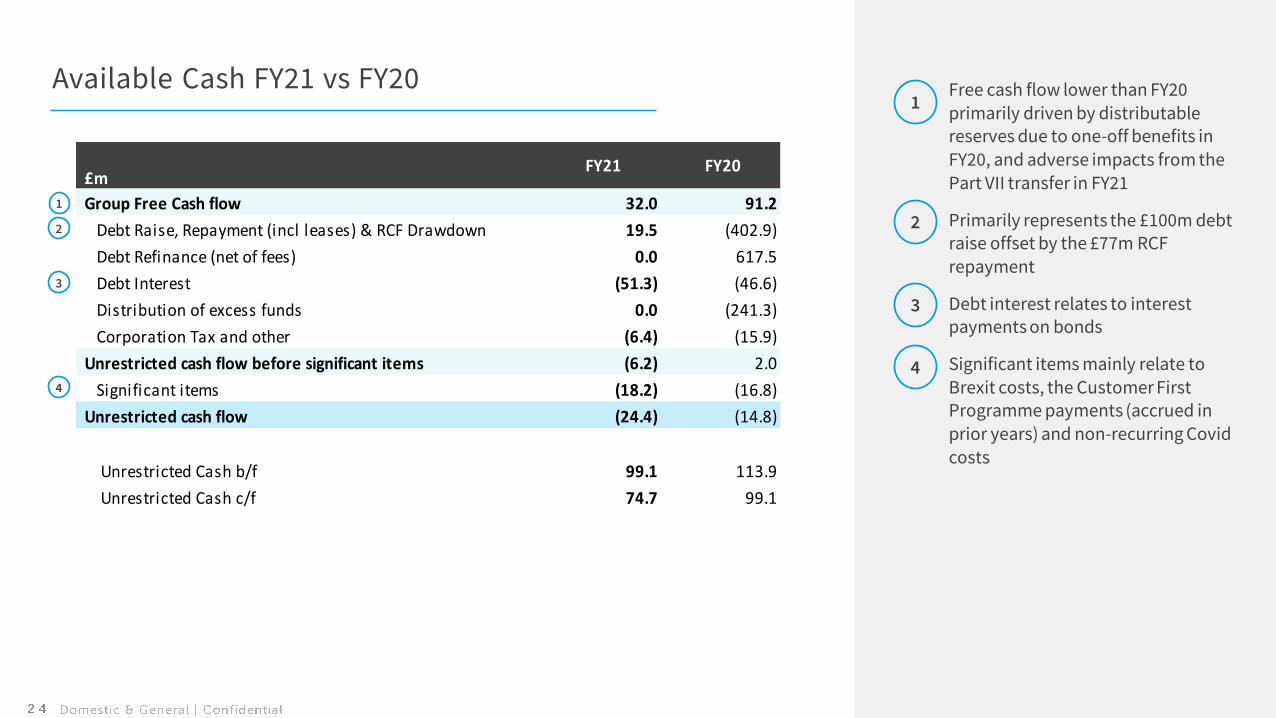
Available Cash FY21 vs FY20 • Free cash flow lower than FY20 primarily driven by distributable reserves due to one-off benefits in FY20, and adverse impacts from the Part VII transfer in FY21
• Primarily represents the £100m debt raise offset by the £77m RCF repayment
• Debt interest relates to interest payments on bonds
• Significant items mainly relate to Brexit costs, the Customer First Programme payments (accrued in prior years) and non-recurring Covid costs
1
2
3
4
1
2
3
4
£m
Group Free Cash flow 32.0 91.2
Debt Raise, Repayment (incl leases) & RCF Drawdown 19.5 (402.9)
Debt Refinance (net of fees) 0.0 617.5
Debt Interest (51.3) (46.6)
Distribution of excess funds 0.0 (241.3)
Corporation Tax and other (6.4) (15.9)
Unrestricted cash flow before significant items (6.2) 2.0
Significant items (18.2) (16.8)
Unrestricted cash flow (24.4) (14.8)
Unrestricted Cash b/f 99.1 113.9
Unrestricted Cash c/f 74.7 99.1
FY21 FY20
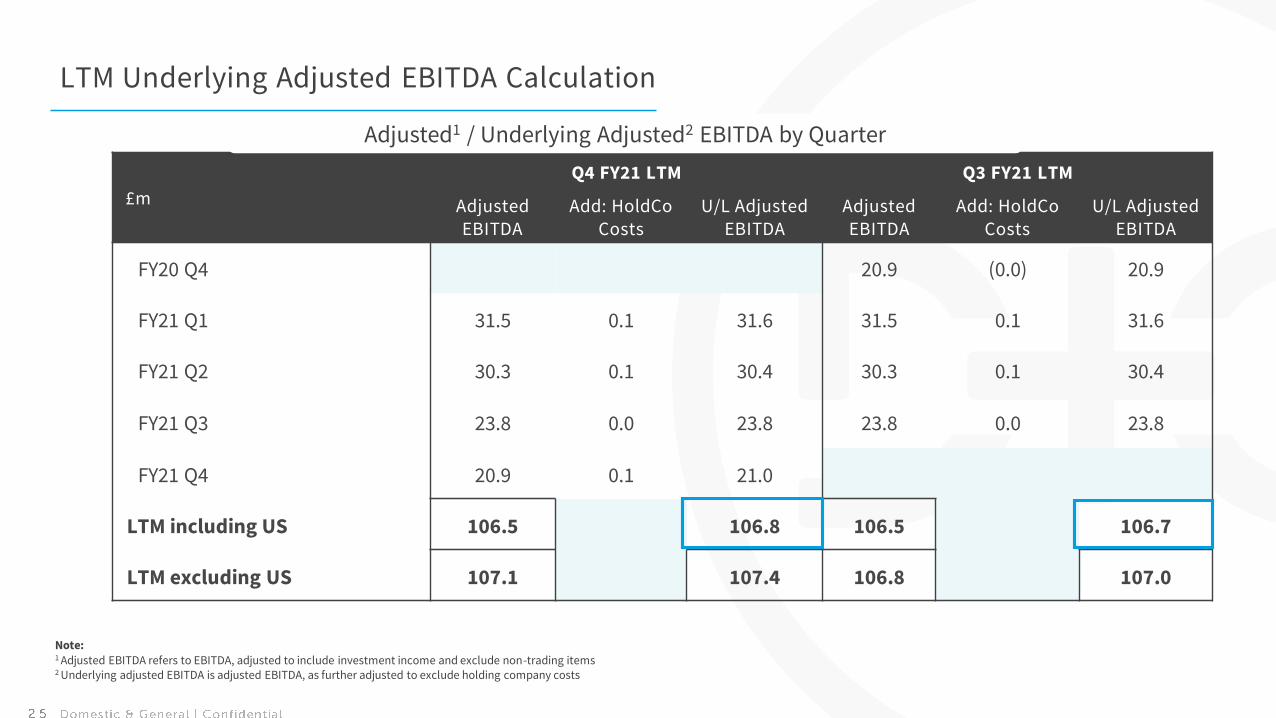
LTM Underlying Adjusted EBITDA Calculation
£m
Q4 FY21 LTM Q3 FY21 LTM
Adjusted EBITDA
Add: HoldCo Costs
U/L Adjusted EBITDA
Adjusted EBITDA
Add: HoldCo Costs
U/L Adjusted EBITDA
FY20 Q4 20.9 (0.0) 20.9
FY21 Q1 31.5 0.1 31.6 31.5 0.1 31.6
FY21 Q2 30.3 0.1 30.4 30.3 0.1 30.4
FY21 Q3 23.8 0.0 23.8 23.8 0.0 23.8
FY21 Q4 20.9 0.1 21.0
LTM including US 106.5 106.8 106.5 106.7
LTM excluding US 107.1 107.4 106.8 107.0
Adjusted1 / Underlying Adjusted2 EBITDA by Quarter
Note:1 Adjusted EBITDA refers to EBITDA, adjusted to include investment income and exclude non-trading items2 Underlying adjusted EBITDA is adjusted EBITDA, as further adjusted to exclude holding company costs

Q + A
Company Confidential, Copyright © Domestic &
General Group Limited. All rights reserved
Disclaimer
This presentation and any materials distributed in connection herewith (together, the “Presentation”) do not constitute or form a part of, and should not be construed as, an offer for sale or subscription of or solicitation of
any offer to purchase or subscribe for any securities in any jurisdiction, and neither this Presentation nor anything contained herein shall form the basis of, or be relied upon in connection with, or act as an inducement to
enter into, any contract or commitment whatsoever.
These materials are being provided to you on a confidential basis, may not be distributed to the press or to any other persons, may not be redistributed or passed on, directly or indirectly, to any person, or published, in
whole or in part, by any medium or for any purpose.
The information contained in this Presentation has not been independently verified and no representation or warranty, express or implied, is made as to, and no reliance should be placed on, the fairness, accuracy,
completeness, reasonableness or correctness of the information or opinions contained herein. None of Galaxy Finco Limited, its subsidiaries or any of their respective employees, advisers, representatives or affiliates shall
have any liability whatsoever (in negligence or otherwise) for any loss howsoever arising from any use of this document or its contents or otherwise arising in connection with this Presentation. The information contained
in this Presentation is provided as at the date of this Presentation and is subject to change without notice.
The information in this Presentation does not constitute investment, legal, accounting, regulatory, taxation or other advice, and the Presentation does not take into account your investment objectives or legal, accounting,
regulatory, taxation or financial situation or other needs. You are solely responsible for forming your own opinions and conclusions on such matters and for making your own independent assessment of the Presentation.
Statements made in this Presentation include forward-looking statements, including in the slide captioned “Summary and Outlook”. These statements may be identified by the fact that they use words such as
“anticipate”, “estimate”, “should”, “expect”, “guidance”, “project”, “intend”, “plan”, “believe”, and/or other words and terms of similar meaning in connection with, among other things, any discussion of results of
operations, financial condition, liquidity, prospects, growth, strategies or developments in the industry in which we operate. Such statements are based on management’s current intentions, expectations or beliefs and
involve inherent risks, assumptions and uncertainties, including factors that could delay, divert or change any of them. Forward-looking statements contained in this Presentation regarding trends or current activities
should not be taken as a representation that such trends or activities will continue in the future. Actual outcomes, results and other future events may differ materially from those expressed or implied by the statements
contained herein. Such differences may adversely affect the outcome and financial effects of the plans and events described herein and may result from, among other things, changes in economic, business, competitive,
technological, strategic or regulatory factors and other factors affecting the business and operations of the company. Neither Galaxy Finco Limited nor any of its affiliates is under any obligation, and each such entity
expressly disclaims any such obligation, to update, revise or amend any forward-looking statements, whether as a result of new information, future events or otherwise. You should not place undue reliance on any such
forward-looking statements, which speak only as of the date of this Presentation. It should be noted that past performance is not a guide to future performance. Particular uncertainties that could cause our actual results
to be materially different than those expressed in these forward-looking statements include risk factors described in the offering memorandum of Galaxy Bidco Limited and Galaxy Finco Limited dated October 24, 2013, as
updated from time to time by our annual and quarterly financial statements and financial reports, including the section captioned “Principal Risks and Uncertainties” of our Annual Report and Accounts 2020. Nothing in
this Presentation should be construed as a profit forecast.
This Presentation may also contain non-GAAP financial information. Management uses this information in its internal analysis of results and liquidity and believes that this information may be informative to investors in
gauging the quality of our financial performance , assessing our liquidity, identifying trends in our results and providing meaningful period-to-period comparisons. In this financial release we report preliminary unaudited
operating and financial information as of 31 March 2021. This financial information is preliminary, has not been audited by our independent auditors and is subject to change prior to Galaxy Finco Limited issuing its 31
March 2021 audited consolidated financial statements.