fy/q4 2014 investor conference call presentation charts
TRANSCRIPT

Investor Conference CallFY/Q4 2014 Results
February 26, 2015 / Marijn Dekkers, CEO

DisclaimerThis presentation may contain forward-looking statements based on currentassumptions and forecasts made by Bayer Group or subgroup management.
Various known and unknown risks, uncertainties and other factors could lead tomaterial differences between the actual future results, financial situation,development or performance of the company and the estimates given here.These factors include those discussed in Bayer’s public reports which areavailable on the Bayer website at www.bayer.com.
The company assumes no liability whatsoever to update these forward-lookingstatements or to conform them to future events or developments.
• Q4/FY 2014 Investor Conference Call • Marijn Dekkers Page 2

Page 3
2014 – Strong Business Development and Focus on Life Sciences
Delivered strong organic growth with record earnings; all subgroups contributed
Q4 – product innovations and emerging markets continued to drive performance
Portfolio transformation into a pure Life Science Company underway
Integration of acquired businesses on track
Dividend proposal of €2.25, up 7% yoy, 37% payout of Core EPS
Financial outlook 2015 projects further growth and higher earnings
• Q4/FY 2014 Investor Conference Call • Marijn Dekkers

Page 4
EBITin € million
-14%
561655
Salesin € million% currency & portfolio adj.
+7%
11,0399,888
EBITDABefore special itemsin € million
+4%
1,8461,769
Core EPSin €
+8%
1.191.10
Q4’14Q4’13 Q4’14Q4’13 Q4’14Q4’13 Q4’14Q4’13
Q4 2014 – Solid Finish to a Successful Year
• Q4/FY 2014 Investor Conference Call • Marijn Dekkers

Q4 2014 – Divisional Break-Down
Page 5
Group €11,039m; +7%
1,609
• Q4/FY 2014 Investor Conference Call • Marijn Dekkers
2013 2014
3,490
3691,844
487
+16%
-13%
1,846
+14%
EBITDA
217
939
-5%
+4%
MaterialScience+5%
CropScience+8%
Pharma+10%
ConsumerHealth+4%
2,195 2,327
3,2712,948 822
515
319
248
1,769
EBITDABefore special itemsin € million
Salesin € million% currency & portfolio adj.

FY 2014 – All Targets Achieved
• Q4/FY 2014 Investor Conference Call • Marijn Dekkers Page 6
Sales ∆ Fx & portf. adjusted, EBITDA before special items
2014 Guidance 2014Actual
∆ 2014 Actual
vs. 2013
Sales ~5% to~€41-42bn €42.2bn +7%
adj. EBITDA mid-single-digit % increase €8.8bn +5%
core EPS mid-to-high-single-digit % increase €6.02 +7%
✓
✓
✓

FY 2014 – Recently Launched Products Continued to Drive Performance at Pharma
Page 7
Stivarga
Recentlylaunched
+95%
Establishedproducts-2%
Pharma €12,052m; +11%
759
+133%1,679
+82%
89
nm224
+17%
2,9089,144
EyleaXarelto
• Q4/FY 2014 Investor Conference Call • Marijn Dekkers
+287%
157
Sales in € million% currency & portfolio adj.
Product Salesin € million% currency adj.

Consumer Care – Brands and Emerging Market Focus Countries Drive Growth
• FY/Q4 2014 Investor Conference Call • Marijn DekkersPage 8
+10%+5%** +18%
2013 2014pro-forma*
China Brazil Russia
+28% +26% +26%∆% Fx adj. yoy
€3.9bn
€5.6bn
* including acquired businesses** including Aspirin Cardio recognized at Pharma

FY 2014 – Commercial Execution, New Products, and Seeds Drive Growth At CropScience
Page 9
CropScience €9,494m; +11%
In € million, ∆% yoy currency & portfolio adj.
• Q4/FY 2014 Investor Conference Call • Marijn Dekkers
Crop Protection+11%
EnvironmentalScience
+7%
Seeds+20%
7,712678
1,104
820974
2012 2013 2014
1,104
Seed Sales
* Launched since 2006; nominal growth
+20%
1.11.5
2012 2013 2014
1.9
New CP Product Sales*
+23%in €bn

FY 2015 Group Guidance –Further Sales and Earnings Growth
Page 10
2014 2015e*
Sales €42.2bnLow-single digit %
increase~€46bn
(positive FX effect approx. +3%)
adj. EBITDA €8.8bnLow-to-mid-teens %
increase(positive FX effect approx. +2%)
core EPS €6.02Low-teens %
increase(positive FX effect approx. +3%)
Sales ∆ Fx and portfolio adjusted, EBITDA before special items
*Assuming Fx rates of 12/31/2014 (USD 1.21)Outlook depends on specific planning assumptions as detailed in the Annual Report• Q4/FY 2014 Investor Conference Call • Marijn Dekkers

FY 2015 –R&D and CapEx Budgets
Page 11
2%
MaterialScience~€0.2bn
HealthCare~€2.6nthereof Pharma ~€2.2bn
MaterialScience~€0.5bn
HealthCare~€0.8bn
Reconciliation~€0.1bn
66%27%
5%
Reconciliation~€0.3bn
CropScience~€1.1bn
CropScience~€0.7bn
23%
31%
35%
11%
• Q4/FY 2014 Investor Conference Call • Marijn Dekkers
R&D 2015e: >€4.0bn (+10%) CapEx (PPE) 2015e: ~€2.3bn
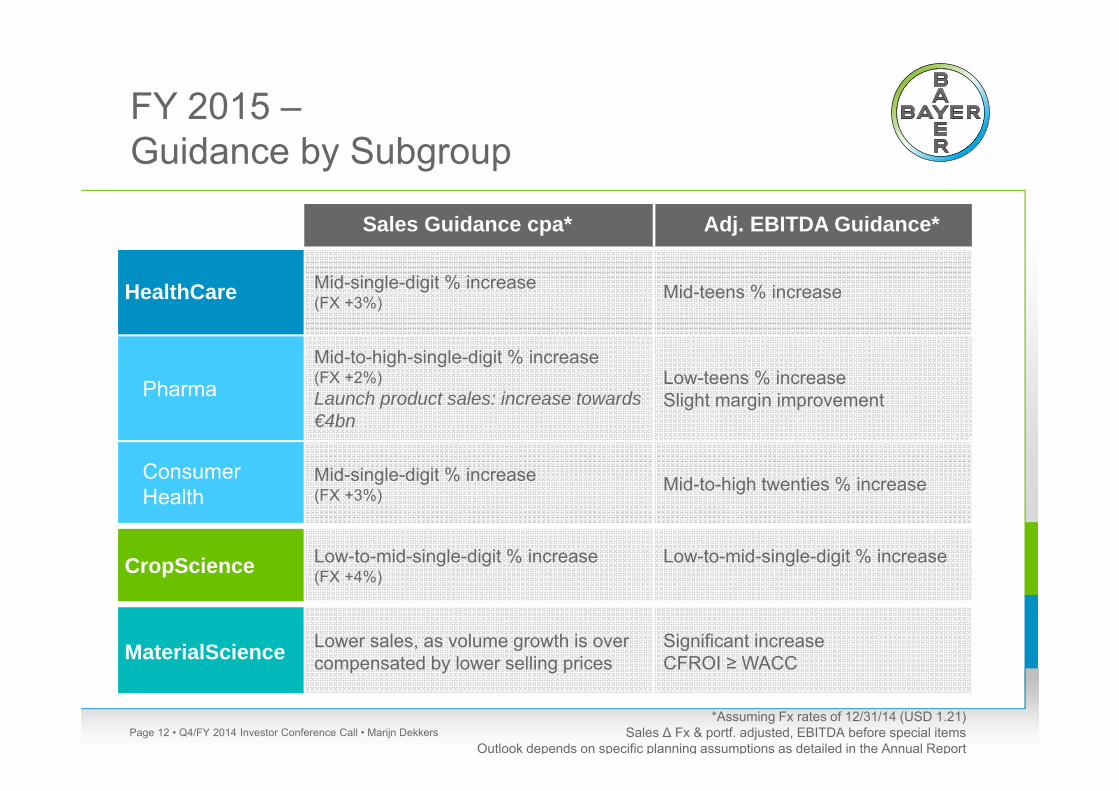
HealthCare Mid-single-digit % increase(FX +3%) Mid-teens % increase
PharmaMid-to-high-single-digit % increase (FX +2%)Launch product sales: increase towards €4bn
Low-teens % increaseSlight margin improvement
ConsumerHealth
Mid-single-digit % increase (FX +3%) Mid-to-high twenties % increase
CropScience Low-to-mid-single-digit % increase (FX +4%)
Low-to-mid-single-digit % increase
MaterialScience Lower sales, as volume growth is over compensated by lower selling prices
Significant increase CFROI ≥ WACC
FY 2015 –Guidance by Subgroup
Page 12*Assuming Fx rates of 12/31/14 (USD 1.21)
Sales ∆ Fx & portf. adjusted, EBITDA before special itemsOutlook depends on specific planning assumptions as detailed in the Annual Report
• Q4/FY 2014 Investor Conference Call • Marijn Dekkers
Sales Guidance cpa* Adj. EBITDA Guidance*