gdch0005mar-global demand, capacity and prices · pdf filereference code gdch0005mar |...
TRANSCRIPT
REFERENCE CODE GDCH0005MAR | PUBLICAT ION DATE AUGUST 2014
GLOBAL DEMAND, CAPACITY AND PRICES FOR METHANOL – CHINA TO REMAIN THE DOMINANT
MARKET

Global Demand, Capacity and Prices for Methanol – China to Remain the Dominant Market 2 © GlobalData. This report is a licensed product and is not to be copied, reproduced, shared or resold in any form.
GLOBAL DEMAND, CAPACITY AND PRICES FOR METHANOL – CHINA TO REMAIN THE DOMINANT MARKET
Executive Summary
Asia-Pacific, Led by China, Drive the Global Methanol Industry
China is driving the global methanol industry, with
tremendous demand from both its energy and
petrochemicals sectors. It accounts for XX% of
Asia-Pacific’s (APAC) methanol capacity, and XX%
of the global methanol capacity. Despite a large
planned capacity increase in other countries, China
will remain the dominant power in the methanol
industry, with a share of XX% of the global
capacity by 2018.
China has huge demand for methanol for gasoline
blending in the transportation fuel sector, and its
plan to implement a mandatory XX% blending in
gasoline is likely to see methanol consumption
increase substantially in the future.
In the petrochemicals sector, methanol demand is
driven by the adhesives, solvents, foams, plastics
and paints industries. Steady growth in the
Chinese economy is likely to create more demand
from these sectors, and drive capacity.
Furthermore, plans to develop additional Methanol
to Olefins (MTO) capacity is forecast to occur in
China. There are five active MTO plants in the
country, as well as XX planned MTO facilities with
a capacity of around XX million metric tons per
year (mmty). Once all of these plants are
operational, the requirement for methanol to be
used as a feedstock will increase, and result in
more methanol capacity being constructed. The
following figure shows the estimated global
methanol capacity share by country in 2013 and
2018.
Methanol Industry, Global, Capacity by Country (%), 2013 and 2018
China
Saudi Arabia
Trinidad and Tobago
Iran
Russia
Other
2013
China
IranUSTrinidad and
Tobago
Saudi Arabia
Other
2018
Source: GlobalData, Petrochemicals eTrack [Accessed on June 13, 2014]
China and the US to Add the Most Capacity in the Next Five Years
China and the US will be the largest contributors to
methanol capacity, and will account for XX% of the
global capacity addition over the next five years. In
China, a demand-side push will drive capacity
expansions, in turn increasing local methanol
production. The country has XX planned methanol
plants, with a total capacity of XX mmty. In the US,
the capacity expansion will be driven by increasing
shale gas production, which provides abundant
and cheap natural gas feedstock for methanol
production. There are eight planned methanol
plants In the US, with a total capacity of XX mmty.

Global Demand, Capacity and Prices for Methanol – China to Remain the Dominant Market 4 © GlobalData. This report is a licensed product and is not to be copied, reproduced, shared or resold in any form.
Table of Contents
GLOBAL DEMAND, CAPACITY AND PRICES FOR METHANOL – CHINA TO REMAIN THE DOMINANT MARKET
1 Table of Contents
1 Table of Contents ....................................................................................................................... 4
1.1 List of Tables ...................................................................................................................... 6
1.2 List of Figures ..................................................................................................................... 7
2 Introduction ................................................................................................................................. 8
2.1 Overview ............................................................................................................................. 8
2.2 GlobalData Report Guidance .............................................................................................. 9
3 Global Methanol Capacity – US Emerges as a New Investment Destination ............................ 10
3.1 Global Methanol Industry, Supply Scenario, 2003–2018 ................................................... 12
3.2 Global Planned Methanol Plants Details – China and the US Will Add the Most Capacity up to 2018 .............................................................................................................................. 14
3.2.1 China ............................................................................................................................ 14
3.2.2 US ................................................................................................................................. 16
3.2.3 Iran ................................................................................................................................ 18
3.3 Methanol to Olefins Plants Gaining Prominence in China.................................................. 23
3.4 Global Methanol Industry, Company Share, 2013 ............................................................. 25
4 Asia-Pacific to Drive Global Methanol Demand ......................................................................... 27
4.1 Global Methanol Industry, Market Size, 2003–2018 .......................................................... 27
4.2 Global Methanol Production, 2003–2018 .......................................................................... 33
4.3 Global Methanol Demand by End-Use Sector, 2013 ......................................................... 36
4.4 Global Methanol Price Forecast, 2003–2018 .................................................................... 38
5 Major Companies Active in the Global Methanol Industry ......................................................... 40
5.1 Methanex Corporation (Methanex) .................................................................................... 40
5.1.1 Company Overview ....................................................................................................... 40
5.1.2 Business Overview ........................................................................................................ 41
5.1.3 Methanex, Global Methanol Capacity, 2003–2018 ........................................................ 42
5.1.4 Methanex’s Active and Planned Methanol Plants, 2013 ................................................ 45

Global Demand, Capacity and Prices for Methanol – China to Remain the Dominant Market 5 © GlobalData. This report is a licensed product and is not to be copied, reproduced, shared or resold in any form.
Table of Contents
GLOBAL DEMAND, CAPACITY AND PRICES FOR METHANOL – CHINA TO REMAIN THE DOMINANT MARKET
5.2 Methanol Holdings (Trinidad) Limited ................................................................................ 46
5.2.1 Company Overview ....................................................................................................... 46
5.2.2 Methanol Holdings, Global Methanol Capacity, 2003–2018 ........................................... 47
5.2.3 Methanol Holdings’ Active and Planned Methanol Plants, 2013 .................................... 48
5.3 Mitsubishi Gas Chemical ................................................................................................... 49
5.3.1 Company Overview ....................................................................................................... 49
5.3.2 Business Overview ........................................................................................................ 50
5.3.3 Mitsubishi Gas Chemical, Total Installed Capacity, 2003–2018 ..................................... 51
5.3.4 Mitsubishi Gas Chemical’s Active and Planned Methanol Plants, 2013 ......................... 53
6 Conclusion ................................................................................................................................ 55
7 Appendix................................................................................................................................... 56
7.1 Definitions ......................................................................................................................... 56
7.1.1 Installed Capacity .......................................................................................................... 56
7.1.2 Process ......................................................................................................................... 56
7.1.3 Technology ................................................................................................................... 56
7.2 Abbreviations .................................................................................................................... 56
7.3 GlobalData’s Research Methodology ................................................................................ 57
7.3.1 Coverage ...................................................................................................................... 57
7.3.2 Secondary Research ..................................................................................................... 58
7.3.3 Primary Research ......................................................................................................... 58
7.3.4 Expert Panel Validation ................................................................................................. 59
7.4 Disclaimer ......................................................................................................................... 59
Global Demand, Capacity and Prices for Methanol – China to Remain the Dominant Market 6 © GlobalData. This report is a licensed product and is not to be copied, reproduced, shared or resold in any form.
Table of Contents
GLOBAL DEMAND, CAPACITY AND PRICES FOR METHANOL – CHINA TO REMAIN THE DOMINANT MARKET
1.1 List of Tables
Table 1: Methanol Industry, Global, Capacity by Region (mmty), 2003–2018 ............................................. 13
Table 2: Methanol Industry, Global, Capacity CAGR by Region (%), 2003–2018 ....................................... 13
Table 3: Methanol Industry, China, Capacity (mmty), 2003–2018 .............................................................. 15
Table 4: Methanol Industry, US, Capacity (mmty), 2003–2018 .................................................................. 17
Table 5: Methanol Industry, Iran, Capacity (mmty), 2003–2018 ................................................................. 19
Table 6: Methanol Industry, Global, Major Planned Plant Details, 2014–2018 ............................................ 20
Table 7: Methanol Industry, Global, Active and Planned Methanol to Olefins Plants, 2011–2017 ............... 24
Table 8: Methanol Industry, Global, Capacity by Company, 2013 .............................................................. 26
Table 9: Methanol Industry, Global, Market Size by Region (US$ bil), 2003–2018 ..................................... 30
Table 10: Methanol Industry, Global, Market Size CAGR by Region (%), 2003–2018 .................................. 30
Table 11: Methanol Industry, Global, Demand Volume by Region (mmty), 2003–2018 ................................ 32
Table 12: Methanol Industry, Global, Demand Volume CAGR by Region (%), 2003–2018 ........................... 32
Table 13: Methanol Industry, Global, Production Volume by Region (mmty), 2003–2018 ............................. 35
Table 14: Methanol Industry, Global, Production Volume CAGR by Region (%), 2003–2018 ....................... 35
Table 15: Methanol Industry, Global, Demand by End-Use Share (%), 2013 ............................................... 37
Table 16: Methanol Industry, Global, Average Price by Region (US$/ton), 2003–2018 ................................ 39
Table 17: Methanex, Key Facts, 2013 ......................................................................................................... 40
Table 18: Methanex, Installed Methanol Capacity (mmty), 2003–2018 ........................................................ 44
Table 19: Methanex, Active and Planned Methanol Plants, 1988–2016 ....................................................... 45
Table 20: Methanol Holdings, Key Facts, 2013............................................................................................ 46
Table 21: Methanol Holdings, Installed Methanol Capacity (mmty), 2003–2018 ........................................... 48
Table 22: Methanol Holdings, Active and Planned Methanol Plant Details, 1984–2007 ................................ 49
Table 23: Mitsubishi Gas Chemical, Key Facts, 2013 .................................................................................. 50
Global Demand, Capacity and Prices for Methanol – China to Remain the Dominant Market 7 © GlobalData. This report is a licensed product and is not to be copied, reproduced, shared or resold in any form.
Table of Contents
GLOBAL DEMAND, CAPACITY AND PRICES FOR METHANOL – CHINA TO REMAIN THE DOMINANT MARKET
Table 24: Mitsubishi Gas Chemical, Installed Methanol Capacity (mmty), 2003–2018 ................................. 53
Table 25: Mitsubishi Gas Chemical, Active and Planned Methanol Plant Details, 1983–2017 ...................... 54
Table 26: List of Abbreviations .................................................................................................................... 56
1.2 List of Figures
Figure 1: Methanol Industry, Global, Capacity by Region (mmty), 2003–2018 ............................................. 12
Figure 2: Methanol Industry, China, Capacity (mmty), 2003–2018 .............................................................. 14
Figure 3: Methanol Industry, US, Capacity (mmty), 2003–2018 .................................................................. 16
Figure 4: Methanol Industry, Iran, Capacity (mmty), 2003–2018 ................................................................. 18
Figure 5: Methanol Industry, Global, Capacity by Company, 2013 .............................................................. 26
Figure 6: Methanol Industry, Global, Market Size by Region (US$ bil), 2003–2018 ..................................... 29
Figure 7: Methanol Industry, Global, Demand Volume by Region (mmty), 2003–2018 ................................ 31
Figure 8: Methanol Industry, Global, Production Volume by Region (mmty), 2003–2018 ............................. 34
Figure 9: Methanol Industry, Global, Demand by End-Use Share (%) 2013 ................................................ 37
Figure 10: Methanol Industry, Global, Average Price by Region (US$/ton), 2003–2018 ................................ 38
Figure 11: Methanex, Installed Methanol Capacity (mmty), 2003–2018 ........................................................ 43
Figure 12: Methanol Holdings, Installed Methanol Capacity (mmty), 2003–2018 ........................................... 47
Figure 13: Mitsubishi Gas Chemical, Installed Methanol Capacity (mmty), 2003–2018 ................................. 52
Global Demand, Capacity and Prices for Methanol – China to Remain the Dominant Market 8 © GlobalData. This report is a licensed product and is not to be copied, reproduced, shared or resold in any form.
GLOBAL DEMAND, CAPACITY AND PRICES FOR METHANOL – CHINA TO REMAIN THE DOMINANT MARKET
Introduction
2 Introduction
2.1 Overview
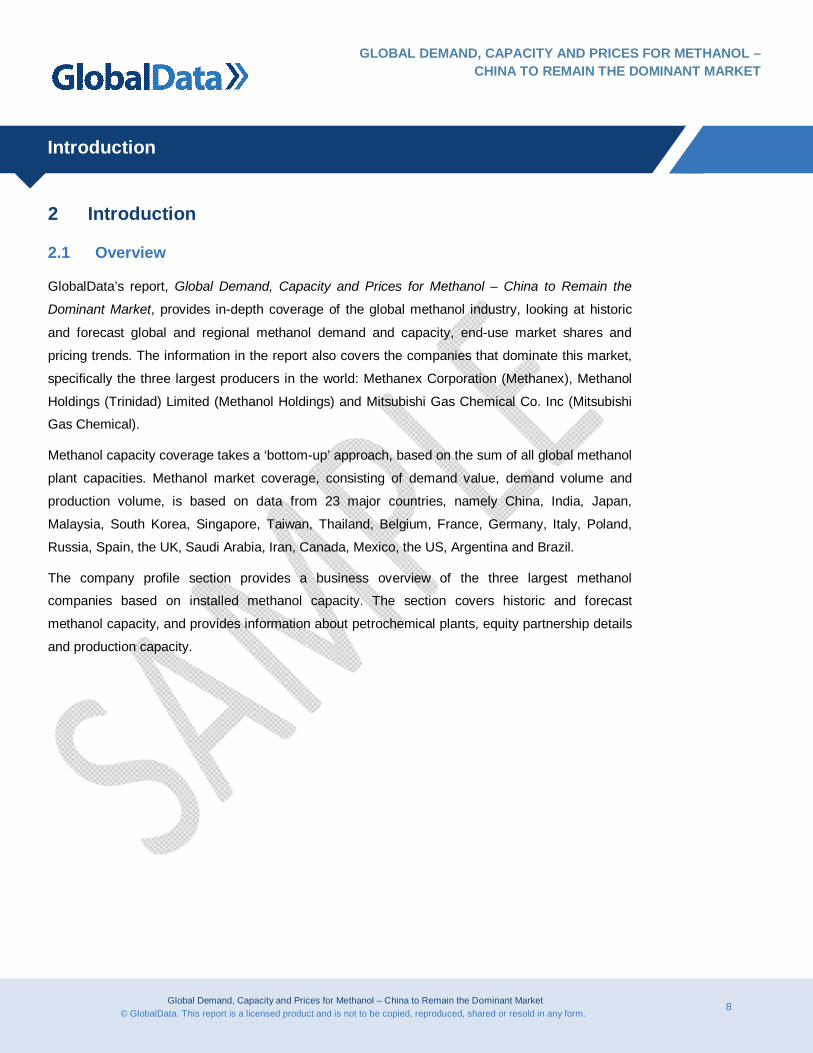
GlobalData’s report, Global Demand, Capacity and Prices for Methanol – China to Remain the
Dominant Market, provides in-depth coverage of the global methanol industry, looking at historic
and forecast global and regional methanol demand and capacity, end-use market shares and
pricing trends. The information in the report also covers the companies that dominate this market,
specifically the three largest producers in the world: Methanex Corporation (Methanex), Methanol
Holdings (Trinidad) Limited (Methanol Holdings) and Mitsubishi Gas Chemical Co. Inc (Mitsubishi
Gas Chemical).
Methanol capacity coverage takes a ‘bottom-up’ approach, based on the sum of all global methanol
plant capacities. Methanol market coverage, consisting of demand value, demand volume and
production volume, is based on data from 23 major countries, namely China, India, Japan,
Malaysia, South Korea, Singapore, Taiwan, Thailand, Belgium, France, Germany, Italy, Poland,
Russia, Spain, the UK, Saudi Arabia, Iran, Canada, Mexico, the US, Argentina and Brazil.
The company profile section provides a business overview of the three largest methanol
companies based on installed methanol capacity. The section covers historic and forecast
methanol capacity, and provides information about petrochemical plants, equity partnership details
and production capacity.
Global Demand, Capacity and Prices for Methanol – China to Remain the Dominant Market 9 © GlobalData. This report is a licensed product and is not to be copied, reproduced, shared or resold in any form.
GLOBAL DEMAND, CAPACITY AND PRICES FOR METHANOL – CHINA TO REMAIN THE DOMINANT MARKET
Introduction
2.2 GlobalData Report Guidance
Chapter three highlights the main features of the global methanol industry, providing historical
and forecast capacity by region, planned facility details, and major company capacity shares.
Chapter four provides historical and forecast supply and demand scenarios. This chapter
covers the size of the methanol market, demand and production volume, and price trends by
geographical regions from 2003 to 2018. Additionally, it provides demand by major end-use
sectors in 2013.
Chapter five presents profiles of the major companies active in the global methanol industry,
covering Methanex, Methanol Holdings and Mitsubishi Gas Chemical.
Chapter six concludes the report with an industry overview.
Global Demand, Capacity and Prices for Methanol – China to Remain the Dominant Market 14 © GlobalData. This report is a licensed product and is not to be copied, reproduced, shared or resold in any form.
US Emerges as a New Investment Destination
GLOBAL DEMAND, CAPACITY AND PRICES FOR METHANOL – CHINA TO REMAIN THE DOMINANT MARKET
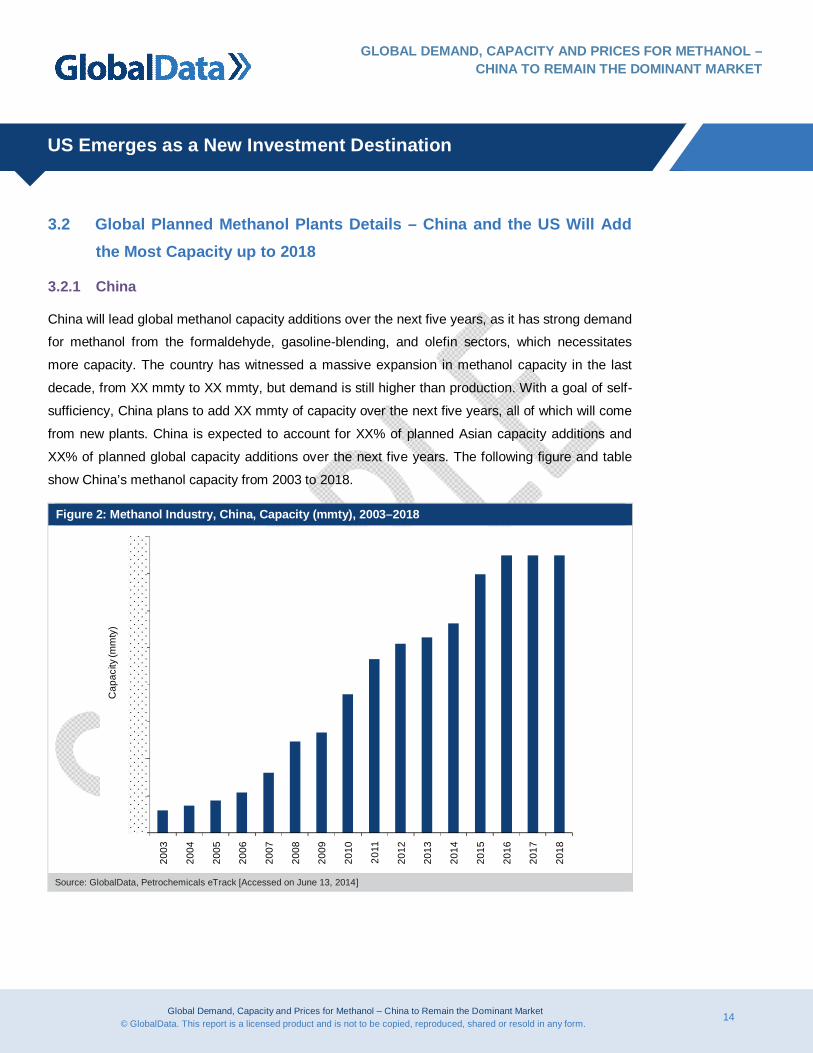
3.2 Global Planned Methanol Plants Details – China and the US Will Add the Most Capacity up to 2018
3.2.1 China
China will lead global methanol capacity additions over the next five years, as it has strong demand
for methanol from the formaldehyde, gasoline-blending, and olefin sectors, which necessitates
more capacity. The country has witnessed a massive expansion in methanol capacity in the last
decade, from XX mmty to XX mmty, but demand is still higher than production. With a goal of self-
sufficiency, China plans to add XX mmty of capacity over the next five years, all of which will come
from new plants. China is expected to account for XX% of planned Asian capacity additions and
XX% of planned global capacity additions over the next five years. The following figure and table
show China’s methanol capacity from 2003 to 2018.
Figure 2: Methanol Industry, China, Capacity (mmty), 2003–2018
2003
2004
2005
2006
2007
2008
2009
2010
2011
2012
2013
2014
2015
2016
2017
2018
Cap
acity
(mm
ty)
Source: GlobalData, Petrochemicals eTrack [Accessed on June 13, 2014]
Global Demand, Capacity and Prices for Methanol – China to Remain the Dominant Market 15 © GlobalData. This report is a licensed product and is not to be copied, reproduced, shared or resold in any form.
US Emerges as a New Investment Destination
GLOBAL DEMAND, CAPACITY AND PRICES FOR METHANOL – CHINA TO REMAIN THE DOMINANT MARKET
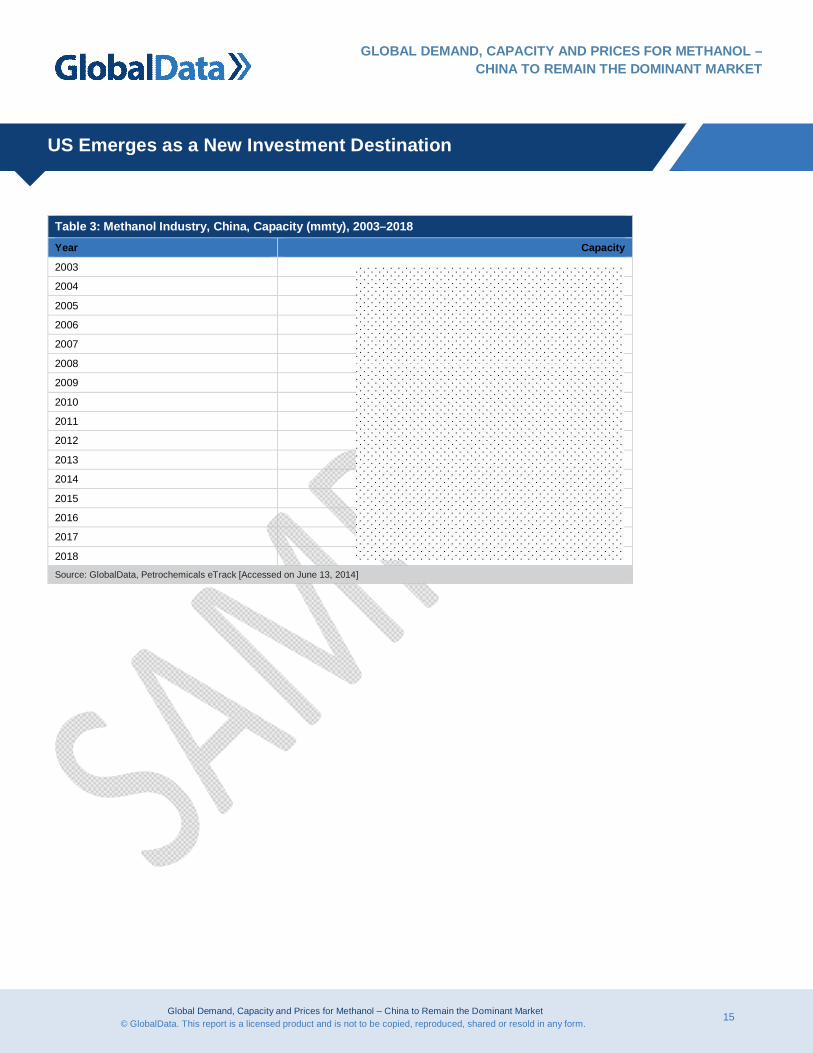
Table 3: Methanol Industry, China, Capacity (mmty), 2003–2018 Year Capacity
2003
2004
2005
2006
2007
2008
2009
2010
2011
2012
2013
2014
2015
2016
2017
2018
Source: GlobalData, Petrochemicals eTrack [Accessed on June 13, 2014]
Global Demand, Capacity and Prices for Methanol – China to Remain the Dominant Market 38 © GlobalData. This report is a licensed product and is not to be copied, reproduced, shared or resold in any form.
GLOBAL DEMAND, CAPACITY AND PRICES FOR METHANOL – CHINA TO REMAIN THE DOMINANT MARKET
Asia-Pacific to Drive Global Methanol Demand
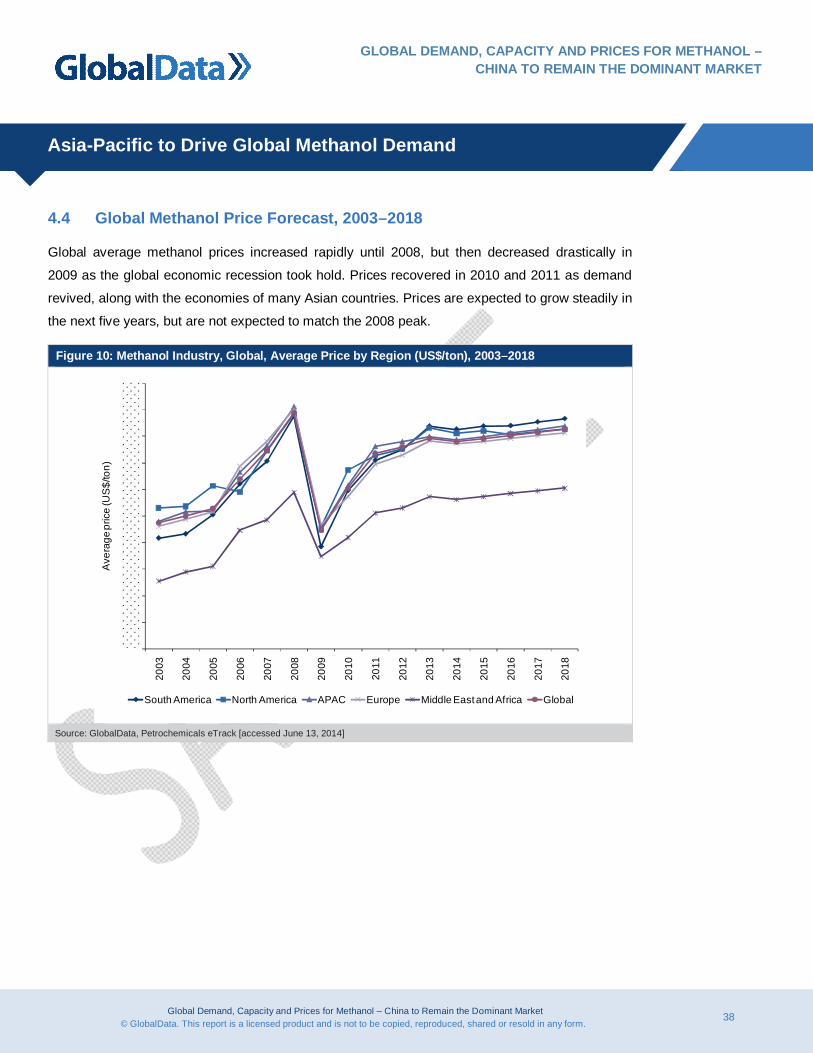
4.4 Global Methanol Price Forecast, 2003–2018
Global average methanol prices increased rapidly until 2008, but then decreased drastically in
2009 as the global economic recession took hold. Prices recovered in 2010 and 2011 as demand
revived, along with the economies of many Asian countries. Prices are expected to grow steadily in
the next five years, but are not expected to match the 2008 peak.
Figure 10: Methanol Industry, Global, Average Price by Region (US$/ton), 2003–2018
2003
2004
2005
2006
2007
2008
2009
2010
2011
2012
2013
2014
2015
2016
2017
2018
Ave
rage
pric
e (U
S$/
ton)
South America North America APAC Europe Middle East and Africa Global
Source: GlobalData, Petrochemicals eTrack [accessed June 13, 2014]
Global Demand, Capacity and Prices for Methanol – China to Remain the Dominant Market 56 © GlobalData. This report is a licensed product and is not to be copied, reproduced, shared or resold in any form.
Appendix
GLOBAL DEMAND, CAPACITY AND PRICES FOR METHANOL – CHINA TO REMAIN THE DOMINANT MARKET
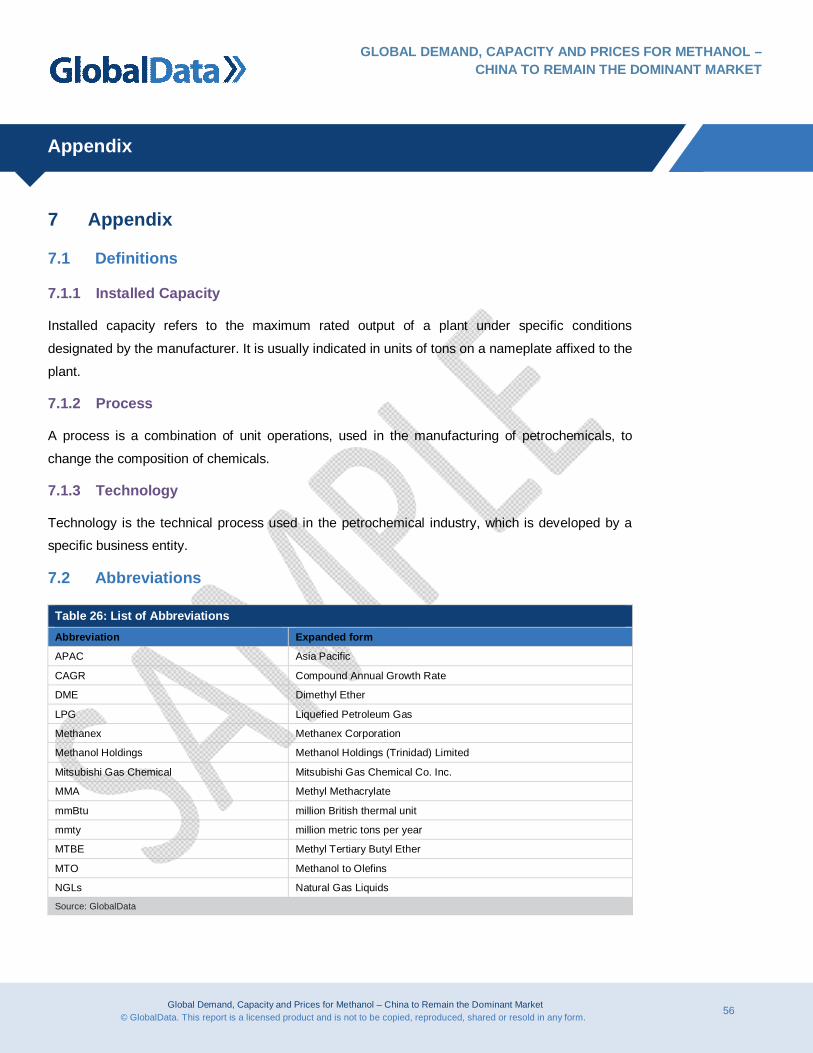
7 Appendix
7.1 Definitions
7.1.1 Installed Capacity
Installed capacity refers to the maximum rated output of a plant under specific conditions
designated by the manufacturer. It is usually indicated in units of tons on a nameplate affixed to the
plant.
7.1.2 Process
A process is a combination of unit operations, used in the manufacturing of petrochemicals, to
change the composition of chemicals.
7.1.3 Technology
Technology is the technical process used in the petrochemical industry, which is developed by a
specific business entity.
7.2 Abbreviations
Table 26: List of Abbreviations Abbreviation Expanded form
APAC Asia Pacific
CAGR Compound Annual Growth Rate
DME Dimethyl Ether
LPG Liquefied Petroleum Gas
Methanex Methanex Corporation
Methanol Holdings Methanol Holdings (Trinidad) Limited
Mitsubishi Gas Chemical Mitsubishi Gas Chemical Co. Inc.
MMA Methyl Methacrylate
mmBtu million British thermal unit
mmty million metric tons per year
MTBE Methyl Tertiary Butyl Ether
MTO Methanol to Olefins
NGLs Natural Gas Liquids
Source: GlobalData
Global Demand, Capacity and Prices for Methanol – China to Remain the Dominant Market 57 © GlobalData. This report is a licensed product and is not to be copied, reproduced, shared or resold in any form.
Appendix
GLOBAL DEMAND, CAPACITY AND PRICES FOR METHANOL – CHINA TO REMAIN THE DOMINANT MARKET
7.3 GlobalData’s Research Methodology
GlobalData’s dedicated research and analysis teams consist of experienced professionals with
advanced statistical expertise and marketing, market research and consulting backgrounds in the
petrochemical industry.
GlobalData adheres to the Codes of Practice of the Market Research Society (www.mrs.org.uk)
and Strategic and Competitive Intelligence Professionals (www.scip.org).
All GlobalData databases are continuously updated and revised. The following research
methodology is followed for all databases and reports.
7.3.1 Coverage
The objective of updating GlobalData coverage is to ensure that it represents the most up-to-date
vision of the industry possible.
Changes in the industry taxonomy are built on the basis of extensive research of company,
association and competitor sources.
Company coverage is based on three key factors: market capitalization; revenues; and media
attention/innovation/market potential.
An exhaustive search of 56 member exchanges is conducted and companies are prioritized on the
basis of their market capitalization.
The estimated revenues of all major companies, including private and governmental, are gathered
and used to prioritize coverage.
Companies that are making news, or which are of particular interest due to their innovative
approach are prioritized.
GlobalData aims to cover all major news events and deals in the petrochemical industry, updated
on a daily basis.
Global Demand, Capacity and Prices for Methanol – China to Remain the Dominant Market 58 © GlobalData. This report is a licensed product and is not to be copied, reproduced, shared or resold in any form.
Appendix
GLOBAL DEMAND, CAPACITY AND PRICES FOR METHANOL – CHINA TO REMAIN THE DOMINANT MARKET
7.3.2 Secondary Research
The research process begins with extensive secondary research on internal and external sources
to gather qualitative and quantitative information relating to each market.
Secondary research sources that are typically referred to include, but are not limited to:
Company websites, annual reports, financial reports, broker reports, investor presentations and
SEC filings
Industry trade journals and other literature
Internal and external proprietary databases
National government documents, statistical databases and market reports
News articles, press releases and webcasts specific to the companies operating in the market.
7.3.3 Primary Research
GlobalData conducts hundreds of primary interviews a year with industry participants and
commentators in order to validate its data and analysis. A typical research interview fulfills the
following functions:
Provides first-hand information on the market size, market trends, growth trends, competitive
landscape, and future outlook
Helps to validate and strengthen the secondary research findings
Further develops the analysis team’s expertise and market understanding
Primary research involves e-mail correspondence and telephone interviews as well as face-to-
face interviews for each market, category, segment and sub-segment across geographies.
The participants who typically take part in such a process include, but are not limited to:
Industry participants: CEOs, VPs, business development managers, market intelligence
managers and national sales managers
Outside experts: investment bankers, valuation experts, research analysts and key opinion
leaders specializing in the petrochemical industry
Global Demand, Capacity and Prices for Methanol – China to Remain the Dominant Market 59 © GlobalData. This report is a licensed product and is not to be copied, reproduced, shared or resold in any form.
Appendix
GLOBAL DEMAND, CAPACITY AND PRICES FOR METHANOL – CHINA TO REMAIN THE DOMINANT MARKET
7.3.4 Expert Panel Validation
GlobalData uses a panel of experts to cross-verify research and forecast methodologies, and drive
its analytical content.
The GlobalData expert panel comprises marketing managers, product specialists, international
sales managers from petrochemical companies; academics from research universities and
consultants from professional services companies.
7.4 Disclaimer
All Rights Reserved.
No part of this publication may be reproduced, stored in a retrieval system or transmitted in any
form by any means, electronic, mechanical, photocopying, recording or otherwise without the prior
permission of the publisher, GlobalData.