generation and transmission planning · · 2017-05-11generation and transmission planning...
TRANSCRIPT

Section 12 Planning
2017 Quarterly State of the Market Report for PJM: January through March 491© 2017 Monitoring Analytics, LLC
Generation and Transmission PlanningOverviewPlanned Generation and Retirements• Planned Generation. As of March 31, 2017, 99,325.3 MW of capacity were
in generation request queues for construction through 2024, compared to an average installed capacity of 195,870.3 MW as of March 31, 2017. Of the capacity in queues, 9,586.4 MW, or 9.7 percent, are uprates and the rest are new generation. Wind projects account for 15,494.6 MW of nameplate capacity or 15.6 percent of the capacity in the queues. Natural gas fired projects account for 64,672.3 MW of capacity or 65.1 percent of the capacity in the queues.
• Generation Retirements. As shown in Table 12-5, 32,314.5 MW have been, or are planned to be, retired between 2011 and 2020. Of that, 8,007.3 MW are planned to retire after the first three months of 2017. In the first three months of 2017, 209.0 MW were retired. Of the 8,007.3 MW pending retirement, 6,516.0MW are coal units. The coal unit retirements were a result of low gas prices, low capacity prices and the investments required for compliance with the EPA’s Mercury and Air Toxics Standards (MATS) for some units.
• Generation Mix. A significant shift in the distribution of unit types within the PJM footprint continues as natural gas fired units enter the queue and steam units retire. There are 291.0 MW of coal fired steam capacity and 64,672.3 MW of gas fired capacity in the queue. The replacement of coal steam units by units burning natural gas will significantly affect future congestion, the role of firm and interruptible gas supply, and natural gas supply infrastructure.
Generation and Transmission Interconnection Planning Process• Any entity that requests interconnection of a new generating facility,
including increases to the capacity of an existing generating unit, or that requests interconnection of a merchant transmission facility, must
follow the process defined in the PJM tariff to obtain interconnection service.1 The process is complex and time consuming at least in part as a result of the required analyses. The cost, time and uncertainty associated with interconnecting to the grid may create barriers to entry for potential entrants.
• The queue contains a substantial number of projects that are not likely to be built. Excluding currently active projects and projects currently under construction, 3,441 projects, representing 455,032.7 MW, have entered the queue process since its inception. Of those, 700 projects, 47,521.8 MW, went into service. Of the projects that entered the queue process, 67.4 percent of the MW withdrew prior to completion. Such projects may create barriers to entry for projects that would otherwise be completed by taking up queue positions, increasing interconnection costs and creating uncertainty.
• Feasibility, impact and facilities studies may be delayed for reasons including disputes with developers, circuit and network issues and retooling as a result of projects being withdrawn. The Earlier Queue Submittal Task Force (EQSTF) was established in August 2015 to address delays, which resulted in revisions to the PJM Open Access Transmission Tariff, effective October 31, 2016.2 3 On December 15, 2016, the Commission issued a notice of proposed rulemaking proposing additional queue reforms intended to improve certainty, promote more informed interconnection, and enhance interconnection processes.4
• A transmission owner (TO) is an “entity that owns, leases or otherwise has a possessory interest in facilities used for the transmission of electric energy in interstate commerce under the tariff.”5 Where the transmission owner is a vertically integrated company that also owns generation, there is a potential conflict of interest when the transmission owner evaluates the interconnection requirements of new generation which is a competitor to the generation of the parent company and when the transmission owner evaluates the interconnection requirements of new
1 See OATT Parts IV & VI.2 See Earlier Queue Submittal Task Force at <http://www.pjm.com/committees-and-groups/task-forces/eqstf.aspx>3 See Letter Order, ER16-2518-000 (Oct. 7, 2016).4 157 FERC ¶ 61,212 (2016).5 See OATT § 1 (Transmission Owner).

2017 Quarterly State of the Market Report for PJM: January through March
492 Section 12 Planning © 2017 Monitoring Analytics, LLC
generation which is part of the same company as the transmission owner. There is also a potential conflict of interest when the transmission owner evaluates the interconnection requirements of a merchant transmission developer which is a competitor of the transmission owner.
Regional Transmission Expansion Plan (RTEP)• Artificial Island is an area in southern New Jersey that includes nuclear
units at Salem and at Hope Creek in the PSEG Zone. On April 29, 2013, PJM issued a request for proposal (RFP), seeking technical solutions to improve stability issues and operational performance under a range of anticipated system conditions, and the elimination of potential planning criteria violations in this area. On July 30, 2015, the PJM Board of Managers accepted PJM’s recommendation to assign the project to LS Power, a merchant developer, PSEG, and PHI with a total cost estimate between $263M and $283M.6 7 On August 5, 2016, PJM announced that the Artificial Island project was to be suspended immediately due to unanticipated project complexities and significant cost overruns. On March 3, 2017, PJM held a special Transmission Expansion Advisory Committee (TEAC) meeting to discuss their updated analysis of the Artificial Island project. PJM staff presented updated assumptions that went into the new project analysis. In consultation with project developers and stakeholders, PJM made several major revisions to the project. These included switching the interconnection point from the Salem Substation to the Hope Creek Substation, removal of the New Freedom switched vertical circuit (SVC) from the project scope, and removal of the optical ground wire (OPGW) from the project scope. These revisions led to a revised total project cost estimate of $280 million, $240 million less than the previous $420 million project cost estimate released in February 2016. On April 6, 2017, the PJM Board lifted a suspension of the project. It is expected to be in service by June 2020.
• On October 25, 2012, Schedule 12 of the tariff and Schedule 6 of the OA were changed to address FERC Order No. 1000 reforms to the cost
6 See “Artificial Island Recommendations,” presented at the TEAC meeting on April 28, 2015 at <http://www.pjm.com/~/media/committees-groups/committees/teac/20150428-ai/20150428-artificial-island-recommendations.ashx>.
7 See letter from Terry Boston concerning the Artificial Island Project at <http://www.pjm.com/~/media/documents/reports/board-statement-on-artificial-island-project.ashx>.
allocation requirements for local and regional transmission planning projects that were formerly defined in Order No. 890. The new approach was applied for the first time to the 2013 RTEP. The allocation process has been upheld by the FERC despite repeated challenges.8
Backbone Facilities• PJM baseline transmission projects are implemented to resolve reliability
criteria violations. PJM backbone transmission projects are a subset of significant baseline projects, which are intended to resolve multiple reliability criteria violations and congestion issues and which may have substantial impacts on energy and capacity markets. There are currently three backbone projects under development, Surry Skiffes Creek 500kV, the Northern New Jersey 345 kV Upgrades, and Byron Wayne 345 kV.9
Transmission Facility Outages• PJM maintains a list of reportable transmission facilities. When the
reportable transmission facilities need to be taken out of service, PJM transmission owners are required to report planned transmission facility outages as early as possible. PJM processes the transmission facility outage requests according to rules in PJM’s Manual 3 to decide if the outage is on time or late and whether or not they will allow the outage.10
• There were 4,516 transmission outage requests submitted in the first three months of 2017. Of the requested outages, 73.9 percent were planned for five days or shorter and 11.4 percent were planned for longer than 30 days. Of the requested outages, 54.2 percent were late according to the rules in PJM’s Manual 3.
8 See 155 FERC ¶ 61,090 (2016); 155 FERC ¶ 61,089 (2016); 155 FERC ¶ 61,088 (2016); see also Order No. 1000, FERC Stats. & Regs. ¶ 31,323 (2011), order on reh’g, Order No. 1000-A, 139 FERC ¶ 61,132, order on reh’g and clarification, Order No. 1000-B, 141 FERC ¶ 61,044 (2012), aff’d sub nom. 762 F.3d 41, 412 (D.C. Cir. 2014); 142 FERC ¶ 61,074 (2013) (accepting the proposed PJM cost allocation method, effective February 1, 2013, subject to the outcome of PJM’s Order No. 1000 regional compliance filing proceeding); 142 FERC ¶ 61,214 (2013), order on reh’g and compliance, 147 FERC ¶ 61,128 (2014), order on reh’g and compliance, 150 FERC ¶ 61,038 (2015), order on reh’g and compliance, 151 FERC ¶ 61,250 (2015).
9 See “2016 RTEP Process Scope and Input Assumptions White Paper,” P 23. <http://www.pjm.com/~/media/documents/reports/2016-rtep-process-scope-and-input-assumptions.ashx> Accessed November 7, 2016.
10 PJM. “Manual 03: Transmission Operations,” Revision 50 (Dec. 1, 2016), Section 4.

Section 12 Planning
2017 Quarterly State of the Market Report for PJM: January through March 493© 2017 Monitoring Analytics, LLC
RecommendationsThe MMU recommends improvements to the planning process.
• The MMU recommends that PJM continue to incorporate the principle that the goal of transmission planning should be the incorporation of transmission investment decisions into market driven processes as much as possible. (Priority: Low. First reported 2001. Status: Not adopted.)
• The MMU recommends the creation of a mechanism to permit a direct comparison, or competition, between transmission and generation alternatives, including which alternative is less costly and who bears the risks associated with each alternative. (Priority: Low. First reported 2013. Status: Not adopted.)
• The MMU recommends that rules be implemented to permit competition to provide financing for transmission projects. This competition could reduce the cost of capital for transmission projects and significantly reduce total costs to customers. (Priority: Low. First reported 2013. Status: Not adopted.)
• The MMU recommends that rules be implemented to require that project cost caps on new transmission projects be part of the evaluation of competing projects. (Priority: Low. First reported 2015. Status: Not adopted.)
• The MMU recommends that barriers to entry be addressed in a timely manner in order to help ensure that the capacity market will result in the entry of new capacity to meet the needs of PJM market participants and reflect the uncertainty and resultant risks in the cost of new entry used to establish the capacity market demand curve in RPM. (Priority: Low. First reported 2012. Status: Not adopted.)
• The MMU recommends that the question of whether Capacity Injection Rights (CIRs) should persist after the retirement of a unit be addressed. Even if the treatment of CIRs remains unchanged, the rules need to ensure that incumbents cannot exploit control of CIRs to block or postpone entry of competitors.11 (Priority: Low. First reported 2013. Status: Not adopted.)
11 See “Comments of the Independent Market Monitor for PJM,” Docket No. ER12-1177-000 <http://www.monitoringanalytics.com/reports/Reports/2012/IMM_Comments_ER12-1177-000_20120312.pdf>.
• The MMU recommends outsourcing interconnection studies to an independent party to avoid potential conflicts of interest. Currently, these studies are performed by incumbent transmission owners under PJM’s direction. This creates potential conflicts of interest, particularly when transmission owners are vertically integrated and the owner of transmission also owns generation. (Priority: Low. First reported 2013. Status: Not adopted.)
• The MMU recommends that PJM establish fair terms of access to rights of way and property, such as at substations, in order to remove any barriers to entry and permit competition between incumbent transmission providers and merchant transmission providers in the RTEP. (Priority: Medium. First reported 2014. Status: Not adopted.)
• The MMU recommends that PJM enhance the transparency and queue management process for merchant transmission investment. Issues related to data access and complete explanations of cost impacts should be addressed. The goal should be to remove barriers to competition from merchant transmission. (Priority: Medium. First reported 2015. Status: Not adopted.)
• The MMU recommends consideration of changing the minimum distribution factor in the allocation from 0.01 to 0.00 and adding a threshold minimum usage impact on the line. (Priority: Medium. First reported 2015. Status: Not adopted.)
• The MMU recommends that PJM reevaluate all transmission outage tickets as on time or late as if they were new requests when an outage is rescheduled and apply the standard rules for late submissions to any such outages. (Priority: Low. First reported 2014. Status: Not adopted.)
• The MMU recommends that PJM draft a clear definition of the congestion analysis required for transmission outage requests to include in Manual 3 after appropriate review. (Priority: Low. First reported 2015. Status: Not adopted.)
• The MMU recommends that PJM modify the rules to reduce or eliminate the approval of late outage requests submitted or rescheduled after the

2017 Quarterly State of the Market Report for PJM: January through March
494 Section 12 Planning © 2017 Monitoring Analytics, LLC
FTR auction bidding opening date. (Priority: Low. First reported 2015. Status: Not adopted.)
• The MMU recommends that PJM not permit transmission owners to divide long duration outages into smaller segments to avoid complying with the requirements for long duration outages. (Priority: Low. First reported 2015. Status: Not adopted.)
• The MMU recommends improvements in queue management including that PJM establish a review process to ensure that projects are removed from the queue if they are not viable, as well as a process to allow commercially viable projects to advance in the queue ahead of projects which have failed to make progress, subject to rules to prevent gaming. (Priority: Medium. First reported 2013. Status: Partially adopted.)
• The MMU recommends an analysis of the study phase of PJM’s transmission planning to reduce the need for postponements of study results, to decrease study completion times, and to improve the likelihood that a project at a given phase in the study process will successfully go into service. (Priority: Medium. First reported 2014. Status: Partially adopted.)
ConclusionThe goal of PJM market design should be to enhance competition and to ensure that competition is the driver for all the key elements of PJM markets. But transmission investments have not been fully incorporated into competitive markets. The construction of new transmission facilities has significant impacts on the energy and capacity markets. But when generating units retire or load increases, there is no market mechanism in place that would require direct competition between transmission and generation to meet loads in the affected area. In addition, despite FERC Order No. 1000, there is not yet a transparent, robust and clearly defined mechanism to permit competition to build transmission projects, to ensure that competitors provide a total project cost cap, or to obtain least cost financing through the capital markets.
The addition of a planned transmission project changes the parameters of the capacity auction for the area, changes the amount of capacity needed in the
area, changes the capacity market supply and demand fundamentals in the area and may effectively forestall the ability of generation to compete. But there is no mechanism to permit a direct comparison, let alone competition, between transmission and generation alternatives. There is no mechanism to evaluate whether the generation or transmission alternative is less costly, whether there is more risk associated with the generation or transmission alternatives, or who bears the risks associated with each alternative. Creating such a mechanism should be an explicit goal of PJM market design.
The PJM queue evaluation process should be improved to ensure that barriers to competition for new generation investments are not created. Issues that need to be addressed include the ownership rights to CIRs, whether transmission owners should perform interconnection studies, and improvements in queue management.
The PJM rules for competitive transmission development through the RTEP should build upon FERC Order No. 1000 to create real competition between incumbent transmission providers and merchant transmission providers. PJM should enhance the transparency and queue management process for merchant transmission investment. Issues related to data access and complete explanations of cost impacts should be addressed. The goal should be to remove barriers to competition from merchant transmission. Another element of opening competition would be to consider transmission owners’ ownership of property and rights of way at or around transmission substations. In many cases, the land acquired included property intended to support future expansion of the grid. Incumbents have included the costs of the property in their rate base. Because PJM now has the responsibility for planning the development of the grid under its RTEP process, property bought to facilitate future expansion should be a part of the RTEP process and be made available to all providers on equal terms.
There are currently no market incentives for transmission owners to submit and complete transmission outages in a timely and efficient manner. Requiring transmission owners to pay does not create an effective incentive when those payments are passed through to transmission customers. The process for the

Section 12 Planning
2017 Quarterly State of the Market Report for PJM: January through March 495© 2017 Monitoring Analytics, LLC
submission of planned transmission outages needs to be carefully reviewed and redesigned to limit the ability of transmission owners to submit transmission outages that are late for FTR auction bid submission dates and are late for the Day-Ahead Energy Market. The submission of late transmission outages can inappropriately affect market outcomes when market participants do not have the ability to modify market bids and offers.
Planned Generation and RetirementsPlanned Generation AdditionsExpected net revenues provide incentives to build new generation to serve PJM markets. The amount of planned new generation in PJM reflects investors’ perception of the incentives provided by the combination of revenues from the PJM energy, capacity and ancillary service markets. On March 31, 2017, 99,325.3 MW of capacity were in generation request queues for construction through 2024, compared to an average installed capacity of 195,870.3 MW as of March 31, 2017. Although it is clear that not all generation in the queues will be built, PJM has added capacity.12 In the first three months of 2017, 2,462.4 MW of nameplate capacity went into service in PJM.
PJM Generation QueuesGeneration request queues are groups of proposed projects, including new units, reratings of existing units, capacity resources and energy only resources. Each queue is open for a fixed amount of time. Studies commence on all projects in a given queue when that queue closes. The duration of the queue period has varied. Queues A and B were open for a year. Queues C-T were open for six months. Starting in February 2008, Queues U-Y1 were open for three months. Starting in May 2012, the duration of the queue period was reset to six months, starting with Queue Y2. Queue AC2 closed on March 31, 2017. Queue AD1 began on April 1, 2017.
All projects that have been entered in a queue have a status assigned. Projects listed as active are undergoing one of the studies (feasibility, system impact, 12 See Monitoring Analytics, “New Generation in the PJM Capacity Market: MW and Funding Sources for Delivery Years 2007/2008 through
2018/2019,” <http://www.monitoringanalytics.com/reports/Reports/2016/New_Generation_in_the_PJM_Capacity_Market_20160504.pdf>.
facility) required to proceed. Other status options are under construction, suspended, and in service. Withdrawn projects are removed from the queue and listed separately. A project cannot be suspended until it has reached the status of under construction. Any project that entered the queue before February 1, 2011, can be suspended for up to three years. Projects that entered the queue after February 1, 2011, face an additional restriction in that the suspension period is reduced to one year if they affect any project later in the queue.13 When a project is suspended, PJM extends the scheduled milestones by the duration of the suspension. If, at any time, a milestone is not met, PJM will initiate the termination of the Interconnection Service Agreement (ISA) and the corresponding cancellation costs must be paid by the customer.14
Table 12-1 shows MW in queues by expected completion date and MW changes in the queues between December 31, 2016, and March 31 2017, for ongoing projects, i.e. projects with the status active, under construction or suspended.15 Projects that are already in service are not included here. The total MW in queues increased by 17,386.0 MW, or 21.2 percent, from 81,936.3 MW at the end of 2015.
Table 12-1 Queue comparison by expected completion year (MW): March 31, 2016 to March 31, 201716
Three Month Change Year As of 12/31/2016 As of 3/31/2017 MW Percent2016 21,064.0 0.0 (21,064.0) 0.0%2017 12,957.0 18,388.4 5,431.4 29.5%2018 14,859.6 25,891.8 11,032.2 42.6%2019 18,416.5 25,435.8 7,019.3 27.6%2020 10,869.3 17,001.1 6,131.8 36.1%2021 1,925.9 10,761.3 8,835.4 82.1%2022 250.0 1,230.0 980.0 79.7%2023 0.0 614.0 614.0 100.0%2024 1,594.0 0.0 (1,594.0) 0.0%Total 81,936.3 99,322.3 17,386.0 21.2%
13 See PJM. Manual 14C “Generation and Transmission Interconnection Process,” Revision 10 (October 1, 2016) Section 3.7 <http://www.pjm.com/~/media/documents/manuals/m14c.ashx>.
14 PJM does not track the duration of suspensions or PJM termination of projects.15 Expected completion dates are entered when the project enters the queue. Actual completion dates are generally different than expected
completion dates.16 Wind and solar capacity in Table 12-2 through Table 12-5 have not been adjusted to reflect derating.

2017 Quarterly State of the Market Report for PJM: January through March
496 Section 12 Planning © 2017 Monitoring Analytics, LLC
Table 12-2 shows the yearly project status changes in more detail and how scheduled queue capacity has changed between December 31, 2016, and March 31, 2017. For example, 8,668.4 MW entered the queue in the first three months of 2017 and 21.1 of these MW have been withdrawn in the first three months of 2017. Of the total 71,567.0 MW marked as active at the beginning of 2017, 749.6 MW were withdrawn, 85.0 MW were suspended, 661.3 MW started construction, and 28.0 MW went into service by the end of the quarter. The Under Construction column shows that 776.4 MW came out of suspension and 661.3 MW began construction in the first three months of 2017, in addition to the 20,406.5 MW of capacity that maintained the status under construction from the previous year.
Table 12-2 Change in project status (MW): December 31, 2016 to March 31, 2017
Status at 3/31/2017
Status at 12/31/2016Total at
12/31/2016 Active SuspendedUnder
Construction In Service Withdrawn(Entered in 2017) 8,668.4 0.0 0.0 0.0 21.1 Active 71,567.0 61,392.2 85.0 661.3 28.0 749.6 Suspended 5,790.0 0.0 4,925.7 776.4 0.0 87.9 Under Construction 24,045.3 0.0 2,409.8 20,406.5 1,089.8 130.3 In Service 46,436.0 0.0 0.0 0.0 46,404.0 0.0 Withdrawn 305,900.6 0.0 0.0 0.0 0.0 305,900.6 Total at 12/31/2016 70,060.6 7,420.5 21,844.2 47,521.8 306,889.5
Table 12-3 shows the amount of capacity active, in service, under construction, suspended, or withdrawn for each queue since the beginning of the RTEP process and the total amount of capacity that had been included in each queue. All items in queues A-M are either in service or have been withdrawn. As of March 17, 2017, there are 99,325.3 MW of capacity in queues that are not yet in service, of which 7.5 percent are suspended, 22.0 percent are under construction and 69.5 percent have not begun construction.
Table 12-3 Capacity in PJM queues (MW): At March 31, 201717
Queue Active In ServiceUnder
Construction Suspended Withdrawn TotalA Expired 31-Jan-98 0.0 8,103.0 0.0 0.0 17,252.0 25,355.0B Expired 31-Jan-99 0.0 4,645.5 0.0 0.0 15,656.7 20,302.2C Expired 31-Jul-99 0.0 531.0 0.0 0.0 3,474.8 4,005.8D Expired 31-Jan-00 0.0 850.6 0.0 0.0 7,369.0 8,219.6E Expired 31-Jul-00 0.0 795.2 0.0 0.0 8,033.8 8,829.0F Expired 31-Jan-01 0.0 52.0 0.0 0.0 3,092.5 3,144.5G Expired 31-Jul-01 0.0 1,189.6 0.0 0.0 17,980.8 19,170.4H Expired 31-Jan-02 0.0 702.5 0.0 0.0 8,421.9 9,124.4I Expired 31-Jul-02 0.0 103.0 0.0 0.0 3,738.3 3,841.3J Expired 31-Jan-03 0.0 40.0 0.0 0.0 846.0 886.0K Expired 31-Jul-03 0.0 98.9 0.0 0.0 485.3 584.2L Expired 31-Jan-04 0.0 256.5 0.0 0.0 4,033.7 4,290.2M Expired 31-Jul-04 0.0 504.8 0.0 0.0 3,705.6 4,210.4N Expired 31-Jan-05 0.0 2,398.8 38.0 0.0 8,090.3 10,527.0O Expired 31-Jul-05 0.0 1,668.2 437.0 0.0 5,466.8 7,572.0P Expired 31-Jan-06 0.0 3,037.3 253.0 0.0 5,320.5 8,610.8Q Expired 31-Jul-06 0.0 3,147.9 0.0 0.0 11,385.7 14,533.6R Expired 31-Jan-07 0.0 1,986.4 60.0 1,288.3 19,420.6 22,755.3S Expired 31-Jul-07 0.0 3,549.5 120.0 70.0 12,396.5 16,136.0T Expired 31-Jan-08 0.0 2,814.0 1,408.0 300.0 23,013.3 27,535.3U Expired 31-Jan-09 200.0 837.3 949.9 520.0 30,829.6 33,336.8V Expired 31-Jan-10 590.0 2,745.6 39.1 561.0 12,877.6 16,813.3W Expired 31-Jan-11 944.0 2,118.9 1,071.9 824.8 19,107.2 24,066.7X Expired 31-Jan-12 1,689.0 3,798.2 4,068.9 2,369.5 18,418.8 30,344.5Y Expired 30-Apr-13 833.5 719.1 4,737.6 794.2 18,655.2 25,739.5Z Expired 30-Apr-14 1,044.0 588.1 5,676.6 135.2 6,866.8 14,310.7AA1 Expired 31-Oct-14 4,588.1 141.7 1,677.7 244.8 5,349.6 12,001.9AA2 Expired 30-Apr-15 8,016.4 36.1 341.3 221.1 7,451.4 16,066.3AB1 Expired 31-Oct-15 12,646.0 52.2 807.5 71.9 6,720.9 20,298.5AB2 Expired 31-Mar-16 12,283.9 10.0 157.7 19.8 625.6 13,097.0AC1 Through 30-Sep-16 18,203.7 0.0 0.0 0.0 211.1 18,414.7AC2 Through 30-Apr-17 9,022.0 0.0 0.0 0.0 591.7 9,613.7Total 70,060.6 47,521.8 21,844.2 7,420.5 306,889.5 453,736.6
17 Projects listed as partially in service are counted as in service for the purposes of this analysis.

Section 12 Planning
2017 Quarterly State of the Market Report for PJM: January through March 497© 2017 Monitoring Analytics, LLC
Distribution of Units in the QueuesTable 12-4 shows the projects under construction, suspended, or active, by unit type, and control zone.18 As of March 31, 2017, 99,325.3 MW of capacity were in generation request queues for construction through 2024, compared to 81,963.3 MW at December 31, 2016.19 Table 12-4 also shows the planned retirements for each zone.
Table 12-4 Queue capacity by LDA, control zone and fuel (MW): At March 31, 201720
LDA Zone BioMass CC CT Diesel Fuel Cell Hydro Nuclear Solar Steam Storage WindTotal Queue
CapacityPlanned
RetirementsEMAAC AECO 0.0 1,667.0 469.0 0.0 1.9 0.0 0.0 99.1 0.0 20.0 175.0 2,432.1 303.0
DPL 16.0 742.0 57.0 32.8 0.0 0.0 0.0 1,547.7 0.0 26.0 499.6 2,921.1 34.0JCPL 0.0 2,047.2 0.0 0.0 0.4 0.0 0.0 255.2 0.0 95.0 0.0 2,397.9 614.5PECO 0.0 1,256.0 0.0 6.6 0.0 0.0 94.0 20.0 0.0 0.0 0.0 1,376.6 50.8PSEG 0.0 2,659.5 788.0 10.6 1.3 0.0 0.0 88.7 24.0 2.5 0.0 3,574.6 1,863.0RECO 0.0 0.0 0.0 0.0 0.0 0.0 0.0 0.0 0.0 0.0 0.0 0.0 0.0EMAAC Total 16.0 8,371.7 1,314.0 50.0 3.6 0.0 94.0 2,010.8 24.0 143.5 674.6 12,702.2 2,865.3
SWMAAC BGE 0.0 0.0 0.0 1.3 0.0 0.4 30.3 104.1 0.0 0.1 0.0 136.2 135.0Pepco 0.0 1,713.5 0.0 0.0 0.0 0.0 0.0 2.5 0.0 0.0 0.0 1,716.0 0.0SWMAAC Total 0.0 1,713.5 0.0 1.3 0.0 0.4 30.3 106.6 0.0 0.1 0.0 1,852.2 135.0
WMAAC Met-Ed 0.0 497.0 34.1 0.0 0.0 0.0 0.0 158.0 30.0 0.0 0.0 719.1 6.0PENELEC 0.0 1,333.0 521.1 141.0 0.0 17.0 0.0 63.5 590.0 0.0 458.8 3,124.4 0.0PPL 16.0 5,800.0 19.9 0.0 0.0 0.0 0.0 30.0 0.0 30.0 266.2 6,162.1 0.0WMAAC Total 16.0 7,630.0 575.1 141.0 0.0 17.0 0.0 251.5 620.0 30.0 725.0 10,005.6 6.0
Non-MAAC AEP 0.0 11,006.0 394.0 21.4 0.0 46.5 28.0 4,280.5 241.0 120.0 7,457.1 23,594.4 0.0AP 0.0 7,050.1 30.0 100.7 0.0 15.0 0.0 662.9 10.0 58.5 1,158.7 9,085.8 0.0ATSI 0.0 5,153.0 0.0 0.9 0.0 0.0 0.0 385.0 0.0 0.0 815.7 6,354.5 776.0ComEd 0.0 8,733.3 1,207.0 32.1 0.0 22.7 0.0 227.0 64.0 87.1 3,446.5 13,819.7 510.0DAY 0.0 1,150.0 0.0 0.0 0.0 0.0 0.0 841.9 12.0 39.9 300.0 2,343.8 2,941.0DEOK 0.0 . 0.0 4.8 0.0 0.0 0.0 290.0 20.0 19.8 0.0 334.6 0.0DLCO 0.0 205.0 0.0 0.0 0.0 0.0 0.0 0.0 0.0 20.0 0.0 225.0 0.0Dominion 62.5 8,299.4 155.0 8.0 0.0 0.0 0.0 8,567.6 14.0 134.0 917.1 18,157.6 728.0EKPC 0.0 614.0 0.0 0.0 0.0 0.0 0.0 160.0 0.0 0.0 0.0 774.0 0.0Non-MAAC Total 62.5 42,210.8 1,786.0 167.8 0.0 84.2 28.0 15,414.8 361.0 479.3 14,095.0 74,689.4 4,955.0
Total in PJM 94.5 59,926.0 3,675.1 360.1 3.6 101.6 152.3 17,783.7 1,005.0 652.9 15,494.6 99,249.3 7,961.3
A significant shift in the distribution of unit types within the PJM footprint continues to develop as natural gas fired units enter the queue and steam units retire. As of March 31, 2017, there were 16,207.9 MW of gas fired capacity under construction in PJM. As of March 31, 2017, there were only 120.0 MW of coal fired steam capacity under construction in PJM. With respect to retirements, 6,663.5 MW of coal fired steam capacity and 208.8 MW of natural gas capacity are
18 Unit types designated as reciprocating engines are classified as diesel.19 Since wind resources cannot be dispatched on demand, PJM rules previously required that the unforced capacity of wind resources be derated to 20 percent of namplate capacity until actual generation data are available. Beginning with Queue U, PJM derates wind resources to 13
percent of nameplate capacity until there is operational data to support a different conclusion. PJM derates solar resources to 38 percent of nameplate capacity. Based on the derating of 15,494.6 MW of wind resources and 17,783.7 MW of solar resources, the 99,325.3 MW currently active in the queue would be reduced to 74.819.2 MW.
20 This data includes only projects with a status of active, under-construction, or suspended.

2017 Quarterly State of the Market Report for PJM: January through March
498 Section 12 Planning © 2017 Monitoring Analytics, LLC
slated for deactivation between now and 2020. The replacement of coal steam units by natural gas units could significantly affect future congestion, the role of firm and interruptible gas supply, and natural gas supply infrastructure.
Planned RetirementsAs shown in Table 12-5, 32,314.5 MW have been, or are planned to be, retired between 2011 and 2020.21 Of that, 8,007.3 MW are planned to retire after the first three months of 2017. In the first three months of 2017, 209.0 MW were retired. Of the 8,007.3 MW pending retirement, 6,516.0 MW are coal units. The coal unit retirements were a result of low gas prices, low capacity prices and the investments required for compliance with the EPA’s Mercury and Air Toxics Standards (MATS) for some units.
Table 12-5 Summary of PJM unit retirements by fuel (MW): 2011 through 2020
Coal Diesel Heavy Oil Hydro KeroseneLandfill
Gas Light OilNatural
Gas Nuclear WindWood Waste Total
Retirements 2011 543.0 0.0 0.0 0.0 0.0 0.0 63.7 522.5 0.0 0.0 0.0 1,129.2 Retirements 2012 5,907.9 0.0 0.0 0.0 0.0 0.0 788.0 250.0 0.0 0.0 16.0 6,961.9 Retirements 2013 2,589.9 2.9 166.0 0.0 0.0 3.8 85.0 0.0 0.0 0.0 8.0 2,855.6 Retirements 2014 2,427.0 50.0 0.0 0.0 184.0 15.3 0.0 294.0 0.0 0.0 0.0 2,970.3 Retirements 2015 7,661.8 10.3 0.0 0.0 644.2 2.0 212.0 1,239.0 0.0 10.4 0.0 9,779.7 Retirements 2016 243.0 59.0 74.0 0.5 0.0 11.0 14.0 0.0 0.0 0.0 0.0 401.5 Retirements 2017 (Jan-Mar) 209.0 0.0 0.0 0.0 0.0 0.0 0.0 0.0 0.0 0.0 0.0 209.0 Planned Retirements for April 2017 and Later 6,516.0 2.4 182.0 0.0 0.0 0.0 30.6 661.8 614.5 0.0 0.0 8,007.3 Total 26,097.6 124.6 422.0 0.5 828.2 32.1 1,193.3 2,967.3 614.5 10.4 24.0 32,314.5
A map of the retirements between 2011 and 2020 is shown in Figure 12-1.
21 See PJM “Generator Deactivation Summary Sheets,” at <http://www.pjm.com/planning/generation-deactivation/gd-summaries.aspx> (June 2, 2016).

Section 12 Planning
2017 Quarterly State of the Market Report for PJM: January through March 499© 2017 Monitoring Analytics, LLC
Figure 12-1 Map of PJM unit retirements: 2011 through 2020

2017 Quarterly State of the Market Report for PJM: January through March
500 Section 12 Planning © 2017 Monitoring Analytics, LLC
The list of pending retirements is shown in Table 12-6.
Table 12-6 Planned retirement of PJM units: as of March 31, 2017
Unit Zone ICAP (MW) Fuel Unit Type
Projected Deactivation
DateYorktown 1-2 Dominion 323.0 Coal Steam 15-Apr-17McKee 1-2 DPL 34.0 Heavy Oil Combustion Turbine 31-May-17Hopewell James River Cogen Dominion 89.0 Coal Steam 31-May-17Hudson 2 PSEG 620.0 Coal Steam 01-Jun-17Mercer 1-2 PSEG 632.0 Coal Steam 01-Jun-17Edgecomb Rocky 1-2 Dominion 115.5 Coal Steam 01-Jun-17Spruance 1-2 (Rich 1-4) Dominion 200.0 Coal Steam 01-Jun-17Sewaren 1-4 PSEG 453.0 Kerosene Combustion Turbine 01-Jun-18Killen 2 DAY 600.0 Coal Steam 01-Jun-18Killen CT DAY 24.0 Heavy Oil Combustion Turbine 01-Jun-18Stuart 1-4 DAY 2,308.0 Coal Steam 01-Jun-18Stuart Diesels 1-4 DAY 9.0 Light Oil Diesel 01-Jun-18Bayonne Cogen Plant (CC) PSEG 158.0 Natural gas Steam 01-Nov-18MH50 Marcus Hook Co-gen PECO 50.8 Natural gas Steam 13-May-19BL England 2-3 AECO 303.0 Coal Steam 31-May-19Elmer Smith U1 External 52.0 Coal Steam 01-Jun-19Oyster Creek JCPL 614.5 Nuclear Nuclear 31-Dec-19Will County 4 ComEd 510.0 Coal Steam 31-May-20W H Sammis 1-4 ATSI 640.0 Coal Steam 31-May-20Wagner 2 BGE 135.0 Coal Steam 01-Jun-20Bay Shore 1 ATSI 136.0 Coal Steam 01-Oct-20Total 8,006.8
Table 12-7 shows the capacity, average size, and average age of units retiring in PJM, from 2011 through 2020, while Table 12-8 shows these retirements by state. The majority, 80.8 percent, of all MW retiring during this period are coal steam units. These units have an average age of 53.9 years and an average size of 169.5 MW. Over half of them, 55.9 percent, are located in either Ohio or Pennsylvania. Retirements have generally consisted of smaller subcritical coal steam units and those without adequate environmental controls to remain viable beyond 2016.
Table 12-7 Retirements by fuel type: 2011 through 2020Number of
UnitsAvg. Size
(MW)Avg. Age at
Retirement (Years) Total MW PercentCoal 154 169.5 53.9 26,097.6 80.8%Diesel 8 15.6 43.5 124.6 0.4%Heavy Oil 5 84.4 55.0 422.0 1.3%Hydro 1 0.5 100.0 0.5 0.0%Kerosene 20 41.4 45.5 828.2 2.6%Landfill Gas 9 3.6 14.0 32.1 0.1%Light Oil 20 59.7 43.7 1,193.3 3.7%Natural Gas 47 63.1 46.6 2,967.3 9.2%Nuclear 1 614.5 50.0 614.5 1.9%Wind 1 10.4 15.0 10.4 0.0%Wood Waste 2 12.0 23.5 24.0 0.1%Total 268 120.6 49.4 32,314.5 100.0%

Section 12 Planning
2017 Quarterly State of the Market Report for PJM: January through March 501© 2017 Monitoring Analytics, LLC
Table 12-8 Retirements (MW) by fuel type and state: 2011 through 2020
State Coal Diesel Hydro Heavy Oil KeroseneLandfill
Gas Light OilNatural
Gas Nuclear WindWood Waste Total
DC 0.0 0.0 0.0 0.0 0.0 0.0 788.0 0.0 0.0 0.0 0.0 788.0 DE 254.0 0.0 34.0 0.0 0.0 0.0 0.0 0.0 0.0 0.0 0.0 288.0 IL 2,134.0 0.0 0.0 0.0 0.0 6.4 0.0 0.0 0.0 0.0 0.0 2,140.4 IN 982.0 0.0 0.0 0.0 0.0 0.0 0.0 0.0 0.0 0.0 0.0 982.0 KY 1,047.0 0.0 0.0 0.0 0.0 0.0 0.0 0.0 0.0 0.0 0.0 1,047.0 MD 250.0 51.0 74.0 0.0 0.0 0.0 0.0 115.0 0.0 0.0 0.0 490.0 NC 324.5 0.0 0.0 0.0 0.0 0.0 31.0 0.0 0.0 0.0 0.0 355.5 NJ 1,543.0 8.0 148.0 0.5 828.2 7.7 212.0 2,600.5 614.5 0.0 0.0 5,962.4 OH 9,436.6 62.7 0.0 0.0 0.0 0.0 30.6 0.0 0.0 0.0 0.0 9,529.9 PA 5,145.0 0.0 166.0 0.0 0.0 16.0 131.7 251.8 0.0 10.4 24.0 5,744.9 VA 2,340.5 2.9 0.0 0.0 0.0 2.0 0.0 0.0 0.0 0.0 0.0 2,345.4 WV 2,641.0 0.0 0.0 0.0 0.0 0.0 0.0 0.0 0.0 0.0 0.0 2,641.0 Total 26,097.6 124.6 422.0 0.5 828.2 32.1 1,193.3 2,967.3 614.5 10.4 24.0 32,314.5
Generation Deactivations in 2017Table 12-9 shows the units that were deactivated in the first three months of 2017.
Table 12-9 Unit deactivations in January through March, 2017
Company Unit Name ICAP (MW) Primary Fuel Zone NameAverage Age
(Years)Retirement
DateExelon Corporation Roanoke Valley 1 165.0 Coal Dominion 22 01-Mar-17Exelon Corporation Roanoke Valley 2 44.0 Coal Dominion 21 01-Mar-17Total 209.0

2017 Quarterly State of the Market Report for PJM: January through March
502 Section 12 Planning © 2017 Monitoring Analytics, LLC
Generation MixAs of March 31, 2017, PJM had an installed capacity of 195,870.3 MW (Table 12-10). This measure differs from capacity market installed capacity because it includes energy-only units, excludes all external units, and uses nameplate values for solar and wind resources.
Table 12-10 Existing PJM capacity: At March 31, 2017 (By zone and unit type (MW))22
Zone CC CT Diesel Fuel Cell Hydroelectric Nuclear Solar Steam Storage Wind TotalAECO 901.9 570.7 14.6 0.0 0.0 0.0 41.7 815.9 0.0 7.5 2,352.3 AEP 6,100.0 3,682.2 80.3 0.0 1,071.9 3,211.0 10.1 18,897.8 6.0 2,204.0 35,263.3 APS 1,129.0 1,226.9 47.9 0.0 129.2 0.0 36.1 5,409.0 47.4 1,088.5 9,114.0 ATSI 1,570.5 1,618.3 67.7 0.0 0.0 2,134.0 0.0 5,719.0 0.0 0.0 11,109.5 BGE 0.0 789.0 18.4 0.0 0.0 1,716.0 0.0 2,921.5 0.0 0.0 5,444.9 ComEd 3,146.1 7,244.0 109.1 0.0 0.0 10,473.5 9.0 5,166.1 107.5 2,781.9 29,037.2 DAY 0.0 1,368.5 47.5 0.0 0.0 0.0 1.1 2,908.0 40.0 0.0 4,365.1 DEOK 47.2 654.0 0.0 0.0 112.0 0.0 0.0 3,567.0 20.0 0.0 4,400.2 DLCO 244.0 15.0 0.0 0.0 6.3 1,777.0 0.0 660.0 0.0 0.0 2,702.3 Dominion 7,651.6 3,761.7 151.8 0.0 3,589.3 3,581.3 157.8 7,775.0 0.0 208.0 26,876.5 DPL 1,498.5 1,820.4 96.1 30.0 0.0 0.0 100.0 1,620.0 0.0 0.0 5,165.0 EKPC 0.0 774.0 0.0 0.0 70.0 0.0 0.0 1,687.0 0.0 0.0 2,531.0 JCPL 2,682.5 763.1 16.1 0.0 400.0 614.5 164.1 10.0 0.0 0.0 4,650.3 Met-Ed 2,111.0 406.5 41.4 0.0 19.0 805.0 0.0 200.0 0.0 0.0 3,582.9 PECO 3,209.0 834.0 2.9 0.0 1,642.0 4,546.8 3.0 979.1 1.0 0.0 11,217.8 PENELEC 850.0 407.5 150.0 0.0 512.8 0.0 0.0 6,793.5 10.4 969.2 9,693.4 Pepco 955.0 1,091.7 9.9 0.0 0.0 0.0 0.0 3,649.1 0.0 0.0 5,705.7 PPL 2,657.9 602.2 55.5 0.0 706.6 2,520.0 15.0 5,169.9 20.0 219.7 11,966.8 PSEG 3,846.3 1,132.0 11.1 0.0 5.0 3,493.0 152.6 2,050.1 2.0 0.0 10,692.1 RECO 0.0 0.0 0.0 0.0 0.0 0.0 0.0 0.0 0.0 0.0 0.0 Total 38,600.5 28,761.7 920.3 30.0 8,264.1 34,872.1 690.5 75,998.0 254.3 7,478.8 195,870.3
Figure 12-2 and Table 12-11 show the age of PJM generators by unit type. Units older than 40 years comprise 75,616.4 MW, or 38.6 percent, of the total capacity of 195,870.3 MW.
Table 12-11 PJM capacity (MW) by age (years): At March 31, 2017Age (years) CC CT Diesel Fuel Cell Hydroelectric Nuclear Solar Steam Storage Wind TotalLess than 20 33,074.0 20,563.3 663.9 30.0 338.8 0.0 690.5 3,225.4 254.3 7,478.8 66,319.020 to 40 5,084.5 3,768.4 98.8 0.0 3,563.2 21,117.9 0.0 20,302.1 0.0 0.0 53,934.940 to 60 442.0 4,430.0 155.6 0.0 2,915.0 13,754.2 0.0 50,558.5 0.0 0.0 72,255.3More than 60 0.0 0.0 2.0 0.0 1,447.1 0.0 0.0 1,912.0 0.0 0.0 3,361.1Total 38,600.5 28,761.7 920.3 30.0 8,264.1 34,872.1 690.5 75,998.0 254.3 7,478.8 195,870.3
22 The capacity described in this section refers to all capacity in PJM at nameplate ratings, regardless of whether the capacity entered the RPM auction. This table previously included external units.

Section 12 Planning
2017 Quarterly State of the Market Report for PJM: January through March 503© 2017 Monitoring Analytics, LLC
Figure 12-2 PJM capacity (MW) by age (years): At March 31, 2017
0
10,000
20,000
30,000
40,000
50,000
60,000
70,000
80,000
CC CT Diesel Fuel Cell Hydro Nuclear Solar Steam Storage Wind
MW in
Ser
vice
Unit Type
> 60
40 to 60
20 to 40
< 20
Generation and Transmission Interconnection Planning ProcessPJM made changes to the queue process in May 2012.23 These changes included reducing the length of the queues, creating an alternate queue for some small projects, and adjustments to the rules regarding suspension rights and Capacity Interconnection Rights (CIR). PJM staff reported on June 11, 2015, that due to these and other process improvements, the study backlog has
23 See letter from PJM to Secretary Kimberly Bose, Docket No. ER12-1177-000 <http://www.pjm.com/~/media/documents/ferc/2012-filings/20120229-er12-1177-000.ashx>.
been significantly reduced.24 The Earlier Queue Submittal Task Force (EQSTF) was established in August 2015, to further address the issue.25
The Earlier Queue Submittal Task ForceIn 2015 and 2016, participants of the Earlier Queue Submittal Task Force (EQSTF) drafted rule changes to the Interconnection Queue process meant to address high levels of deficient project applications being submitted to PJM for review.
To discourage incomplete interconnection project requests, the EQSTF proposed to only assign queue positions for project applications that had submitted all required project elements including site control. In addition, all project applications would be required to remedy any deficiencies by the end of the queue window in order to be considered in feasibility studies or be terminated and withdrawn. Queue positions had historically been assigned to project developers that paid the study deposit and submitted a project application by the appropriate submission deadline. Project applications with missing information were assigned queue numbers so long as these two criteria were met.
The EQSTF also proposed rule changes to interconnection study fee structures that would discourage the submission of speculative or incomplete queue projects. Under the old rules, deposits provided by developers for interconnection studies could not be charged until after a queue position was accepted. Under the new rules, these deposits would be available for charging before a queue position is assigned.
In addition, rather than socializing the study costs for deficient applications from project developers, the EQSTF proposed that these project costs be assigned directly to the developer that submitted the project. This would significantly increase the cost burden that developers would experience if a project is found to be deficient in the review process.
24 See presentation by Dave Egan to the PJM Planning Committee, at <http://www.pjm.com/~/media/committees-groups/committees/pc/20150611/20150611-item-09-queue-status-update.ashx>.
25 See Earlier Queue Submittal Task Force at <http://www.pjm.com/committees-and-groups/task-forces/eqstf.aspx>.

2017 Quarterly State of the Market Report for PJM: January through March
504 Section 12 Planning © 2017 Monitoring Analytics, LLC
The EQSTF proposed to change the timing of queue windows and Feasibility Study dates to enable more generation projects to participate in the PJM Base Residual Auction. The EQSTF proposed shifting start dates for the queue windows back a month from May 1 to April 1 and Nov 1 to October 1. The EQSTF also proposed shifting feasibility study dates from Dec 1 to Nov 1 and June 1 to May 1.
Revisions to the OATT developed by the EQSTF were approved by the FERC effective October 31, 2016.26
On December 15, 2016, the Commission issued a notice of proposed rulemaking proposing additional queue reforms intended to improve certainty, promote more informed interconnection, and enhance interconnection processes.
Interconnection Study PhaseIn the study phase of the interconnection planning process, a series of studies are performed to determine the feasibility, impact, and cost of projects in the queue. Table 12-12 is an overview of PJM’s study process. System impact and facilities studies are often redone when a project is withdrawn in order to determine the impact on the projects remaining in the queue.
Table 12-12 PJM generation planning process
Process Step Start on Financial ObligationDays for PJM to Complete
Days for Applicant to Decide Whether
to ContinueFeasibility Study Close of current queue Cost of study (partially
refundable deposit)90 30
System Impact Study Upon acceptance of the System Impact Study Agreement
Cost of study (partially refundable deposit)
120 30
Facilities Study Upon acceptance of the Facilities Study Agreement
Cost of study (refundable deposit)
Varies 60
Schedule of Work Upon acceptance of Interconnection Service
Agreement (ISA)
Letter of credit for upgrade costs
Varies 37
Construction (only for new generation) Upon acceptance of Interconnection Construction
Service Agreement (ICSA)
None Varies NA
26 See Letter Order, ER16-2518-000 (Oct. 7, 2016).
Manual 14B requires PJM to apply a commercial probability factor at the feasibility study stage to improve the accuracy of capacity and cost estimates. The commercial probability factor is based on the historical incidence of projects dropping out of the queue at the impact study stage.27 The impact and facilities studies are performed using the full amount of planned generation in the queues. The actual withdrawal rates are shown in Table 12-13 and Table 12-14.
Table 12-13 shows the milestone status when projects were withdrawn, for all withdrawn projects. Of the projects withdrawn, 49.5 percent were withdrawn before the system impact study was completed. Once an Interconnection Service Agreement (ISA) or a Wholesale Market Participation Agreement (WMPA) is executed, the financial obligation for any necessary transmission upgrades cannot be retracted.28 29 Withdrawing at or beyond this point is uncommon; only 245 projects, or 13.2 percent, of all projects withdrawn were withdrawn after reaching this milestone.
27 See PJM Manual 14B. “PJM Region Transmission Planning Process,” Revision 33 (May 5, 2016), p.70.28 “Generators planning to connect to the local distribution systems at locations that are not under FERC jurisdiction and wish to
participate in PJM’s market need to execute a PJM Wholesale Market Participation Agreement (WMPA)…” instead of an ISA. See PJM Manual 14C. “Generation and Transmission Interconnection Facility Construction,” Revision 10 (October 1, 2016), p.8.
29 See PJM. “Manual 14C: Generation and Transmission Interconnection Facility Construction,” Revision 10 (October 1, 2016), p.22.

Section 12 Planning
2017 Quarterly State of the Market Report for PJM: January through March 505© 2017 Monitoring Analytics, LLC
Table 12-13 Last milestone at time of withdrawal: January 1, 1997 through March 31, 2017
Milestone CompletedProjects
Withdrawn PercentAverage
DaysMaximum
DaysNever Started 106 5.7% 163 1,235 Feasibility Study 814 43.8% 318 3,238 System Impact Study 442 23.8% 591 3,174 Facilities Study 253 13.6% 1,271 4,210 Construction Service Agreement (CSA) or beyond 245 13.2% 1,313 4,249 Total 1,860 100.0%
Table 12-14 and Table 12-15 show the time spent at various stages in the queue process and the completion time for the studies performed. For completed projects, there is an average time of 991 days, or 2.7 years, between entering a queue and going into service. For withdrawn projects, there is an average time of 635 days, or 1.7 years, between entering a queue and withdrawing.
Table 12-14 Average project queue times (days): At March 31, 2017
Status Average (Days)Standard Deviation Minimum Maximum
Active 886 538 2 3,745In-Service 991 715 1 4,024Suspended 2,095 1,176 610 5,108Under Construction 1,684 985 427 4,652Withdrawn 635 665 1 4,249
Table 12-15 presents information on the time in the stages of the queue for those projects not yet in service. Of the 858 projects in the queue as of March 31, 2017, 83 had a completed feasibility study and 166 were under construction.
Table 12-15 PJM generation planning summary: At March 31, 2017
Milestone ReachedNumber of
ProjectsPercent of
Total Projects Average DaysMaximum
DaysUnder Review 418 48.7% 767 2,540Feasibility Study 83 9.7% 976 1,943System Impact Study 107 12.5% 985 3,651Facilities Study 84 9.8% 1,925 4,260Construction Service Agreement (CSA) or beyond 166 19.3% 2,078 5,108Total 858 100.0%
The time it takes to complete a study depends on the backlog and the number of projects in the queue, but not on the size of the project. Table 12-16 shows the number of projects that entered the queue by year. The number of queue entries has increased during the past three years, primarily by renewable projects (solar, hydro, storage, biomass, wind). Of the 844 projects entered in 2014, 2015, and 2016, 594, 70.3 percent, were renewable. Of the 163 projects entered 2016, 135, 82.8 percent, were renewable.

2017 Quarterly State of the Market Report for PJM: January through March
506 Section 12 Planning © 2017 Monitoring Analytics, LLC
Table 12-16 Number of projects entered in the queue as of March 31, 2017Fuel Group
Year Entered Nuclear Renewable Traditional Grand Total1997 2 0 11 13 1998 0 0 18 18 1999 1 5 85 91 2000 2 3 79 84 2001 4 6 83 93 2002 3 14 33 50 2003 1 35 17 53 2004 4 17 32 53 2005 3 78 51 132 2006 9 78 70 157 2007 9 68 142 219 2008 3 114 99 216 2009 10 113 50 173 2010 5 381 55 441 2011 6 265 78 349 2012 2 73 80 155 2013 1 78 73 152 2014 0 122 68 190 2015 0 191 114 305 2016 2 265 67 334 2017 2 135 26 163 Total 69 2,041 1,331 3,441
Even though renewable projects comprise the majority of projects entered in the queue, as well as what is currently active in the queue, renewable projects only account for 35.2 percent of the nameplate MW currently active in the queue (Table 12-17).
Table 12-17 Queue details by fuel group: March 31, 2017
Fuel GroupNumber of
ProjectsPercent of
Projects MW Percent MWNuclear 8 0.9% 152.3 0.2%Renewable 613 69.7% 35,423.3 35.2%Traditional 258 29.4% 65,045.8 64.6%Total 879 100.0% 100,621.4 100.0%
Table 12-18 shows the current status of all generation queue projects by fuel type and project classification from January 1, 1997, through March 31, 2017. For example, between January 1, 1997 and March 31, 2017, 140 nameplate capacity upgrades at natural gas fired facilities have completed the queue process and are in service.
Since 1997, there have been a total of 3,441 projects in PJM generation queues. A total of 2,810 projects have been classified as new generation and 631 projects have been classified as upgrades. Wind, solar and natural gas projects have accounted for 2,690 projects, or 78.2 percent, of all 3,441 generation queue projects. A total of 145 new projects from either project classification entered the generation queue in the first three months of 2017.

Section 12 Planning
2017 Quarterly State of the Market Report for PJM: January through March 507© 2017 Monitoring Analytics, LLC
Table 12-18 Status of all generation queue projects: January 1, 1997 through March 31, 2017
Project StatusProject Classification
Number of ProjectsNatural
Gas Wind Coal Solar Nuclear Hydro Oil Biomass Storage Other LFG Diesel TOTAL
In ServiceNew Generation 91 61 9 104 1 10 4 7 16 3 71 6 383 Upgrade 140 15 45 16 42 16 14 5 3 4 15 2 317
Under ConstructionNew Generation 31 26 - 62 - 4 - - 28 - 6 - 157 Upgrade 30 - 5 3 - 1 - 2 2 - - - 43
SuspendedNew Generation 14 16 1 28 - - - 1 6 - 1 - 67 Upgrade 5 3 - - - - - - 3 - - - 11
WithdrawnNew Generation 406 372 54 633 9 40 9 32 65 10 76 12 1,718 Upgrade 65 14 12 9 9 2 13 1 7 2 8 2 144
ActiveNew Generation 75 43 - 336 1 1 - 2 22 - 5 - 485 Upgrade 74 7 5 11 7 1 - 1 4 3 - 3 116
Total ProjectsNew Generation 617 518 64 1,163 11 55 13 42 137 13 159 18 2,810 Upgrade 314 39 67 39 58 20 27 9 19 9 23 7 631
Table 12-19 Status of all generation queue projects as percent of total projects by classification: January 1, 1997 through March 31, 2017
Project StatusProject Classification
Percent of Total Projects by ClassificationNatural
Gas Wind Coal Solar Nuclear Hydro Oil Biomass Storage Other LFG Diesel
In ServiceNew Generation 14.7% 11.8% 14.1% 8.9% 9.1% 18.2% 30.8% 16.7% 11.7% 23.1% 44.7% 33.3%Upgrade 44.6% 38.5% 67.2% 41.0% 72.4% 80.0% 51.9% 55.6% 15.8% 44.4% 65.2% 28.6%
Under ConstructionNew Generation 5.0% 5.0% 0.0% 5.3% 0.0% 7.3% 0.0% 0.0% 20.4% 0.0% 3.8% 0.0%Upgrade 9.6% 0.0% 7.5% 7.7% 0.0% 5.0% 0.0% 22.2% 10.5% 0.0% 0.0% 0.0%
SuspendedNew Generation 2.3% 3.1% 1.6% 2.4% 0.0% 0.0% 0.0% 2.4% 4.4% 0.0% 0.6% 0.0%Upgrade 1.6% 7.7% 0.0% 0.0% 0.0% 0.0% 0.0% 0.0% 15.8% 0.0% 0.0% 0.0%
WithdrawnNew Generation 65.8% 71.8% 84.4% 54.4% 81.8% 72.7% 69.2% 76.2% 47.4% 76.9% 47.8% 66.7%Upgrade 20.7% 35.9% 17.9% 23.1% 15.5% 10.0% 48.1% 11.1% 36.8% 22.2% 34.8% 28.6%
ActiveNew Generation 12.2% 8.3% 0.0% 28.9% 9.1% 1.8% 0.0% 4.8% 16.1% 0.0% 3.1% 0.0%Upgrade 23.6% 17.9% 7.5% 28.2% 12.1% 5.0% 0.0% 11.1% 21.1% 33.3% 0.0% 42.9%
Table 12-19 shows the MW in Table 12-18 by share by classification as new generation or upgrade. Within a fuel type the shares of upgrades add to 100 percent and the shares of new generation add to 100 percent. For example, 80.0 percent of all hydro projects classified as upgrades are currently in service in PJM, 10.0 percent of hydro upgrades were withdrawn, 5.0 percent of hydro upgrades are under construction, and 5.0 percent of hydro upgrades are active in the queue. From January 1, 1997, through March 31, 2017, solar projects
have had the lowest completion rate across all technology types for projects classified as new generation and storage projects have had the lowest completion rate across all technology types for projects classified as upgrades. Landfill gas projects have had the highest completion rate across all technology types for projects classified as new generation and hydro projects have had the highest completion rate across all technology types for projects classified as upgrades.

2017 Quarterly State of the Market Report for PJM: January through March
508 Section 12 Planning © 2017 Monitoring Analytics, LLC
Table 12-20 shows the nameplate generating capacity of projects in the PJM generation queue by technology type and project classification. For example, the 372 new generation wind projects that have been withdrawn from the queue as of March 31, 2017 listed in Table 12-18 constitute 58,499.7 MW of nameplate capacity. The 472 new generation and upgrade natural gas projects that have been withdrawn in the same time period constitute 188,622.0 MW of nameplate capacity.
Table 12-20 Status of all generation capacity (MW) in the PJM generation queue: January 1, 1997 through March 31, 2017
Project StatusProject Classification
Project MWNatural
Gas Wind Coal Solar Nuclear Hydro Oil Biomass Storage Other LFG Diesel TOTAL
In ServiceNew Generation 24,046.1 6,671.2 1,378.0 824.2 9.0 565.6 607.0 225.7 155.4 50.0 382.6 69.5 34,984.2Upgrade 6,363.4 33.7 755.5 19.4 3,912.8 605.6 125.8 58.8 36.4 547.5 53.4 25.3 12,537.5
Under ConstructionNew Generation 14,553.8 3,989.9 0.0 1,188.2 0.0 35.6 0.0 0.0 71.1 0.0 35.5 0.0 19,874.1Upgrade 1,654.1 0.0 120.0 64.5 0.0 17.0 0.0 62.5 52.0 0.0 0.0 0.0 1,970.1
SuspendedNew Generation 3,487.8 2,867.4 80.0 322.0 0.0 0.0 0.0 16.0 75.8 0.0 0.9 0.0 6,849.8Upgrade 365.7 175.0 0.0 0.0 0.0 0.0 0.0 0.0 30.0 0.0 0.0 0.0 570.7
WithdrawnNew Generation 180,030.6 58,499.7 33,431.6 8,391.8 8,161.0 1,988.0 1,721.0 1,027.7 720.1 843.8 426.5 63.9 295,305.6Upgrade 8,591.4 367.0 815.0 48.9 916.0 56.0 589.0 12.1 92.1 24.0 43.4 29.0 11,583.9
ActiveNew Generation 38,821.3 8,201.5 0.0 16,849.9 28.0 15.0 0.0 12.0 344.5 0.0 39.0 0.0 64,311.1Upgrade 5,789.6 260.8 91.0 655.2 124.3 34.0 0.0 4.0 79.5 1.1 0.0 6.1 7,045.6
Total ProjectsNew Generation 260,939.6 80,229.7 34,889.6 27,576.0 8,198.0 2,604.2 2,328.0 1,281.4 1,366.9 893.8 884.4 133.4 421,324.9Upgrade 22,764.2 836.4 1,781.5 788.0 4,953.1 712.6 714.8 137.4 290.0 572.6 96.8 60.4 33,707.8
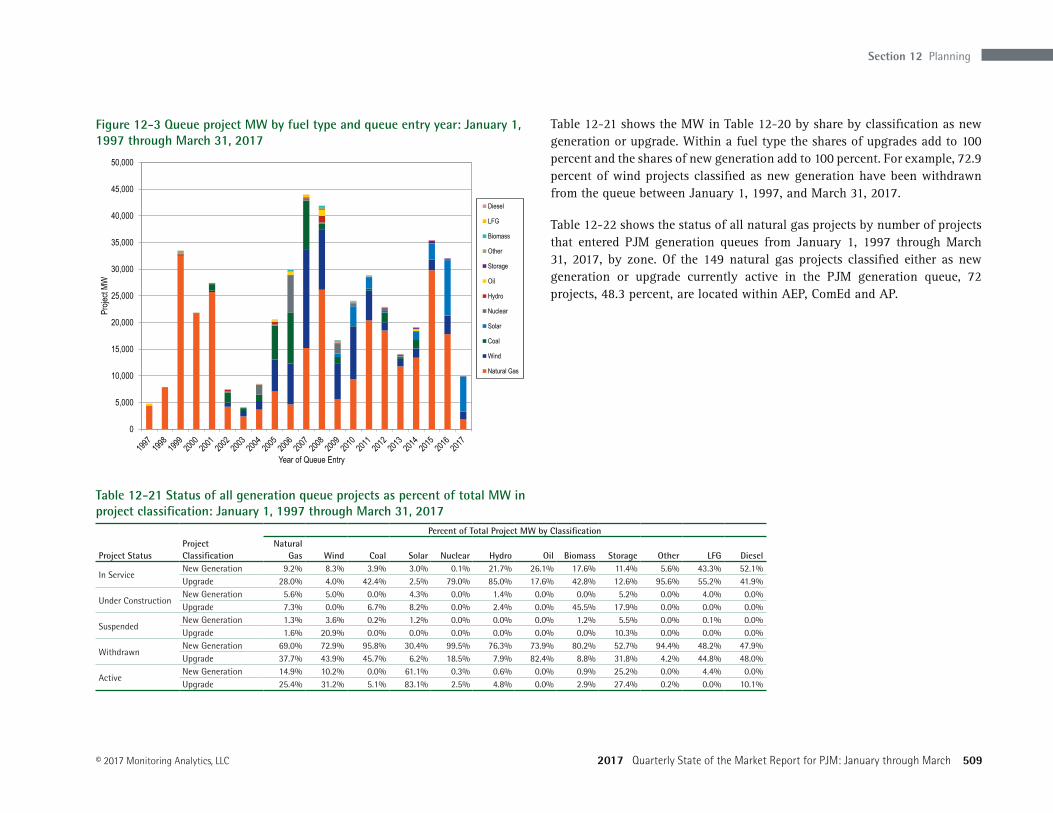
Figure 12-3 shows the project MW that have entered the PJM generation queue by fuel type and year of entry. In 2015 and 2016, natural gas, wind, and solar projects accounted for the majority of all new projects entering the generation queue. The increase in solar projects entering the queue in 2016 from 2015 was primarily a result of new projects in Dominion. The increase in solar projects entering the queue in the first three months of 2017 was primarily a result of new projects in AEP.
Section 12 Planning
2017 Quarterly State of the Market Report for PJM: January through March 509© 2017 Monitoring Analytics, LLC
Figure 12-3 Queue project MW by fuel type and queue entry year: January 1, 1997 through March 31, 2017
0
5,000
10,000
15,000
20,000
25,000
30,000
35,000
40,000
45,000
50,000
Proje
ct MW
Year of Queue Entry
Diesel
LFG
Biomass
Other
Storage
Oil
Hydro
Nuclear
Solar
Coal
Wind
Natural Gas
Table 12-21 Status of all generation queue projects as percent of total MW in project classification: January 1, 1997 through March 31, 2017
Project StatusProject Classification
Percent of Total Project MW by ClassificationNatural
Gas Wind Coal Solar Nuclear Hydro Oil Biomass Storage Other LFG Diesel
In ServiceNew Generation 9.2% 8.3% 3.9% 3.0% 0.1% 21.7% 26.1% 17.6% 11.4% 5.6% 43.3% 52.1%Upgrade 28.0% 4.0% 42.4% 2.5% 79.0% 85.0% 17.6% 42.8% 12.6% 95.6% 55.2% 41.9%
Under ConstructionNew Generation 5.6% 5.0% 0.0% 4.3% 0.0% 1.4% 0.0% 0.0% 5.2% 0.0% 4.0% 0.0%Upgrade 7.3% 0.0% 6.7% 8.2% 0.0% 2.4% 0.0% 45.5% 17.9% 0.0% 0.0% 0.0%
SuspendedNew Generation 1.3% 3.6% 0.2% 1.2% 0.0% 0.0% 0.0% 1.2% 5.5% 0.0% 0.1% 0.0%Upgrade 1.6% 20.9% 0.0% 0.0% 0.0% 0.0% 0.0% 0.0% 10.3% 0.0% 0.0% 0.0%
WithdrawnNew Generation 69.0% 72.9% 95.8% 30.4% 99.5% 76.3% 73.9% 80.2% 52.7% 94.4% 48.2% 47.9%Upgrade 37.7% 43.9% 45.7% 6.2% 18.5% 7.9% 82.4% 8.8% 31.8% 4.2% 44.8% 48.0%
ActiveNew Generation 14.9% 10.2% 0.0% 61.1% 0.3% 0.6% 0.0% 0.9% 25.2% 0.0% 4.4% 0.0%Upgrade 25.4% 31.2% 5.1% 83.1% 2.5% 4.8% 0.0% 2.9% 27.4% 0.2% 0.0% 10.1%
Table 12-21 shows the MW in Table 12-20 by share by classification as new generation or upgrade. Within a fuel type the shares of upgrades add to 100 percent and the shares of new generation add to 100 percent. For example, 72.9 percent of wind projects classified as new generation have been withdrawn from the queue between January 1, 1997, and March 31, 2017.
Table 12-22 shows the status of all natural gas projects by number of projects that entered PJM generation queues from January 1, 1997 through March 31, 2017, by zone. Of the 149 natural gas projects classified either as new generation or upgrade currently active in the PJM generation queue, 72 projects, 48.3 percent, are located within AEP, ComEd and AP.

2017 Quarterly State of the Market Report for PJM: January through March
510 Section 12 Planning © 2017 Monitoring Analytics, LLC
Table 12-22 Status of all natural gas generation queue projects: January 1, 1997 through March 31, 2017
Project StatusProject Classification
Number of ProjectsAECO AEP AP ATSI BGE ComEd DAY DEOK Dominion DPL DLCO EKPC JCPL Met-Ed PECO PENELEC Pepco PPL PSEG RECO TOTAL
In ServiceNew Generation 7 2 7 1 6 2 0 1 4 7 0 0 8 4 7 8 7 9 11 0 91Upgrade 7 9 8 1 3 9 6 0 30 13 0 0 5 1 8 6 4 6 24 0 140
Under ConstructionNew Generation 3 4 3 1 1 0 0 0 4 0 1 0 1 0 2 1 2 5 3 0 31Upgrade 2 3 2 1 0 6 0 0 3 0 0 0 1 0 3 0 1 4 4 0 30
SuspendedNew Generation 2 2 2 0 0 0 0 0 0 1 0 0 1 0 0 5 1 0 0 0 14Upgrade 0 1 0 0 0 0 0 0 2 0 0 0 1 0 0 1 0 0 0 0 5
WithdrawnNew Generation 24 11 39 13 11 9 0 1 17 18 2 2 23 25 41 47 32 34 55 2 406Upgrade 5 1 4 3 0 1 0 1 7 4 0 0 5 7 2 4 3 4 14 0 65
ActiveNew Generation 4 11 9 4 0 12 1 0 3 2 0 1 2 1 1 9 0 4 11 0 75Upgrade 2 17 7 2 0 16 0 0 11 1 0 0 1 4 3 2 0 4 4 0 74
Total ProjectsNew Generation 40 30 60 19 18 23 1 2 28 28 3 3 35 30 51 70 42 52 80 2 617Upgrade 16 31 21 7 3 32 6 1 53 18 0 0 13 12 16 13 8 18 46 0 314
Table 12-23 shows the status of all gas projects by MW that entered PJM generation queues from January 1, 1997 through March 31, 2017, by zone. Of the 44,610.9 MW of natural gas projects classified either as new generation or upgrade currently active in the PJM generation queue, 23,622.8 MW, 52.9 percent, are located within AEP, ComEd and Dominion.
Table 12-23 Status of all natural gas generation capacity (MW) in the PJM generation queue: January 1, 1997 through March 31, 2017
Project StatusProject Classification
Project MW
AECO AEP AP ATSI BGE ComEd DAY DEOK Dominion DPL DLCO EKPC JCPL Met-Ed PECO PENELEC Pepco PPL PSEG RECO TOTAL
In ServiceNew Generation 1,016.2 1,615.0 1,701.0 16.5 390.0 629.0 0.0 20.0 3,211.0 1,122.2 0.0 0.0 2,070.3 2,052.0 2,464.3 1,267.1 840.0 3,576.6 2,054.9 0.0 24,046.1
Upgrade 265.7 244.0 812.7 40.0 6.5 849.5 60.0 0.0 1,446.7 189.0 0.0 0.0 224.0 10.0 715.0 103.0 105.1 327.3 964.9 0.0 6,363.4
Under ConstructionNew Generation 453.5 2,729.0 954.4 800.0 1.3 0.0 0.0 0.0 3,655.1 0.0 205.0 0.0 0.4 0.0 760.5 590.0 755.0 3,074.0 575.6 0.0 14,553.8
Upgrade 41.0 21.0 45.0 161.0 0.0 112.6 0.0 0.0 225.0 0.0 0.0 0.0 0.0 0.0 206.0 0.0 64.5 524.0 254.0 0.0 1,654.1
SuspendedNew Generation 606.0 1,110.0 39.8 0.0 0.0 0.0 0.0 0.0 0.0 291.0 0.0 0.0 440.0 0.0 0.0 107.0 894.0 0.0 0.0 0.0 3,487.8
Upgrade 0.0 20.0 0.0 0.0 0.0 0.0 0.0 0.0 144.1 0.0 0.0 0.0 200.0 0.0 0.0 1.6 0.0 0.0 0.0 0.0 365.7
WithdrawnNew Generation 6,932.2 5,535.0 15,941.0 5,420.7 4,792.1 3,958.0 0.0 134.5 11,066.0 5,651.4 665.0 377.8 11,286.0 12,486.5 23,270.0 16,557.0 19,769.2 13,576.7 22,604.7 6.9 180,030.6
Upgrade 122.8 610.0 567.0 86.0 0.0 10.0 0.0 36.0 305.3 668.0 0.0 0.0 253.0 1,730.0 205.0 1,040.6 85.0 480.0 2,392.7 0.0 8,591.4
ActiveNew Generation 805.4 6,959.0 5,695.8 4,047.0 0.0 7,383.3 1,150.0 0.0 3,544.5 508.0 0.0 614.0 1,267.2 450.0 220.0 1,795.5 0.0 1,878.9 2,502.7 0.0 38,821.3
Upgrade 232.0 603.0 444.7 145.0 0.0 2,537.0 0.0 0.0 885.7 60.0 0.0 0.0 140.0 111.1 70.0 91.0 0.0 343.0 127.1 0.0 5,789.6
Total ProjectsNew Generation 9,813.3 17,948.0 24,332.0 10,284.2 5,183.4 11,970.3 1,150.0 154.5 21,476.6 7,572.6 870.0 991.8 15,063.9 14,988.5 26,714.8 20,316.6 22,258.2 22,106.2 27,737.9 6.9 260,939.6
Upgrade 661.5 1,498.0 1,869.4 432.0 6.5 3,509.1 60.0 36.0 3,006.8 917.0 0.0 0.0 817.0 1,851.1 1,196.0 1,236.2 254.6 1,674.3 3,738.7 0.0 22,764.2

Section 12 Planning
2017 Quarterly State of the Market Report for PJM: January through March 511© 2017 Monitoring Analytics, LLC
Table 12-24 shows the status of all wind generation projects that entered PJM generation queues from January 1, 1997 through March 31, 2017, by zone. Of the 76 wind projects to achieve in service status, 65 projects, 85.5 percent are located within ComEd, AEP, AP and PENELEC. Of the 50 wind projects currently active in the PJM generation queue, 39 projects, 78.0 percent are located within AEP, ComEd and AP.
Table 12-24 Status of all wind generation queue projects: January 1, 1997 through March 31, 2017
Project StatusProject Classification
Number of ProjectsAECO AEP AP ATSI BGE ComEd DAY DEOK Dominion DPL DLCO EKPC JCPL Met-Ed PECO PENELEC Pepco PPL PSEG RECO TOTAL
In ServiceNew Generation 1 8 11 0 0 17 0 0 0 0 0 0 1 1 0 18 0 4 0 0 61Upgrade 0 0 3 0 0 2 0 0 0 0 0 0 0 0 0 6 0 4 0 0 15
Under ConstructionNew Generation 1 9 7 0 0 4 0 0 4 0 0 0 0 0 0 1 0 0 0 0 26Upgrade 0 0 0 0 0 0 0 0 0 0 0 0 0 0 0 0 0 0 0 0 0
SuspendedNew Generation 1 7 1 1 0 1 2 0 0 0 0 0 0 0 0 2 0 1 0 0 16Upgrade 1 1 1 0 0 0 0 0 0 0 0 0 0 0 0 0 0 0 0 0 3
WithdrawnNew Generation 15 82 41 6 0 92 13 0 13 9 0 1 1 0 0 59 0 39 1 0 372Upgrade 1 0 7 0 0 1 0 0 1 0 0 0 0 0 0 2 0 2 0 0 14
ActiveNew Generation 0 20 2 2 0 12 0 0 2 2 0 0 0 0 0 1 0 2 0 0 43Upgrade 0 0 3 0 0 2 0 0 0 0 0 0 0 0 0 2 0 0 0 0 7
Total ProjectsNew Generation 18 126 62 9 0 126 15 0 19 11 0 1 2 1 0 81 0 46 1 0 518Upgrade 2 1 14 0 0 5 0 0 1 0 0 0 0 0 0 10 0 6 0 0 39
Table 12-25 Status of all wind generation capacity (MW) in the PJM generation queue: January 1, 1997 through March 31, 2017
Project StatusProject Classification
Project MWAECO AEP AP ATSI BGE ComEd DAY DEOK Dominion DPL DLCO EKPC JCPL Met-Ed PECO PENELEC Pepco PPL PSEG RECO TOTAL
In ServiceNew Generation 7.5 2,052.0 1,004.0 0.0 0.0 2,413.5 0.0 0.0 0.0 0.0 0.0 0.0 30.6 70.0 0.0 894.4 0.0 199.2 0.0 0.0 6,671.2Upgrade 0.0 0.0 0.0 0.0 0.0 0.0 0.0 0.0 0.0 0.0 0.0 0.0 0.0 0.0 0.0 6.4 0.0 27.3 0.0 0.0 33.7
Under ConstructionNew Generation 150.0 1,318.3 782.6 0.0 0.0 978.5 0.0 0.0 690.5 0.0 0.0 0.0 0.0 0.0 0.0 70.0 0.0 0.0 0.0 0.0 3,989.9Upgrade 0.0 0.0 0.0 0.0 0.0 0.0 0.0 0.0 0.0 0.0 0.0 0.0 0.0 0.0 0.0 0.0 0.0 0.0 0.0 0.0 0.0
SuspendedNew Generation 20.0 1,198.3 69.1 500.0 0.0 500.0 300.0 0.0 0.0 0.0 0.0 0.0 0.0 0.0 0.0 180.0 0.0 100.0 0.0 0.0 2,867.4Upgrade 5.0 100.0 70.0 0.0 0.0 0.0 0.0 0.0 0.0 0.0 0.0 0.0 0.0 0.0 0.0 0.0 0.0 0.0 0.0 0.0 175.0
WithdrawnNew Generation 3,626.4 15,573.1 3,010.1 645.6 0.0 21,515.8 1,828.0 0.0 2,156.5 2,310.0 0.0 150.3 60.0 0.0 0.0 4,897.6 0.0 2,706.3 20.0 0.0 58,499.7Upgrade 0.0 0.0 199.0 0.0 0.0 4.0 0.0 0.0 78.0 0.0 0.0 0.0 0.0 0.0 0.0 80.0 0.0 6.0 0.0 0.0 367.0
ActiveNew Generation 0.0 4,840.5 217.0 315.7 0.0 1,798.0 0.0 0.0 226.6 499.6 0.0 0.0 0.0 0.0 0.0 138.0 0.0 166.2 0.0 0.0 8,201.5Upgrade 0.0 0.0 20.0 0.0 0.0 170.0 0.0 0.0 0.0 0.0 0.0 0.0 0.0 0.0 0.0 70.8 0.0 0.0 0.0 0.0 260.8
Total ProjectsNew Generation 3,803.9 24,982.2 5,082.8 1,461.3 0.0 27,205.8 2,128.0 0.0 3,073.6 2,809.6 0.0 150.3 90.6 70.0 0.0 6,180.0 0.0 3,171.7 20.0 0.0 80,229.7Upgrade 5.0 100.0 289.0 0.0 0.0 174.0 0.0 0.0 78.0 0.0 0.0 0.0 0.0 0.0 0.0 157.1 0.0 33.3 0.0 0.0 836.4
Table 12-25 shows the wind project capacity in MW of all wind generation projects that have entered the PJM generation queue from January 1, 1997 through March 31, 2017, by zone. Of the 6,704.9 MW of wind generation capacity to achieve in service status, 6,370.3 MW, or 95.0 percent of nameplate capacity is located within ComEd, AEP, AP and PENELEC. Of the 8,462.3 MW of wind generation capacity currently active in the PJM generation queue, 7,045.5 MW of generation capacity or 83.2 percent is located within AEP, ComEd and AP.

2017 Quarterly State of the Market Report for PJM: January through March
512 Section 12 Planning © 2017 Monitoring Analytics, LLC
Table 12-26 shows the status of all solar generation projects that have entered the PJM generation queue from January 1, 1997 through March 31, 2017, by zone. Out of a total of 1,199 solar projects in the PJM generation queue, 503 projects or 42.0 percent have been located in JCPL, AECO and PSEG, all zones in New Jersey. Of these three zones, AECO has the lowest completion rates for new generation and upgrade solar projects. Excluding currently active projects, only 5.1 percent of solar projects classified as new generation or upgrades in AECO are either in service or under construction. Of these three zones, PSEG has the highest completion rates. Excluding currently active projects, 44.1 percent of solar projects classified as either new generation or upgrades in PSEG are either in service or under construction.
The number of currently active new generation solar projects is also highly concentrated in several zones. Out of 344 active new generation solar projects, 125 projects, or 36.3 percent of all currently active new generation solar projects are located in Dominion. Out of 344 active new generation solar projects, 68, or 21.7 percent of all currently active new generation solar projects are located in AEP.
Table 12-26 Status of all solar generation queue projects: January 1, 1997 through March 31, 2017
Project StatusProject Classification
Number of ProjectsAECO AEP AP ATSI BGE ComEd DAY DEOK Dominion DPL DLCO EKPC JCPL Met-Ed PECO PENELEC Pepco PPL PSEG RECO TOTAL
In ServiceNew Generation 5 4 2 0 1 1 1 0 7 9 0 0 35 0 1 0 0 2 36 0 104Upgrade 0 0 0 0 0 0 0 0 2 8 0 0 6 0 0 0 0 0 0 0 16
Under ConstructionNew Generation 3 4 7 0 2 0 1 0 18 6 0 0 12 0 0 0 0 0 9 0 62Upgrade 0 0 0 0 0 0 0 0 2 1 0 0 0 0 0 0 0 0 0 0 3
SuspendedNew Generation 0 3 12 0 0 0 1 0 1 2 0 0 5 1 0 1 0 0 2 0 28Upgrade 0 0 0 0 0 0 0 0 0 0 0 0 0 0 0 0 0 0 0 0 0
WithdrawnNew Generation 147 17 44 6 4 7 4 5 51 81 0 0 153 11 5 10 6 27 55 0 633Upgrade 1 1 0 0 0 0 0 0 1 0 0 0 5 0 0 0 0 1 0 0 9
ActiveNew Generation 12 71 10 4 6 14 12 4 118 53 1 3 7 3 1 2 1 2 9 0 333Upgrade 0 0 1 0 0 0 0 1 7 1 0 0 0 0 0 0 0 0 1 0 11
Total ProjectsNew Generation 167 99 75 10 13 22 19 9 195 151 1 3 212 15 7 13 7 31 111 0 1160Upgrade 1 1 1 0 0 0 0 1 12 10 0 0 11 0 0 0 0 1 1 0 39
Table 12-27 shows the status of all solar generation project MW that have entered the PJM generation queue from January 1, 1997 through March 31, 2017, by zone. Out of a total of 28,264.0 MW of solar nameplate capacity in the PJM generation queue, 4,226.3 MW or 15.0 percent have been located in JCPL, AECO and PSEG, all of which are zones in New Jersey. Solar projects in Dominion have accounted for 11,153.0 MW or 39.5 percent of all solar project nameplate capacity in the PJM queue from January 1, 1997 through March 31, 2017. Solar projects in DPL have accounted for 2,833.6 MW or 10.0 percent of all solar project nameplate capacity in the PJM queue from January 1, 1997 through March 31, 2017.

Section 12 Planning
2017 Quarterly State of the Market Report for PJM: January through March 513© 2017 Monitoring Analytics, LLC
Table 12-27 Current status of all solar generation capacity (MW) in the PJM generation queue: January 1, 1997 through March 31, 2017
Project StatusProject Classification
Project MWAECO AEP AP ATSI BGE ComEd DAY DEOK Dominion DPL DLCO EKPC JCPL Met-Ed PECO PENELEC Pepco PPL PSEG RECO TOTAL
In ServiceNew Generation 38.5 14.7 34.0 0.0 1.1 9.0 2.5 0.0 172.0 118.4 0.0 0.0 234.3 0.0 3.3 0.0 0.0 15.0 181.4 0.0 824.2Upgrade 0.0 0.0 0.0 0.0 0.0 0.0 0.0 0.0 3.1 0.0 0.0 0.0 16.3 0.0 0.0 0.0 0.0 0.0 0.0 0.0 19.4
Under ConstructionNew Generation 20.8 40.0 81.3 0.0 22.0 0.0 3.4 0.0 753.0 49.0 0.0 0.0 167.6 0.0 0.0 0.0 0.0 0.0 51.2 0.0 1,188.2Upgrade 0.0 0.0 0.0 0.0 0.0 0.0 0.0 0.0 64.5 0.0 0.0 0.0 0.0 0.0 0.0 0.0 0.0 0.0 0.0 0.0 64.5
SuspendedNew Generation 0.0 49.9 143.4 0.0 0.0 0.0 20.0 0.0 5.0 25.5 0.0 0.0 52.0 3.0 0.0 13.5 0.0 0.0 9.7 0.0 322.0Upgrade 0.0 0.0 0.0 0.0 0.0 0.0 0.0 0.0 0.0 0.0 0.0 0.0 0.0 0.0 0.0 0.0 0.0 0.0 0.0 0.0 0.0
WithdrawnNew Generation 1,628.8 332.3 750.1 60.1 9.2 84.8 51.5 83.0 1,791.2 1,167.5 0.0 0.0 1,249.4 367.0 50.1 34.3 58.1 283.7 390.6 0.0 8,391.8Upgrade 10.0 6.0 0.0 0.0 0.0 0.0 0.0 0.0 8.0 0.0 0.0 0.0 23.8 0.0 0.0 0.0 0.0 1.1 0.0 0.0 48.9
ActiveNew Generation 78.3 4,540.6 428.2 385.0 22.1 367.0 818.5 264.9 7,807.3 1,453.2 15.0 160.0 35.7 155.0 20.0 130.0 2.5 30.0 36.5 0.0 16,749.9Upgrade 0.0 0.0 10.0 0.0 0.0 0.0 0.0 75.0 548.9 20.0 0.0 0.0 0.0 0.0 0.0 0.0 0.0 0.0 1.3 0.0 655.2
Total ProjectsNew Generation 1,766.5 4,977.4 1,437.0 445.1 54.4 460.8 895.9 347.9 10,528.5 2,813.6 15.0 160.0 1,738.9 525.0 73.4 177.8 60.6 328.7 669.5 0.0 27,476.0Upgrade 10.0 6.0 10.0 0.0 0.0 0.0 0.0 75.0 624.5 20.0 0.0 0.0 40.1 0.0 0.0 0.0 0.0 1.1 1.3 0.0 788.0
Table 12-28 shows the relationship between the project developer and Transmission Owner for all project MW that have entered the PJM generation queue from January 1, 1997 through March 31, 2017 by zone and technology type. A project where the developer is or is affiliated with the Transmission Owner is classified as related. A project where the developer is not affiliated with the Transmission Owner is classified as unrelated. For example, 36.0 MW of natural gas fired generation projects that have entered the PJM generation queue in DEOK were projects developed by Duke Energy or subsidiaries of Duke Energy, the Transmission Owner for DEOK. These project MW are classified as “related.” There have been 154.5 MW of natural gas fired projects that have entered the PJM generation queue in DEOK by developers not affiliated with Duke Energy. These project MW are classified as “unrelated.”

2017 Quarterly State of the Market Report for PJM: January through March
514 Section 12 Planning © 2017 Monitoring Analytics, LLC
Table 12-28 Relationship between project developer and Transmission Owner for all interconnection queue projects MW by fuel type: January 1, 1997 through March 31, 2017
MW by Fuel Type
Parent CompanyTransmission Owner
Related To Developer
Number of Projects Biomass Coal Diesel Hydro Landfill Gas Natural Gas Nuclear Other Solar Wind Total MW
AEP AEP Related 49 0.0 3,965.0 0.0 34.0 3.0 3,027.0 214.0 0.0 74.7 0.0 7,317.7Unrelated 364 501.1 10,292.0 7.5 448.4 83.8 19,493.0 0.0 66.0 4,913.7 25,178.8 60,984.3
AES DAY Related 16 0.0 1,347.5 0.0 0.0 0.0 51.0 0.0 0.0 24.0 0.0 1,422.5Unrelated 35 1.9 0.0 0.0 0.0 10.0 9.0 0.0 0.0 471.9 2,128.0 2,620.8
DLCO DLCO Related 0 0.0 0.0 0.0 0.0 0.0 0.0 0.0 0.0 0.0 0.0 0.0Unrelated 20 0.0 2,810.0 0.0 106.0 19.2 870.0 1,879.0 0.0 0.0 0.0 5,684.2
Dominion Dominion Related 83 64.0 301.0 0.0 340.0 0.0 13,215.0 1,944.0 0.0 251.4 142.0 16,257.4Unrelated 287 343.7 20.0 10.0 29.5 184.0 12,051.1 0.0 156.3 13,335.6 2,913.0 29,043.2
Duke DEOK Related 4 0.0 0.0 0.0 0.0 0.0 36.0 0.0 0.0 0.0 0.0 36.0Unrelated 18 0.0 70.0 0.0 112.0 4.8 154.5 0.0 0.0 373.0 0.0 714.3
EKPC EKPC Related 0 0.0 0.0 0.0 0.0 0.0 0.0 0.0 0.0 0.0 0.0 0.0Unrelated 8 0.0 0.0 0.0 0.0 0.0 2,141.8 0.0 0.0 160.0 150.3 2,452.1
Exelon AECO Related 3 0.0 0.0 0.0 0.0 0.0 730.0 0.0 0.0 0.0 0.0 730.0Unrelated 268 29.8 15.0 13.0 0.0 31.0 9,783.6 0.0 0.0 1,786.3 3,808.9 15,467.6
BGE Related 14 0.0 10.0 0.0 0.0 0.0 1,037.0 3,373.3 0.0 20.0 0.0 4,440.3Unrelated 59 0.0 0.0 29.0 140.4 9.5 4,152.9 0.0 132.0 34.4 0.0 4,498.2
ComEd Related 18 0.0 0.0 0.0 0.0 0.0 0.0 1,185.0 0.0 9.0 396.0 1,590.0Unrelated 253 90.0 1,926.0 42.0 22.7 112.9 15,479.4 0.0 20.0 311.8 27,379.8 45,384.6
DPL Related 10 0.0 0.0 0.0 0.0 0.0 1,716.0 0.0 0.0 31.4 0.0 1,747.4Unrelated 252 62.2 653.0 0.0 0.0 58.4 6,773.6 0.0 30.0 2,954.9 2,809.6 13,341.7
PECO Related 29 0.0 7.0 0.0 45.0 0.0 6,420.0 437.8 0.0 0.0 0.0 6,909.8Unrelated 78 0.0 0.0 12.1 220.0 18.7 21,490.8 0.0 0.0 73.4 0.0 21,815.0
Pepco Related 1 0.0 0.0 0.0 0.0 0.0 0.0 1,640.0 0.0 0.0 0.0 1,640.0Unrelated 63 0.0 0.0 0.0 0.0 12.5 22,623.9 0.0 0.0 58.1 0.0 22,694.5
First Energy AP Related 14 0.0 1,745.0 0.0 252.0 0.0 4,790.0 0.0 0.0 0.0 0.0 6,787.0Unrelated 303 177.2 4,057.0 53.8 371.3 125.8 21,427.9 0.0 96.0 1,491.9 5,282.7 33,083.5
ATSI Related 8 0.0 0.0 0.0 0.0 0.0 1,678.0 16.0 0.0 0.6 0.0 1,694.6Unrelated 50 0.0 0.0 0.0 0.0 35.3 9,021.7 0.0 135.0 444.5 1,461.3 11,097.8
JCPL Related 2 0.0 0.0 0.0 20.0 0.0 100.0 0.0 0.0 0.0 0.0 120.0Unrelated 310 30.0 0.0 0.0 1.6 24.4 15,780.9 0.0 0.0 1,797.4 90.6 17,724.8
Met-Ed Related 0 0.0 0.0 0.0 0.0 0.0 0.0 0.0 0.0 0.0 0.0 0.0Unrelated 89 90.4 0.0 8.0 0.0 57.9 16,839.6 93.0 11.0 525.0 70.0 17,694.9
PENELEC Related 8 0.0 1,860.0 0.0 32.0 0.0 1,174.0 0.0 0.0 0.0 0.0 3,066.0Unrelated 214 0.0 561.0 8.0 53.3 50.9 20,396.8 0.0 621.0 97.8 6,454.1 28,242.8
PPL PPL Related 36 0.0 139.0 0.0 0.0 7.7 2,294.0 1,988.0 0.0 0.0 0.0 4,428.7Unrelated 187 28.5 6,868.6 10.4 2.6 95.4 21,486.5 0.0 152.5 329.8 3,205.0 32,179.2
PSEG PSEG Related 101 0.0 24.0 0.0 0.0 11.7 12,802.1 381.0 0.0 125.2 0.0 13,344.0Unrelated 164 0.0 0.0 0.0 1,000.0 24.4 18,673.2 0.0 45.5 535.1 20.0 20,298.2
Consolidated Edison, Inc. RECO Related 0 0.0 0.0 0.0 0.0 0.0 0.0 0.0 0.0 0.0 0.0 0.0Unrelated 2 0.0 0.0 0.0 0.0 0.0 6.9 0.0 0.0 0.0 0.0 6.9
TotalRelated 396 64.0 9,398.5 0.0 723.0 22.4 49,070.1 11,179.1 0.0 536.3 538.0 71,531.4Unrelated 3,024 1,354.8 27,272.6 193.8 2,507.8 958.8 238,657.0 1,972.0 1,465.3 29,694.4 80,952.0 385,028.5

Section 12 Planning
2017 Quarterly State of the Market Report for PJM: January through March 515© 2017 Monitoring Analytics, LLC
Table 12-29 shows the relationship between the project developer and Transmission Owner for all solar project MW that have entered the PJM generation queue from January 1, 1997 through March 31, 2017, by zone and project status. Of the 1,318.7 solar project MW that have achieved in service or under construction status during this time period, 186.9 MW, or 16.5 percent have been developed by Transmission Owners building in their own service territory. Of that 186.9 MW of solar projects, 115.8 MW or 62.0 percent have been developed by PSEG in the PSEG Zone and 20.0 MW or 10.7 percent have been developed by Dominion in the Dominion Zone.
Table 12-29 Relationship between project developer and Transmission Owner for all solar project MW in PJM interconnection queue: January 1, 1997 through March 31, 2017
Parent Company Transmission Owner Related To DeveloperMW by Project Status
In Service Under Construction Suspended Withdrawn Active Total MWAEP AEP Related 2.5 12.2 0.0 0.0 60.0 74.7
Unrelated 0.0 20.0 51.7 336.5 4,505.6 4,913.7AES DAY Related 0.0 0.0 0.0 0.0 0.0 0.0
Unrelated 2.5 23.4 0.0 51.5 418.5 495.9DLCO DLCO Related 0.0 0.0 0.0 0.0 0.0 0.0
Unrelated 0.0 0.0 0.0 0.0 0.0 0.0Dominion Dominion Related 20.0 0.0 0.0 7.0 224.4 251.4
Unrelated 140.1 122.9 205.0 1,511.2 11,356.4 13,335.6Duke DEOK Related 0.0 0.0 0.0 0.0 0.0 0.0
Unrelated 0.0 0.0 0.0 83.0 290.0 373.0EKPC EKPC Related 0.0 0.0 0.0 0.0 0.0 0.0
Unrelated 0.0 0.0 0.0 0.0 160.0 160.0Exelon AECO Related 0.0 0.0 0.0 0.0 0.0 0.0
Unrelated 38.5 20.8 0.0 1,638.8 88.1 1,786.3BGE Related 0.0 20.0 0.0 0.0 0.0 20.0
Unrelated 1.1 2.0 0.0 9.2 22.1 34.4ComEd Related 9.0 0.0 0.0 0.0 0.0 9.0
Unrelated 0.0 0.0 0.0 84.8 227.0 311.8DPL Related 7.4 0.0 0.0 24.0 0.0 31.4
Unrelated 21.0 159.5 0.0 1,094.5 1,679.9 2,954.9PECO Related 0.0 0.0 0.0 0.0 0.0 0.0
Unrelated 3.3 0.0 0.0 50.1 20.0 73.4Pepco Related 0.0 0.0 0.0 0.0 0.0 0.0
Unrelated 0.0 0.0 0.0 58.1 0.0 58.1First Energy AP Related 0.0 0.0 0.0 0.0 0.0 0.0
Unrelated 34.0 32.5 38.9 692.2 694.3 1,491.9ATSI Related 0.0 0.0 0.0 0.6 0.0 0.6
Unrelated 0.0 0.0 0.0 59.5 385.0 444.5JCPL Related 0.0 0.0 0.0 0.0 0.0 0.0
Unrelated 204.1 175.5 92.9 1,235.2 89.7 1,797.4Met-Ed Related 0.0 0.0 0.0 0.0 0.0 0.0
Unrelated 0.0 0.0 3.0 367.0 155.0 525.0PENELEC Related 0.0 0.0 0.0 0.0 0.0 0.0
Unrelated 0.0 0.0 13.5 34.3 50.0 97.8PPL PPL Related 0.0 0.0 0.0 0.0 0.0 0.0
Unrelated 15.0 16.0 0.0 268.8 30.0 329.8PSEG PSEG Related 105.8 10.0 0.0 8.2 1.2 125.2
Unrelated 53.8 46.2 9.7 382.5 42.9 535.1Consolidated Edison, Inc. RECO Related 0.0 0.0 0.0 0.0 0.0 0.0
Unrelated 0.0 0.0 0.0 0.0 0.0 0.0Total Related 144.7 42.2 0.0 39.8 285.6 512.3
Unrelated 513.4 618.8 414.7 7,957.0 20,214.5 29,718.4

2017 Quarterly State of the Market Report for PJM: January through March
516 Section 12 Planning © 2017 Monitoring Analytics, LLC
Table 12-30 shows the relationship between the project developer and Transmission Owner for all natural gas fired project MW that have entered the PJM generation queue from January 1, 1997 through March 31, 2017, by zone and project status. Of the 46,198.0 natural gas project MW that have achieved in service or under construction status during this time period, 10,382.0 MW, or 22.5 percent have been developed by Transmission Owners building in their own service territory. Of that 10,382.0 MW of natural gas projects, 5,571.0 MW or 53.7 percent have been developed by Dominion in the Dominion zone and 1,972.0 MW or 19.0 percent have been developed by PSEG in the PSEG Zone.
Table 12-30 Relationship between project developer and Transmission Owner for all natural gas project MW in PJM interconnection queue: January 1, 1997 through March 31, 2017
Parent Company Transmission Owner Related To DeveloperMW by Project Status
In Service Under Construction Suspended Withdrawn Active Total MWAEP AEP Related 717.0 0.0 0.0 0.0 2,310.0 3,027.0
Unrelated 1,142.0 3,355.0 525.0 6,145.0 8,326.0 19,493.0AES DAY Related 0.0 0.0 0.0 0.0 0.0 0.0
Unrelated 60.0 0.0 0.0 0.0 0.0 60.0DLCO DLCO Related 0.0 0.0 0.0 0.0 0.0 0.0
Unrelated 0.0 205.0 0.0 665.0 0.0 870.0Dominion Dominion Related 3,823.0 1,748.0 0.0 7,476.0 168.0 13,215.0
Unrelated 771.7 1,799.1 0.0 3,895.3 5,585.0 12,051.1Duke DEOK Related 0.0 0.0 0.0 36.0 0.0 36.0
Unrelated 20.0 0.0 0.0 134.5 0.0 154.5EKPC EKPC Related 0.0 0.0 0.0 0.0 0.0 0.0
Unrelated 0.0 0.0 0.0 377.8 1,764.0 2,141.8Exelon AECO Related 0.0 0.0 0.0 730.0 0.0 730.0
Unrelated 1,281.9 460.5 606.0 6,324.8 1,110.4 9,783.6BGE Related 367.0 0.0 0.0 670.0 0.0 1,037.0
Unrelated 29.5 1.3 0.0 4,122.1 0.0 4,152.9ComEd Related 0.0 0.0 0.0 0.0 0.0 0.0
Unrelated 1,478.5 112.6 0.0 3,958.0 9,930.3 15,479.4DPL Related 411.0 0.0 0.0 1,305.0 0.0 1,716.0
Unrelated 900.2 0.0 291.0 5,014.4 568.0 6,773.6PECO Related 5.0 0.0 0.0 6,415.0 0.0 6,420.0
Unrelated 3,174.3 892.5 0.0 17,060.0 364.0 21,490.8Pepco Related 0.0 0.0 0.0 0.0 0.0 0.0
Unrelated 160.1 2,498.5 0.0 19,854.2 111.1 22,623.9First Energy AP Related 701.0 0.0 0.0 4,089.0 0.0 4,790.0
Unrelated 1,796.7 962.5 70.1 12,393.1 6,205.5 21,427.9ATSI Related 0.0 0.0 0.0 1,678.0 0.0 1,678.0
Unrelated 40.0 961.0 0.0 3,808.8 4,211.9 9,021.7JCPL Related 0.0 0.0 0.0 100.0 0.0 100.0
Unrelated 2,294.3 440.0 200.0 10,879.0 1,967.6 15,780.9Met-Ed Related 0.0 0.0 0.0 0.0 0.0 0.0
Unrelated 2,062.0 0.0 0.0 14,216.5 561.1 16,839.6PENELEC Related 5.0 0.0 0.0 1,169.0 0.0 1,174.0
Unrelated 1,267.8 88.7 59.7 16,408.7 2,571.9 20,396.8PPL PPL Related 633.0 0.0 0.0 1,661.0 0.0 2,294.0
Unrelated 2,420.9 3,924.0 0.0 12,395.7 2,745.9 21,486.5PSEG PSEG Related 1,972.0 0.0 0.0 9,871.1 959.0 12,802.1
Unrelated 1,047.8 167.6 0.0 14,905.3 2,552.5 18,673.2Consolidated Edison, Inc. RECO Related 0.0 0.0 0.0 0.0 0.0 0.0
Unrelated 0.0 0.0 0.0 6.9 0.0 6.9
TotalRelated 8,634.0 1,748.0 0.0 35,200.1 3,437.0 49,019.1Unrelated 19,947.7 15,868.3 1,751.8 152,565.0 48,575.2 238,708.0

Section 12 Planning
2017 Quarterly State of the Market Report for PJM: January through March 517© 2017 Monitoring Analytics, LLC
Table 12-31 shows the relationship between the project developer and Transmission Owner for all wind project MW that have entered the PJM generation queue from January 1, 1997 through March 31, 2017, by zone and project status. Of the 10,584.3 wind project MW that have achieved in service or under construction status during this time period, 408.0 MW, or 3.9 percent have been developed by Transmission Owners building in their own service territory. Of that 408.0 MW of wind projects, 396.0 MW or 97.1 percent have been developed by Exelon in the ComEd Zone.
Table 12-31 Relationship between project developer and Transmission Owner for all wind project MW in PJM interconnection queue: January 1, 1997 through March 31, 2017
Parent Company Transmission Owner Related To Developer
MW by Project Status
In Service Under Construction Suspended Withdrawn Active Total MWAEP AEP Related 0.0 0.0 0.0 0.0 0.0 0.0
Unrelated 2,052.0 966.6 1,650.0 14,383.8 6,126.4 25,178.8AES DAY Related 0.0 0.0 0.0 0.0 0.0 0.0
Unrelated 0.0 0.0 300.0 1,828.0 0.0 2,128.0DLCO DLCO Related 0.0 0.0 0.0 0.0 0.0 0.0
Unrelated 0.0 0.0 0.0 0.0 0.0 0.0Dominion Dominion Related 0.0 12.0 0.0 130.0 0.0 142.0
Unrelated 0.0 673.9 300.0 1,730.9 208.2 2,913.0Duke DEOK Related 0.0 0.0 0.0 0.0 0.0 0.0
Unrelated 0.0 0.0 0.0 0.0 0.0 0.0EKPC EKPC Related 0.0 0.0 0.0 0.0 0.0 0.0
Unrelated 0.0 0.0 0.0 150.3 0.0 150.3Exelon AECO Related 0.0 0.0 0.0 0.0 0.0 0.0
Unrelated 7.5 150.0 25.0 3,626.4 0.0 3,808.9BGE Related 0.0 0.0 0.0 0.0 0.0 0.0
Unrelated 0.0 0.0 0.0 0.0 0.0 0.0ComEd Related 396.0 0.0 0.0 0.0 0.0 396.0
Unrelated 2,238.5 802.5 710.0 20,859.8 2,769.0 27,379.8DPL Related 0.0 0.0 0.0 0.0 0.0 0.0
Unrelated 0.0 100.0 0.0 2,210.0 499.6 2,809.6PECO Related 0.0 0.0 0.0 0.0 0.0 0.0
Unrelated 0.0 0.0 0.0 0.0 0.0 0.0Pepco Related 0.0 0.0 0.0 0.0 0.0 0.0
Unrelated 0.0 0.0 0.0 0.0 0.0 0.0First Energy AP Related 0.0 0.0 0.0 0.0 0.0 0.0
Unrelated 1,031.4 426.0 130.0 3,027.5 667.8 5,282.7ATSI Related 0.0 0.0 0.0 0.0 0.0 0.0
Unrelated 0.0 500.0 0.0 645.6 315.7 1,461.3JCPL Related 0.0 0.0 0.0 0.0 0.0 0.0
Unrelated 30.6 0.0 0.0 60.0 0.0 90.6Met-Ed Related 0.0 0.0 0.0 0.0 0.0 0.0
Unrelated 70.0 0.0 0.0 0.0 0.0 70.0PENELEC Related 0.0 0.0 0.0 0.0 0.0 0.0
Unrelated 862.5 38.3 150.0 4,927.6 475.8 6,454.1PPL PPL Related 0.0 0.0 0.0 0.0 0.0 0.0
Unrelated 226.5 0.0 100.0 2,443.8 434.7 3,205.0PSEG PSEG Related 0.0 0.0 0.0 0.0 0.0 0.0
Unrelated 0.0 0.0 0.0 20.0 0.0 20.0Consolidated Edison, Inc. RECO Related 0.0 0.0 0.0 0.0 0.0 0.0
Unrelated 0.0 0.0 0.0 0.0 0.0 0.0Total Related 396.0 12.0 0.0 130.0 0.0 538.0
Unrelated 6,519.0 3,657.3 3,365.0 55,913.7 11,497.1 80,952.0

2017 Quarterly State of the Market Report for PJM: January through March
518 Section 12 Planning © 2017 Monitoring Analytics, LLC
Transmission Facility OutagesScheduling Transmission Facility Outage RequestsA transmission facility is designated as reportable by PJM if a change in its status can affect a transmission constraint on any Monitored Transmission Facility or could impede free flowing ties within the PJM RTO and/or adjacent areas.30 When one of the reportable transmission facilities needs to be taken out of service, the TO is required to submit an outage request as early as possible. The specific timeline is shown in Table 12-33.31
Transmission outages have significant impacts on PJM markets. There are impacts on FTR auctions, on congestion, and on expected market outcomes in the day-ahead and real-time markets. It is important for the efficient functioning of the markets that there be clear, enforceable rules governing transmission outages.
Transmission outages are categorized by duration: greater than 30 calendar days; less than or equal to 30 calendar days and greater than five calendar days; or less than or equal to five calendar days.32 Table 12-32 shows that 73.9 percent of the requested outages were planned for less than or equal to five days and 11.4 percent of requested outages were planned for greater than 30 days in the first three months of 2017. All of the outage data in this section except in the analysis for the FTR market are for outages scheduled to occur in the first three months of 2016 and 2017, regardless of when they were initially submitted.33 The outage data in the analysis for the FTR market are for outages scheduled to occur in the planning periods 2015 to 2016 and 2016 to 2017.
30 If a transmission facility is not modeled in the PJM EMS or the facility is not expected to significantly impact PJM system security or congestion management, it is not reportable. See PJM. “Manual 3A: Energy Management System (EMS) Model Updates and Quality Assurance (QA), Revision 12 (September 30, 2016).
31 See PJM. “Manual 3: Transmission Operations,” Revision 50 (December 1, 2016), p.68.32 See PJM. “Manual 3: Transmission Operations,” Revision 50 (December 1, 2016), p.70.33 The hotline tickets, EMS tripping tickets or test outage tickets were excluded. We only included all the transmission outage tickets
submitted by PJM internal companies which are currently active.
Table 12-32 Transmission facility outage request summary by planned duration: January 1 through March 31, 2016 and 2017
2016 (Jan - Mar) 2017 (Jan - Mar)Planned Duration (Days) Outage Requests Percent Outage Requests Percent<=5 3,496 74.4% 3,338 73.9%>5 & <=30 688 14.6% 665 14.7%>30 514 10.9% 513 11.4%Total 4,698 100.0% 4,516 100.0%
After receiving a transmission facility outage request from a TO, PJM assigns a received status to the request based on its submission date and outage planned duration. The received status can be On Time or Late, as defined in Table 12-33.34
The purpose of the rules defined in Table 12-33 is to require the TOs to submit transmission facility outages prior to the Financial Transmission Right (FTR) auctions so that market participants have complete information about market conditions on which to base their FTR bids and so that PJM can accurately model market conditions.35
Table 12-33 PJM transmission facility outage request received status definition Planned Duration (Calendar Days) Request Submitted
Received Status
<=5Before the 1st of the month one month prior to the starting month of the outage On TimeAfter or on the 1st of the month one month prior to the starting month of the outage Late
> 5 & <=30Before the 1st of the month six months prior to the starting month of the outage On TimeAfter or on the 1st of the month six months prior to the starting month of the outage Late
>30The earlier of 1) February 1st, 2) the 1st of the month six months prior to the starting month of the outage On TimeAfter or on the earlier of 1) February 1st, 2) the 1st of the month six months prior to the starting month of the outage Late
34 See PJM. “Manual 3: Transmission Operations,” Revision 50 (December 1, 2016), p.69 and p.70.35 See “Report of PJM Interconnection, L.L.C. on Transmission Oversight Procedures,” Docket No. EL01-122-000 (November 2, 2001).
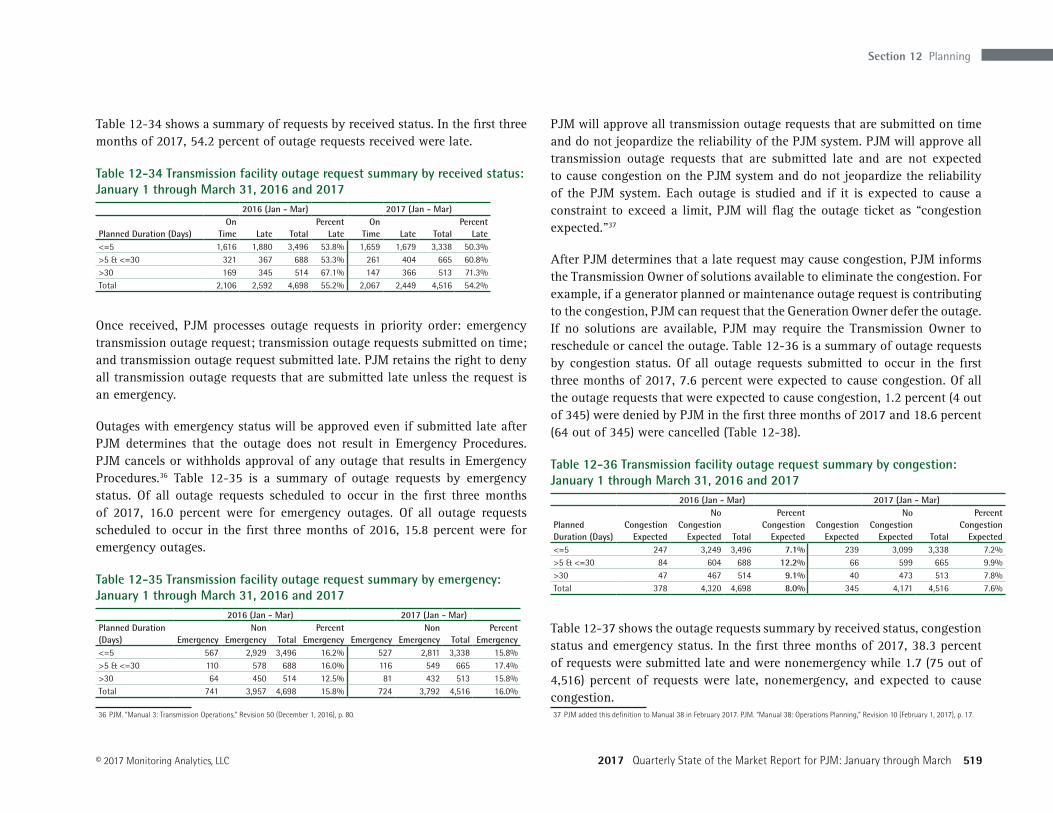
Section 12 Planning
2017 Quarterly State of the Market Report for PJM: January through March 519© 2017 Monitoring Analytics, LLC
Table 12-34 shows a summary of requests by received status. In the first three months of 2017, 54.2 percent of outage requests received were late.
Table 12-34 Transmission facility outage request summary by received status: January 1 through March 31, 2016 and 2017
2016 (Jan - Mar) 2017 (Jan - Mar)
Planned Duration (Days)On
Time Late TotalPercent
LateOn
Time Late TotalPercent
Late<=5 1,616 1,880 3,496 53.8% 1,659 1,679 3,338 50.3%>5 & <=30 321 367 688 53.3% 261 404 665 60.8%>30 169 345 514 67.1% 147 366 513 71.3%Total 2,106 2,592 4,698 55.2% 2,067 2,449 4,516 54.2%
Once received, PJM processes outage requests in priority order: emergency transmission outage request; transmission outage requests submitted on time; and transmission outage request submitted late. PJM retains the right to deny all transmission outage requests that are submitted late unless the request is an emergency.
Outages with emergency status will be approved even if submitted late after PJM determines that the outage does not result in Emergency Procedures. PJM cancels or withholds approval of any outage that results in Emergency Procedures.36 Table 12-35 is a summary of outage requests by emergency status. Of all outage requests scheduled to occur in the first three months of 2017, 16.0 percent were for emergency outages. Of all outage requests scheduled to occur in the first three months of 2016, 15.8 percent were for emergency outages.
Table 12-35 Transmission facility outage request summary by emergency: January 1 through March 31, 2016 and 2017
2016 (Jan - Mar) 2017 (Jan - Mar)Planned Duration (Days) Emergency
Non Emergency Total
Percent Emergency Emergency
Non Emergency Total
Percent Emergency
<=5 567 2,929 3,496 16.2% 527 2,811 3,338 15.8%>5 & <=30 110 578 688 16.0% 116 549 665 17.4%>30 64 450 514 12.5% 81 432 513 15.8%Total 741 3,957 4,698 15.8% 724 3,792 4,516 16.0%
36 PJM. “Manual 3: Transmission Operations,” Revision 50 (December 1, 2016), p. 80.
PJM will approve all transmission outage requests that are submitted on time and do not jeopardize the reliability of the PJM system. PJM will approve all transmission outage requests that are submitted late and are not expected to cause congestion on the PJM system and do not jeopardize the reliability of the PJM system. Each outage is studied and if it is expected to cause a constraint to exceed a limit, PJM will flag the outage ticket as “congestion expected.”37
After PJM determines that a late request may cause congestion, PJM informs the Transmission Owner of solutions available to eliminate the congestion. For example, if a generator planned or maintenance outage request is contributing to the congestion, PJM can request that the Generation Owner defer the outage. If no solutions are available, PJM may require the Transmission Owner to reschedule or cancel the outage. Table 12-36 is a summary of outage requests by congestion status. Of all outage requests submitted to occur in the first three months of 2017, 7.6 percent were expected to cause congestion. Of all the outage requests that were expected to cause congestion, 1.2 percent (4 out of 345) were denied by PJM in the first three months of 2017 and 18.6 percent (64 out of 345) were cancelled (Table 12-38).
Table 12-36 Transmission facility outage request summary by congestion: January 1 through March 31, 2016 and 2017
2016 (Jan - Mar) 2017 (Jan - Mar)
Planned Duration (Days)
Congestion Expected
No Congestion
Expected Total
Percent Congestion
ExpectedCongestion
Expected
No Congestion
Expected Total
Percent Congestion
Expected<=5 247 3,249 3,496 7.1% 239 3,099 3,338 7.2%>5 & <=30 84 604 688 12.2% 66 599 665 9.9%>30 47 467 514 9.1% 40 473 513 7.8%Total 378 4,320 4,698 8.0% 345 4,171 4,516 7.6%
Table 12-37 shows the outage requests summary by received status, congestion status and emergency status. In the first three months of 2017, 38.3 percent of requests were submitted late and were nonemergency while 1.7 (75 out of 4,516) percent of requests were late, nonemergency, and expected to cause congestion.37 PJM added this definition to Manual 38 in February 2017. PJM. “Manual 38: Operations Planning,” Revision 10 (February 1, 2017), p. 17.

2017 Quarterly State of the Market Report for PJM: January through March
520 Section 12 Planning © 2017 Monitoring Analytics, LLC
Table 12-37 Transmission facility outage requests that by received status, congestion and emergency: January 1 through March 31, 2016 and 2017
2016 (Jan - Mar) 2017 (Jan - Mar)
Submission StatusCongestion
Expected
No Congestion
Expected Total PercentCongestion
Expected
No Congestion
Expected Total PercentLate Emergency 18 719 737 15.7% 29 691 720 15.9%
Non Emergency 90 1,765 1,855 39.5% 75 1,654 1,729 38.3%On Time Emergency 0 4 4 0.1% 0 4 4 0.1%
Non Emergency 270 1,832 2,102 44.7% 241 1,822 2,063 45.7%Total 378 4,320 4,698 100.0% 345 4,171 4,516 100.0%
Once PJM processes an outage request, the outage request is labelled as Submitted, Received, Denied, Approved, Cancelled by Company, PJM Admin Closure, Revised, Active or Complete according to the processed stage of a request.38 Table 12-38 shows the detailed process status for outage requests only for the outage requests that are expected to cause congestion. Status Submitted and status Received are in the In Process category and status Cancelled by Company and status PJM Admin Closure are in the Cancelled category in Table 12-38. Table 12-38 shows that of all the outage requests that were expected to cause congestion, 1.2 percent (4 out of 345) were denied by PJM in the first three months of 2017, 75.7 percent were complete and 18.6 percent (64 out of 345) were cancelled.
Table 12-38 Transmission facility outage requests that might cause congestion status summary: January 1 through March 31, 2016 and 2017
2016 (Jan - Mar) 2017 (Jan - Mar)
Submission Status Cancelled Complete In Process DeniedCongestion
ExpectedPercent
Complete Cancelled Complete In Process DeniedCongestion
ExpectedPercent
CompleteLate Emergency 0 18 0 0 18 100.0% 5 22 2 0 29 75.9%
Non Emergency 17 65 0 8 90 72.2% 9 59 5 2 75 78.7%On Time Emergency 0 0 0 0 0 0.0% 0 0 0 0 0 0.0%
Non Emergency 72 193 0 5 270 71.5% 50 180 9 2 241 74.7%Total 89 276 0 13 378 73.0% 64 261 16 4 345 75.7%
38 See PJM. “Outage Information,” <http://www.pjm.com/markets-and-operations/etools/oasis/system-information/outage-info.aspx> (November 1, 2015).
There are clear rules defined for assigning On Time or Late status for submitted outage requests in both the PJM Tariff and PJM Manuals.39 However, the On Time or Late status only affects the priority that PJM assigns for processing the outage request. Many (78.7 percent or 59 out of 75) outages that were nonemergency, expected to cause congestion, and late transmission outages were approved and completed. The expected impact on congestion is the basis for PJM’s treatment of late outage requests. But there is no rule or clear definition of this congestion analysis in the PJM Manuals. The MMU recommends that PJM draft a clear definition of
the congestion analysis required for transmission outage requests to include in Manual 3 after appropriate review.
39 OA Schedule 1 § 1.9.2 (Planned Outages).

Section 12 Planning
2017 Quarterly State of the Market Report for PJM: January through March 521© 2017 Monitoring Analytics, LLC
Rescheduling Transmission Facility Outage RequestsA TO can reschedule or cancel an outage after initial submission. Table 12-39 is a summary of all the outage requests planned for the first three months of 2016 and 2017 which were approved and then cancelled or rescheduled by TOs at least once. If an outage request was submitted, approved and subsequently rescheduled at least once, the outage request will be counted as Approved and Rescheduled. If an outage request was submitted, approved and subsequently cancelled at least once, the outage request will be counted as Approved and Cancelled. In the first three months of 2017, 7.9 percent of transmission outage requests were approved by PJM and then rescheduled by the TOs, and 4.3 percent of the transmission outages were approved by PJM and subsequently cancelled by the TOs.
Table 12-39 Rescheduled and cancelled transmission outage request summary: January 1 through March 31, 2016 and 2017
2016 (Jan - Mar) 2017 (Jan - Mar)
DaysOutage
RequestsApproved and
Rescheduled
Percent Approved and
RescheduledApproved and
Cancelled
Percent Approved and
CancelledOutage
RequestsApproved and
Rescheduled
Percent Approved and
RescheduledApproved and
Cancelled
Percent Approved and
Cancelled<=5 3,496 210 6.0% 338 9.7% 3,338 143 4.3% 310 9.3%>5 & <=30 688 14 2.0% 26 3.8% 665 37 5.6% 31 4.7%>30 514 21 4.1% 14 2.7% 513 13 2.5% 16 3.1%Total 4,698 245 5.2% 378 8.0% 4,516 193 4.3% 357 7.9%
If a requested outage is determined to be late and TO reschedules the outage, the outage will be revaluated by PJM again as On Time or Late.
A transmission outage ticket with duration of five days or less with an On Time status can retain its On Time status if the outage is rescheduled within the original scheduled month.40 This rule allows a TO to reschedule within the same month with very little notice.
A transmission outage ticket with a duration exceeding five days with an On Time status can retain its On Time status if the outage is rescheduled to a future month, and the revision is submitted by the first of the month prior
40 PJM. “Manual 3: Transmission Operations,” Revision 50 (December 1, 2016), p. 70.
to the revised month in which the outage will occur.41 This rescheduling rule is much less strict than the rule that applies to the first submission of outage requests with similar duration. When first submitted, the outage request with a duration exceeding five days needs to be submitted before the first of the month nine months prior to the month in which the outage was expected to occur.
The MMU recommends that PJM reevaluate all transmission outage tickets as On Time or Late as if they were new requests when an outage is rescheduled and apply the standard rules for late submissions to any such outages.
Long Duration Transmission Facility Outage RequestsPJM rules (Table 12-33) define a transmission outage request as On Time or Late based on the planned outage duration and the time of submission.
The rule has stricter submission requirements for transmission outage requests planned for longer than 30 days. In order to avoid the stricter submission requirement, some transmission owners divided the duration of outage requests longer than 30 days into shorter segments for the same equipment and submitted
one request for each segment. The MMU recommends that PJM not permit transmission owners to divide long duration outages into smaller segments to avoid complying with the requirements for long duration outages. Table 12-40 shows that there were 3,683 transmission equipment planned outages in the first three months of 2017, of which 469 were planned outages longer than 30 days, and of which 14 or 0.4 percent were scheduled longer than 30 days if the duration of the outages were combined for the same equipment. The duration of those outages could potentially be longer than 30 days, however were divided into shorter periods by transmission owners.
41 PJM. “Manual 3: Transmission Operations,” Revision 50 (December 1, 2016), p. 70.
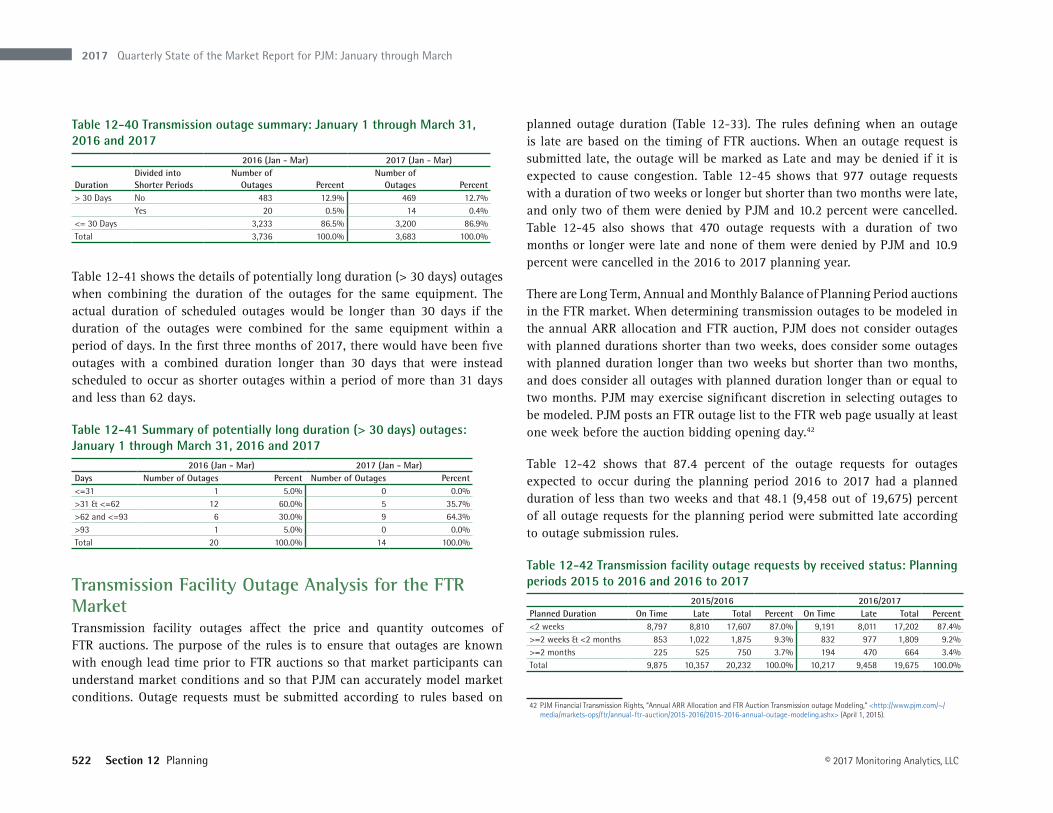
2017 Quarterly State of the Market Report for PJM: January through March
522 Section 12 Planning © 2017 Monitoring Analytics, LLC
Table 12-40 Transmission outage summary: January 1 through March 31, 2016 and 2017
2016 (Jan - Mar) 2017 (Jan - Mar)
DurationDivided into Shorter Periods
Number of Outages Percent
Number of Outages Percent
> 30 Days No 483 12.9% 469 12.7%Yes 20 0.5% 14 0.4%
<= 30 Days 3,233 86.5% 3,200 86.9%Total 3,736 100.0% 3,683 100.0%
Table 12-41 shows the details of potentially long duration (> 30 days) outages when combining the duration of the outages for the same equipment. The actual duration of scheduled outages would be longer than 30 days if the duration of the outages were combined for the same equipment within a period of days. In the first three months of 2017, there would have been five outages with a combined duration longer than 30 days that were instead scheduled to occur as shorter outages within a period of more than 31 days and less than 62 days.
Table 12-41 Summary of potentially long duration (> 30 days) outages: January 1 through March 31, 2016 and 2017
2016 (Jan - Mar) 2017 (Jan - Mar)Days Number of Outages Percent Number of Outages Percent<=31 1 5.0% 0 0.0%>31 & <=62 12 60.0% 5 35.7%>62 and <=93 6 30.0% 9 64.3%>93 1 5.0% 0 0.0%Total 20 100.0% 14 100.0%
Transmission Facility Outage Analysis for the FTR MarketTransmission facility outages affect the price and quantity outcomes of FTR auctions. The purpose of the rules is to ensure that outages are known with enough lead time prior to FTR auctions so that market participants can understand market conditions and so that PJM can accurately model market conditions. Outage requests must be submitted according to rules based on
planned outage duration (Table 12-33). The rules defining when an outage is late are based on the timing of FTR auctions. When an outage request is submitted late, the outage will be marked as Late and may be denied if it is expected to cause congestion. Table 12-45 shows that 977 outage requests with a duration of two weeks or longer but shorter than two months were late, and only two of them were denied by PJM and 10.2 percent were cancelled. Table 12-45 also shows that 470 outage requests with a duration of two months or longer were late and none of them were denied by PJM and 10.9 percent were cancelled in the 2016 to 2017 planning year.
There are Long Term, Annual and Monthly Balance of Planning Period auctions in the FTR market. When determining transmission outages to be modeled in the annual ARR allocation and FTR auction, PJM does not consider outages with planned durations shorter than two weeks, does consider some outages with planned duration longer than two weeks but shorter than two months, and does consider all outages with planned duration longer than or equal to two months. PJM may exercise significant discretion in selecting outages to be modeled. PJM posts an FTR outage list to the FTR web page usually at least one week before the auction bidding opening day.42
Table 12-42 shows that 87.4 percent of the outage requests for outages expected to occur during the planning period 2016 to 2017 had a planned duration of less than two weeks and that 48.1 (9,458 out of 19,675) percent of all outage requests for the planning period were submitted late according to outage submission rules.
Table 12-42 Transmission facility outage requests by received status: Planning periods 2015 to 2016 and 2016 to 2017
2015/2016 2016/2017Planned Duration On Time Late Total Percent On Time Late Total Percent<2 weeks 8,797 8,810 17,607 87.0% 9,191 8,011 17,202 87.4%>=2 weeks & <2 months 853 1,022 1,875 9.3% 832 977 1,809 9.2%>=2 months 225 525 750 3.7% 194 470 664 3.4%Total 9,875 10,357 20,232 100.0% 10,217 9,458 19,675 100.0%
42 PJM Financial Transmission Rights, “Annual ARR Allocation and FTR Auction Transmission outage Modeling,” <http://www.pjm.com/~/media/markets-ops/ftr/annual-ftr-auction/2015-2016/2015-2016-annual-outage-modeling.ashx> (April 1, 2015).

Section 12 Planning
2017 Quarterly State of the Market Report for PJM: January through March 523© 2017 Monitoring Analytics, LLC
Table 12-43 shows late outage requests summary by emergency status. Of all outage requests for outages expected to occur in the 2016 to 2017 planning year and submitted late, 73.4 percent were for nonemergency outages.
Table 12-43 Late transmission facility outage requests by emergency: Planning periods 2015 to 2016 and 2016 to 20172015/2016 2016/2017
Planned Duration EmergencyNon
Emergency Total
Percent Non
Emergency EmergencyNon
Emergency Total
Percent Non
EmergencyOn Time <2 weeks 16 8,781 8,797 99.8% 15 9,176 9,191 99.8%
>=2 weeks & <2 months 4 849 853 99.5% 2 830 832 99.8%>=2 months 0 225 225 100.0% 0 194 194 100.0%Total 20 9,855 9,875 99.8% 17 10,200 10,217 99.8%
Late <2 weeks 2,399 6,411 8,810 72.8% 2,239 5,772 8,011 72.1%>=2 weeks & <2 months 174 848 1,022 83.0% 182 795 977 81.4%>=2 months 103 422 525 80.4% 99 371 470 78.9%Total 2,676 7,681 10,357 74.2% 2,520 6,938 9,458 73.4%
PJM analyzes expected congestion for both On time and Late outage requests. A Late outage request may be denied or cancelled if it is expected to cause congestion. Table 12-44 shows a summary of requests by expected congestion and received status. Overall, 4.9 percent of all outage requests for outages expected to occur in the 2016 to 2017 planning year and submitted late were expected to cause congestion.
Table 12-44 Late transmission facility outage requests by congestion: Planning periods 2015 to 2016 and 2016 to 20172015/2016 2016/2017
Planned DurationCongestion
Expected
No Congestion
Expected Total
Percent Congestion
ExpectedCongestion
Expected
No Congestion
Expected Total
Percent Congestion
ExpectedOn Time <2 weeks 1,151 7,646 8,797 13.1% 1,091 8,100 9,191 11.9%
>=2 weeks & <2 months 172 681 853 20.2% 149 683 832 17.9%>=2 months 46 179 225 20.4% 33 161 194 17.0%Total 1,369 8,506 9,875 13.9% 1,273 8,944 10,217 12.5%
Late <2 weeks 371 8,439 8,810 4.2% 389 7,622 8,011 4.9%>=2 weeks & <2 months 49 973 1,022 4.8% 59 918 977 6.0%>=2 months 18 507 525 3.4% 15 455 470 3.2%Total 438 9,919 10,357 4.2% 463 8,995 9,458 4.9%
Table 12-45 shows that 84.4 percent of late outage requests with a duration of two weeks or longer but shorter than two months were active or completed, two was denied by PJM and 10.2 percent were cancelled in the 2016 to 2017 planning year. Table 12-45 also shows that 86.2 percent of late outage requests with duration of two months or longer were active or completed, none of them was denied, and 10.9 percent were cancelled in the 2016 to 2017 planning year.

2017 Quarterly State of the Market Report for PJM: January through March
524 Section 12 Planning © 2017 Monitoring Analytics, LLC
Table 12-45 Transmission facility outage requests by received status and processed status: Planning periods 2015 to 2016 and 2016 to 20172015/2016 2016/2017
Planned DurationProcessed Status On Time Percent Late Percent On Time Percent Late Percent
<2 weeks In Progress 0 0.0% 0 0.0% 1,407 15.3% 262 3.3%Denied 39 0.4% 36 0.4% 36 0.4% 51 0.6%Approved 0 0.0% 0 0.0% 134 1.5% 80 1.0%Cancelled 2,432 27.6% 1,202 13.6% 2,076 22.6% 968 12.1%Revised 0 0.0% 0 0.0% 18 0.2% 3 0.0%Active 0 0.0% 1 0.0% 26 0.3% 26 0.3%Completed 6,326 71.9% 7,571 85.9% 5,494 59.8% 6,621 82.6%
Total Submission 8,797 100.0% 8,810 100.0% 9,191 100.0% 8,011 100.0%>=2 weeks & <2 months In Progress 0 0.0% 0 0.0% 87 10.5% 41 4.2%
Denied 0 0.0% 0 0.0% 2 0.2% 2 0.2%Approved 0 0.0% 0 0.0% 11 1.3% 9 0.9%Cancelled 236 27.7% 105 10.3% 202 24.3% 100 10.2%Revised 0 0.0% 0 0.0% 0 0.0% 0 0.0%Active 0 0.0% 0 0.0% 72 8.7% 82 8.4%Completed 617 72.3% 917 89.7% 458 55.0% 743 76.0%
Total Submission 853 100.0% 1,022 100.0% 832 100.0% 977 100.0%>=2 months In Progress 0 0.0% 0 0.0% 4 2.1% 13 2.8%
Denied 0 0.0% 0 0.0% 0 0.0% 0 0.0%Approved 0 0.0% 0 0.0% 0 0.0% 1 0.2%Cancelled 45 20.0% 57 10.9% 52 26.8% 51 10.9%Revised 0 0.0% 0 0.0% 0 0.0% 0 0.0%Active 4 1.8% 20 3.8% 32 16.5% 120 25.5%Completed 176 78.2% 448 85.3% 106 54.6% 285 60.6%
Total Submission 225 100.0% 525 100.0% 194 100.0% 470 100.0%
Table 12-46 shows that there were 977 outage requests with a duration of two weeks or longer but shorter than two months submitted late, of which 55 were nonemergency and expected to cause congestion in the 2016 to 2017 planning year. Of the 55 such requests, three were in process, one was denied, eight were cancelled, and 43 were active or complete. For the outages planned for two months or longer, there were 470 total outages submitted late, of which 14 requests were nonemergency. Of those requests, two were in process, three were cancelled and nine were active or complete.
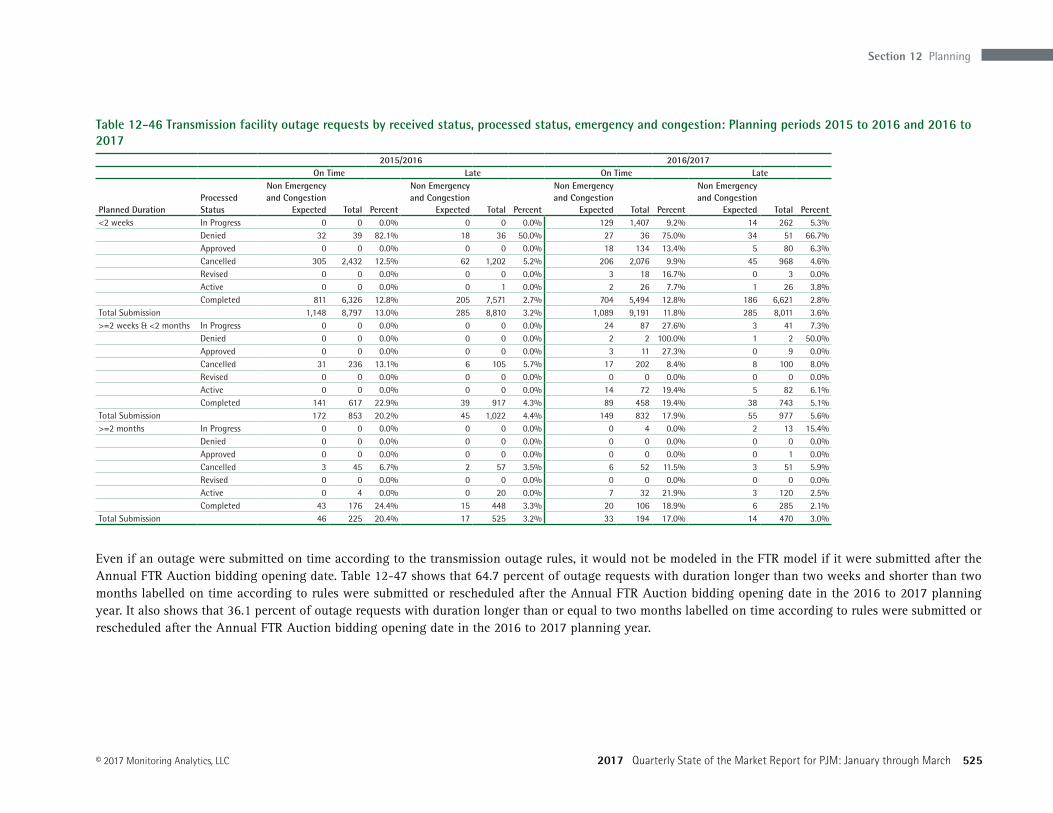
Section 12 Planning
2017 Quarterly State of the Market Report for PJM: January through March 525© 2017 Monitoring Analytics, LLC
Table 12-46 Transmission facility outage requests by received status, processed status, emergency and congestion: Planning periods 2015 to 2016 and 2016 to 2017
2015/2016 2016/2017On Time Late On Time Late
Planned DurationProcessed Status
Non Emergency and Congestion
Expected Total Percent
Non Emergency and Congestion
Expected Total Percent
Non Emergency and Congestion
Expected Total Percent
Non Emergency and Congestion
Expected Total Percent<2 weeks In Progress 0 0 0.0% 0 0 0.0% 129 1,407 9.2% 14 262 5.3%
Denied 32 39 82.1% 18 36 50.0% 27 36 75.0% 34 51 66.7%Approved 0 0 0.0% 0 0 0.0% 18 134 13.4% 5 80 6.3%Cancelled 305 2,432 12.5% 62 1,202 5.2% 206 2,076 9.9% 45 968 4.6%Revised 0 0 0.0% 0 0 0.0% 3 18 16.7% 0 3 0.0%Active 0 0 0.0% 0 1 0.0% 2 26 7.7% 1 26 3.8%Completed 811 6,326 12.8% 205 7,571 2.7% 704 5,494 12.8% 186 6,621 2.8%
Total Submission 1,148 8,797 13.0% 285 8,810 3.2% 1,089 9,191 11.8% 285 8,011 3.6%>=2 weeks & <2 months In Progress 0 0 0.0% 0 0 0.0% 24 87 27.6% 3 41 7.3%
Denied 0 0 0.0% 0 0 0.0% 2 2 100.0% 1 2 50.0%Approved 0 0 0.0% 0 0 0.0% 3 11 27.3% 0 9 0.0%Cancelled 31 236 13.1% 6 105 5.7% 17 202 8.4% 8 100 8.0%Revised 0 0 0.0% 0 0 0.0% 0 0 0.0% 0 0 0.0%Active 0 0 0.0% 0 0 0.0% 14 72 19.4% 5 82 6.1%Completed 141 617 22.9% 39 917 4.3% 89 458 19.4% 38 743 5.1%
Total Submission 172 853 20.2% 45 1,022 4.4% 149 832 17.9% 55 977 5.6%>=2 months In Progress 0 0 0.0% 0 0 0.0% 0 4 0.0% 2 13 15.4%
Denied 0 0 0.0% 0 0 0.0% 0 0 0.0% 0 0 0.0%Approved 0 0 0.0% 0 0 0.0% 0 0 0.0% 0 1 0.0%Cancelled 3 45 6.7% 2 57 3.5% 6 52 11.5% 3 51 5.9%Revised 0 0 0.0% 0 0 0.0% 0 0 0.0% 0 0 0.0%Active 0 4 0.0% 0 20 0.0% 7 32 21.9% 3 120 2.5%Completed 43 176 24.4% 15 448 3.3% 20 106 18.9% 6 285 2.1%
Total Submission 46 225 20.4% 17 525 3.2% 33 194 17.0% 14 470 3.0%
Even if an outage were submitted on time according to the transmission outage rules, it would not be modeled in the FTR model if it were submitted after the Annual FTR Auction bidding opening date. Table 12-47 shows that 64.7 percent of outage requests with duration longer than two weeks and shorter than two months labelled on time according to rules were submitted or rescheduled after the Annual FTR Auction bidding opening date in the 2016 to 2017 planning year. It also shows that 36.1 percent of outage requests with duration longer than or equal to two months labelled on time according to rules were submitted or rescheduled after the Annual FTR Auction bidding opening date in the 2016 to 2017 planning year.

2017 Quarterly State of the Market Report for PJM: January through March
526 Section 12 Planning © 2017 Monitoring Analytics, LLC
Table 12-47 Transmission facility outage requests by received status and bidding opening date: Planning periods 2015 to 2016 and 2016 to 2017
2015/2016 2016/2017On Time Late On Time Late
Planned Duration
Before Bidding
Opening DateAfter Bidding Opening Date Percent After
Before Bidding
Opening DateAfter Bidding Opening Date Percent After
Before Bidding
Opening DateAfter Bidding Opening Date Percent After
Before Bidding
Opening DateAfter Bidding Opening Date Percent After
<2 weeks 766 8,031 91.3% 181 8,629 97.9% 788 8,403 91.4% 158 7,853 98.0%>=2 weeks & <2 months 316 537 63.0% 126 896 87.7% 294 538 64.7% 72 905 92.6%>=2 months 131 94 41.8% 189 336 64.0% 124 70 36.1% 166 304 64.7%Total 1,213 8,662 87.7% 496 9,861 95.2% 1,206 9,011 88.2% 396 9,062 95.8%
Table 12-48 shows that 80.7 percent of late outage requests which were submitted or rescheduled after the Annual FTR Auction bidding opening date were approved and complete in the 2016 to 2017 planning.
Table 12-48 Late transmission facility outage requests that are submitted after annual bidding opening date: Planning periods 2015 to 2016 and 2016 to 2017
2015/2016 2016/2017
Planned DurationCompleted
Outages Total PercentCompleted
Outages Total Percent<2 weeks 7,407 8,629 85.8% 6,474 7,853 82.4%>=2 weeks & <2 months 799 896 89.2% 684 905 75.6%>=2 months 291 336 86.6% 159 304 52.3%Total 8,497 9,861 86.2% 7,317 9,062 80.7%
Thus, although the definition of late outages was developed in order to prevent outages for the planning period being submitted after the Annual FTR Auction bidding opening date, the rules have not worked to prevent this since the rule has no direct connection to the Annual FTR Auction opening date. By requiring all long-duration transmission outages to be submitted before February 1, PJM outage submission rules only prevent long-duration transmission outages from being submitted late. The rule does not address the situation in which long-duration transmission outages are submitted on-time, but are rescheduled so that they are late. The Annual FTR Auction model may consider transmission outages planned for longer than two weeks but less than two months. Those outages not only include long-duration but also
include outages shorter than 30 days. In those cases, PJM outage submission rules failed to prevent long-duration transmission outages submitted late. The MMU recommends that PJM modify the rules to reduce or eliminate the approval of late outage requests submitted or rescheduled after the Annual FTR Auction bidding opening date.
Transmission Facility Outage Analysis in the Day-Ahead Energy MarketTransmission facility outages also affect the energy market. Just as with the FTR market, it is critical that outages that affect the operating day are known prior to the submission of offers in the Day-Ahead Energy Market so that market participants can understand market conditions and so that PJM can accurately model market conditions in the day-ahead market. PJM requires transmission owners to submit changes to outages scheduled for the next two days no later than 09:30 am. 43
In order to analyze the market impact, the outage requests that affect the operating day are compared: before the day-ahead market is closed; when the day-ahead market save cases are created; and during the operating day. The list of approved or active outage requests before the day-ahead market is closed is the view of outages available to market participants. The day-ahead market model uses a list of outages as an input. The list of outages that actually occurred during the operating day are the outages that affect the real-time market. If the three sets of outages are the same, there is no potential 43 PJM. “Manual 3: Transmission Operations,” Revision 50 (December 1, 2016), p. 74

Section 12 Planning
2017 Quarterly State of the Market Report for PJM: January through March 527© 2017 Monitoring Analytics, LLC
impact on markets. If the three sets of outages differ, there is a potential impact on markets.
For example for the operating day of November 23, 2016, Figure 12-4 shows that: there were 421 approved or active outages seen by market participants before the day-ahead market was closed; there were 282 outage requests included in the day-ahead market model; there were 273 outage request included in both sets of outage; there were 148 outage requests approved or active before the day-ahead market was closed but not included as inputs in day-ahead market model; and there were 9 outage requests included in day-ahead market model but not available to market participants prior to the day-ahead market.
Figure 12-4 Illustration of day-ahead market analysis on November 22, 2016
Figure 12-5 compares the weekly average number of active or approved outages available to market participants prior to the close of the day-ahead market with the outages included as inputs to the day-ahead market by PJM.
Figure 12-5 Weekly average number of approved or active outage requests comparing day-ahead market model outages: January 1, 2015 through March 31, 2017
0
100
200
300
400
500
600
700
Numb
er of
Outa
ge R
eque
sts
Market Participant View
Day Ahead Market Model
Market Participant and Day Ahead Model
Market Participant View and Not in Day Ahead Model
Day Ahead Market Model and Not in Market Participant View
Figure 12-6 compares the weekly average number of outages included as inputs to the day-ahead market by PJM with the outages that actually occurred during the operating day.

2017 Quarterly State of the Market Report for PJM: January through March
528 Section 12 Planning © 2017 Monitoring Analytics, LLC
Figure 12-6 Weekly average number of day-ahead market model outages comparing outages occurred on operating day: January 1, 2015 through March 31, 2017
0
100
200
300
400
500
600
1-Ja
n-15
1-Fe
b-15
1-Ma
r-15
1-Ap
r-15
1-Ma
y-15
1-Ju
n-15
1-Ju
l-15
1-Au
g-15
1-Se
p-15
1-Oc
t-15
1-No
v-15
1-De
c-15
1-Ja
n-16
1-Fe
b-16
1-Ma
r-16
1-Ap
r-16
1-Ma
y-16
1-Ju
n-16
1-Ju
l-16
1-Au
g-16
1-Se
p-16
1-Oc
t-16
1-No
v-16
1-De
c-16
1-Ja
n-17
1-Fe
b-17
1-Ma
r-17
Numb
er of
Outa
ge R
eque
sts
Day Ahead Market Model
Occurred
Day Ahead Market Model and Occurred
Day Ahead Market Model and Not Occurred
Occurred and Not in Day Ahead Market Model
Figure 12-7 compares the weekly average number of active or approved outages available to market participants prior to the close of the day-ahead market with the outages that actually occurred during the operating day.
Figure 12-7 Weekly average number of approved or active outage requests comparing outages occurred on operating day: January 1, 2015 through March 31, 2017
0
100
200
300
400
500
600
700
Jan-15 Mar-15 May-15 Jul-15 Sep-15 Nov-15 Jan-16 Mar-16 May-16 Jul-16 Sep-16 Nov-16 Jan-17 Mar-17
Numb
er of
Outa
ge R
eque
sts
Market Participant ViewOccurredMarket Participant View and OccurredMarket Participant View and Not OccurredOccurred and Not in Market Participant View
Figure 12-5, Figure 12-6, and Figure 12-7 show that on a weekly average basis, the active or approved outages available to day-ahead market participants, the outages included as inputs in the day-ahead market model and the outages that actually occurred in real time are not consistent. The active or approved outages available to day-ahead market participants are more consistent with the outages that actually occurred in real time than with the outages included in the day-ahead market model.