genome-wide association study of lung function phenotypes...
TRANSCRIPT

Genome-wide association study of lung functionphenotypes in a founder population
Tsung-Chieh Yao, MD, PhD,a,b Gaixin Du, MS,a Lide Han, PhD,a Ying Sun, MS,a Donglei Hu, PhD,c James J. Yang, PhD,d
Rasika Mathias, ScD,e Lindsey A. Roth, MA,c Nicholas Rafaels, MS,e Emma E. Thompson, PhD,a Dagan A. Loisel, PhD,a
Rebecca Anderson, MS,a Celeste Eng, BS,c Maitane Arruabarrena Orbegozo, RN,a Melody Young, RN,f
James M. Klocksieben, BA,g Elizabeth Anderson, RN,h Kathleen Shanovich, MS, RN,h Lucille A. Lester, MD,f
L. Keoki Williams, MD, MPH,i Kathleen C. Barnes, PhD,e Esteban G. Burchard, MD, MPH,c,j Dan L. Nicolae, PhD,a,f,k
Mark Abney, PhD,a* and Carole Ober, PhDa* Chicago, Ill, San Francisco, Calif, Detroit, Mich, Baltimore, Md, Madison, Wis, and
Taoyuan, Taiwan
Background: Lung function is a long-term predictor ofmortality and morbidity.Objective: We sought to identify single nucleotidepolymorphisms (SNPs) associated with lung function.Methods: We performed a genome-wide association study(GWAS) of FEV1, forced vital capacity (FVC), and FEV1/FVCin 1144 Hutterites aged 6 to 89 years, who are members of afounder population of European descent. We performed leastabsolute shrinkage and selection operation regression to selectthe minimum set of SNPs that best predict FEV1/FVC in theHutterites and used the GRAIL algorithm to mine the GeneOntology database for evidence of functional connectionsbetween genes near the predictive SNPs.Results: Our GWAS identified significant associations betweenFEV1/FVC and SNPs at the THSD4-UACA-TLE3 locus on
From athe Department of Human Genetics, University of Chicago; bthe Division of
Allergy, Asthma, and Rheumatology, Department of Pediatrics, Chang Gung
Memorial Hospital and Chang Gung University College of Medicine, Taoyuan; cthe
Department of Medicine, University of California, San Francisco; dthe Department
of Public Health Sciences, Henry Ford Health System, Detroit; ethe Division of
Allergy and Clinical Immunology, Department of Medicine, The Johns Hopkins
University, Baltimore; fthe Department of Pediatrics, University of Chicago; gthe
Department of Medicine, University of Chicago; hthe Department of Pediatrics,
University of Wisconsin, Madison; ithe Center for Health Services Research and
Department of InternalMedicine, Henry FordHealth System, Detroit; jthe Department
of Bioengineering and Therapeutic Sciences, University of California, San Francisco;
and kthe Department of Statistics, University of Chicago.
*These authors contributed equally to this work.
Supported by the National Institutes of Health grant R01HL085197 (C.O.) and grant R01
HG002899 (M.A.).
Disclosure of potential conflict of interest: L. Han, J. J. Yang, R. Mathais, E. E.
Thompson, D. A. Loisel, R. Anderson, M. A. Orbegozo,M. Young, J. M. Klocksieben,
L. A. Lester, K. C. Barnes, M. Abney, and C. Ober have received grants from the
National Institutes of Health (NIH). C. Eng has received grants from the NIH and the
National Heart Lung and Blood Institute. L. K. Williams has received grants from the
NIH, the National Institute of Allergy and Infectious Disease, and the National
Institute of Diabetes and Digestive and Kidney Diseases, and has received payment
for lectures from Merck & Company. E. G. Burchard has received grants from the
NIH and the National Heart Lung and Blood Institute. The rest of the authors declare
that they have no relevant conflicts of interest.
Received for publication February 4, 2013; revised April 18, 2013; accepted for publica-
tion June 12, 2013.
Available online August 6, 2013.
Corresponding author: Tsung-Chieh Yao, MD, PhD, Department of Pediatrics, Chang
Gung Memorial Hospital, No. 5 Fu-Hsin Street, Kweishan, Taoyuan 333, Taiwan.
E-mail: [email protected]. Or: Carole Ober, PhD, Department of Human Genet-
ics, University of Chicago, 920 E 58th St, Rm 425, Chicago, IL 60637. E-mail:
0091-6749/$36.00
� 2013 American Academy of Allergy, Asthma & Immunology
http://dx.doi.org/10.1016/j.jaci.2013.06.018
248
chromosome 15q23 (P5 5.73 1028 to 3.43 1029). Nine SNPs ator near 4 additional loci had P < 1025 with FEV1/FVC. Only 2SNPs were found with P < 1025 for FEV1 or FVC. We foundnominal levels of significance with SNPs at 9 of the 27 previouslyreported loci associated with lung function measures. Among apredictive set of 80 SNPs, 6 loci were identified that had asignificant degree of functional connectivity (GRAIL P < .05),including 3 clusters of b-defensin genes, 2 chemokine genes(CCL18 and CXCL12), and TNFRSF13B.Conclusion: This study identifies genome-wide significantassociations and replicates results of previous GWASs.Multimarker modeling implicated for the first time commonvariation in genes involved in antimicrobial immunity in airwaymucosa that influences lung function. (J Allergy Clin Immunol2014;133:248-55.)
Key words: FEV1/FVC, FEV1, FVC, GWAS, LASSO regression,GRAIL
Chronic lower respiratory diseases are the third leadingcause of death in the United States, resulting in 137,082 deathsin 2009.1 Lung function, as assessed by the spirometric measuresof FEV1, forced vital capacity (FVC) and the FEV1-to-FVC ratio(FEV1/FVC), is an objective indicator of general respiratoryhealth, as well as an important long-term predictor of morbidityand mortality.2-6 Family- and twin-based studies provide consis-tent evidence of genetic contributions to lung function, withestimates of heritability ranging as high as 85% for FEV1, 91%for FVC, and 45% for FEV1/FVC.
7-20
Recently, genome-wide association studies (GWASs) havebegun to shed light on the complex genetic architecture of lungfunction measures. Two large meta-analyses of lung functionGWAS in subjects of European ancestry who participated inthe SpiroMeta21 or CHARGE22 consortium reported 11 lociassociated with FEV1/FVC or FEV1. A subsequent combinedmeta-analysis of 48,201 persons from both consortia reported 16additional loci that influence lung function.23 However, variantsat these highly significant loci in the SpiroMeta-CHARGE meta-analysis explained only 3.2% of the variance for FEV1/FVC and1.5% of the variance for FEV1.
23 Thus, similar to studies of othercomplex phenotypes, a significant proportion of the heritability re-mains unexplained by individual variants identified inGWASs.24-26
This ‘‘missing heritability’’ after GWAS has been attributed tonumerous potential causes,24-27 many or all of which likelycontribute. In particular, the assumptions about the genetic modelunderlying complex phenotypes that are inherent in standard

J ALLERGY CLIN IMMUNOL
VOLUME 133, NUMBER 1
YAO ET AL 249
Abbreviations used
COPD: C
hronic obstructive pulmonary diseaseFVC: F
orced vital capacityGWAS: G
enome-wide association studyLASSO: L
east absolute shrinkage and selection operationSNP: S
ingle nucleotide polymorphismGWAS approaches may not reflect the true genetic architecturefor many phenotypes. GWASs typically assess the effect of each(common) single nucleotide polymorphism (SNP) individuallywith the use of stringent thresholds of significance. Although thisstrategy has been effective in minimizing false-positive associa-tions and capturing the ‘‘low hanging fruit,’’ the inability toidentify genetic variation that accounts for significant proportionsof human phenotypic variation suggests that alternative analyticstrategies are required to differentiate the true from false-positiveassociations among the variants with more modest P values. Forexample, considering 294,831 SNPs simultaneously in a linearmodel, Yang et al28 found that common SNPs accounted for asmuch as 45% of the phenotypic variance and 50% of the heritabi-lity of height in 3925 subjects compared with only 5% of thevariance of height explained by approximately 50 SNPs thatreached genome-wide thresholds of significance in earlierstudies.29-32
Here, we conducted a GWAS of lung function phenotypesin members of a founder population, the Hutterites.20,33,34 Inaddition to loci reported in previous GWASs, multimarkermodeling identified a novel set of airway epithelial cell–derivedhost defense genes.
METHODS
The HutteritesThe Hutterites are a young founder population that originated in the South
Tyrol in the 16th century and migrated from Europe to the United States in the
1870s.35,36 Today, >40,000 Hutterites live on communal farms (called
colonies) in the north central United States and western Canada. We have
been conducting genetic studies of complex phenotypes in the Hutterites of
South Dakota for >15 years.20,34,37-40 Overall, their communal farming
lifestyle minimizes environmental heterogeneity. In particular, smoking is
prohibited and rare in this population, and air quality is excellent in rural South
Dakota (see Table E1 in this article’s Online Repository at www.jacionline.
org), eliminating environmental exposures that have profound effects on
lung function.
Subjects were recruited for this study if theywere (1) at least 6 years of age,
(2) at home on the days of our visit to their colony, and (3) able to perform
spirometry. Participation rates within each colony are typically around 95%,
thus minimizing ascertainment biases that could affect our results. The final
sample included 1180 S-leut Hutterites who live on or were visiting 1 of 10
South Dakota colonies on the days of our visits; 187 persons (15.8%) were
diagnosed with asthma, as previously defined.39,40 These subjects are related
to each other throughmultiple lines of descent in a 3673-person, 13-generation
pedigree with 64 founders. Adult participants provided written informed
consent for themselves and their children younger than 18 years; participants
who were younger than 18 years provided written assent. These studies were
approved by The University of Chicago Institutional Review Board.
Measures of lung functionSpirometry was performed in the Hutterites during 2 phases of field trips,
the first in 1996-1997 and the second in 2006-2009, using identical protocols.
Briefly, subjects underwent lung function tests with the use of spirometry in
the sitting position while breathing through a mouthpiece and wearing a nose
clip in accordance with the American Thoracic Society/European Respiratory
Society recommendations.41,42 The best FEV1 and FVCwere recorded. Of the
1180 persons, 335were studied in phase 1 only, 524 in phase 2 only, and 321 in
both phases. For the persons studied in both phases, we included measure-
ments from the more recent time only and excluded 36 persons (24 used
asthma rescue medications before spirometry, 4 had cystic fibrosis, and
8 had poor quality spirometry).
Genotyping and quality controlHutterite persons were genotyped with the Affymetrix GeneChip 500k,
Genome-Wide SNP 5.0, or Genome-Wide SNP 6.0 arrays (Affymetrix,
Santa Clara, Calif). An overlapping set of 369,487 autosomal SNPs were
present on the 500k, 5.0, and 6.0 arrays; 94,552 of those SNPs were not
studied because they were monomorphic (n 5 31,246) or had minor allele
frequency of <5% (n 5 63,306) in the Hutterites. Of the remaining 274,935
SNPs, 28,925 were excluded because they had call rates of <95%
(n 5 6,456), generated >_5 Mendelian errors (n 5 15,912), or deviated
from Hardy-Weinberg expectations at P < 1023 (correcting for inbreeding
and relatedness)43 (n 5 6,557), yielding a final set of 246,010 autosomal
markers with a median intermarker spacing of 5.1 kb. The positions
of SNPs shown in all figures and tables are based on NCBI release
36 (dbSNP build 129).
Heritability estimates and GWAS in the HutteritesFEV1, FVC, and FEV1/FVC were transformed to normally distributed
z-scores within each phase, and then adjusted for age, sex, age 3 sex,
height, and inbreeding. The residuals of each trait from the 2 phases were
then combined for further analyses. The distributions of these traits by
age and sex and the correlations between them are shown in Fig E1
(in the Online Repository available at www.jacionline.org). The heritabi-
lities of lung function measures were estimated with variance-component
methods, as previously described.44 Association testing was performed
with a regression-based test for large, complex pedigrees.37 Briefly, at
each SNP, we used the general 2-allele model test of association in the entire
pedigree, keeping all inbreeding loops intact; at each SNP we tested an
additive model of association. SNP-specific P values were determined
according to Gaussian theory. Genomic inflation was weak or absent
(genomic inflation factor l 5 1.10 for FEV1, 1.09 for FVC, and 1.00 for
FEV1/FVC). The GWAS P values for FEV1 and FVC were adjusted by
using their genomic control.45 The Bonferroni-corrected genome-wide
significance threshold was P < 2.0 3 1027 (ie, 0.05/246,010). The
proportion of the residual variance explained by each SNP or a group of
SNPs was determined by comparing the residual sum of squares in the
regression model with that obtained without a SNP (or a group of SNPs),
as implemented in the general 2-allele model.
In silico replicationWe investigated in the Hutterites the associations between lung function
measures and SNPs at the 27 previously identified loci associated with
lung function.21-23 If the previously reported SNP was not genotyped in the
Hutterites, a surrogate SNP with the strongest linkage equilibrium to the
reported SNP was investigated.
Multimarker modelingTo select the minimum set of SNPs that best predict FEV1/FVC in the
Hutterites from among SNPs with P < 1023 in the GWAS, we performed least
absolute shrinkage and selection operation (LASSO) regression,46-48 as imple-
mented in the R package glmnet.49 These studies were conducted in 604
Hutterites without missing genotypes at all 312 SNPs with P < 1023
(87 SNPs had missing data in at least 1 person and were not included in the
LASSO regression). Of the 540 subjects that had missing genotypes in these

J ALLERGY CLIN IMMUNOL
JANUARY 2014
250 YAO ET AL
SNPs and not included in the LASSO regression, 261 had no missing
genotypes in the 80 SNPs selected by LASSO and were used in subsequent
analyses. The minimum set of best-predicting SNPs was selected by running
a 10-fold cross-validation procedure after choosing the glmnet parameter
a5 1.0. The cross-validation procedure selected a LASSO penalty parameter
of l5 3.33 1023.K-fold cross-validation was used to minimize the effects of
overfitting the model to our data by randomly dividing the full data set into
K-subsamples where K-1 subsamples are used to develop the model and the
remaining subsample is used for testing the model. LASSO regression uses
SNPs as predictors of the phenotype (FEV1/FVC), while minimizing the
number of SNPs in the model. Genotypes were coded as 0, 1, or 2 doses of
the minor allele. After the 10-fold cross-validation procedure the LASSO
regression selected 108 SNPs in the model. However, 28 of these SNPs had
negligible effect sizes (absolute value of fixed effect size < .005) and were
removed from the model, resulting in a final set of 80 SNPs.
Identifying related sets of genesTo identify related sets of genes and common pathways for genes near the
SNPs that best predicted FEV1/FVC, we used the GRAIL algorithm50 to mine
the Gene Ontology database. Briefly, GRAIL assesses the degree of related-
ness among genes within regions that harbor predictive SNPs, selecting the
most connected gene that corresponds to 1 or more SNPs as the likely
implicated gene. GRAIL assigns a P value for each region that reflects the
relatedness of the gene(s) in each region to all other regions, correcting for
the number of genes in the region.
RESULTSA total of 1144 Hutterites (613 females; 53.6%) aged 6 to 89
years (mean 6 SD, 30.6 6 18.4 years) with both genome-widegenotyping and spirometry phenotypes were included in theGWAS (Table I). These same data are shown for the nonasthmaticand asthmatic sample subsets in Table E2 (in the OnlineRepository available at www.jacionline.org).
Heritability of lung function in the HutteritesThe broad (H2) and narrow (h2) heritabilities of lung function
measures in the Hutterites were h2 5 H2 5 40.2% (SE 5.4%)for FEV1, h
2 5 17.8% (SE 3.7%) and H2 5 70.4% (SE 11.2%)for FVC, and h2 5 22.1% (SE, 8.0%) and H2 5 91.5% (SE,12.9%) for FEV1/FVC. These estimates indicate that 40.2%,70.4%, and 91.5% of the phenotypic variances in FEV1, FVC,and the FEV1/FVC, respectively, are attributable to geneticvariation in the Hutterites. The heritabilities of FVC and FEV1/FVC included both additive and nonadditive (ie, dominance)genetic variance components, whereas the heritability of FEV1
was attributed entirely to additive genetic variance.
GWAS of lung function traitsWe identified genome-wide significant associations between
FEV1/FVC and 5 SNPs at the THSD4-UACA-TLE3 locus onchromosome 15q23 (see Fig E2, A, in this article’s Online Repos-itory at www.jacionline.org), replicating results from previousGWASs.21,23 Overall, there were 21 SNPs at this locus withP < 1025 (see Table E3 in this article’s Online Repository atwww.jacionline.org). The most significant SNP at this locus,rs12441227, explained 2.9% of the residual variance in FEV1/FVC in the Hutterites. The evidence for association with SNPsat this locus remained when the persons with asthma wereexcluded (Fig E2, D), and when the sample was stratified
by age (see Table E4 in this article’s Online Repository atwww.jacionline.org).Nine additional SNPs at 4 loci had P values < 1025 with FEV1/
FVC, including SNPs downstream of the C10orf11 gene onchromosome 10q22.3, which was associated with FEV1 in ameta-analysis of lung function GWAS.23 When a subanalysiswas performed that excluded the Hutterites with asthma, theevidence for association at this locus increased to genome-widelevels of significance (Table E4 and Fig E2, F). The evidence forassociations with SNPs at 3 of these loci with P values < 1025,CCL23-CCL18 on chromosome 17q12 (Fig E2, B and E),PITPNC1 locus on chromosome 17q24.2, and CHAF1B onchromosome 21q22.13, remained in subanalyses that excludedpersons with asthma. The evidence for association at all locuswith P values < 1025 remained in subset analyses stratified byage (Table E4). Only 2 SNPs had P values < 1025 in the GWASfor the other 2 phenotypes: 1 SNP 7 k downstream of the IL37gene on chromosome 2q13 was associated with FEV1 and1 SNP in an intron of ASXL3 on chromosome 18q12.1 wasassociated with FVC.The Manhattan and Q–Q plots of P values for the GWAS of
the 3 phenotypes are shown in Fig 1; results for all SNPs withP < 1025 are shown in Table E3. The GWAS P values in theHutterites for the 27 loci associated with lung function in previousmeta-analyses21-23 are shown in Table E5 (in the OnlineRepository available at www.jacionline.org). Overall, we foundnominal evidence (P < .05) of association with at least 1 of the3 phenotypes for 15 SNPs at 9 of the 27 previously reported loci.
Multimarker modelingWe assumed that there were additional true associations among
the GWAS SNPs that did not reach genome-wide levels ofsignificance because their effects are too small to detect in singleSNP analyses, especially in a sample size of approximately 1000subjects. Therefore, to assess a multimarker model of risk thatincluded all SNPs with P < 1023, we performed LASSOregression to identify minimum sets of SNPs that provided thesmallest mean square error of FEV1/FVC in the Hutterites.A set of 80 SNPs yielded the best predictive value and wereused for further study (see Table E6 in this article’s OnlineRepository at www.jacionline.org).First, we assessed the phenotypic effects of these 80 SNPs by
binning persons by the total number of alleles associated withreduced FEV1/FVC that they carried (total possible 5 160) andcalculated the mean 6 SE residual FEV1/FVC for Hutteritesin each bin. The mean residual FEV1/FVC decreased withincreasing number of low FEV1/FVC alleles, consistent with anadditive genetic architecture (Fig 2).
Next, we used the GRAIL algorithm50 to mine the GeneOntology database for evidence of functional connectionsbetween genes near the 80 predictive SNPs.We identified a subsetof 6 SNPs with significantly related genes (GRAIL P < .05),including 3 clusters of b-defensin genes, 2 chemokine genes(CCL18 and CXCL12), and TNFRSF13B (Table II and Fig 3).Notably, the associated GWAS SNPs at 2 replicated loci,THSD4-UACA-TLE3 and C10orf11, were not functionallyconnected to any other genes defined by the 80 SNPs. However,a SNP at the CCL23-CCL18 locus, the second most significantlocus in the Hutterite GWAS (see Fig E2, B, in this article’sOnline Repository at www.jacionline.org), was significantly

TABLE I. Characteristics of the Hutterite sample
Males Females
6-17 y >17 y 6-17 y >17 y
Sample size 180 351 195 418
No. with asthma (%) 25 (13.9) 48 (13.6) 38 (19.5) 51 (12.2)
No. with atopy (%) 76 (42.2) 191 (54.4) 93 (47.7) 194 (46.4)
Mean age 6 SD (y) 11.3 6 3.2 40.1 6 15.3 12.2 6 2.9 39.6 6 15.7
Mean FEV1 6 SD (L) 2.60 6 1.05 3.90 6 0.77 2.56 6 0.78 2.94 6 0.59
Mean FVC 6 SD (L) 3.04 6 1.29 4.91 6 0.91 2.86 6 0.90 3.61 6 0.70
Mean FEV1/FVC 6 SD (%) 86.8 6 7.5 79.6 6 7.8 90.0 6 6.5 81.5 6 7.1
Asthma and atopy are defined as described in Ober et al.40
FIG 1. Manhattan and Q–Q plots of P values from the GWAS of FEV1/FVC (A and B), FEV1 (C and D), and FVC
(E and F). SNPs with P < 1025 are shown in red. The horizontal red line shows the genome-wide significance
threshold (P < 2.0 3 1027).
J ALLERGY CLIN IMMUNOL
VOLUME 133, NUMBER 1
YAO ET AL 251
connected to the b-defensin genes, as well as to CXCL12 andTNFRSF13B in the GRAIL analysis. These 6 SNPs by themselvesexplained 5.8% of the residual variance in FEV1/FVC in theHutterites.
DISCUSSIONThe success of GWAS for unraveling the genetic architecture of
complex phenotypes has beenwidely debated.24-27,51-53 Althoughmany robust associations have been discovered for a widespectrum of diseases and phenotypes,54 the associated variantstypically explain relatively little of the phenotypic variation.Several recent studies have highlighted the importance of ap-proaches that consider multiple variants simultaneously,28,48,55-58
a more suitable approach if the genetic architecture of common
phenotypes is polygenic with many contributing loci with smalleffects. However, the best way to identify multiple contributingloci is at present unclear.The GWAS of the FEV1/FVC in the Hutterites revealed 2
previously reported associations with measures of lung function.Associations with multiple SNPs at the highly replicated locus on15q2321,23 reached genome-wide significance in the combinedsample, and SNPs at the C10orf11 on chromosome 10q22.323
reached genome-wide significance in the nonasthmatic subsetof the Hutterite sample. These results were robust to age, withevidence for association present in both the child and adultsubsets of the population. Moreover, we detected nominal levelsof significance with SNPs at 9 previously reported loci associatedwith lung function measures. Together, these results indicate thatgenes influencing lung function in Europeans and European

FIG 2. The combined effects of genotypes for 80 SNPs on the residual
FEV1/FVC in the Hutterites. Hutterites were binned by their total number of
alleles associated with reduced FEV1/FVC (x-axis); the mean 6 SE residual
FEV1/FVC for each bin is plotted on the right y-axis (blue dots and bars),
and the number of subjects in each bin is on the left y-axis. The linear
regression line through these points is shown in red.
J ALLERGY CLIN IMMUNOL
JANUARY 2014
252 YAO ET AL
Americans from the general population also contribute to lungfunction phenotypes in the Hutterites.To assess the combined effects of these and other SNPs with
less significant evidence of association, we used LASSOregression to select the minimum set of SNPs from among the312 with P < 1023. The LASSO regression selected 80 indepen-dent SNPs as the best predictor of the FEV1/FVC. Consistent withan additive genetic model, the mean phenotypic value decreaseswith increasing number of ‘‘risk’’ alleles (Fig 2). Moreover,this approach led to the discovery of additional genes, including3 independent clusters of b-defensin genes, 2 chemokine genes,and a TNF family receptor, suggesting an important link betweenhost defense mechanisms and lung function. Defensins areantimicrobial peptides that recruit inflammatory cells andmodulate innate and adaptive immune responses, participatingin both the promotion and resolution of inflammatory responses.59
There are 3 classes of defensins, but only the b-defensins arespecifically expressed in epithelial cells, including thoselining the respiratory tract. Genetic studies have implicated theb-defensin genes on chromosome 8p23 in lung function inpatients with asthma,60 chronic obstructive pulmonary disease(COPD)61 and with cystic fibrosis.62 In particular, DEFB1mRNA in bronchial epithelial cell biopsies was significantlyelevated in patients with COPD compared with controls andsignificantly associated with both reduced FEV1 and FEV1/FVCin patients with COPD and in controls.61 The results of our studieswould further suggest that all 3 clusters of b-defensin genes onchromosomes 8p23, 20p13, and 20p11 contribute to lung functionin healthy, unselected subjects. Chemokines are small proteinsthat bind to G-protein–coupled receptors and orchestrate themigration of circulating leukocytes to sites of inflammation.CCL18 (also named pulmonary and activated-regulated cytokine)is constitutively and highly expressed in the human lung63 and cangenerate regulatory T cells from CD41CD252 T cells in healthypersons via direct induction of TGF-b1.64 Functional poly-morphisms in the promoter of the TGFB1 gene have beenassociated with airway responsiveness and asthma exacerbations,
and haplotypes that comprise polymorphisms and specific codingvariants in this gene have been associated with lung function inpatients with cystic fibrosis,65,66 although the exact variants anddirection of effect are inconsistent across studies. Moreover,both b-defensin-2 and CCL18 were significantly elevated inperipheral blood from patients with COPD compared to in smok-ing and nonsmoking controls.67 CXCL12 (also name stromalderived growth factor 1) is critical to bone marrow–derivedstem cell production and shows increased expression in bronchialalveolar lavage fluid after bleomycin-induced lung fibrosis in amurine model and in airway tissues in patients with idiopathicpulmonary fibrosis compared with controls.68 The TNFRSF13Bgene encodes the transmembrane activator and calcium modula-tor and cyclophilin ligand interactor, which binds 2 ligands,B-cell activating factor and a proliferating-inducing ligand. It isthought that the transmembrane activator and calcium modulatorand cyclophilin ligand interactor plays a key role in B-cell activa-tion and differentiation into plasma cells. In a recent study, raremutations in TNFRSF13B were associated with asthmasymptoms in Swedish children.69 Moreover, expression ofB-cell activating factor in alveolar macrophages was inverselycorrelated with lung function in patients with COPD.70 Our studyextends the roles of these 2 chemokines and TNF-family receptorto interindividual variability in normal lung function.Despite conducting this study in a relatively small sample
(;1000 Hutterites) and the absence of a major locus thatinfluenced variation in lung function compared with other traits(eg, see Ober et al39 and Ober et al71), we were successful inidentifying both genome-wide significant associations withreplicated loci on chromosome 15 in the combined sample andon chromosome 10 in the nonasthmatic subset, in addition to aset of novel variants that are highly predictive for lung functionin the Hutterites. The power of our study was likely enhancedby the homogeneity of the Hutterite population compared withthe larger population samples that have been included in previousstudies of lung function.21-23 The advantages of this population forgenetic studies of complex phenotypes are primarily 2-fold. Onthe one hand, it is possible that there are fewer lung function-associated alleles segregating in the Hutterites because of thepopulation bottleneck that occurred before their emigration tothe United States.35,36 This would result in a simpler geneticarchitecture due to both overall reduced genetic variation andincreased frequencies of somevariantswith potentially larger phe-notypic effects that are rare in other European populations. On theother hand, their communal lifestyle and shared environmentalexposures,33 which include the absence of exposure to cigarettesmoke and air pollution, may have enhanced the effects of geneticvariation in general, and on specific pathways in particular, onlung development and subsequent lung function. In this popula-tion, exposures are remarkably similar during critical periods oflung development both in utero and in early life. Hutterite womenand young children are not directly involved in farming activities,and their homes are generally distant from the agricultural fieldsand animal barns. Meals are prepared in a communal kitchen,using traditional recipes that are shared among the colonies. Thereare no pets, televisions, radios, or computers in the homes, and, asa result, Hutterite children spend significant proportions of eachday playing outside. Thus, the absence of important environmen-tal exposures that affect lung development and lung function,combined with a shared environment throughout life, not onlyreduces nongenetic heterogeneity but also allows for the detection
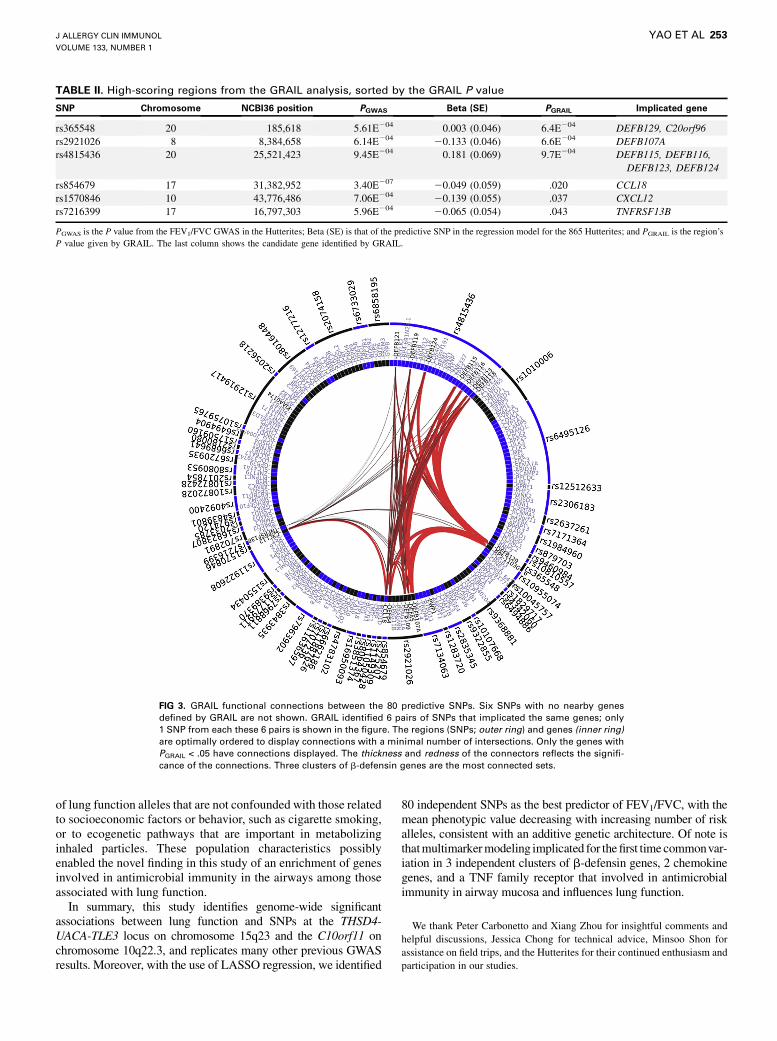
FIG 3. GRAIL functional connections between the 80 predictive SNPs. Six SNPs with no nearby genes
defined by GRAIL are not shown. GRAIL identified 6 pairs of SNPs that implicated the same genes; only
1 SNP from each these 6 pairs is shown in the figure. The regions (SNPs; outer ring) and genes (inner ring)
are optimally ordered to display connections with a minimal number of intersections. Only the genes with
PGRAIL < .05 have connections displayed. The thickness and redness of the connectors reflects the signifi-
cance of the connections. Three clusters of b-defensin genes are the most connected sets.
TABLE II. High-scoring regions from the GRAIL analysis, sorted by the GRAIL P value
SNP Chromosome NCBI36 position PGWAS Beta (SE) PGRAIL Implicated gene
rs365548 20 185,618 5.61E204 0.003 (0.046) 6.4E204 DEFB129, C20orf96
rs2921026 8 8,384,658 6.14E204 20.133 (0.046) 6.6E204 DEFB107A
rs4815436 20 25,521,423 9.45E204 0.181 (0.069) 9.7E204 DEFB115, DEFB116,
DEFB123, DEFB124
rs854679 17 31,382,952 3.40E207 20.049 (0.059) .020 CCL18
rs1570846 10 43,776,486 7.06E204 20.139 (0.055) .037 CXCL12
rs7216399 17 16,797,303 5.96E204 20.065 (0.054) .043 TNFRSF13B
PGWAS is the P value from the FEV1/FVC GWAS in the Hutterites; Beta (SE) is that of the predictive SNP in the regression model for the 865 Hutterites; and PGRAIL is the region’s
P value given by GRAIL. The last column shows the candidate gene identified by GRAIL.
J ALLERGY CLIN IMMUNOL
VOLUME 133, NUMBER 1
YAO ET AL 253
of lung function alleles that are not confounded with those relatedto socioeconomic factors or behavior, such as cigarette smoking,or to ecogenetic pathways that are important in metabolizinginhaled particles. These population characteristics possiblyenabled the novel finding in this study of an enrichment of genesinvolved in antimicrobial immunity in the airways among thoseassociated with lung function.In summary, this study identifies genome-wide significant
associations between lung function and SNPs at the THSD4-UACA-TLE3 locus on chromosome 15q23 and the C10orf11 onchromosome 10q22.3, and replicates many other previous GWASresults. Moreover, with the use of LASSO regression, we identified
80 independent SNPs as the best predictor of FEV1/FVC, with themean phenotypic value decreasing with increasing number of riskalleles, consistent with an additive genetic architecture. Of note isthatmultimarkermodeling implicated for thefirst timecommonvar-iation in 3 independent clusters of b-defensin genes, 2 chemokinegenes, and a TNF family receptor that involved in antimicrobialimmunity in airway mucosa and influences lung function.
We thank Peter Carbonetto and Xiang Zhou for insightful comments and
helpful discussions, Jessica Chong for technical advice, Minsoo Shon for
assistance on field trips, and the Hutterites for their continued enthusiasm and
participation in our studies.
J ALLERGY CLIN IMMUNOL
JANUARY 2014
254 YAO ET AL
Clinical implications: Three independent clusters of b-defensingenes, 2 chemokine genes (CCL18 and CXCL12), andTNFRSF13B that are involved in antimicrobial immunity inairway mucosa contribute to lung function phenotypes inhealthy, unselected subjects.
REFERENCES
1. Kochanek KD, Xu J, Murphy SL, Minino AM, Kung HC. Deaths: preliminary
data for 2009. Natl Vital Stat Rep 2011;59:1-51.
2. Burney PG, Hooper R. Forced vital capacity, airway obstruction and survival in a
general population sample from the USA. Thorax 2011;66:49-54.
3. Weiss ST, Segal MR, Sparrow D, Wager C. Relation of FEV1 and peripheral
blood leukocyte count to total mortality. The Normative Aging Study. Am J
Epidemiol 1995;142:493-8; discussion 499-503.
4. Schunemann HJ, Dorn J, Grant BJ, Winkelstein W Jr, Trevisan M. Pulmonary
function is a long-term predictor of mortality in the general population:
29-year follow-up of the Buffalo Health Study. Chest 2000;118:656-64.
5. Young RP, Hopkins R, Eaton TE. Forced expiratory volume in one second:
not just a lung function test but a marker of premature death from all causes.
Eur Respir J 2007;30:616-22.
6. Myint PK, Luben RN, Surtees PG, Wainwright NW, Welch AA, Bingham SA,
et al. Respiratory function and self-reported functional health: EPIC-Norfolk
population study. Eur Respir J 2005;26:494-502.
7. Hubert HB, Fabsitz RR, Feinleib M, Gwinn C. Genetic and environmental
influences on pulmonary function in adult twins. Am Rev Respir Dis 1982;
125:409-15.
8. Gibson JB, Martin NG, Oakeshott JG, Rowell DM, Clark P. Lung function in an
Australian population: contributions of polygenic factors and the Pi locus to
individual differences in lung function in a sample of twins. Ann Hum Biol
1983;10:547-56.
9. Lewitter FI, Tager IB, McGue M, Tishler PV, Speizer FE. Genetic and environ-
mental determinants of level of pulmonary function. Am J Epidemiol 1984;120:
518-30.
10. Astemborski JA, Beaty TH, Cohen BH. Variance components analysis of forced
expiration in families. Am J Med Genet 1985;21:741-53.
11. Beaty TH, Liang KY, Seerey S, Cohen BH. Robust inference for variance
components models in families ascertained through probands, II: analysis of
spirometric measures. Genet Epidemiol 1987;4:211-21.
12. Ghio AJ, Crapo RO, Elliott CG, Adams TD, Hunt SC, Jensen RL, et al.
Heritability estimates of pulmonary function. Chest 1989;96:743-6.
13. Cotch MF, Beaty TH, Cohen BH. Path analysis of familial resemblance of pulmo-
nary function and cigarette smoking. Am Rev Respir Dis 1990;142:1337-43.
14. Coultas DB, Hanis CL, Howard CA, Skipper BJ, Samet JM. Heritability of
ventilatory function in smoking and nonsmoking New Mexico Hispanics.
Am Rev Respir Dis 1991;144:770-5.
15. McClearn GE, Svartengren M, Pedersen NL, Heller DA, Plomin R. Genetic and
environmental influences on pulmonary function in aging Swedish twins.
J Gerontol 1994;49:264-8.
16. Chen Y, Horne SL, Rennie DC, Dosman JA. Segregation analysis of two lung
function indices in a random sample of young families: the Humboldt Family
Study. Genet Epidemiol 1996;13:35-47.
17. Wilk JB, Djousse L, Arnett DK, Rich SS, Province MA, Hunt SC, et al. Evidence
for major genes influencing pulmonary function in the NHLBI family heart study.
Genet Epidemiol 2000;19:81-94.
18. Palmer LJ, Burton PR, James AL, Musk AW, Cookson WO. Familial aggregation
and heritability of asthma-associated quantitative traits in a population-based
sample of nuclear families. Eur J Hum Genet 2000;8:853-60.
19. Palmer LJ, Knuiman MW, Divitini ML, Burton PR, James AL, Bartholomew HC,
et al. Familial aggregation and heritability of adult lung function: results from the
Busselton Health Study. Eur Respir J 2001;17:696-702.
20. Ober C, Abney M, McPeek MS. The genetic dissection of complex traits in a
founder population. Am J Hum Genet 2001;69:1068-79.
21. Repapi E, Sayers I, Wain LV, Burton PR, Johnson T, Obeidat M, et al. Genome-
wide association study identifies five loci associated with lung function. Nat
Genet 2010;42:36-44.
22. Hancock DB, Eijgelsheim M, Wilk JB, Gharib SA, Loehr LR, Marciante KD,
et al. Meta-analyses of genome-wide association studies identify multiple loci
associated with pulmonary function. Nat Genet 2010;42:45-52.
23. Soler Artigas M, Loth DW, Wain LV, Gharib SA, Obeidat M, Tang W, et al.
Genome-wide association and large-scale follow up identifies 16 new loci
influencing lung function. Nat Genet 2011;43:1082-90.
24. Manolio TA, Collins FS, Cox NJ, Goldstein DB, Hindorff LA, Hunter DJ, et al.
Finding the missing heritability of complex diseases. Nature 2009;461:747-53.
25. Maher B. Personal genomes: the case of the missing heritability. Nature 2008;
456:18-21.
26. McCarthy MI, Abecasis GR, Cardon LR, Goldstein DB, Little J, Ioannidis JP,
et al. Genome-wide association studies for complex traits: consensus, uncertainty
and challenges. Nat Rev Genet 2008;9:356-69.
27. Eichler EE, Flint J, Gibson G, Kong A, Leal SM, Moore JH, et al. Missing
heritability and strategies for finding the underlying causes of complex disease.
Nat Rev Genet 2010;11:446-50.
28. Yang J, Benyamin B, McEvoy BP, Gordon S, Henders AK, Nyholt DR, et al.
Common SNPs explain a large proportion of the heritability for human height.
Nat Genet 2010;42:565-9.
29. Gudbjartsson DF, Walters GB, Thorleifsson G, Stefansson H, Halldorsson BV,
Zusmanovich P, et al. Many sequence variants affecting diversity of adult human
height. Nat Genet 2008;40:609-15.
30. Lettre G, Jackson AU, Gieger C, Schumacher FR, Berndt SI, Sanna S, et al.
Identification of ten loci associated with height highlights new biological
pathways in human growth. Nat Genet 2008;40:584-91.
31. Weedon MN, Lango H, Lindgren CM, Wallace C, Evans DM, Mangino M, et al.
Genome-wide association analysis identifies 20 loci that influence adult height.
Nat Genet 2008;40:575-83.
32. Visscher PM. Sizing up human height variation. Nat Genet 2008;40:489-90.
33. Ober C, Cox NJ. The genetics of asthma. Mapping genes for complex traits in
founder populations. Clin Exp Allergy 1998;28(Suppl 1):101-5; discussion
108-10.
34. Weiss LA, Pan L, Abney M, Ober C. The sex-specific genetic architecture of
quantitative traits in humans. Nat Genet 2006;38:218-22.
35. Hostetler JA. Hutterite society. Baltimore, Md: Johns Hopkins University Press;
1974.
36. Steinberg AG, Bleibtreu HK, Kurczynski TW, Martin AO, Kurczynski EM.
Genetics studies in an inbred human isolate. In: Crow JF, Neel JV, editors.
Proceedings of the Third International Congress of Human Genetics. Baltimore,
Md: Johns Hopkins University Press; 1967. p. 267-90.
37. Abney M, Ober C, McPeek MS. Quantitative trait homozygosity and associa-
tion mapping and empirical genome-wide significance in large complex
pedigrees: fasting serum insulin level in the Hutterites. Am J Hum Genet 2002;
70:920-34.
38. Cusanovich DA, Billstrand C, Zhou X, Chavarria C, De Leon S, Michelini K,
et al. The combination of a genome-wide association study of lymphocyte count
and analysis of gene expression data reveals novel asthma candidate genes. Hum
Mol Genet 2012;21:2111-23.
39. Ober C, Tan Z, Sun Y, Possick JD, Pan L, Nicolae R, et al. Effect of variation in
CHI3L1 on serum YKL-40 level, asthma risk, and lung function. N Engl J Med
2008;358:1682-91.
40. Ober C, Tsalenko A, Parry R, Cox NJ. A second-generation genomewide screen
for asthma-susceptibility alleles in a founder population. Am J Hum Genet 2000;
67:1154-62.
41. Miller MR, Crapo R, Hankinson J, Brusasco V, Burgos F, Casaburi R, et al.
General considerations for lung function testing. Eur Respir J 2005;26:153-61.
42. Miller MR, Hankinson J, Brusasco V, Burgos F, Casaburi R, Coates A, et al.
Standardisation of spirometry. Eur Respir J 2005;26:319-38.
43. Bourgain C, Abney M, Schneider D, Ober C, McPeek MS. Testing for
Hardy-Weinberg equilibrium in samples with related individuals. Genetics
2004;168:2349-61.
44. Abney M, McPeek MS, Ober C. Broad and narrow heritabilities of quantitative
traits in a founder population. Am J Hum Genet 2001;68:1302-7.
45. Devlin B, Roeder K. Genomic control for association studies. Biometrics 1999;
55:997-1004.
46. Tibshirani R. Regression shrinkage and selectionv ia the lasso. J R Stat Soc Ser B
1996;58:267-88.
47. Guo W, Elston R, Zhu X. Evaluation of a LASSO regression approach on the
unrelated samples of Genetic Analysis Workshop 17. BMC Proc 2011;5:S12.
48. Wu TT, Chen YF, Hastie T, Sobel E, Lange K. Genome-wide association analysis
by lasso penalized logistic regression. Bioinformatics 2009;25:714-21.
49. Friedman J, Hastie T, Tibshirani R. Regularization paths for generalized linear
models via coordinate descent. J Stat Softw 2010;33:1-22.
50. Raychaudhuri S, Plenge RM, Rossin EJ, Ng AC, Purcell SM, Sklar P, et al.
Identifying relationships among genomic disease regions: predicting genes at
pathogenic SNP associations and rare deletions. PLoS Genet 2009;5:e1000534.
51. Goldstein DB. Common genetic variation and human traits. N Engl J Med 2009;
360:1696-8.
52. Hirschhorn JN. Genomewide association studies–illuminating biologic pathways.
N Engl J Med 2009;360:1699-701.

J ALLERGY CLIN IMMUNOL
VOLUME 133, NUMBER 1
YAO ET AL 255
53. Kraft P, Hunter DJ. Genetic risk prediction–are we there yet? N Engl J Med 2009;
360:1701-3.
54. A catalog of published genome-wide association studies. Available from http://
www.genome.gov/gwastudies/. Assessed January 11, 2012.
55. Kutalik Z, Whittaker J, Waterworth D, Beckmann JS, Bergmann S. Novel method
to estimate the phenotypic variation explained by genome-wide association
studies reveals large fraction of the missing heritability. Genet Epidemiol 2011;
35:341-9.
56. Lee SH, Wray NR, Goddard ME, Visscher PM. Estimating missing heritability
for disease from genome-wide association studies. Am J Hum Genet 2011;88:
294-305.
57. de los Campos G, Gianola D, Allison DB. Predicting genetic predisposition
in humans: the promise of whole-genome markers. Nat Rev Genet 2010;11:
880-6.
58. Makowsky R, Pajewski NM, Klimentidis YC, Vazquez AI, Duarte CW, Allison
DB, et al. Beyond missing heritability: prediction of complex traits. PLoS Genet
2011;7:e1002051.
59. Tecle T, Tripathi S, Hartshorn KL. Review: defensins and cathelicidins in lung
immunity. Innate Immun 2010;16:151-9.
60. Levy H, Raby BA, Lake S, Tantisira KG, Kwiatkowski D, Lazarus R, et al.
Association of defensin beta-1 gene polymorphisms with asthma. J Allergy
Clin Immunol 2005;115:252-8.
61. Andresen E, Gunther G, Bullwinkel J, Lange C, Heine H. Increased expression of
beta-defensin 1 (DEFB1) in chronic obstructive pulmonary disease. PLoS One
2011;6:e21898.
62. Crovella S, Segat L, Amato A, Athanasakis E, Bezzerri V, Braggion C, et al. A
polymorphism in the 59 UTR of the DEFB1 gene is associated with the lung
phenotype in F508del homozygous Italian cystic fibrosis patients. Clin Chem
Lab Med 2011;49:49-54.
63. Hieshima K, Imai T, Baba M, Shoudai K, Ishizuka K, Nakagawa T, et al. A novel
human CC chemokine PARC that is most homologous to macrophage-
inflammatory protein-1 alpha/LD78 alpha and chemotactic for T lymphocytes,
but not for monocytes. J Immunol 1997;159:1140-9.
64. Chang Y, de Nadai P, Azzaoui I, Morales O, Delhem N, Vorng H, et al. The
chemokine CCL18 generates adaptive regulatory T cells from memory CD41T cells of healthy but not allergic subjects. FASEB J 2010;24:5063-72.
65. Bremer LA, Blackman SM, Vanscoy LL, McDougal KE, Bowers A, Naughton
KM, et al. Interaction between a novel TGFB1 haplotype and CFTR genotype
is associated with improved lung function in cystic fibrosis. Hum Mol Genet
2008;17:2228-37.
66. Drumm ML, Konstan MW, Schluchter MD, Handler A, Pace R, Zou F, et al. Ge-
netic modifiers of lung disease in cystic fibrosis. N Engl J Med 2005;353:1443-53.
67. Dickens JA, Miller BE, Edwards LD, Silverman EK, Lomas DA, Tal-Singer R.
COPD association and repeatability of blood biomarkers in the ECLIPSE cohort.
Respir Res 2011;12:146.
68. Xu J, Mora A, Shim H, Stecenko A, Brigham KL, Rojas M. Role of the SDF-1/
CXCR4 axis in the pathogenesis of lung injury and fibrosis. Am J Respir Cell Mol
Biol 2007;37:291-9.
69. Janzi M, Melen E, Kull I, Wickman M, Hammarstrom L. Rare mutations in
TNFRSF13B increase the risk of asthma symptoms in Swedish children. Genes
Immun 2012;13:59-65.
70. Polverino F, Baraldo S, Bazzan E, Agostini S, Turato G, Lunardi F, et al. A novel
insight into adaptive immunity in chronic obstructive pulmonary disease: B cell
activating factor belonging to the tumor necrosis factor family. Am J Respir
Crit Care Med 2010;182:1011-9.
71. Ober C, Nord AS, Thompson EE, Pan L, Tan Z, Cusanovich D, et al. Genome-
wide association study of plasma lipoprotein(a) levels identifies multiple genes
on chromosome 6q. J Lipid Res 2009;50:798-806.
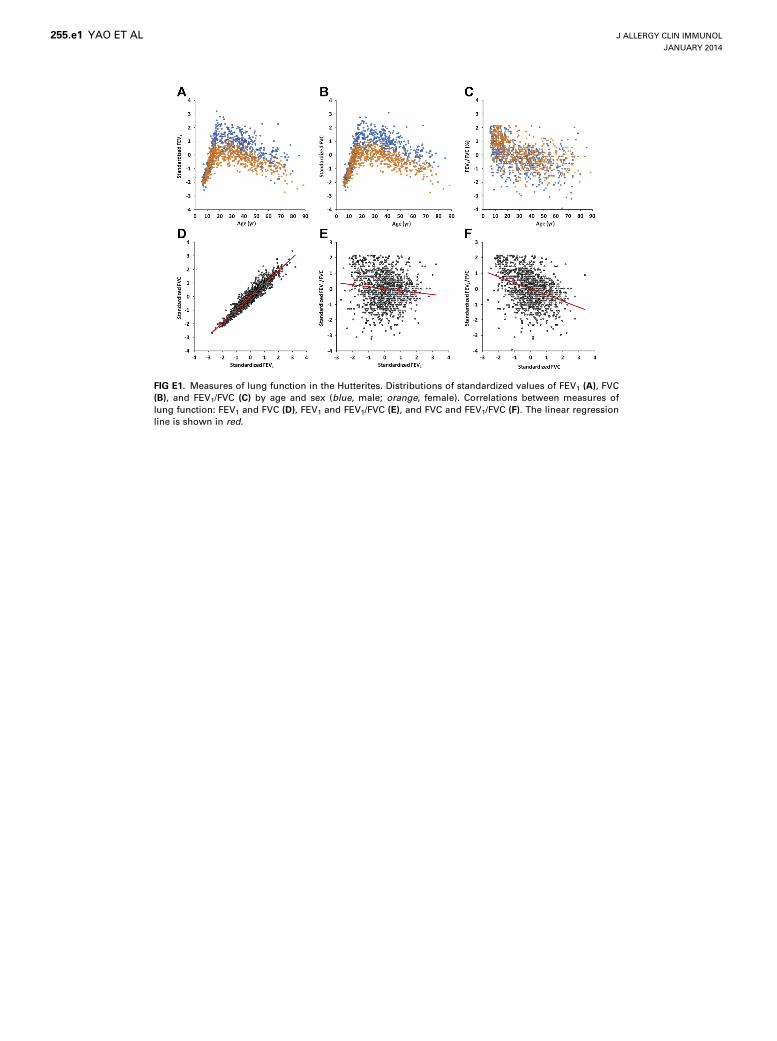
FIG E1. Measures of lung function in the Hutterites. Distributions of standardized values of FEV1 (A), FVC
(B), and FEV1/FVC (C) by age and sex (blue, male; orange, female). Correlations between measures of
lung function: FEV1 and FVC (D), FEV1 and FEV1/FVC (E), and FVC and FEV1/FVC (F). The linear regression
line is shown in red.
J ALLERGY CLIN IMMUNOL
JANUARY 2014
255.e1 YAO ET AL

FIG E2. Regional association plots for the 3 most significant associations in the GWAS of FEV1/FVC in the
Hutterites: THSD4-UACA-TLE3 locus on chromosome 15q23, CCL23-CCL18 locus on chromosome 17q12,
and C10orf11 locus on chromosome 10q22.3 in the full sample (A-C, respectively) and in subanalyses
that excluded persons with asthma (D-F, respectively). In each plot the most significantly associated SNP
is shown as a large blue diamond. The colors of the other SNPs reflect the linkage disequilibrium with
that SNP based on r2 values in the Hutterites (red, r2 >_ 0.8; orange, 0.5 <_ r2 < 0.8; yellow, 0.2 <_ r2 < 0.5; white,
r2 < 0.2).
J ALLERGY CLIN IMMUNOL
VOLUME 133, NUMBER 1
YAO ET AL 255.e2

TABLE E1. Air quality data for the 10 Hutterite colonies in South Dakota participating in these studies
ZIP code No. of colonies at this ZIP code Range of air quality values Overall air quality Overall rating
57042 1 5.0-9.9 9.2 Outstanding
57076 1 5.7-9.9 9.2 Outstanding
57301 2 6.8-9.9 9.6 Outstanding
57311 2 6.8-9.9 9.6 Outstanding
57314 1 5.0-9.9 9.2 Outstanding
57334 1 6.8-9.9 9.2 Outstanding
57334 1 6.8-9.9 9.6 Outstanding
57366 1 6.8-9.9 9.6 Outstanding
These data are gathered from measuring stations across the country. A higher number (on a scale of 1-10) reflects fewer amounts of pollutants (ie, a 9.0 means that 90% of the
stations around the country are measuring higher amounts than the local station). The 6 air pollutants reported are ozone, carbon monoxide, nitrogen dioxide, sulfur dioxide,
particulate matter (PM) 10, and PM 2.5. The range of values for the 6 pollutants and overall ratings are shown. Values for the individual pollutants can be found at http://www.
homefacts.com/airquality/South-Dakota.html.
J ALLERGY CLIN IMMUNOL
JANUARY 2014
255.e3 YAO ET AL
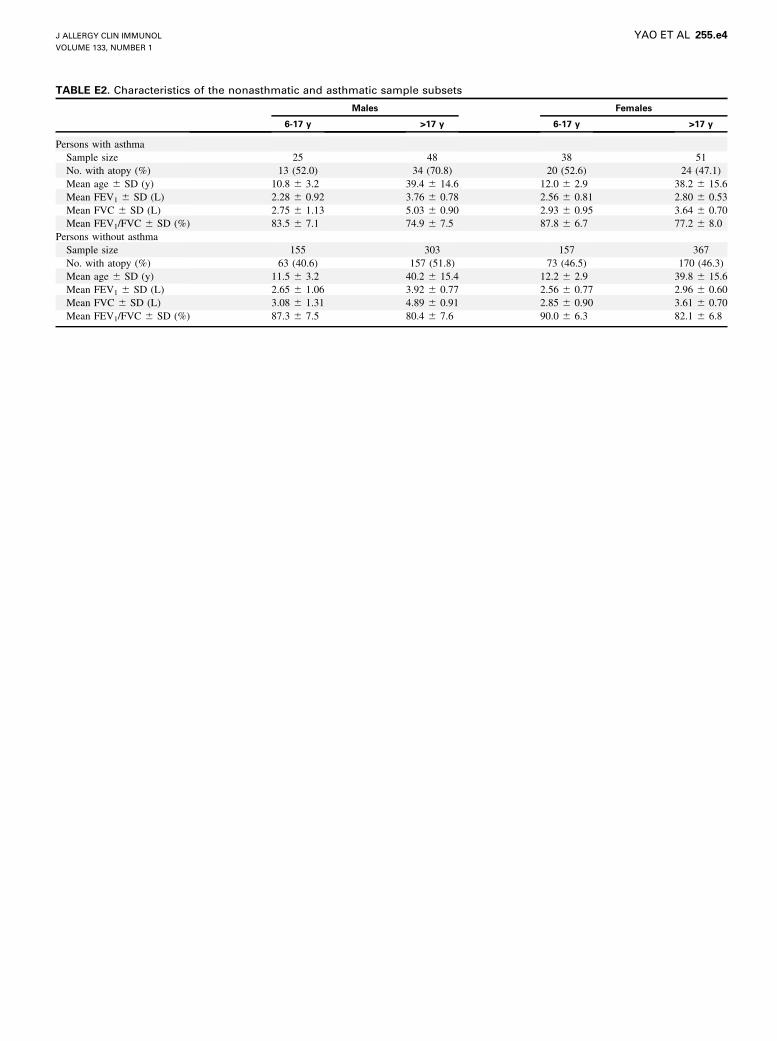
TABLE E2. Characteristics of the nonasthmatic and asthmatic sample subsets
Males Females
6-17 y >17 y 6-17 y >17 y
Persons with asthma
Sample size 25 48 38 51
No. with atopy (%) 13 (52.0) 34 (70.8) 20 (52.6) 24 (47.1)
Mean age 6 SD (y) 10.8 6 3.2 39.4 6 14.6 12.0 6 2.9 38.2 6 15.6
Mean FEV1 6 SD (L) 2.28 6 0.92 3.76 6 0.78 2.56 6 0.81 2.80 6 0.53
Mean FVC 6 SD (L) 2.75 6 1.13 5.03 6 0.90 2.93 6 0.95 3.64 6 0.70
Mean FEV1/FVC 6 SD (%) 83.5 6 7.1 74.9 6 7.5 87.8 6 6.7 77.2 6 8.0
Persons without asthma
Sample size 155 303 157 367
No. with atopy (%) 63 (40.6) 157 (51.8) 73 (46.5) 170 (46.3)
Mean age 6 SD (y) 11.5 6 3.2 40.2 6 15.4 12.2 6 2.9 39.8 6 15.6
Mean FEV1 6 SD (L) 2.65 6 1.06 3.92 6 0.77 2.56 6 0.77 2.96 6 0.60
Mean FVC 6 SD (L) 3.08 6 1.31 4.89 6 0.91 2.85 6 0.90 3.61 6 0.70
Mean FEV1/FVC 6 SD (%) 87.3 6 7.5 80.4 6 7.6 90.0 6 6.3 82.1 6 6.8
J ALLERGY CLIN IMMUNOL
VOLUME 133, NUMBER 1
YAO ET AL 255.e4

TABLE E3. SNPs associated with lung function at P < 1025 in the Hutterites
SNP Chr NCBI36 position Gene SNP-gene relationship Major/minor allele MAF
FEV1/FVC FEV1 FVC
P value P value P value
rs10864907 2 113,400,346 IL37 7.4 k downstream G/A 0.44 1.5E-01 6.7E-06 3.9E-04
rs2637260 10 77,990,352 C10orf11 3.2 k downstream T/C 0.44 7.5E-06 1.4E-01 3.9E-01
rs2637261 10 77,990,599 C10orf11 3.5 k downstream G/A 0.44 7.5E-06 1.4E-01 3.9E-01
rs2637266 10 78,001,324 C10orf11 14.2 k downstream T/C 0.44 2.0E-06 1.1E-01 4.2E-01
rs10824425 10 78,010,316 C10orf11 23.2 k downstream C/G 0.44 8.2E-06 1.1E-01 4.7E-01
rs11856830 15 68,211,555 TLE3 34.2 k upstream A/G 0.40 3.2E-06 1.6E-01 8.7E-01
rs2114719 15 68,720,392 UACA 13.6 k downstream G/A 0.12 4.2E-07 6.9E-04 2.5E-01
rs2162555 15 68,720,626 UACA 13.3 k downstream G/A 0.12 5.7E-07 2.2E-04 1.6E-01
rs6494886 15 68,720,785 UACA 13.2 k downstream C/A 0.12 3.9E-07 1.2E-03 2.5E-01
rs2162556 15 68,723,492 UACA 10.5 k downstream C/T 0.12 4.2E-07 6.9E-04 2.5E-01
rs1991088 15 68,791,504 UACA Intron C/T 0.18 1.2E-06 3.8E-02 8.6E-01
rs1477439 15 68,821,634 UACA Intron G/C 0.28 5.3E-06 1.3E-01 5.4E-01
rs4777305 15 68,832,522 UACA Intron T/C 0.18 1.5E-06 2.5E-02 8.1E-01
rs11633212 15 69,387,305 THSD4 Intron A/G 0.33 3.8E-06 1.6E-01 6.4E-01
rs17786786 15 69,395,673 THSD4 Intron A/C 0.27 4.2E-08* 1.6E-01 4.2E-01
rs6494904 15 69,396,576 THSD4 Intron T/C 0.25 1.4E-08* 5.8E-02 5.9E-01
rs11855326 15 69,397,889 THSD4 Intron G/A 0.25 2.5E-08* 5.4E-02 6.6E-01
rs1837762 15 69,399,357 THSD4 Intron C/T 0.11 5.7E-08* 1.7E-03 4.5E-01
rs11858540 15 69,409,840 THSD4 Intron T/G 0.12 3.0E-07 1.5E-02 7.4E-01
rs1441361 15 69,412,176 THSD4 Intron A/G 0.12 2.8E-07 1.5E-02 7.3E-01
rs1568010 15 69,455,566 THSD4 Intron T/G 0.44 7.6E-06 3.8E-01 5.8E-02
rs11858454 15 69,456,169 THSD4 Intron C/T 0.44 5.3E-06 3.8E-01 6.1E-02
rs8033889 15 69,467,134 THSD4 Intron G/T 0.25 2.3E-07 4.4E-03 3.3E-01
rs4531689 15 69,476,033 THSD4 Intron C/T 0.46 4.8E-06 5.0E-01 5.4E-02
rs4288952 15 69,477,937 THSD4 Intron G/A 0.45 4.6E-06 4.6E-01 4.8E-02
rs12441227 15 69,483,940 THSD4 Intron T/C 0.22 3.4E-09* 2.2E-03 3.7E-01
rs712046 17 31,382,410 CCL23 13.3 k upstream G/A 0.32 3.2E-07 8.2E-02 5.0E-01
rs854679 17 31,382,952 CCL23 13.8 k upstream G/T 0.32 3.4E-07 8.9E-02 5.2E-01
rs854674 17 31,384,085 CCL23 15.0 k upstream T/C 0.32 6.8E-07 1.3E-01 4.6E-01
rs2017854 17 62,918,483 PITPNC1 Intron G/C 0.41 2.6E-06 5.2E-01 8.5E-04
rs4799710 18 29,520,739 ASXL3 Intron A/G 0.32 2.8E-01 6.4E-04 6.7E-06
rs2835345 21 36,723,304 CHAF1B 12.3 k downstream G/T 0.25 8.3E-06 1.1E-01 4.9E-01
Chr, Chromosome; MAF, minor allele frequency.
*P values exceeded the threshold for Bonferroni-corrected genome-wide significance (P < 2.0 3 1027).
J ALLERGY CLIN IMMUNOL
JANUARY 2014
255.e5 YAO ET AL

TABLE E4. Results of analyses of FEV1/FVC in combined sample, in sample excluding asthmatics (nonasthmatics), and in analyses
stratified by age
SNP Chr NCBI36 position
Combined sample Nonasthmatics Asthmatics Adults (>17 y) Children (<_17 y)
No. P value No. P value No. P value No. P value No. P value
rs2637260 10 77,990,352 1106 7.50E-06 949 6.34E-07 157 9.82E-01 760 2.70E-04 346 2.69E-02
rs2637261 10 77,990,599 1106 7.50E-06 949 6.34E-07 157 9.82E-01 760 2.70E-04 346 2.69E-02
rs2637266 10 78,001,324 1065 2.00E-06 916 2.43E-07 149 8.31E-01 722 4.22E-05 343 3.38E-02
rs10824425 10 78,010,316 1099 8.23E-06 943 8.98E-07 156 9.99E-01 753 3.34E-04 346 2.58E-02
rs11856830 15 68,211,555 1055 3.17E-06 905 2.41E-04 150 1.42E-01 713 1.87E-03 342 1.40E-03
rs2114719 15 68,720,392 1106 4.15E-07 949 2.97E-05 157 1.93E-02 760 5.56E-05 346 1.98E-02
rs2162555 15 68,720,626 1095 5.68E-07 940 3.74E-05 155 2.38E-02 750 4.62E-05 345 2.38E-02
rs6494886 15 68,720,785 1092 3.87E-07 938 1.50E-05 154 4.28E-02 750 6.07E-05 342 2.58E-02
rs2162556 15 68,723,492 1106 4.15E-07 949 2.97E-05 157 1.93E-02 760 5.56E-05 346 1.98E-02
rs1991088 15 68,791,504 1097 1.18E-06 941 1.72E-04 156 1.64E-03 753 3.87E-04 344 5.35E-03
rs1477439 15 68,821,634 1101 5.34E-06 945 1.18E-03 156 9.70E-03 757 4.63E-03 344 5.08E-04
rs4777305 15 68,832,522 1100 1.47E-06 944 1.60E-04 156 3.22E-03 754 6.59E-04 346 4.03E-03
rs11633212 15 69,387,305 1103 3.80E-06 946 5.33E-04 157 7.29E-05 757 1.22E-04 346 2.31E-02
rs17786786 15 69,395,673 1100 4.23E-08 944 1.28E-05 156 7.28E-05 757 1.08E-05 343 1.09E-02
rs6494904 15 69,396,576 1105 1.43E-08 948 3.64E-06 157 1.57E-04 759 3.23E-06 346 9.91E-03
rs11855326 15 69,397,889 1104 2.47E-08 947 6.12E-06 157 1.57E-04 758 6.08E-06 346 9.91E-03
rs1837762 15 69,399,357 1104 5.65E-08 947 5.42E-06 157 2.36E-02 758 4.17E-05 346 1.59E-02
rs11858540 15 69,409,840 1106 2.98E-07 949 3.44E-05 157 1.26E-02 760 2.05E-04 346 2.12E-02
rs1441361 15 69,412,176 1105 2.76E-07 948 3.06E-05 157 1.26E-02 759 1.95E-04 346 2.12E-02
rs1568010 15 69,455,566 1102 7.56E-06 946 3.10E-04 156 1.45E-01 757 3.08E-05 345 1.15E-01
rs11858454 15 69,456,169 1106 5.26E-06 949 2.26E-04 157 1.38E-01 760 2.87E-05 346 1.04E-01
rs8033889 15 69,467,134 1103 2.31E-07 946 3.56E-05 157 1.08E-03 757 1.89E-05 346 2.07E-03
rs4531689 15 69,476,033 1104 4.77E-06 947 3.87E-04 157 1.05E-01 759 5.60E-05 345 4.50E-02
rs4288952 15 69,477,937 1099 4.58E-06 942 2.60E-04 157 1.03E-01 755 3.51E-05 344 8.37E-02
rs12441227 15 69,483,940 1091 3.38E-09 36 2.79E-06 155 2.05E-03 746 4.70E-06 345 5.86E-04
rs712046 17 31,382,410 1104 3.20E-07 947 7.23E-05 157 4.37E-02 759 6.73E-05 345 6.27E-03
rs854679 17 31,382,952 1097 3.40E-07 941 5.66E-05 156 6.64E-02 751 6.21E-05 346 7.38E-03
rs854674 17 31,384,085 1098 6.77E-07 941 9.55E-05 157 5.44E-02 752 1.39E-04 346 6.92E-03
rs2017854 17 62,918,483 1105 2.58E-06 948 3.87E-05 157 1.48E-03 759 1.63E-05 346 1.19E-02
rs2835345 21 36,723,304 1103 8.29E-06 947 1.92E-04 156 3.39E-03 758 2.45E-03 345 5.70E-03
All SNPs with P < 1025 in the combined sample are shown.
Chr, Chromosome.
J ALLERGY CLIN IMMUNOL
VOLUME 133, NUMBER 1
YAO ET AL 255.e6
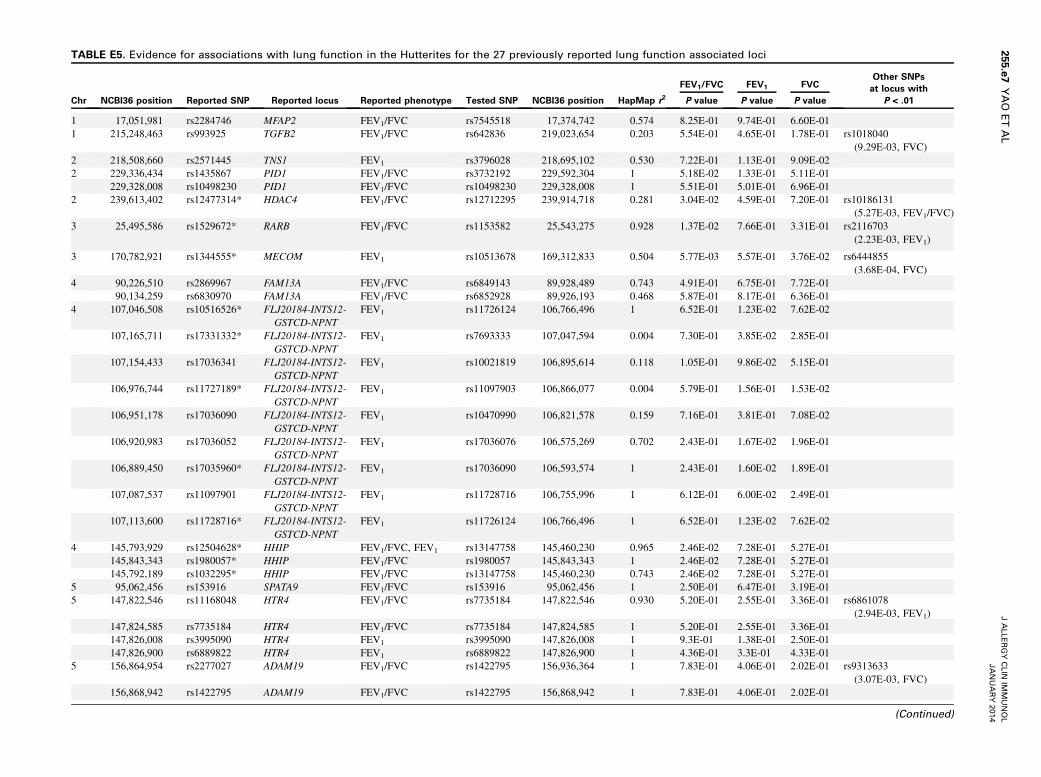
TABLE E5. Evidence for associations with lung function in the Hutterites for the 27 previously reported lung function associated loci
Chr NCBI36 position Reported SNP Reported locus Reported phenotype Tested SNP NCBI36 position HapMap r2
FEV1/FVC FEV1 FVCOther SNPs
at locus with
P < .01P value P value P value
1 17,051,981 rs2284746 MFAP2 FEV1/FVC rs7545518 17,374,742 0.574 8.25E-01 9.74E-01 6.60E-01
1 215,248,463 rs993925 TGFB2 FEV1/FVC rs642836 219,023,654 0.203 5.54E-01 4.65E-01 1.78E-01 rs1018040
(9.29E-03, FVC)
2 218,508,660 rs2571445 TNS1 FEV1 rs3796028 218,695,102 0.530 7.22E-01 1.13E-01 9.09E-02
2 229,336,434 rs1435867 PID1 FEV1/FVC rs3732192 229,592,304 1 5.18E-02 1.33E-01 5.11E-01
229,328,008 rs10498230 PID1 FEV1/FVC rs10498230 229,328,008 1 5.51E-01 5.01E-01 6.96E-01
2 239,613,402 rs12477314* HDAC4 FEV1/FVC rs12712295 239,914,718 0.281 3.04E-02 4.59E-01 7.20E-01 rs10186131
(5.27E-03, FEV1/FVC)
3 25,495,586 rs1529672* RARB FEV1/FVC rs1153582 25,543,275 0.928 1.37E-02 7.66E-01 3.31E-01 rs2116703
(2.23E-03, FEV1)
3 170,782,921 rs1344555* MECOM FEV1 rs10513678 169,312,833 0.504 5.77E-03 5.57E-01 3.76E-02 rs6444855
(3.68E-04, FVC)
4 90,226,510 rs2869967 FAM13A FEV1/FVC rs6849143 89,928,489 0.743 4.91E-01 6.75E-01 7.72E-01
90,134,259 rs6830970 FAM13A FEV1/FVC rs6852928 89,926,193 0.468 5.87E-01 8.17E-01 6.36E-01
4 107,046,508 rs10516526* FLJ20184-INTS12-
GSTCD-NPNT
FEV1 rs11726124 106,766,496 1 6.52E-01 1.23E-02 7.62E-02
107,165,711 rs17331332* FLJ20184-INTS12-
GSTCD-NPNT
FEV1 rs7693333 107,047,594 0.004 7.30E-01 3.85E-02 2.85E-01
107,154,433 rs17036341 FLJ20184-INTS12-
GSTCD-NPNT
FEV1 rs10021819 106,895,614 0.118 1.05E-01 9.86E-02 5.15E-01
106,976,744 rs11727189* FLJ20184-INTS12-
GSTCD-NPNT
FEV1 rs11097903 106,866,077 0.004 5.79E-01 1.56E-01 1.53E-02
106,951,178 rs17036090 FLJ20184-INTS12-
GSTCD-NPNT
FEV1 rs10470990 106,821,578 0.159 7.16E-01 3.81E-01 7.08E-02
106,920,983 rs17036052 FLJ20184-INTS12-
GSTCD-NPNT
FEV1 rs17036076 106,575,269 0.702 2.43E-01 1.67E-02 1.96E-01
106,889,450 rs17035960* FLJ20184-INTS12-
GSTCD-NPNT
FEV1 rs17036090 106,593,574 1 2.43E-01 1.60E-02 1.89E-01
107,087,537 rs11097901 FLJ20184-INTS12-
GSTCD-NPNT
FEV1 rs11728716 106,755,996 1 6.12E-01 6.00E-02 2.49E-01
107,113,600 rs11728716* FLJ20184-INTS12-
GSTCD-NPNT
FEV1 rs11726124 106,766,496 1 6.52E-01 1.23E-02 7.62E-02
4 145,793,929 rs12504628* HHIP FEV1/FVC, FEV1 rs13147758 145,460,230 0.965 2.46E-02 7.28E-01 5.27E-01
145,843,343 rs1980057* HHIP FEV1/FVC rs1980057 145,843,343 1 2.46E-02 7.28E-01 5.27E-01
145,792,189 rs1032295* HHIP FEV1/FVC rs13147758 145,460,230 0.743 2.46E-02 7.28E-01 5.27E-01
5 95,062,456 rs153916 SPATA9 FEV1/FVC rs153916 95,062,456 1 2.50E-01 6.47E-01 3.19E-01
5 147,822,546 rs11168048 HTR4 FEV1/FVC rs7735184 147,822,546 0.930 5.20E-01 2.55E-01 3.36E-01 rs6861078
(2.94E-03, FEV1)
147,824,585 rs7735184 HTR4 FEV1/FVC rs7735184 147,824,585 1 5.20E-01 2.55E-01 3.36E-01147,826,008 rs3995090 HTR4 FEV1 rs3995090 147,826,008 1 9.3E-01 1.38E-01 2.50E-01
147,826,900 rs6889822 HTR4 FEV1 rs6889822 147,826,900 1 4.36E-01 3.3E-01 4.33E-01
5 156,864,954 rs2277027 ADAM19 FEV1/FVC rs1422795 156,936,364 1 7.83E-01 4.06E-01 2.02E-01 rs9313633
(3.07E-03, FVC)
156,868,942 rs1422795 ADAM19 FEV1/FVC rs1422795 156,868,942 1 7.83E-01 4.06E-01 2.02E-01
(Continued)
JALLERGYCLIN
IMMUNOL
JANUARY2014
255.e7
YAO
ETAL

TABLE E5. (Continued)
Chr NCBI36 position Reported SNP Reported locus Reported phenotype Tested SNP NCBI36 position HapMap r2
FEV1/FVC FEV1 FVCOther SNPs
at locus with
P < .01P value P value P value
6 28,430,275 rs6903823 ZKSCAN3/ZNF323 FEV1 rs6922111 28,325,308 0.945 7.46E-01 4.97E-01 2.98E-01
6 31,676,448 rs2857595 NCR3 FEV1/FVC rs2857595 31,676,448 1 6.17E-01 9.31E-01 7.84E-01
6 32,259,421 rs2070600 PPT2-AGER-
NOTCH4
FEV1/FVC rs206015 32,182,759 0.649 8.48E-01 2.31E-01 1.87E-01
32,232,402 rs10947233* PPT2-AGER-
NOTCH4
FEV1/FVC rs10947233 32,232,402 1 2.42E-01 1.45E-01 8.64E-03
6 109,374,743 rs2798641* ARMC2 FEV1/FVC rs2798641 109,374,743 2.22E-03 8.37E-01 2.15E-01 rs6904998
(3.25E-03, FVC)
6 142,792,209 rs3817928 GPR126 FEV1/FVC rs6906468 142,769,386 1 1.59E-01 6.80E-01 8.07E-01
142,818,757 rs7776375 GPR126 FEV1/FVC rs595184 143,012,314 0.147 4.47E-01 7.77E-01 8.55E-01
142,748,826 rs6937121 GPR126 FEV1/FVC rs6937121 142,748,826 1 1.60E-01 6.47E-01 2.88E-01142,733,242 rs11155242 GPR126 FEV1/FVC rs6906468 142,769,386 1 1.59E-01 6.80E-01 8.07E-01
9 95,310,563 rs16909898 PTCH1 FEV1/FVC rs10512249 98,256,309 1 3.00E-01 4.54E-01 3.29E-01
95,335,864 rs10512249 PTCH1 FEV1/FVC rs10512249 95,335,864 1 3.00E-01 4.54E-01 3.29E-01
10 12,317,998 rs7068966 CDC123 FEV1/FVC, FEV1 rs7068966 12,317,998 1 5.98E-01 8.57E-01 7.36E-01
10 77,985,230 rs11001819* C10orf11 FEV1 rs2256413 78,315,334 0.755 4.67E-04 3.62E-01 5.40E-01 rs2637266
(2.00E-06, FEV1/FVC)
12 55,813,550 rs11172113 LRP1 FEV1/FVC rs1466535 57,534,470 0.721 5.31E-01 5.70E-02 5.26E-02
12 94,773,896 rs1036429 CCDC38 FEV1/FVC rs4762637 96,282,655 0.691 4.79E-01 9.81E-01 3.41E-01
15 69,432,174 rs12899618* THSD4 FEV1/FVC rs12102112 71,655,735 1 3.54E-04 8.39E-01 1.37E-01 rs12441227
(3.38E-09, FEV1/FVC;
2.99E-04, FEV1)
16 56,632,783 rs12447804� MMP15 FEV1/FVC -� -� -� -�16 73,947,817 rs2865531 CFDP1 FEV1/FVC rs12444589 75,454,404 1 1.96E-01 7.80E-02 3.13E-01 rs10871308
(5.07E-03, FEV1)
21 34,574,109 rs9978142 KCNE2 FEV1/FVC rs10470171 35,652,644 0.857 5.26E-01 8.64E-01 9.41E-01 rs2834455
(8.53E-03, FEV1/FVC)
If the reported SNP was not genotyped in the Hutterites, a surrogate SNP with the strongest LD to the reported SNP and the amount of LD in HapMap (r2) are shown. One SNP, rs12447804, did not have any surrogate SNPs in the
Hutterites. Other SNPs at the same locus with P < .01 in the Hutterites are shown in the last column.
Chr, Chromosome.
*SNPs replicated at P < .05.
�HapMap linkage disequilibrium data are not available for rs12447804; therefore, no surrogate marker has been selected for rs12447804.
JALLERGYCLIN
IMMUNOL
VOLUME133,NUMBER1
YAO
ETAL
255.e8

TABLE E6. Eighty SNPs that best predicted FEV1/FVC in the Hutterites, sorted by the chromosome location
SNP Chr NCBI36 position PGWAS Beta (SE) PGRAIL Implicated gene
rs6694986 1p13.3 107,631,201 4.0E-04 0.090 (0.049) 0.340 NTNG1
rs17509160 1p13.3 107,656,536 6.7E-05 0.074 (0.077) 0.340 NTNG1
rs1277216 1p13.3 109,160,754 4.7E-04 0.105 (0.048) 0.961 STXBP3
rs6689641 1p13.3 110,521,9233 7.1E-04 0.090 (0.051) 0.756 SLC6A17
rs6662186 1q23.3 163,531,357 1.2E-04 0.092 (0.077) 0.250 LMX1A
rs11887626 2p16.3 47,709,832 1.4E-04 0.137 (0.062) 0.737 MSH2
rs702891 2p14 65,611,954 4.6E-04 -0.015 (0.049) 0.242 SPRED2
rs6733029 2p14 68,287,661 3.7E-04 0.057 (0.046) 0.516 PNO1
rs2707549 2q14.3 124,120,027 2.3E-04 0.040 (0.047) NA
rs6720935 2q21.2 132,882,030 6.9E-04 0.067 (0.050) 0.758 LOC339742
rs16823807 2q23.3 153,146,906 9.2E-05 0.044 (0.088) 0.489 FMNL2
rs4342060 3q22.3 138,698,510 7.6E-04 0.050 (0.059) 0.363 SOX14
rs3851374 3q26.2 170,184,342 7.0E-04 20.102 (0.048) 0.089 EVI1
rs11922608 3q27.3 188,719,180 5.4E-04 0.090 (0.069) 0.482 SST
rs10517456 4p14 37,631,127 9.0E-04 0.046 (0.051) 0.971 PTTG2
rs1984960 4p14 37,644,419 3.0E-04 0.175 (0.080) 0.971 PTTG2
rs12512633 4q28.1 124,506,365 5.2E-04 20.115 (0.052) 0.149 SPRY1
rs6858195 4q31.21 144,909,047 3.1E-04 0.076 (0.046) 0.978 GYPE
rs10045757 5p14.2 23,306,226 1.0E-03 0.094 (0.059) 0.423 LOC391771
rs12659895 5p14.1 27,801,997 6.4E-04 20.022 (0.057) NA
rs245610 5q34 162,032,345 8.9E-04 20.134 (0.083) NA
rs9460984 6p22.2 24,355,227 5.6E-05 0.144 (0.059) 0.412 DCDC2
rs9368881 6p21.31 35,742,266 3.5E-04 20.061 (0.047) 0.641 C6orf81
rs4839801 6q16.3 102,353,321 9.6E-04 0.004 (0.052) 0.777 GRIK2
rs1149309 6q21 105,856,616 4.9E-05 0.031 (0.067) 0.574 PREP
rs10872028 6q21 109,420,421 2.7E-04 20.055 (0.060) 0.256 ARMC2
rs10872428 6q23.3 135,533,565 4.4E-04 0.207 (0.057) 0.324 MYB
rs9389370 6q23.3 136,472,958 5.4E-04 20.072 (0.044) 0.620 PDE7B
rs4092400 8p23.2 2,371,110 9.9E-04 0.065 (0.048) 0.616 MYOM2
rs974120 8p23.2 2,634,025 3.2E-04 0.038 (0.079) 0.937 CSMD1
rs2921026 8p23.1 8,384,658 6.1E-04 20.133 (0.046) 0.001 DEFB107A
rs10107668 8p12 33,643,721 8.0E-04 0.038 (0.048) 0.208 DUSP26
rs11779911 8p11.21 40,301,135 7.0E-04 20.173 (0.049) 0.905 ZMAT4
rs7001967 8q21.13 83,905,913 8.1E-04 0.189 (0.079) NA
rs10955074 8q21.3 87,925,578 9.6E-04 20.045 (0.045) 0.680 CNGB3
rs1283720 8q23.1 108,541,504 5.2E-04 20.099 (0.048) 0.392 ANGPT1
rs9886419 8q24.21 129,353,533 7.1E-04 20.119 (0.050) NA
rs10810557 9p22.3 16,326,250 3.4E-04 0.077 (0.044) 0.648 BNC2
rs3843935 9p13.3 33,777,871 9.0E-04 0.029 (0.048) 0.573 PRSS3
rs2306183 9q22.31 95,092,000 9.7E-04 20.118 (0.045) 0.816 PHF2
rs10759765 9q22.33 99,347,314 4.2E-05 20.065 (0.048) 0.261 TMOD1
rs1570846 10q11.21 43,776,486 7.1E-04 20.139 (0.055) 0.037 CXCL12
rs2637261 10q22.3 77,990,599 7.5E-06 0.044 (0.044) 0.766 KCNMA1
rs1010006 10q24.2 99,562,286 4.5E-04 0.051 (0.046) 0.662 ANKRD2
rs7963902 12p13.32 4,988,938 1.9E-04 0.090 (0.043) 0.932 KCNA6
rs3925064 12p12.1 23,985,031 4.2E-04 20.099 (0.048) 0.271 SOX5
rs7968811 12p12.1 24,428,104 2.8E-04 20.021 (0.045) 0.271 SOX5
rs11050428 12p12.1 29,823,051 2.2E-04 20.112 (0.065) 0.818 TMTC1
rs1829717 12q21.31 80,433,224 7.8E-05 0.009 (0.048) 0.899 PPFIA2
rs2056218 12q21.31 82,056,671 4.5E-04 0.147 (0.048) 0.903 TMTC2
rs879703 12q22 92,946,123 2.4E-04 0.049 (0.047) 0.467 CRADD
rs7134063 12q23.3 106,723,461 4.4E-05 0.083 (0.047) 0.167 PWP1
rs2329247 13q31.1 82,160,171 8.0E-04 0.055 (0.077) NA
rs9322855 14q11.2 20,223,139 7.6E-04 20.048 (0.046) 0.171 RNASE4
rs8016448 14q24.3 72,961,640 5.9E-04 20.071 (0.055) 0.316 C14orf169
rs2180080 14q32.13 93,560,454 7.2E-04 20.132 (0.067) 0.213 OTUB2
rs2033785 15q22.33 65,228,920 2.9E-04 0.044 (0.057) 0.262 SMAD3
rs11636597 15q23 68,208,095 1.5E-05 0.117 (0.059) 0.642 TLE3
rs12907875 15q23 68,217,654 4.6E-04 20.024 (0.054) 0.642 TLE3
rs6494886 15q23 68,720,785 3.9E-07 20.018 (0.098) 0.557 UACA
rs1477439 15q23 68,821,634 5.3E-06 0.110 (0.071) 0.557 UACA
rs6494904 15q23 69,396,576 1.4E-08 20.016 (0.069) 0.739 THSD4
(Continued)
J ALLERGY CLIN IMMUNOL
JANUARY 2014
255.e9 YAO ET AL

TABLE E6. (Continued)
SNP Chr NCBI36 position PGWAS Beta (SE) PGRAIL Implicated gene
rs12592370 15q24.1 72,098,742 4.5E-04 20.027 (0.065) 0.738 PML
rs1550434 15q24.1 72,118,264 2.0E-05 20.067 (0.057) 0.738 PML
rs6495126 15q24.1 72,962,079 8.0E-04 20.060 (0.056) 0.976 RPP25
rs7171364 15q25.3 83,803,031 3.4E-04 0.180 (0.064) 0.367 PDE8A
rs12919417 16q22.3 70,137,212 3.2E-04 0.043 (0.068) 0.345 KIAA0174
rs707236 16q23.3 82,360,661 6.3E-04 0.143 (0.045) 0.910 CDH13
rs4783102 16q24.1 83,535,549 1.4E-04 20.106 (0.054) 0.687 USP10
rs7216399 17p11.2 16,797,303 6.0E-04 20.065 (0.054) 0.043 TNFRSF13B
rs8080953 17p11.2 19,381,812 1.0E-03 20.233 (0.100) 0.748 ZNF179
rs225207 17q11.2 27,918,837 4.9E-05 20.096 (0.065) 0.980 MYO1D
rs8064367 17q12 29,496,973 9.1E-04 20.018 (0.062) 0.521 ACCN1
rs854679 17q12 31,382,952 3.4E-07 20.049 (0.059) 0.020 CCL18
rs2074158 17q21.2 37,510,689 8.8E-05 20.132 (0.083) 0.486 HSPB9
rs16950093 17q21.33 46,995,183 5.6E-04 20.085 (0.054) 0.205 UTP18
rs2017854 17q24.2 62,918,483 2.6E-06 20.097 (0.048) 0.828 PITPNC1
rs365548 20p13 185,618 5.6E-04 0.003 (0.046) 0.001 DEFB129, C20orf96
rs4815436 20p11.21 25,521,423 9.4E-04 0.181 (0.069) 0.001 DEFB115, DEFB116, DEFB123,
DEFB124
rs2835345 21q22.13 36,723,304 8.3E-06 20.108 (0.055) 0.900 CHAF1B
PGWAS is the P value from the FEV1/FVC GWAS in the Hutterites; Beta (SE) is that of the predictive SNP in the regression model for the 865 Hutterites; and PGRAIL is the region’s
P value given by GRAIL.
Chr, Chromosome; NA, not available.
J ALLERGY CLIN IMMUNOL
VOLUME 133, NUMBER 1
YAO ET AL 255.e10