gerdau 080611 eng - latibex
TRANSCRIPT
BRAZIL EQUITY RESEARCH LARGE CAPS
Resumption of coverage | Steel June 8, 2011
Gerdau and Metalúrgica Gerdau
This research was prepared by BES Securities do Brasil S.A.CCVM - Av. Brig. Faria Lima, 3729 – Mezanino 04538-905 – São Paulo – BRAZIL FOR IMPORTANT DISCLOSURE INFORMATION, INCLUDING DISCLOSURES RELATED TO THE U.S. DISTRIBUTOR OF THIS REPORT, PLEASE REFER TO LAST 4 PAGES OF THIS REPORT.
BUY ON WEAKNESS AND FUNDAMENTALS
We resume coverage of Gerdau and Metalúrgica Gerdau with BUY ratings, reiteratingour bullish view on the long steel segment in Brazil and in the US. Gerdau (GGBR4 –GGB) is our top pick in our coverage universe of BZ Steels. GGBR4 trades at an EV/Ebitda12E multiple of 6.5x and P/E12E of 11.7x on our estimates. We expect a 24% YoY increase in the EPS12E to R$ 1.40. Given the recent underperformance of Gerdau’s shares vs. local peers and the IBOV, positive earnings momentum we see, higher forecast Ebitda margins for 2Q and 3Q11 and 49% upside potential based on our DCF, we believe Gerdau’s shares could re-rate in the short term. We revise down our PT from R$ 31.8/sh to R$ 24.4/sh in order to reflect the higher number of outstanding shares after the offering, 1Q11 results and lower earnings estimates for 2011E and 2012E. The new PT includes our estimated value for Gerdau’s mining assets, for which we have adopted conservative assumptions based on similar iron ore projects given no information has been disclosed by the company.
We value mining assets at US$ 2.8bn = 16% of upside potential We estimate Gerdau’s mining assets to be worth R$ 4.5bn (US$ 2.8bn), which corresponds to R$ 2.7/share and 16% upside potential. We assumed a mining period of 30 years, sales of 32mtpa from 2017 (39 mt of production, less 7 mt of Açominas’ consumption), CAPEX of US$ 120/ton for mining (US$ 100/ton) and port logistics (US$ 20/ton). We believe Gerdau’s management should announce further details about the next steps in the company’s strategy to monetize its iron ore assets within 5 to 6 months. In the short term, we expect Gerdau’s shares to start reflecting the potential value of the company’s mining assets, which we believe are not priced in, leading to a re-rating of the shares.
Earnings momentum: higher Ebitda margin in 2Q11E and 3Q11E We expect operating margins to continue rising in the upcoming quarters on the back of:(i) higher volumes in Brazil and US; (ii) a better sales mix; (iii) an increase in sales of high value-added products; (iv) higher sales of specialty steel; and (v) less pressure from scrapcosts in the Brazilian business ops. We lowered our earnings estimates for 2011 and 2012 to reflect fiercer competition in the domestic market and the negative effects of a strong BRL that affect both revenues and costs. We lowered our forecast for Ebitda by 30% in 2011E to R$ 4.9bn and by 34% in 2012E to R$ 5.9bn. On the other hand, the next quarters’ results should be key drivers for Gerdau’s shares and we expect margins to show improvements in all of Gerdau’s business operations. We see the positive earnings momentum as an important trigger that could lead the shares up in the short term.
We like Gerdau’s exposure in the US We view positively Gerdau’s strategy of maintaining its high exposure to the US long steel market, not to mention the specialty steel unit that has been boosted by a strong pick up in US car makers’ sales last year. In the past, the long steel cash-cost used to be competitive in Brazil, but this is not the case anymore. Labor, electricity and other costs have been affected by cost inflation in Brazil. As a consequence, the cost to produce steel in US nowadays is lower than in Brazil, where the strong BRL is another key contributor to this difference. We expect Gerdau Ameristeel to increase its utilization rate in the coming quarters as soon as long steel consumption improves in the US, despite the fact that a material increase in demand will only likely be seen when the US government decides to reinvest in the country’s infrastructure. Furthermore, Gerdau could also increase the use of its US long steel platform to supply other markets, as it has been doing in Mexico, and boost its utilization rate.
Net income EPS EPS chg. P/E EBITDA chg. EV/EBITDA FCF Yield DY2009 1,122 0.66 -49% 36.3 -62% 13.2 16.8% 0.8%2010 2,194 1.29 96% 12.7 36% 7.8 9.2% 1.8%2011E 1,921 1.13 -12% 14.5 -4% 7.9 5.0% 2.1%2012E 2,391 1.40 24% 11.7 19% 6.5 8.1% 2.6%2013E 3,244 1.90 36% 8.6 19% 5.2 10.6% 3.5%
Source: Company for historical figures, Bloomberg for consensus and BES Securities for estimates. Note: Net income in R$ m; EPS in R$; P/E and EV/EBITDA in x.
Analyst Juliano Navarro [email protected] +55 11 30747320
BUY
Price Target (Dec. 11) GGBR4 R$ 24.4GGB* US$ 15.2GOAU4 R$ 30.3Price (6 Jun 11) GGBR4 R$ 16.3GGB US$ 10.4GOAU4 R$ 20.5Upside Potential GGBR4 +49% GGB +46% GOAU4 +48% * US$/R$ 1.60
TradingBovespa Ticker GGBR4Bloomberg Ticker GGBR4.BZShares Outstanding (m) 1,706Market Cap (R$ m) 27,866Avg. Daily Vol. (ths. shares) 6,111Avg. Daily Turnover (R$ ths.) 102,668Ibovespa Index W eight 2.9%52W High / Low 26,6 / 16Performance (%) Abs. vs Ibov3M -26.1 -20.36M -22.9 -15.0YTD -27.5 -20.3Financials YE11EEBITDA mg. 14.4%Interest Coverage 13.8Net debt / EBITDA (x) 2.3ROCE 9%ROE 10%Shareholders (%)
42.2%4.6%
Gerdau family 2.8%Treasury 0.9%Free Float 49.5%
Metalúrgica Gerdau S/AGerdau BG Part. S.A.
Source: Bloomberg, Gerdau for historical figures and BES Securities for estimates.
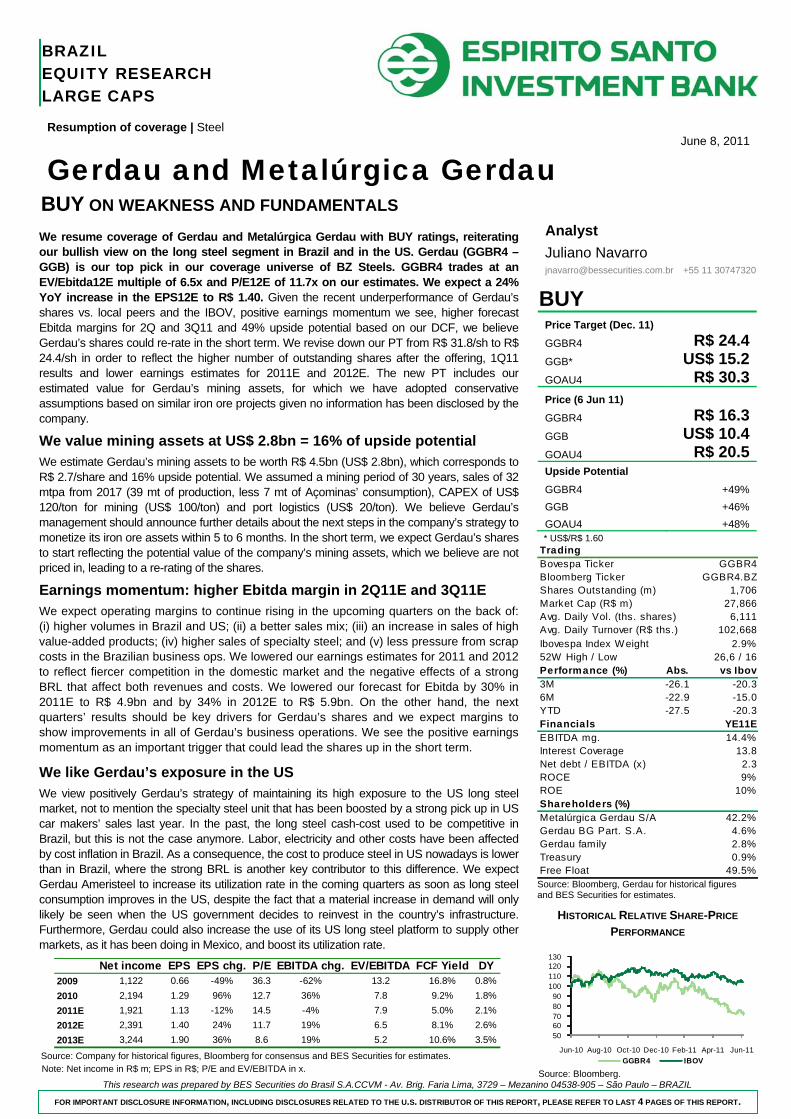
HISTORICAL RELATIVE SHARE-PRICE
PERFORMANCE
5060708090
100110120130
Jun-10 Aug-10 Oct-10 Dec-10 Feb-11 Apr-11 Jun-11GGBR4 IBOV
Source: Bloomberg.
Gerdau and Met. Gerdau June 8, 2011
BES Securities do Brasil S.A CCVM Equity Spain & Portugal – Brazil – Poland
Source: Company for historical figures, Bloomberg and BES Securities for estimates.
Summary financial informationValuation Metrics (Year end Dec) 2009 2010 2011E 2012E 2013E
GERDAURating BUY Recurrent P/E (x) 36.3 12.7 14.5 11.7 8.6Price Target (Dec. 11, R$/sh): 24.4 Reported P/E (x) 36.3 12.7 14.5 11.7 8.6Price Target (Dec. 11, US$/ADR): 15.2 EV / Sales (x) 1.9 1.3 1.1 1.0 0.9
EV / EBITDA (x) 13.2 7.8 7.9 6.5 5.2Share Price (6/Jun/11, R$/sh): 16.3 EV / EBIT (x) 23.2 11.2 13.3 10.2 7.6Share Price (6/Jun/11, US$/ADR): 10.4 FCF Yield (%) 16.8% 9.2% 5.0% 8.1% 10.6%
Dividend yield (%) 0.8% 1.8% 2.1% 2.6% 3.5%Upside / Downside potential (GGBR4) 49.4%Upside / Downside potential (GGB) 46.4%
Key Ratios 2009 2010 2011E 2012E 2013EPrevious Target price (R$/sh): 31.8% change to target price: -23% EBITDA margin 14.4% 16.6% 14.4% 16.0% 17.2%Previous Target price (US$/ADR): 18.2 EBIT margin 8.2% 11.5% 8.6% 10.2% 11.7%% change to target price: -16% Capex / Revenue 0.1 0.0 0.1 0.1 0.1
Capex / Depreciation (x) 0.9 0.7 1.3 1.1 1.1Bloomberg GGBR4.BZ Net Debt / EBITDA (x) 2.6 2.4 2.3 1.7 1.2IBOV GGBR4 EBITDA / Net Interest (x) 20.7 -8.2 -13.8 -9.0 -14.1
ROE 5.8% 11.6% 9.7% 11.4% 14.1%
Shares in Issue (Less Treasury)(m) 1,706Market Cap (R$ m) 27,866 P & L Summary (R$ m) 2009 2010 2011E 2012E 2013ENet Debt 1Q11 (R$ m) 12,494Adjustments for Associates & Minorities (R$ m) 1,622 Revenue 26,540 31,393 34,413 36,798 40,712Enterprise Value (R$ m) 41,982 % change -37% 18% 10% 7% 11%
EBITDA 3,815 5,201 4,967 5,906 7,020 % change -62% 36% -4% 19% 19%
Forthcoming Catalysts % margin 14% 17% 14% 16% 17%2Q11 Earnings release - 4/Aug/11 Depreciation and Amortisation 1,745 1,893 1,970 2,147 2,270
EBIT 2,179 3,605 2,964 3,759 4,750 % change -73% 65% -18% 27% 26%
BES Securities Research Analyst % margin 8% 11% 9% 10% 12%Juliano Navarro Associates (109) 39 (18) 84 82+55 11 30747320 Operation Profit 2,070 3,645 2,946 3,843 4,[email protected] Net Financials 185 (634) (361) (655) (499)
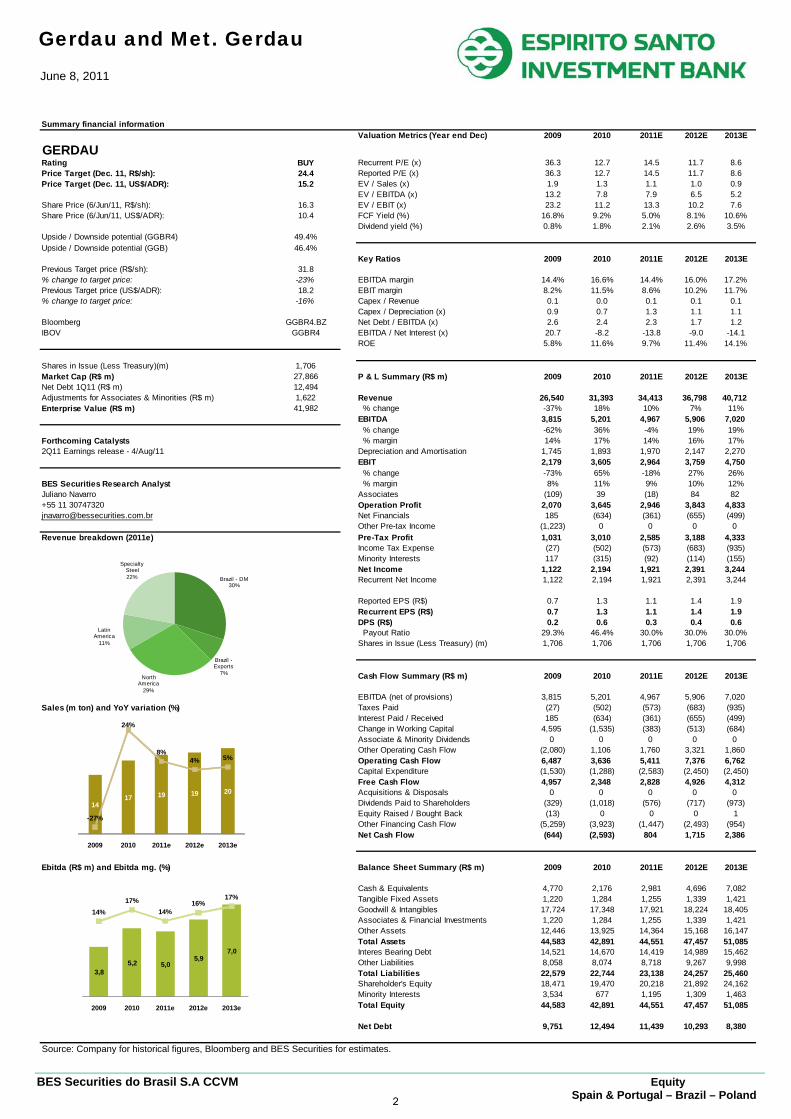
Other Pre-tax Income (1,223) 0 0 0 0Revenue breakdown (2011e) Pre-Tax Profit 1,031 3,010 2,585 3,188 4,333
Income Tax Expense (27) (502) (573) (683) (935)Minority Interests 117 (315) (92) (114) (155)Net Income 1,122 2,194 1,921 2,391 3,244Recurrent Net Income 1,122 2,194 1,921 2,391 3,244
Reported EPS (R$) 0.7 1.3 1.1 1.4 1.9Recurrent EPS (R$) 0.7 1.3 1.1 1.4 1.9DPS (R$) 0.2 0.6 0.3 0.4 0.6 Payout Ratio 29.3% 46.4% 30.0% 30.0% 30.0%Shares in Issue (Less Treasury) (m) 1,706 1,706 1,706 1,706 1,706
Cash Flow Summary (R$ m) 2009 2010 2011E 2012E 2013E
EBITDA (net of provisions) 3,815 5,201 4,967 5,906 7,020Sales (m ton) and YoY variation (%) Taxes Paid (27) (502) (573) (683) (935)
Interest Paid / Received 185 (634) (361) (655) (499)Change in Working Capital 4,595 (1,535) (383) (513) (684)Associate & Minority Dividends 0 0 0 0 0Other Operating Cash Flow (2,080) 1,106 1,760 3,321 1,860Operating Cash Flow 6,487 3,636 5,411 7,376 6,762Capital Expenditure (1,530) (1,288) (2,583) (2,450) (2,450)Free Cash Flow 4,957 2,348 2,828 4,926 4,312Acquisitions & Disposals 0 0 0 0 0Dividends Paid to Shareholders (329) (1,018) (576) (717) (973)Equity Raised / Bought Back (13) 0 0 0 1Other Financing Cash Flow (5,259) (3,923) (1,447) (2,493) (954)Net Cash Flow (644) (2,593) 804 1,715 2,386
Ebitda (R$ m) and Ebitda mg. (%) Balance Sheet Summary (R$ m) 2009 2010 2011E 2012E 2013E
Cash & Equivalents 4,770 2,176 2,981 4,696 7,082Tangible Fixed Assets 1,220 1,284 1,255 1,339 1,421Goodwill & Intangibles 17,724 17,348 17,921 18,224 18,405Associates & Financial Investments 1,220 1,284 1,255 1,339 1,421Other Assets 12,446 13,925 14,364 15,168 16,147Total Assets 44,583 42,891 44,551 47,457 51,085Interes Bearing Debt 14,521 14,670 14,419 14,989 15,462Other Liabilities 8,058 8,074 8,718 9,267 9,998Total Liabilities 22,579 22,744 23,138 24,257 25,460Shareholder's Equity 18,471 19,470 20,218 21,892 24,162Minority Interests 3,534 677 1,195 1,309 1,463Total Equity 44,583 42,891 44,551 47,457 51,085
Net Debt 9,751 12,494 11,439 10,293 8,380
1417 19 19 20
-27%
24%
8%4% 5%
2009 2010 2011e 2012e 2013e
14%17%
14%16%
17%
3,85,2 5,0
5,97,0
2009 2010 2011e 2012e 2013e
Brazil - DM30%
Brazil -Exports
7%North
America29%
Latin America
11%
Specialty Steel22%
2
Gerdau and Met. Gerdau June 8, 2011
BES Securities do Brasil S.A CCVM Equity Spain & Portugal – Brazil – Poland
Bullish on long steel in Brazil and US
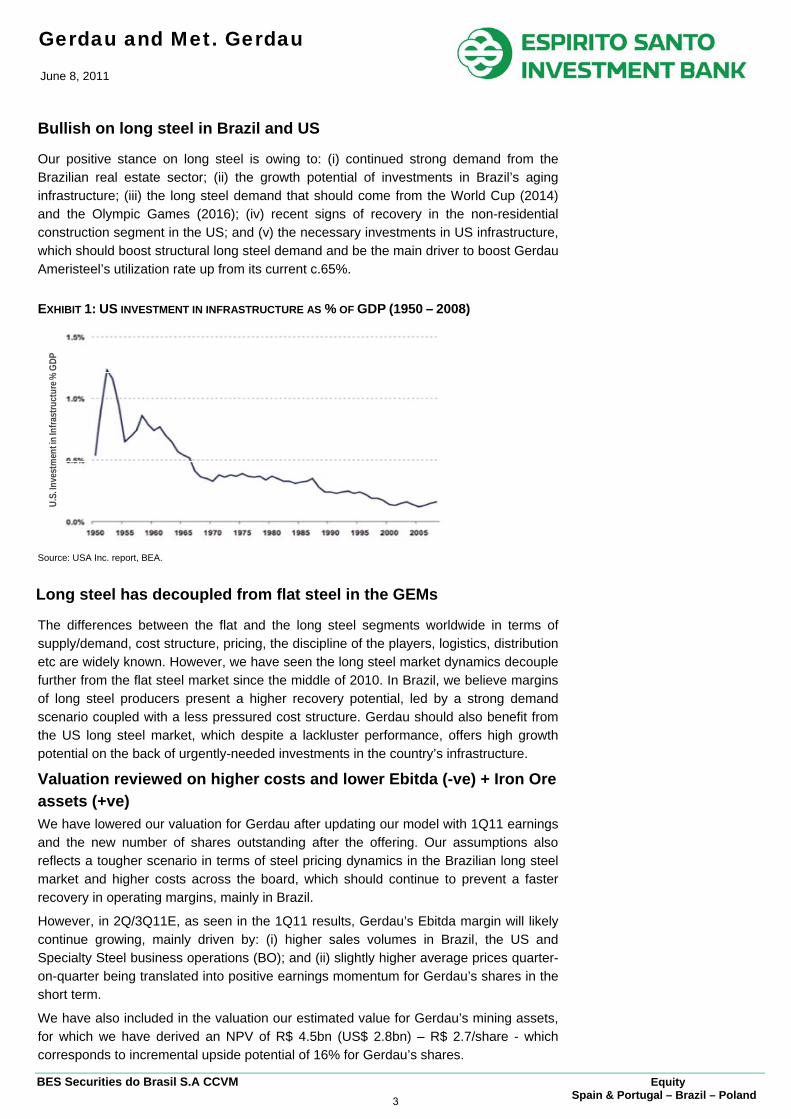
Our positive stance on long steel is owing to: (i) continued strong demand from the Brazilian real estate sector; (ii) the growth potential of investments in Brazil’s aging infrastructure; (iii) the long steel demand that should come from the World Cup (2014) and the Olympic Games (2016); (iv) recent signs of recovery in the non-residential construction segment in the US; and (v) the necessary investments in US infrastructure, which should boost structural long steel demand and be the main driver to boost Gerdau Ameristeel’s utilization rate up from its current c.65%.
EXHIBIT 1: US INVESTMENT IN INFRASTRUCTURE AS % OF GDP (1950 – 2008)
Source: USA Inc. report, BEA.
Long steel has decoupled from flat steel in the GEMs
The differences between the flat and the long steel segments worldwide in terms of supply/demand, cost structure, pricing, the discipline of the players, logistics, distribution etc are widely known. However, we have seen the long steel market dynamics decouple further from the flat steel market since the middle of 2010. In Brazil, we believe margins of long steel producers present a higher recovery potential, led by a strong demand scenario coupled with a less pressured cost structure. Gerdau should also benefit from the US long steel market, which despite a lackluster performance, offers high growth potential on the back of urgently-needed investments in the country’s infrastructure.
Valuation reviewed on higher costs and lower Ebitda (-ve) + Iron Ore assets (+ve)
We have lowered our valuation for Gerdau after updating our model with 1Q11 earnings and the new number of shares outstanding after the offering. Our assumptions also reflects a tougher scenario in terms of steel pricing dynamics in the Brazilian long steel market and higher costs across the board, which should continue to prevent a faster recovery in operating margins, mainly in Brazil.
However, in 2Q/3Q11E, as seen in the 1Q11 results, Gerdau’s Ebitda margin will likely continue growing, mainly driven by: (i) higher sales volumes in Brazil, the US and Specialty Steel business operations (BO); and (ii) slightly higher average prices quarter-on-quarter being translated into positive earnings momentum for Gerdau’s shares in the short term.
We have also included in the valuation our estimated value for Gerdau’s mining assets, for which we have derived an NPV of R$ 4.5bn (US$ 2.8bn) – R$ 2.7/share - which corresponds to incremental upside potential of 16% for Gerdau’s shares.
U.S.
Inve
stm
ent in
Infra
stru
ctur
e % G
DP
3
Gerdau and Met. Gerdau June 8, 2011
BES Securities do Brasil S.A CCVM Equity Spain & Portugal – Brazil – Poland
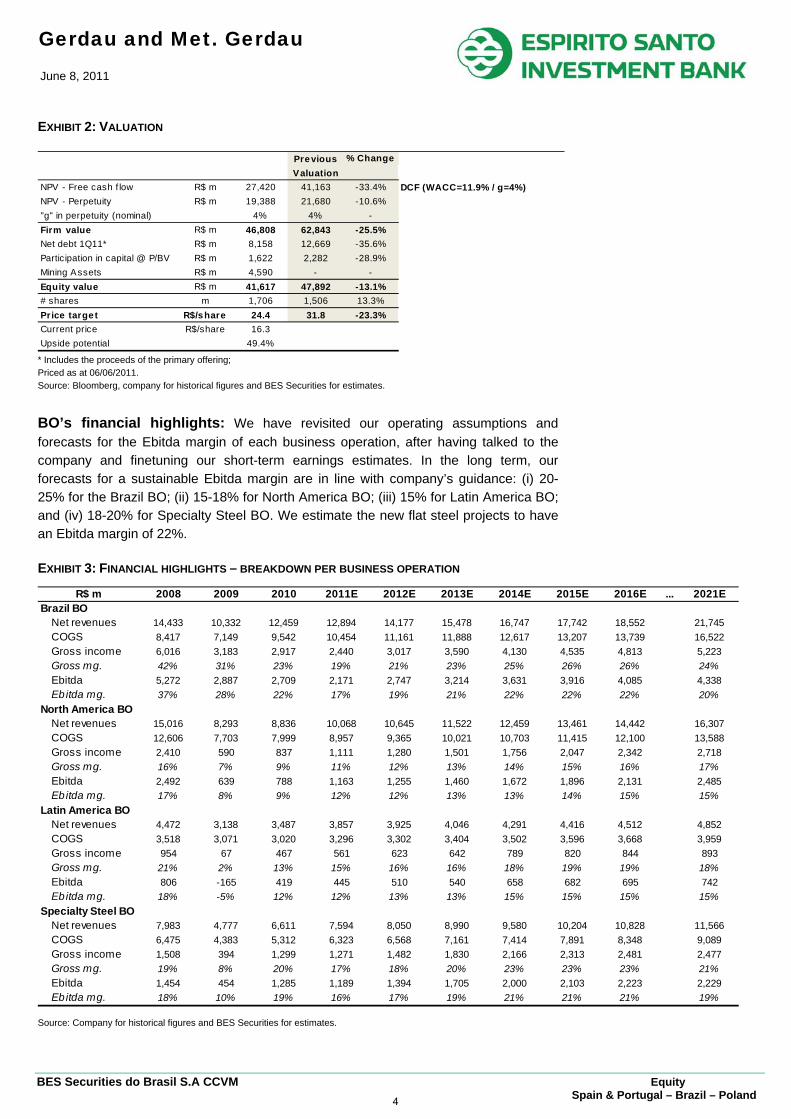
EXHIBIT 2: VALUATION
Previous % ChangeValuation
NPV - Free cash f low R$ m 27,420 41,163 -33.4% DCF (WACC=11.9% / g=4%)NPV - Perpetuity R$ m 19,388 21,680 -10.6%"g" in perpetuity (nominal) 4% 4% -Firm value R$ m 46,808 62,843 -25.5%Net debt 1Q11* R$ m 8,158 12,669 -35.6%Participation in capital @ P/BV R$ m 1,622 2,282 -28.9%Mining Assets R$ m 4,590 - -Equity value R$ m 41,617 47,892 -13.1%# shares m 1,706 1,506 13.3%Price target R$/share 24.4 31.8 -23.3%Current price R$/share 16.3Upside potential 49.4%
* Includes the proceeds of the primary offering; Priced as at 06/06/2011. Source: Bloomberg, company for historical figures and BES Securities for estimates.
BO’s financial highlights: We have revisited our operating assumptions and forecasts for the Ebitda margin of each business operation, after having talked to the company and finetuning our short-term earnings estimates. In the long term, our forecasts for a sustainable Ebitda margin are in line with company’s guidance: (i) 20-25% for the Brazil BO; (ii) 15-18% for North America BO; (iii) 15% for Latin America BO; and (iv) 18-20% for Specialty Steel BO. We estimate the new flat steel projects to have an Ebitda margin of 22%.
EXHIBIT 3: FINANCIAL HIGHLIGHTS – BREAKDOWN PER BUSINESS OPERATION
R$ m 2008 2009 2010 2011E 2012E 2013E 2014E 2015E 2016E ... 2021EBrazil BO
Net revenues 14,433 10,332 12,459 12,894 14,177 15,478 16,747 17,742 18,552 21,745COGS 8,417 7,149 9,542 10,454 11,161 11,888 12,617 13,207 13,739 16,522Gross income 6,016 3,183 2,917 2,440 3,017 3,590 4,130 4,535 4,813 5,223Gross mg. 42% 31% 23% 19% 21% 23% 25% 26% 26% 24%Ebitda 5,272 2,887 2,709 2,171 2,747 3,214 3,631 3,916 4,085 4,338Ebitda mg. 37% 28% 22% 17% 19% 21% 22% 22% 22% 20%
North America BONet revenues 15,016 8,293 8,836 10,068 10,645 11,522 12,459 13,461 14,442 16,307COGS 12,606 7,703 7,999 8,957 9,365 10,021 10,703 11,415 12,100 13,588Gross income 2,410 590 837 1,111 1,280 1,501 1,756 2,047 2,342 2,718Gross mg. 16% 7% 9% 11% 12% 13% 14% 15% 16% 17%Ebitda 2,492 639 788 1,163 1,255 1,460 1,672 1,896 2,131 2,485Ebitda mg. 17% 8% 9% 12% 12% 13% 13% 14% 15% 15%
Latin America BONet revenues 4,472 3,138 3,487 3,857 3,925 4,046 4,291 4,416 4,512 4,852COGS 3,518 3,071 3,020 3,296 3,302 3,404 3,502 3,596 3,668 3,959Gross income 954 67 467 561 623 642 789 820 844 893Gross mg. 21% 2% 13% 15% 16% 16% 18% 19% 19% 18%Ebitda 806 -165 419 445 510 540 658 682 695 742Ebitda mg. 18% -5% 12% 12% 13% 13% 15% 15% 15% 15%
Specialty Steel BONet revenues 7,983 4,777 6,611 7,594 8,050 8,990 9,580 10,204 10,828 11,566COGS 6,475 4,383 5,312 6,323 6,568 7,161 7,414 7,891 8,348 9,089Gross income 1,508 394 1,299 1,271 1,482 1,830 2,166 2,313 2,481 2,477Gross mg. 19% 8% 20% 17% 18% 20% 23% 23% 23% 21%Ebitda 1,454 454 1,285 1,189 1,394 1,705 2,000 2,103 2,223 2,229Ebitda mg. 18% 10% 19% 16% 17% 19% 21% 21% 21% 19%
Source: Company for historical figures and BES Securities for estimates.
4
Gerdau and Met. Gerdau June 8, 2011
BES Securities do Brasil S.A CCVM Equity Spain & Portugal – Brazil – Poland
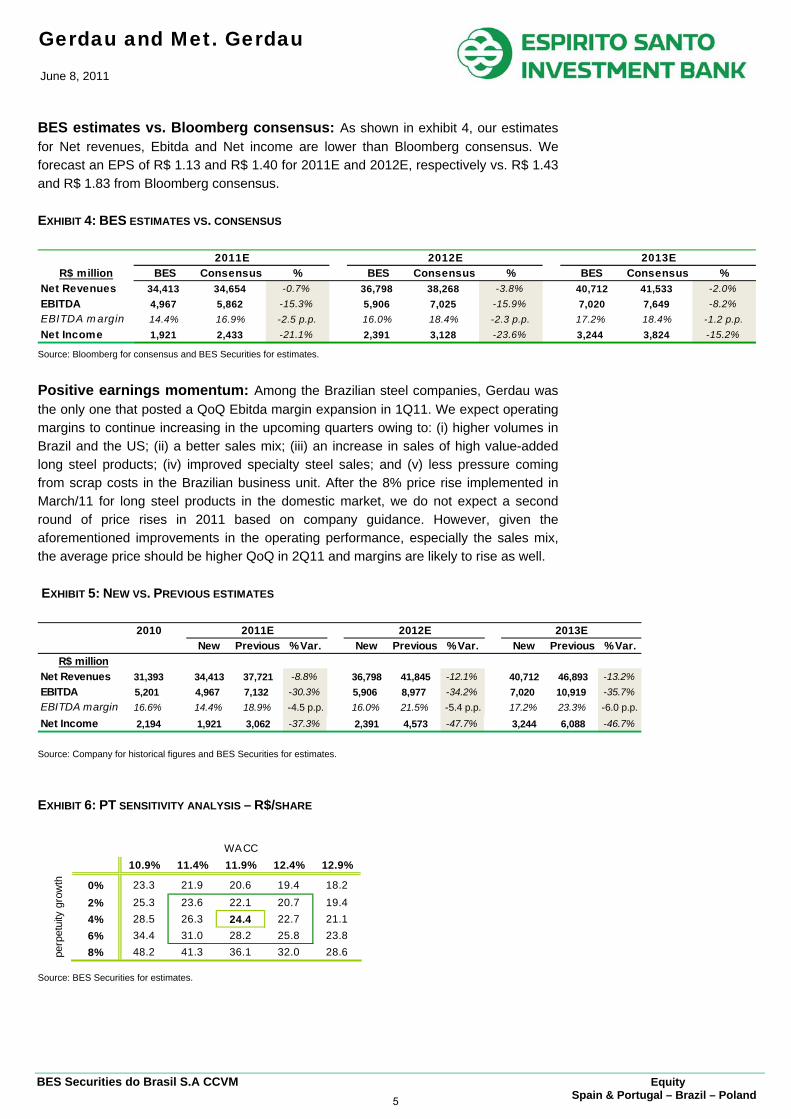
BES estimates vs. Bloomberg consensus: As shown in exhibit 4, our estimates for Net revenues, Ebitda and Net income are lower than Bloomberg consensus. We forecast an EPS of R$ 1.13 and R$ 1.40 for 2011E and 2012E, respectively vs. R$ 1.43 and R$ 1.83 from Bloomberg consensus.
EXHIBIT 4: BES ESTIMATES VS. CONSENSUS
R$ million BES Consensus % BES Consensus % BES Consensus %Net Revenues 34,413 34,654 -0.7% 36,798 38,268 -3.8% 40,712 41,533 -2.0%EBITDA 4,967 5,862 -15.3% 5,906 7,025 -15.9% 7,020 7,649 -8.2%EBITDA m argin 14.4% 16.9% -2.5 p.p. 16.0% 18.4% -2.3 p.p. 17.2% 18.4% -1.2 p.p.Net Income 1,921 2,433 -21.1% 2,391 3,128 -23.6% 3,244 3,824 -15.2%
2013E2011E 2012E
Source: Bloomberg for consensus and BES Securities for estimates.
Positive earnings momentum: Among the Brazilian steel companies, Gerdau was the only one that posted a QoQ Ebitda margin expansion in 1Q11. We expect operating margins to continue increasing in the upcoming quarters owing to: (i) higher volumes in Brazil and the US; (ii) a better sales mix; (iii) an increase in sales of high value-added long steel products; (iv) improved specialty steel sales; and (v) less pressure coming from scrap costs in the Brazilian business unit. After the 8% price rise implemented in March/11 for long steel products in the domestic market, we do not expect a second round of price rises in 2011 based on company guidance. However, given the aforementioned improvements in the operating performance, especially the sales mix, the average price should be higher QoQ in 2Q11 and margins are likely to rise as well.
EXHIBIT 5: NEW VS. PREVIOUS ESTIMATES
2010New Previous % Var. New Previous % Var. New Previous % Var.
R$ millionNet Revenues 31,393 34,413 37,721 -8.8% 36,798 41,845 -12.1% 40,712 46,893 -13.2%EBITDA 5,201 4,967 7,132 -30.3% 5,906 8,977 -34.2% 7,020 10,919 -35.7%EBITDA margin 16.6% 14.4% 18.9% -4.5 p.p. 16.0% 21.5% -5.4 p.p. 17.2% 23.3% -6.0 p.p.Net Income 2,194 1,921 3,062 -37.3% 2,391 4,573 -47.7% 3,244 6,088 -46.7%
2011E 2012E 2013E
Source: Company for historical figures and BES Securities for estimates.
EXHIBIT 6: PT SENSITIVITY ANALYSIS – R$/SHARE
24.4 10.9% 11.4% 11.9% 12.4% 12.9%
0% 23.3 21.9 20.6 19.4 18.2
2% 25.3 23.6 22.1 20.7 19.44% 28.5 26.3 24.4 22.7 21.16% 34.4 31.0 28.2 25.8 23.88% 48.2 41.3 36.1 32.0 28.6
WACC
perp
etui
ty g
row
th
Source: BES Securities for estimates.
5
Gerdau and Met. Gerdau June 8, 2011
BES Securities do Brasil S.A CCVM Equity Spain & Portugal – Brazil – Poland
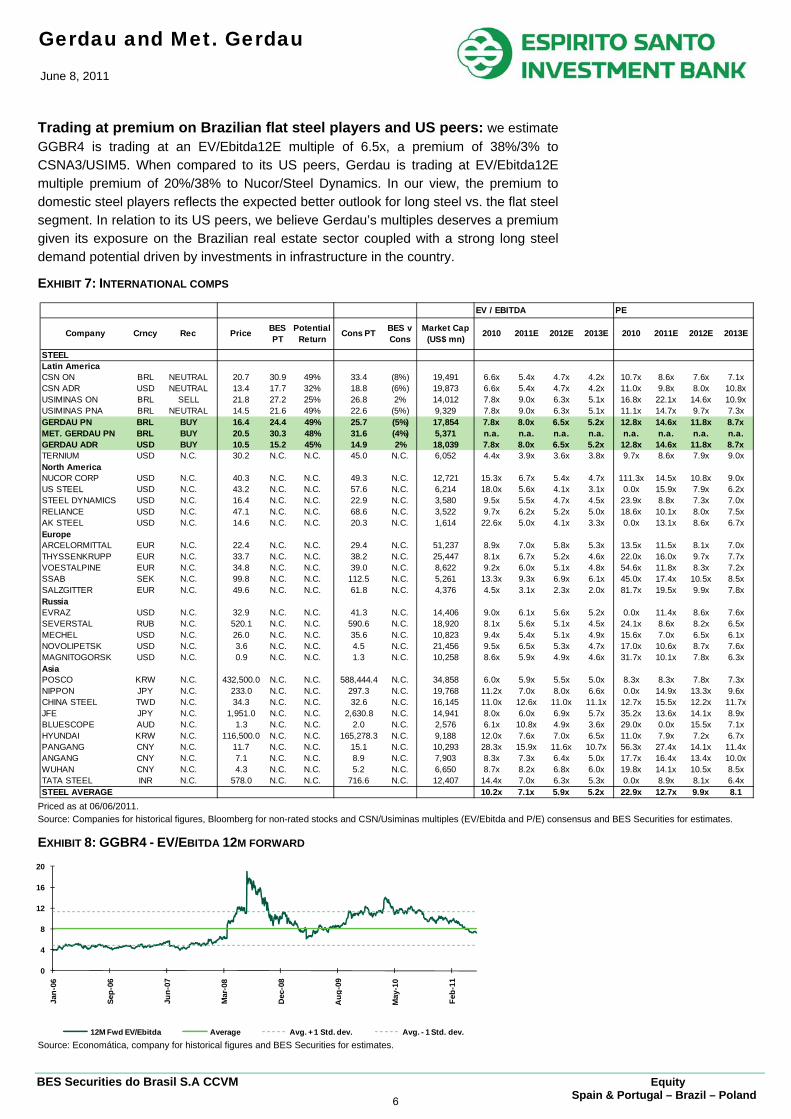
Trading at premium on Brazilian flat steel players and US peers: we estimate GGBR4 is trading at an EV/Ebitda12E multiple of 6.5x, a premium of 38%/3% to CSNA3/USIM5. When compared to its US peers, Gerdau is trading at EV/Ebitda12E multiple premium of 20%/38% to Nucor/Steel Dynamics. In our view, the premium to domestic steel players reflects the expected better outlook for long steel vs. the flat steel segment. In relation to its US peers, we believe Gerdau’s multiples deserves a premium given its exposure on the Brazilian real estate sector coupled with a strong long steel demand potential driven by investments in infrastructure in the country.
EXHIBIT 7: INTERNATIONAL COMPS
Priced as at 06/06/2011. Source: Companies for historical figures, Bloomberg for non-rated stocks and CSN/Usiminas multiples (EV/Ebitda and P/E) consensus and BES Securities for estimates.
EXHIBIT 8: GGBR4 - EV/EBITDA 12M FORWARD
Source: Economática, company for historical figures and BES Securities for estimates.
EV / EBITDA PE
Company Crncy Rec Price BES PT
Potential Return
Cons PT BES v Cons
Market Cap (US$ mn)
2010 2011E 2012E 2013E 2010 2011E 2012E 2013E
STEELLatin AmericaCSN ON BRL NEUTRAL 20.7 30.9 49% 33.4 (8%) 19,491 6.6x 5.4x 4.7x 4.2x 10.7x 8.6x 7.6x 7.1xCSN ADR USD NEUTRAL 13.4 17.7 32% 18.8 (6%) 19,873 6.6x 5.4x 4.7x 4.2x 11.0x 9.8x 8.0x 10.8xUSIMINAS ON BRL SELL 21.8 27.2 25% 26.8 2% 14,012 7.8x 9.0x 6.3x 5.1x 16.8x 22.1x 14.6x 10.9xUSIMINAS PNA BRL NEUTRAL 14.5 21.6 49% 22.6 (5%) 9,329 7.8x 9.0x 6.3x 5.1x 11.1x 14.7x 9.7x 7.3xGERDAU PN BRL BUY 16.4 24.4 49% 25.7 (5%) 17,854 7.8x 8.0x 6.5x 5.2x 12.8x 14.6x 11.8x 8.7xMET. GERDAU PN BRL BUY 20.5 30.3 48% 31.6 (4%) 5,371 n.a. n.a. n.a. n.a. n.a. n.a. n.a. n.a.GERDAU ADR USD BUY 10.5 15.2 45% 14.9 2% 18,039 7.8x 8.0x 6.5x 5.2x 12.8x 14.6x 11.8x 8.7xTERNIUM USD N.C. 30.2 N.C. N.C. 45.0 N.C. 6,052 4.4x 3.9x 3.6x 3.8x 9.7x 8.6x 7.9x 9.0xNorth AmericaNUCOR CORP USD N.C. 40.3 N.C. N.C. 49.3 N.C. 12,721 15.3x 6.7x 5.4x 4.7x 111.3x 14.5x 10.8x 9.0xUS STEEL USD N.C. 43.2 N.C. N.C. 57.6 N.C. 6,214 18.0x 5.6x 4.1x 3.1x 0.0x 15.9x 7.9x 6.2xSTEEL DYNAMICS USD N.C. 16.4 N.C. N.C. 22.9 N.C. 3,580 9.5x 5.5x 4.7x 4.5x 23.9x 8.8x 7.3x 7.0xRELIANCE USD N.C. 47.1 N.C. N.C. 68.6 N.C. 3,522 9.7x 6.2x 5.2x 5.0x 18.6x 10.1x 8.0x 7.5xAK STEEL USD N.C. 14.6 N.C. N.C. 20.3 N.C. 1,614 22.6x 5.0x 4.1x 3.3x 0.0x 13.1x 8.6x 6.7xEuropeARCELORMITTAL EUR N.C. 22.4 N.C. N.C. 29.4 N.C. 51,237 8.9x 7.0x 5.8x 5.3x 13.5x 11.5x 8.1x 7.0xTHYSSENKRUPP EUR N.C. 33.7 N.C. N.C. 38.2 N.C. 25,447 8.1x 6.7x 5.2x 4.6x 22.0x 16.0x 9.7x 7.7xVOESTALPINE EUR N.C. 34.8 N.C. N.C. 39.0 N.C. 8,622 9.2x 6.0x 5.1x 4.8x 54.6x 11.8x 8.3x 7.2xSSAB SEK N.C. 99.8 N.C. N.C. 112.5 N.C. 5,261 13.3x 9.3x 6.9x 6.1x 45.0x 17.4x 10.5x 8.5xSALZGITTER EUR N.C. 49.6 N.C. N.C. 61.8 N.C. 4,376 4.5x 3.1x 2.3x 2.0x 81.7x 19.5x 9.9x 7.8xRussiaEVRAZ USD N.C. 32.9 N.C. N.C. 41.3 N.C. 14,406 9.0x 6.1x 5.6x 5.2x 0.0x 11.4x 8.6x 7.6xSEVERSTAL RUB N.C. 520.1 N.C. N.C. 590.6 N.C. 18,920 8.1x 5.6x 5.1x 4.5x 24.1x 8.6x 8.2x 6.5xMECHEL USD N.C. 26.0 N.C. N.C. 35.6 N.C. 10,823 9.4x 5.4x 5.1x 4.9x 15.6x 7.0x 6.5x 6.1xNOVOLIPETSK USD N.C. 3.6 N.C. N.C. 4.5 N.C. 21,456 9.5x 6.5x 5.3x 4.7x 17.0x 10.6x 8.7x 7.6xMAGNITOGORSK USD N.C. 0.9 N.C. N.C. 1.3 N.C. 10,258 8.6x 5.9x 4.9x 4.6x 31.7x 10.1x 7.8x 6.3xAsiaPOSCO KRW N.C. 432,500.0 N.C. N.C. 588,444.4 N.C. 34,858 6.0x 5.9x 5.5x 5.0x 8.3x 8.3x 7.8x 7.3xNIPPON JPY N.C. 233.0 N.C. N.C. 297.3 N.C. 19,768 11.2x 7.0x 8.0x 6.6x 0.0x 14.9x 13.3x 9.6xCHINA STEEL TWD N.C. 34.3 N.C. N.C. 32.6 N.C. 16,145 11.0x 12.6x 11.0x 11.1x 12.7x 15.5x 12.2x 11.7xJFE JPY N.C. 1,951.0 N.C. N.C. 2,630.8 N.C. 14,941 8.0x 6.0x 6.9x 5.7x 35.2x 13.6x 14.1x 8.9xBLUESCOPE AUD N.C. 1.3 N.C. N.C. 2.0 N.C. 2,576 6.1x 10.8x 4.9x 3.6x 29.0x 0.0x 15.5x 7.1xHYUNDAI KRW N.C. 116,500.0 N.C. N.C. 165,278.3 N.C. 9,188 12.0x 7.6x 7.0x 6.5x 11.0x 7.9x 7.2x 6.7xPANGANG CNY N.C. 11.7 N.C. N.C. 15.1 N.C. 10,293 28.3x 15.9x 11.6x 10.7x 56.3x 27.4x 14.1x 11.4xANGANG CNY N.C. 7.1 N.C. N.C. 8.9 N.C. 7,903 8.3x 7.3x 6.4x 5.0x 17.7x 16.4x 13.4x 10.0xWUHAN CNY N.C. 4.3 N.C. N.C. 5.2 N.C. 6,650 8.7x 8.2x 6.8x 6.0x 19.8x 14.1x 10.5x 8.5xTATA STEEL INR N.C. 578.0 N.C. N.C. 716.6 N.C. 12,407 14.4x 7.0x 6.3x 5.3x 0.0x 8.9x 8.1x 6.4xSTEEL AVERAGE 10.2x 7.1x 5.9x 5.2x 22.9x 12.7x 9.9x 8.1
0
4
8
12
16
20
Jan-
06
Sep-
06
Jun-
07
Mar
-08
Dec
-08
Aug
-09
May
-10
Feb-
11
12M Fwd EV/Ebitda Average Avg. + 1 Std. dev. Avg. - 1 Std. dev.
6
Gerdau and Met. Gerdau June 8, 2011
BES Securities do Brasil S.A CCVM Equity Spain & Portugal – Brazil – Poland
Iron ore: beyond self sufficiency
We value Gerdau’s mining assets at US$ 2.8bn = 16% incremental upside potential
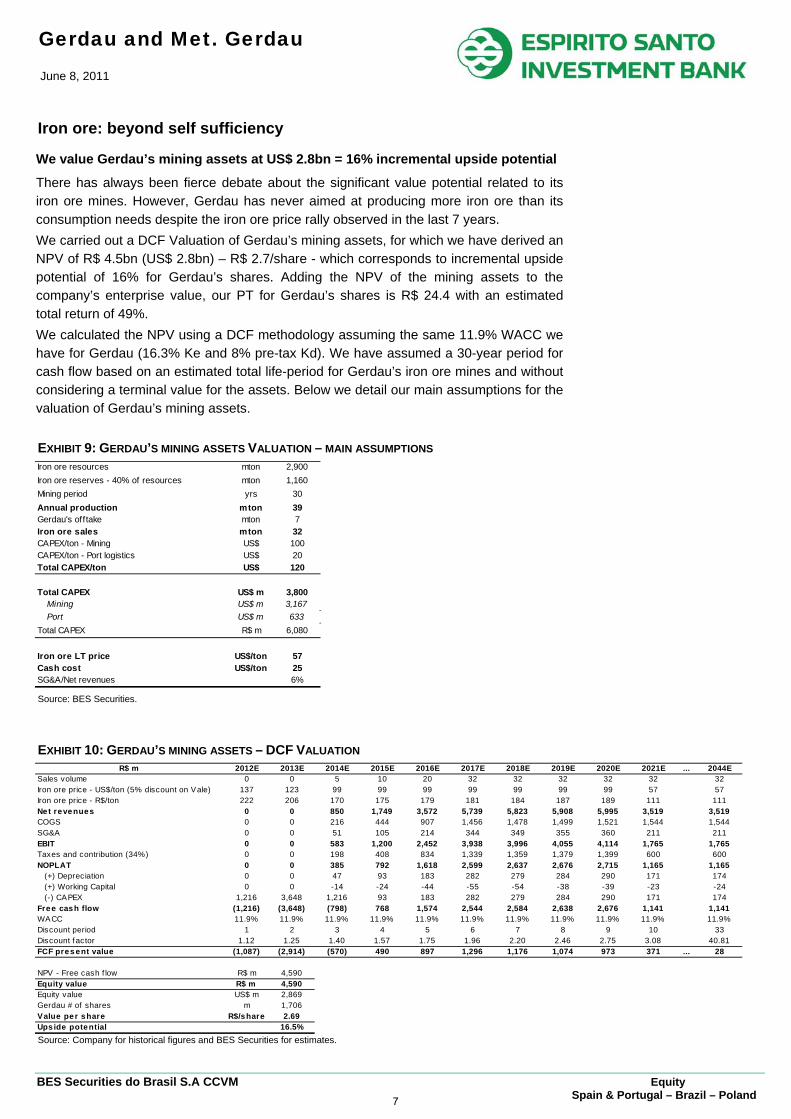
There has always been fierce debate about the significant value potential related to its iron ore mines. However, Gerdau has never aimed at producing more iron ore than its consumption needs despite the iron ore price rally observed in the last 7 years. We carried out a DCF Valuation of Gerdau’s mining assets, for which we have derived an NPV of R$ 4.5bn (US$ 2.8bn) – R$ 2.7/share - which corresponds to incremental upside potential of 16% for Gerdau’s shares. Adding the NPV of the mining assets to the company’s enterprise value, our PT for Gerdau’s shares is R$ 24.4 with an estimated total return of 49%. We calculated the NPV using a DCF methodology assuming the same 11.9% WACC we have for Gerdau (16.3% Ke and 8% pre-tax Kd). We have assumed a 30-year period for cash flow based on an estimated total life-period for Gerdau’s iron ore mines and without considering a terminal value for the assets. Below we detail our main assumptions for the valuation of Gerdau’s mining assets.
EXHIBIT 9: GERDAU’S MINING ASSETS VALUATION – MAIN ASSUMPTIONS
Iron ore resources mton 2,900Iron ore reserves - 40% of resources mton 1,160Mining period yrs 30Annual production mton 39Gerdau's offtake mton 7Iron ore sales mton 32CAPEX/ton - Mining US$ 100CAPEX/ton - Port logistics US$ 20Total CAPEX/ton US$ 120
Total CAPEX US$ m 3,800Mining US$ m 3,167Port US$ m 633
Total CAPEX R$ m 6,080
Iron ore LT price US$/ton 57Cash cost US$/ton 25SG&A/Net revenues 6%
Source: BES Securities.
EXHIBIT 10: GERDAU’S MINING ASSETS – DCF VALUATION
R$ m 2012E 2013E 2014E 2015E 2016E 2017E 2018E 2019E 2020E 2021E ... 2044ESales volume 0 0 5 10 20 32 32 32 32 32 32Iron ore price - US$/ton (5% discount on Vale) 137 123 99 99 99 99 99 99 99 57 57Iron ore price - R$/ton 222 206 170 175 179 181 184 187 189 111 111Net revenues 0 0 850 1,749 3,572 5,739 5,823 5,908 5,995 3,519 3,519COGS 0 0 216 444 907 1,456 1,478 1,499 1,521 1,544 1,544SG&A 0 0 51 105 214 344 349 355 360 211 211EBIT 0 0 583 1,200 2,452 3,938 3,996 4,055 4,114 1,765 1,765Taxes and contribution (34%) 0 0 198 408 834 1,339 1,359 1,379 1,399 600 600NOPLAT 0 0 385 792 1,618 2,599 2,637 2,676 2,715 1,165 1,165 (+) Depreciation 0 0 47 93 183 282 279 284 290 171 174 (+) Working Capital 0 0 -14 -24 -44 -55 -54 -38 -39 -23 -24 (-) CAPEX 1,216 3,648 1,216 93 183 282 279 284 290 171 174Free cash flow (1,216) (3,648) (798) 768 1,574 2,544 2,584 2,638 2,676 1,141 1,141WACC 11.9% 11.9% 11.9% 11.9% 11.9% 11.9% 11.9% 11.9% 11.9% 11.9% 11.9%Discount period 1 2 3 4 5 6 7 8 9 10 33Discount factor 1.12 1.25 1.40 1.57 1.75 1.96 2.20 2.46 2.75 3.08 40.81FCF pres ent value (1,087) (2,914) (570) 490 897 1,296 1,176 1,074 973 371 ... 28
NPV - Free cash f low R$ m 4,590Equity value R$ m 4,590Equity value US$ m 2,869Gerdau # of shares m 1,706Value pe r share R$/share 2.69Ups ide potential 16.5%
Source: Company for historical figures and BES Securities for estimates.
7
Gerdau and Met. Gerdau June 8, 2011
BES Securities do Brasil S.A CCVM Equity Spain & Portugal – Brazil – Poland
Overview: Gerdau acquired four iron ore mines from Votorantim in the Brazilian Iron Belt in Minas Gerais in 2002: Miguel Burnier, Várzea do Lopes, Dom Bosco and Gongo Soco. According to the latest appraisal carried out by the company, the total iron ore resources amount to 2.9 billion tons. Dom Bosco and Gongo Soco are still unexplored mines. Miguel Burnier’s ore reserves have an average iron content of 55% due to the presence of hematite, and account for most of the appraised resources. Várzea do Lopes’ reserves are lower, with an iron content of 40-45%. Gerdau disclosed its intention to monetize its iron ore assets a couple of months ago. So far, the strategy has been to produce iron ore to be used for semi-finished steel production in Açominas (4.5 mtpa), the blast furnace operation located in the state of Minas Gerais and no plan to expand the mines has come up. However, last year Açominas’ crude steel capacity increased and Gerdau decided to invest in heavy plate and hot-rolled coil production, mainly in order to focus on the oil and gas industry that will likely demand very significant investments in the pre-salt exploration. As a result, Gerdau has decided to expand its mining output for the first time in several years. The expansion project envisages increasing the current capacity of 2.7 mtpa to 7 mtpa by the end of 2012, by which time ore consumption from Açominas should be fully met by the company’s own production.
Iron ore sales forecast of 32 mtpa from 2017 onwards
Gerdau has been investing in iron ore capacity expansion at a CAPEX of US$ 70/ton, aiming to reach 7m ton of annual production by the end of 2012, when it should reach 100% of Açominas’ ore consumption.
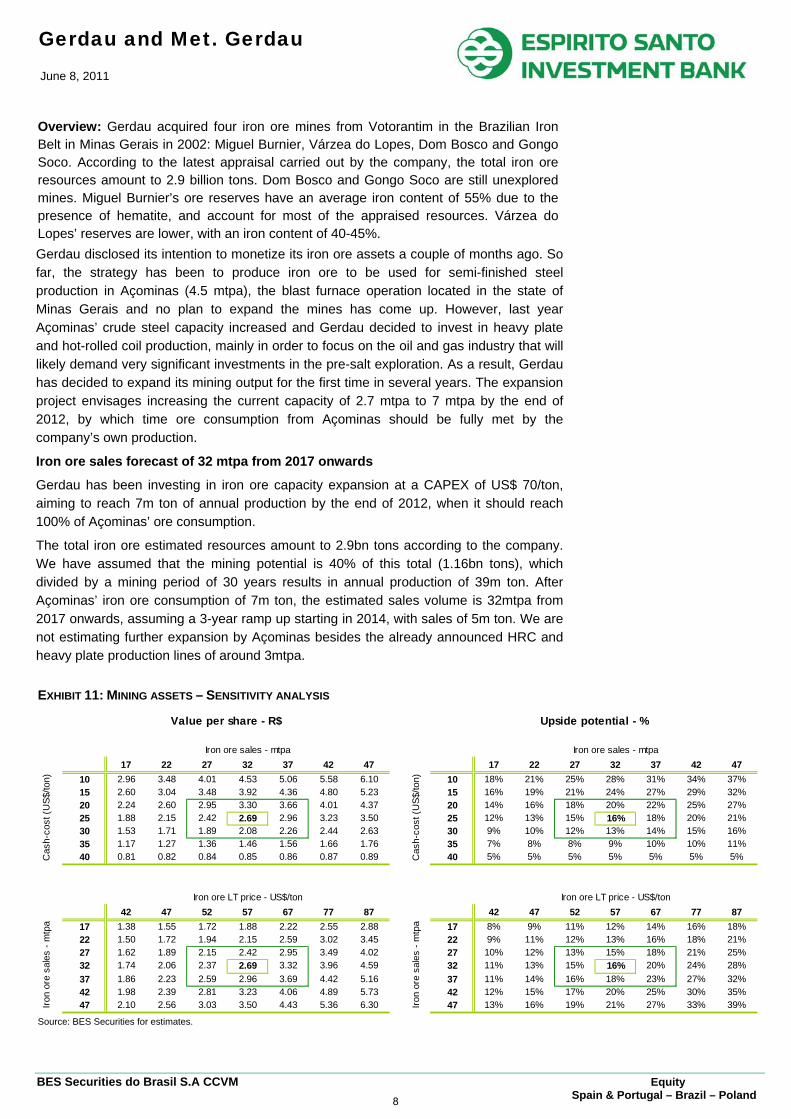
The total iron ore estimated resources amount to 2.9bn tons according to the company. We have assumed that the mining potential is 40% of this total (1.16bn tons), which divided by a mining period of 30 years results in annual production of 39m ton. After Açominas’ iron ore consumption of 7m ton, the estimated sales volume is 32mtpa from 2017 onwards, assuming a 3-year ramp up starting in 2014, with sales of 5m ton. We are not estimating further expansion by Açominas besides the already announced HRC and heavy plate production lines of around 3mtpa.
EXHIBIT 11: MINING ASSETS – SENSITIVITY ANALYSIS
2.7 17 22 27 32 37 42 47 0.2 17 22 27 32 37 42 4710 2.96 3.48 4.01 4.53 5.06 5.58 6.10 10 18% 21% 25% 28% 31% 34% 37%15 2.60 3.04 3.48 3.92 4.36 4.80 5.23 15 16% 19% 21% 24% 27% 29% 32%20 2.24 2.60 2.95 3.30 3.66 4.01 4.37 20 14% 16% 18% 20% 22% 25% 27%25 1.88 2.15 2.42 2.69 2.96 3.23 3.50 25 12% 13% 15% 16% 18% 20% 21%30 1.53 1.71 1.89 2.08 2.26 2.44 2.63 30 9% 10% 12% 13% 14% 15% 16%35 1.17 1.27 1.36 1.46 1.56 1.66 1.76 35 7% 8% 8% 9% 10% 10% 11%40 0.81 0.82 0.84 0.85 0.86 0.87 0.89 40 5% 5% 5% 5% 5% 5% 5%
2.7 42 47 52 57 67 77 87 0.2 42 47 52 57 67 77 8717 1.38 1.55 1.72 1.88 2.22 2.55 2.88 17 8% 9% 11% 12% 14% 16% 18%22 1.50 1.72 1.94 2.15 2.59 3.02 3.45 22 9% 11% 12% 13% 16% 18% 21%27 1.62 1.89 2.15 2.42 2.95 3.49 4.02 27 10% 12% 13% 15% 18% 21% 25%32 1.74 2.06 2.37 2.69 3.32 3.96 4.59 32 11% 13% 15% 16% 20% 24% 28%37 1.86 2.23 2.59 2.96 3.69 4.42 5.16 37 11% 14% 16% 18% 23% 27% 32%42 1.98 2.39 2.81 3.23 4.06 4.89 5.73 42 12% 15% 17% 20% 25% 30% 35%47 2.10 2.56 3.03 3.50 4.43 5.36 6.30 47 13% 16% 19% 21% 27% 33% 39%
Value per share - R$ Upside potential - %
Iron ore LT price - US$/ton
Iron
ore
sale
s - m
tpa
Cas
h-co
st (U
S$/to
n)
Iron ore sales - mtpa Iron ore sales - mtpa
Cas
h-co
st (U
S$/to
n)
Iron ore LT price - US$/ton
Iron
ore
sale
s - m
tpa
Source: BES Securities for estimates.
8
Gerdau and Met. Gerdau June 8, 2011
BES Securities do Brasil S.A CCVM Equity Spain & Portugal – Brazil – Poland
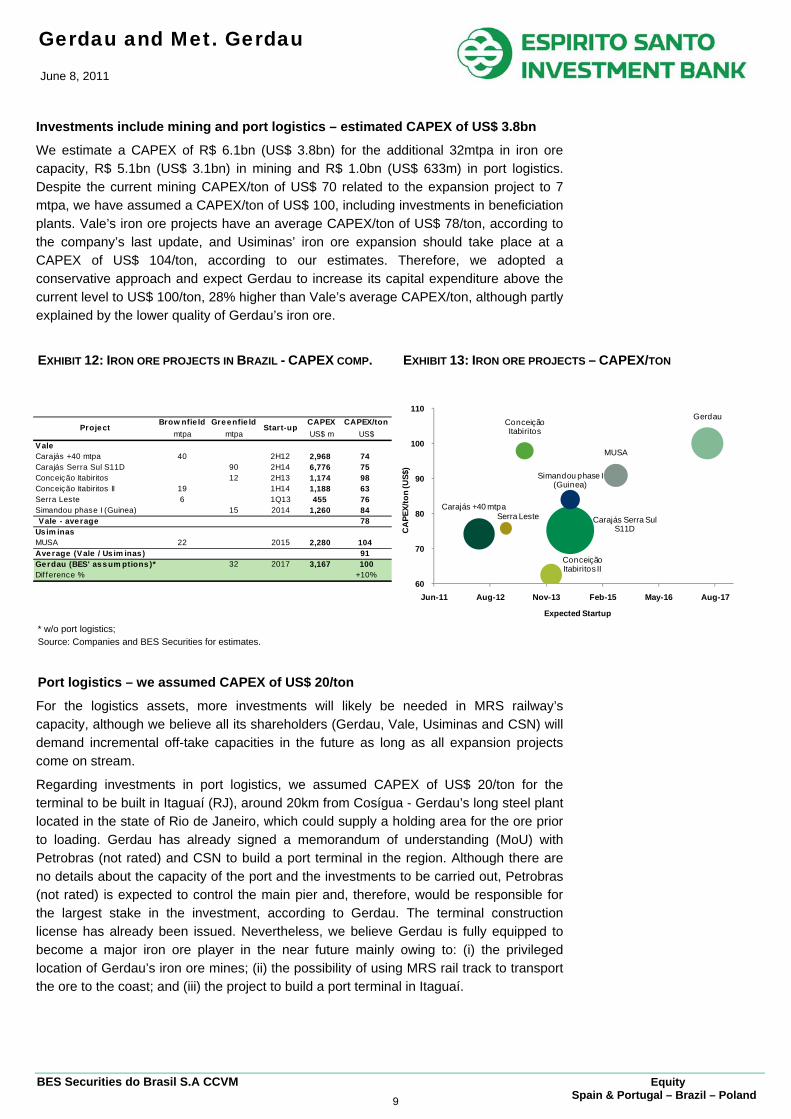
Investments include mining and port logistics – estimated CAPEX of US$ 3.8bn
We estimate a CAPEX of R$ 6.1bn (US$ 3.8bn) for the additional 32mtpa in iron ore capacity, R$ 5.1bn (US$ 3.1bn) in mining and R$ 1.0bn (US$ 633m) in port logistics. Despite the current mining CAPEX/ton of US$ 70 related to the expansion project to 7 mtpa, we have assumed a CAPEX/ton of US$ 100, including investments in beneficiation plants. Vale’s iron ore projects have an average CAPEX/ton of US$ 78/ton, according to the company’s last update, and Usiminas’ iron ore expansion should take place at a CAPEX of US$ 104/ton, according to our estimates. Therefore, we adopted a conservative approach and expect Gerdau to increase its capital expenditure above the current level to US$ 100/ton, 28% higher than Vale’s average CAPEX/ton, although partly explained by the lower quality of Gerdau’s iron ore.
EXHIBIT 12: IRON ORE PROJECTS IN BRAZIL - CAPEX COMP. EXHIBIT 13: IRON ORE PROJECTS – CAPEX/TON
Brow nfie ld Gre enfie ld CAPEX CAPEX/tonmtpa mtpa US$ m US$
ValeCarajás +40 mtpa 40 2H12 2,968 74Carajás Serra Sul S11D 90 2H14 6,776 75Conceição Itabiritos 12 2H13 1,174 98Conceição Itabiritos II 19 1H14 1,188 63Serra Leste 6 1Q13 455 76Simandou phase I (Guinea) 15 2014 1,260 84Vale - average 78
Usim inasMUSA 22 2015 2,280 104Ave rage (Vale / Us im inas) 91Gerdau (BES' ass um ptions )* 32 2017 3,167 100Dif ference % +10%
Project Start-up
* w/o port logistics; Source: Companies and BES Securities for estimates.
Port logistics – we assumed CAPEX of US$ 20/ton
For the logistics assets, more investments will likely be needed in MRS railway’s capacity, although we believe all its shareholders (Gerdau, Vale, Usiminas and CSN) will demand incremental off-take capacities in the future as long as all expansion projects come on stream.
Regarding investments in port logistics, we assumed CAPEX of US$ 20/ton for the terminal to be built in Itaguaí (RJ), around 20km from Cosígua - Gerdau’s long steel plant located in the state of Rio de Janeiro, which could supply a holding area for the ore prior to loading. Gerdau has already signed a memorandum of understanding (MoU) with Petrobras (not rated) and CSN to build a port terminal in the region. Although there are no details about the capacity of the port and the investments to be carried out, Petrobras (not rated) is expected to control the main pier and, therefore, would be responsible for the largest stake in the investment, according to Gerdau. The terminal construction license has already been issued. Nevertheless, we believe Gerdau is fully equipped to become a major iron ore player in the near future mainly owing to: (i) the privileged location of Gerdau’s iron ore mines; (ii) the possibility of using MRS rail track to transport the ore to the coast; and (iii) the project to build a port terminal in Itaguaí.
Carajás +40 mtpaCarajás Serra Sul
S11D
Conceição Itabiritos
Conceição Itabiritos II
Serra Leste
Simandou phase I (Guinea)
MUSA
Gerdau
60
70
80
90
100
110
Jun-11 Aug-12 Nov-13 Feb-15 May-16 Aug-17
CA
PEX/
ton
(US$
)
Expected Startup
9
Gerdau and Met. Gerdau June 8, 2011
BES Securities do Brasil S.A CCVM Equity Spain & Portugal – Brazil – Poland
METALÚRGICA GERDAU
We have also resumed our coverage of Metalúrgica Gerdau with a BUY rating and a Dec-11E price target of R$ 30.3/share (down from R$ 39.4), giving upside potential of 48%.
Metalúrgica Gerdau controls Gerdau S.A., retaining 75% of its voting and 21% of its non-voting shares, corresponding to 39% of its total capital. We have evaluated Met. Gerdau based on its stake in Gerdau S.A. and our revised price target for GGBR4. For the stake in the subsidiaries, we used the last update of the market value disclosed by Met. Gerdau. Finally, we maintained a 20% discount on the price target in order to reflect Met. Gerdau’s shares lower liquidity compared with GGBR4, plus the absence of an ADR for Met. Gerdau. Measured by the average daily traded volume in the last 21 days, GOAU4’s liquidity is six times lower than that of GGBR4.
Calculation of the target price of Met. Gerdau’s shares Targe t price - GOAU4Target price - GGBR4 R$/share 24.4# shares ON m 433# shares PN m 244Value of s take in Ge rdau S.A. R$ m 16,512
Net debt 1Q11 R$ m 1,303Stake in subsidiaries R$ m 201Equity value - GOAU R$ m 15,410# shares mm 406Shares liquidity discount 20%Price targe t - GOAU4 R$/share 30.3
Source: Bloomberg, company for historical figures and BES Securities for estimates.
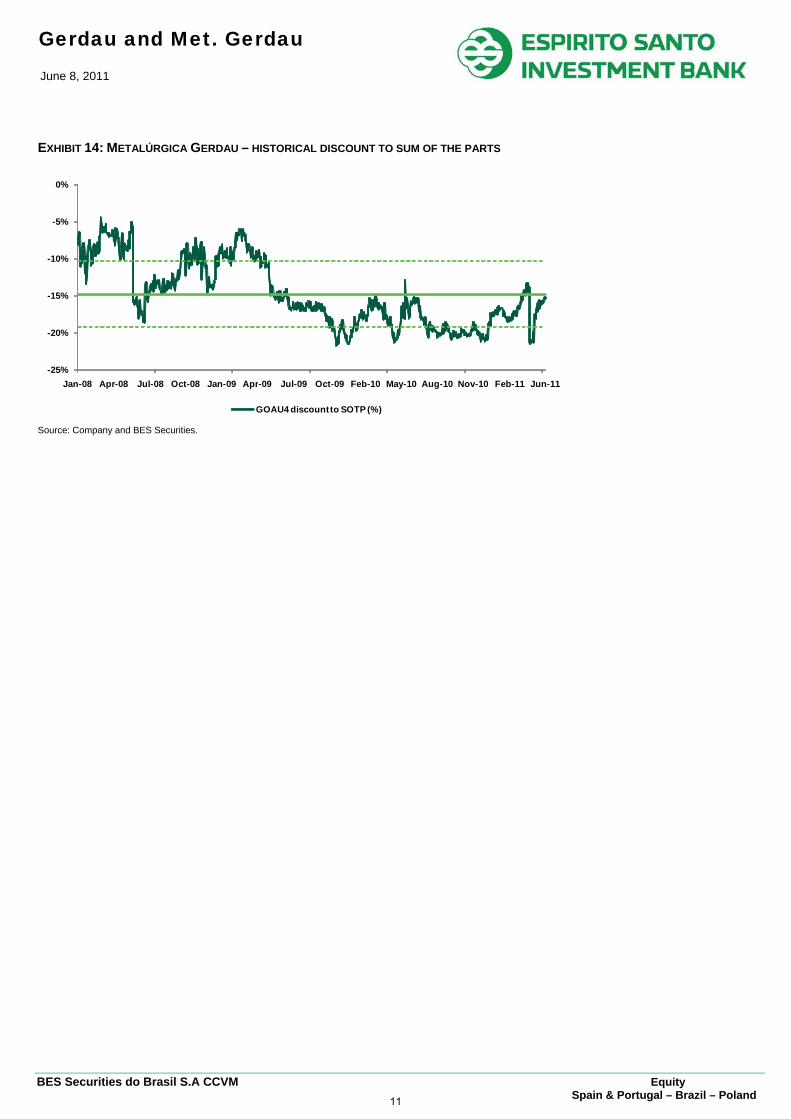
Met. Gerdau’s shares are currently trading at a 16.3% discount to its sum of the parts as the table below shows. The discount has narrowed on the back of the recent sell-off of Gerdau’s non-voting shares, mainly after the share issue in April. In light of this, we believe the discount should widen again to historical levels (20-22%) and, therefore, we expect a better performance by GGBR4 vs. GOAU4 in the short term.
Met. Gerdau (GOAU4) discount to sum of the parts Current price GGBR4 R$/share 16.3 # shares ON m 433# shares PN m 244Market value of stake in Gerdau S.A. R$ m 11,056Net debt GOAU (1Q11) R$ m 1,303Stake in other subsidiaries R$ m 201SOTP market value (a) R$ m 9,954
Current price GOAU4 R$/share 20.5# shares GOAU m 406Met. Gerdau market cap(b) R$ m 8,332Premium/discount (b/a) -16.3%
Source: Bloomberg, company for historical figures and BES Securities for estimates.
Analyst Juliano Navarro [email protected] +55 11 30747320
BUY
Price Target (Dec. 11) GOUA4 R$ 30.3Price (6 June 11) GOUA4 R$ 20.5Upside Potential GOUA4 +48%
TradingBovespa Ticker GOAU4Bloomberg Ticker GOAU4.BZShares Outstanding (m) 38Market Cap (R$ m) 18Avg. Daily Vol. (ths. shares) 1,101Avg. Daily Turnover (R$ ths.) 22,935Ibovespa Index W eight 0.8%52W High / Low 32,3 / 20Performance (%) Abs. vs Ibov3M -21.4 -15.26M -18.9 -10.6YTD -22.9 -15.2Financials YE11EEBITDA mg. naInterest Coverage naNet debt / EBITDA (x) naROCE naROE naShareholders (%)
13.0%8.8%8.5%3.3%
Treasury 1.5%Free Float 64.9%
Indac Ind. Adm. e Comercio S.AGrupo Gerdau EmpreendimentoBanco J. P. Morgan S.A.Tarpon Investimentos S.A.
Source: Bloomberg, company for historical figures and BES Securities for estimates.
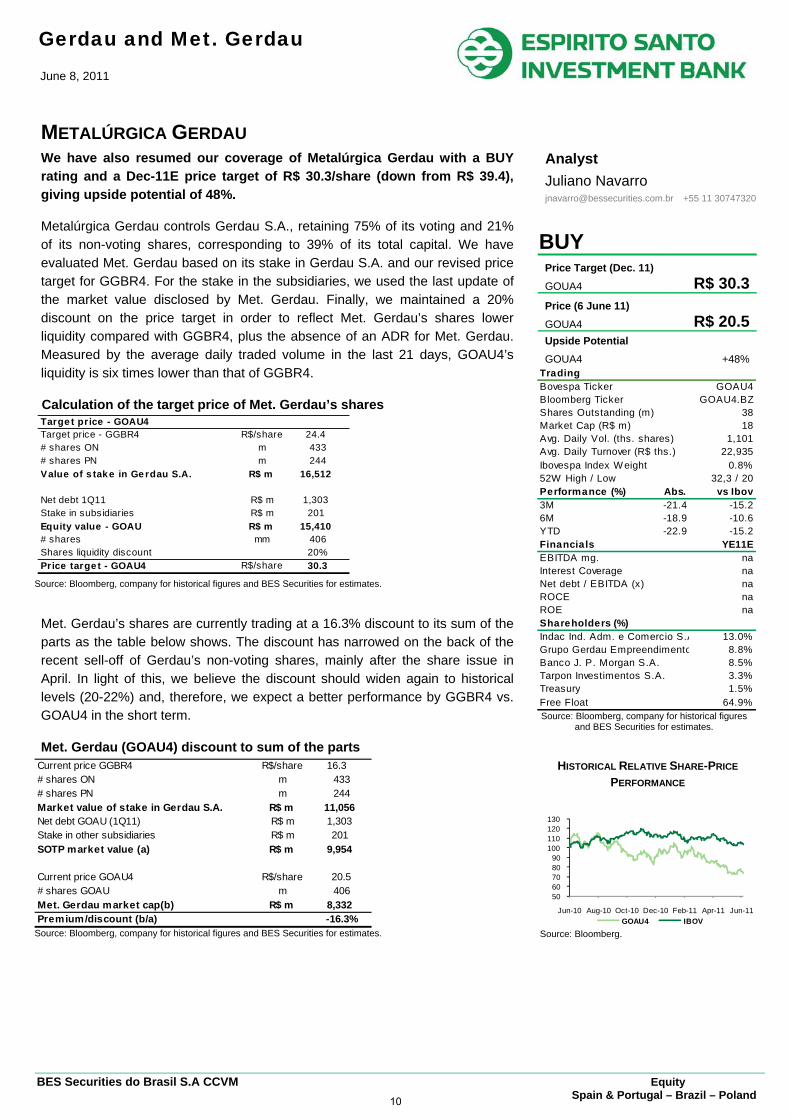
HISTORICAL RELATIVE SHARE-PRICE
PERFORMANCE
Source: Bloomberg.
5060708090
100110120130
Jun-10 Aug-10 Oct-10 Dec-10 Feb-11 Apr-11 Jun-11GOAU4 IBOV
10
Gerdau and Met. Gerdau June 8, 2011
BES Securities do Brasil S.A CCVM Equity Spain & Portugal – Brazil – Poland
EXHIBIT 14: METALÚRGICA GERDAU – HISTORICAL DISCOUNT TO SUM OF THE PARTS
-25%
-20%
-15%
-10%
-5%
0%
Jan-08 Apr-08 Jul-08 Oct-08 Jan-09 Apr-09 Jul-09 Oct-09 Feb-10 May-10 Aug-10 Nov-10 Feb-11 Jun-11
GOAU4 discount to SOTP (%)
Source: Company and BES Securities.
11
Gerdau and Met. Gerdau June 8, 2011
BES Securities do Brasil S.A CCVM Equity Spain & Portugal – Brazil – Poland
Valuation Methodology (Gerdau S.A.) The valuation methodology we use for Gerdau is to apply a Discounted Cash Flow to rolling ten-year cash flow forecasts. The discount rate, calculated by nominal WACC, is 11.9%, arrived at through a weighting of 40% debt (Kd of 5.3%) and 60% equity (Ke of 16.3%). We adopted a Beta of 1.35 to calculate the cost of equity (Ke). We have also included Gerdau’s mining assets, using a conservative set of assumptions. The resultant Fair Value is an end of the current year valuation i.e. what we believe the company would be worth in December, and is usually the same as our Price Target for the shares.
Risk Factors The U.S. long steel market staged an extremely modest recovery following the financial crisis, chiefly due to the low level of investments in construction and the renovation and repair of the country’s infrastructure. After the acquisition of Chaparral, Gerdau’s exposure to U.S. infrastructure increased substantially, in turn increasing its dependence on the U.S. government’s investment package as a means of leveraging sales. The risk is that the current situation will remain unchanged for at least another year, with no interim upturn in long steel demand in the region.
There is a risk of an upturn in scrap prices both in Brazil and the U.S. and that the steelmakers will be unable to pass on the full impact to steel prices. The risk is greater in the U.S. given that the country is the world’s biggest scrap exporter, and prices could go up without any accompanying improvement in the local market. If this happens, Gerdau’s operating margins may suffer.
Valuation Methodology (Met. Gerdau) We have evaluated Met. Gerdau based on its stake in Gerdau S.A. and our price target for GGBR4. For the stake in the subsidiaries, we used the last update of the market value disclosed by Met. Gerdau. Finally, we maintain a 20% discount on the price target in order to reflect Met. Gerdau’s shares lower liquidity compared with GGBR4, plus the absence of an ADR for Met. Gerdau.
Risk Factors As a holding company, Met. Gerdau is subject to the same risks factors as Gerdau. The U.S. long steel market staged an extremely modest recovery following the financial crisis, chiefly due to the low level of investments in construction and the renovation and repair of the country’s infrastructure. After the acquisition of Chaparral, Gerdau’s exposure to U.S. infrastructure increased substantially, in turn increasing its dependence on the U.S. government’s investment package as a means of leveraging sales. The risk is that the current situation will remain unchanged for at least another year, with no interim upturn in long steel demand in the region.
There is a risk of an upturn in scrap prices both in Brazil and the U.S. and that the steelmakers will be unable to pass on the full impact to steel prices. The risk is greater in the U.S. given that the country is the world’s biggest scrap exporter, and prices could go up without any accompanying improvement in the local market. If this happens, Gerdau’s operating margins may suffer.
Companies Mentioned (6/Jun/11) Gerdau (GGBR4, R$16.3, BUY, PT R$24.4) Metalúrgica Gerdau (GOAU4, R$20.5, BUY, PT R$30.3) Vale (VALE5, R$44.1, BUY, PT R$70.9) CSN (CSNA3, R$20.7, NEUTRAL, PT R$30.9) Usiminas (USIM5, R$14.4, NEUTRAL, PT R$21.6)
12
Gerdau and Met. Gerdau June 8, 2011
BES Securities do Brasil S.A CCVM Equity Spain & Portugal – Brazil – Poland
DISCLAIMER
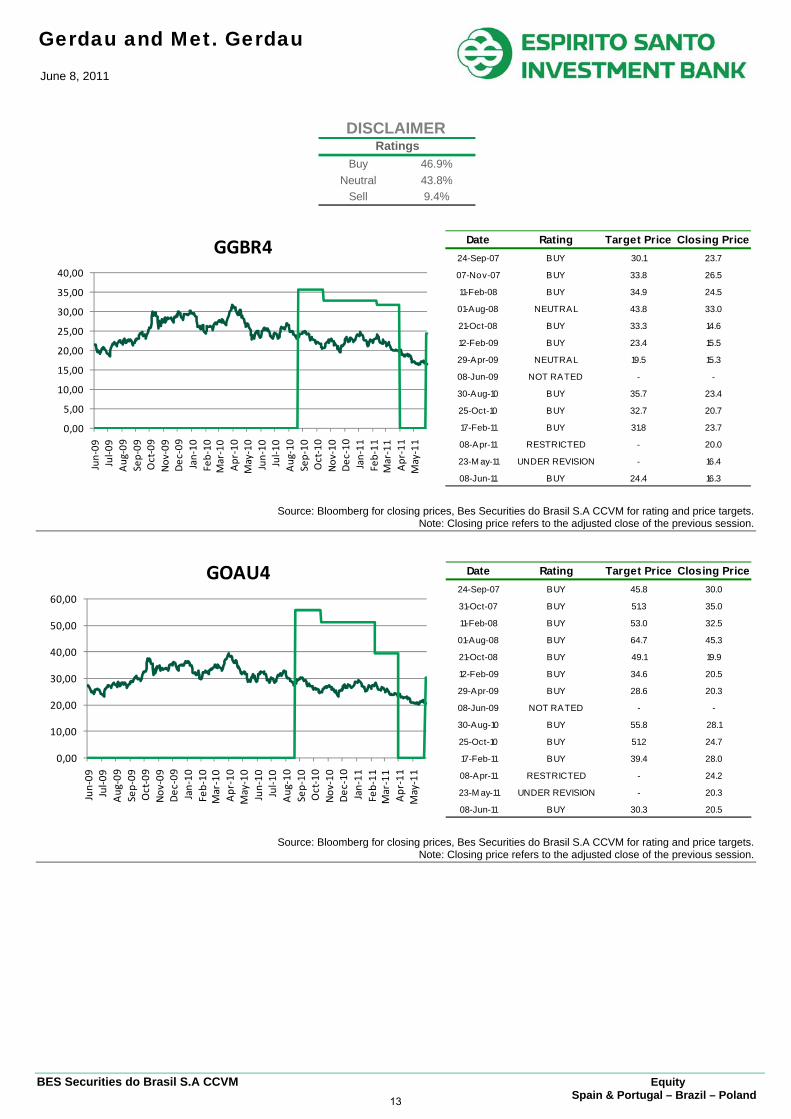
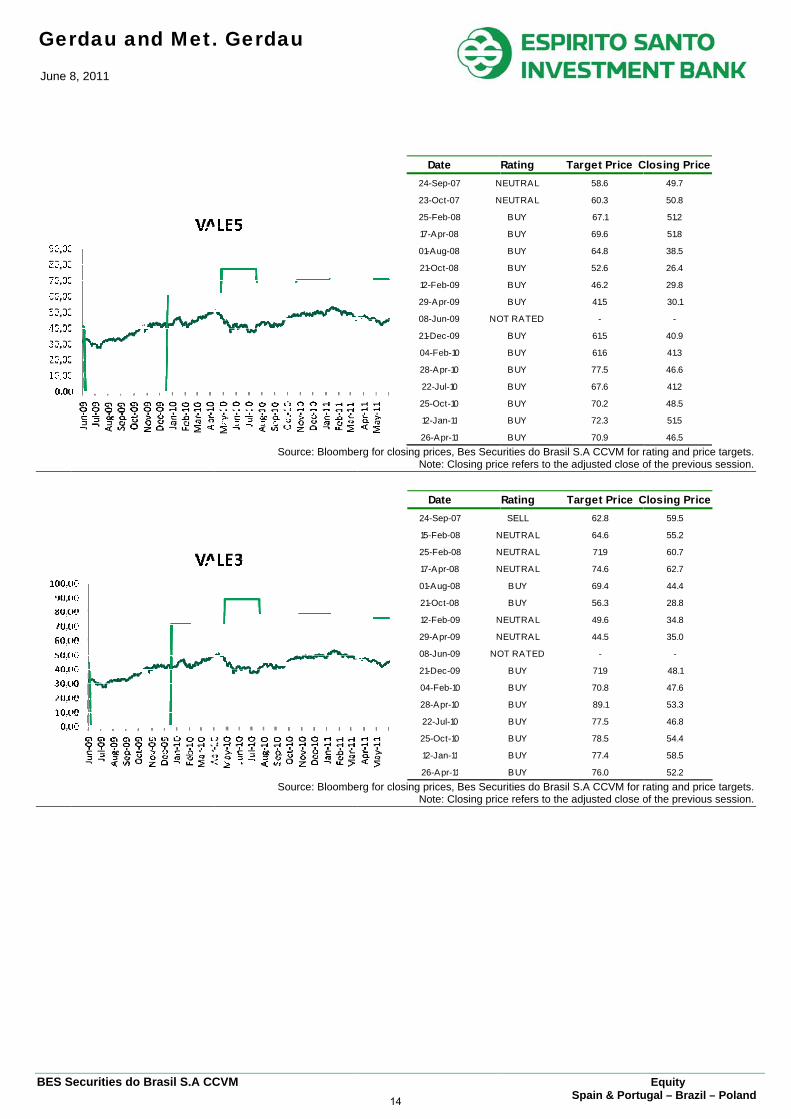
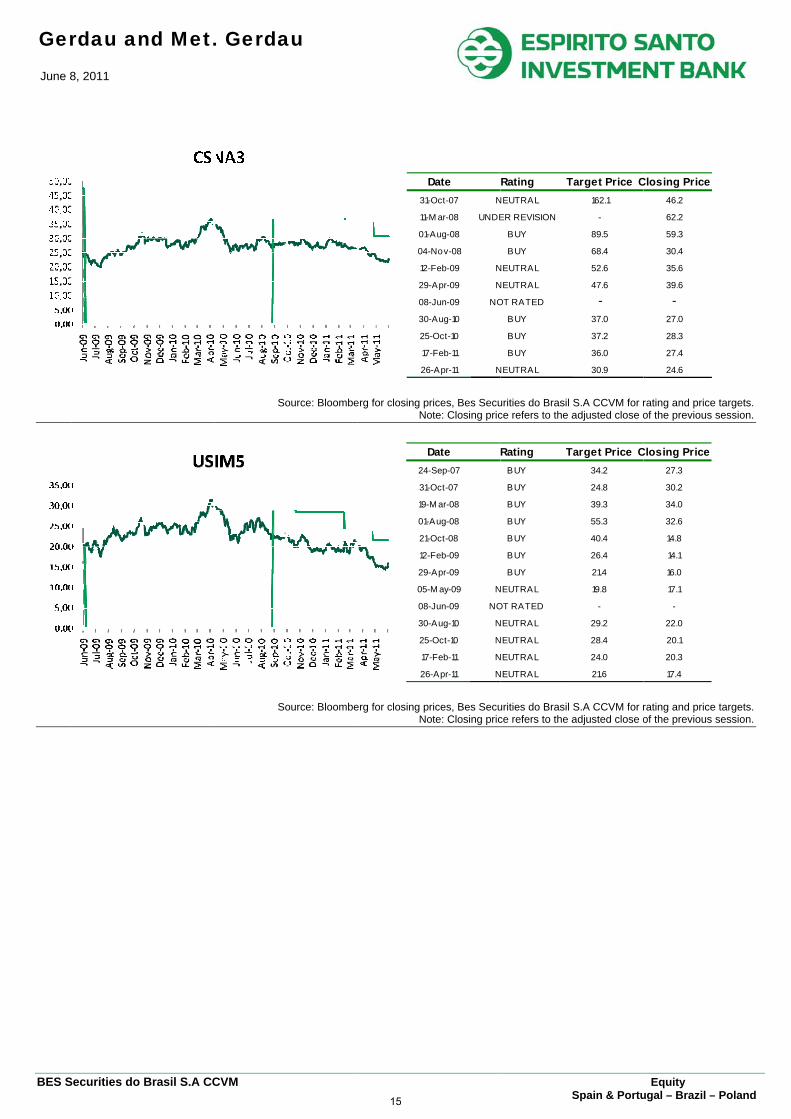
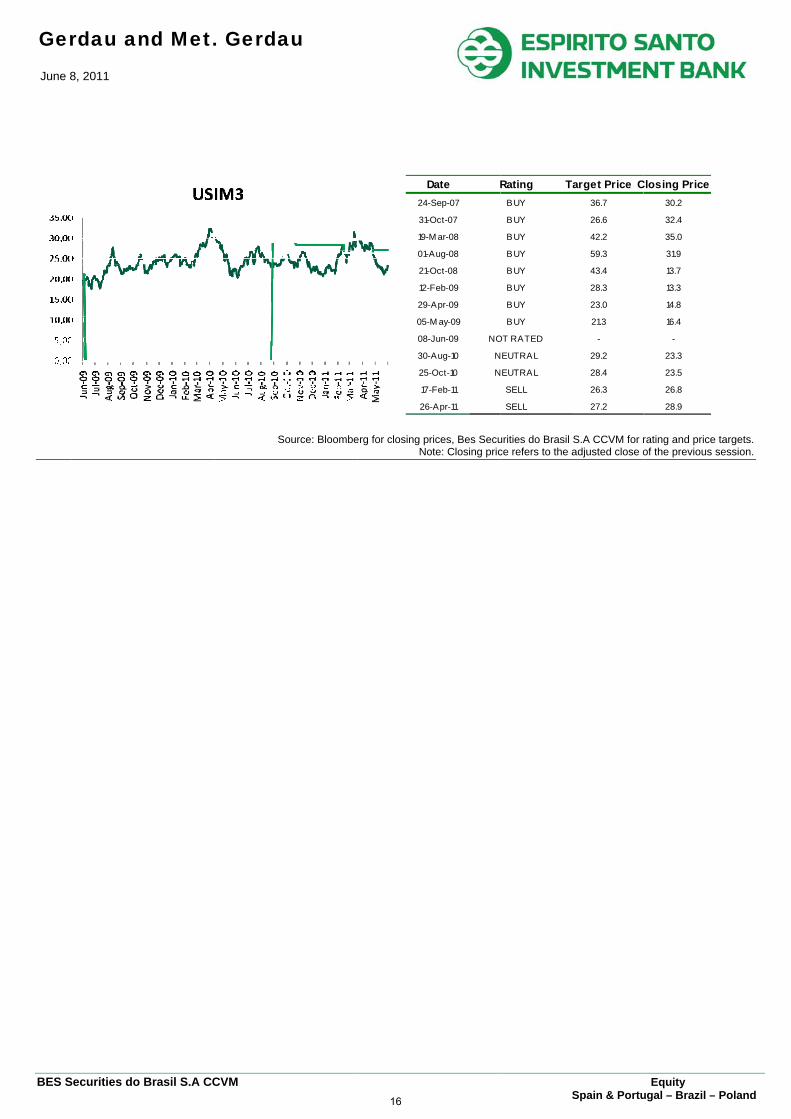
Source: Bloomberg for closing prices, Bes Securities do Brasil S.A CCVM for rating and price targets. Note: Closing price refers to the adjusted close of the previous session.
Source: Bloomberg for closing prices, Bes Securities do Brasil S.A CCVM for rating and price targets. Note: Closing price refers to the adjusted close of the previous session.
Buy 46.9%Neutral 43.8%
Sell 9.4%
Ratings
0,00
5,00
10,00
15,00
20,00
25,00
30,00
35,00
40,00
Jun‐09
Jul‐0
9Aug
‐09
Sep‐09
Oct‐09
Nov
‐09
Dec
‐09
Jan‐10
Feb‐10
Mar‐10
Apr‐10
May‐10
Jun‐10
Jul‐1
0Aug
‐10
Sep‐10
Oct‐10
Nov
‐10
Dec
‐10
Jan‐11
Feb‐11
Mar‐11
Apr‐11
May‐11
GGBR4 Date Rating Target Price Closing Price24-Sep-07 BUY 30.1 23.7
07-Nov-07 BUY 33.8 26.5
11-Feb-08 BUY 34.9 24.5
01-Aug-08 NEUTRAL 43.8 33.0
21-Oct-08 BUY 33.3 14.6
12-Feb-09 BUY 23.4 15.5
29-Apr-09 NEUTRAL 19.5 15.3
08-Jun-09 NOT RATED - -
30-Aug-10 BUY 35.7 23.4
25-Oct-10 BUY 32.7 20.7
17-Feb-11 BUY 31.8 23.7
08-Apr-11 RESTRICTED - 20.0
23-M ay-11 UNDER REVISION - 16.4
08-Jun-11 BUY 24.4 16.3
0,00
10,00
20,00
30,00
40,00
50,00
60,00
Jun‐09
Jul‐0
9Aug
‐09
Sep‐09
Oct‐09
Nov
‐09
Dec
‐09
Jan‐10
Feb‐10
Mar‐10
Apr‐10
May‐10
Jun‐10
Jul‐1
0Aug
‐10
Sep‐10
Oct‐10
Nov
‐10
Dec
‐10
Jan‐11
Feb‐11
Mar‐11
Apr‐11
May‐11
GOAU4 Date Rating Target Price Closing Price24-Sep-07 BUY 45.8 30.0
31-Oct-07 BUY 51.3 35.0
11-Feb-08 BUY 53.0 32.5
01-Aug-08 BUY 64.7 45.3
21-Oct-08 BUY 49.1 19.9
12-Feb-09 BUY 34.6 20.5
29-Apr-09 BUY 28.6 20.3
08-Jun-09 NOT RATED - -
30-Aug-10 BUY 55.8 28.1
25-Oct-10 BUY 51.2 24.7
17-Feb-11 BUY 39.4 28.0
08-Apr-11 RESTRICTED - 24.2
23-M ay-11 UNDER REVISION - 20.3
08-Jun-11 BUY 30.3 20.5
13
Ger June 8
BES S
rdau an8, 2011
Securities do
nd Met.
Brasil S.A CC
. Gerda
CVM
So
So
au
ource: Bloombe
ource: Bloombe
erg for closing p
No
erg for closing p
No
D24-
23-
25-
17-
01-
21-
12-
29-
08-
21-
04
28
22
25
12
26
D24
15-
25
17-
01-
21-
12-
29
08
21-
04
28
22
25
12
26
rices, Bes Secuote: Closing pric
rices, Bes Secuote: Closing pric
Date-Sep-07 N
-Oct-07 N
-Feb-08
-Apr-08
-Aug-08
-Oct-08
-Feb-09
-Apr-09
-Jun-09 NO
-Dec-09
4-Feb-10
8-Apr-10
2-Jul-10
5-Oct-10
2-Jan-11
6-Apr-11
Date-Sep-07
-Feb-08 N
-Feb-08 N
-Apr-08 N
-Aug-08
-Oct-08
-Feb-09 N
-Apr-09 N
-Jun-09 NO
-Dec-09
4-Feb-10
8-Apr-10
2-Jul-10
5-Oct-10
2-Jan-11
6-Apr-11
urities do Brasil ce refers to the a
urities do Brasil ce refers to the a
Rating TNEUTRAL
NEUTRAL
BUY
BUY
BUY
BUY
BUY
BUY
OT RATED
BUY
BUY
BUY
BUY
BUY
BUY
BUY
Rating TSELL
NEUTRAL
NEUTRAL
NEUTRAL
BUY
BUY
NEUTRAL
NEUTRAL
OT RATED
BUY
BUY
BUY
BUY
BUY
BUY
BUY
Spain & Portu
S.A CCVM for radjusted close o
S.A CCVM for radjusted close o
Target Price C58.6
60.3
67.1
69.6
64.8
52.6
46.2
41.5
-
61.5
61.6
77.5
67.6
70.2
72.3
70.9
Target Price C62.8
64.6
71.9
74.6
69.4
56.3
49.6
44.5
-
71.9
70.8
89.1
77.5
78.5
77.4
76.0
Equity ugal – Brazil –
rating and priceof the previous
rating and priceof the previous
Closing Price49.7
50.8
51.2
51.8
38.5
26.4
29.8
30.1
-
40.9
41.3
46.6
41.2
48.5
51.5
46.5
Closing Price59.5
55.2
60.7
62.7
44.4
28.8
34.8
35.0
-
48.1
47.6
53.3
46.8
54.4
58.5
52.2
– Poland
e targets. session.
e targets. session.
14
Ger June 8
BES S
rdau an8, 2011
Securities do
nd Met.
Brasil S.A CC
. Gerda
CVM
So
So
au
ource: Bloombe
ource: Bloombe
erg for closing pNo
erg for closing pNo
D31-
11-
01-
04-
12-
29-
08-
30-
25
17
26
D24-
31-
19-
01-
21-
12-
29-
05-
08-
30-
25
17
26
rices, Bes Secuote: Closing pric
rices, Bes Secuote: Closing pric
Date-Oct-07 N
M ar-08 UNDE
-Aug-08
-Nov-08
-Feb-09 N
-Apr-09 N
-Jun-09 NO
-Aug-10
5-Oct-10
7-Feb-11
6-Apr-11 N
Date-Sep-07
-Oct-07
M ar-08
Aug-08
-Oct-08
-Feb-09
-Apr-09
-M ay-09 N
-Jun-09 NO
-Aug-10 N
-Oct-10 N
-Feb-11 N
6-Apr-11 N
urities do Brasil ce refers to the a
urities do Brasil ce refers to the a
Rating TNEUTRAL
ER REVISION
BUY
BUY
NEUTRAL
NEUTRAL
OT RATED
BUY
BUY
BUY
NEUTRAL
Rating TBUY
BUY
BUY
BUY
BUY
BUY
BUY
NEUTRAL
OT RATED
NEUTRAL
NEUTRAL
NEUTRAL
NEUTRAL
Spain & Portu
S.A CCVM for radjusted close o
S.A CCVM for radjusted close o
Target Price C162.1
-
89.5
68.4
52.6
47.6
-37.0
37.2
36.0
30.9
Target Price C34.2
24.8
39.3
55.3
40.4
26.4
21.4
19.8
-
29.2
28.4
24.0
21.6
Equity ugal – Brazil –
rating and priceof the previous
rating and priceof the previous
Closing Price46.2
62.2
59.3
30.4
35.6
39.6
-27.0
28.3
27.4
24.6
Closing Price27.3
30.2
34.0
32.6
14.8
14.1
16.0
17.1
-
22.0
20.1
20.3
17.4
– Poland
e targets. session.
e targets. session.
15
Ger June 8
BES S
rdau an8, 2011
Securities do
nd Met.
Brasil S.A CC
. Gerda
CVM
So
au
ource: Bloombe
erg for closing pNo
D24-
31-
19-
01-A
21-
12-
29-
05-
08-
30-
25
17
26
rices, Bes Secuote: Closing pric
Date R-Sep-07
-Oct-07
M ar-08
Aug-08
-Oct-08
-Feb-09
-Apr-09
-M ay-09
-Jun-09 NO
-Aug-10 N
-Oct-10 N
-Feb-11
6-Apr-11
urities do Brasil ce refers to the a
Rating TBUY
BUY
BUY
BUY
BUY
BUY
BUY
BUY
OT RATED
EUTRAL
EUTRAL
SELL
SELL
Spain & Portu
S.A CCVM for radjusted close o
arget Price C36.7
26.6
42.2
59.3
43.4
28.3
23.0
21.3
-
29.2
28.4
26.3
27.2
Equity ugal – Brazil –
rating and priceof the previous
Closing Price30.2
32.4
35.0
31.9
13.7
13.3
14.8
16.4
-
23.3
23.5
26.8
28.9
– Poland
e targets. session.
16
Gerdau and Met. Gerdau June 8, 2011
BES Securities do Brasil S.A CCVM Equity Spain & Portugal – Brazil – Poland
IMPORTANT DISCLOSURES FOR NON U.S. PERSONS
This report was prepared by BES Securities do Brasil S.A. CCVM, a broker dealer authorized to engage in securities activities in Brasil.
Analyst stock rating
BUY: Expect the company to perform better than the primary market index over the next 12 months.
NEUTRAL: Expect the company to perform approximately in line with the primary market index over the next 12 months.
SELL: Expect the company to underperform the primary market index over the next 12 months.
Espírito Santo Equity Research has issued this report for information purposes only. All the information contained in this report is based upon information available to the public and has been obtained from sources believed to be reliable, but Espírito Santo Equity Research does not guarantee its accuracy or completeness. The opinions expressed herein are our present opinions only, and are subject to change without prior notice. Espírito Santo Equity Research is not under any obligation to update or keep current the information and the opinions expressed herein. This report is not, and should not be construed as, an offer or a solicitation to buy or sell any securities or related financial instruments. The investment discussed or recommended in this report may be unsuitable for investors depending on their specific investment objectives and financial position. Where an investment is denominated in a currency other than the investor's currency, changes in rates of exchange may have an adverse effect on the value, price of, or income derived from the investment. Past performance is not necessarily a guide to future performance. Income from investments may fluctuate. The price or value of the investments to which this report relates, either directly or indirectly, may fall or rise against the interest of investors. The securities mentioned in this publication may not be eligible for sale in some states or countries. Espírito Santo Equity Research does not accept any kind of liability for losses or damages which may arise from the use of this report. This report cannot be reproduced, in whole or in part, in any form or by any means, without Espírito Santo Equity Research specific written authorization. Espírito Santo Equity Research is a research team which aggregates analysts from Banco Espírito Santo de Investimento S.A. and its affiliate BES Securities do Brasil S.A. CCVM.
Receipt of Compensation
BES Investimento do Brasil S.A., - Banco de Investimento, shareholder of BES Securities do Brasil S.A. CCVM and/or subsidiaries have received compensation for investment banking services from Energias do Brasil, JBS, Autometal, PDG Realty, Tecnisa, BR Properties, Even, Sonae, Brasil Brokers, Hypermarcas, Magazine Luiza, Eletrobras, ABC Brasil, Bradesco, Banco do Brasil, Panamericano, Pine, Ecorodovias, OHL, Gerdau, Met. Gerdau, Braskem, Petrobras, HRT Petróleo, Fleury, Tim, Droga Raia and Arezzo in the past 12 months.
BES Investimento do Brasil S.A. and BES Securities do Brasil S.A. CCVM participates or has participated, in the last 12 months, as a syndicate member in share offerings of the JBS, Autometal, Inpar, Lopes, PDG Realty, Tecnisa, BR Properties, Even, Sonae, Direcional, Brasil Brokers, Hypermarcas, Magazine Luiza, Estácio, Banco do Brasil, Brasil Insurance, Ecorodovias, Julio Simões, Gerdau, Met. Gerdau, Magnesita, Mils, Multiplus, OSX Brasil, Petrobras, HRT Petróleo, Queiroz Galvão, CAB, Fleury, Droga Raia and Arezzo.
Banco Espírito Santo de Investimento S.A., indirect majority shareholder of BES Investimento do Brasil S.A. CCVM, participates or has participated, in the last 12 months, as a syndicate member in bond issues of the following companies: JHSF, Cemig, Eletrobrás, ABC Brasil, Bradesco, Panamericano, Pine and Julio Simões.
BES Investimento do Brasil S.A. CCVM expects to receive or intends to seek compensation for investment banking services from Energias do Brasil, Eletrobrás, OHL, Julio Simões, Petrobras, Telemar, Telemar Norte Leste and Tim in the next three months.
Analyst Certification
Each research analyst primarily responsible for the content of this report certifies that with respect to each security or issuer that the analyst covered in this report: - all of the views expressed in this research report accurately reflect his or her personal views about those securities or issuers mentioned in this report;
- he or she does not maintain relationships with any individual working for the company[ies] covered in this report;
- he or she does not hold, directly or indirectly, securities issued by the company[ies] covered in this report, which correspond to 5% (five percent) or more of the individual assets, up to the date of publication, or is involved in the acquisition, disposal or intermediation of securities issued by the company [ies] in the market;
- he or she does not receive, nor does BES Securities pay for, services provided, nor maintain commercial relations with the covered company [ies], or with individuals, legal entities or funds that act on their behalf;
17
Gerdau and Met. Gerdau June 8, 2011
BES Securities do Brasil S.A CCVM Equity Spain & Portugal – Brazil – Poland
- his or her fixed compensation and eventual variable compensation is not related to pricing of securities issued by the company covered in this report. Any variable compensation is awarded in consideration of the fulfillment of qualitative and quantitative criteria established by the BES Securities board of directors.
Ownership and Material Conflicts of Interest
BES Securities do Brasil S.A. CCVM does not hold direct or indirect stake in the capital of the company (companies) object of analysis(es)/recommendation(s) in this report, but the Grupo Banco Espírito Santo in which it takes part, holds, directly and in some cases indirectly, 1% or more of the equity securities of the following companies: Energias do Brasil, Cia. Providência Indústria e Comércio, Bradesco and Vila Velha S/A and its associated company UNIPAR. Bradesco is a direct shareholder of BES Securities do Brasil S.A. CCVM’ parent company. With the exception of the companies mentioned before, the BES Securities do Brasil S.A. CCVM does not hold direct or indirect stake in the capital of the other companies object of analysis(es)/recommendations in this report, as well as it was not involved in the acquisition alienation and intermediation of securities issued by these companies in the market.
Confidentiality
This report cannot be reproduced, in whole or in part, in any form or by any means, without BES Securities do Brasil S.A. CCVM’ specific written authorization. This report contains information intended solely for the designated addressee. Therefore any disclosure, replication, distribution or any action taken in reliance on it, is prohibited and unlawful.
IMPORTANT DISCLOSURES FOR U.S. PERSONS
This report was prepared by BES Securities do Brasil S.A. CCVM, a broker dealer authorized to engage in securities activities in Brasil. BES Securities do Brasil S.A. CCVM is not a registered broker-dealer in the United States and therefore, is not subject to U.S. rules regarding the preparation of research reports and the independence of research analysts. This report is provided for distribution to U.S. institutional investors in reliance upon the exemption from registration provided by Rule 15a-6 of the U.S. Securities Exchange Act of 1934, as amended.
This report is confidential and not intended for distribution to, or use by, persons other than the addressee and its employees, agents and advisors.
E.S. Financial Services, Inc. is the U.S. distributor of this report. E.S. Financial Services, Inc. accepts responsibility for the contents of this report, subject to the terms set out below, to the extent that it is delivered to a U.S. person other than a major U.S. institutional investor. Any U.S. person receiving this report and wishing to effect securities transactions in any security discussed in the report should do so through E.S. Financial Services, Inc. and not through any non-U.S. affiliate of E.S. Financial Services, Inc.
Contact Information:
Andrea Czarniak – Head of Sales (212) 351-6050 [email protected]
Joy Bejasa – Equity Research Sales (212) 351-6055 [email protected]
Michael Williams – Sales Trader (212) 351-6052 [email protected]
E.S. Financial Services, Inc.
New York Branch
340 Madison Avenue, 12th Floor
New York, N.Y. 10173
Each analyst whose name appears in this report certifies the following, with respect to each security or issuer that the analyst covered in this report: (1) that all of the views expressed in this report accurately reflect the personal views of the analyst about those securities and issuers; and (2) that no part of the compensation of the analyst was, is, or will be, directly or indirectly, related to the specific recommendations or views expressed by the analyst in this report.
The analysts whose names appear in this report are not registered or qualified as research analysts with the Financial Industry Regulatory Authority ("FINRA") and may not be associated persons of E.S. Financial Services, Inc. and therefore may not be subject to the applicable restrictions under FINRA Rules on communications with a subject company, public appearances and trading securities held by a research analyst account.
18
Gerdau and Met. Gerdau June 8, 2011
BES Securities do Brasil S.A CCVM Equity Spain & Portugal – Brazil – Poland
Ownership and Material Conflicts of Interest
As of the end of the month immediately preceding the date of publication of this research report, or the end of the second most recent month if the publication date is less than 10 calendar days after the end of the most recent month, Espirito Santo Financial Services, Inc. or affiliates ‘beneficially own’, as determined in accordance with Section 13(d) of the U.S. Securities Exchange Act of 1934, 1% or more of the equity securities of Cia. Providência Indústria e Comércio, Bradesco and Bradespar.
The research analyst(s), as named on the front cover of this report, have no actual, material conflict of interest of which he or she knows or has reason to know at the time of the publication of this research report.
E.S. Financial Services, Inc., BES Securities do Brasil S.A. CCVM and/or their affiliates, directors, officers and employees may have interests, or long or short positions, and may at any time make purchases or sales as a principal or agent of the subject companies mentioned or referred to in this report.
Receipt of Compensation
BES Investimento do Brasil S.A., - Banco de Investimento, shareholder of BES Securities do Brasil S.A. CCVM and/or subsidiaries have received compensation for investment banking services from Energias do Brasil, JBS, Autometal, PDG Realty, Tecnisa, BR Properties, Even, Sonae, Brasil Brokers, Hypermarcas, Magazine Luiza, Eletrobras, ABC Brasil, Bradesco, Banco do Brasil, Panamericano, Pine, Ecorodovias, OHL, Gerdau, Met. Gerdau, Braskem, Petrobras, HRT Petróleo, Fleury, Tim, Droga Raia and Arezzo in the past 12 months.
BES Investimento do Brasil S.A. and BES Securities do Brasil S.A. CCVM participates or has participated, in the last 12 months, as a syndicate member in share offerings of the JBS, Autometal, Inpar, Lopes, PDG Realty, Tecnisa, BR Properties, Even, Sonae, Direcional, Brasil Brokers, Hypermarcas, Magazine Luiza, Estácio, Banco do Brasil, Brasil Insurance, Ecorodovias, Julio Simões, Gerdau, Met. Gerdau, Magnesita, Mils, Multiplus, OSX Brasil, Petrobras, HRT Petróleo, Queiroz Galvão, CAB, Fleury, Droga Raia and Arezzo.
Banco Espírito Santo de Investimento S.A., indirect majority shareholder of BES Investimento do Brasil S.A. CCVM, participates or has participated, in the last 12 months, as a syndicate member in bond issues of the following companies: JHSF, Cemig, Eletrobrás, ABC Brasil, Bradesco, Panamericano, Pine and Julio Simões.
BES Investimento do Brasil S.A. CCVM expects to receive or intends to seek compensation for investment banking services from Energias do Brasil, Eletrobrás, OHL, Julio Simões, Petrobras, Telemar, Telemar Norte Leste and Tim in the next three months.
Representation to the Investors
Espírito Santo Equity Research has issued this report for information purposes only. All the information contained therein is based upon information available to the public and has been obtained from sources believed to be reliable. However, Espírito Santo Equity Research does not guarantee the accuracy or completeness of the information contained in this report. The opinions expressed herein are our present opinions only, and are subject to change without prior notice. Espírito Santo Equity Research is not under any obligation to update or keep current the information and the opinions expressed herein. This report is not, and should not be construed as an offer or a solicitation to buy or sell any securities or related financial instruments. The investment discussed or recommended in this report may be unsuitable for investors depending on their specific investment objectives and financial position. Where an investment is denominated in a currency other than the investor’s currency, changes in rates of exchange may have an adverse effect on the value, price of, or income derived from the investment. Past performance is not necessarily a guide to future performance. Income from investments may fluctuate. The price or value of the investments to which this report relates, either directly or indirectly, may fall or rise against the interest of investors. Any recommendation and opinion contained in this report may become outdated as a consequence of changes in the environment in which the issuer of the securities under analysis operates, in addition to changes in the estimates and forecasts, assumptions and valuation methodology used herein. The securities mentioned in this publication may not be eligible for sale in some states or countries. Espírito Santo Equity Research does not accept any form of liability for losses or damages which may arise from the use of this report.
19