global spread of helminth parasites at the human domestic
TRANSCRIPT
Global spread of helminth parasites at the human – domestic animal – 1
wildlife interface 2
3
Running head: Parasites at the human–animal interface 4
5
Konstans Wells1,*, David I. Gibson2, Nicholas J. Clark3, Alexis Ribas4, Serge Morand5, 6
Hamish I. McCallum1 7
8
1 Environmental Futures Research Institute, Griffith University, Nathan QLD 4111, 9
Australia 10
2 Department of Life Sciences, Natural History Museum, London SW7 5BD, United Kingdom 11
3 School of Veterinary Science, University of Queensland, Gatton, Queensland, Australia 12
4 Department of Biology, Healthcare and the Environment, Faculty of Pharmacy and Food 13
Sciences, University of Barcelona, Barcelona, Spain 14
5 CIRAD ASTRE, CNRS ISEM, Faculty of Veterinary Technology, Kasetsart University, 15
Bangkok, Thailand 16
E-mail addresses (following order of authorship): [email protected], 17
[email protected], [email protected], [email protected], [email protected], 18
20
*Correspondence: 21
Konstans Wells, Environmental Futures Research Institute, Griffith University, Brisbane 22
QLD 4111, Australia, 23
E-mail: [email protected], Phone: +61 737357707, Fax: +61 737354209 24
25
2
26
Keywords: Global spread of parasites, helminth parasites, human–wildlife interface, parasite 27
biodiversity, parasite host shifting, zoonoses 28
29
Abstract 30
Changes in species distributions open novel parasite transmission routes at the human–31
wildlife interface, yet the strength of biotic and biogeographical factors that prevent or 32
facilitate parasite host shifting are not well understood. 33
We investigated global patterns of helminth parasite (Nematoda, Cestoda, Trematoda) 34
sharing between mammalian wildlife species and domestic mammal hosts (including 35
humans) using > 24,000 unique country-level records of host-parasite associations. We used 36
hierarchical modelling and species trait data to determine possible drivers of the level of 37
parasite sharing between wildlife species and either humans or domestic animal hosts. We 38
found the diet of wildlife species to be a strong predictor of levels of helminth parasite 39
sharing with humans and domestic animals, followed by a moderate effect of 40
zoogeographical region and minor effects of species’ habitat and climatic niches. Combining 41
model predictions with the distribution and ecological profile data of wildlife species, we 42
projected global risk maps that uncovered strikingly similar patterns of wildlife parasite 43
sharing across geographical areas for the different domestic host species (including humans). 44
These similarities are largely explained by the fact that widespread parasites are commonly 45
recorded infecting several domestic species. 46
If the dietary profile and position in the trophic chain of a wildlife species largely drives its 47
level of helminth parasite sharing with humans/domestic animals, future range shifts of host 48
species that result in novel trophic interactions may likely increase parasite host shifting and 49
have important ramifications for human and animal health. 50
3
51
Introduction 52
The emergence of parasitic diseases is largely a consequence of the exploitation of novel host 53
species by parasites capable of shifting hosts (Lloyd-Smith et al., 2009). A central goal in 54
disease ecology is thus to identify factors that enable parasite sharing, especially since 55
determinants of parasite sharing can influence the spread of parasites to new habitats and 56
biogeographic regions. For zoonotic diseases (i.e. infectious diseases of humans caused by 57
parasites that have an animal reservoir) a key determinant of emergence is overlapping 58
environmental conditions and biological traits that enable parasites to be shared by human 59
and animal hosts. Along early human migration pathways, increased physical contact with 60
endemic animal and plant species led to increased exposure to novel parasites (Pedersen & 61
Davies, 2009; Pulliam, 2008), especially those acquired through ingestion of wild animal 62
meat (Reinhard et al., 2013). Anthropogenic land use, conversion of natural habitats into 63
production landscapes, and intensification of international travel and wildlife trades continue 64
to diminish or shift former geographical barriers between humans and wildlife, likely 65
facilitating exposure to novel parasite pools (Murray et al., 2015; Patz et al., 2008). In 66
contrast, decreasing wildlife populations and the isolation of populations through habitat 67
fragmentation (through construction of roads or other barriers that prevent animal movement) 68
may effectively decrease contact between humans and wildlife. 69
While direct human-wildlife parasite sharing is a topic of major importance, domestic 70
animals that occur in close proximity to humans may also act as key hosts for wildlife 71
parasites. Domestic animals (hereafter including domesticated animals, such as dogs, but also 72
animals that live in close proximity to humans, such as commensal rats) have colonised 73
almost all terrestrial environments (Hoberg & Brooks, 2008; Matisoo-Smith et al., 1998). In 74
turn, domestic animals commonly share subsets of their parasite fauna with humans. This 75
4
subset increases the longer a species has been domesticated (Morand et al., 2014; Wolfe et 76
al., 2007). Parasite host shifting at the interface between humans, domestic animals and 77
wildlife is a multifaceted and multidirectional problem, with potential effects for human and 78
wildlife health (Daszak et al., 2000). Yet, while previous studies found 60 % of human 79
diseases to be of zoonotic origin (Taylor et al., 2001; Woolhouse & Gowtage-Sequeria, 80
2005), global patterns in parasite sharing at the human–domestic animal–wildlife interface 81
are poorly resolved. 82
Predicting zoonotic disease risk requires understanding wildlife characteristics that 83
enable host shifting at local and global scales (Hoberg & Brooks, 2008). Host attributes, such 84
as phylogenetic relatedness or overlap in habitat use, are useful for predicting whether hosts 85
share the same parasite species through ecological fitting (Streicker et al., 2010; Wells et al., 86
2015) or how invasions into novel environments may result in novel host-parasite 87
associations (Agosta & Klemens, 2008; Clark et al., 2017). Conversely, knowledge of 88
whether species attributes such as demography, body size or diet increase the likelihood of 89
sharing parasites with humans, and whether zoonotic disease burdens in humans or domestic 90
animals exhibit biogeographical structure, remains sparse (Han et al., 2015; Just et al., 2014; 91
Stephens et al., 2016). 92
A key gap in our understanding of zoonotic disease emergence is information on how 93
patterns of wildlife parasite sharing differ among domestic host species or across 94
biogeographical regions. Despite persisting in close spatial proximity, humans and domestic 95
animals differ in habitat use, diet and other ecological traits. This may have consequences for 96
determining subsets of parasites that humans and domestic animals share with wildlife. 97
Humans and dogs, for example, each consume a large range of invertebrate and vertebrate 98
species (many of which may be relevant reservoir hosts) and can access almost any type of 99
terrestrial habitat. Other domestic species, such as cows, are confined to relatively few 100
5
habitats and food items (e.g. grassland vegetation). One may expect that different domestic 101
animals will exhibit different patterns of wildlife parasite sharing and, consequently, different 102
potential roles as carriers of zoonotic parasites. Globally, wildlife communities occur in 103
distinct species assemblages according to biogeographical history, speciation events and 104
habitat biomes (Holt et al., 2013; Kraft et al., 2007; Wallace, 1876). Such biogeographical 105
structure may lead to spatial gradients in wildlife parasite sharing for humans and domestic 106
animals. 107
Here, we investigate possible drivers of helminth parasite (Nematoda, Cestoda, 108
Trematoda) sharing between wildlife and focal domestic host species (including humans) at a 109
global scale. Using a large database of mammalian host-parasite associations, we addressed 110
two key questions: 1) Which species traits make wildlife most prone to share helminth 111
parasites with humans or domestic species? 2) Do patterns of wildlife parasite sharing exhibit 112
biogeographical structure across the globe? Given that humans share parasites most 113
intensively with domestic species, we expect to find similar patterns of wildlife parasite 114
sharing among humans and domestic animals. We expect this to be especially true when 115
comparing patterns for humans and dogs, as dogs have a long domestication history and share 116
a broad range of habitats with humans. We also expect biogeographical structure in wildlife 117
assemblages to drive global patterns in wildlife–human and wildlife–domestic animal parasite 118
exchange, as different wildlife traits may facilitate or impede parasite transmission cycles and 119
host shifting abilities. 120
121
Materials and Methods 122
Host-parasite database 123
We compiled a global database of mammalian host–parasite associations from the publicly 124
available Natural History Museum (NHM), London’s Host-Parasite Database (Gibson et al., 125

6
2005). This database has been used as a backbone for the comprehensive Fauna Europaea 126
biodiversity inventories of parasitic worms (Gibson & Bray, 1994; Gibson et al., 2014) and is 127
arguably the largest publicly available compilation of country-level records for helminth host 128
associations to date. In humans, for example, previous estimates suggested > 300 helminth 129
species infecting humans (Crompton, 1999), whereas our database reports a total of 397 130
helminth species (Nematoda, Cestoda, Trematoda) to be associated with humans. We 131
downloaded all host-parasite data from the database using web-scraping tools implemented in 132
the package xml in the software R (R Development Core Team, 2017). The data of interest 133
for our study were country-specific combinations of parasite-mammal species associations, 134
which included information from wild and domestic mammals as well as humans. We 135
excluded all records from captive animals or experiments, and considered only records that 136
included full binomial species names (scientific genus and species names). As the original 137
database records were not specified in detail, records may include reports of molecular 138
identification of parasite species and also dead-end hosts, from which parasites are not 139
transmitted to other species. Mammal species synonyms were standardised using the 140
taxonomy of Wilson & Reeder (2005) and the IUCN Red List. Parasite names were 141
standardised using the WoRMS database (http://www.marinespecies.org), the tapeworm 142
database at the University of Connecticut (http://tapewormdb.uconn.edu/) and GBIF 143
(www.gbif.org/). Location names were standardised to country names of the current world 144
geopolitical map and assigned to one of 11 global zoogeographical regions according to Holt 145
et al. (2013). Since China covers different zoogeographical regions, and not all records from 146
China could be assigned to any particular region, we classified these unspecified records into 147
an extra category (“China unspecified”). 148
Our dataset consisted of 24,486 unique combinations of host–parasite–country records for 149
selected helminth species (Nematoda, Cestoda, Trematoda), of which 1,737 involved humans 150
7
as a host, from a total of 4,507 selected parasite species. Of the 1,366 total mammalian host 151
species in our dataset, we considered 21 species as ‘domestic’ (including humans and 152
commensal murids) and all others as ‘wildlife’. Domestic species were banteng (Bos 153
javanicus), yak (B. mutus), cow (B. taurus), bactrian camel (Camelus bactrianus), dromedary 154
(C. dromedarius), dog (Canis familiaris), goat (Capra aegagrus), guinea pig (Cavia 155
porcellus), wild ass (Equus africanus), donkey (E. asinus), horse (E. caballus), cat (Felis 156
catus), human (Homo sapiens), guanaco (Lama guanicoe), house mouse (Mus musculus), 157
rabbit (Oryctolagus cuniculus), sheep (Ovis aries), brown rat (Rattus norvegicus), black rat 158
(R. rattus), pig (Sus scrofa) and vicugna (Vicugna vicugna). From these domestic species, we 159
selected parasite assemblages (Nematoda, Cestoda, Trematoda) from seven focal host species 160
(hereafter termed focal species) to examine associations with wildlife: man, dog, cat, cow, 161
pig, black rat and brown rat. Focal host species were selected because they are among the 162
most cosmopolitan host species and are represented with enough records in the database to 163
facilitate statistical inference of wildlife parasite sharing patterns. 164
We are aware that this dataset is incomplete in that it lacks recently described parasite 165
species and recent records of host-parasite associations in different locations; while this limits 166
inference about absolute species numbers, we believe this dataset provides meaningful 167
insights into the relative strength of how wildlife species share parasites with domestic 168
species in relation to ecological traits and projected global maps, which were the main 169
interests of this study. 170
171
Host ecological traits 172
We selected nine ecological traits of terrestrial mammals, based on the PanTHERIA (Jones et 173
al., 2009) and EltonTraits 1.0 (Wilman et al., 2014) databases, to include a broad range of 174
attributes likely to distinguish hosts in terms of their suitability for a parasite’s life and 175

8
transmission cycles. Selected traits included: body mass, which is a key feature of mammals 176
in terms of their metabolism and adaptation to environments; average longevity, litter size 177
and the average number of litters per year as demographic parameters that could be relevant 178
for allowing parasites to complete parts of their life cycles in a host; diet breadth (calculated 179
as a Shannon diversity index based on the proportional use of 10 diet categories as presented 180
in EltonTraits) and diet class (‘invertebrate predator’, ‘herbivore’, ‘omnivore’ or ‘carnivore’) 181
as trophic interactions traits; range area, which we expect to affect the exposure to other 182
mammalian host species; average temperature within range as an indicator of climate niche; 183
and habitat as multiple binary indicators of whether a species uses 1) forest, 2) open 184
vegetation, and/or 3) artificial/anthropogenic habitats. Information about specific habitat 185
utilisation was compiled from the International Union for the Conservation of Nature (IUCN) 186
database (IUCN, 2014). We did not include a larger set of ecological traits in our analysis to 187
avoid trait autocorrelation and colinearity issues in the modelling. 188
We accounted for phylogenetic distances between wildlife species and focal domestic species 189
based on a correlation matrix (Paradis et al., 2004) of phylogenetic branch lengths, which 190
was built using a recent mammalian phylogenetic supertree (Bininda-Emonds et al., 2007). 191
We further considered the orders Carnivora, Rodentia and Primates as binary (categorical) 192
indicator variables for the major taxonomic groups that are suspected to share parasites with 193
the focal species; we used these as indicators to account for possible group-level taxonomic 194
effects additional to the phylogenetic branching. To account for sampling bias among wildlife 195
species, we queried the number of published references for each binomial wildlife species 196
name from the Scopus literature database (accessed 25/02/2017); we used this measure as 197
more refined searches, such as the number of references linked only to parasites, included 198
large proportions of zeros and information on the true number of sampled individuals (which 199
should determine the chance parasites are detected if prevalence is low) was not available. 200
9
201
Statistical analysis 202
The primary goal of this study was to identify drivers of parasite sharing between focal 203
domestic species and wildlife. We addressed this aim using logistic hierarchical regressions 204
to analyse the relative strength of covariates that could determine the probability of parasites 205
from either humans or domestic species to be found in wildlife species (calibrated on host 206
species from the NHM database). For each focal domestic host species d, we constructed 207
presence-absence vectors Yd(wr, pd) that encompassed all combinations of mammalian 208
wildlife species wr (i.e. non-domestic species in the database) surveyed for parasites from any 209
zoogeographical region r and all parasite species pd from one of the selected parasite groups 210
(Nematoda, Cestoda, Trematoda) recorded in the respective focal species. Here, we assume 211
that any wildlife species recorded in our database has been potentially examined for all 212
parasite species pd known to occur in the respective region; the absence of such records are 213
set to 0. These ‘absence records’ likely include false zeros due to missing observations and 214
hence underestimate the link of parasite species from focal hosts to wildlife; however, we 215
prefer this approach to presence-only modelling, as the true proportion of wildlife species 216
infected remains unknown, and we thus expect techniques such as data imputation not to 217
improve our analysis. 218
We assumed the resulting data vectors Yd(wr, pd) are random draws from the 219
underlying association probability Ψd(wr, pd) of a wildlife species sharing a parasite with a 220
focal species according to a Bernoulli distribution, as commonly used in logistic regression. 221
We modelled the probability Ψd(wr, pd) further using a logit-link function such that 222
logit[Ψd(wr, pd)] = µParasite(pd) + µRegion(r) + Β ETwr 223
where µParasite(pd) is the parasite-specific intercept, µRegion are coefficient estimates that 224
account for variation across zoogeographical regions r, and Β is a vector of coefficient 225
10
estimates that accounts for variations in the association risk linked to the matrix of covariates 226
ETwr of the nine host ecological traits, the phylogenetic distance of wildlife to the focal host 227
species and the number of publications, as specified above. 228
We used a hierarchical model with a common hyperprior ηµ for the intercept as 229
µ(pd) = N(ηµ, ε µ). 230
where εµ is a random Gaussian variance term that allows species-specific intercepts to vary 231
from the hyperprior (no group specific hyperprior was specified as we ran models separately 232
for the three parasite groups). We fitted the model in a Bayesian framework with Markov 233
Chain Monte Carlo (MCMC) sampling based on the Gibbs sampler in the freeware 234
OpenBUGS (Lunn et al., 2012). We used a Gibbs variable selection procedure (GVS) to only 235
include variables in the model if sufficiently supported by the fit to data and joint sampling of 236
the most likely coefficient values (selection frequencies were typically high for covariates 237
with significant effects, except for the categorical effects of ‘region’). We used normal priors 238
with mean = 0 and variance ~ Exp(1) for intercepts and all regression coefficients if selected 239
as part of the GVS, and 0 otherwise. This prior gives close approximation to a logistic 240
distribution and is appropriate for logit-scale estimates (Lunn et al., 2012). Convergence of 241
MCMC chains was assessed visually and with Gelman-Rubin diagnostics (all values < 1.2) 242
after burn-ins > 50,000 MCMC samples. Parameter estimates were calculated as posterior 243
modes and 95% highest posterior density credible intervals (CI) from 5,000 samples. 244
Posterior predictive checks assessed whether model assumptions were reasonable 245
approximations of the data generating process, with Bayesian P-values around 0.5 indicating 246
a good fit. This model checking approach essentially compares whether the observed data 247
resemble data simulated from the posterior distribution (Gelman et al., 1996). All covariates 248
were scaled (dividing centred values by one SD) and log-transformed if featuring 249
overdispersion (body mass, range area, number of publications) to facilitate comparison of 250
11
effect sizes. Missing values of ecological trait covariates were imputed during MCMC 251
updates, randomly drawing values from priors according to the mean and variance of all 252
known trait values (considering all information in the trait databases) from species in the 253
same orders. Specific trait data are currently not available for a considerable diversity of 254
mammalian species; consequently, because of our ability to meaningfully impute missing 255
data using a Bayesian sampling approach, account for uncertainty in parameter estimates, and 256
make reasonably accurate parameter estimates, we preferred this approach over others, such 257
as machine learning techniques, which are commonly used to more flexibly model nonlinear 258
and interaction relationships (Elith et al., 2008). Significance of model effects was 259
determined by examining whether the 95% CI of regression coefficients did not overlap zero 260
for continuous covariates or were clearly distinguished from each other for categorical 261
covariates. 262
We computed the relative risk that a wildlife species will share parasites with each of 263
the focal host species for all 5,289 terrestrial mammal species in the IUCN database by 264
entering species’ ecological traits into equations from the fitted models above (using posterior 265
modes of parameter estimates). We hereafter refer to this relative risk as the association risk, 266
which is appropriate in this case since the analysed data vectors included all combinations of 267
parasites from a focal host and wildlife species. Thus, the association risk would be ‘1’ if a 268
wildlife species is likely to share all parasite species known from a particular focal species. 269
We set the respective parameter values to zero if trait variables were missing (i.e. assuming 270
an ‘average’ effect of the respective covariate for computing the respective species-level 271
association risk). 272
The second aim of this study was to examine whether patterns of wildlife parasite 273
sharing among domestic hosts exhibit biogeographical structure, which could be informative 274
for understanding the future spread of zoonotic parasites. We addressed this goal by 275
12
exploring global patterns in observed parasite associations for focal host species and 276
forecasted associations of wildlife infestation with parasites shared with the focal host 277
species. First, for each focal host species, we used our model outputs to generate a series of 278
maps (10km2 raster cell sizes) to forecast global patterns in both wildlife parasite association 279
risks and parasite assemblage structure. Using IUCN geographical range maps for wildlife 280
species, we projected the respective parasite association risks on a global raster and, for each 281
cell, computed average species-level and cumulative community-level geographical 282
association risks for local wildlife assemblages. We were not able to account for possible 283
regional variation in realized host-parasite interactions (which could arise due to variation in 284
local conditions that enable host-parasite interactions) within the given wildlife range maps 285
and, for simplicity, assumed homogenous association risks throughout species’ given ranges. 286
Next, to explore variation in parasite assemblage structure across zoogeographical 287
regions, we computed for each cell the hypothetical presence of focal host parasites in local 288
wildlife by assuming that a parasite species occurred throughout the range of its associated 289
wildlife host species. We then aggregated the presence-absence of these parasites at the 290
zoogeographical region level and calculated parasite species turnover across regions using the 291
βsim index, a basic turnover index that is based on the number of shared and unique species 292
and is relatively unbiased by species richness (Lennon et al., 2001). As an index of parasite 293
assemblage distinctiveness in each region, we calculated the mean of all region-specific 294
pairwise βsim indices. We explored geographical sampling bias by computing the number of 295
wildlife species examined for helminths (including species not found in domestic host 296
species) and wildlife species richness for each cell. 297
Spearman rank correlation tests were used to compare biogeographical patterns. First, 298
we assessed whether infestation of a greater number of focal host species leads to broader 299
biogeographical spread by testing the correlation strength between the Shannon index of 300
13
biogeographical spread and the total number of associated focal host species. We then 301
explored whether wildlife species show similar biogeographical patterns in the risk for 302
sharing parasites with different focal host species by testing all pairwise correlations between 303
the geographical association risks for parasites from the different focal host species. 304
We quantified the biogeographical spread of parasites (Nematoda, Cestoda, 305
Trematoda) found in any focal species. We did this by calculating a Shannon index Hp for 306
each parasite species p to account for both ‘richness’, according to the number of 307
zoogeographical regions where a species was recorded, and ‘evenness’, according to the 308
proportion φp(r) of wildlife species infected with the respective parasite species in each 309
zoogeographical region r (Magurran, 2004). We calculated the index as 310
Hp = ∑ 𝜑𝑝(𝑟) ln [𝑝
(𝑟)]𝑅𝑟=1 . 311
Larger values indicate higher proportions of wildlife species infected and a more even spread 312
by the parasite across zoogeographical regions. 313
All statistical analyses and distributional map constructions were conducted separately for the 314
three groups of Nematoda, Cestoda and Trematoda using R (R Development Core Team, 315
2017) for data preparation and summary statistics. 316
317
Results 318
Of the 1,345 mammalian wildlife species in our host-parasite database, 41 % (n = 553 spp.) 319
were infected with helminth parasite species (Nematoda, Cestoda and Trematoda) also found 320
in humans. For humans, in turn, 49 % (195 of 397 spp.) of all helminth parasite species were 321
also found in wildlife and 45 % (182 spp.) in at least one other domestic host species. The 322
wildlife species associated with the highest numbers of zoonotic parasites were Vulpes vulpes 323
(red fox, 51 spp.), Canis lupus (grey wolf, 33 spp.) and Nyctereutes procyonoides (raccoon 324
dog, 29 spp.). For the other focal domestic host species, proportions of examined wildlife 325
14
species that shared parasites ranged from 21 – 31 % (Table S1, Supplementary 326
Information). 327
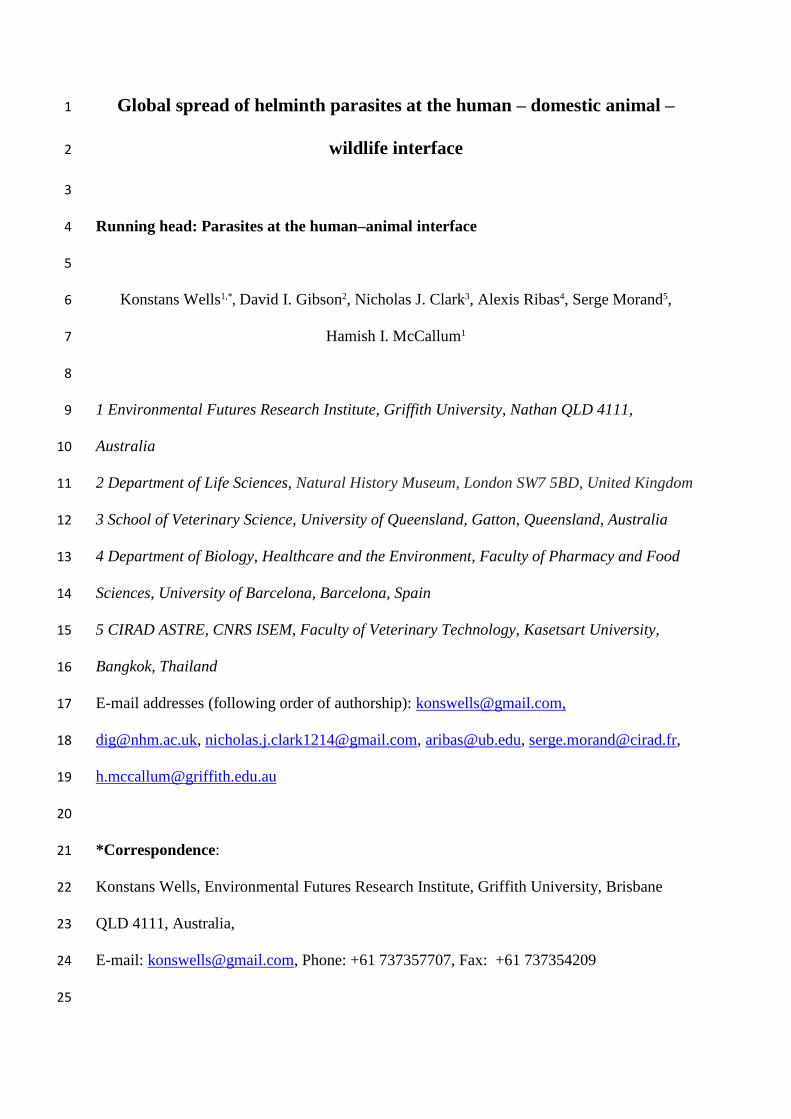
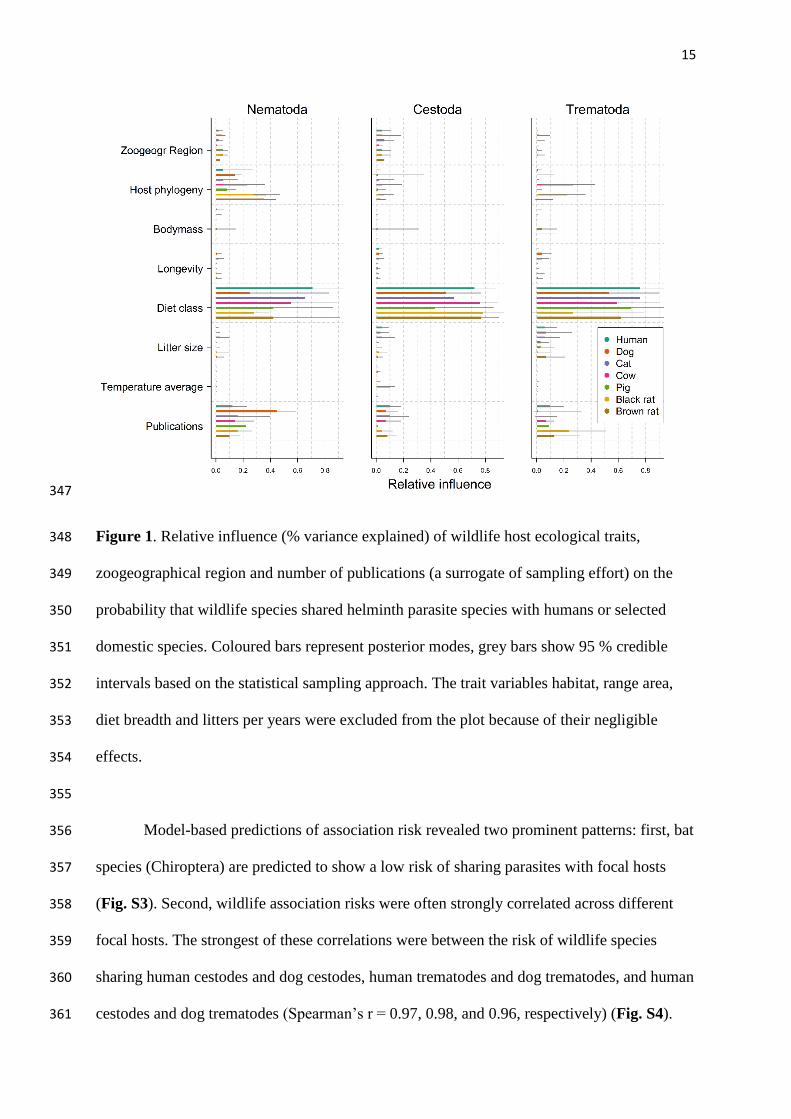
Diet class was the strongest predictor of sharing parasites with focal host species for all 328
combinations of parasites (Nematoda, Cestoda, Trematoda) and focal host species, explaining 329
25 – 78 % of variation in wildlife infestation risk (all 95 % credible intervals, CIs = 13 – 96 330
%) (Fig. 1). Wild insectivorous and omnivorous mammals were at significantly lower risk of 331
sharing parasites with humans than were herbivores and carnivores, a pattern that was also 332
true for other domestic host species (with a few exceptions; Fig. S1). Risks of wildlife 333
species sharing parasites with the focal species also differed across zoogeographical regions. 334
Overall, risks were relatively high in the Palaearctic region (Fig. S2), though some 335
combinations of parasite and domestic host species exhibited other informative 336
zoogeographical patterns. Wildlife had increased risk of sharing trematodes with cows and 337
black rats in the Neotropical region and increased risk of sharing nematodes with humans, 338
dogs and cats in the Nearctic region. In contrast, the risk for wildlife sharing cestodes with 339
focal host species was generally low in the Neotropical region (Fig. S2). Nevertheless, the 340
overall effect of zoogeographical region was weaker than the effect of diet class (Fig. 1). 341
Coefficient estimates for all other covariates are presented in Table S2; notably, various 342
coefficient estimates were significantly different from zero, though they explained much less 343
variance than diet and zoogeographical region. Bayesian p values ranged from 0.43 to 0.79 344
for the various models. 345
346
15
347
Figure 1. Relative influence (% variance explained) of wildlife host ecological traits, 348
zoogeographical region and number of publications (a surrogate of sampling effort) on the 349
probability that wildlife species shared helminth parasite species with humans or selected 350
domestic species. Coloured bars represent posterior modes, grey bars show 95 % credible 351
intervals based on the statistical sampling approach. The trait variables habitat, range area, 352
diet breadth and litters per years were excluded from the plot because of their negligible 353
effects. 354
355
Model-based predictions of association risk revealed two prominent patterns: first, bat 356
species (Chiroptera) are predicted to show a low risk of sharing parasites with focal hosts 357
(Fig. S3). Second, wildlife association risks were often strongly correlated across different 358
focal hosts. The strongest of these correlations were between the risk of wildlife species 359
sharing human cestodes and dog cestodes, human trematodes and dog trematodes, and human 360
cestodes and dog trematodes (Spearman’s r = 0.97, 0.98, and 0.96, respectively) (Fig. S4). 361
16
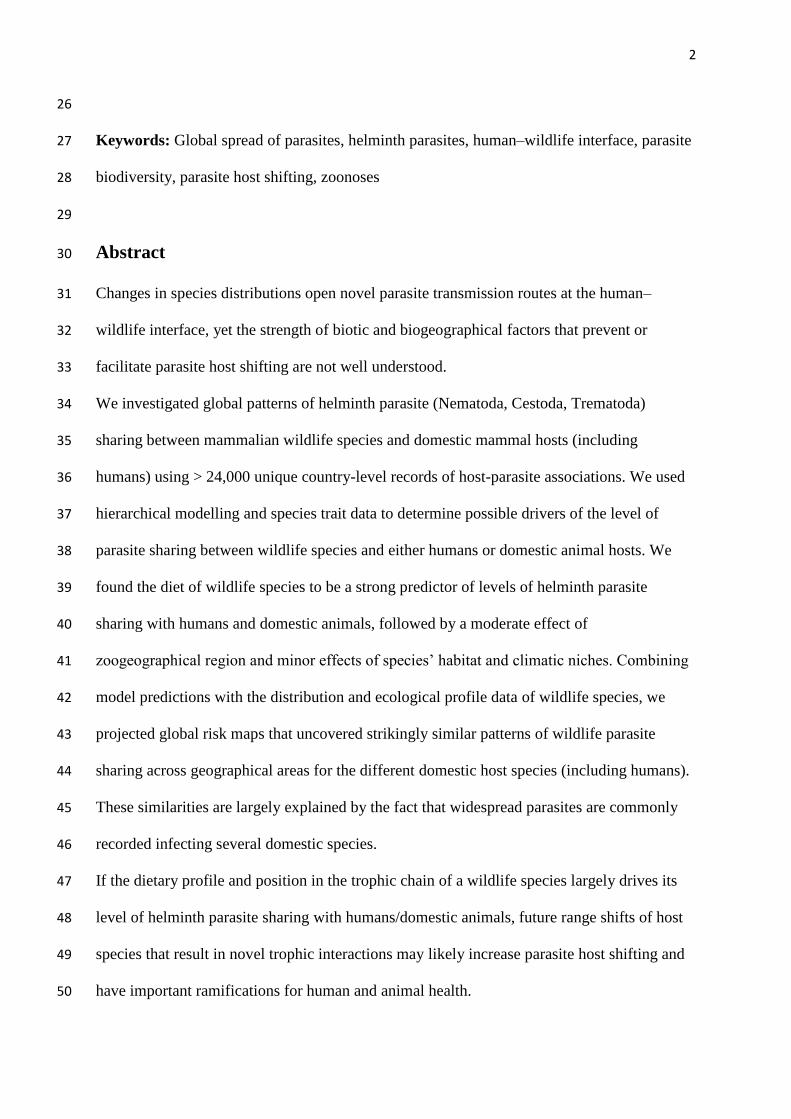
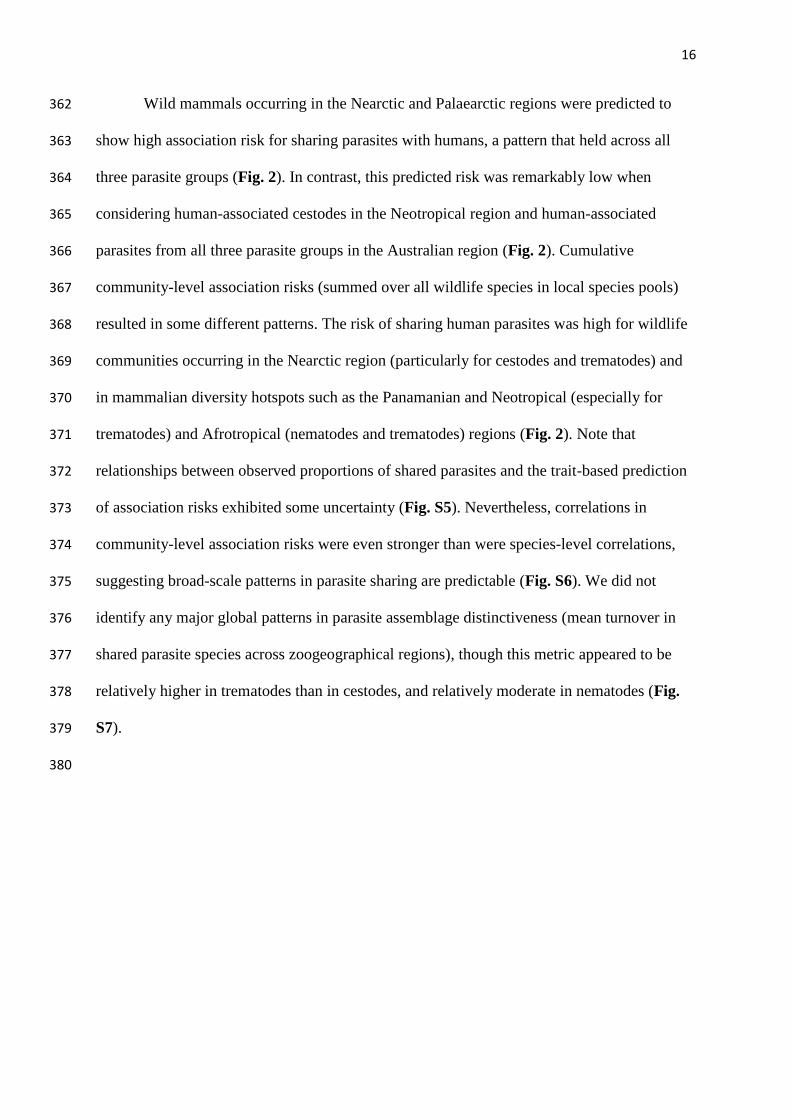
Wild mammals occurring in the Nearctic and Palaearctic regions were predicted to 362
show high association risk for sharing parasites with humans, a pattern that held across all 363
three parasite groups (Fig. 2). In contrast, this predicted risk was remarkably low when 364
considering human-associated cestodes in the Neotropical region and human-associated 365
parasites from all three parasite groups in the Australian region (Fig. 2). Cumulative 366
community-level association risks (summed over all wildlife species in local species pools) 367
resulted in some different patterns. The risk of sharing human parasites was high for wildlife 368
communities occurring in the Nearctic region (particularly for cestodes and trematodes) and 369
in mammalian diversity hotspots such as the Panamanian and Neotropical (especially for 370
trematodes) and Afrotropical (nematodes and trematodes) regions (Fig. 2). Note that 371
relationships between observed proportions of shared parasites and the trait-based prediction 372
of association risks exhibited some uncertainty (Fig. S5). Nevertheless, correlations in 373
community-level association risks were even stronger than were species-level correlations, 374
suggesting broad-scale patterns in parasite sharing are predictable (Fig. S6). We did not 375
identify any major global patterns in parasite assemblage distinctiveness (mean turnover in 376
shared parasite species across zoogeographical regions), though this metric appeared to be 377
relatively higher in trematodes than in cestodes, and relatively moderate in nematodes (Fig. 378
S7). 379
380
17
381
Figure 2. Predicted average (species-level) and cumulative (community-level) geographical 382
association risks for local wildlife assemblages sharing helminth parasites (Nematoda, 383
Cestoda, Trematoda) with humans. The risk of wildlife species sharing parasites with humans 384
were computed using data on host-parasite associations and ecological profiles for 1,345 385
wildlife species. Projections of model-based predictions on a global map are based on 386
computed wildlife species-level association risks for all extant mammals, rasterised at 10 km2 387
resolution and respective IUCN range maps. 388
389
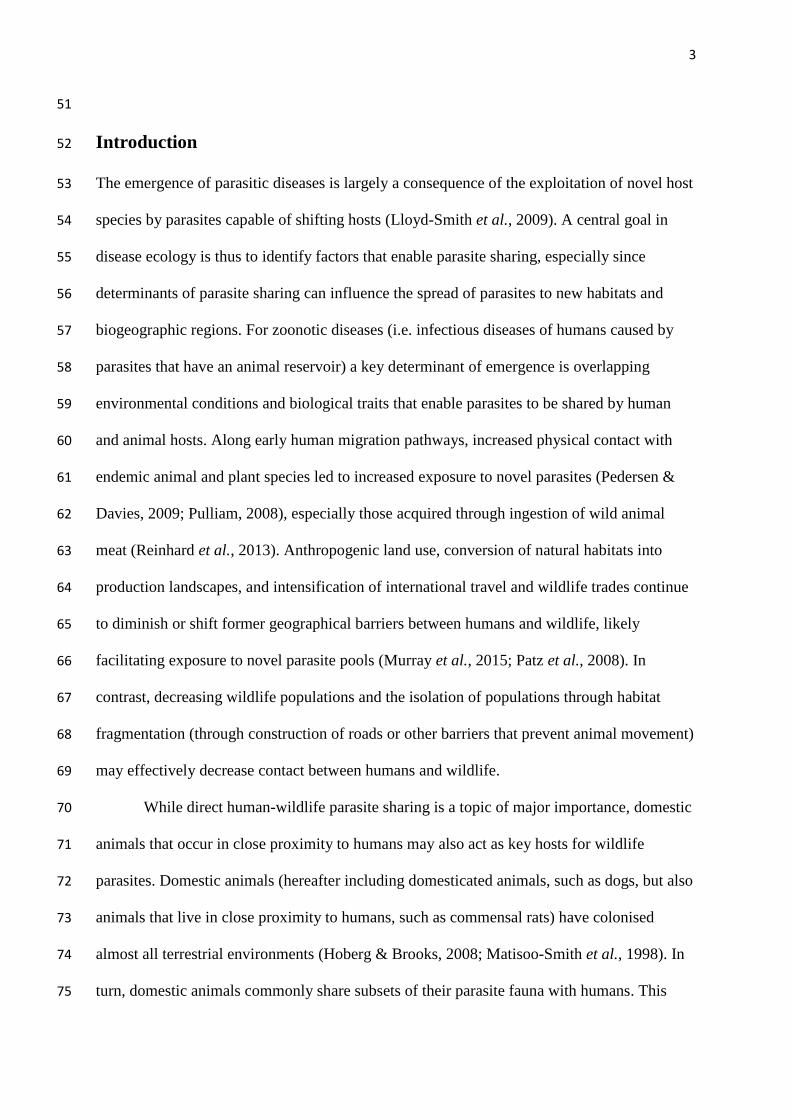
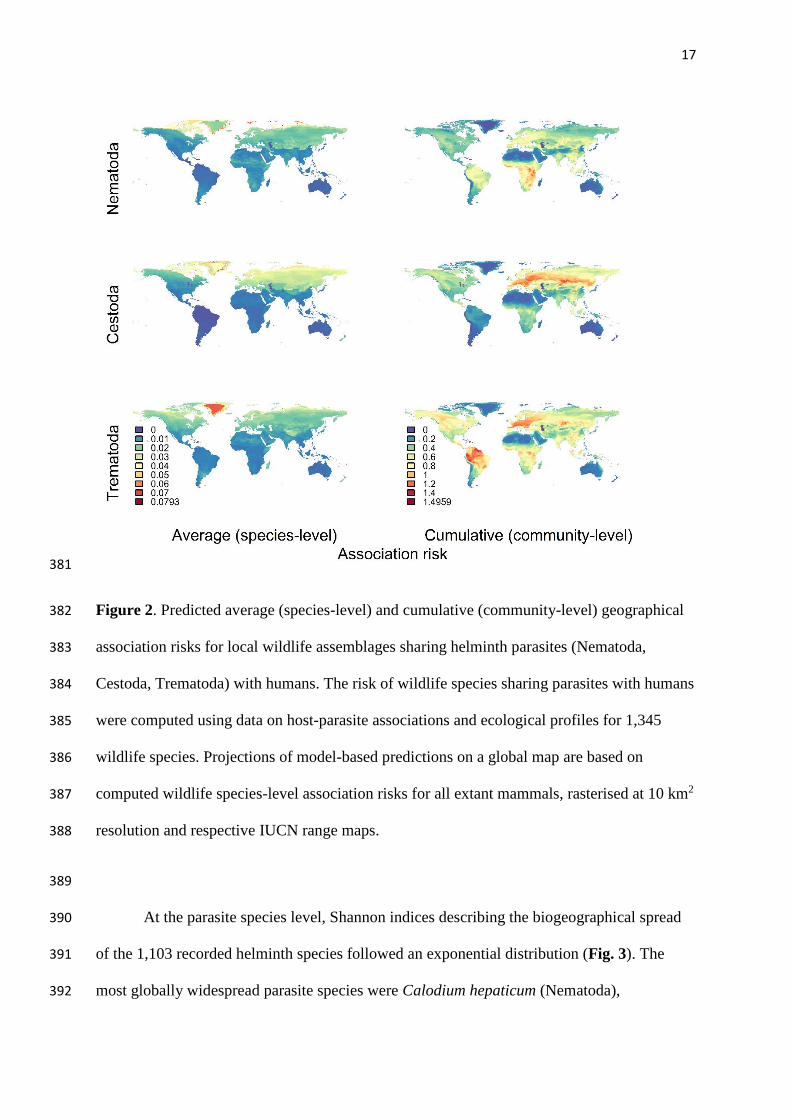
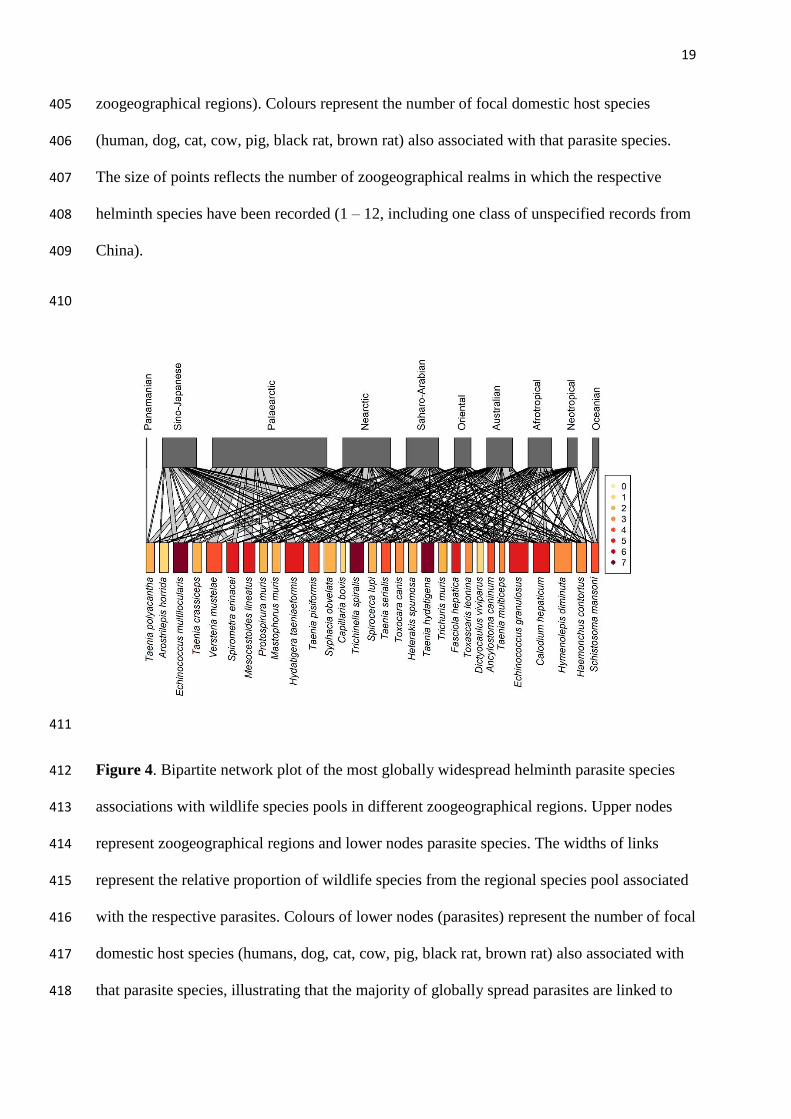
At the parasite species level, Shannon indices describing the biogeographical spread 390
of the 1,103 recorded helminth species followed an exponential distribution (Fig. 3). The 391
most globally widespread parasite species were Calodium hepaticum (Nematoda), 392
18
Echinococcus granulosus (Cestoda), E. multilocularis (Cestoda), Hydatigera taeniaeformis 393
(Cestoda) and Hymenolepis diminuta (Cestoda), all of which infected 50 – 73 wildlife species 394
and were recorded in at least three of the focal host species (Fig. 4). The correlation between 395
the index of parasite biogeographical spread and the total number of associated focal host 396
species, however, was only moderate (Spearman’s r = 0.5, p < 0.01). 397
398
399
400
Figure 3. Rank distribution plot of Shannon indices for 1,103 helminth parasite species 401
(Nematoda, Cestoda and Trematoda) recorded in domestic host species, indicating the 402
relative global spread and linkage to wildlife for each parasite species (Shannon indices are 403
based on the proportion of wildlife species associated with the parasites in different 404
19
zoogeographical regions). Colours represent the number of focal domestic host species 405
(human, dog, cat, cow, pig, black rat, brown rat) also associated with that parasite species. 406
The size of points reflects the number of zoogeographical realms in which the respective 407
helminth species have been recorded (1 – 12, including one class of unspecified records from 408
China). 409
410
411
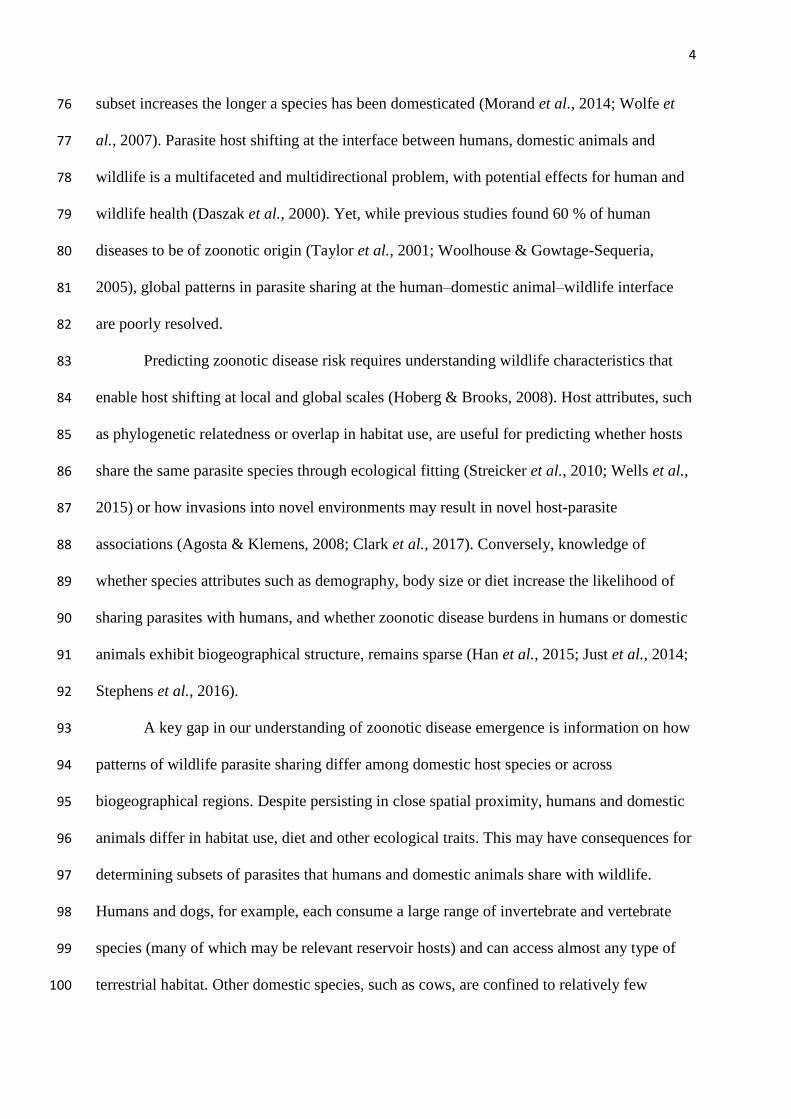
Figure 4. Bipartite network plot of the most globally widespread helminth parasite species 412
associations with wildlife species pools in different zoogeographical regions. Upper nodes 413
represent zoogeographical regions and lower nodes parasite species. The widths of links 414
represent the relative proportion of wildlife species from the regional species pool associated 415
with the respective parasites. Colours of lower nodes (parasites) represent the number of focal 416
domestic host species (humans, dog, cat, cow, pig, black rat, brown rat) also associated with 417
that parasite species, illustrating that the majority of globally spread parasites are linked to 418

20
multiple domestic host species. Widespread parasites species (n = 31) were identified as 419
those with the highest Shannon index scores, accounting for the associated proportions of 420
sampled wildlife species in different zoogeographical realms. Note the Madagascan region is 421
not shown, as no wildlife species were associated with the displayed parasites. 422
423
Discussion 424
Global biodiversity change will affect human and animal health in many ways, but potential 425
shifts in disease burden at the human–animal interface are largely unexplored (Myers et al., 426
2013), particularly at the macro-ecological scale (Stephens et al., 2016). We show that diet is 427
a key driver of the risk that wild mammal species share helminth parasites with humans. 428
Carnivores and herbivores, in particular, are at high risk of sharing parasites with humans, 429
while insectivores are generally at low risk. Relatively weaker effects of a wildlife species’ 430
climatic and habitat niches indicate that zoonotic parasite spread will not be contained if 431
contacts between wildlife and humans continue to increase. Crucially, these same patterns 432
hold when assessing the risk of wildlife sharing helminths with important domestic animals. 433
While parasite sharing is a multifaceted one-health issue, we show that decomposing risk of 434
parasite sharing based on species’ ecological and climatic niches is an important first step 435
towards predicting future parasite emergence. 436
437
Diet as a key driver of helminth parasite sharing 438
Our study focuses on terrestrial mammalian species, of which many interact in predator–prey 439
relationships. The completion of life cycles for some of the most globally widespread 440
helminths, such as Echinococcus spp. and Fasciola spp., which are also of significant health 441
concern (Garcia et al., 2007), depend on such trophic interactions among mammalian hosts. 442
Unlike microparasites (viruses, bacteria, protozoa, fungi), the majority of parasitic helminth 443
21
species do not replicate in the definitive vertebrate host, with many species requiring 444
transmission through a diversity of invertebrates to complete their life cycles. For wildlife 445
insectivores, the low risks of carrying domestic animal helminths found by our study suggest 446
there is a transmission disruption that prevents host shifting (e.g. if humans consume 447
insectivorous species such as bats or shrews, but these species do not in turn ingest 448
contaminated material from humans or other infected species). Alternatively, domestic 449
animals and insectivorous wildlife species may not adequately share resources, such as 450
invertebrate food items or particular habitats, which would enable parasite transmission. 451
The majority of parasitic nematode species undergo free-living life-history stages in the 452
environment; some are transmitted by direct skin penetration into the definite host, whereas 453
others are transmitted through trophic interactions that may involve the ingestion of 454
intermediate invertebrate hosts (Anderson, 2000). This environmental transmission may play 455
an important role in governing nematode host sharing. Wild and domestic ungulate species, 456
for example, may share considerable proportions of their nematode fauna through grazing on 457
common grounds (Walker & Morgan, 2014). Importantly, although one might expect host-458
shifting of parasites with free-living stages to be susceptible to environmental conditions, our 459
results suggest host sharing is more strongly linked to the diet strategy of the host species. 460
Focusing just on helminth parasites, we found notable differences compared to previous 461
studies examining zoonotic disease risk and reservoir potential for wildlife species. A recent 462
study on the zoonotic reservoir potential of rodents for both helminths and microparasites 463
(viruses, bacteria, protozoa, fungi), for example, predicted that the rather fast-paced life 464
history strategies of rodents should be linked to a higher reservoir potential for zoonotic 465
diseases (Han et al., 2015). Furthermore, Luis et al. (2013) reported both bats and rodents to 466
be major natural reservoirs for viral zoonoses. In contrast, we predicted the majority of bat 467
species are less likely to share parasites with humans and domestic species (see Fig. S4). 468
22
Different mechanisms may apply in relation to how helminths and microparasites are spread 469
through multi-species systems at the human–domestic animal–wildlife interface, warranting 470
future research. 471
472
Roles of domestic animal hosts at the human – wildlife interface 473
Consistent with our expectations, we found strong correlations between the risk that wildlife 474
will share cestodes with human and the risk that wildlife will share cestodes with dogs. 475
Previous work has suggested that dogs and humans share a considerable number of parasites 476
(Morand et al., 2014). We extend these findings to show that, concomitant with man’s long 477
association with dogs and the collective exploitation of environments, both humans and dogs 478
share a considerable number of their helminth parasites with wildlife. However, this pattern is 479
not restricted to dogs, but can be also seen in patterns of parasite sharing for various domestic 480
species at a global scale. We found generally strong correlations in the spatially projected 481
wildlife associations risks – both at the species-level and the community-level – across 482
domestic host species (Fig. S6, S7). This emphasises, that for helminth parasites, the human–483
wildlife interface is not independent of domestic species. 484
Our findings support previous calls for multi-species and community-level 485
approaches to understand parasite and disease spread (Fenton et al., 2015; Johnson et al., 486
2015; Viana et al., 2014). Notably, we provide a starting point for explaining how 487
overlapping distributions and contact patterns between humans, domestic animals and 488
wildlife may impact zoonotic helminth spread at a global scale. Based on our results, future 489
geographical spread of helminth parasites will likely be facilitated through infection of 490
multiple domestic hosts (and possibly also invasive mammal species) that show similar 491
trophic relationships. 492
We demonstrate clear zoogeographical structure in predicted risks that wildlife will 493
23
share parasites with humans and domestic host species. The highest risk is consistently found 494
in the Palaearctic and Nearctic regions. Similar global patterns have been reported for rodent-495
borne zoonotic diseases, for example by Han et al. (2015). In previous work, we found the 496
two commensal rat species included in our study generally share helminth parasites with 497
wildlife species of least conservation concern (Wells et al., 2015), which are likely those 498
species well adapted to anthropogenically modified landscapes. Possibly, strong adaptation to 499
anthropogenically modified landscapes by many wildlife species in the Palaearctic and 500
Nearctic regions, in combination with relevant ecological profiles, could contribute to the 501
strong geographical gradients in risks of parasite sharing. 502
Unfortunately, it is very difficult to discern historical host shifts by parasites, and thus 503
any possible spill-over and spill-back events, unless adequate molecular data for ancestral 504
state reconstruction are available (Hoberg et al., 2001; Terefe et al., 2014). Our analysis does 505
not determine whether wildlife hosts have acquired parasites from humans and domestic 506
animals, or vice versa. This is especially challenging for humans and domestic species, which 507
hardly exist in isolation from each other. 508
509
Future parasite spread through mechanisms of parasite sharing 510
Our finding that trophic interactions are important for interspecific helminth sharing 511
indicates the need for quantitative approaches that predict whether potential host species may 512
interact locally in predator-prey relationships. Our predictions can foster a better 513
understanding of how future domestic animal and wildlife assemblages might impact 514
potential parasite host shifting through ecological fitting and changed biotic interactions (e.g. 515
predator-prey relationships). Zoonotic disease risk caused by helminths, for example, could 516
then be refined to sophisticated measures that take multi-species networks of trophic 517
interactions into account, rather than only considering the number of wildlife species in local 518
24
assemblages (Karesh et al., 2005). Given the variable sensitivities among wildlife species to 519
climate change, such work could also account for shifting trophic interactions among 520
potential parasite hosts through regionally altered community assemblages (Lurgi et al., 521
2012). 522
The wildlife and domestic animal trade, together with species invasions and shifting 523
species ranges, will continue to mix formerly disjunctive host species assemblages and cause 524
biotic homogenisation (Hobbs et al., 2009). However, future climate-induced range shifts, 525
decreasing population sizes or newly arising barriers that prevent wildlife movement can also 526
decrease contact intensity between humans and some wildlife species. This may serve to 527
inhibit the sharing of parasites. We nevertheless believe that very few wildlife species will be 528
sufficiently ‘left alone’ by humans to prevent parasite exchange unless such wildlife species 529
are extremely rare. 530
531
Host-parasite interactions and sampling bias 532
Based on records of presence-only host-parasite associations, we consider the results of our 533
study to be indicative for unravelling general patterns, rather than for providing precise 534
predictions. Several challenges are associated with studying species interactions and macro-535
ecological patterns from presence-only data. First, it is well known from sampling and 536
probability theory that parasites are likely overlooked in host species sampled with relatively 537
low intensity (Little, 2004). This will be especially true when low parasite prevalence 538
prevents detection in a limited number of examined host individuals. Helminth species 539
richness in freshwater fish, for example, was found to be highly correlated with the number 540
of individuals examined per host species (Walther et al., 1995). An obstacle to accounting for 541
this sampling bias is that the true sampling effort, that is the number individuals per host 542
species examined, was not available for our study; this would have enabled us to better 543
25
correct for sampling bias when making inferences about host-parasite associations (Wells et 544
al., 2013). Moreover, spatial bias, both in the species sampled and in species–species 545
interactions, is generally known to strongly bias inference of macro-ecological patterns 546
(Boakes et al., 2010; Meyer et al., 2015). Bias may be also linked to parasite size, if large 547
species are more likely to be detected. Our trait-based approach may leverage (to some 548
extent) poorly sampled species and we used the number of publications for each host species 549
as a simplified proxy of sampling bias. Limitations in the currently available data on host-550
parasite associations and infectious disease prevent concise mapping of the majority of 551
parasites and diseases (Hay et al., 2013). Considering further sampling bias – as far as 552
relevant data are available – could be of especial interest for inferring large-scale global 553
patterns. The proportion of wildlife species examined for parasites, for example, exhibits 554
considerable gradients across zoogeographical regions (Fig. S8). This warrants future 555
research and a critical revision of whether the particularly strong linkage of human parasites 556
to wildlife in temperate Europe and North America, as found in this study and others (Han et 557
al., 2015; Murray et al., 2015), is a true biological phenomenon or a consequence of uneven 558
survey efforts. Moreover, improving the spatial resolution to understand whether host-559
parasite interactions and disease emergence are constrained to only those parts of a species 560
range where enabling conditions are met would improve predictions and our understanding of 561
how natural barriers may prevent disease emergence. This is of particular importance as, 562
ultimately, ecological and epidemiological dynamics are driving the interaction between 563
hosts and parasites and possible parasite spill-over among hosts (Plowright et al., 2017). 564
565
Anticipating and mitigating future changes in parasite host shifting at the human– 566
wildlife interface may require quantitative approaches that consider novel transmission 567
pathways. These shifting pathways could be caused by the ongoing decline and/or extinction 568
26
of native species (Schipper et al., 2008), the introduction of invasive species (Clavero & 569
García-Berthou, 2005) and/or the increasing density of domestic livestock species (Jones et 570
al., 2013). Novel trophic interactions at the human–wildlife interface may also be largely 571
driven by human behaviour, such as expanding the menu of consumed animal species, or the 572
exposure of domestic species to potentially contaminated food waste (Macpherson, 2005). 573
Disentangling the roles of trophic and other biotic interactions versus environmental 574
conditions in driving parasite host sharing will improve public and wildlife health measures. 575
576
Acknowledgements 577
We are grateful to the Natural History Museum, London, for access to records of host-578
parasite associations and for making these data publicly available. We thank three 579
anonymous reviewers and the editor for comments that considerably improved the paper. 580
581
REFERENCES 582
Agosta SJ, Klemens JA (2008) Ecological fitting by phenotypically flexible genotypes: 583
implications for species associations, community assembly and evolution. Ecology 584
Letters, 11, 1123-1134. 585
Anderson RC (2000) Nematode parasites of vertebrates: their development and transmission, 586
Wallingford, Oxon, U.K., CABI Publishing. 587
Bininda-Emonds ORP, Cardillo M, Jones KE et al. (2007) The delayed rise of present-day 588
mammals. Nature, 446, 507-512. 589
Boakes EH, Mcgowan PJK, Fuller RA, Chang-Qing D, Clark NE, O'Connor K, Mace GM 590
(2010) Distorted views of biodiversity: spatial and temporal bias in species 591
occurrence data. Plos Biology, 8, e1000385. 592
Clark NJ, Clegg SM, Sam K, Goulding W, Koane B, Wells K (2017) Climate, host 593
27
phylogeny and the connectivity of host communities govern regional parasite 594
assembly. Diversity and Distributions, doi: 10.1111/ddi.12661. 595
Clavero M, García-Berthou E (2005) Invasive species are a leading cause of animal 596
extinctions. Trends in Ecology and Evolution, 20, 110. 597
Crompton DWT (1999) How much human helminthiasis is there in the world? Journal of 598
Parasitology, 85, 397-403. 599
Daszak P, Cunningham AA, Hyatt AD (2000) Emerging infectious diseases of wildlife -600
threats to biodiversity and human health. Science, 287, 443-449. 601
Elith J, Leathwick JR, Hastie T (2008) A working guide to boosted regression trees. Journal 602
of Animal Ecology, 77, 802-813. 603
Fenton A, Streicker DG, Petchey OL, Pedersen AB (2015) Are all hosts created equal? 604
Partitioning host species contributions to parasite persistence in multihost 605
communities. The American Naturalist, 186, 610-622. 606
Garcia HH, Moro PL, Schantz PM (2007) Zoonotic helminth infections of humans: 607
echinococcosis, cysticercosis and fascioliasis. Current Opinion in Infectious Diseases, 608
20, 489-494. 609
Gelman A, Meng XL, Stern H (1996) Posterior predictive assessment of model fitness via 610
realized discrepancies. Statistica Sinica, 6, 733-760. 611
Gibson DI, Bray RA (1994) The evolutionary expansion and host-parasite relationships of the 612
Digenea. International Journal for Parasitology, 24, 1213-1226. 613
Gibson DI, Bray RA, Harris EA (2005) Host-parasite database of the Natural History 614
Museum, London. pp Page, Natural History Museum. 615
Gibson DI, Bray RA, Hunt D et al. (2014) Fauna Europaea: helminths (animal parasitic). 616
Biodiversity Data Journal, 2, e1060. 617
Han BA, Schmidt JP, Bowden SE, Drake JM (2015) Rodent reservoirs of future zoonotic 618
28
diseases. Proceedings of the National Academy of Sciences, 112, 7039-7044. 619
Hay SI, Battle KE, Pigott DM et al. (2013) Global mapping of infectious disease. 620
Philosophical Transactions of the Royal Society B-Biological Sciences, 368, 0120250. 621
Hobbs RJ, Higgs E, Harris JA (2009) Novel ecosystems: implications for conservation and 622
restoration. Trends in Ecology and Evolution, 24, 599-605. 623
Hoberg EP, Alkire NL, Queiroz AD, Jones A (2001) Out of Africa: origins of the Taenia 624
tapeworms in humans. Proceedings of the Royal Society of London B: Biological 625
Sciences, 268, 781-787. 626
Hoberg EP, Brooks DR (2008) A macroevolutionary mosaic: episodic host-switching, 627
geographical colonization and diversification in complex host–parasite systems. 628
Journal of Biogeography, 35, 1533-1550. 629
Holt BG, Lessard J-P, Borregaard MK et al. (2013) An update of Wallace’s zoogeographic 630
regions of the world. Science, 339, 74-78. 631
Johnson PTJ, Ostfeld RS, Keesing F (2015) Frontiers in research on biodiversity and disease. 632
Ecology Letters, 18, 1119-1133. 633
Jones BA, Grace D, Kock R et al. (2013) Zoonosis emergence linked to agricultural 634
intensification and environmental change. Proceedings of the National Academy of 635
Sciences, 110, 8399-8404. 636
Jones KE, Bielby J, Cardillo M et al. (2009) PanTHERIA: a species-level database of life 637
history, ecology, and geography of extant and recently extinct mammals. Ecology, 90, 638
2648-2648. 639
Just MG, Norton JF, Traud AL et al. (2014) Global biogeographic regions in a human-640
dominated world: the case of human diseases. Ecosphere, 5, 1-21. 641
Karesh WB, Cook RA, Bennett EL, Newcomb J (2005) Wildlife trade and global disease 642
emergence. Emerging Infectious Diseases, 11, 1000-1002. 643

29
Kraft Nathan jB, Cornwell William k, Webb Campbell o, Ackerly David d (2007) Trait 644
evolution, community assembly, and the phylogenetic structure of ecological 645
communities. The American Naturalist, 170, 271-283. 646
Lennon JJ, Koleff P, Greenwood JJD, Gaston KJ (2001) The geographical structure of British 647
bird distributions: diversity, spatial turnover and scale. Journal of Animal Ecology, 648
70, 966-979. 649
Little RJ (2004) To model or not to model? Competing modes of inference for finite 650
population sampling. Journal of the American Statistical Association, 99, 546-556. 651
Lloyd-Smith JO, George D, Pepin KM et al. (2009) Epidemic dynamics at the human-animal 652
interface. Science, 326, 1362-1367. 653
Lunn D, Jackson C, Best N, Thomas A, Spiegelhalter D (2012) The BUGS Book - A practical 654
introduction to Bayesian analysis, London, CRC Press / Chapman and Hall. 655
Lurgi M, López BC, Montoya JM (2012) Novel communities from climate change. 656
Philosophical Transactions of the Royal Society B-Biological Sciences, 367, 2913-657
2922. 658
Macpherson CNL (2005) Human behaviour and the epidemiology of parasitic zoonoses. 659
International Journal for Parasitology, 35, 1319-1331. 660
Magurran AE (ed) (2004) Measuring biological diversity, Oxford, Blackwell. 661
Matisoo-Smith, E. , Roberts, R. M., Irwin, G. J. , Allen, J. S., Penny, D. , Lambert, D. M. 662
(1998) Patterns of prehistoric human mobility in Polynesia indicated by mtDNA from 663
the Pacific rat. Proceedings of the National Academy of Sciences, 95, 15145-15150. 664
Meyer C, Kreft H, Guralnick R, Jetz W (2015) Global priorities for an effective information 665
basis of biodiversity distributions. Nature Communications, 6, 8221. 666
Morand S, Mcintyre KM, Baylis M (2014) Domesticated animals and human infectious 667
diseases of zoonotic origins: domestication time matters. Infection, Genetics and 668

30
Evolution, 24, 76-81. 669
Murray KA, Preston N, Allen T, Zambrana-Torrelio C, Hosseini PR, Daszak P (2015) Global 670
biogeography of human infectious diseases. Proceedings of the National Academy of 671
Sciences, 112, 12746-12751. 672
Myers SS, Gaffikin L, Golden CD et al. (2013) Human health impacts of ecosystem 673
alteration. Proceedings of the National Academy of Sciences, 110, 18753-18760. 674
Paradis E, Claude J, Strimmer K (2004) APE: Analyses of phylogenetics and evolution in R 675
language. Bioinformatics, 20, 289-290. 676
Patz JA, Olson SH, Uejio CK, Gibbs HK (2008) Disease emergence from global climate and 677
land use change. Medical Clinics of North America, 92, 1473–1491. 678
Pedersen AB, Davies TJ (2009) Cross-species pathogen transmission and disease emergence 679
in primates. Ecohealth, 6, 496-508. 680
Plowright RK, Parrish CR, McCallum H, Hudson PJ, Ko AI, Graham AL, Lloyd-Smith JO 681
(2017) Pathways to zoonotic spillover. Nature Review Microbiology, doi: 682
10.1038/nrmicro.2017.45. 683
Pulliam JRC (2008) Viral host jumps: moving toward a predictive framework. Ecohealth, 5, 684
80-91. 685
R Development Core Team (2017) R: A language and environment for statistical computing, 686
Vienna, Austria, R Foundation for Statistical Computing. 687
Reinhard KJ, Ferreira LF, Bouchet F et al. (2013) Food, parasites, and epidemiological 688
transitions: a broad perspective. International Journal of Paleopathology, 3, 150-157. 689
Schipper J, Chanson JS, Chiozza F et al. (2008) The status of the world's land and marine 690
mammals: diversity, threat, and knowledge. Science, 322, 225-230. 691
Stephens PR, Altizer S, Smith KF et al. (2016) The macroecology of infectious diseases: a 692
new perspective on global-scale drivers of pathogen distributions and impacts. 693
31
Ecology Letters, 19, 1159–1171. 694
Streicker DG, Turmelle AS, Vonhof MJ, Kuzmin IV, Mccracken GF, Rupprecht CE (2010) 695
Host phylogeny constrains cross-species emergence and establishment of rabies virus 696
in bats. Science, 329, 676-679. 697
Taylor LH, Latham SM, Woolhouse MEJ (2001) Risk factors for human disease emergence. 698
Philosophical Transactions of the Royal Society of London B Biological Sciences, 699
356, 983-989. 700
Terefe Y, Hailemariam Z, Menkir S et al. (2014) Phylogenetic characterisation of Taenia 701
tapeworms in spotted hyenas and reconsideration of the “Out of Africa” hypothesis of 702
Taenia in humans. International Journal for Parasitology, 44, 533-541. 703
Viana M, Mancy R, Biek R, Cleaveland S, Cross PC, Lloyd-Smith JO, Haydon DT (2014) 704
Assembling evidence for identifying reservoirs of infection. Trends in Ecology & 705
Evolution, 29, 270-279. 706
Walker JG, Morgan ER (2014) Generalists at the interface: nematode transmission between 707
wild and domestic ungulates. International Journal for Parasitology: Parasites and 708
Wildlife, 3, 242-250. 709
Wallace AR (1876) The geographical distributions of animals, with a study of the relations of 710
living and extinct faunas as elucidating the past changes of the Earth’s surface, 711
London, Macmillan. 712
Walther BA, Cotgreave P, Price RD, Gregory RD, Clayton DH (1995) Sampling effort and 713
parasite species richness. Parasitology Today, 11, 306-310. 714
Wells K, O'Hara RB, Morand S, Lessard J-P, Ribas A (2015) The importance of parasite 715
geography and spillover effects for global patterns of host–parasite associations in 716
two invasive species. Diversity and Distributions, 21, 477-486. 717
Wells K, O’Hara RB, Pfeiffer M, Lakim MB, Petney TN, Durden LA (2013) Inferring host 718
32
specificity and network formation through agent-based models: tick–mammal 719
interactions in Borneo. Oecologia, 172, 307-316. 720
Wilman H, Belmaker J, Simpson J, De La Rosa C, Rivadeneira MM, Jetz W (2014) 721
EltonTraits 1.0: species-level foraging attributes of the world's birds and mammals. 722
Ecology, 95, 2027-2027. 723
Wolfe ND, Dunavan CP, Diamond J (2007) Origins of major human infectious diseases. 724
Nature, 447, 279-283. 725
Woolhouse MEJ, Gowtage-Sequeria S (2005) Host range and emerging and reemerging 726
pathogens. Emerging Infectious Diseases, 11, 1842-1847. 727