go to file -> properties -> and enter 'title'dpw.lacounty.gov/wmd/irwmp/docs/2014...
TRANSCRIPT

Appendices
L. Upper Los Angeles River Subregional Plan
APPENDIX L

This page intentionally left blank.

Upper Los Angeles River Subregional Plan
Final
Prepared by:
In Association with:
October 2013

This page intentionally left blank.

GLAC IRWM Upper Los Angeles River Subregional Plan
1 Background and Purpose of Subregional Plan The Upper Los Angeles Subregional plan is one of five Subregional plans that make up the Greater Los Angeles County (GLAC) Integrated Regional Water Management (IRWM) Plan. This Subregional plan outlines Upper Los Angeles’s physical setting, sources of water supply, water quality, environmental resources, planning objectives and targets, and partnership and multi-benefit opportunities. The purpose of the Subregional Plan is to outline its expected contribution to meeting the GLAC regional planning goals, objective, and targets.
2 Upper Los Angeles Description 2.1 Physical Setting The Upper Los Angeles River Subregion of the GLAC Region is located in the northwest portion of the Los Angeles County urbanized area. The Upper Los Angeles River Watershed begins in the surrounding mountains (San Gabriel Mountains, Santa Susana Mountains, Simi Hills and Santa Monica Mountains) and runs through the San Fernando Valley on its way south to the Pacific Ocean. Development is concentrated in the interior valleys and the surrounding foothills. Groundwater basins and runoff from the surrounding mountains provide local water supplies, although groundwater contamination from industrial sources and prior land uses poses a significant challenge in some locations. The large expanses of urban and suburban development on the valley floors are home to approximately 2.3 million residents, with projections estimating population increasing to 2.6 million residents by 2035 (SCAG, 2010). Most of the major river and stream channels on the valley floors have been subject to channelization due to flood issues in the past, which prevents percolation.
Political Boundaries
The Subregion consists of 8 cities and unincorporated areas of Los Angeles County. Figure 2 depicts the county and city boundaries of the Upper Los Angeles River Subregion.
Climate, Temperature, and Rainfall
The Upper Los Angeles River Subregion is within a Mediterranean climate zone. Summers are typically dry and hot while winters are wet and cool. Precipitation typically falls in a few major storm events between November and March. Precipitation in the Upper Los Angeles River Subregion averages 19 inches per year, though the foothills and mountains receive considerably more rain than valleys, causing considerable runoff and flooding potential.
Geography and Geomorphology
The geography of the Upper Los Angeles River Subregion can generally be divided into three distinct types: inland valleys, foothills that generally surround the valley, and the surrounding mountains. The San Gabriel Mountains, Santa Susana Mountains, Simi Hills and Santa Monica Mountains are part of the
Figure 1: GLAC Subregional and Watershed Boundaries
October 2013 1

GLAC IRWM Upper Los Angeles River Subregional Plan
Transverse Ranges, which extend 350 miles east to west from the Eagle Mountains in San Bernardino County to the Pacific Ocean. The elevation of the San Gabriel Mountains (in the northeastern portion of the Subregion) ranges from sea level to over 10,000 feet and separates the Los Angeles basin from the Mojave Desert. The Santa Susana Mountains are located in the northwestern portion of the Subregion, reaching a height of 3,747 feet, and separates the San Fernando and Santa Clarita Valleys. The Santa Monica Mountains lie to the south of the Subregion and separate the San Fernando Valley and the Los Angeles Basin. The Simi Hills form the western border of the Subregion. The foothills reach 3,000 to 4,000 feet before rising rapidly into the surrounding mountains. Below these elevations are the valley areas.
The San Gabriel, Santa Monica and Santa Susana Mountains, as well as Simi Hills are young mountains, geologically speaking, and continue to rise at a rate of one-quarter to three-quarters of an inch per year. Because of this instability, they are also eroding at a rapid rate. Alluvial deposits of sand, gravel, clay and silt in the coastal plain are thousands of feet thick in some areas, due in part to the erosive nature of the surrounding mountains. The Subregion is extensively faulted, with the San Andreas Fault bordering the north side and the Sierra Madre–Cucamonga fault zone on the south side of the San Gabriel Mountains and Santa Susana Mountains. The Santa Monica Mountains Thrust Fault runs through the Santa Monica Mountains.
Petroleum source rock found within the Subregion is a well-known source of potential water quality concerns. The Modelo Formation forms parts of the northern, western and southern slopes of the San Fernando Valley. The Modelo Formation is a depositionally distinct subset of the Monterey Formation, California’s primary petroleum source rock. The Los Angeles River cuts through the Puente Formation, also a petroleum source rock, by Elysian Park. Both of these formations contribute high concentrations of solutes to runoff, includes metals, sulfates, chloride, phosphorus and selenium.1
1 U.S. Geological Survey, 2002. Hazardous trace elements in petroleum source rock: The Monterey Formation. http://geomaps.wr.usgs.gov/env/monterey.html
October 2013 2

GLAC IRWM Upper Los Angeles River Subregional Plan
Figure 2: Cities and Communities in the ULAR Subregion
2.2 Watersheds and Water Systems Watersheds
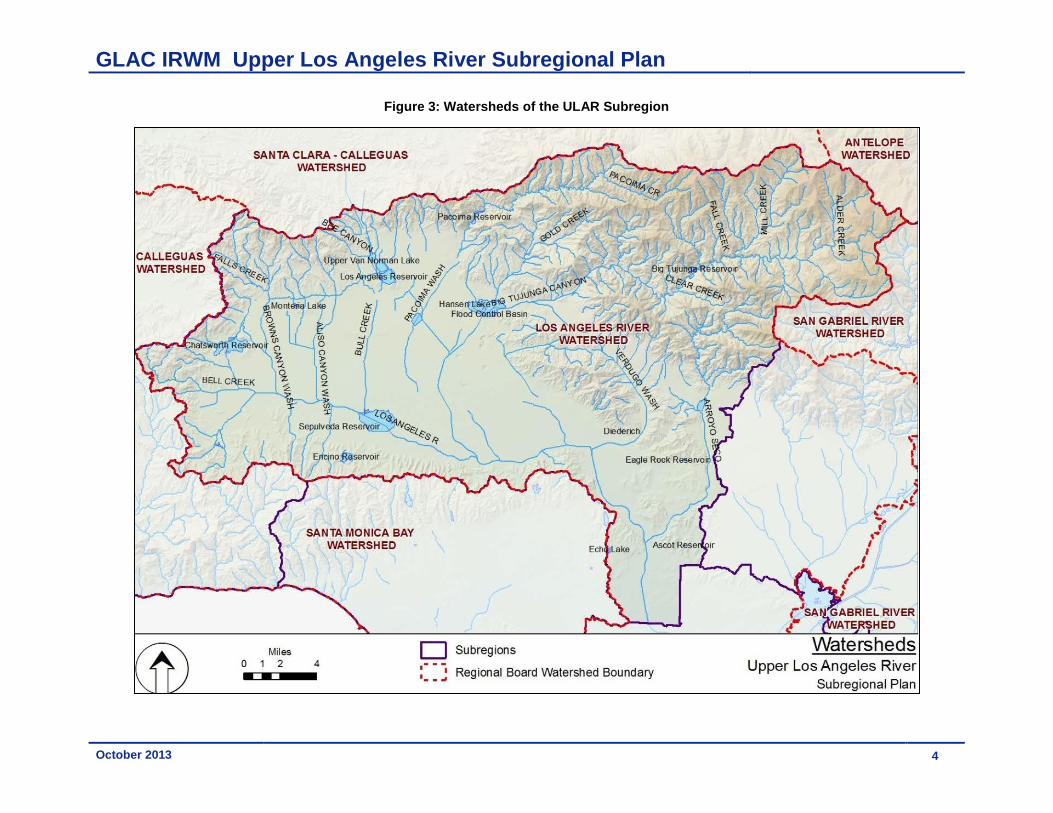
The Upper Los Angeles River Subregion consists of the Upper Los Angeles River watershed (Figure 3). The watershed begins in the surrounding mountains, and stretches across the San Fernando Valley, then down to the Pacific Ocean. The portion of the watershed which this Subregional plan is concerned with is the upper watershed, upstream of the coastal plain, at the Glendale Narrows. The Upper Los Angeles River watershed is made up of a number of tributaries in addition to the main Los Angeles River channel, including: Arroyo Calabasas, Bell Creek, Aliso Creek, Pacoima Wash, Tujunga Wash, Big Tujunga Creek, Verdugo Wash, and the Arroyo Seco. The main Los Angeles River begins at the confluence of Bell Creek and Calabasas Creek in Canoga Park in the City of Los Angeles, with its tributaries running south to meet it. There is very little natural flow within the Los Angeles River throughout most of the year. The tertiary treated recycled wastewater of the wastewater treatment plants in the Subregion provide the baseflow seen during most of the year. During storm events, a large amount of runoff can be conveyed through the flood control infrastructure discussed in the next section.
In addition, though Rio Hondo isn’t a part of the Subregion, it is typically included as a part of the Upper Los Angeles River watershed. The Rio Hondo lies to the east of the Subregion and captures runoff from the San Gabriel Valley, running southwest through the Whittier narrows then through urban areas to its confluence with the Los Angeles River.
October 2013 3
GLAC IRWM Upper Los Angeles River Subregional Plan
Figure 3: Watersheds of the ULAR Subregion
October 2013 4

GLAC IRWM Upper Los Angeles River Subregional Plan
Flood Management and Infrastructure
Flood management is important to protect human lives and property, particularly in the surrounding mountain regions where, historically, flooding and debris flows have been an issue due to wildfires and changes to the natural landscape. The Los Angeles County Flood Control District, with the Army Corps of Engineers, constructed, manages and maintains the Subregion’s flood infrastructure, such as debris basins, storm drains, culverts, dams, reservoirs, spreading basins, and flood control channels (Figure 6).
The Subregion’s dams and reservoirs often operate secondarily as water conservation facilities. The major flood control reservoirs within the Subregion include the Hansen, Lopez and Sepulveda Reservoirs. Many tributary stream channels to the Los Angeles River have concrete banks and bottoms due to frequent and historical flooding. This added imperviousness has reduced the amount of permeable acreage and recharge to the groundwater basin. A number of in-stream and off-stream groundwater replenishment facilities are in place to attempt to help offset the impact of the flood control features.
Water Suppliers and Infrastructure
The water suppliers in the Subregion can be divided into wholesalers and retailers. Wholesalers (Figure 4) provide imported water and/or recycled water and to other agencies, while retailers (Figure 5) sell water to end users. These suppliers use a combination of imported water, recycled water, and groundwater to serve potable and non-potable demand in their service areas. Each of these major suppliers has written a 2010 Urban Water Management Plan (UWMP) to estimate future water supply demand and availability, and which were utilized in the estimation of supplies described later in this plan.
October 2013 5

GLAC IRWM Upper Los Angeles River Subregional Plan
Figure 4: Wholesale Water Suppliers
October 2013 6

GLAC IRWM Upper Los Angeles River Subregional Plan
Figure 5: Retail Water Suppliers
October 2013 7

GLAC IRWM Upper Los Angeles River Subregional Plan
2.3 Sources of Water Supply The Upper Los Angeles River Subregion depends primarily on a combination of groundwater and imported water to meet its water demands. Local water supplies include surface water, recycled water, and groundwater. Imported water is provided by Metropolitan Water District of Southern California (MWDSC) through the California State Water Project (SWP) and the Colorado River Aqueduct, and the City of Los Angeles through the Los Angeles Aqueduct. MWDSC calculates that it can reliably deliver water under not only normal conditions but under multiple dry year conditions. Imported water provided through the Los Angeles Aqueduct has decreased over time due to the need for environmental mitigation in the Owens Valley area, but the City of Los Angeles predicts that deliveries will be sufficient to meet demand in conjunction with Los Angeles’s other supplies. Recycled water is provided by the Sanitation Districts of Los Angeles County, the City of Los Angeles, and Las Virgenes MWD.
Sources of supply vary throughout the Subregion, as shown in Table 1. These supplyies are based on numbers reported in the 2010 Urban Water Mangement Plans (UWMPs) for Glendale, Burbank, Pasadena, Los Angeles, Las Virgenes MWD, Calleguas MWD and Foothill MWD. These water suppliers were chosen as their service areas cover a majority of the Subregion.
This table was developed based on 2010 Urban Water Management Plans (UWMPs) whose service areas cover a majority of the Subregion. These agencies include:
• City of Los Angeles (portion within Subregion) • City of Glendale • City of Burbank • City of Pasadena • Las Virgenes MWD (portion within Subregion) • Foothill MWD (portion within Subregion)
In addition to retail supply, replenishment supply is needed to refill the Central Groundwater Basin and to use with injection wells serving as seawater barriers. Table 2 shows the actual supplies used to meet replenishment needs.
Table 1: Actual Retail Supplies (acre-feet per year)
Supply 2010 Ground Water 90,000
Imported Water 286,000
Recycled Water 13,000
Local Surface Water 1,000
Desalinated Ocean water -
Water Use Efficiency 5,000
Stormwater Capture and Use -
Total 395,000
October 2013 8

GLAC IRWM Upper Los Angeles River Subregional Plan
Table 2: Actual Replenishment Supplies (acre-feet per year)2
Supply 2010 Imported Water 2,000 Recycled Water -
Stormwater 33,000 Total 35,000
Surface Water The Subregion has developed a system of dams, flood control channels, and spreading basins for supplying local water and recharging groundwater. Though there are many areas of the Subregion’s rivers that are concrete lined, several spreading grounds have been constructed adjacent to them to allow for recharge (Figure 7), including:
• Pacoima Spreading Grounds (adjacent to Pacoima Wash)
• Branford Spreading Basin (adjacent to Pacoima Wash)
• Tujunga Spreading Grounds (adjacent to Tujunga Wash)
• Hansen Spreading Grounds (adjacent to Tujunga Wash)
Water agencies that have water diversion rights within the Subregion include the City of Pasadena and the City of Los Angeles. The City of Pasadena has rights up to 25 cfs of Arroyo Seco runoff, though the yield of the Arroyo Seco is highly variable depending on weather and rain patterns, and uses its diversions for both direct use and groundwater recharge. The City of Los Angeles has full rights to flows in the Los Angeles River, and uses its diversion rights for groundwater recharge.
2 Replenishment supplies based on 10-year average of replenishment in Coastal Plain area as reported in Los Angeles County Hydrologic reports. Included are groundwater basin recharge (100% contribution to groundwater supply) and sea water barrier injection (60% contribution to groundwater supply)
October 2013 9

GLAC IRWM Upper Los Angeles River Subregional Plan
Figure 6: Flood Control Facilities
October 2013 10

GLAC IRWM Upper Los Angeles River Subregional Plan
Figure 7: Spreading Basins, Dams and Reservoirs
October 2013 11

GLAC IRWM Upper Los Angeles River Subregional Plan
Groundwater Groundwater represents a significant portion of local supplies in the Subregion. The majority of groundwater yield in the Subregion is naturally recharged through the percolation of direct rainfall, and stream flow from surface runoff, percolation of imported water, and return flow from applied water. Some areas capture surface runoff and release it into spreading basins for additional percolation into the groundwater basin. The Los Angeles County Flood Control District and the City of Los Angeles operate several groundwater recharge facilities along tributaries to the Los Angeles River which recharge the San Fernando Basin. The Pasadena Water and Power Water Services Division also operates recharge facilities which recharge the Raymond Basin as discussed previously under “Surface Water”.
Groundwater basins act as underground reservoirs. During wet years, a basin can store excess surface water (imported and local) when available in wet years and then withdraw that water in dry years or during emergency situations when other sources are not available. Some basins, such as the Raymond Basin and Central Basin, have ample storage capacity and are able to store water for other agencies through conjunctive use programs.
The groundwater basins (shown in Figure 8) underlying this Subregion include:
• San Fernando Basin
• Verdugo Basin
• Sylmar Basin
• Eagle Rock Basin
• Raymond Basin
• Central Basin
The San Fernando, Sylmar, Eagle Rock and Verdugo Basin are collectively referred to as the Upper Los Angeles River Area (ULARA) Basins. The ULARA Basins cover a majority of the San Fernando Valley Floor and are bound by the San Gabriel and Santa Susana Mountains to the north, and the Santa Monica Mountains to the south. These basins are managed by the ULARA Watermaster, which tracks groundwater pumpage from 43 parties.
The Raymond Basin is bounded on the north by the San Gabriel Mountains, on the south and east by the San Gabriel Valley and on the west by the San Rafael Hills; only the western portion of the basin underlays the Upper Los Angeles River Subregion. The Raymond Basin Management Board manages the basin, and tracks the groundwater pumpage of the 16 different water purveyors that pump water from the basin.
The Central Basin is adjudicated through the Central Basin Judgment, with the total amount of allowable extraction rights set at 217,367 AFY. The California Department of Water Resources serves as Watermaster for the Central Basin, while the Water Replenishment District of Southern California is responsible for ensuring an adequate supply of replenishment water to offset groundwater production through monitoring, and various groundwater reliability programs and projects.
October 2013 12

GLAC IRWM Upper Los Angeles River Subregional Plan
Figure 8: Groundwater Basins
October 2013 13

GLAC IRWM Upper Los Angeles River Subregional Plan
Imported Water This Subregion significantly depends on imported water as local supply alone is insufficient to meet demand. The imported water wholesaler to the Subregion is the MWDSC. The City of Los Angeles also obtains imported water from the Los Angeles Aqueduct as described in Section 2.3.
Factors that impact reliability of MWDSC deliveries include operational constraints such as court ordered pumping restrictions on imported water from the San Joaquin-Sacramento River Delta (Delta) due to endangered species protection. Water quality concerns such as high salinity levels can require that water from the Colorado River be blended with higher quality SWP water. Invasive species, such as the quagga mussel, can force extensive maintenance of systems reducing operational flexibility. Climate change may impact supply reliability by reducing levels of precipitation impacting the snowpack in the Sierra Nevada Mountains, increasing the intensity and frequency of extreme weather such as droughts, and flooding events that increase the risk of levee failure in the Delta.
The reliability of Los Angeles Aqueduct supplies also includes operational constraints due to environmental mitigation needs in the Owens Valley and Mono Basin. Additionally, water quality concerns such as disinfection byproducts may require future treatment of Los Angeles Aqueduct water. Climate change is also expected to reduce the amount of water that can be imported from the Sierra Nevada Mountains. (LADWP 2010 UWMP)
Further discussion on imported water is included in Exhibit A.
Recycled Water Recycled water supplied to the Subregion is treated at the Donald C. Tillman Water Reclamation Plant (DCTWRP), Burbank WRP, Los Angeles-Glendale WRP (LAGWRP) and La Cañada WRP, all shown in Figure 9. DCTWRP and LAGWRP are both owned and operated by the City of Los Angeles. The DCTWRP has been producing recycled water since 1985 and annually produces approximately 23,000 acre-feet of recycled water per year. The LAGWRP began operation in 1976, and produces approximately 5,000 acre-feet of recycled water per year. La Cañada WRP is owned and operated by the Sanitation Districts of Los Angeles County. The La Cañada WRP has been in operation since 1962 and provides approximately 100 acre-feet per year of recycled water for golf course lakes and irrigation. Lastly, the Burbank WRP, owned and operated by Burbank Water and Power, began operation in 1966 and was upgraded in 2000 to meet current regulations. Burbank WRP produces approximately 10,000 acre-feet per year of recycled water. Smaller quantities are provided by Tapia WRF to Las Virgenes MWD service areas in Calabasas. In addition, there is potential for additional recycled water flows from these facilities, specifically the potential for increased production of recycled water in the Subregion if funding is available for capital improvements. These capital improvements could be at the treatment plants themselves to increase capacity, or by modifications of the upstream sewer collection system to divert more wastewater to the treatment plants, as well as extensions to recycled water distribution systems. Recycled water projects are being pursued by the water suppliers in the Subregion. Many of those projects are supported by MWDSC’s Local Projects rebates program. For some agencies, recycled water provides a significant portion of total water supplies. Recycled water is typically used for irrigation of large landscapes such as golf courses, freeway medians, parks, sports fields, and cemeteries. Existing recycled water projects in the Subregion are shown in Table 3. Additionally, the LADWP Recycled Water Master Plan proposes using recycled water for groundwater replenishment in the future. Those recycled water projects that are under construction, in advanced planning, or in the feasibility study stage include those shown in Table 4. (MWDSC, 2010)
October 2013 14

GLAC IRWM Upper Los Angeles River Subregional Plan
Figure 9: Water Reclamation Facilities in the GLAC Region
October 2013 15

GLAC IRWM Upper Los Angeles River Subregional Plan
Table 3: Existing Recycled Water Projects
Agency Project Name Ultimate capacity (acre-feet)
Burbank Water and Power
Burbank Reclaimed Water System Project Expansion 850
BWP Power Plant 1,500
Caltrans 20
Sanitation Districts of Los Angeles County La Canada-Flintridge Country Club 224
Glendale Glendale Forest Lawn WRP Expansion 500
Glendale Grayson Power Plant Project 460
Glendale Verdugo-Scholl Canyon Brand
Park Reclaimed Water Project 2,225
LADWP Environmental Use 28,000
Griffith Park 650
Hansen Area Water Recycling Project,
Phase1 2,500
Los Angeles Greenbelt Project 900
MCA/Universal 810
Sepulveda Basin Water Reclamation
Project 1,500
Las Virgenes MWD / Triunfo Sanitation
District Eastern Recycled Water System 7,280
Total Capacity 47,419
Table 4: Future Recycled Water Projects
Agency Project Name Ultimate capacity (acre-feet)
Burbank Water and Power
Burbank Reclaimed Water System Project Expansion, Phase II 974
Foothill MWD Foothill MWD Recycled Water Project 318
LADWP Hansen Dam Golf Course Water
Recycling Project 500
LA-Glendale Storage & Distribution
System Water Recycling Project 2,600
Elysian Park Tank and Pumping Station
Water Recycling Project 500
LA Zoo Water Recycling Project 500
October 2013 16

GLAC IRWM Upper Los Angeles River Subregional Plan
Agency Project Name Ultimate capacity (acre-feet)
Tillman Groundwater Replenishment
System 30,000
San Fernando Valley/Central City Water
Recycling and Reliability Project 1,500
Satellite Plant and Distribution System 4,500
Pasadena Water and Power
Central Los Angeles County Regional Recycled Water Project: Phase 1 730
Central Los Angeles County Regional
Recycled Water Project: Phase 2 3,110
Central Los Angeles County Regional
Recycled Water Project: Phase 3 3,170
Las Virgenes MWD / Triunfo Sanitation
District Woodland Hills Golf Course Recycled
Water System Extension 230
Total Capacity 48,632
Ocean Desalination Due to the Subregion’s lack of proximity to the ocean, ocean desalination projects would not occur within the Subregion. However, there may be opportunities to partner with an agency along the coast and transfer water through either a groundwater basin or through MWDSC in the future as desalination supplies become more cost competitive with imported water.
Stormwater Capture and Use Stormwater runoff from urban areas is an underutilized resource. Within the Subregion, a majority of stormwater runoff is directed to storm drains and channeled to the ocean. Stormwater reuse is a method that can be used by municipalities both to add a source of supply to its water portfolio, and to reduce runoff that can contribute to flooding and water quality issues. The County of Los Angeles, the City of Los Angeles, and the City of Burbank have low impact development (LID) ordinances in place that will increase the use of best management practices (BMPs) to reduce stormwater quality issues, flooding, and increase percolation to groundwater basins.
The City of Los Angeles is planning to develop a Stormwater Capture Master Plan in place that will investigate potential strategies for advancement of stormwater and watershed management in the City of Los Angeles, including centralized and distributed stormwater capture goals, and recommended projects to meet those goals. The City of Los Angeles has undertaken programs in the Sun Valley watershed to manage runoff and prevent flooding. The various stormwater management methods include installation of catch basins, storm drain inlets, and underground pipes to divert water to retention basins, open space for the storage and percolation of stormwater, and use of stormwater for landscaping.
The City of Burbank is completing a pilot percolation project that improves public right of ways along a street that will allow for the capture and percolation of stormwater.
It should also be mentioned that reservoirs in the Subregion have the capability to conserve some stormwater from the upper watershed, though primary purpose of these reservoirs is generally flood prevention. In addition, the permeable soils of the Subregion would allow for stormwater recharge of the groundwater basins.
October 2013 17

GLAC IRWM Upper Los Angeles River Subregional Plan
2.4 Water Supply/Demand As water agency boundaries are not aligned with the Subregional boundaries, an estimate of the actual Subregion’s water supply and demand was not readily available for this Plan. Water supply and demand for the Subregion was estimated based on review of 2010 Urban Water Management Plans (UWMPs).
Demand projections for the Subregion can be seen in Table 5. Demand was calculated using the 2010 UWMPs for the following water purveyors:
• City of Los Angeles (portion within Subregion) • City of Glendale • City of Burbank • City of Pasadena • Las Virgenes MWD (portion within Subregion) • Foothill MWD (portion within Subregion)
All agencies have incorporated water conservation measures into water planning and practice. This practice involves the implementation of best management practices (BMPs) as prescribed by the California Urban Water Conservation Council in order to meet the requirements SBx7-7 (Steinberg, 2009), also known as the 20x2020 Plan. Member agencies of MWDSC assist the Subregion by implementing incentive programs that provide rebates to water conservation and recycled water use projects and programs.
Table 5: Subregion Retail Demand Projections (acre-feet per year)
2010 2015 2020 2025 2030 2035
Demand 394,000 439,000 462,000 477,000 493,000 500,000 Supply 395,000 441,000 465,000 480,000 496,000 503,000
2.5 Water Quality The GLAC Region has suffered water quality degradation of varying degrees due to sources associated with urbanization, including the use of chemicals, fertilizers, industrial solvents, automobiles and household products. Both surface water and groundwater quality have been impacted by this degradation which can be classified as either point or nonpoint sources. Regulations are in place to control both types of sources.
The Federal Water Pollution Control Act Amendments of 1972, amended in 1977, are commonly known as the Clean Water Act. The Clean Water Act established the basic structure for regulating discharges of pollutants into the waters of the United Sates and gave the USEPA the authority to implement pollution control programs. In California, per the Porter Cologne Water Quality Control Act of 1969, responsibility for protecting water quality rests with the State Water Resources Control Board (SWRCB) and Regional Water Quality Control Boards (RWQCBs).
The SWRCB sets statewide policies and develops regulations for the implementation of water quality control programs mandated by state and federal statutes and regulations. The RWQCBs develop and implement Basin Plans designed to preserve and enhance water quality. The determination of whether water quality is impaired is based on the designated beneficial uses of individual water bodies, which are established in the Basin Plan. As mandated by Section 303(d) of the Federal Clean Water Act, the SWRCB maintains and updates a list of “impaired” water bodies that exceed state and federal water quality standards. To address these impairments, the RWQCBs identify the maximum amount of pollutants that may be present without impairing the designated beneficial uses, and are known as Total
October 2013 18

GLAC IRWM Upper Los Angeles River Subregional Plan
Maximum Daily Loads (TMDLs). In addition to development of the TMDLs the RWQCBs develop and implement the NPDES permits for discharges from wastewater treatment and water reclamation plants of treated wastewater effluent to surface water bodies.
The Subregion has 303(d) listings related both human activities and natural sources. Human activity can cause poor water quality due to trash, nutrients from wastewater treatment effluent, metals, and toxic pollutants. These pollutants are carried in stormwater runoff and through point source discharges, impacting streams, canyon ecosystems, and eventually beaches and offshore waters. Natural sources of contaminants primarily include minerals and metals from underlying local geology.
Even though agencies and cities in the Subregion have significantly reduced pollutants that are discharged to water bodies from individual point sources since the Clean Water Act was established, many of the major water bodies are still considered impaired due to trash, bacteria, nutrients, metals, and toxic pollutants. Water quality issues affecting the Subregion’s local surface waters and groundwater basins are discussed below.
Surface Water Quality The Upper Los Angeles River and its tributaries serve many beneficial uses including: municipal and domestic supply, groundwater recharge, recreation, warm freshwater habitat, aquatic habitat, wildlife habitat, protection of rare and endangered species, and wildlife habitat. Typically, surface water quality is better in the headwaters and upper portions of watershed, and is degraded by urban and stormwater runoff as the rivers move through urban areas. As a result, a number of waters in the Subregion are 303(d) listed for several constituents as shown in Table 6 and Table 7.
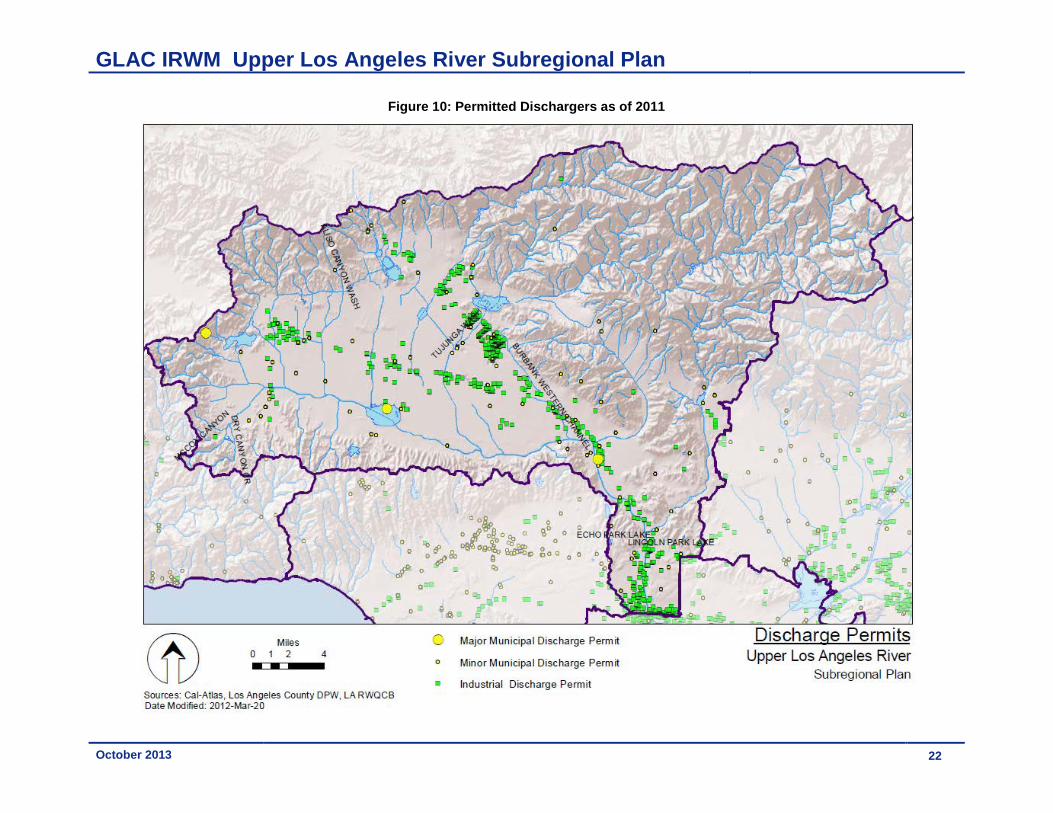
The locations of permitted dischargers are shown in Figure 10. Please note that Figure 10 does not show MS4 and Caltrans discharges as these are non-point discharge permits.
Investigations are needed to determine natural background levels for some listings which may not be due to anthropogenic causes. However, the reports written in support of the Subregion’s TMDLs conduct a source assessment for each impairment, and determine the major sources of each, as listed below:
• Los Angeles River Bacteria TMDL: Dry and wet weather stormwater system discharges, wildlife, direct human discharge, septic systems, re-growth or re-suspension of sediments
• Los Angeles River Metals TMDL: Dry weather: Publically owned treatment works (POTWs) including Tillman WRP, LA-Glendale WRP and Burbank WRP, tributary flows, groundwater discharge and flows from other permitted NPDES discharges; wet weather: storm flow through permitted storm sewer systems; atmospheric deposition, natural geologic conditions
• Los Angeles River Nutrient TMDL: Discharges from POTWs, including Tillman WRP, LA-Glendale WRP and Burbank WRP, urban runoff, stormwater, groundwater discharge
• Trash TMDL for the Los Angeles River Watershed: Stormwater discharges, direct deposition by people or wind
• Lincoln Park Lake TMDLs: Runoff, supplemental water additions to maintain lake level, parkland irrigation, atmospheric deposition
• Echo Park Lake TMDLs: Permitted storm sewer discharges, parkland irrigation, supplemental water additions to maintain lake levels, atmospheric deposition
• Lake Calabasas TMDLs: Permitted storm sewer discharges, Caltrans stormwater discharge permit, parkland irrigation, supplemental water additions to maintain lake levels, atmospheric deposition
Table 6: 303(d) Listed Waters with Approved TMDLs
303(d) Listed Waters and Impairments1 TMDLs
October 2013 19

GLAC IRWM Upper Los Angeles River Subregional Plan
303(d) Listed Waters and Impairments1 TMDLs Aliso Canyon Wash Metals: Copper, Selenium Los Angeles River Metals TMDL Fecal Coliform Los Angeles River Bacteria TMDL Arroyo Seco Coliform Bacteria Los Angeles River Bacteria TMDL Trash Trash TMDL for the Los Angeles River Watershed Bell Creek Coliform Bacteria Los Angeles River Bacteria TMDL Metals: Copper Los Angeles River Metals TMDL Burbank Western Channel Metals: Copper, Lead, Selenium Los Angeles River Metals TMDL Indicator Bacteria Los Angeles River Bacteria TMDL Trash Trash TMDL for the Los Angeles River Watershed Dry Canyon Creek Fecal Coliform Los Angeles River Bacteria TMDL Metals: Selenium Los Angeles River Metals TMDL Los Angeles River Nutrients: Ammonia, Nutrients (Algae), pH Los Angeles River Nutrient TMDL Bacteria Los Angeles River Bacteria TMDL Metals: Copper, Lead, Zinc, Cadmium Los Angeles River Metals TMDL Trash Trash TMDL for the Los Angeles River Watershed McCoy Canyon Creek Fecal Coliform Los Angeles River Bacteria TMDL Nutrients: Nitrite, Nitrate Los Angeles River Nutrient TMDL Selenium Los Angeles River Metals TMDL Tujunga Wash Coliform Bacteria Los Angeles River Bacteria TMDL Trash Trash TMDL for the Los Angeles River Watershed Nutrients: Ammonia Los Angeles River Nutrient TMDL Metals: Copper Los Angeles River Metals TMDL Verdugo Wash Coliform Bacteria Los Angeles River Bacteria TMDL Trash Trash TMDL for the Los Angeles River Watershed Metals: Copper Los Angeles River Metals TMDL Echo Park Lake Nutrients: Algae, Eutrophic, Organic Enrichment/Low Dissolved Oxygen
Echo Park Lake TMDLs
Ammonia Odor DDT pH PCBs Trash Metals: Copper, Lead No TMDL necessary as metals determined to be
meeting numeric targets Lake Calabasas Nutrients: Ammonia, Eutrophic, Organic Enrichment/Low Dissolved
Lake Calabasas TMDLs
pH Odor
October 2013 20
GLAC IRWM Upper Los Angeles River Subregional Plan
303(d) Listed Waters and Impairments1 TMDLs Lincoln Park Lake Nutrients: Ammonia, Eutrophic, Organic Enrichment/Low Dissolved Oxygen, Odor
Lincoln Park Lake TMDLs
Trash Lead No TMDL necessary as lead determined to be
meeting numeric targets 1. According to the US EPA’s 2010 Integrated Report (Clean Water Act Section 303(d) List / 305(b) Report
Table 7: 303(d) Listed Waters without Approved TMDLs
303(d) Listed Waters and Impairments1
Arroyo Seco Benthic-Macroinvertebrate Bioassessments Burbank Western Channel Cyanide Los Angeles River Oil
1. According to the US EPA’s 2010 Integrated Report (Clean Water Act Section 303(d) List / 305(b) Report
Groundwater Quality Groundwater quality in the ULARA Basins is managed by the ULARA Watermaster which reports on water quality, treatment and remedial investigation activities in its annual report. The overall quality of the ULARA Basins is generally within the recommended limits of drinking water standards, except for those areas of concern listed in Table 8. Groundwater pumped from these areas (for those wells that haven’t been shut down) are treated to meet state drinking water standards.
Within the San Fernando Valley, three Operable Units (OUs) have been created as part of long-term groundwater remediation activities in the San Fernando Basin. These OUs include: 1) North Hollywood OU due to VOC contamination, 2) Burbank OU due to VOCs and hexavalent chromium, and 3) Glendale North and South OUs due to VOCs. Various groundwater quality investigations are also taking place throughout the ULARA Basins to determine the cause and extent of the above listed contamination.
Table 8: Groundwater Quality Concerns in the ULARA Basins
Basin Area Water Quality Concern
San Fernando Basin – eastern portion TCE, PCE, hexavalent chromium, nitrate
San Fernando Basin – western portion Sulfate, TDS
Verdugo Basin MTBE, nitrate
Sylmar Basin nitrate
Raymond Basin groundwater quality is managed by the Raymond Basin Management Board. This basin provides potable supply, with good to fair groundwater quality in most areas. Constituents of concern include TDS, nitrate, perchlorate, and VOCs. There is one Superfund site located at the Jet Propulsion Laboratory (JPL) due to liquid waste seepage which released perchlorate and VOCs into the groundwater. Water agencies which pump from the Raymond Basin have treatment facilities in place to treat groundwater for VOCs and Perchlorate.
October 2013 21
GLAC IRWM Upper Los Angeles River Subregional Plan
Figure 10: Permitted Dischargers as of 2011
October 2013 22

GLAC IRWM Upper Los Angeles River Subregional Plan
2.6 Environmental Resources The Subregion contains areas that have been highly urbanized as well as areas in the San Gabriel Mountains that provide a variety of natural resources that serve as habitat for wildlife. Below is a discussion of the existing environmental resources found in the Subregion.
2.6.1 Habitat A variety of habitats can be found in the Subregion. In terms of water resources, these habitats include both upland and aquatic habitat.
Upland habitat provides a buffer to aquatic habitat as well as linkages to species through the landscape. Wetland areas provide habitat to innumerable species of flora and fauna. Wetland areas within the Subregion can be seen in Figure 11, and include:
• Freshwater aquatic habitats: Aquatic habitats such as depressional marshes, lakes and ponds. For the purposes of this Subregional Plan, freshwater aquatic habitats include man-made habitats such as flood control basins and ponds which may include areas of freshwater aquatic habitats. It is important to note that although some spreading grounds and some stormwater Best Management Practices such as detention basins, swales and depressional areas, also provide ecosystem benefits, they belong under a separate category and should not be subject to the same protection criteria
• Riverine aquatic habitats: Streambed and aquatic habitats associated with rivers and streams, including upper and lower riverine habitats. Man-made habitats considered riverine aquatic habitats include concrete-lined channels and soft-bottomed channels. Note that “riparian” is sometimes used to mean riverine aquatic habitats.
Studies have found that the Subregion contains a number of distinct habitats that fall under the above described upland and aquatic habitat:
• Soft bottom channel with annually flooded riparian growth: Soft bottom areas which are lined with cobble, sediment and boulders allow growth of willows and other riparian vegetation. This habitat occurs in two areas: Glendale Narrows from the Burbank/Western Channel confluence (Victory Boulevard) to just above the Arroyo Seco confluence and in the Sepulveda Flood Control Basin from the dam to above Balboa Boulevard.
• River bank: Earthen river banks can be found around the edges of some flood control basins, especially behind Hansen Dam
• Freshwater marsh/cienega: This habitat, which was once common along the river, now occurs only in small areas of teh soft bottom channel
• Open freshwater reservoirs: Constructed reservoirs and lakes within the Los Angeles River watershed that offer feeding and resting habitat to migrating birds include Silver Lake, Encino, Los Angeles, Pacoima and Tujunga reservoirs and spreading grounds. These form part of the "habitat system" to which the river belongs.
• Floodplain forest: This habitat is characterized by willows and cottonwoods, with dense shrubby undergrowth. Once common along the river, remnants of this habitat now occur only in Whittier Narrows, Sepulveda and Hansen flood control basins.
• Valley oak savanna: Once occurred in the western area of the river drainage. Now only disturbed remnants remain near the Chatsworth Reservoir and in Sepulveda Basin.
• Alluvial scrub: Occurred on alluvial washes, or bajadas. Big Tujunga Wash contains the only remnant of this habitat.
October 2013 23

GLAC IRWM Upper Los Angeles River Subregional Plan
• Urban/suburban: This highly modified habitat type, with mostly exotic tree and shrub species, is typical of the lowland portions of the Los Angeles River. The extensive urbanization of the flood plain and the channelization of the river and its tributaries have provided for the spread of this habitat type. While some native species survive, most native birds and animals do not adapt to this habitat.
• Aerial: Animals that eat insects, such as bats, swallows and swifts, are common throughout the Los Angeles River watershed where conditions of vegetation, wind and topography produce ideal conditions for large concentrations of insects, and therefore, the species that feed on them.
It has been determined that seasonal and permanent freshwater aquatic habitats, lowland riparian forests and thickets, and alluvial scrub have been the most heavily impacted by urbanization and flood control programs. (The Biota of the Los Angeles River)
2.6.2 Significant Ecological Areas Los Angeles County developed the concept of significant ecological areas in the 1970s in conjunction with adopting the original general plan for the County.
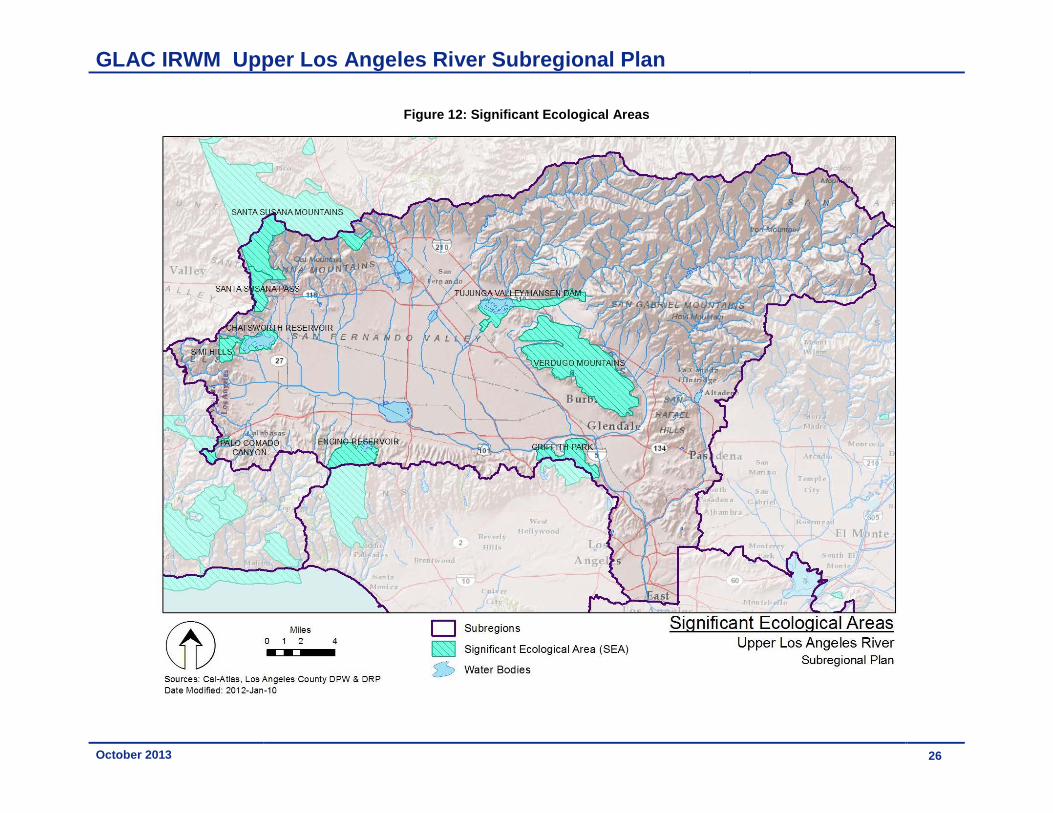
The Significant Ecological Area (SEA) Program is a component of the Los Angeles County Conservation/Open Space Element in their General Plan. This program is a resource identification tool that indicates the existence of important biological resources. SEAs are not preserves, but are areas where the County deems it important to facilitate a balance between limited development and resource conservation. Limited development activities are reviewed closely in these areas where site design is a key element in conserving fragile resources such as streams, oak woodlands, and threatened or endangered species and their habitat.
Proposed development is governed by SEA regulations. The regulations, currently under review, do not to preclude development, but to allow limited, controlled development that does not jeopardize the unique biotic diversity within the County. The SEA conditional use permit requires development activities be reviewed by the Significant Ecological Area Technical Advisory Committee (SEATAC). Additional information about regulatory requirements is available on the Los Angeles County website. (Los Angeles County Planning, 2012, http://planning.lacounty.gov/sea/faqs).
Within the Subregion, SEAs include:
• Santa Susana Mountains
• Santa Susana Pass
• Chatsworth Reservoir
• Simi Hills
• Palo Comado Canyon
• Encino Reservoir
• Tujunga Valley / Hansen Dam
• Verdugo Mountains
• Griffith Park
These SEAs can be seen in Figure 12.
October 2013 24

GLAC IRWM Upper Los Angeles River Subregional Plan
Figure 11: Aquatic Habitat
October 2013 25
GLAC IRWM Upper Los Angeles River Subregional Plan
Figure 12: Significant Ecological Areas
October 2013 26

GLAC IRWM Upper Los Angeles River Subregional Plan
2.6.3 Ecological Processes The open space areas in the northern and-eastern portions of the Subregion known as the Puente-Chino Hills Wildlife Corridor is an unbroken zone of natural habitat extending nearly 31 miles from the Cleveland National Forest in Orange County to the West end of the Puente Hills above Whittier Narrows (LSA, 2007). This is a biologically rich area that provides critical habitat to endangered species and upland habitat, and connectivity between various habitat types.
The aquatic habitat and upland habitats found in the Subregion provide a number of ecosystem services including biodiversity support, flood damage reduction, carbon sequestration, pollutant reduction in runoff, consumptive use support (such as hunting and fishing), and non-consumptive use support (such as bird watching) (Brauman et al., 2007).
In addition to ecosystem services which may improve water supply and water quality, major ecological processes may impact water resources, and are listed below.
Fire Fire is an integral and necessary part of the natural environment and plays a role in shaping the landscape. Catastrophic wildfire events can denude hillsides which create opportunities for invasive plants and increase the potential for subsequent rains to result in debris flows that erode the landscape and can clog stream channels, damage structures, and injure inhabitants in the canyons and lower foothill areas.
Invasive Species Invasive species in the Region have also substantially affected specific habitats and areas. Along with the rest of California, most of the Subregion’s native grasslands were long ago displaced by introduced species. The receptive climate has resulted in the widespread importation of plants from around the globe for landscaping. Some plant introductions have resulted in adverse impacts. In many undeveloped areas, non-native plants such as arundo (Arundo donax), tree of heaven (Alianthus altissima) tree tobacco (Nicotiana glauca), castor bean (Ricinus communis), salt cedar (Tamarix ramosissima) and cape ivy (Senecio mikanioides) are out-competing native. The removal of this particular species, which requires focused and repeated efforts, can provide substantial dividends in water savings and restored species diversity.
Slope Stability The area in the northern portion of the Subregion is prone to slope stability problems such as landslides, mudslides, slumping and rockfalls. Shallow slope failure such as mudslides and slumping occur where graded cut and fill slopes have been inadequately constructed. Rockfalls are generally associated with seismic ground-shaking or rains washing out the ground containing large rocks and boulders.
2.6.4 Critical Habitat Areas Critical habitat areas have been established by the endangered species act (ESA) to prevent the destruction or adverse modification of designated critical habitat of endangered and threatened plants and animals. The United States Fish and Wildlife Service (USFWS) through the Endangered Species Act (ESA) defines critical habitat as “a specific geographic area(s) that contains features essential for the conservation of a threatened or endangered species and that may require special management and protection. Critical habitat may include an area that is not currently occupied by the species but that will be needed for its recovery.” A critical habitat designation typically has no impact on property or developments that do not involve a Federal agency, such as a private landowner developing a property that involves no Federal funding or permit. However, when such funding or permit is needed, the impacts to critical habitat are considered during the consultation with the USFWS.
Within the Subregion, there is 11,400 acres of designated critical habitat defined for various endangered and threatened species as shown in Figure 13.
October 2013 27

GLAC IRWM Upper Los Angeles River Subregional Plan
2.7 Open Space and Recreation Open space and recreation area is limited in the Subregion due to its being highly developed. Parks, recreation and other open space in the Subregion can be seen in Table 9. Acreage of recreation and open space lands within the Subregion is shown in Table 9. In total, of the Subregion’s 373,665 acres, approximately 154,590 acres (or 41%) are considered open space or recreation land areas. A majority of the areas are National Forest Land within the San Gabriel Mountains.
Table 9: Existing Recreation and Open Space Land Area
Land Type Acres Developed Urban Park and Recreation Area 4,600 acres
Open Space Lands (including aquatic habitats and National Forest) 149,000 acres Greenways 430 acres
Other/Miscellaneous 560 acres Total Area in Subregion 154,590 acres
October 2013 28

GLAC IRWM Upper Los Angeles River Subregional Plan
Figure 13: Critical Habitat
October 2013 29

GLAC IRWM Upper Los Angeles River Subregional Plan
Figure 14: Parks, Recreation and Other Open Space
October 2013 30

GLAC IRWM Upper Los Angeles River Subregional Plan
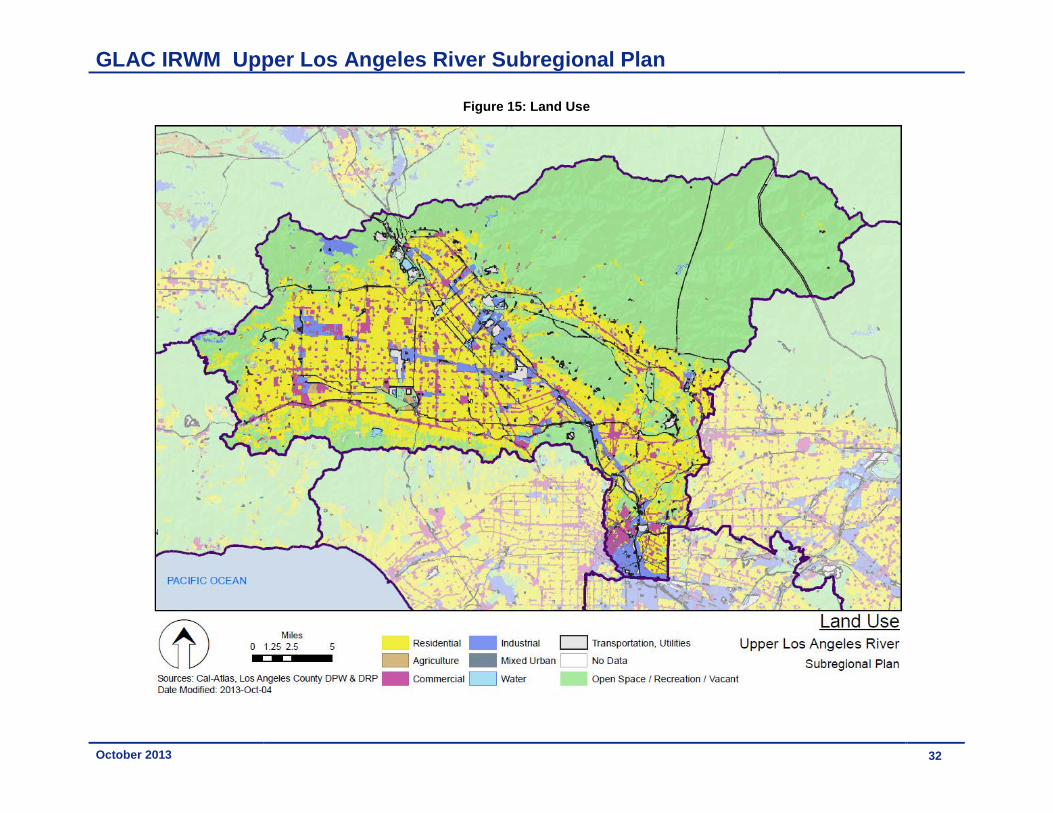
2.8 Land Use Land use within the Upper Los Angeles Subregion reflects the historic pattern of urbanization as most of the Subregion is occupied with residential, commercial, industrial, and institutional uses while most of the foothills and mountains are principally open space.
Land use types may include the following:
• Residential: duplexes and triplexes, single family residential, apartments and condominiums, trailer parks, mobile home courts and subdivisions
• Commercial: parking facilities, colleges and universities, commercial recreation, correctional facilities, elementary/middle/high schools, fire stations, government offices, office use, hotels and motels, health care facilities, military air fields, military bases, military vacant area, strip development, police and sheriff stations, pre-schools and day care centers, shopping malls, religious facilities, retail centers, skyscrapers, special care facilities, and trade schools
• Industrial: chemical processing, metal processing, manufacturing and assembly, mineral extractions, motion picture, open storage, packing houses and grain elevators, petroleum refining and processing, research and development, wholesaling and warehousing
• Transportation and Communication: airports, bus terminals and yards, communication facilities, electrical power facilities, freeways and major roads, harbor facilities, improved flood waterways and structures, maintenance yards, mixed transportation and utility, natural gas and petroleum facilities, navigation aids, park and ride lots, railroads, solid and liquid waste disposal facilities, truck terminals, water storage and transfer facilities
• Open Space and Recreation / Vacant Land: cemeteries, golf courses, developed and undeveloped parks, parks and recreation, specimen gardens and arboreta, wildlife preserves and sanctuaries, abandoned orchards and vineyards, vacant undifferentiated, and vacant land with limited improvements. Note that this land use type includes more land uses than are listed in Table 9: Existing Recreation and Open Space Land Area.
Table 10: Land Use in the Upper Los Angeles Subregion
Land Use Type Acres Percentage Open Space / Recreation / Vacant 199,481 53%
Residential 115,543 31% Commercial 21,048 6%
Industrial 14,476 4% Transportation, Utilities 16,738 4%
Agriculture 2,195 1% Mixed Urban 3,124 1%
Water 1,024 <1% No Data 36 <1%
Total 373,665 100%
October 2013 31
GLAC IRWM Upper Los Angeles River Subregional Plan
Figure 15: Land Use
October 2013 32

GLAC IRWM Upper Los Angeles River Subregional Plan
3 Subregional Objectives and Targets This section identifies the objectives for the Subregion and establishes quantified planning targets to the 2035 planning horizon that can be used to gauge success in meeting the objectives.
3.1 Objective and Target Development The Greater Los Angeles County Regional IRWM Plan has developed regional goals, objectives, and targets. To assist the region in meeting these, objectives and targets have been developed for the Subregion. These objectives and targets are intended to help guide improvements to water supply, water quality, habitat, open space, and flood management to meet the Region’s objectives and targets through Subregional planning.
Five objectives have been articulated, based on recent water resource planning documents. Workgroups composed of Stakeholders from within the Region were involved in establishing the Plan’s objectives and targets. To establish quantifiable benchmarks for implementation of the plan, planning targets were defined based on much discussion within the regional workgroup. Objectives for five water resource areas were identified for the Subregion, which are discussed below (and summarized in Table 9).
3.2 Water Supply Optimizing local water supply resources is vital for the Subregion to reduce its reliance on imported water and improve reliability of local water supplies should imported water supplies be reduced or interrupted due to environmental and/or political reasons. The Subregion plans on achieving this objective by conserving water through water use efficiency measures, creating an additional ability to pump groundwater, increasing the indirect potable reuse and non-potable reuse of recycled water, and increasing the infiltration, capture, and use of stormwater. In total, water supply targets will yield an additional 97,000 AFY of local supply for direct use, and 67,000 AFY of local supply for groundwater recharge.
To develop supply targets, water supply planning documents for agencies whose service areas cover a majority of the Subregion were examined for potential supply projects, and planned increases in supply between the years 2010 and 2035. The water supply targets for each Subregion were discussed in the Water Supply Targets TM.
3.3 Water Quality Improving the quality of urban and stormwater runoff will reduce or eliminate impairment of rivers, beaches, and other water bodies within and downstream of the Subregion. Improving the quality of urban and stormwater runoff would also make these local water supplies available for groundwater recharge. Additionally, the Subregion will continue to improve groundwater and protect drinking water quality to ensure a reliable water supply.
The Subregion plans on achieving these objectives by increasing the capacity to capture and treat runoff and prevent certain dry weather flows (see table above). The water quality target was determined by setting a goal of capturing ¾” of storms over the Subregion. The Subregion’s target is to develop 14,800 AF of new stormwater capture capacity (or equivalent). An emphasis will be given to the higher priority areas which will be determined by project-specific characteristics provided by the project proponent, including land use in the proposed project area, runoff and downstream impairments. The assumptions and calculations used to determine this target and catchment prioritization can be found in the Water Quality Objectives and Targets TM.
October 2013 33

GLAC IRWM Upper Los Angeles River Subregional Plan
3.4 Habitat Objective and Targets
Protecting, restoring, and enhancing the Subregion’s native habitats is vital to preserving areas that will contribute to the natural recharge of precipitation and improve downstream water quality. Additionally, the protection, restoration, and enhancement of upland habitat, aquatic habitat/marsh habitat, riparian habitat and buffer areas will help restore natural ecosystem processes and preserve long-term species diversity. Subregional targets for habitat were not developed, but Regional habitat target development is discussed in the Open Space, Habitat and Recreation TM.
3.5 Open Space and Recreation Objective and Targets Open space and recreation areas provide space for native vegetation to create habitat and passive recreational opportunities for the community. In addition, open space and recreation areas may preserve or expand the area available for natural groundwater recharge (though only in the forebay areas), improve surface water quality to the extent that these open spaces filter, retain, or detain stormwater runoff, and provide opportunities to reuse treated runoff for irrigation. Subregional targets for open space and recreation were not developed, but Regional open space and recreation target development is discussed in the Open Space, Habitat and Recreation TM.
3.6 Flood Management Objective and Targets Improved integrated flood management systems can help reduce the risk of flooding, and protect lives and property. The Subregion plans on meeting this objective by reducing 1,970 acres of local unmet drainage needs, and removing 27.6 million cubic yards of sediment from debris basins and reservoirs. The local unmet drainage target was determined by looking at Special Flood Hazard Areas (SFHAs), also known as flood plains, as defined by FEMA, compared to land uses and the presence of structures. The sediment removal target was established using historical records to estimate sediment inflow, and estimate the sediment trapped within a 20-year period. Assumptions used to develop the Subregion’s flood target can be found in the Flood Management Objectives and Targets TM.
October 2013 34

GLAC IRWM Upper Los Angeles River Subregional Plan
Table 11: Upper Los Angeles Subregion Objectives and Planning Targets
Objectives Regional Planning Targets
Improve Water Supply
Optimize local water resources to reduce the Subregion’s reliance on imported water.
Water Use Efficiency Conserve 37,000 AFY of water by 2035 through water use efficiency and conservation measures.
Ground Water Create additional ability to pump 40,000 AFY using a combination of treatment, recharge, and storage access.
Recycled Water Increase indirect potable reuse of recycled water by 30,000 AFY.
Increase non-potable reuse of recycled water by 13,000 AFY.
Ocean Desalination No target to increase ocean desalination.
Stormwater Increase capture and use of stormwater runoff by 7,000 AFY that is currently lost to the ocean.
Increase stormwater infiltration by 37,000 AFY.
Improve Water Quality Comply with water quality regulations (including TMDLs) by improving the quality of urban runoff, stormwater, and wastewater.
Runoff (Wet Weather Flows)
Develop3 14,700 AF of new stormwater capture capacity (or equivalent) spatially dispersed to reduce region-wide pollutant loads, emphasizing higher priority areas4.
Enhance Habitat
Protect, restore, and enhance natural processes and habitats.
Habitat targets were not developed to the subregional level – only to the regional level.
Enhance Open Space and Recreation
Increase watershed friendly recreational space for all communities.
Open space and recreation targets were not developed to the subregional level – only to the regional level.
Improve Flood Management
Reduce flood risk in flood prone areas by either increasing protection or decreasing needs using integrated flood management approaches.
Sediment Management and Integrated Flood Planning
Reduce flood risk in 1,970 acres of flood prone areas by either increasing protection or decreasing needs using integrated flood management approaches.
Remove 27.6 million cubic yards of sediment from debris basins and reservoirs.
3 Stormwater capture capacity assumes (1) providing storage volume equivalent to runoff from the 0.75”, 24-hour design storm event, (2) designing BMPs to retain the captured volume to the maximum extent practicable via infiltration, evapotranspiration, or harvest and use, and (3) designing BMPs to provide effective treatment to address pollutants of concern for the remaining portion of the captured volume that is not retained. Projects deviating from these specifications may be demonstrated to be equivalent based on comparison of average annual volume captured and/or average annual pollutant load reduction for pollutants of concern. Pollutants of concern are defined as those pollutants expected to be generated from the land uses within the subwatershed and for which the downstream water bodies are impaired (TMDL, 303(d) listed). 4 High priority areas will be determined based on project-specific characteristics such as project area land use, precipitation, imperviousness and downstream impairments.
October 2013 35
GLAC IRWM Upper Los Angeles River Subregional Plan
4 Partnership and Multi-benefit Opportunities Many agencies and other entities have successfully been working together for decades on many collaborative projects. Projects that seek to enhance or extend these existing activities should be encouraged, because they will often be the most cost-effective. Implementation of projects is the vehicle to meeting the objectives and planning targets discussed in Section 3. Integration and collaboration can help these projects achieve synergies and, at times, increase their cost-effectiveness in meeting multiple objectives. In addition to the collaboration described above, the GLAC IRWM Region will continue to build upon a wealth of potential multi-benefit project opportunities for partnership projects including:
• Local Supply Development: Alternative supply development such as distributed (smaller, non-centralized) stormwater capture projects are often too costly for a water supply agency to construct on their own for water supply purposes only. The near-term unit cost can be well in excess of the cost of imported water. However, partnerships often help to share the costs, thus providing opportunities for more complex, multi-benefit projects (such as water quality improvement) that otherwise might not be accomplished.
• Improving Stormwater Quality: In preparing this update of the IRWM Plan, a methodology to identify priority drainage areas based on their ability to improve water quality for coastal and terrestrial waters was developed. Integrated projects that can provide water quality improvements can be cited relative to that prioritization to achieve the highest benefits.
• Integrated Flood Management: Earlier studies, such as the Sun Valley Watershed Management Plan (2004), demonstrated the potential for similar cost-effective synergies between flood control, stormwater quality management, water supply, parks creation and habitat opportunities. Flood control benefits usually achieved through significant traditional construction projects can sometimes be accomplished with alternative multi-benefit projects.
• Open Space for Habitat and Recreation: When habitat is targeted for restoration, there are often opportunities for cost-effective implementation of flood control, stormwater management and passive recreation (such as walking and biking trails) as well.
These benefit synergies and cost effectiveness outcomes can best be attained when the unique physical, demographic and agency service area attributes of the region are considered. In addition to existing collaborative processes, the GLAC IRWMP has developed a geodatabase tool to assist in identifying areas and partnerships conducive to both inter-subregional and intra-subregional integrated project development. This section discusses this tool as well as some preliminary analyses on the Upper Los Angeles River Subregion’s potential partnerships and integrated project opportunities.
4.1 GLAC IRWMP Integration Process and Tools As part of the objectives and targets update process, the GLAC Region compiled and developed several geo-referenced data layers to assist in spatially identifying priorities and potential opportunities to achieve water supply, water quality, habitat, recreation and flood management benefits. These data layers were initially used individually to determine the objectives and planning targets for each water management area. However, these datasets can also be overlaid to visually highlight areas with the greatest potential to provide multiple benefits. The resulting Potential Benefits Geodatabase (Geodatabase) can also align these areas relative to other layers containing agency service areas and jurisdictions – allowing for project proponents and partners to be identified.
October 2013 36

GLAC IRWM Upper Los Angeles River Subregional Plan
Potential Benefits Geodatabase The GLAC IRWMP Potential Benefits Geodatabase is a dynamic tool that should be updated as new data is made available in order to maintain its relevance in the IRWM planning context. However, in order to provide an analysis of potential integration and partnership opportunities for the 2013 GLAC IRWM Plan, current data layers were overlaid and analyzed. The key layers used are shown in Figure 15 and described in Table 12. It should be noted that these datasets may not be complete or in need of further refinement and therefore will be updated on an as-needed basis – which is part of the dynamic process previously described. Therefore, the Geodatabase should only be used as an initial step in identifying multi-benefit potential and by no means used to invalidate the potential for achieving benefits in other areas.
Figure 16: GLAC Region Potential Benefits Geodatabase Layers
Using the Geodatabase The Geodatabase is a dynamic visual tool. The data layers and maps shown in this Section are only some of a multitude of ways to package and view the datasets to help with the integration process. It is important to note that not all data that could be useful in identifying integration and partnership potential for the region is easily viewed spatially in this format. Therefore the Geodatabase should only be used as one of several potential integration tools or methods.
The Geodatabase can also be used to identify the potential for further integration between existing projects included in an IRWMP. Currently the GLAC Region has web-based project database (OPTI) that geo-references all projects included in the IRWM. As part of the 2013 Plan Update, this dataset of projects will eventually be updated and prioritized. This resulting project dataset could be included as a layer in the Geodatabase or conversely, the existing Geodatabase layers could be uploaded to OPTI for public viewing and made available to OPTI users. In the future, additional layers, such as groundwater quality and general plan areas, can be added to the Geodatabase to enhance the ability of project
October 2013 37

GLAC IRWM Upper Los Angeles River Subregional Plan
proponents to identify integration opportunities. Either way, by overlaying the current projects on top of the potential benefit layers, additional benefits could be added to existing project or linked to other projects and proponents through those benefits.
Table 12: Potential Benefit Geodatabase Layers
Data Layer Description Supply: Recharge Areas1 Shows areas where soils suitable for recharging are above supply
aquifer recharge zones. Thereby indicating that water infiltrating in these areas has the potential to increase groundwater supplies.
Supply: Existing and Potential Water Reclamation2
Shows locations of existing wastewater and water reclamation plants.
Flood: Special Flood Hazard Areas3
Shows some of the areas that would benefit from increased drainage to alleviate flooding potential.
Habitat: Historical and Current Aquatic4
Shows the combined current and historical habitat areas that would indicate the potential for aquatic habitat protection, enhancement, or restoration benefits to be derived. (Note: North Santa Monica Bay Subregion did not have similar data so it shows Significant Ecological Areas instead5.)
Recreation: High Priority6 Shows areas that have the greatest need for open space recreation given the distance from current open space recreation sites.
Water Quality: Medium and High Priority7
Shows watershed areas with medium and high priority and therefore relative potential to improve surface water quality.
1 Created using Los Angeles County’s groundwater basins shapefile overlaid with soils and known forebays shapefiles 2 Created by RMC Water and Environment for the Los Angeles Department of Water and Power’s Recycled Water Master Planning program to show sources of wastewater that could be made available for recycled water use. 3 Created by Federal Emergency Management Agency to define areas at high risk for flooding (subject to inundation by the 1% annual chance flood event) and where national floodplain management regulations must be enforced 4 From Regional restoration goals for wetland resources in the Greater Los Angeles Drainage Area: A landscape-level comparison of recent historic and current conditions using GIS (C. Rairdan, 1998) and additional current aquatic habitat is based on the extent of current habitat derived from the National Wetlands Inventory. 5 Significant Ecological Areas are those areas defined by Los Angeles County as having ecologically important land and water systems that support valuable habitat for plants and animals. 6 Created for the GLAC IRWM Open Space for Habitat and Recreation Plan (2012), and shows where there is less than one acre of park or recreation area per one thousand residents. 7 Created for the GLAC IRWM Water Quality Targets TM (2012), which ranked catchments based on TMDLs, 303(d) listings and catchments that drain into Areas of Special Biological Significance (ASBS).
4.1 Integration Opportunities in Upper Los Angeles River Planning for the GLAC Region is primarily done on a sub-regional level, given that each subregion has a unique set of physical characteristics and stakeholders that create opportunities for project identification and collaboration. Therefore, the Geodatabase layers are more useful when examined and discussed on a subregional scale. Figure 16 focuses on the Upper Los Angeles River Subregion and highlights just a few unique areas within the Subregion that have potential for generating multiple benefit projects. These areas described here are meant to provide examples of potential multiple benefits areas and are not meant to be a comprehensive inventory of opportunities. As subregions move forward to identify potential projects, it
October 2013 38

GLAC IRWM Upper Los Angeles River Subregional Plan
will be necessary to examine localized site characteristics (such as land uses) to confirm that it will be possible to meet the potential benefits discussed below.
The Subregion’s integration potential is notable relative to other subregions in a few ways:
• There are large areas suitable for groundwater recharge and significant sources of local stormwater and recycled water supplies.
• There is a large northern upland open space watershed that drains into areas with a high potential to derive aquatic habitat benefits.
• There is a heavily urbanized valley area but with strong examples of successful integrated flood management facilities and great opportunities for furthering multiple benefit projects.
• The Los Angeles River Watershed provides unique opportunities for integrated flood management projects that would improve habitat and water quality while maintain flood control.
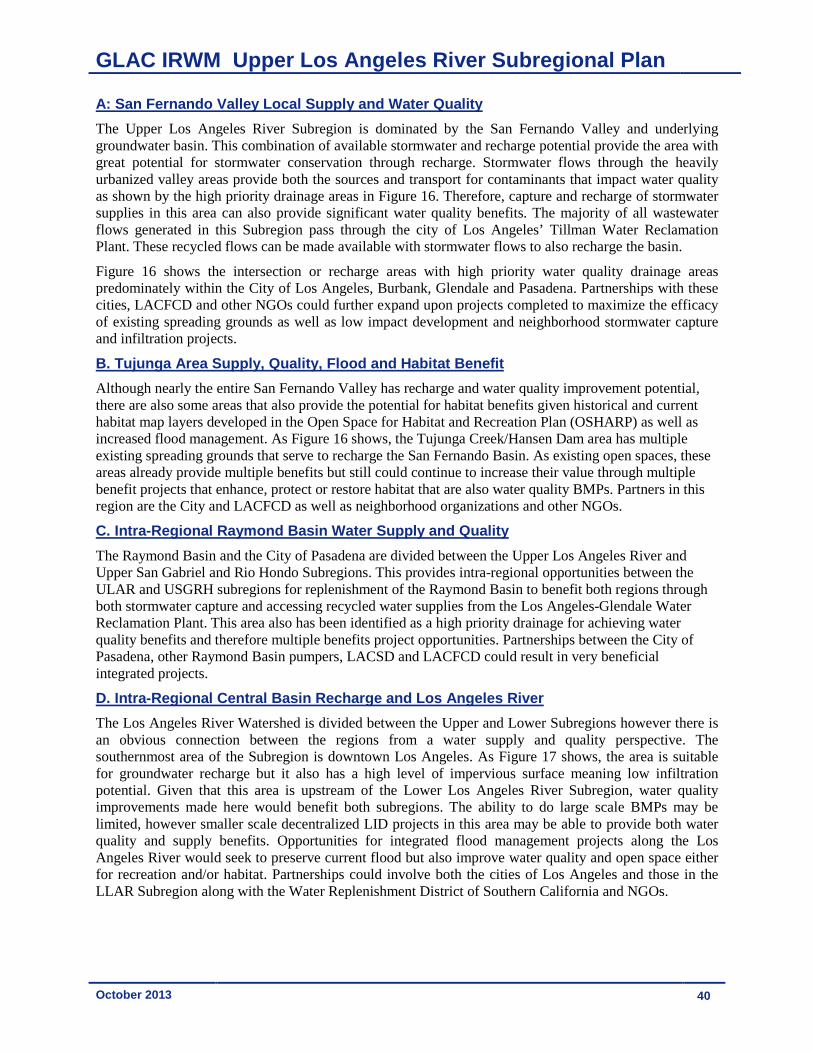
Figure 17: Upper Los Angeles River Subregion Potential Multiple-Benefits
The following sections highlight a few areas in the Upper Los Angeles Subregion where integration and partnership opportunities could be found based upon the Geodatabase layers and multiple benefit analysis performed. There are multiple areas beyond those few highlighted here that can be explored by the Upper Los Angeles River stakeholders and project proponents.
A
B
C
D
October 2013 39
GLAC IRWM Upper Los Angeles River Subregional Plan
A: San Fernando Valley Local Supply and Water Quality The Upper Los Angeles River Subregion is dominated by the San Fernando Valley and underlying groundwater basin. This combination of available stormwater and recharge potential provide the area with great potential for stormwater conservation through recharge. Stormwater flows through the heavily urbanized valley areas provide both the sources and transport for contaminants that impact water quality as shown by the high priority drainage areas in Figure 16. Therefore, capture and recharge of stormwater supplies in this area can also provide significant water quality benefits. The majority of all wastewater flows generated in this Subregion pass through the city of Los Angeles’ Tillman Water Reclamation Plant. These recycled flows can be made available with stormwater flows to also recharge the basin.
Figure 16 shows the intersection or recharge areas with high priority water quality drainage areas predominately within the City of Los Angeles, Burbank, Glendale and Pasadena. Partnerships with these cities, LACFCD and other NGOs could further expand upon projects completed to maximize the efficacy of existing spreading grounds as well as low impact development and neighborhood stormwater capture and infiltration projects.
B. Tujunga Area Supply, Quality, Flood and Habitat Benefit Although nearly the entire San Fernando Valley has recharge and water quality improvement potential, there are also some areas that also provide the potential for habitat benefits given historical and current habitat map layers developed in the Open Space for Habitat and Recreation Plan (OSHARP) as well as increased flood management. As Figure 16 shows, the Tujunga Creek/Hansen Dam area has multiple existing spreading grounds that serve to recharge the San Fernando Basin. As existing open spaces, these areas already provide multiple benefits but still could continue to increase their value through multiple benefit projects that enhance, protect or restore habitat that are also water quality BMPs. Partners in this region are the City and LACFCD as well as neighborhood organizations and other NGOs.
C. Intra-Regional Raymond Basin Water Supply and Quality The Raymond Basin and the City of Pasadena are divided between the Upper Los Angeles River and Upper San Gabriel and Rio Hondo Subregions. This provides intra-regional opportunities between the ULAR and USGRH subregions for replenishment of the Raymond Basin to benefit both regions through both stormwater capture and accessing recycled water supplies from the Los Angeles-Glendale Water Reclamation Plant. This area also has been identified as a high priority drainage for achieving water quality benefits and therefore multiple benefits project opportunities. Partnerships between the City of Pasadena, other Raymond Basin pumpers, LACSD and LACFCD could result in very beneficial integrated projects.
D. Intra-Regional Central Basin Recharge and Los Angeles River The Los Angeles River Watershed is divided between the Upper and Lower Subregions however there is an obvious connection between the regions from a water supply and quality perspective. The southernmost area of the Subregion is downtown Los Angeles. As Figure 17 shows, the area is suitable for groundwater recharge but it also has a high level of impervious surface meaning low infiltration potential. Given that this area is upstream of the Lower Los Angeles River Subregion, water quality improvements made here would benefit both subregions. The ability to do large scale BMPs may be limited, however smaller scale decentralized LID projects in this area may be able to provide both water quality and supply benefits. Opportunities for integrated flood management projects along the Los Angeles River would seek to preserve current flood but also improve water quality and open space either for recreation and/or habitat. Partnerships could involve both the cities of Los Angeles and those in the LLAR Subregion along with the Water Replenishment District of Southern California and NGOs.
October 2013 40

GLAC IRWM Upper Los Angeles River Subregional Plan
References Los Angeles, City of, 2011. 2010 Urban Water Management Plan.
Los Angeles County Department of Regional Planning (LACDRP), 2011. Los Angeles County General Plan 2035. Public Review Draft.
LSA, 2007. Initial Study / Mitigated Negative Declaration, Puente Hills Landfill Native Habitat Preservation Authority Resource Management Plan.
Metropolitan Water District of Southern California (MWDSC), 2010. Integrated Regional Plan.
Regional Water Quality Control Board - Los Angeles Region (RWQCB), 2011. Water Management Initiative, Los Angeles River Watershed. http://www.swrcb.ca.gov/rwqcb4/water_issues/programs/regional_program/wmi/los_angeles_river_watershed/los_angeles_river_watershed.doc
RWQCB, 2011b. Shapefiles of Permitted Storm Sewer System (MS4) Discharges, Industrial General Discharges, and Caltrans Discharges.
State Water Resources Control Board (SWRCB), 2010. 2010 Integrated Report (Clean Water Act Section 303(3) List / 305(b) Report) - Statewide. http://www.waterboards.ca.gov/water_issues/programs/tmdl/integrated2010.shtml
Southern California Association of Governments (SCAG), 2012. Adopted 2012 RTP Growth Forecast. http://www.scag.ca.gov/forecast/index.htm
2004. Sun Valley Watershed Mangement Plan Final Program EIR.
U.S. Census Bureau, 2012. 2010 Census Data. Census tract.
October 2013 41

This page intentionally left blank.

GLAC IRWM Upper Los Angeles River Subregional Plan
Exhibit A. Regional Imported Water Information
October 2013
Exhibit
A-1

GLAC IRWM Upper Los Angeles River Subregional Plan
State Water Project
The SWP is a system of reservoirs, pumps and aqueducts that carries water from Lake Oroville and other facilities north of Sacramento to the Sacramento-San Joaquin Delta and then transports that water to central and southern California. Environmental concerns in the Sacramento-San Joaquin Delta have limited the volume of water that can be pumped from the SWP. The potential impact of further declines in ecological indicators in the Bay-Delta system on SWP water deliveries is unclear. Uncertainty about the long-term stability of the levee system surrounding the Delta system raises concerns about the ability to transfer water via the Bay-Delta to the SWP.
The MWD contract with the Department of Water Resources (DWR), operator of the SWP, is for 1,911,500 acre-feet/year. However, MWD projects a minimum dry year supply from the SWP of 370,000 acre-feet/year, and average annual deliveries of 1.4 million acre-feet/ year. These amounts do not include water which may become available from transfer and storage programs, or Delta improvements.
MWD began receiving water from the SWP in 1972. The infrastructure built for the project has become an important water management tool for moving not only annual deliveries from the SWP but also transfer water from other entities. MWD, among others, has agreements in place to store water at a number of groundwater basins along the aqueduct, primarily in Kern County. When needed, the project facilities can be used to move stored water to southern California.
Colorado River Aqueduct
California water agencies are entitled to 4.4 million acre-feet/year of Colorado River water. Of this amount, the first three priorities totaling 3.85 million acre-feet/year are assigned in aggregate to the agricultural agencies along the river. MWD’s fourth priority entitlement is 550,000 acre-feet per year. Until a few years ago MWD routinely had access to 1.2 million acre-feet/year because Arizona and Nevada had not been using their full entitlement and the Colorado River flow was often adequate enough to yield surplus water to MWD. According to its 2010 Regional UWMP, MWD intends to obtain a full 1.2 million acre-feet/year when possible water management programs with agricultural and other holders. MWD delivers the available water via the 242-mile Colorado River Aqueduct, completed in 1941, which has a capacity of 1.2 million acre-feet per year.
The Quantification Settlement Agreement (QSA), executed in 2003, affirms the state’s right to 4.4 million acre-feet per year, though water allotments to California from the Colorado River could be reduced during future droughts along the Colorado River watershed as other states increase their diversions in accord with their authorized entitlements. California’s Colorado River Water Use Plan and the QSA provide numeric baseline to measure conservation and transfer water programs thus enable the shifting to conserve water (such as the lining of existing earthen canals) and to shift some water from agricultural use to urban use. Since the signing of the QSA, water conservation measures have been implemented including the agriculture-to-urban transfer of conserved water from Imperial Valley to San Diego, agricultural land fallowing with Palo Verde, and the lining of the All-American Canal.
October 2013
Exhibit
A-1