golar q4 2011 report
TRANSCRIPT

7/29/2019 Golar Q4 2011 Report
http://slidepdf.com/reader/full/golar-q4-2011-report 1/23
PRELIMINARY FOURTH QUARTER AND FINANCIAL YEAR 2011RESULTS
Highlights
• Golar LNG reports consolidated net income of $17.2 million and consolidated operating incomeof $33.8 million for the fourth quarter of 2011
• Golar LNG announces an increased quarterly cash dividend of $0.325 cents per share• Golar Arctic entered into a three year charter with annualized EBITDA contribution of $45.0
million• Golar announces firm contracts for two additional LNG carriers with Hyundai• Hilli is taken out of lay-up and reactivation project is underway• Golar purchases remaining 50% interest in Gandria and proceeds with re-activating the vessel• First dropdown into Golar LNG Partners successfully completed with the sale of the Golar
Freeze
• LNG shipping market tightening. Spot rates increased from $110,000/day to $135,000/day by theend of the quarter
Financial Review
Golar LNG Limited (“Golar” or the “Company”) reports consolidated net profit of $17.2 million andconsolidated operating income of $33.8 million for the three months ended December 31, 2011 (the“fourth quarter”).
Revenues in the fourth quarter were $80.6 million as compared to $77.8 million for the third quarterof 2011 (the “third quarter”). The increase is primarily as a result of the additional revenuecontribution from Gimi which was in charter throughout the quarter. Vessel utilisation in the fourthquarter also improved slightly to 100% as compared to 99% for the third quarter. Average daily timecharter equivalent rates (“TCEs”) for the fourth quarter at $86,521 per day has decreased from the
third quarter which was at $91,614 per day. This is mainly due to the dilutive effect of Gimi’s charterrate.
Operating cost in the fourth quarter at $17.6 million is higher than third quarter at $15.0 million. Thisis mainly due to the Gimi’s re-activation cost of $3.5 million offset slightly by a reduction in costs onthe remaining vessels.
Net interest expense for the fourth quarter at $5.6 million is slightly higher from $4.9 million in thethird quarter due to a slight increase in USD LIBOR which impacted the floating debt portion of theCompany’s debt portfolio.
Other financial items have decreased to a loss of $0.05 million for the fourth quarter compared to aloss of $20.0 million in the third quarter. This is mainly due to the reversal of mark-to-market losses

7/29/2019 Golar Q4 2011 Report
http://slidepdf.com/reader/full/golar-q4-2011-report 2/23
seen in the last quarter as a result of a slight increase in medium to long-term swap rates by the endof the fourth quarter.
The Company reports operating revenues of $299.9 million, operating income of $121.0 million anda net income of $46.7 million for the year ended December 31, 2011. This compares to operating
revenues of $244.0 million, operating income of $60.2 million and a net income of $0.4 million forthe year ended December 31, 2010.
Financing, corporate and other matters
Dividends The Board has proposed an increased quarterly cash dividend of $0.325 per share in respect of thefourth quarter 2011 results. This further supports the Board’s positive outlook of the Company’sability to take advantage of the rapid positive developments in the LNG markets. The record date forthe dividend is March 11, 2012, ex-dividend date is March 7, 2012 and the dividend will be paid onor about March 21, 2012.
Golar Arctic charter The Company announced on January 13, 2012 that it has succesfully secured a three year charter forthe Golar Arctic with a major Japanese trading company. The charter will commence and influenceearnings positively from second quarter 2012, when the vessel is expected to contributeapproximately $45 million in annualized EBITDA.
Newbuildings The Company announced on February 14, 2012 that it has entered into firm contracts with HyundaiSamho Heavy Industries Co., Ltd. (“Hyundai”) for two LNG carriers to be delivered in the third andfourth quarter of 2014. The aggregate price for the two ships is approximately $400 million. As withGolar’s existing newbuilding orders, the vessels will be delivered with tri-fuel diesel electric enginesand with the lowest boil-off rate amongst LNG carriers. The firm contracts also come with fixedprice options for another two LNG carriers.
The delivery dates and price achieved for these newbuildings make them a very attractive addition toGolar’s newbuilding programme. Including these two contracts, Golar now has nine LNG carriersand two FSRUs on order. Five of these will be delivered in 2013 starting from August of that year,with the rest being delivered in 2014. Along with its two open positions of modern carriers, Golar isuniquely positioned to take advantage of the LNG market in the periods 2012 to 2014 when theglobal expectation is very positive for LNG shipping. Furthermore, the development in the
Company’s newbuilding programme confirms Golar’s commitment to be the world’s leadingindependent LNG shipping company.
HilliFollowing the successful re-activation of Gimi which has had one hundred percent utilization sinceits immediate placement into a high-quality charter, the Board has decided to re-activate Hilli. Thevessel had been in lay-up in Labuan since April 2008. The Company expects the vessel to startgenerating income from second quarter 2012. The cost of re-activation will be approximately $20million.
Gandria
The Company announced on January 23, 2012 that it had secured the remaining fifty percent (50%)interest in the company that owns the Gandria. The Company agreed a price of $19.5 million to own
7/29/2019 Golar Q4 2011 Report
http://slidepdf.com/reader/full/golar-q4-2011-report 3/23
the title of the vessel outright. The Company is happy with the agreed price considering the demandfor similar vessels during a very tight time of tonnage availability. Subsequent to its purchase thevessel is now in Singapore for a re-activation process. Re-activation cost is expected to besignificantly lower than Gimi and Hilli. The Company expects the vessel to be contributing torevenue from second quarter 2012.
Golar Freeze sale to Golar LNG Partners L.P The fourth quarter saw the first dropdown of an asset from the Company to Golar LNG Partners L.P(“Golar Partners”). The Freeze was sold for $330 million to Golar Partners which completed theacquisition by assuming the $108 million of outstanding senior bank debt on the FSRU and $222million of vendor financing provided by Golar. The loan from the Company to Golar Partners has aterm of three years and a fixed interest rate of 6.75%.
Financing In April 2011, the Company entered into a new $80 million unsecured revolving credit facility with acompany related to its major shareholder, World Shipholding. This facility has now been extended to
$250 million and will be used to part finance the Company’s newbuilding instalments. The facilitybears interest at LIBOR plus 3.5% together with a commitment fee of 0.75% of any undrawn portionof the credit facility. As of 31 January, 2012, the amount drawn down from the facility is $145million. No arrangement fee has been paid for the extension of the facility.
Shares and optionsDuring the quarter a total of 91,395 Golar LNG options were exercised. In connection with this, theCompany issued 91,395 new shares. The total number of remaining Golar LNG options is 848,904. The total number of shares outstanding in Golar excluding options is 80,236,252.
Shipping
During the quarter, strong demand for both First Generation and modern LNG carriers surfaced.Demand for multi-year shipping requirements continued to be driven by high demand for LNG,liquefaction projects due to increased exports; and fleet renewals. On the back of strong underlyingsentiments, existing tonnage continued to be secured well in advance of scheduled redeliveries fromexisting Charterers and in advance of Charterers actual need. Owners of modern tonnage withstructural availability in 2012-13 have shown preference to secure a minimum period of 3 years athistorically high rates. While the pool of existing modern tonnage available for multi-year periodsdwindled further during this quarter, small windows of vessel availability existed in the form of backhaul and short intra-regional voyage opportunities. In the absence of suitable modern tonnage,Charterers secured First Generation tonnage for periods of between 12-24 months as a bridgingsolution to their longer term structural shipping needs. As many as 11 fixtures, basis First Generationvessels, were secured for multi month charters in the fourth quarter. By the end of the quarter, thestructural availability of First Generation vessels had tightened significantly.
During this quarter and driven by the sustained West-East arbitrage, charter rates rose sharply fromaround $110,000 per day, on a round trip basis for modern steam vessels to $135,000 per day by theend of the quarter. In addition, the high interest in First Generation tonnage saw rates climb in excessof $70,000 per day. With anticipated structural tightness during 2012-2014, Owners continue to havelittle interest in offering existing modern tonnage for less than a 3 year charter at rates in excess of $130,000 per day. Given the tightness in the market, Owners continue to retain the ability to beselective in which requirements to work (nature/period of commitment and nature of the Charterer).

7/29/2019 Golar Q4 2011 Report
http://slidepdf.com/reader/full/golar-q4-2011-report 4/23
Backwardation has weakened in the LNG shipping charter market. The Company believes that thiscurve has flattened somewhat, particularly for 3 to 7 year charter periods, as the major players realisethe underlying strength of existing shipping demand.
The worldwide LNG fleet currently stands at 367 vessels including FSRUs, with a further 69 on
order; 60 vessels have been ordered since January 1, 2011. Today, there is very limited shipyardcapacity available before the last quarter of 2014 and diminishing availability for 2015.
In the period 2014 to 2015, substantial new LNG supply is anticipated from Australia and the MiddleEast, which will require significant and as yet unsecured additional shipping capacity. Additionalshipping capacity will also be needed to support the development of new liquefaction capacity, aswell as the growing short term / spot LNG trading business (which accounts for, on average, between18-22% of the overall LNG trade). The development of potential U.S. LNG export capacity willfurther increase the demand for tonnage. The demand for LNG shipping is also positively affected bythe debottlenecking of existing liquefaction facilities, which gives rise to additional LNG production.
Golar currently has three existing first generation vessels, four existing modern vessels and ninenewbuilding LNG carriers available for employment over the next three years. With fundamentalevidence of a structural deficit in the supply of LNG carriers in this same time period, the Boardbelieves that the Company is advantageously positioned to lock in solid long term returns. Golar’snew vessels will be delivered with historically low boil off rates and will have in all material respectssuperior operating performance relative to the existing fleet. The Company has already entered intospecific discussions with regards to chartering its open tonnage and expects that, in line with whatwas communicated in the third quarter results report, that several of the Company’s open newbuildpositions will be covered in the coming months.
FSRUs
On the FSRU side of the business, the Board is disappointed that due to high rate indications theCompany was unsuccessful in its recent bids. The deal flow in this sector continues to be robust and,given that the Company’s portfolio has the two earliest deliveries of newbuild FSRU’s out of theyards, the Board is optimistic at the prospects for continued growth. Regarding committed projects,the Board looks forward to the completion of the FSRU conversion for the Nusantara Regas Projectin West Java Indonesia after which, similar to the successful Golar Freeze transaction, the vessel willbe offered for sale into Golar LNG Partners.
The Company continues to bid into ongoing FSRU tenders. Golar’s outlook remains positive againstfirm demand for new projects and recognition that it has the only two FSRU newbuildings availableduring the period from Sep 2013 to approximately May of 2014. The Company remains committedto this sector with increasing focus on newbuildings and delivering projects to shareholders with aview to increased returns.
The West Java FSRU project is entering its final phases of project execution. Mechanicalcompletion of the FSRU conversion is targeted at Jurong shipyard by the end of first quarter 2012. The mooring jetty construction which is fifteen kilometres offshore Java will reach mechanicalcompletion in February 2012. Khannur, in compliance with cabotage requirements, is nowIndonesian flagged and has been renamed Nusantara Regas Satu. The vessel is in the final stages of
vessel registration prior to its importation. First gas is expected during second quarter 2012.

7/29/2019 Golar Q4 2011 Report
http://slidepdf.com/reader/full/golar-q4-2011-report 5/23
LNG Market
Incremental LNG supplies remain available in the market, limited primarily to West African, USGulf Coast re-export, NW Europe re-export and Middle East sources.
During this quarter, Far East demand was soft due to mild weather and oversupply for fourth quarter2011 deliveries. Consequently, buying interest became more opportunistic as a direct result of ullageconstraints in both Korea and Japan. As such, the recent over supply in the Far East for fourthquarter 2011 deliveries pushed additional deliveries out further. By the end of the year most Utilitieswere covered as far out as February and focusing on securing March deliveries. With anticipation of spot cargo prices falling in the first quarter 2012 and ample available supply, there was no urgency tosource forward cargoes. While forward appetite for incremental supply in the Far East is expected toremain strong going into the summer period, the anticipated announcement of which Japanesenuclear reactors will be allowed to restart in 2012 will influence and determine Japanese buyinginterest for the second quarter of 2012 and beyond. Nuclear utilization in Japan continues to fall, andcould drop to zero by spring.
While Europe remained quiet, South American markets remain active with considerable supplymoving into both Argentina and Brazil, even as their peak demand season came to a close. Increaseddemand in South America surfaced, with a tender from Argentina resulting in Enarsa securing 3.2million tonnes of LNG for delivery in 2012 into both Escobar and Bahia Blanca, first delivery wasexpected in January. Re-export opportunities out of the United States and Europe have gainedground with up to 33 cargoes re-exported in 2011.
New LNG supply projects slated to come on line in the coming quarters have been delayed. Start-upof Woodside’s Pluto Train 1 is now expected in March 2012, while Angola LNG is slated to comeon line towards the end of the second quarter 2012. In addition to these, supply projects underconstruction in both the Atlantic and Pacific Basin have reached close to 73 million tonnes, with 54million tonnes slated to come on line by 2016. Furthermore, two projects (Sabine LNG Export /Australia Pacific LNG Train 2) are close to announcing a final investment decision, adding anadditional capacity of 22.5 million tonnes to projects under construction.
This additional new production in 2012 from Pluto and Angola LNG, together with debottleneckingprojects and the ramp up of the significant number of new projects that have recently started upcould add up to 14 million tonnes of LNG (or approximately 5.2% of total current production) to themarket by the end of 2012. In the same timeframe only 2 conventional size vessels are expected to bedelivered, both dedicated to lift project volumes from Malaysia and Angola.
Outlook
The Company remains very encouraged with the robust growth outlook of the LNG industry whichis now in plain sight. Albeit with minor delays inevitable, production from committed new trainsand debottlenecking projects will be adding significant quantities of LNG to the market. Additionalprojects, notably in the United States, are nearing the point of commitment which may furtherincrease the trend. Liquefaction capacity, excluding U.S capacity, is expected to grow by more than15% by 2015. LNG quantities, as a percentage of total production, traded on a short term basiscontinue to increase. Japan’s power companies and China’s total LNG import increased by 39% and30%, respectively, from 2010. All these factors are contributors to the strong forward demand for
LNG shipping capacity for many years to come.

7/29/2019 Golar Q4 2011 Report
http://slidepdf.com/reader/full/golar-q4-2011-report 6/23
In response, the Board has taken several key steps to position the Company to capitalize on thismarket environment. With the recent additional newbuild orders the Company has a total of 13modern LNG carriers including 2 FSRU's available for new chartering opportunities in the period2012- 2014. In addition the company has several older vessels available. The Company will use theexisting open positions to seek strategic partnerships as well as creating a balanced portfolio of short,
medium and long term charters. In addition to the contracts with Hyundai, Golar is in finaldiscussions with regards to further increasing the Company's new building investment. With thesenew investments in vessels at attractive prices, the current portfolio of long term charters and thecorporate structure including Golar LNG Partners, the Company is well positioned to serve itscustomers’ rapid expansion and to grow earnings aggressively in the years the come. The Board iscommitted to making the Company the world’s leading independent LNG shipping company.
The Board is hopeful that a significant part of the Company’s current market capitalization can berepaid to shareholders in the form of cash dividends in the next three to five years. The size of thedividend will be dependent on asset sales to Golar LNG Partners L.P (“Golar Partners”), financing of its existing newbuild programme, any potential monetisation of its holding in and dividend receipts
from Golar Partners and cash flow from its normal activities.
The Company expects its first quarter 2012 EBITDA to be in line with fourth quarter 2011 before theimpact of reactivation costs. However, with the commencement of charters for Grand, Arctic andrevenue contribution from Hilli, Gandria and Khannur, the Company expects that its EBITDA willhave grown by more than 40% in the second quarter. EBITDA is expected to grow further in thethird and fourth quarter 2012 based on existing contracts. Further growth can be expected in 2013and 2014 when the newbuildings are delivered and the total fleet increases from 13 to 24 units. Theboard is excited about the outlook for the Company.
Forward Looking Statements
This press release contains forward looking statements. These statements are based upon variousassumptions, many of which are based, in turn, upon further assumptions, including examination of historical operating trends made by the management of Golar LNG. Although Golar LNG believesthat these assumptions were reasonable when made, because assumptions are inherently subject tosignificant uncertainties and contingencies, which are difficult or impossible to predict and arebeyond its control, Golar LNG cannot give assurance that it will achieve or accomplish theseexpectations, beliefs or intentions.
Included among the factors that, in the Company's view, could cause actual results to differ
materially from the forward looking statements contained in this press release are the following:inability of the Company to obtain financing for the new building vessels at all or on favourableterms; changes in demand; a material decline or prolonged weakness in rates for LNG carriers;political events affecting production in areas in which natural gas is produced and demand for naturalgas in areas to which our vessels deliver; changes in demand for natural gas generally or in particularregions; changes in the financial stability of our major customers; adoption of new rules andregulations applicable to LNG carriers and FSRU’s; actions taken by regulatory authorities that mayprohibit the access of LNG carriers or FSRU’s to various ports; our inability to achieve successfulutilisation of our expanded fleet and inability to expand beyond the carriage of LNG; increases incosts including: crew wages, insurance, provisions, repairs and maintenance; changes in generaldomestic and international political conditions; the current turmoil in the global financial markets
and deterioration thereof; changes in applicable maintenance or regulatory standards that could affectour anticipated dry-docking or maintenance and repair costs; our ability to timely complete our

7/29/2019 Golar Q4 2011 Report
http://slidepdf.com/reader/full/golar-q4-2011-report 7/23
FSRU conversions; failure of shipyards to comply with delivery schedules on a timely basis andother factors listed from time to time in registration statements and reports that we have filed with orfurnished to the Securities and Exchange Commission, including our Registration Statement on Form20-F and subsequent announcements and reports. Nothing contained in this press release shallconstitute an offer of any securities for sale.
February 21, 2012 The Board of DirectorsGolar LNG LimitedHamilton, Bermuda.
Questions should be directed to:Golar Management Limited - +44 207 063 7900
Doug Arnell – Chief Executive Officer
Brian Tienzo – Chief Financial Officer

7/29/2019 Golar Q4 2011 Report
http://slidepdf.com/reader/full/golar-q4-2011-report 8/23
Golar LNG L imited
FOURTH QUARTER CONDENSED CONSOLI DATED FINANCIAL STATEMENTS(UNAUDITED)
INCOME STATEMENT 2011 2011 2010 2011 2010(in thousands of $) Oct-Dec J ul-Sep Oct-Dec J an - Dec J an-Dec
Operating revenues 80,622 77,771 64,615 299,848 244,045
Vessel operating expenses 17,622 14,970 15,180 62,872 52,910
Voyage and charterhire expenses 1,022 357 3,172 6,042 32,311
Administrative expenses 9,896 6,162 7,455 33,679 22,832
Depreciation and amortization 18,301 17,060 16,432 70,286 65,076
Impairment of long-term assets 500 - 4,500 500 4,500
Total operating expenses 47,341 38,549 46,739 173,379 177,629
Other operating gains and losses 515 6,258 (2,862) (5,438) (6,230)
Operating income 33,796 45,480 15,014 121,031 60,186
Gain on sale of available-for-sale-securities
- - 2,379 541 4,196
Financial income (expenses)
Interest income 565 428 401 1,757 4,290
Interest expense (6,136) (5,338) (7,474) (25,773) (32,654)
Other financial items (47) (20,015) (8,314) (29,086) (38,597)
Net financial expenses (5,618) (24,925) (15,387) (53,102) (66,961)
Income (losses) before taxes,equity in net earnings of associates and non-controllinginterests
28,178 20,555 2,006 68,470 (2,579)
Taxes (926) 1,019 94 1,705 (1,427)
Equity in net earnings (losses) of
investees(240) (431) (356) (1,900) (1,435)
Net income (loss) 27,012 21,143 1,744 68,275 (5,441)
Net (income) loss attributable tonon-controlling interests
(9,832) (7,400) 2,970 (21,625) 5,825
Net income (loss) attributable toGolar LNG L td
17,180 13,743 4,714 46,650 384
Basic and diluted earnings (loss)per share ($)
$0.21 $0.17 $0.07 $0.62 $0.01
The accompanying notes are an integral part of these condensed consolidated financial statements

7/29/2019 Golar Q4 2011 Report
http://slidepdf.com/reader/full/golar-q4-2011-report 9/23
Golar LNG L imited
FOURTH QUARTER CONDENSED CONSOLI DATED FINANCIAL STATEMENTS(UNAUDITED)
Statement of ComprehensiveIncome 2011 2011 2010 2011 2010
(in thousands of $)Oct-Dec J ul-Sep Oct-Dec J an-Dec J an-Dec
Net income (loss) 27,012 21,143 1,744 68,275 (5,441)
Other comprehensive (loss) income:
Losses associated with pensions (netof tax) (3,139) - (95) (3,139) (95)
Unrealized losses on marketablesecurities - - (1,087) - (9,942)Unrealized net gain (loss) onqualifying cash flow hedginginstruments 2,930 (2,306) 6,250 1,024 (8,578)
Other comprehensive (loss) income (209) (2,306) 5,068 (2,115) (18,615)
Comprehensive income (loss) 26,803 18,837 6,812 66,160 (24,056)
Comprehensive income (loss)attributable to:
Stockholders of Golar LNG Limited 16,354 11,577 5,545 43,636 (14,108)
Non-controlling interests 10,449 7,260 1,267 22,524 (9,948)
26,803 18,837 6,812 66,160 (24,056)
The accompanying notes are an integral part of these condensed consolidated financial statements.

7/29/2019 Golar Q4 2011 Report
http://slidepdf.com/reader/full/golar-q4-2011-report 10/23
Golar LNG L imited
FOURTH QUARTER CONDENSED CONSOLI DATED FINANCIAL STATEMENTS(UNAUDITED)
BALANCE SHEET 2011 2010
(in thousands of $) Dec-31 Dec-31
ASSETS
Short-term
Cash and cash equivalents 66,913 164,717
Restricted cash and short-term investments 28,012 21,815
Other current assets 10,687 17,578
Amounts due from related parties 354 222
Long-term
Restricted cash 185,270 186,041
Equity in net assets of non-consolidated investees 22,529 20,276
Newbuildings 190,100 -
Vessels and equipment, net 1,704,907 1,618,803
Other long-term assets 23,862 48,320
Total assets 2,232,634 2,077,772
LIABIL ITIES AND
STOCKHOLDERS’ EQUITY
Short-term
Current portion of long-term debt 64,306 105,629
Current portion of capital lease obligations 5,909 5,766
Other current liabilities 164,747 135,323
Amounts due to related parties 21,178 438
Long-term
Long-term debt 627,243 681,549
Long-term debt to related parties 80,000 10,000
Obligations under capital leases 399,934 406,109
Other long-term liabilities 113,497 133,636
Equity
Non-controlling interests 78,055 188,734
Stockholders’ equity 677,765 410,588
Total liabilities and stockholders’ equity 2,232,634 2,077,772
The accompanying notes are an integral part of these condensed consolidated financial statements.

7/29/2019 Golar Q4 2011 Report
http://slidepdf.com/reader/full/golar-q4-2011-report 11/23
Golar LNG L imited
FOURTH QUARTER CONDENSED CONSOLIDATED FINANCIAL STATEMENTS(UNAUDITED)
STATEMENT OF CASH FLOWS2011 2011 2010 2011 2010
(in thousands of $)Oct-Dec J ul-Sep Oct-Dec J an-Dec J an-Dec
OPERATING ACTIVITIES
Net income (loss) 27,012 21,143 1,744 68,275 (5,441)
Adjustments to reconcile net income(loss) to net cash provided by operatingactivities:
Depreciation and amortization 18,301 17,060 16,432 70,286 65,076
Amortization of deferred tax benefits onintragroup transfers
(1,814) (1,814) - (6,687) -
Amortization of deferred charges 359 367 72 1,484 1,494
Loss on termination of financingarrangements
- - 7,777 - 7,777
Undistributed net earnings (losses) of non-consolidated investee
240 431 356 1,900 1,435
Drydocking expenditure (2,264) (7,852) - (19,773) (7,369)
Stock-based compensation 889 415 513 1,970 1,869
Gain on available-for-sale-securities - - (2,379) (541) (4,196)
Change in market value of derivatives (3,556) 17,386 (7,986) 3,117 -
Trade accounts receivable 2,849 29,384 (301) 5,245 (2,010)
Inventories 1,099 39,727 (22) 2,479 1,166
Prepaid expenses, accrued income andother assets
2,421 (3,267) 31,274 (3,721) (17,629)
Amount due from/to related companies (440) (2) 254 (404) 713
Trade accounts payable (23,413) (30,231) 8,412 (12,804) (7,221)
Accrued expenses (5,943) (8,106) (6,962) 8,082 409
Interest element included in capital leaseobligations
270 252 275 898 762
Unrealized foreign exchange (gain)/loss (183) (3,505) (1,654) 1,669 (5,180)
Impairment of long-term assets 500 - 4,500 500 4,500
Other current and long-term liabilities 2,069 643 9,182 (5,367) 15,555
Net cash provided by operatingactivities
18,396 72,031 61,487 116,608 51,710
The accompanying notes are an integral part of these condensed consolidated financial statements.

7/29/2019 Golar Q4 2011 Report
http://slidepdf.com/reader/full/golar-q4-2011-report 12/23
Golar LNG L imited
FOURTH QUARTER CONDENSED CONSOLI DATED FINANCIAL STATEMENTS(UNAUDITED)
STATEMENT OF CASH FLOWS(continued) 2011 2011 2010 2011 2010(in thousands of $)
Oct-Dec J ul-Sep Oct-Dec J an-Dec J an-Dec
INVESTING ACTIVIT IES
Additions to vessels and equipment (13,488) (44,362) (2,470) (99,082) (33,927)
Additions to newbuildings (8,136) (64,642) - (190,100) -
Additions to unlisted investments (3,833) (97) (107) (4,152) (469)
Placement of long-term restricted cash - - - (1,739) -
Proceeds from sale of investments inavailable-for-sale securities - - - 901 7,711
Proceeds from disposal of marketablesecurities - - 4,238 - -
Restricted cash and short-terminvestments (238) 8,241 393,812 (4,472) 391,421
Net cash (used in) provided byinvesting activities (25,695) (100,860) 395,473 (298,644) 364,736
FINANCING ACTIVITIES
Proceeds from short-term debt - - - 23,600 -
Proceeds from long-term debt - - - - 125,000Proceeds from long-term debt to related
parties - 45,000 - 80,000 -Repayments of obligations under
capital leases (1,463) (1,552) (342,342) (6,054) (354,881)
Repayments of long-term debt (21,573) (9,619) (24,231) (105,750) (110,037)
Repayments of short-term debt - (23,600) - (23,600) -
Cash dividends paid (12,939) (11,769) (27,214) (65,022) (45,761)
Acquisition of non-controlling interest - (275) (15,741) (108,050) (15,741)
Non-controlling interest dividends (6,220) (5,312) (1,000) (12,532) (3,120)Proceeds from exercise of share
options (including disposal of treasury shares) 995 2,471 3,448 13,845 2,985
Proceeds from sales of shares in non-
controlling interests - - 5,605 - 5,549Proceeds from issuance of equity in
subsidiaries to non-controllinginterests - - 3,304 287,795 3,304
Proceeds arising from exercise of warrants - - 18,742 - 18,742
Net cash (used in) provided byfinancing activities (41,200) (4,656) (379,429) 84,232 (373,960)
Net (decrease) increase in cash andcash equivalents (48,499) (33,485) 77,531 (97,804) 42,486Cash and cash equivalents atbeginning of period 115,412 148,897 87,186 164,717 122,231Cash and cash equivalents at end of period 66,913 115,412 164,717 66,913 164,717
The accompanying notes are an integral part of these condensed consolidated financial statements.

7/29/2019 Golar Q4 2011 Report
http://slidepdf.com/reader/full/golar-q4-2011-report 13/23
Golar LNG L imited
FOURTH QUARTER CONDENSED CONSOLIDATED FINANCIAL STATEMENTS(UNAUDITED)
STATEMENT OF CHANGES INEQUITY
(in thousands of $) ShareCapital
TreasuryShares
AdditionalPaid inCapital
Contrib-uted
Surplus
AccumulatedOther
Comprehensi-ve loss
AccumulatedRetainedEarnings
Total beforeNon-
ControllingInterest
Non-Controlling
Interest
TotalStockholders’
Equity
Balance at December 31, 2010 67,809 (2,280) 100,285 200,000 (33,312) 78,086 410,588 188,734 599,322
Net income - - - - - 46,650 46,650 21,625 68,275
Dividends- - - - - (86,156) (86,156) - (86,156)
Share options charge - - 1,970 - - - 1,970 - 1,970Incorporation costs
- - 40 - - - 40 - 40
Disposal of treasury shares- 2,280 - - - - 2,280 - 2,280
Non-controlling interest dividends - - - - - - - (12,532) (12,532)
Exercise of share options 825 - 12,493 - - (4,487) 8,831 667 9,498
Acquisition of shares in non-controlling interest¹
11,603 - 3,853 - 1,378 - 16,834 (129,379) (112,545)
Creation of non-controlling interest 2 - - 183,010 - - - 183,010 104,773 287,783
Impact of transfer of Freeze intoGolar Partners3
- - 96,732 - - - 96,732 (96,732) -
Other comprehensive (loss) income - - - - (3,014) - (3,014) 899 (2,115)
Balance at December 31, 2011 80,237 - 398,383 200,000 (34,948) 34,093 677,765 78,055 755,820
The accompanying notes are an integral part of these condensed consolidated financial statements.
Footnote:
1. In connection with the acquisition of the Golar Energy shares the company increased its ownership of Golar Energy duringthe period from 61.1% to 99.6%. On June 3, 2011 a compulsory offer was made to acquire the remaining 0.4% resulting inthe delisting of Golar Energy from Oslo Axess on July 4, 2011. Of the 92,333,112 Golar Energy shares acquired 70,315,792were exchanged for newly issued Golar LNG shares where the seller received one newly-issued Golar LNG share for every6.06 Golar Energy shares, increasing the Company’s share capital by 11,603,253 and share premium by $340.0 million. The
new Golar LNG shares were effectively issued for $30.30 per share. The remaining Golar Energy shares were acquired at aprice of approximately $5 per share. As a result of this non-controlling interest of $129.4 million was eliminated and thedifference between the NCI and consideration paid was recognised as a reduction in APIC of $335.9 million.
2. In April 2011, the Company completed a public offering of 13.8 million common units (including 1.8 million units issued inrespect of an over-allotment option) of its subsidiary, Golar LNG Partners LP (Golar Partners), which is listed on theNASDAQ stock exchange under the symbol "GMLP". As a result of the offering the Company’s ownership of GolarPartners was reduced to approximately 65%. The 13.8 million units were priced at $22.50 per unit resulting in grossproceeds of $310.5 million (net proceeds of $287.8 million).
3. In October 2011, certain subsidiaries which owned the FSRU, the Golar Freeze, were dropped down into Golar Partners.Purchase consideration was based upon the fair value of the entities, net of debt assumed. Golar Partners accounted for thisacquisition as a transfer under common control. Under this method the book value of the net assets acquired is recognised onthe Golar Partner's balance sheet and the excess of proceeds paid by Golar Partners over these book values is accounted for
as an equity distribution. At Golar Partners' level, the overall impact of this accounting treatment is a reduction in equity. This reduction in overall equity at Golar Partners' level results in a reduction of the non-controlling interest relating to GolarPartner's in the Company's financial statements.

7/29/2019 Golar Q4 2011 Report
http://slidepdf.com/reader/full/golar-q4-2011-report 14/23
Golar LNG L imitedNotes to Condensed Consolidated Interim Financial Statements
1. GENERAL
Golar LNG Limited (the "Company" or "Golar") was incorporated in Hamilton, Bermuda on May10, 2001 for the purpose of acquiring the liquefied natural gas ("LNG") shipping interests of OspreyMaritime Limited, which was owned by World Shipholding Limited (“World Shipholding”), acompany indirectly controlled by Trusts established by John Fredriksen for the benefit of hisimmediate family. Mr. Fredriksen is a Director, the Chairman and President of Golar. As of December 31, 2011, World Shipholding owned 45.81% (December 31, 2010: 45.75%) of Golar.
2. ACCOUNTING POLI CIES
Basis of accounting
The condensed consolidated financial statements are prepared in accordance with accounting
principles generally accepted in the United States. The condensed consolidated financial statementsdo not include all of the disclosures required in the annual consolidated financial statements, andshould be read in conjunction with the Company’s annual financial statements for the year December31, 2010.
As explained in further detail in the Company’s 2010 annual financial statements, certain amountsreported in prior periods have been reclassified to be consistent with the current quarter’s and year’spresentation. In the opinion of management these condensed consolidated interim financials includeall adjustments, of a normal recurring nature, necessary for a fair statement.
Significant accounting policies
The accounting policies adopted in the preparation of the condensed consolidated interim financialstatements are consistent with those followed in the preparation of the Company’s annualconsolidated financial statements for the year ended December 31, 2010.
3. SEGMENTAL INFORMATION
The Company provides vessel operations on charters, including time charters and spot rentals, andtrades in physical and future LNG contracts. Golar's reportable segments consist of the primaryservices it provides. Although Golar's segments are generally influenced by the same economicfactors, each represents a distinct product in the LNG industry. There have not been anyintersegment sales during the periods presented. Segment results are evaluated based on operating
income. The accounting principles for the segments are the same as for the Company's consolidatedfinancial statements.
The business is split into two segments based on differences in management structure and reporting,economic characteristics, customer base, asset class and contract structure. The Company operates inthe following two segments:
• Vessel Operations – The Company owns or leases, and subsequently charters out LNGvessels and FSRUs for fixed terms to customers.
• LNG Trading – Provides physical and financial risk management in LNG and gas markets forits customers around the world. Activities include structured services to outside customers,
arbitrage service as well as proprietary trading.
7/29/2019 Golar Q4 2011 Report
http://slidepdf.com/reader/full/golar-q4-2011-report 15/23
Golar LNG L imitedNotes to Condensed Consolidated Interim Financial Statements (continued)
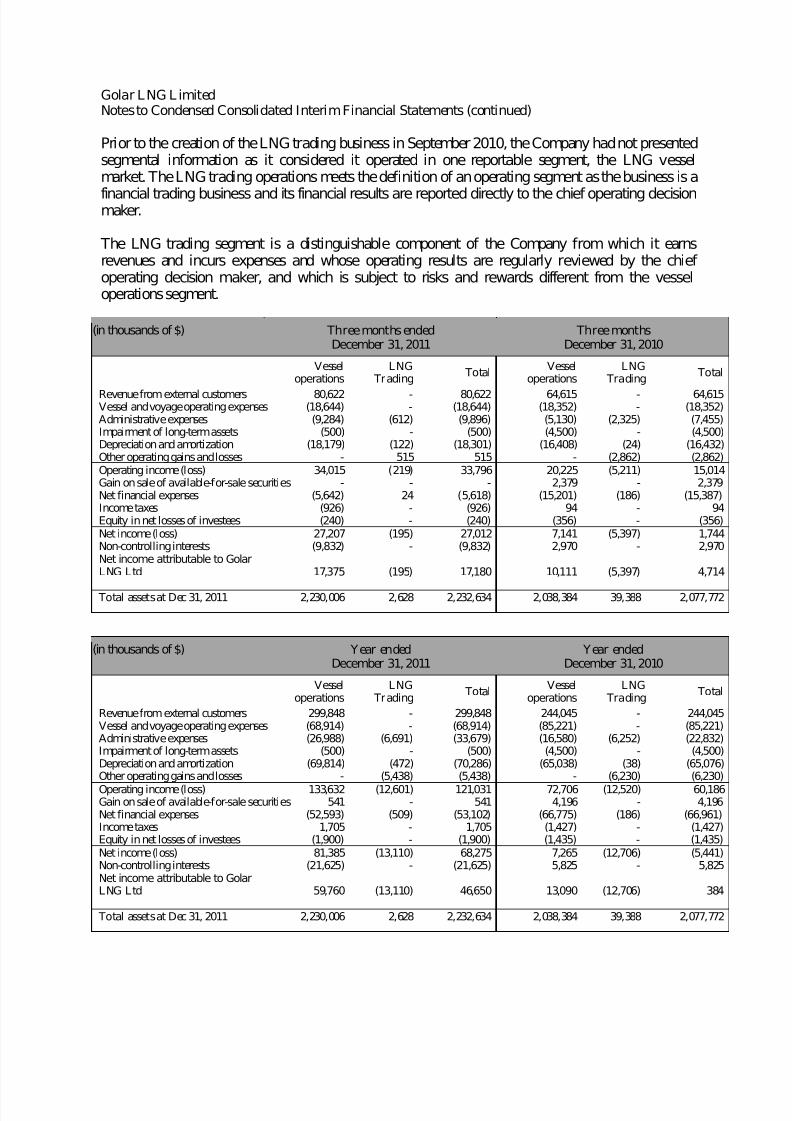
Prior to the creation of the LNG trading business in September 2010, the Company had not presentedsegmental information as it considered it operated in one reportable segment, the LNG vessel
market. The LNG trading operations meets the definition of an operating segment as the business is afinancial trading business and its financial results are reported directly to the chief operating decisionmaker.
The LNG trading segment is a distinguishable component of the Company from which it earnsrevenues and incurs expenses and whose operating results are regularly reviewed by the chief operating decision maker, and which is subject to risks and rewards different from the vesseloperations segment.
(in thousands of $) Three months endedDecember 31, 2011
Three monthsDecember 31, 2010
Vesseloperations
LNG Trading
TotalVessel
operationsLNG
Trading Total
Revenue from external customers 80,622 - 80,622 64,615 - 64,615Vessel and voyage operating expenses (18,644) - (18,644) (18,352) - (18,352)Administrative expenses (9,284) (612) (9,896) (5,130) (2,325) (7,455)Impairment of long-term assets (500) - (500) (4,500) - (4,500)Depreciation and amortization (18,179) (122) (18,301) (16,408) (24) (16,432)Other operating gains and losses - 515 515 - (2,862) (2,862)Operating income (loss) 34,015 (219) 33,796 20,225 (5,211) 15,014Gain on sale of available-for-sale securities - - - 2,379 - 2,379Net financial expenses (5,642) 24 (5,618) (15,201) (186) (15,387)Income taxes (926) - (926) 94 - 94Equity in net losses of investees (240) - (240) (356) - (356)Net income (loss) 27,207 (195) 27,012 7,141 (5,397) 1,744Non-controlling interests (9,832) - (9,832) 2,970 - 2,970Net income attributable to GolarLNG Ltd 17,375 (195) 17,180 10,111 (5,397) 4,714
Total assets at Dec 31, 2011 2,230,006 2,628 2,232,634 2,038,384 39,388 2,077,772
(in thousands of $) Year endedDecember 31, 2011
Year endedDecember 31, 2010
Vesseloperations
LNG Trading
TotalVessel
operationsLNG
Trading Total
Revenue from external customers 299,848 - 299,848 244,045 - 244,045Vessel and voyage operating expenses (68,914) - (68,914) (85,221) - (85,221)Administrative expenses (26,988) (6,691) (33,679) (16,580) (6,252) (22,832)Impairment of long-term assets (500) - (500) (4,500) - (4,500)Depreciation and amortization (69,814) (472) (70,286) (65,038) (38) (65,076)Other operating gains and losses - (5,438) (5,438) - (6,230) (6,230)Operating income (loss) 133,632 (12,601) 121,031 72,706 (12,520) 60,186Gain on sale of available-for-sale securities 541 - 541 4,196 - 4,196Net financial expenses (52,593) (509) (53,102) (66,775) (186) (66,961)Income taxes 1,705 - 1,705 (1,427) - (1,427)Equity in net losses of investees (1,900) - (1,900) (1,435) - (1,435)Net income (loss) 81,385 (13,110) 68,275 7,265 (12,706) (5,441)Non-controlling interests (21,625) - (21,625) 5,825 - 5,825Net income attributable to GolarLNG Ltd 59,760 (13,110) 46,650 13,090 (12,706) 384
Total assets at Dec 31, 2011 2,230,006 2,628 2,232,634 2,038,384 39,388 2,077,772

7/29/2019 Golar Q4 2011 Report
http://slidepdf.com/reader/full/golar-q4-2011-report 16/23
Golar LNG L imitedNotes to Condensed Consolidated Interim Financial Statements (continued)
3. SEGMENTAL INFORMATION (continued)
Revenues from external customers
The vast majority of the Company’s Vessel Operations arise under time charters and in particularwith three charterers, Petrobras, Dubai Supply Authority and Pertamina. Petrobras is a Brazilianenergy company. Dubai Supply Authority, or DUSUP is a government entity which is the solesupplier of natural gas to the Emirate. Pertamina is the state-owned oil and gas company of Indonesia. In time charters, the charterer, not the Company, controls the choice of which routes theCompany's vessel will serve. These routes can be worldwide. Accordingly, the Company'smanagement, including the chief operating decision maker, does not evaluate the Company’sperformance either according to customer or geographical region.
For the three and twelve months period ended December 31, 2011 and 2010, revenues from thefollowing customers accounted for over 10% of the Company’s consolidated revenues:
(in thousands of $) Three months ended Year ended
December 31, December 31,
2011 2010 2011 2010
Petrobras 23,702 29% 22,767 35% 93,740 31% 90,652 37%
Qatar Gas TransportCompany
11,667 14% - - 35,461 12% - -
DUSUP 12,041 15% 11,990 19% 47,047 16% 29,893 12%
Pertamina 9,273 12% 9,065 14% 37,685 13% 36,944 15%
BG Group plc 6,338 8% 6,309 10% 25,013 8% 49,147 20%
Shell - - 8,382 13% 5,105 2% 25,440 10%
4. EARNINGS PER SHARE
Basic earnings per share (“EPS”) are calculated with reference to the weighted average number of common shares outstanding during the period. Treasury shares are not included in the calculation. The computation of diluted EPS for the twelve and three month periods ended December 31, 2011and 2010 respectively, assumes the conversion of potentially dilutive instruments.
The components of the numerator for the calculation of basic and diluted EPS are as follows:
Three months ended Year endedDecember 31, December 31,
(in thousands of $) 2011 2010 2011 2010
Net income attributable to Golar LNG Ltdavailable to stockholders – basic and diluted
17,180 4,714 46,650 384

7/29/2019 Golar Q4 2011 Report
http://slidepdf.com/reader/full/golar-q4-2011-report 17/23
Golar LNG L imitedNotes to Condensed Consolidated Interim Financial Statements (continued)
4. EARNINGS PER SHARE (continued)
The components of the denominator for the calculation of basic and diluted EPS are as follows:
Three months ended Year endedDecember 31, December 31,
(in thousands of $) 2011 2010 2011 2010
Basic earnings per share
Weighted average number of shares 80,164 67,657 74,707 67,597Weighted average number of treasury shares - (346) - (424)Weighted average number of common sharesoutstanding
80,164 67,311 74,707 67,173
Three months ended Year endedDecember 31, December 31,
(in thousands of $) 2011 2010 2011 2010
Diluted earnings per share:
Weighted average number of common sharesoutstanding 80,164 67,311 74,707 67,173Effect of dilutive share options 105 78 326 220Common stock and common stock equivalents 80,269 67,389 75,033 67,393
Earnings per share are as follows:
Three months ended Year endedDecember 31, December 31,
2011 2010 2011 2010
Basic and diluted $0.21 $0.07 $0.62 $0.01
5. NEWBUILDINGS
The Company has contracts to build seven LNG carriers and two FSRU’s at a total contract cost of approximately $1.8 billion. As at December 31, 2011, $190.1 million of newbuild costs had beencapitalized. The remaining installments for these vessels are due to be paid as follows:
(in millions of $)
Payable in 12 months to December 31, 2012 152.4
Payable in 12 months to December 31, 2013 914.8
Payable in 12 months to December 31, 2014 576.7
1,643.9
6. VESSELS AND EQUIPMENT
Significant additions to vessels and equipment for the year ended December 31, 2011 include $128.8
million costs relating to the conversion of the Khannur to a FSRU and $13.7 million in relation to thereactivation of the Gimi.

7/29/2019 Golar Q4 2011 Report
http://slidepdf.com/reader/full/golar-q4-2011-report 18/23
Golar LNG L imitedNotes to Condensed Consolidated Interim Financial Statements (continued)
7. DEBT AND CAPITAL LEASES
As of December 31, 2011 and December 31, 2010, the Company had long-term debt outstanding of $771.5 million and $797.2 million, respectively.
The Company’s capital lease obligations as at December 31, 2011, and December 31, 2010, were$405.8 million and $411.9 million, respectively.
In April 2011, the Company entered into a new $80 million revolving credit facility with a companyrelated to its major shareholder, World Shipholding. See note 9 for details.
8. FINANCIAL INSTRUMENTS
Fair values The Company recognizes its fair value estimates using a fair value hierarchy based on the inputsused to measure fair value. The fair value of hierarchy has three levels on reliability of inputs used todetermine fair value as follows:
Level 1: Quoted market prices in active markets for identical assets and liabilities.Level 2: Observable market based inputs or unobservable inputs that are corroborated by marketdata.Level 3: Unobservable inputs that are not corroborated by market data.
The carrying values and estimated fair values of the Company’s financial instruments at December
31, 2011 and December 31, 2010 are as follows:
December 31, 2011 December 31, 2010
(in thousands of $)
Fair valueHierarchy
CarryingValue
Fairvalue
CarryingValue
Fair Value
Non-Derivatives:
Cash and cash equivalents Level 1 66,913 66,913 164,717 164,717
Restricted cash and short-term investments Level 1 213,282 213,282 207,856 207,856
Long-term unlisted investments (1) 7,347 N/a 7,347 N/a
Long-term debt – fixed (1) - - 10,000 10,000
Long-term debt – floating (1) 771,549 771,549 787,178 787,178
Obligations under capital leases (1) 405,843 405,843 411,875 411,875
Derivatives:
Commodity contracts asset (2) Level 2 - - 111 111
Interest rate swaps liability (2) Level 2 59,084 59,084 50,051 50,051
Foreign currency swaps liability (2) Level 2 27,622 27,622 26,205 26,205
1. The fair value hierarchy is only applicable to each financial instrument on the consolidated balance sheets that are recorded at fairvalue on a recurring basis.
2. Derivative liabilities are captured within other current liabilities and derivative assets are captured within long-term assets on thebalance sheet.

7/29/2019 Golar Q4 2011 Report
http://slidepdf.com/reader/full/golar-q4-2011-report 19/23
Golar LNG L imitedNotes to Condensed Consolidated Interim Financial Statements (continued)
8. FINANCIAL INSTRUMENTS (continued)
The carrying values of cash and cash equivalents, which are highly liquid, are a reasonable estimateof fair value.
The estimated fair value for restricted cash and short-term investments is considered to be equal tothe carrying value since they are placed for periods of less than six months. The estimated fair valuefor long-term restricted cash is considered to be equal to the carrying value since it bears variableinterest rates, which are reset on a quarterly basis.
As at December 31, 2011, the Company did not identify any events or changes in circumstances thatwould indicate the carrying value of its unlisted investment in OLT Offshore Toscana S.p.A, orOLT-O were not recoverable. Accordingly, the Company did not estimate the fair value of this
investment as at December 31, 2011.
The estimated fair value for floating long-term debt is considered to be equal to the carrying valuesince it bears variable interest rates, which are reset on a quarterly or six monthly basis.
The estimated fair values of obligations under capital leases are considered to be equal to thecarrying value since they bear interest at rates which are reset on a quarterly basis.
Commodity contracts are measured at fair value with gains and losses recorded in the incomestatement within other operating gains and losses. Trading gains of $0.5 million and $5.4 million losswere recognized in the three and twelve month periods ended December 31, 2011, respectively and
trading losses of $2.7 million and $6.2 million were recognized in the three and twelve monthperiods ended December 31, 2010, respectively.
The fair value of the Company’s derivative instruments is the estimated amount that the Companywould receive or pay to terminate the agreements at the reporting date, taking into account currentinterest rates, foreign exchange rates, closing quoted market prices and the creditworthiness of theCompany and its swap counterparties.
As of December 31, 2011, the Company has entered into the following interest rate swaptransactions involving the payment of fixed rates in exchange for LIBOR as summarized below. Thesummary also includes those that are designated as cash flow hedges amounting to $436.3 million:
Instrument (in thousands of $)
Notional value Maturity Dates Fixed Interest Rates
Interest rate swaps:Receiving floating, pay fixed 899,080 2012-2018 0.92% to 5.04%
At December 31, 2011, the notional principal amount of the debt and capital lease obligationsoutstanding subject to such swap agreements was $899.1 million (December 31, 2010: $620.3million).

7/29/2019 Golar Q4 2011 Report
http://slidepdf.com/reader/full/golar-q4-2011-report 20/23
Golar LNG L imitedNotes to Condensed Consolidated Interim Financial Statements (continued)
9. RELATED PARTY TRANSACTIONS
Receivables (payables) from related parties:
(in thousands of $) December 31, 2011 December 31, 2010
Frontline 181 (278)
Bluewater Energy Services B.V. 125 -
Ship Finance 47 124
World Shipholding* (21,134) -
Seatankers (43) (62)
(20,824) (216)
*Relates to unpaid dividends declared on August 19, 2011 and November 18, 2011 relating to the second and third quarters of 2011, respectively.
Receivables and payables with related parties comprise primarily of unpaid management fees,advisory and administrative services. In addition, certain receivables and payables arise when theCompany pays an invoice on behalf of a related party and vice versa. Receivables and payables aregenerally settled quarterly in arrears.
Faraway Maritime Shipping Company, which is 60% owned by the Company and 40% owned byChina Petroleum Corporation ("CPC"), paid dividends totalling $1.75 million and $6.0 millionduring the three and twelve month periods ended December 31, 2011, respectively and $3.8 millionand $7.8 million for the three and twelve months period ended December 31, 2010, respectively.
In June 2009, the Company entered into an $80 million revolving credit facility with WorldShipholding Limited. World Shipholding Limited is a company indirectly controlled by Trustsestablished by John Fredriksen for the benefit of his immediate family. The outstanding balance of $10 million as at December 31, 2010 was repaid in March 2011.
In April 2011, the Company entered into a new $80 million revolving credit facility with a companyrelated to our major shareholder, World Shipholding. The Company drew down an initial amount of $35 million in April 2011 and an additional $45 million in July 2011. As of December 31, 2011 theoutstanding balance on the facility is $80.0 million. The facility bears interest at LIBOR plus 3.5%together with a commitment fee of 0.75% of any undrawn portion of the credit facility. The facility is
available until September 2013; all amounts due under the facility must be repaid by then. TheCompany incurred and paid interest on the loan of $0.8 million and $1.8 million during the three andtwelve months ended December 31, 2011, respectively.
The company completed the acquisition of its subsidiary, Golar Energy once a compulsory shareoffer was made on June 3, 2011 resulting in the delisting of Golar Energy from Oslo Axess on July

7/29/2019 Golar Q4 2011 Report
http://slidepdf.com/reader/full/golar-q4-2011-report 21/23
Golar LNG L imitedNotes to Condensed Consolidated Interim Financial Statements (continued)
9. RELATED PARTY TRANSACTIONS
Receivables (payables) from related parties (continued):
4, 2011. Of the 92,333,112 Golar Energy shares acquired 70,315,792 were exchanged for newlyissued Golar LNG shares where the seller received one newly-issued Golar LNG share for every6.06 Golar Energy shares, increasing the Company’s share capital by 11,603,253 and share premiumby $340.0 million. The new Golar LNG shares were effectively issued for $30.30 per share. Theremaining Golar Energy shares were acquired at a price of $5 per share. As a result of this the non-controlling interest (“NCI”) of $129.3 million was eliminated and the difference between the NCIand the consideration paid was recognized as a reduction in additional paid in capital of $335.9million.
In April 2011, the Company completed a public offering of 13.8 million common units (including1.8 million units issued in respect of an over-allotment option) of its subsidiary, Golar LNG PartnersLP (“Golar Partners”), which is listed on the NASDAQ stock exchange under the symbol “GMLP”.As a result of the offering the Company’s ownership of Golar Partners was reduced to approximately65%. The 13.8 million units were priced at $22.50 per unit resulting in gross proceeds of $310.5million.
In October 2011, the Company disposed of certain 100% interests in subsidiaries which owned theFSRU, the Golar Freeze to Golar Partners for purchase consideration of $330 million net of theassumption of debt of $108 million.
10. OTHER COMMITMENTS AND CONTINGENCIES
Assets Pledged
(in thousands of $) December 31,2011
At December 31,2010
Book value of vessels secured against long-term loansand capital leases
1,704,907 1,618,803
11. SUBSEQUENT EVENTS
The Board has proposed an increased quarterly cash dividend of $0.325 per share in respect of thefourth quarter 2011 results. The record date for the dividend is March 11, 2012, ex-dividend date isMarch 7, 2012 and the dividend will be paid on or about March 21, 2012.
The Company’s US listed subsidiary, Golar LNG Partners LP announced on February 6, 2012 thatits board of directors has declared a quarterly cash distribution with respect to the quarter endedDecember 31, 2011 of $0.43 per unit. This represents an increase of $0.03 per unit or 7.5 per centfrom the previous quarter. This cash distribution will be paid on February 15, 2012 to all unitholdersof record as of the close of business on February 9, 2012.

7/29/2019 Golar Q4 2011 Report
http://slidepdf.com/reader/full/golar-q4-2011-report 22/23
Golar LNG L imitedNotes to Condensed Consolidated Interim Financial Statements (continued)
11. SUBSEQUENT EVENTS (continued)
On January 23, 2012, the Company acquired the remaining 50% share interest in Bluewater GandriaN.V. from Bluewater Energy Services B.V. for $19.5 million. The Company became 100% owner of the LNG Carrier Gandria as a result of this transaction.
The Company has also made a firm commitment to reactivate the LNG Carrier Hilli. The vessel hasbeen brought to Keppel Shipyard for a $15 million upgrading project. The Company is targeting herreadiness for service prior to the end of March 2012.
In January 2012, the Company extended its $80 million revolving credit facility with a companyrelated to our major shareholder, World Shipholding, by a further $65 million, under the same terms. The Company drew down $65 million in January 2012. As of January 31, 2012, the outstanding
balance on the facility was $145 million. The facility will be further extended to $250 million fromFebruary 2012.
In February 2012, the Company entered into newbuild contracts for two LNG carriers with fixedprice options for a further two with a Korean shipbuilder. Both vessels will be delivered in thesecond half of 2014. The total cost for the two vessels is approximately $400 million.
7/29/2019 Golar Q4 2011 Report
http://slidepdf.com/reader/full/golar-q4-2011-report 23/23
Responsibility StatementWe confirm, to the best of our knowledge, that the condensed consolidated financial statements forthe period January 1 to December 31, 2011 have been prepared in accordance with U.S generallyaccepted accounting principles, and give a true and fair view of the Company’s assets, liabilities,financial position and profit or loss as a whole. We also confirm, to the best of our knowledge, that
the interim management report includes a fair review of important events that have occurred duringthe first nine months of the financial year and their impact on the condensed interim financialstatements, a description of the principal risks and uncertainties for the remaining three months of the financial year, and major related parties transactions.
The Board of Directors