google matrix analysis of the multiproduct world trade...
TRANSCRIPT

Eur. Phys. J. B (2015) 88: 84DOI: 10.1140/epjb/e2015-60047-0
Regular Article
THE EUROPEANPHYSICAL JOURNAL B
Google matrix analysis of the multiproduct world trade network
Leonardo Ermann1 and Dima L. Shepelyansky2,a
1 Departamento de Fısica Teorica, GIyA, CNEA, Av. Libertador 8250, C1429BNP Buenos Aires, Argentina2 Laboratoire de Physique Theorique du CNRS, IRSAMC, Universite de Toulouse, UPS, 31062 Toulouse, France
Received 14 January 2015 / Received in final form 2 March 2015Published online 1st April 2015 – c© EDP Sciences, Societa Italiana di Fisica, Springer-Verlag 2015
Abstract. Using the United Nations COMTRADE database [United Nations Commodity Trade StatisticsDatabase, available at: http://comtrade.un.org/db/. Accessed November (2014)] we construct the Googlematrix G of multiproduct world trade between the UN countries and analyze the properties of trade flows onthis network for years 1962−2010. This construction, based on Markov chains, treats all countries on equaldemocratic grounds independently of their richness and at the same time it considers the contributionsof trade products proportionally to their trade volume. We consider the trade with 61 products for upto 227 countries. The obtained results show that the trade contribution of products is asymmetric: someof them are export oriented while others are import oriented even if the ranking by their trade volumeis symmetric in respect to export and import after averaging over all world countries. The constructionof the Google matrix allows to investigate the sensitivity of trade balance in respect to price variationsof products, e.g. petroleum and gas, taking into account the world connectivity of trade links. The tradebalance based on PageRank and CheiRank probabilities highlights the leading role of China and otherBRICS countries in the world trade in recent years. We also show that the eigenstates of G with largeeigenvalues select specific trade communities.
1 Introduction
According to the data of UN COMTRADE [1] and the in-ternational trade statistics 2014 of the World Trade Orga-nization (WTO) [2] the international world trade betweenworld countries demonstrates a spectacular growth withan increasing trade volume and number of trade products.It is well clear that the world trade plays the fundamentalrole in the development of world economy [3]. Accordingto the WTO Chief Statistician Hubert Escaith “In recentyears we have seen growing demand for data on the worldeconomy and on international trade in particular. This de-mand has grown in particular since the 2008−2009 crisis,whose depth and breadth surprised many experts” [2]. Inglobal the data of the world trade exchange can be viewedas a large multi-functional directed World Trade Network(WTN) which provides important information about mul-tiproduct commercial flows between countries for a givenyear. At present the COMTRADE database contains datafor Nc = 227 UN countries with up to Np ≈ 104 tradeproducts. Thus the whole matrix of these directed tradeflows has a rather large size N = NpNc ∼ 106. A usualapproach is to consider the export and import volumes,expressed in US dollars (USD). An example of the worldmap of countries characterized by their import and exporttrade volume for year 2008 is shown in Figure 1. However,
a e-mail: [email protected]
such an approach gives only an approximate description oftrade where hidden links and interactions between certaincountries and products are not taken into account sinceonly a country global import or export are considered.Thus the statistical analysis of these multiproduct tradedata requires a utilization of more advanced mathematicaland numerical methods.
In fact, in the last decade, modern societies developedenormous communication and social networks includingthe World Wide Web (WWW), Wikipedia, Twitter, etc.(see e.g. [4]). A necessity of information retrieval fromsuch networks led to a development of efficient algorithmsfor information analysis on such networks appeared incomputer science. One of the most spectacular tools isthe PageRank algorithm developed by Brin and Page in1998 [5], which became a mathematical foundation of theGoogle search engine (see e.g. [6]). This algorithm is basedon the concept of Markov chains and a construction of theGoogle matrix G of Markov transitions between networknodes. The right eigenvector of this matrix G, known asPageRank vector, allows to rank all nodes according totheir importance and influence on the network. The stud-ies of various directed networks showed that it is usefulto analyze also the matrix G∗ constructed for the samenetwork but with an inverted direction of links [7,8]. ThePageRank vector of G∗ is known as the CheiRank vec-tor. The spectral properties of Google matrix for variousnetworks are described in reference [9].

Page 2 of 19 Eur. Phys. J. B (2015) 88: 84
Table 1. Codes and names of the 61 products from COMTRADE Standard International Trade Classification (SITC) Rev. 1.
Code Name Code Name00 Live animals 54 Medicinal and pharmaceutical products01 Meat and meat preparations 55 Perfume materials, toilet & cleansing preptions02 Dairy products and eggs 56 Fertilizers, manufactured03 Fish and fish preparations 57 Explosives and pyrotechnic products04 Cereals and cereal preparations 58 Plastic materials, etc.05 Fruit and vegetables 59 Chemical materials and products, nes06 Sugar, sugar preparations and honey 61 Leather, lthr. Manufs., nes & dressed fur skins07 Coffee, tea, cocoa, spices & manufacs. Thereof 62 Rubber manufactures, nes08 Feed. Stuff for animals excl. Unmilled cereals 63 Wood and cork manufactures excluding furniture09 Miscellaneous food preparations 64 Paper, paperboard and manufactures thereof11 Beverages 65 Textile yarn, fabrics, made up articles, etc.12 Tobacco and tobacco manufactures 66 Non metallic mineral manufactures, nes21 Hides, skins and fur skins, undressed 67 Iron and steel22 Oil seeds, oil nuts and oil kernels 68 Non ferrous metals23 Crude rubber including synthetic and reclaimed 69 Manufactures of metal, nes24 Wood, lumber and cork 71 Machinery, other than electric25 Pulp and paper 72 Electrical machinery, apparatus and appliances26 Textile fibres, not manufactured, and waste 73 Transport equipment27 Crude fertilizers and crude minerals, nes 81 Sanitary, plumbing, heating and lighting fixt.28 Metalliferous ores and metal scrap 82 Furniture29 Crude animal and vegetable materials, nes 83 Travel goods, handbags and similar articles32 Coal, coke and briquettes 84 Clothing33 Petroleum and petroleum products 85 Footwear34 Gas, natural and manufactured 86 Scientif & control instrum, photogr gds, clocks35 Electric energy 89 Miscellaneous manufactured articles, nes41 Animal oils and fats 91 Postal packages not class. According to kind42 Fixed vegetable oils and fats 93 Special transact. Not class. According to kind43 Animal and vegetable oils and fats, processed 94 Animals, nes, incl. Zoo animals, dogs and cats51 Chemical elements and compounds 95 Firearms of war and ammunition therefor52 Crude chemicals from coal, petroleum and gas 96 Coin, other than gold coin, not legal tender53 Dyeing, tanning and colouring materials
Fig. 1. World map of countries with color showing countryimport (top panel) and export (bottom panel) trade volumeexpressed in millions of USD given by numbers of the colorbars. The data are shown for year 2008 with Nc = 227 countriesfor trade in all Np = 61 products (from UN COMTRADE [1]).Names of countries can be found at [10].
The approach of Google matrix to the analysis of WTNwas started in [11]. The striking feature of this approachis that it treats all UN countries on equal democraticgrounds, independently of richness of a given country,in agreement with the principles of UN where all coun-tries are equal. This property of G matrix is based onthe property of Markov chains where the total probabil-ity is conserved to be unity since the sum of elementsfor each column of G is equal to unity. Even if in thisapproach all countries are treated on equal grounds stillthe PageRank and CheiRank analysis recovers about 75%of industrially developed countries of G20. However, nowthese countries appear at the top ranking positions notdue to their richness but due to the efficiency of their tradenetwork. Another important aspect found in [11] is thatboth PageRank and CheiRank vectors appear very nat-urally in the WTN corresponding to import and exportflows.
In this work we extend the Google matrix analysis forthe multiproduct WTN obtained from COMTRADE [1]with up to Np = 61 trade products for up to Nc = 227countries. The global G matrix of such trade flows has asize up to N = NpNc = 13 847 nodes. The names andcodes of products are given in Table 1 and their tradevolumes, expressed in percent of the whole world tradevolume, are given in Table 2 for years 1998 and 2008.

Eur. Phys. J. B (2015) 88: 84 Page 3 of 19
Table 2. Columns represent data: codes of 61 products of COMTRADE SITC Rev. 1, ImportRank and ExportRank K = K∗
in year 2008, product fraction in global trade volume in 2008, K = K∗ in 1998, product fraction in 1998.
Code K(08) % Vol(08) K(98) % Vol (98) Code K(08) % Vol(08) K(98) % Vol (98)
00 53 0.10 51 0.17 54 9 2.89 16 1.8801 27 0.69 26 0.83 55 25 0.76 28 0.79
02 34 0.44 34 0.56 56 30 0.55 43 0.36
03 28 0.63 22 0.99 57 58 0.03 57 0.0404 21 1.07 19 1.13 58 15 1.95 13 2.07
05 19 1.16 18 1.50 59 22 1.04 20 1.13
06 49 0.23 44 0.36 61 51 0.19 42 0.37
07 33 0.47 29 0.73 62 26 0.73 24 0.8508 38 0.39 36 0.45 63 35 0.43 32 0.61
09 40 0.34 41 0.39 64 20 1.14 17 1.79
11 31 0.54 31 0.65 65 18 1.40 11 2.4612 47 0.24 35 0.49 66 17 1.71 14 2.01
21 56 0.05 53 0.11 67 7 3.63 10 2.74
22 37 0.39 48 0.32 68 11 2.27 15 1.95
23 44 0.26 50 0.22 69 13 2.04 12 2.1224 39 0.35 30 0.65 71 2 11.82 1 15.03
25 43 0.29 45 0.34 72 3 10.42 3 12.26
26 50 0.22 37 0.45 73 4 10.06 2 12.38
27 41 0.33 47 0.33 81 42 0.31 46 0.3428 16 1.92 25 0.84 82 23 0.93 21 1.03
29 48 0.24 40 0.39 83 45 0.26 49 0.26
32 24 0.82 39 0.42 84 10 2.42 6 3.4433 1 14.88 4 5.02 85 29 0.59 27 0.79
34 14 2.04 23 0.99 86 12 2.25 8 2.95
35 46 0.26 52 0.17 89 6 3.72 5 4.54
41 57 0.03 58 0.04 91 61 0.00 61 0.0042 32 0.49 38 0.44 93 5 3.92 9 2.92
43 54 0.08 55 0.08 94 59 0.01 59 0.01
51 8 3.01 7 3.07 95 55 0.08 54 0.1152 52 0.11 56 0.05 96 60 0.00 60 0.00
53 36 0.39 33 0.60
The main problem of construction of such a matrix is notits size, which is rather modest compared to those studiedin [9], but the necessity to treat all countries on democraticgrounds and at the same time to treat trade productson the basis of their trade volume. Indeed, the productscannot be considered on democratic grounds since theircontributions to economy are linked with their trade vol-ume. Thus, according to Table 2, in year 2008 the tradevolume of Petroleum and petroleum products (code 33 inTab. 1) is by a factor 300 larger than those of Hides, skinsand fur skins (undressed) (code 21 in Tab. 1). To incorpo-rate these features in our mathematical analysis of multi-product WTN we developed in this work the google per-sonalized vector method (GPVM) which allows to keep ademocratic treatment of countries and at the same timeto consider products proportionally to their trade volume.As a result we are able to perform analysis of the globalmultiproduct WTN keeping all interactions between allcountries and all products. This is a new step in the WTNanalysis since in our previous studies [11] it was possibleto consider a trade between countries only in one productor only in all products summed together (all commodi-ties). The new finding of such global WTN analysis is an
asymmetric ranking of products: some of them are moreoriented to import and others are oriented to export whilethe ranking of products by the trade volume is always sym-metric after summation over all countries. This result withasymmetric ranking of products confirms the indicationsobtained on the basis of ecological ranking [12], which alsogives an asymmetry of products in respect to import andexport. Our approach also allows to analyze the sensitivityof trade network to price variations of a certain product.
We think that the GPVM approach allows to perform amost advanced analysis of multiproduct world trade. Theprevious studies have been restricted to studies of sta-tistical characteristics of WTN links, patterns and theirtopology (see e.g. [13–19]). The applications of PageRankalgorithm to the WTN was discussed in [20] but effectsof export had been not analyzed there, the approachbased on HITS algorithm was used in [21]. In compar-ison to the above studies, the approach developed herefor the multiproduct WTN has an advantage of analysisof ingoing and outgoing flows, related to PageRank andCheiRank, and of taking into account of multiproduct as-pects of the WTN. Even if the importance to multiprod-uct WTN analysis is clearly understood by researchers

Page 4 of 19 Eur. Phys. J. B (2015) 88: 84
(see e.g. [22]) the Google matrix methods have not beenefficiently used up to now. We also note that the matrixmethods are extensively used for analysis of correlationsof trade indexes (see e.g. [23,24]) but these matrices areHermitian being qualitatively different from those appear-ing in the frame of Markov chains. Here we make the stepsin multi-functional or multiproduct Google matrix analy-sis of the WTN extending the approach used in [11].
2 Methods
Below we give the mathematical definition for the con-struction of the Google matrix G, which belongs to theclass of Perron-Frobenius operators and Markov chains.The matrixG is constructed for the import (ingoing) tradeflows. We also use the matrix G∗ built from the export(outgoing) trade flows. The matrix size N is given by theproduct of number of countriesNc by the number of prod-ucts Np. The main features of matrices G and G∗ are: allelements are real positive numbers or zeros; the sum ofelements in each matrix column is equal to unity, thatgives the probability conservation required for Markovchains. We use the right eigenvectors of PageRank P andCheiRank P ∗ respectively for the matrices G,G∗ with thelargest eigenvalue λ = 1 (GP = P , G∗P ∗ = P ∗). Thesevectors give the stationary distribution of probability overthe nodes. The important element of G and G∗ is theirdemocratic (equal grounds) treatment of all world coun-tries independently of their richness. This results from theconstruction rules of G,G∗ where for each country the sumof elements in each column, corresponding to any productof given country, is equal to unity. At the same time wekeep the contribution of products to be proportional totheir trade volume since their effect on the trade is in-deed related with their volume contribution in the worldtrade. Thus, the important new element of this work isthe new proposed method which uses a certain personal-ized vector in construction of G,G∗ and satisfies the aboverequirements.
At the same time we note that it is preferable to workin a certain fixed class of operators, e.g. Google matrix andMarkov chains. Already only this requirement implies thatwe need to treat countries in a democratic manner since bythe construction sum of elements in each column shouldbe unity. For one product, or for a sum of all products,the construction of G,G∗ is relatively straightforward asdescribed in [11]. The most tricky part is the case of manyproducts which contribution should be treated proportion-ally to their fraction in the world trade. We describe theconstruction method of G,G∗ which takes into accountboth these features of the world trade. We note that, asdiscussed in [11], the obtained results have no significantdependence on the damping factor α, which we keep be-low at the fixed value α = 0.5. The simple examples ofconstructions of matrices G,G∗ for directed networks areillustrated in Figures 3 and 4 in [9]. Below we present allmathematical definitions and describe the main featuresof these matrices and eigenvectors.
2.1 Google matrix construction for the WTN
For a given year, we build Np money matrices Mpc,c′ of the
WTN from the COMTRADE database [1] (see [11]).
Mpc,c′ = product p transfer (in USD) fromcountry c′ to c.
(1)
Here the country indexes are c, c′ = 1, . . . , Nc and a prod-uct index is p = 1, . . . , Np. According to the COMTRADEdatabase the number of UN registered countries is Nc =227 (in recent years) and the number of products isNp = 10 and Np = 61 for 1 and 2 digits respectively fromthe Standard International Trade Classification (SITC)Rev. 1. For convenience of future notation we also definethe volume of imports and exports for a given country andproduct respectively as:
V pc =
∑
c′Mp
c,c′ , V∗pc =
∑
c′Mp
c′,c. (2)
The import and export volumes Vc =∑
p Vpc and V ∗
c =∑p V
∗pc are shown for the world map of countries in
Figure 1 for year 2008.In order to compare later with PageRank and
CheiRank probabilities we define volume trade ranks inthe whole trade space of dimension N = Np × Nc. Thusthe ImportRank (P ) and ExportRank (P ∗) probabilitiesare given by the normalized import and export volumes
Pi = V pc /V, P
∗i = V ∗p
c /V, (3)
where i = p+ (c− 1)Np, i = 1, . . . , N and the total tradevolume is:
V =∑
p,c,c′Mp
c,c′ =∑
p,c
V pc =
∑
p,c
V ∗pc .
The Google matrices G and G∗ are defined as N ×N realmatrices with non-negative elements:
Gij = αSij +(1−α)viej , G∗ij = αS∗
ij +(1−α)v∗i ej , (4)
where N = Np × Nc, α ∈ (0, 1] is the damping factor(0 < α < 1), ej is the row vector of unit elements (ej = 1),and vi is a positive column vector called a personaliza-tion vector with
∑i vi = 1 [6]. We note that the usual
Google matrix is recovered for a personalization vectorvi = ei/N . In this work, following [11], we fix α = 0.5. Asdiscussed in [6,9,11] a variation of α in a range (0.5, 0.9)does not significantly affect the probability distributionsof PageRank and CheiRank vectors. We specify the choiceof the personalization vector a bit below.
The matrices S and S∗ are built from money matricesMp
cc′ as:
Si,i′ ={Mp
c,c′δp,p′/V ∗pc′ if V ∗p
c′ �= 01/N if V ∗p
c′ = 0
S∗i,i′ =
{Mp
c′,cδp,p′/V pc′ if V p
c′ �= 01/N if V p
c′ = 0 (5)
Eur. Phys. J. B (2015) 88: 84 Page 5 of 19
where c, c′ = 1, . . . , Nc; p, p′ = 1, . . . , Np; i = p+(c−1)Np;i′ = p′ + (c′ − 1)Np; and therefore i, i′ = 1, . . . , N . Notethat the sum of each column of S and S∗ are normalizedto unity and hence the matrices G,G∗, S, S∗ belong to theclass of Google matrices and Markov chains. The eigen-values and eigenstates of G,G∗ are obtained by a directnumerical diagonalization using the standard numericalpackages.
2.2 PageRank and CheiRank vectors from GPVM
PageRank and CheiRank (P and P ∗) are defined as theright eigenvectors of G and G∗ matrices respectively ateigenvalue λ = 1:
∑
j
Gijψj = λψi,∑
j
G∗ijψ
∗j = λψ∗
j . (6)
For the eigenstate at λ = 1 we use the notation Pi =ψi, P
∗ = ψ∗i with the normalization
∑Pi =
∑i P
∗i = 1.
For other eigenstates we use the normalization∑
i |ψi|2 =∑i |ψ∗
i |2 = 1. According to the Perron-Frobenius theoremthe components of Pi, P ∗
i are positive and give the prob-abilities to find a random surfer on a given node [6]. ThePageRank K and CheiRank K∗ indexes are defined fromthe decreasing ordering of P and P ∗ as P (K) ≥ P (K+1)and P ∗(K) ≥ P ∗(K∗ + 1) with K,K∗ = 1, . . . , N .
If we want to compute the reduced PageRank andCheiRank probabilities of countries for all commodities(or equivalently all products) we trace over the prod-uct space getting Pc =
∑p Ppc =
∑p P (p+ (c− 1)Np)
and P ∗c =
∑P ∗
pc =∑
p P∗ (p+ (c− 1)Np) with their
corresponding Kc and K∗c indexes. In a similar way
we obtain the reduced PageRank and CheiRank prob-abilities for products tracing over all countries andgetting Pp =
∑c P (p+ (c− 1)Np)
∑p Ppc and P ∗
p =∑c P
∗ (p+ (c− 1)Np)∑P ∗
pc with their correspondingproduct indexes Kp and K∗
p .In summary we have Kp,K
∗p = 1, . . . , Np and
Kc,K∗c = 1, . . . , Nc. A similar definition of ranks from
import and export trade volume can be done in a straight-forward way via probabilities Pp, P
∗p , Pc, P
∗c , Ppc, P
∗pc and
corresponding indexes Kp, K∗p , Kc, K
∗c , K, K
∗.To compute the PageRank and CheiRank probabilities
from G and G∗ keeping democracy in countries and pro-portionality of products to their trade volume we use theGPVM approach with a personalized vector in (4). At thefirst iteration of Google matrix we take into account therelative product volume per country using the followingpersonalization vectors for G and G∗:
vi =V p
c
Nc
∑p′ V
p′c
, v∗i =V ∗p
c
Nc
∑p′ V
∗p′c
, (7)
using the definitions (2) and the relation i = p+ (c− 1)Np.This personalized vector depends both on product andcountry indexes. In order to have the same value of person-alization vector in countries we can define the second it-eration vector proportional to the reduced PageRank and
100
101
102
103
104
Ki
K*i
10-7
10-6
10-5
10-4
10-3
10-2
10-1
Pi
P*i 1
st iteration
2nd
iterationvolume
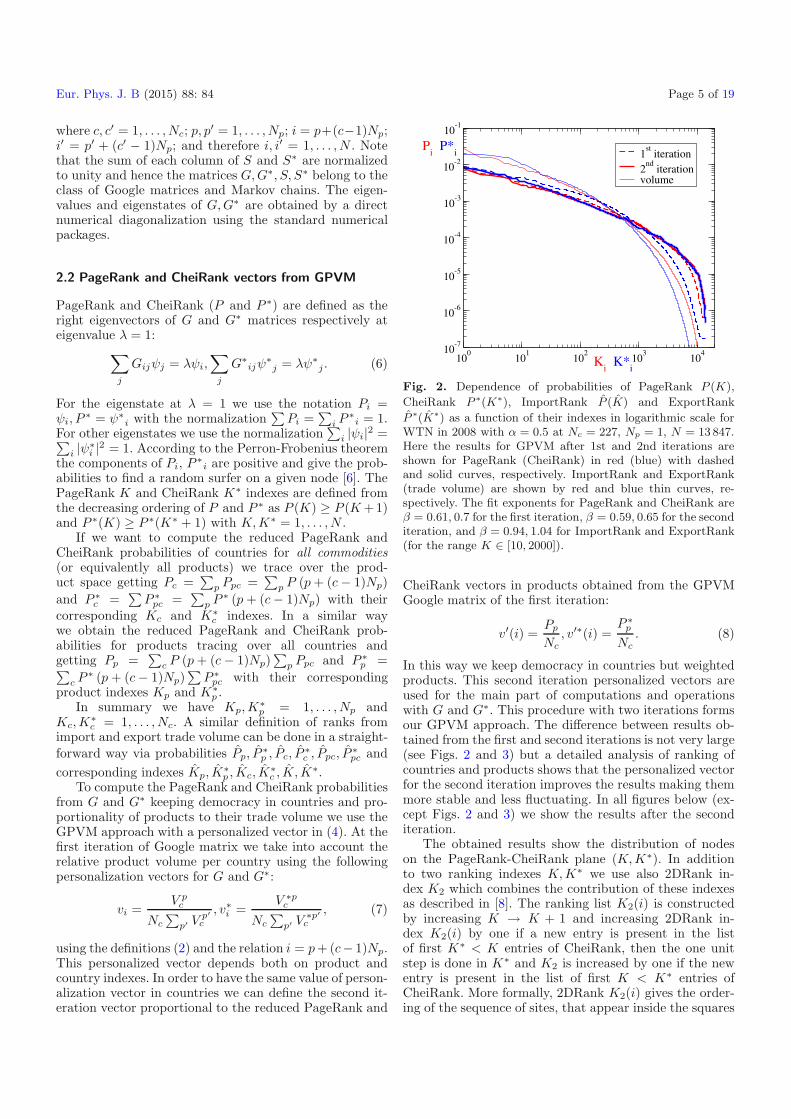
Fig. 2. Dependence of probabilities of PageRank P (K),
CheiRank P ∗(K∗), ImportRank P (K) and ExportRank
P ∗(K∗) as a function of their indexes in logarithmic scale forWTN in 2008 with α = 0.5 at Nc = 227, Np = 1, N = 13 847.Here the results for GPVM after 1st and 2nd iterations areshown for PageRank (CheiRank) in red (blue) with dashedand solid curves, respectively. ImportRank and ExportRank(trade volume) are shown by red and blue thin curves, re-spectively. The fit exponents for PageRank and CheiRank areβ = 0.61, 0.7 for the first iteration, β = 0.59, 0.65 for the seconditeration, and β = 0.94, 1.04 for ImportRank and ExportRank(for the range K ∈ [10, 2000]).
CheiRank vectors in products obtained from the GPVMGoogle matrix of the first iteration:
v′(i) =Pp
Nc, v′∗(i) =
P ∗p
Nc. (8)
In this way we keep democracy in countries but weightedproducts. This second iteration personalized vectors areused for the main part of computations and operationswith G and G∗. This procedure with two iterations formsour GPVM approach. The difference between results ob-tained from the first and second iterations is not very large(see Figs. 2 and 3) but a detailed analysis of ranking ofcountries and products shows that the personalized vectorfor the second iteration improves the results making themmore stable and less fluctuating. In all figures below (ex-cept Figs. 2 and 3) we show the results after the seconditeration.
The obtained results show the distribution of nodeson the PageRank-CheiRank plane (K,K∗). In additionto two ranking indexes K,K∗ we use also 2DRank in-dex K2 which combines the contribution of these indexesas described in [8]. The ranking list K2(i) is constructedby increasing K → K + 1 and increasing 2DRank in-dex K2(i) by one if a new entry is present in the listof first K∗ < K entries of CheiRank, then the one unitstep is done in K∗ and K2 is increased by one if the newentry is present in the list of first K < K∗ entries ofCheiRank. More formally, 2DRank K2(i) gives the order-ing of the sequence of sites, that appear inside the squares

Page 6 of 19 Eur. Phys. J. B (2015) 88: 84
1 10 Kp
K*p
10-4
10-3
10-2
10-1
Pp
P*p
1st iteration
2st iteration
volume
1 10 100Kc
K*c
10-3
10-2
10-1
Pc
P*c
1st iteration
2nd
iterationvolume
Fig. 3. Probability distributions of PageRank and CheiRankfor products Pp(Kp), P ∗
p (K∗p ) (left panel) and countries
Pc(Kc), P∗c (K∗
c ) (right panel) in logarithmic scale for WTNfrom Figure 2. Here the results for the 1st and 2nd GPVMiterations are shown by red (blue) curves for PageRank(CheiRank) with dashed and solid curves, respectively. Theprobabilities from the trade volume ranking are shown by blackcurve (left) and dotted red and blue curves (right) for Impor-tRank and ExportRank, respectively.
[1, 1;K = k,K∗ = k; . . .] when one runs progressively fromk = 1 to N . Additionally, we analyze the distribution ofnodes for reduced indexes (Kp,K
∗p ), (Kc,K
∗c ).
We also characterize the localization properties ofeigenstates of G,G∗ by the inverse participation ratio(IPR) defined as ξ = (
∑i |ψi|2)2/
∑i |ψi|4. This char-
acteristic determines an effective number of nodes whichcontribute to a formation of a given eigenstate (see detailsin Ref. [9]).
2.3 Correlators of PageRank and CheiRank vectors
Following previous works [7,8,11] the correlator ofPageRank and CheiRank vectors is defined as:
κ = NN∑
i=1
P (i)P ∗(i) − 1. (9)
The typical values of κ are given in [9] for variousnetworks.
For global PageRank and CheiRank the product-product correlator matrix is defined as:
κpp′ = Nc
×Nc∑
c=1
[P (p+ (c−1)Np)P ∗(p′ + (c−1)Np)∑
c′ P (p+ (c′−1)Np)∑
c′′ P∗(p′ + (c′′−1)Np)
]−1.
(10)
Then the correlator for a given product is obtainedfrom (10) as:
κp = κpp′δp,p′ , (11)
where δp,p′ is the Kronecker delta.We also use the correlators obtained from the prob-
abilities traced over products (Pc =∑
p Ppc) and over
countries (Pp =∑
c Ppc) which are defined as:
κ(c) = Nc
Nc∑
c=1
PcP∗c − 1,
κ(p) = Np
Np∑
p=1
PpP∗p − 1. (12)
In the above equations (9)–(12) the correlators are com-puted for PageRank and CheiRank probabilities. We canalso compute the same correlators using probabilities fromthe trade volume in ImportRank P and ExportRank P ∗defined by (3).
We discuss the values of these correlators in Section 4.
3 Data description
All data are obtained from the COMTRADE database [1].We used products from COMTRADE SITC Rev. 1 clas-sification with number of products Np = 10 and 61. Wechoose SITC Rev. 1 since it covers the longest time inter-val. The main results are presented for Np = 61 with upto Nc = 227 countries. The names of products are given inTable 1, their ImportRank index K and their fraction (inpercent) of global trade volume in years 1998 and 2008 aregiven in Table 2. The data are collected and presented forthe years 1962−2010. Our data and results are availableat [25], the data for the matrices Mp
c,c′ are available atCOMTRADE [1] with the rules of their distribution pol-icy. Following [11] we use for countries ISO 3166-1 alpha-3code available at Wikipedia.
4 Results
We apply the above methods to the described data sets ofCOMTRADE and present the obtained results below.
4.1 PageRank and CheiRank probabilities
The dependence of probabilities of PageRank P (K) andCheiRank P ∗(K∗) vectors on their indexes K,K∗ areshown in Figure 2 for a selected year 2008. The results canbe approximately described by an algebraic dependenceP ∝ 1/Kβ with the exponent values given in the cap-tion. It is interesting to note that we find approximatelythe same β ≈ 0.6 both for PageRank and CheiRank incontrast to the WWW, universities and Wikipedia net-works where usually one finds β ≈ 1 for PageRank andβ ≈ 0.6 for CheiRank [6,9]. We attribute this to an intrin-sic property of WTN where the countries try to keep econ-omy balance of their trade. The data show that the rangeof probability variation is reduced for the Google rank-ing compared to the volume ranking. This results from ademocratic ranking of countries used in the Google matrixanalysis that gives a reduction of richness dispersion be-tween countries. The results also show that the variation

Eur. Phys. J. B (2015) 88: 84 Page 7 of 19
of probabilities for 1st and 2nd GPVM results are not verylarge that demonstrates the convergence of this approach.
After tracing probabilities over countries we obtainprobability distributions Pp(Kp), P ∗
p (K∗p) over products
shown in Figure 3. The variation range of probabilities isthe same as for the case of volume ranking. This showsthat the GPVM approach correctly treats products keep-ing their contributions proportional to their volume. Thedifference between 1st and 2nd iterations is rather smalland is practically not visible on this plot. The impor-tant result well visible here is a visible difference betweenPageRank and CheiRank probabilities while there is nodifference between ImportRank and ExportRank proba-bilities since they are equal after tracing over countries.
After tracing over products we obtain probability dis-tributions Pc(Kc), P ∗
c (K∗c ) over countries shown in Fig-
ure 3. We see that the probability of volume ranking variesapproximately by a factor 1000 while for PageRank andCheiRank such a factor is only approximately 10. Thusthe democracy in countries induced by the Google matrixconstruction reduces significantly the variations of proba-bilities among countries and inequality between countries.
Both panels of Figure 3 show relatively small varia-tions between 1st and 2nd GPVM iterations confirmingthe stability of this approach. In next sections we presentthe results only for 2nd GPVM iteration. This choice isconfirmed by consideration of ranking positions of variousnodes of global matrices G,G∗ which show less fluctua-tions compared to the results of the 1st GPVM iteration.
From the global ranking of countries and products wecan select a given product and then determine local rank-ing of countries in a given product to see how strong istheir trade for this product. The results for three selectedproducts are discussed below for year 2008. For compar-ison we also present comparison with the export-importranking from the trade volume.
4.2 Ranking of countries and products
After tracing the probabilities P (K), P ∗(K∗) over prod-ucts we obtain the distribution of world countries onthe PageRank-CheiRank plane (Kc,K
∗c ) presented in
Figure 4 for a test year 2008. In the same figure wepresent the rank distributions obtained from ImportRank-ExportRank probabilities of trade volume and the resultsobtained in [11] for trade in all commodities. For theGPVM data we see the global features already discussedin [11]: the countries are distributed in a vicinity of diag-onal Kc = K∗
c since each country aims to keep its tradebalanced. The top 20 list of top K2 countries recover 15of 19 countries of G20 major world economies (EU is thenumber 20) thus obtaining 79% of the whole list. Thisis close to the percent obtained in [11] for trade in allcommodities.
The global distributions of top countries with Kc ≤ 40,K∗
c ≤ 40 for the three ranking methods, shown in Fig-ure 4, are similar on average. But some modifications in-troduced by the GPVM analysis are visible. Thus China(CHN) moves on 2nd position of CheiRank while it is in
Fig. 4. Country positions on PageRank-CheiRank plane(Kc, K
∗c ) obtained by the GPVM analysis (top panels),
ImportRank-ExportRank of trade volume (center panels), andfor PageRank-CheiRank of all commodities (bottom panels,data from [11]). Left panels show global scale (Kc,K
∗c ∈
[1, 200]) and right panels show zoom on top ranks (Kc,K∗c ∈
[1, 40]). Each country is shown by circle with its own flag (fora better visibility the circle center is slightly displaced from itsinteger position (Kc,K
∗c ) along direction angle π/4). Data are
shown for year 2008.
the 1st position for trade volume ranking and CheiRank ofall commodities. Also e.g. Saudi Arabia (SAU) and Rus-sia (RUS) move from the CheiRank positions K∗
c = 21and K∗
c = 7 in all commodities [11] to K∗c = 29 and
K∗c = 6 in the GPVM ranking, respectively. Other ex-
ample is a significant displacement of Nigeria (NGA). Weexplain such differences as the result of larger connectiv-ity required for getting high ranking in the multiproductWTN. Indeed, China is more specialized in specific prod-ucts compared to USA (e.g. no petroleum production andexport) that leads to its displacement in K∗
c . We note thatthe ecological ranking gives also worse ranking positionsfor China comparing to the trade volume ranking [12]. Ina similar way the trade of Saudi Arabia is strongly dom-inated by petroleum and moreover its petroleum trade isstrongly oriented on USA that makes its trade networkconcentrated on a few links while Russia is improving its
Page 8 of 19 Eur. Phys. J. B (2015) 88: 84
0 10 20 30 40 50 60Kp
0
10
20
30
40
50
60
K*p
0 10 20 30 40 50 60Kp
0
10
20
30
40
50
60
K*p
0 10 20 30 40 50 60Kp
0
10
20
30
40
50
60
K*p
0 10 20 30 40 50 60Kp
0
10
20
30
40
50
60
K*p
Machinery, other than electricElectrical machinery, apparatus and appliancesTransport equipmentSanitary, plumbing, heating and lighting fixt.FurnitureTravel goods, handbags and similar articlesClothingFootwearScientif & control instrum, photogr gds, clocksMiscellaneous manufactured articles, nesPostal packages not class. According to kindSpecial transact. Not class. According to kindAnimals, nes, incl. Zoo animals, dogs and catsFirearms of war and ammunition thereforCoin, other than gold coin, not legal tender
Medicinal & pharmaceutical prod.Perfume mat., toilet & clean. prep.Fertilizers, manufacturedExplosives and pyrotechnic prod.Plastic materials, etc.Chemical materials and productsLeather. Manuf. & dressed fur skinRubber manufactures, nesWood & cork manuf. exc. furniturePaper, paperboard and manuf.Textile yarn, fabrics, etc.Non metallic mineral manuf., nesIron and steelNon ferrous metalsManufactures of metal, nes
Pulp and paperTextile fibres, not manuf., & wasteCrude fertilizers & crude mineralsMetalliferous ores and metal scrapCrude animal & vegetable mat.Coal, coke and briquettesPetroleum and petroleum productsGas, natural and manufacturedElectric energyAnimal oils and fatsFixed vegetable oils and fatsAnimal & veg. oils & fats (proc.)Chemical elements & compoundsCrude chem. from coal, petr. & gasDyeing, tanning & colouring mat.
Live animalsMeat and meat preparationsDairy products and eggsFish and fish preparationsCereals and cereal preparationsFruit and vegetablesSugar, sugar prep. and honeyCoffee, tea, cocoa, spices & manFeed. Stuff for animalsMiscellaneous food preparationsBeveragesTobacco and tobacco manuf.Hides, skins and fur skins, undress.Oil seeds, oil nuts and oil kernelsCrude rubber incl. synth & recl.Wood, lumber and cork
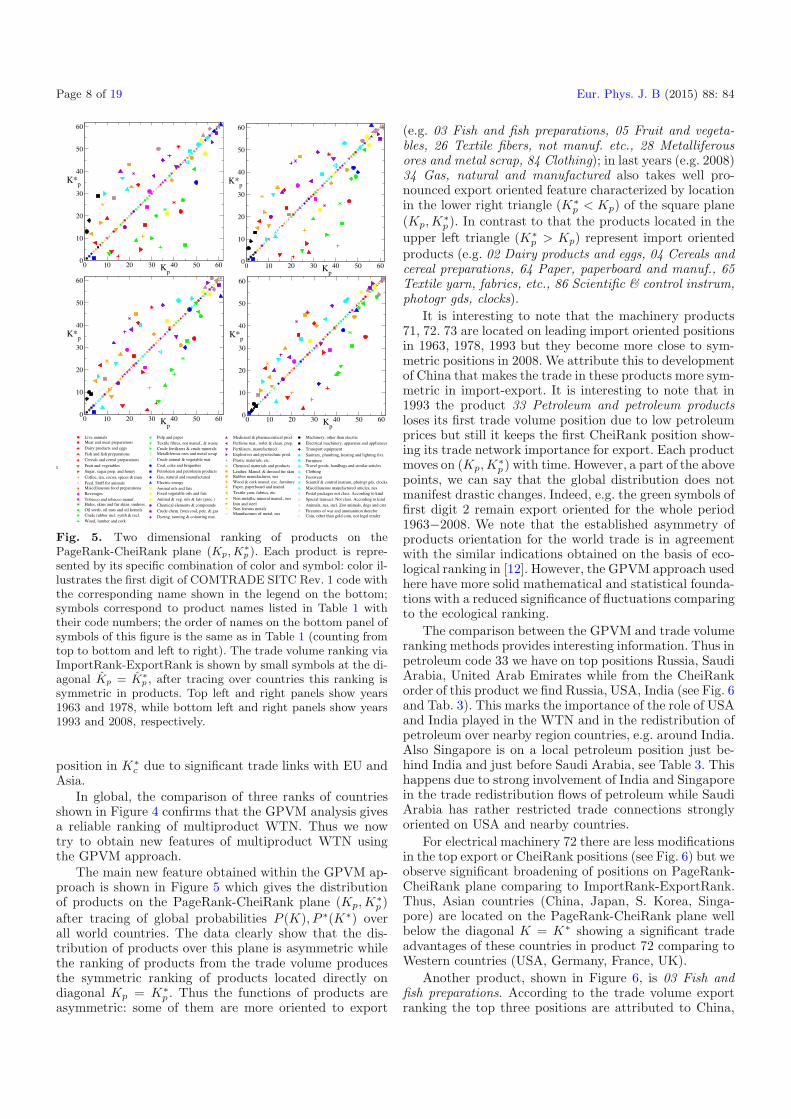
Fig. 5. Two dimensional ranking of products on thePageRank-CheiRank plane (Kp,K
∗p ). Each product is repre-
sented by its specific combination of color and symbol: color il-lustrates the first digit of COMTRADE SITC Rev. 1 code withthe corresponding name shown in the legend on the bottom;symbols correspond to product names listed in Table 1 withtheir code numbers; the order of names on the bottom panel ofsymbols of this figure is the same as in Table 1 (counting fromtop to bottom and left to right). The trade volume ranking viaImportRank-ExportRank is shown by small symbols at the di-agonal Kp = K∗
p , after tracing over countries this ranking issymmetric in products. Top left and right panels show years1963 and 1978, while bottom left and right panels show years1993 and 2008, respectively.
position in K∗c due to significant trade links with EU and
Asia.In global, the comparison of three ranks of countries
shown in Figure 4 confirms that the GPVM analysis givesa reliable ranking of multiproduct WTN. Thus we nowtry to obtain new features of multiproduct WTN usingthe GPVM approach.
The main new feature obtained within the GPVM ap-proach is shown in Figure 5 which gives the distributionof products on the PageRank-CheiRank plane (Kp,K
∗p )
after tracing of global probabilities P (K), P ∗(K∗) overall world countries. The data clearly show that the dis-tribution of products over this plane is asymmetric whilethe ranking of products from the trade volume producesthe symmetric ranking of products located directly ondiagonal Kp = K∗
p . Thus the functions of products areasymmetric: some of them are more oriented to export
(e.g. 03 Fish and fish preparations, 05 Fruit and vegeta-bles, 26 Textile fibers, not manuf. etc., 28 Metalliferousores and metal scrap, 84 Clothing); in last years (e.g. 2008)34 Gas, natural and manufactured also takes well pro-nounced export oriented feature characterized by locationin the lower right triangle (K∗
p < Kp) of the square plane(Kp,K
∗p). In contrast to that the products located in the
upper left triangle (K∗p > Kp) represent import oriented
products (e.g. 02 Dairy products and eggs, 04 Cereals andcereal preparations, 64 Paper, paperboard and manuf., 65Textile yarn, fabrics, etc., 86 Scientific & control instrum,photogr gds, clocks).
It is interesting to note that the machinery products71, 72. 73 are located on leading import oriented positionsin 1963, 1978, 1993 but they become more close to sym-metric positions in 2008. We attribute this to developmentof China that makes the trade in these products more sym-metric in import-export. It is interesting to note that in1993 the product 33 Petroleum and petroleum productsloses its first trade volume position due to low petroleumprices but still it keeps the first CheiRank position show-ing its trade network importance for export. Each productmoves on (Kp,K
∗p ) with time. However, a part of the above
points, we can say that the global distribution does notmanifest drastic changes. Indeed, e.g. the green symbols offirst digit 2 remain export oriented for the whole period1963−2008. We note that the established asymmetry ofproducts orientation for the world trade is in agreementwith the similar indications obtained on the basis of eco-logical ranking in [12]. However, the GPVM approach usedhere have more solid mathematical and statistical founda-tions with a reduced significance of fluctuations comparingto the ecological ranking.
The comparison between the GPVM and trade volumeranking methods provides interesting information. Thus inpetroleum code 33 we have on top positions Russia, SaudiArabia, United Arab Emirates while from the CheiRankorder of this product we find Russia, USA, India (see Fig. 6and Tab. 3). This marks the importance of the role of USAand India played in the WTN and in the redistribution ofpetroleum over nearby region countries, e.g. around India.Also Singapore is on a local petroleum position just be-hind India and just before Saudi Arabia, see Table 3. Thishappens due to strong involvement of India and Singaporein the trade redistribution flows of petroleum while SaudiArabia has rather restricted trade connections stronglyoriented on USA and nearby countries.
For electrical machinery 72 there are less modificationsin the top export or CheiRank positions (see Fig. 6) but weobserve significant broadening of positions on PageRank-CheiRank plane comparing to ImportRank-ExportRank.Thus, Asian countries (China, Japan, S. Korea, Singa-pore) are located on the PageRank-CheiRank plane wellbelow the diagonal K = K∗ showing a significant tradeadvantages of these countries in product 72 comparing toWestern countries (USA, Germany, France, UK).
Another product, shown in Figure 6, is 03 Fish andfish preparations. According to the trade volume exportranking the top three positions are attributed to China,

Eur. Phys. J. B (2015) 88: 84 Page 9 of 19
Fig. 6. Left panels show results of the GPVM data for countrypositions on PageRank-CheiRank plane of local rank valuesK,K∗ ordered by (Kcp,K
∗cp) for specific products with p =
33 (top panel), p = 72 (center panel) and p = 03 (bottompanel). Right panels show the ImportRank-ExportRank planesrespectively for comparison. Data are given for year 2008. Eachcountry is shown by circle with its own flag as in Figure 4.
Norway, Thailand. However, from CheiRank of product 03we find another order with Thailand, USA, China. Thisresult stresses again the broadness and robustness of thetrade connections of Thailand and USA. As another exam-ple we note a significant improvement of Spain CheiRankposition showing its strong commercial relations for prod-uct 03. On the other side Russia has relatively good po-sition in the trade volume export of 03 product but itsCheiRank index becomes worse due to absence of broadcommercial links for this product.
The global top 20 positions of indexes K,K∗, K2, K,K∗ are given in Table 3 for year 2008. We note a sig-nificant improvement of positions of Singapore and Indiain PageRank-CheiRank positions comparing to their po-sitions in the trade volume ranking. This reflects theirstrong commercial relations in the world trade. In thetrade volume ranking the top positions are taken by 33petroleum and digit 7 of machinery products. This re-mains mainly true for PageRank-CheiRank positions but
1 10 100 1000 10000K
1
10
100
1000
10000
K*USASouth KoreaChinaRussiaFranceBrazil
2008
1 10 100 1000 10000K
1
10
100
1000
10000
K*USASouth KoreaChinaRussiaFranceBrazil
2008
Fig. 7. Global plane of rank indexes (K,K∗) for PageRank-CheiRank (left panel) and ImportRank-ExportRank (rightpanel) for N = 13 847 nodes in year 2008. Each country andproduct pair is represented by a gray circle. Some countriesare highlighted in colors: USA with black, South Korea withred, China with green, Russia with red, France with yellow andBrazil with orange.
Fig. 8. Top 200 global PageRank-CheiRank indexes (K,K∗)distributions for year 2008. Each country (for differentproducts) is represented by its flag.
we see the spectacular improvement of positions of 84Clothing for China (K∗ = 2) and 93 Special transact. forUSA (K = 4) showing thus these two products have strongcommercial exchange all over the world even if their tradevolume is not so dominant.
We show the plane (K,K∗) for the global world rank-ing in logarithmic scale in 2008 in Figure 7. The positionsof trade nodes of certain selected countries are shown bycolor. We observe that the trade volume gives a higherconcentration of nodes around diagonal comparing to theGPVM ranking. We attribute this to the symmetry oftrade volume in products.
In Figure 8 we show the distributions of top 200 ranksof the PageRank-CheiRank plane (zoom of left panel ofFig. 7). Among the top 30 positions of K∗ there are 8products of USA, 6 of China, 3 of Germany and othercountries with less number of products. The top positionatK∗ = 1 corresponds to product 33 of Russia while Saudi

Page 10 of 19 Eur. Phys. J. B (2015) 88: 84
Table 3. Top 20 ranks for global PageRank K, CheiRank K∗, 2dRank K2, ImportRank K and ExportRank K∗ for givencountry and product code for year 2008.
# K K∗ K2 K K∗
country & code country & code country & code country & code country & code1 USA 33 Russia 33 Germany 73 USA 33 China 722 USA 73 China 84 USA 73 USA 71 Russia 333 USA 71 Germany 73 USA 33 USA 72 China 714 USA 93 Japan 73 USA 71 USA 73 Germany 735 Germany 73 USA 73 India 33 Japan 33 Germany 716 USA 72 China 72 Singapore 33 China 72 Saudi Arabia 337 France 73 USA 33 Germany 71 China 33 USA 718 Germany 71 India 33 USA 72 Germany 71 Japan 739 Singapore 33 USA 71 France 73 Germany 73 USA 7310 India 33 China 71 Netherlands 33 Netherlands 33 Japan 7111 China 33 Singapore 33 USA 93 Germany 72 USA 7212 Netherlands 33 Saudi Arabia 33 Nigeria 33 China 71 China 8913 France 33 Germany 71 Germany 72 USA 89 Germany 7214 UK 71 USA 72 China 72 Italy 33 China 8415 UK 73 France 73 China 71 Germany 33 Japan 7216 Germany 72 Thailand 3 UK 33 South Korea 33 South Korea 7217 USA 89 Kazakhstan 33 Germany 93 France 73 France 7318 South Korea 33 U. Arab Emir. 33 China 33 China 28 Italy 7119 France 71 USA 28 South Korea 33 Germany 93 U. Arab Emir. 3320 Sudan 73 Netherlands 33 Australia 33 India 33 Germany 93
Arabia is only at K∗ = 12 for this product. The lists ofall N = 13 847 network nodes with their K,K2,K
∗ valuesare available at [25].
4.3 Time evolution of ranking
The time evolution of indexes of products Kp,K∗p is
shown in Figure 9. To obtain these data we trace PageR-ank and CheiRank probabilities over countries and showthe time evolution of rank indexes of products Kp,K
∗p
for top 15 rank products of year 2010. The product 33Petroleum and petroleum products remains at the topCheiRank position K∗
p = 1 for the whole period whilein PageRank it shows significant variations from Kp = 1to 4 being at Kp = 4 at 1986−1999 when the petroleumhad a low price. Products with first digit 7 have high ranksof Kp but especially strong variation is observed for K∗
p of72 Electrical machinery moving from position 26 in 1962to 4 in 2010. Among other indexes with strong variationswe note 58 Plastic materials, 84 Clothing, 93 Special trans-act., 34 Gas, natural and manufactured.
The time evolution of products 33 and 72 on the globalindex plane (K,K∗) is shown in Figure 10 for 6 countriesfrom Figure 7. Thus for product 72 we see a striking im-provement of K∗ for China and Korea that is at the originof the global importance improvement of K∗
p in Figure 9.For the product 33 in Figure 10 Russia improves signif-icantly its rank positions taking the top rank K∗ = 1(see also Tab. 3).
The variation of global ranksK,K∗ with time is shownfor 4 products and 10 countries in Figure 11. For prod-ucts 72, 73 on a scale of 50 years we see a spectacular im-provement of K∗ for China, Japan, Korea. For the prod-uct 33 we see strong improvement of K∗ for Russia in
10
Kp
10
20
30
K*p
10
20
0
10
20
30
1970 1980 1990 2000 2010 year
10
20
30
40
1970 1980 1990 2000 20100
1020304050
33
7371
7289
9367696504
5466848658
3303
7273
71
2884076805
9389663467
Fig. 9. Time evolution of PageRank Kp and CheiRank K∗p
indexes for years 1962 to 2010 for certain products marked onthe right panel side by their codes from Table 1. Top panelsshow top 5 ranks of 2010, middle and bottom panels showranks 6 to 10 and 11 to 15 for 2010, respectively. Colors ofcurves correspond to the colors of Figure 5 marking the firstcode digit.
last 15 years. It is interesting to note that at the pe-riod 1986−1992 of cheap petroleum 33 USA takes thetop position K∗ = 1 with a significant increase of itscorresponding K value. We think that this is a resultof political decision to make an economical pressure onUSSR since such an increase of export of cheap pricepetroleum is not justified from the economical view point.

Eur. Phys. J. B (2015) 88: 84 Page 11 of 19
1 10 100 1000 K1
10
100
1000
K* USASouth KoreaChinaRussiaFranceBrazil
1 10 100 1000 K1
10
100
1000
K* USASouth KoreaChinaRussiaFranceBrazil
72 − Electrical mahinery, apparatus and appliances 33 − Petroleum and petroleum products
Fig. 10. Time evolution of ranking of two products 72 and 33for 6 countries of Figure 7 shown on the global PageRank-CheiRank plane (K,K∗). Left and right panels show thecases of 72 Electrical machinery, apparatus and appliances and33 petroleum and petroleum products, respectively. The evolu-tion in time starts in 1962 (marked by cross) and ends in 2010(marked by square).
1
10
100
1000
10000
USASouth KoreaChinaRussiaFranceGreat BritainJapanGermanyArgentinaIndia
1960 1970 1980 1990 2000 2010year
1960 1970 1980 1990 2000 2010
K K*
03
33
72
73
Fig. 11. Time evolution of global ranking of PageRank andCheiRank indexes K,K∗ for selected 10 countries and 4 prod-ucts. Left and right panels show K and K∗ as a function ofyears for products: 03 Fish and fish preparations; 33 Petroleumand petroleum products; 72 Electrical machinery, apparatusand appliances; and 73 Transport equipment (from top to bot-tom). In all panels the ranks are shown in logarithmic scale for10 given countries: USA, South Korea, China, Russia, France,Brazil, Great Britain, Japan, Germany and Argentina markedby curve colors.
For the product 33 we also note a notable improvementof K∗ of India which is visible in CheiRank but not inExportRank (see Tab. 3). We attribute this not to a largeamount of trade volume but to a significant structural im-provements of trade network of India in this product. Wenote that the strength and efficiency of trade network isalso at the origin of significant improvement of PageRankand CheiRank positions of Singapore comparing to thetrade volume ranking. Thus the development of trade con-nections of certain countries significantly improves their
10 20 30 40 50 60p0.1
1
10
100
κp
Fig. 12. PageRank-CheiRank correlators κp (11) from theGPVM are shown as a function of the product index p withthe corresponding symbol from Figure 5. PageRank-CheiRankand ImportRank-ExportRank correlators are shown by solidand dashed lines respectively, where the global correlator κ (9)is shown in black, the correlator for countries κ(c) (12) is shownby red lines, the correlator for products κ(p) (12) is shown byblue lines. Here product number p is counted in order of ap-pearance in Table 1. The data are given for year 2008 withNp = 61, Nc = 227, N = 13 847.
Google rank positions. For the product 03 we note the im-provement of K∗ positions of China and Argentina whileRussia shows no improvements in this product trade forthis time period.
4.4 Correlation properties of PageRank and CheiRank
The properties of κ correlator of PageRank and CheiRankvectors for various networks are reported in [7,9]. Thereare directed networks with small or even slightly negativevalues of κ, e.g. Linux Kernel or Physical Review citationnetworks, or with κ ∼ 4 for Wikipedia networks and evenlarger values κ ≈ 116 for the Twitter network.
The values of correlators defined by equations (9)–(12)are shown in Figures 12 and 13 for a typical year 2008.For the global PageRank-CheiRank correlator we findκ ≈ 5.7 (9) while for Import-Export probabilities thecorresponding value is significantly larger with κ ≈ 33.7.Thus the trade volume ranking with its symmetry in prod-ucts gives an artificial increase of κ by a significant factor.A similar enhancement factor of Import-Export remainsfor correlators in products κ(p) and countries κ(c) fromequation (12) while for PageRank-CheiRank we obtainmoderate correlator values around unity (see Fig. 12). ThePageRank-CheiRank correlator κp (11) for specific prod-ucts have relatively low values with κp < 1 for practicallyall products with p ≤ 45 (we remind that here p countsthe products in the order of their appearance in Tab. 1, itis different from COMTRADE code number).
The correlation matrix of products κpp′ (10) is shownin Figure 13. This matrix is asymmetric and demonstratesthe existence of relatively high correlations between prod-ucts 73 Transport equipment, 65 Textile yarn, fabrics,made up articles, etc. and 83 Travel goods, handbags andsimilar articles that all are related with transportation ofproducts.

Page 12 of 19 Eur. Phys. J. B (2015) 88: 84
Table 4. Top 10 values of 4 different eigenvectors from Figure 16. The corresponding eigenvalues form left to right are λ = 0.9548,λ = 0.9345, λ = 0.452+ i0.775 and λ = 0.424+ i0.467. There is only one product in each of these top 10 list nodes which are: 57Explosives and pyrotechnic products; 06 Sugar, sugar preparations and honey ; 56 Fertilizers, manufactured ; 52 Crude chemicalsfrom coal, petroleum and gas.
Ki |ψi| Country |ψi| Country |ψi| Country |ψi| Countryprod: 57 prod:06 prod:56 prod:52
1 0.052 USA 0.216 Mali 0.332 Brazil 0.288 Japan2 0.044 Tajikistan 0.201 Guinea 0.304 Bolivia 0.279 Rep. of Korea3 0.042 Kyrgyzstan 0.059 USA 0.274 Paraguay 0.245 China4 0.022 France 0.023 Germany 0.031 Argentina 0.020 Australia5 0.021 Mexico 0.021 Mexico 0.017 Uruguay 0.013 USA6 0.018 Italy 0.021 Canada 0.009 Chile 0.012 U. Arab Em.7 0.018 Canada 0.018 UK 0.004 Portugal 0.010 Canada8 0.015 Germany 0.015 Israel 0.004 Angola 0.010 Singapore9 0.013 U. Arab Em. 0.015 C. d’Ivoire 0.004 Spain 0.009 Germany10 0.012 Qatar 0.014 Japan 0.003 France 0.008 New Zealand
0 1 2 3 4 5 6 7 8 9
0
1
2
34
5
6
78
9
0
1
2
3
4
5
Fig. 13. Product PageRank-CheiRank correlation matrix κp,p′
(10) for year 2008 with correlator values shown by color. Thecode indexes p and p′ of all Np = 61 products are shown on xand y axes by their corresponding first digit (see Tab. 1).
4.5 Spectrum and eigenstates of WTN Google matrix
Above we analyzed the properties of eigenstates of G andG∗ at the largest eigenvalue λ = 1. However, in total thereare N eigenvalues and eigenstates. The results obtainedfor the Wikipedia network [26] demonstrated that eigen-states with large modulus of λ correspond to certain spe-cific communities of the network. Thus it is interesting tostudy the spectral properties of G for the multiproductWTN. The spectra of G and G∗ are shown in Figure 14for year 2008. It is interesting to note that for G the spec-trum shows some similarities with those of Wikipedia (seeFig. 1 in [26]). At α = 1 there are 12 and 7 degenerateeigenvalues λ = 1 for G and G∗, respectively. Thus thespectral gap appears only for α < 1. The dependence ofIPR ξ of eigenstates of G on Reλ is shown in Figure 15.The results show that ξ N so that the eigenstates arewell localized on a certain group on nodes.
The eigenstates ψi can be ordered by their decreas-ing amplitude |ψi| giving the eigenstate index Ki with
-1 -0.5 0 0.5 1
-0.5
0
0.5 λ
-1 -0.5 0 0.5 1
-0.5
0
0.5 λ
Fig. 14. Spectrum of Google matrices G (left panel) and G∗
(right panel) represented in the complex plane of λ. The dataare for year 2008 with α = 1, and N = 13 847, Nc = 227,Np = 61. Four eigenvalues marked by colored circles are usedfor illustration of eigenstates in Figures 15 and 16.
the largest amplitude at Ki = 1. The examples of foureigenstates are shown in Figure 16. We see that the am-plitude is mainly localized on a few top nodes in agreementof small values of ξ ∼ 4 shown in Figure 15. The top tenamplitudes of these four eigenstates are shown in Table 4with corresponding names of countries and products. Wesee that for a given eigenstate these top ten nodes cor-respond to one product clearly indicating strong links oftrade between certain countries. Thus for 06 Sugar we seestrong link between geographically close Mali and Guineawith further links to USA, Germany, etc. In a similarway for 56 Fertilizers there is a group of Latin Americancountries Brazil, Bolivia, Paraguay linked to Argentina,Uruguay, etc. We see a similar situation for products 57and 52. These results confirm the observation establishedin [26] for Wikipedia that the eigenstates with large mod-ulus of λ select interesting specific network communities.We think that it would be interesting to investigate theproperties of eigenstates in further studies.
4.6 Sensitivity to price variations
Above we established the global mathematical structureof multiproduct WTN and presented results on its rankingand spectral properties. Such ranking properties bring newinteresting and important information about the WTN.

Eur. Phys. J. B (2015) 88: 84 Page 13 of 19
-1 -0.75 -0.5 -0.25 0 0.25 0.5 0.75 1Re(λ)
0
20
40
60
80
ξ
Fig. 15. Inverse participation ratio (IPR) ξ of all eigen-states of G as a function of the real part of the correspondingeigenvalue λ from the spectrum of Figure 14. The eigenvaluesmarked by color circles are those from Figure 14.
1 10 100 1000 1000010-9
10-7
10-5
10-3
10-1
λ=0.9548λ=0.9345
1 10 100 1000 10000Ki
10-9
10-7
10-5
10-3
10-1
|ψi|
λ=-0.452+i0.775λ=-0.424+i0.467
Fig. 16. Eigenstate amplitudes |ψi| ordered by its own de-creasing amplitude order with index Ki for 4 different eigen-values of Figure 14 (states are normalized as
∑i |ψi| = 1). Top
panel shows two examples of real eigenvalues with λ = 0.9548and λ = 0.9345 while bottom panel shows two eigenval-ues with large imaginary part with λ = 0.452 + i0.775 andλ = 0.424+ i0.467. Node names (country, product) for top tenlargest amplitudes of these eigenvectors are shown in Table 4.
However, from the view point of economy it is more im-portant to analyze the effects of crisis contamination andprice variations. Such an analysis represents a complextask to which we hope to return in our further investiga-tions. However, the knowledge of the global WTN struc-ture is an essential building block of this task and we thinkthat the presented results demonstrate that this block isavailable now.
Using the knowledge of WTN structure, we illustratehere that it allows to obtain nontrivial results on sensitiv-ity to price variations for certain products. We consider asan example year 2008 and assume that the price of prod-uct 33 Petroleum and petroleum products is increased bya relative fraction δ going from its unit value 1 to 1+δ (orδ = δ33). Then we compute the derivatives of probabilities
Fig. 17. Derivatives D = dP/dδ33 and D∗ = dP ∗/dδ33 for aprice variation δ33 of 33 Petroleum and petroleum products foryear 2008. Top left and right panels show the cases of negativeand positive D and D∗ respectively, with some products andcountries labeled by their 2 digit code. Bottom panels showthe positive and negative cases of the logarithmic derivativesDl = D/P and D∗
l = D∗/P ∗ for countries and products withK2 ≤ 50, where the flags and 2 digit codes for countries andproducts are shown (in right panels only product 33 is present).Codes are described in Table 1.
of PageRank D = dP/dδ = ΔP/δ and CheiRank D∗ =dP ∗/dδ = ΔP ∗/δ. The computation is done for values ofδ = 0.01, 0.03, 0.05 ensuring that the result is not sensi-tive to a specific δ value. We also compute the logarithmicderivatives Dl = d lnP/dδ, D∗
l = d lnP ∗/dδ which give usa relative changes of P, P ∗.
The results for the price variation δ33 of 33 Petroleumand petroleum products are shown in Figure 17. Thederivatives for all WTN nodes are shown on theplanes (D,D∗) and (Dl, D
∗l ). For (D,D∗) the nodes
are distributed in two sectors with D > 0, D∗ > 0andD < 0, D∗ < 0. The largest values withD > 0, D∗ > 0correspond to nodes of countries of product 33 which arerich in petroleum (e.g. Russia, Saudi Arabia, Nigeria)or those which have strong trade transfer of petroleumto other countries (Singapore, India, China, etc). It israther natural that with the growth of petroleum pricesthe rank probabilities P, P ∗ of these countries grow. Amore unexpected effect is observed in the sector D <0, D∗ < 0. Here we see that an increase of petroleumprice leads to a decrease of probabilities of nodes of coun-tries Germany, France, China, Japan trading in machineryproducts 71, 72, 73.
For comparison we also compute the derivativesD,D∗,Dl, D
∗l from the probabilities (3) defined by the trade vol-
ume of Import-Export instead of PageRank-CheiRank.

Page 14 of 19 Eur. Phys. J. B (2015) 88: 84
-0.004 -0.003 -0.002 -0.001 0
D
-0.004
-0.003
-0.002
-0.001
0
D*
0 0.01 0.02 0.030
0.01
0.02
0.03
33
USA
China
Netherlands
Russia
Saudi Arabia
Canada
71 China72 China
73 Germany71 Germany
71 USA73 Japan
73 USA
72 USA
Fig. 18. Same as in top panels of Figure 17 but usingprobabilities from the trade volume (3).
The results are shown in Figure 18 for petroleum pricevariation to be compared with Figure 17. The distribu-tion ofD,D∗ is rather different from those values obtainedwith PageRank-CheiRank probabilities. This is related tothe fact that PageRank and CheiRank take into accountthe global network structure while the trade volume givesonly local relations in trade links between countries. Thedifference between these two methods becomes even morestriking for logarithmic derivatives Dl, D
∗l . Indeed, for the
trade volume ranking the variation of probabilities P ∗, Pdue to price variation of a given product can be computedanalytically taking into account the trade volume changewith δp. The computations giveDcp = (1−fp)Pcp, D∗
cp =(1−fp)P ∗
cp for a derivative of probability of product p andcountry c over the price of product δp and Dcp′ = −fpPcp′ ,Dcp′ = −fpPcp′ , D∗
cp′ = −fpP∗cp′ (if p′ �= p), where fp
is a fraction of product p in the world trade. From theseexpressions we see that the logarithmic derivatives are in-dependent of country and product. Indeed, for the case ofFigure 18 we obtain analytically and by direct numericalcomputations that Dl = D∗
l = −0.2022 (for all countriesif p′ �= p = 33) and Dl = D∗
l = 0.7916 (for all countriesif p′ = p = 33). Due to simplicity of this case we do notshow it in Figure 18.
The results for price variation of 34 Gas, natural andmanufactured are presented in Figure 19 showing deriva-tives of PageRank and CheiRank probabilities over δ34.We see that for absolute derivatives D,D∗ the mostly af-fected are now nodes of gas producing countries for thesector D,D∗ > 0, while for the sector D,D∗ < 0 themostly affected are countries linked to petroleum produc-tion or trade, plus USA with products 71,72,73. For thesector of logarithmic derivativesDl, D
∗l < 0 among topK2
and K,K∗ nodes we find nodes of countries of product 33and also 93.
Thus the analysis of derivatives provides an interest-ing new information of sensitivity of world trade to pricevariations.
4.7 World map of CheiRank-PageRank trade balance
On the basis of the obtained WTN Google matrix we cannow analyze the trade balance in various products betweenthe world countries. Usually economists consider the ex-
Fig. 19. Derivative of P and P ∗ (D and D∗ respectively) for aprice variation of 34 Gas, natural and manufactured for 2008.Top left and right panels show the cases of negative and posi-tive sectors of D and D∗ respectively, with some products andcountries labeled by their 2 digit code and names (in top rightpanel all points correspond to product 34). Bottom panels showthe cases of the logarithmic derivatives Dl and D∗
l for countriesand products with K2 ≤ 50 (bottom left panel) and K,K∗ ≤25 (bottom right panel); flags and 2 digit codes for countriesand products are shown. In bottom right panel (K,K∗ ≤ 25)we do not show the case of Sudan (73 Transport equipment)which has values of (Dl,D
∗l ) = (2 × 10⁻⁴, 1.75 × 10⁻²). Codes
are described in Table 1.
port and import of a given country as it is shown in Fig-ure 1. Then the trade balance of a given country c can bedefined making summation over all products:
Bc =∑
p
(P ∗
cp − Pcp
)/
∑
p
(P ∗
cp + Pcp
)
= (P ∗c − Pc) / (P ∗
c + Pc) . (13)
In economy, Pc, P∗c are defined via the probabilities of
trade volume Pcp, P∗cp from (3). In our approach, we define
Pcp, P∗cp as PageRank and CheiRank probabilities. In con-
trast to the trade volume our approach takes into accountthe multiple network links between nodes.
The comparison of the world trade balance obtainedby these two methods is shown in Figure 20. We seethat the leadership of China becomes very well visiblein CheiRank-PageRank balance map while it is muchless pronounced in the trade volume balance. The Googlematrix analysis also highlights the dis-balance of tradenetwork of Nigeria (strongly oriented on petroleum ex-port and machinery import) and Sudan. It is interest-ing to note that the positive CheiRank-PageRank bal-ance is mainly located in the countries of BRICS (Brazil,Russia, India, China, South Africa). In contrast to that,

Eur. Phys. J. B (2015) 88: 84 Page 15 of 19
Fig. 20. World map of probabilities balance Bc = (P ∗c −
Pc)/(P∗c +Pc) determined for each ofNc = 227 countries in year
2008. Top panel: probabilities P ∗c , Pc are given by CheiRank
and PageRank vectors; bottom panel: probabilities are com-puted from the trade volume of Export-Import (3). Names ofcountries can be found at [10].
the usual trade volume balance highlights Western Saharaand Afghanistan at large positive and negative trade bal-ance in 2008.
We can also determine the sensitivity of trade bal-ance to price variation of a certain product p comput-ing the balance derivative dBc/dδp. The world map sen-sitivity in respect to price of petroleum p = 33 is shownin Figure 21 for the above two methods of definition ofprobabilities Pc, P
∗c in (13). For the CheiRank-PageRank
balance we see that the derivative dBc/dδ33 is positivefor countries producing petroleum (Russia, Saudi Arabia,Venezuela) while the highest negative derivative appearsfor China which economy is happened to be very sensi-tive to petroleum price. The results from the trade vol-ume computation of dBc/dδp, shown in Figure 21, giverather different distribution of derivatives over countrieswith maximum for Sudan and minimum for the Republicof Nauru (this country has very small area and is not vis-ible in the bottom panel of Fig. 21), while for China thebalance looks to be not very sensitive to δ33 (in contrastto the CheiRank-PageRank method). This happens due toabsence of links between nodes in the trade volume com-putations while the CheiRank-PageRank approach takeslinks into account and recover hidden trade relations be-tween products and countries.
This absence of links in the trade volume approachbecomes also evident if we consider the derivative of thepartial trade balance for a given product p defined as:
Bcp = (P ∗cp − Pcp)/
∑
p
(P ∗cp + Pcp)
= (P ∗cp − Pcp)/(P ∗
c + Pc), (14)
Fig. 21. Derivative of probabilities balance dBc/dδ33 overpetroleum price δ33 for year 2008. Top panel: balance of coun-tries Bc is determined from CheiRank and PageRank vectorsas in the top panel of Figure 20; bottom panel: Bc values arecomputed from the trade volume as in the bottom panel ofFigure 20. Names of countries can be found at [10].
so that the global country balance is Bc =∑
p Bcp. Thenthe sensitivity of partial balance of a given product p inrespect to a price variation of a product p′ is given bythe derivative dBcp/dδp′ . The sensitivity for balance ofproduct p = 72 (72 Electrical machinery . . . ) in respectto petroleum p′ = 33 price variation δ33 is shown for theCheiRank-PageRank balance in Figure 22 (top panel) in-dicating sensitivity of trade balance of product p = 72at the petroleum p′ = 33 price variation. We see thatChina has a negative derivative for this partial balance.In contrast, the computations based on the trade volume(Fig. 22 bottom panel) give a rather different distribu-tion of derivatives dBcp/dδp′ over countries. In the tradevolume approach the derivative dBcp/dδp′ appears due tothe renormalization of total trade volume and nonlinearitycoming from the ratio of probabilities. We argue that theCheiRank-PageRank approach treats the trade relationsbetween products and countries on a significantly moreadvanced level taking into account all the complexity oflinks in the multiproduct world trade.
Using the CheiRank-PageRank approach we determinethe sensitivity of partial balance of all 61 products in re-spect to petroleum price variation δ33 for China, Russiaand USA, as shown in Figure 23 (top panel). We see thatthe diagonal derivative dBc33/dδ33 is positive for Russiabut is negative for China and USA. Even if USA producepetroleum its sensitivity is negative due to a significantimport of petroleum to USA. For non-diagonal derivativesover δ33 we find positive sensitivity of Russia and USAfor products p = 71, 72, 73 while for China it is negative.Other product partial balances sensitive to petroleum aree.g. 84 Clothing for China for which expensive petroleum

Page 16 of 19 Eur. Phys. J. B (2015) 88: 84
Fig. 22. Derivative of partial probability balance of productp defined as dBcp/dδ33 over petroleum price δ33 for year 2008;here Bcp = (P ∗
cp − Pcp)/(P∗c + Pc) and p = 72 (72 Electrical
machinery . . . from Tab. 1); the product balance of countriesBcp is determined from CheiRank and PageRank vectors (toppanel) and from the trade volume of Export-Import (3) (bot-tom panel). Names of countries can be found at [10].
gives an increase of transportation costs; negative deriva-tive of balance in metal products p = 67, 68 for Russiadue to fuel price increase; positive derivative for 93 Specialtransact . . . of USA.
The sensitivity of country balance Bc to price varia-tion δp′ for all products is shown in Figure 23 for China(middle panel) and USA (bottom panel). We find thatthe balance of China is very sensitive to p′ = 33, 84 andindeed, these products play an important role in its econ-omy with negative and positive derivatives, respectively.For USA the trade balance is also very sensitive to thesetwo products p′ = 33, 84 but the derivative is negativein both cases. We also present the derivative of balancewithout diagonal term (d(Bc −Bcp′)/dδp′) for China andUSA. This quantity shows that for USA all other productsgive a positive derivative for p′ = 33 but the contributionof petroleum import gives the global negative derivativeof the total USA balance. In a similar way for China forp′ = 84 all products, except the diagonal one p′ = 84, givea negative sensitivity for balance but the diagonal con-tribution of p′ = 84 gives the final positive derivative ofChina total balance in respect to δ84.
The CheiRank-PageRank approach allows to deter-mine cross-product sensitivity of partial trade balancecomputing the derivative dBcp/dδp′ shown in Figure 24for China and USA. The derivatives are very differentfor two countries showing a structural difference of theireconomies. Thus for China the cross-derivative (at p �= p′)are mainly negative (except a few lines around p = 33)but the diagonal terms dBcp/dδp are mainly positive.
0 1 2 3 4 5 6 7 8 9p
-0.01
-0.005
0
0.005
0.01
dBcp
/dδ 33
ChinaRussiaUSA
32 33 34-0.05
0
0.05
0.1
-0.08
-0.06
-0.04
-0.02
0
0.02
0.04
0.06
0.08
dBc/d
δ p’
0 1 2 3 4 5 6 7 8 9p’
-0.03
-0.02
-0.01
0
0.01
0.02
0.03
dBc/d
δ p’
Fig. 23. Top panel: derivative dBcp/dδ33 of partial probabilitybalance Bcp of product p over petroleum price δ33 for year 2008and countries: China (black circles), Russia (blue squares) andUSA (red diamonds); inset panel shows the products of digit3 including the diagonal term p = 33 being out of scale inthe main panel; here Bcp = (P ∗
cp −Pcp)/(P∗c +Pc) (14). Center
(China) and bottom (USA) panels show derivative dBc/dδp′ ofcountry total probability balance Bc over price δp′ of productp′ for year 2008; derivatives of balance without diagonal term(dBc/dδp′ − dBcp′/dδp′) are represented by open circles andopen diamonds for China and USA, respectively. The productbalance of countries Bcp and Bc are determined from CheiRankand PageRank vectors. The vertical dotted lines mark the firstdigit of product index p or p′ from Table 1.
In contrast, for USA the situation is almost the oppo-site. We attribute this to the leading role of China in ex-port and the leading role of USA in import. However, adetailed analysis of these cross-products derivatives andcorrelations require further more detailed analysis. Wethink that the presented cross-product sensitivity playsand important role in the multiproduct trade network thatare highlighted by the Google matrix analysis developedhere. This analysis allows to determine efficiently the sen-sitivity of multiproduct trade in respect to price variationsof various products.

Eur. Phys. J. B (2015) 88: 84 Page 17 of 19
China
USA
Fig. 24. China (top) and USA (bottom) examples of deriva-tive dBcp/dδp′ of partial probability balance Bcp of productp over price δp′ of product p′ for year 2008. Diagonal terms,given by dBcp/dδp vs. p = p′, are shown on the top panels ofeach example. Products p′ and p are shown in x-axis and y-axisrespectively (indexed as in Tab. 1), while dBcp/dδp′ is repre-sented by colors with a threshold value given by −0.01 and0.01 for negative and positive values respectively, also shownin red dashed lines on top panels with diagonal terms. Dottedlines mark the first digit of Table 1. Here Bcp are defined byCheiRank and PageRank probabilities.
5 Discussion
In this work we have developed the Google matrix anal-ysis of the multiproduct world trade network. Our ap-proach allows to treat all world countries on equal demo-cratic grounds independently of their richness keeping thecontributions of trade products proportional to their frac-tions in the world trade. As a result of this approach wehave obtained a reliable ranking of world countries and
products for years 1962−2010. The Google analysis cap-tures the years with crises and also shows that after av-eraging over all world countries some products are exportoriented while others are import oriented. This feature isabsent in the usual Import-Export analysis based on tradevolume which gives a symmetric orientation of productsafter such an averaging.
The WTN matrix analysis determines the trade bal-ance for each country not only in trade volume but also inCheiRank-PageRank probabilities which take into accountmultiple trade links between countries which are absent inthe usual Export-Import considerations. The CheiRank-PageRank balance highlights in a clear manner the lead-ing WTN role of new rising economies of China and otherBRICS countries. This analysis also allows to determinethe sensitivity of trade network to price variations of var-ious products that opens new possibilities for analysis ofcross-product price influence via network links absent inthe standard Export-Import analysis.
We think that this work makes only first steps inthe development of WTN matrix analysis of multiproductworld trade. Indeed, the global properties of the Googlematrix of multiproduct WTN should be studied in moredetail since the statistical properties of matrix elementsof G, shown in Figure 25 for year 2008, are still not wellunderstood (e.g. visible patterns present in the coarse-grained representation of G in Fig. 25).
Even if the UN COMTRADE database contains alot of information there are still open questions if all es-sential economic aspects are completely captured in thisdatabase. Indeed, the COMTRADE data for trade ex-change are diagonal in products since there are no interac-tions (trade) between products. However, this feature maybe a weak point of collected data since in a real economythere is a transformation of some products into some otherproducts (e.g. metal and plastic are transferred to carsand machinery). It is possible that additional data shouldbe collected to take into account the existing interactionsbetween products. There are also some other aspects ofservices and various other activities which are not presentin the COMTRADE database and which can affect theworld economy. At the same time our results show thatthe existing COMTRADE data allow to obtain reliableresults using the Google matrix analysis: thus the rankingof countries and products are reasonable being in corre-spondence with results of other methods. Also sensitivityto price variations is correct from the economy view point(e.g Fig. 22 showing a high sensitivity of China economy topetroleum price). We think that additional inter-productlinks will not modify significantly the results presentedhere but we expect that they will allow to characterize ina better way how one product is transfered to others inthe result of the multiproduct world trade.
One of the important missing element of COMTRADEare financial flows between countries. Indeed, the prod-uct 93 Special trans . . . (see Tabs. 1 and 2) partiallytakes into account the financial flows but it is clear thatthe interbank flows are not completely reported in thedatabase. In fact the Wold Bank Web (WBW) really exists

Page 18 of 19 Eur. Phys. J. B (2015) 88: 84
Fig. 25. Google matrix GKK′ representation for 2008 with α =0.5 ordered by PageRank index Kvalue (where K = K′ = 1 ison top left corner). Top panel shows the whole Google matrix(N = Nc × Np = 227 × 61 = 13 847) with coarse-grainingof N × N elements down to 200 × 200 shown cells. Centerpanel represents the top corner of the full Google matrix withK,K′ ≤ 200. Bottom panel shows the coarse-grained Googlematrix for countries for the top 100 countries (Kc,K
′c ≤ 100).
Color changes from black at minimal matrix element to whiteat maximal element, α = 0.5.
(e.g. a private person can transfer money from his bankaccount to another person account using SWIFT code)but the flows on the WBW remain completely hidden andnot available for scientific analysis. The size on interbanknetworks are relatively small (e.g. the whole Federal Re-serve of USA has only N ≈ 6600 bank nodes [27] and thereare only about N ≈ 2000 bank nodes in Germany [28]).
Thus the WBW size of the whole world is about a fewtens of thousands of nodes and the Google matrix analysisshould be well adapted for WBW. We consider that thereare many similarities between the multiproduct WTN andthe WBW, where financial transfers are performed withvarious financial products so that the above WTN analysisshould be well suited for the WBW. The network approachto the WBW flows is now at the initial development stage(see e.g. [27–29]) but hopefully the security aspects will behandled in an efficient manner opening possibilities for theGoogle matrix analysis of the WBW. The joint analysis oftrade and financial flows between world countries wouldallow to reach a scientific understanding of peculiaritiesof such network flows and to control in an efficient wayfinancial and petroleum crises.
The developed Google matrix analysis of multiprod-uct world trade allows to establish hidden dependenciesbetween various products and countries and opens newprospects for further studies of this interesting complexsystem of world importance.
We thank the representatives of UN COMTRADE [1] for pro-viding us with the friendly access to this database. This re-search is supported in part by the EC FET Open project “Newtools and algorithms for directed network analysis” (NADINENo. 288956). We thank Barbara Meller (Deutsche Bundesbank,Zentrale) for constructive critical remarks.
References
1. United Nations Commodity Trade Statistics Database,http://comtrade.un.org/db/. Accessed November 2014
2. World Trade Organization, International TradeStatistics 2014, http://www.wto.org/its2014/. AccessedNovember 2014
3. P.R. Krugman, M. Obstfeld, M. Melitz, International Eco-nomics: Theory & Policy (Prentice Hall, New Jersey, 2011)
4. S. Dorogovtsev, Lectures on Complex Networks (OxfordUniversity Press, Oxford, 2010)
5. S. Brin, L. Page, Computer Networks and ISDN Systems30, 107 (1998)
6. A.M. Langville, C.D. Meyer, Google’s PageRank andBeyond: the Science of Search Engine Rankings (PrincetonUniversity Press, Princeton, 2006)
7. A.D. Chepelianskii, arXiv:1003.5455[cs.SE] (2010)8. A.O. Zhirov, O.V. Zhirov, D.L. Shepelyansky, Eur. Phys.
J. B 77, 523 (2010)9. L. Ermann, K.M. Frahm, D.L. Shepelyansky,
arXiv:1409.0428[physics.soc-ph] (2014)10. Web page Maps of the world, http://www.mapsofworld.
com/. Accessed December 201411. L. Ermann, D.L. Shepelyansky, Acta Phys. Pol. A 120,
A158 (2011)12. L. Ermann, D.L. Shepelyansky, Phys. Lett. A 377, 250
(2013)13. D. Garlaschelli, M.I. Loffredo, Physica A 355, 138 (2005)14. M.A. Serrano, M. Boguna, A. Vespignani, J. Econ. Interac.
Coord. 2, 111 (2007)15. G. Fagiolo, J. Reyes, S. Schiavo, Phys. Rev. E 79, 036115
(2009)

Eur. Phys. J. B (2015) 88: 84 Page 19 of 19
16. J. He, M.W. Deem, Phys. Rev. Lett. 105, 198701 (2010)17. G. Fagiolo, J. Reyes, S. Schiavo, J. Evol. Econ. 20, 479
(2010)18. M. Barigozzi, G. Fagiolo, D. Garlaschelli, Phys. Rev. E 81,
046104 (2010)19. T. Squartini, G. Fagiolo, D. Garlaschelli, Phys. Rev. E 84,
046118 (2011)20. L. De Benedictis, L. Tajoli, World Econ. 34, 1417 (2011)21. T. Deguchi, K. Takahashi, H. Takayasu, M. Takayasu,
PLoS One 9, e1001338 (2014)22. C.A. Hidalgo, B. Klinger, A.-L. Barabasi, R. Hausmann,
Science 317, 5837 (2007)23. J.-P. Bouchaud, M. Potters, Theory of Financial Risk
and Derivative Pricing (Cambridge University Press,Cambridge, 2003)
24. M.C. Munnix, R. Schaefer, T. Guhr, PLoS One 9, e98030(2014)
25. Web page Google matrix of multiproduct world trade,http://www.quantware.ups-tlse.fr/QWLIB/wtnmatrix.Accessed December 2014
26. L. Ermann, K.M. Frahm, D.L. Shepelyansky, Eur. Phys.J. B 86, 193 (2013)
27. K. Soramaki, M.L. Bech, J. Arnold, R.J. Glass, W.E.Beyler, Physica A 379, 317 (2007)
28. B. Craig, G. von Peter, Interbank tiering and money cen-ter bank, Discussion paper No. 12, Deutsche Bundesbank(2010)
29. R.J. Garratt, L. Mahadeva, K. Svirydzenka, Mapping sys-temic risk in the international banking network, Workingpaper No. 413, Bank of England (2011)