growth opportunities in the global composites industry · creating the equation for growth...
TRANSCRIPT

Creating the Equation for Growth
Growth Opportunities in the Global
Composites Industry
SPE ACCE
September, 2011
Lucintel
1320 Greenway Dr., Suite 870, Las Colinas, TX 75038, USA.
Tel: +1-972-636-5056, E-mail: [email protected]
Copyright © Lucintel

Creating the Equation for Growth
Table of Contents
2
• Executive Summary
• Composites Competitiveness and Market Opportunity
• Market Trends and Opportunity
• Growth Opportunities in 2011 and Beyond
• Conclusions
• About Lucintel
2

Creating the Equation for Growth
Executive Summary
• Global composite materials industry reached $17.7 B in 2010, YOY growth of 10.3%
• Major industries rebounded after 2009 slowdown from economic crises
• End product market made with composites in 2010 was $50.2 B
• North American composites industry accelerated by ~13% in 2010, while Europe accelerated by ~8%
and Asia grew by ~9% in 2010
• Driven by Government economic stimulus package and increased consumer confidence
• By 2016, composite materials industry is expected to reach $ 27.4 B (7.8% CAGR) while end product
market made with composite materials expected to reach $78.0 B
• Global Automotive Composite Materials market was estimated to be around $ 2.4 B in 2010, forecast to
reach $ 3.7 B by 2016 @ CAGR of approx. 8%
• Demand for low weight, fuel efficiency & reduced emissions will drive the usage of composites in
automotive industry
• NA automotive market has shown a positive growth after a setback in 2009
• European market has more penetration for composite usage in automotive applications
• Population growth, new infrastructure projects, urbanization, increase in middle class population and
green movement will drive composites growth to new horizons
• Companies with innovation capability will sustain and gain market share in future
3

Creating the Equation for Growth
Table of Content
4
• Executive Summary
• Composites Competitiveness and Market Opportunity
• Market Trends and Opportunity
• Growth Opportunities in 2011 and Beyond
• Conclusions
• About Lucintel
4

Creating the Equation for Growth
Composites Penetration in Various Market Segments
Market Segment
Composite
Materials
Market
Structural
Materials Market
(Steel, Al &
Composites)
Composites
Penetration
Performance
GapPrice Gap
Transportation $2.7 B $75.7 B 3.6%
Marine $0.5 B $0.7 B 68%
Aerospace $2.0 B $19.1 B 10%
Pipe & Tank $2.1 B $29.6 B 7%
Construction $3.1 B $78 B 4%
Wind Energy $2.0 B $5.4 B 38%
Consumer Goods $1.1 B $7.7 B 14%
0% – 25% 25% – 50%
Source: Lucintel
5

Creating the Equation for Growth
Composites in Automotive
6
Key Insights
• Global Automotive Composite Materials market
was $ 2.4 B in 2010
• Glass fiber-reinforced polymer composites (SMC,
GMT, etc.) are cost effective around 100K units per
annum due to lowered tooling cost
• High cost of materials and lack of suitable high
volume manufacturing processes for applications
continue to be limiting factors for growth
• Carbon fiber usage will remain limited to high end &
premium segment cars
• Advent of lower (than aerospace) cost and
performance carbon fiber could open a new era for
composites in high-volume applicationsApplication
Front Bumper
Hood panelsRoofChassis Leaf Spring
Body Panels, Parts Key Composite
Materials
Key Manufacturing
Processes
Interior HeadlinersPolyurethane,
LWRTRIM, Injection molding
Air Intake Manifold SFT Injection molding
Front End Carriers LFT, SMCInjection molding,
Compression molding
Engine Valve Covers SFT, BMC Injection Molding
Bumper BeamsGMT, SMC,
Polyurethane
Injection Molding,
Compression Molding,
RIM
Fenders SMC, LCM Compression molding
Hoods SMC, LCM Compression molding

Creating the Equation for Growth
Weight savings, fuel economy and other performance benefits will fuel
the growth of composite consumption in Automotive applications
7
Drivers
• Light Weight: GFRP reduces fabricated
part weight by 20-30% whereas CFRP
can reduce by 40-60%
• Excellent corrosion resistance
• Superior fatigue strength
• Styling & system cost saving
Challenges
• High material cost
• Lack of efficient
manufacturing process
ProcessInitial
Cost
Production
Rate
Injection Molding H H
Blow Molding H L
BMC Molding H M
SMC Molding H M
GMT Stamping H M
RIM L M
RTM L L
Thermoforming L M
H = High, M = Medium, L = Low
Automotive parts fabrication process
comparison
3.7
2.4
0
1
2
3
4 +8%
2010 2016
Global Automotive Composite Materials
market (2010-16) in $B
Key Insight• EU has a significant share of composite usage in
automotive applications, followed by the US
• Emerging economies from APAC & ROW will
substantially drive composites usage in automotive
applications in the future
• Global Automotive Composite Materials market is
estimated to grow @ CAGR 8% to 2016
Source: Lucintel
Air Intake Manifold
Instrument Panel
Creating the Equation for Growth
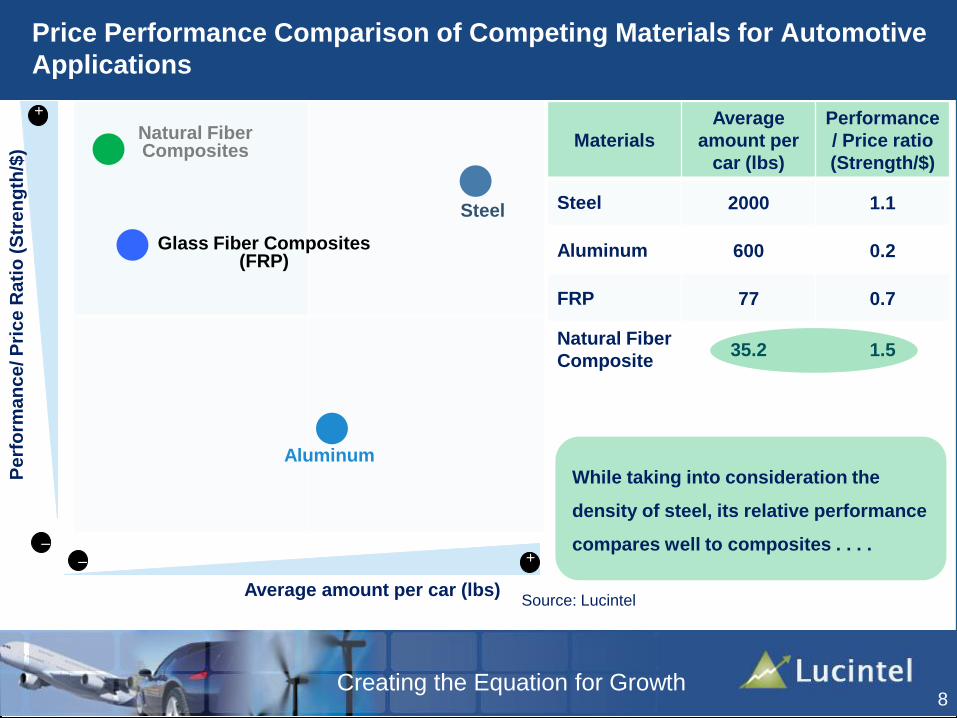
Price Performance Comparison of Competing Materials for Automotive
Applications
–
+
Pe
rfo
rma
nc
e/ P
ric
e R
ati
o (
Str
en
gth
/$)
Average amount per car (lbs)
Steel
–
Aluminum
Glass Fiber Composites (FRP)
Natural Fiber Composites
Materials
Average
amount per
car (lbs)
Performance
/ Price ratio
(Strength/$)
Steel 2000 1.1
Aluminum 600 0.2
FRP 77 0.7
Natural Fiber
Composite35.2 1.5
While taking into consideration the
density of steel, its relative performance
compares well to composites . . . .+
Source: Lucintel
8

Creating the Equation for Growth
Price Performance Comparison of Competing Materials for Automotive
Applications
–
+
Pe
rfo
rma
nc
e/ P
ric
e R
ati
o (
Sp
ec
ific
Str
en
gth
/ $
)
Average amount per car (lbs)
Steel
–
Aluminum
Glass Fiber Composites (FRP)
Natural Fiber Composites
Materials
Average
amount per
car (lbs)
Performance
/Price ratio
(Specific
strength/$)
Steel 2000 0.15
Aluminum 600 0.08
FRP 77 0.36
Natural Fiber
Comp.35.2 1.15
…. but for equal volumes, glass fiber
composites outperform steel and
aluminum. Natural fiber composites have
additional strong penetration potential
+
Source: Lucintel
9
Creating the Equation for Growth
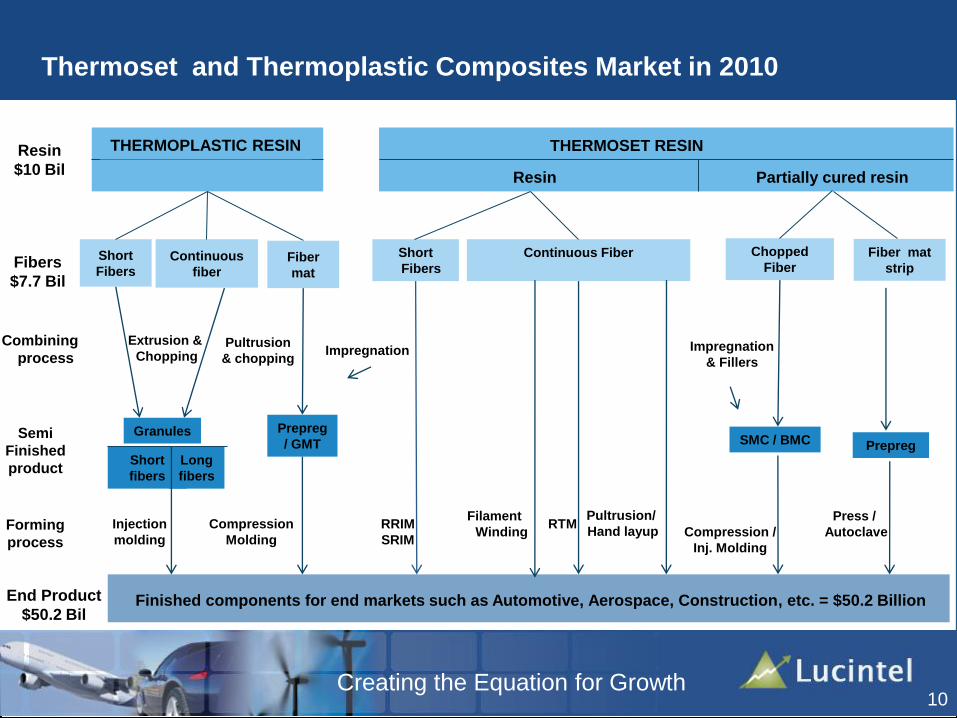
THERMOPLASTIC RESIN THERMOSET RESIN
Resin Partially cured resin
Resin
$10 Bil
Continuous
fiber
Short
Fibers
Continuous Fiber Chopped
FiberFiber mat
stripFibers
$7.7 Bil
Combining
process
Granules
Short
fibers
Long
fibers
Prepreg
/ GMT SMC / BMC PrepregSemi
Finished
product
Forming
process
Injection
molding
Compression
Molding
RRIM
SRIM
Filament
WindingRTM
Pultrusion/
Hand layupPress /
Autoclave
Finished components for end markets such as Automotive, Aerospace, Construction, etc. = $50.2 Billion
Pultrusion
& chopping
Extrusion &
Chopping Impregnation Impregnation
& Fillers
Short
FibersFiber
mat
Thermoset and Thermoplastic Composites Market in 2010
Compression /
Inj. Molding
End Product
$50.2 Bil
10

Creating the Equation for Growth
Table of Content
11
• Executive Summary
• Composites Competitiveness and Market Opportunity
• Market Trends and Opportunity
• Growth Opportunities in 2011 and Beyond
• Conclusions
• About Lucintel
11

Creating the Equation for Growth
External Forces Shaping Composites Industry: Higher market fragmentation
expected in future due to emerging economies. Companies in developed nations
with innovation capability can thrive and gain share
Composites
Industry
SuppliersCustomers
Competitors
WorkforceTechnology
Regulators
• Specialization
• Efficiency
• Power
• Competition from
emerging
economies
• Consolidation
• Non-traditional/new
entrants
• Focus/specialization
• Skills
• Availability
• Location
• Needs
• Culture
• Global recession
• War
• Political instability
• China asset bubble
• Technical Service
• Specialization
• Efficiency
• Value-added
DestabilizersDistributors
• Innovation
• Cost
• Process
improvement
• Capital
• Regulations on (VOCs)
• Tax credits on
renewables
• Uncertainty in
Government programs
for defense projects
• Global platforms
• Technical service
• Application Dev.
• Partnership
• Value
12

Creating the Equation for Growth
Regional Composites Market Trend: 2005-2010
Key Insights
• Composites industry growth outpaced
GDP in 2010
• Huge fluctuations in various markets
during last 5 years due to economic
recession
• Composites industry performed poorly
relative to GDP during the last 5 years
• However it is forecast to grow at a
higher rate than GDP over next 5
years
Source: Lucintel
13
Source: Lucintel0
1000
2000
3000
4000
5000
6000
7000
8000
2005 2006 2007 2008 2009 2010
Ship
men
t ($
Mn)
Trend (2005-2010) in composites shipment in various region in ($ Mn)
North America
Europe
Aisa
ROW
0
5000
10000
15000
20000
2005 2006 2007 2008 2009 2010
GD
P in
$ B
illi
on
Trend (2005 - 2010) in GDP in various regions
North America
Europe
Asia
ROW

Creating the Equation for Growth
Looking towards the future: the world has become an Urban World
with strong growth opportunities across developing nations . . .
Global Urban & Non-Urban Population
(Millions)
4,435
61%
39%
1950
2,519
71%
29%
2030
8,309
40%
60%
2010
6,790
49%
51%
2005
6,454
51%
49%
2000
6,070
53%
47%
1990
5,263
57%
43%
1980
Non Urban Population
Urban Population
World Population in Millions
1950 1980 1990 2000 2005 2010 2030
World 2,518 4,434 5,262 6,070 6,453 6,791 8,309
Urban 731 1,734 2,263 2,835 3,143 3,449 4,985
Non Urban 1,788 2,701 3,000 3,235 3,311 3,341 3,324
Oceania
North America
Latin America
Europe
Asia
Africa
138%
9%
2010
6,791
5%5%9%
11%
61%
15%
2005
6,453
5%9%
11%
61%
14%
1990
1%1%
5%8%
8,309
2030
1%
5,262
14%
60%
12%
1980
4,434
1%
6%8%
16%
59%
11%
1950
2,518
7%
7%22%
55%
9%
1%
59%
18%
Global Population by Region
(Millions)
14
Creating the Equation for Growth
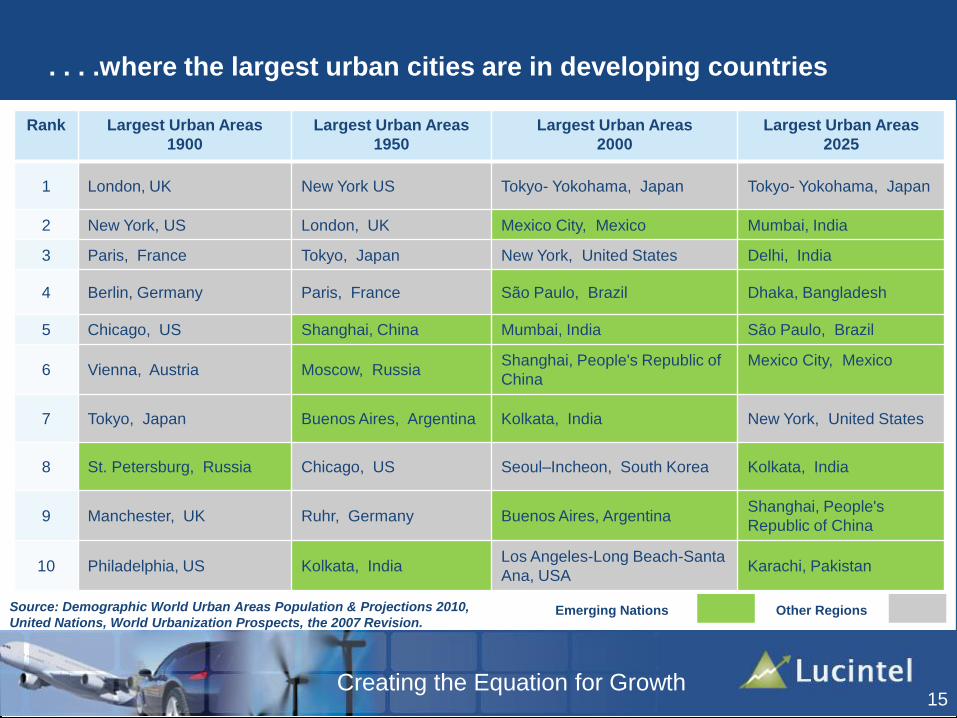
. . . .where the largest urban cities are in developing countries
Source: Demographic World Urban Areas Population & Projections 2010,
United Nations, World Urbanization Prospects, the 2007 Revision.
Rank Largest Urban Areas
1900
Largest Urban Areas
1950
Largest Urban Areas
2000
Largest Urban Areas
2025
1 London, UK New York US Tokyo- Yokohama, Japan Tokyo- Yokohama, Japan
2 New York, US London, UK Mexico City, Mexico Mumbai, India
3 Paris, France Tokyo, Japan New York, United States Delhi, India
4 Berlin, Germany Paris, France São Paulo, Brazil Dhaka, Bangladesh
5 Chicago, US Shanghai, China Mumbai, India São Paulo, Brazil
6 Vienna, Austria Moscow, RussiaShanghai, People's Republic of
China
Mexico City, Mexico
7 Tokyo, Japan Buenos Aires, Argentina Kolkata, India New York, United States
8 St. Petersburg, Russia Chicago, US Seoul–Incheon, South Korea Kolkata, India
9 Manchester, UK Ruhr, Germany Buenos Aires, ArgentinaShanghai, People's
Republic of China
10 Philadelphia, US Kolkata, IndiaLos Angeles-Long Beach-Santa
Ana, USAKarachi, Pakistan
Emerging Nations Other Regions
15

Creating the Equation for Growth
11%
DevelopedCountries
89%
40%BRIC nations
DevelopedCountries
60%
As developing countries play a larger role in the global economy, their
presence in composites manufacturing is also increasing
16
BRIC nations
2000 2010
• Developing nations (defined as
BRIC) have substantially increased
their participation in global economy
• Overall, developing nations have
taken a stronger role in global
composites production
GDP
Composites
Production
GDP
DevelopedCountries
BRIC Nations
53%
Key Insights
19%
81%
37%
63%DevelopedCountries
BRICNations
Source: Lucintel

Creating the Equation for Growth
Composites consumption/potential in various countries (2010)
17
BRIC Mega Trends
Rapid Growth
Rapid Urbanization
Emerging Middle Class
Global Connectivity
Increased OEM Production
Rising Costs
Potential Challenges
Asset Bubbles / Loose Credit
Political InstabilitySource: Lucintel
US
China
Japan
Germany
FranceUK
Italy
India
Brazil
Russia
-5
0
5
10
15
20
25
-20000 0 20000 40000 60000
Co
mp
osi
te V
olu
me
Pe
r C
ap
ita
($
/Ca
pit
a)
(20
10
)
GDP Per Capita US$ (2010)
Composite Potential by Country (2010)

Creating the Equation for Growth
US wind energy market declined in 2010 with future recovery in the
works
Challenges as overall wind market declined in
2010
• 3-4% drop in energy demand had a multiplier effect on new
capacity projects which were 50% renewable
• Fall in natural gas prices affected wind competitiveness
• Connectivity issues impacted new projects
• Lack of robust long term federal targets for renewable energy
continued to impact investor confidence and credit availability
• State level RPS targets are main driver
Solutions
• Demand to grow with renewed economic vigor with
EIA forecasting 2% CAGR over next 5 years for
overall energy demand
• Forecast 7% CAGR in natural gas prices over 5 yrs
• Texas is leading way with new connectivity
• Political support for renewable energy expected to
continue
Forecast of US cumulative wind capacity installation
(MW) - 2011-2016
102,300
48,200
0
20,000
40,000
60,000
80,000
100,000
120,000
20162011
+16%
Source: Lucintel
18
Creating the Equation for Growth
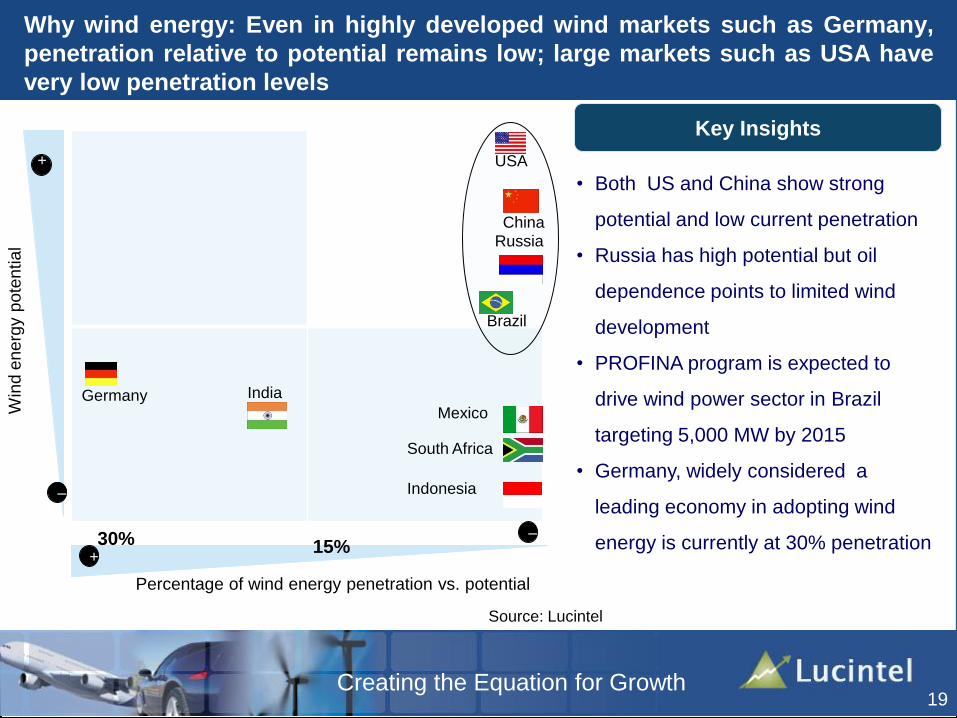
Why wind energy: Even in highly developed wind markets such as Germany,
penetration relative to potential remains low; large markets such as USA have
very low penetration levels
Key Insights
+
–
Win
d e
nerg
y p
ote
ntial
30%+
–15%
Percentage of wind energy penetration vs. potential
• Both US and China show strong
potential and low current penetration
• Russia has high potential but oil
dependence points to limited wind
development
• PROFINA program is expected to
drive wind power sector in Brazil
targeting 5,000 MW by 2015
• Germany, widely considered a
leading economy in adopting wind
energy is currently at 30% penetration
Germany India
Mexico
South Africa
Indonesia
USA
ChinaRussia
Brazil
Source: Lucintel
19

Creating the Equation for Growth
China wind market expected to witness robust cumulative growth rate
in next 5 years
• Wind is expected to remain dominant
renewable source in next 10 years
• Chinese government made commitment
for 15% non-fossil fuel in total energy use
by 2020 (currently at 8.5%)
• Expiration of Kyoto Protocol in 2012, with
elimination of carbon trading mechanism, is
likely to have a temporary adverse impact on
China wind market in 2013 by reducing the
carbon trading revenue of wind farms, reducing
their IRR and impacting overall investment in
wind
• China’s YoY annual installation growth rate to
2016 is relatively low due to a high base in
2010, but total installations are expected to
exceed 100 GW by 2014
Forecast of China wind cumulative capacity
installation (MW) 2011-2016
Key Insights
Source: Lucintel
20
158,700
64,200
0
50,000
100,000
150,000
200,000
20162011
+20%

Creating the Equation for Growth
Wind energy market insight: increasing blade length requires better
blade design, improved materials, lower process and life cycle cost
Current focus for Wind Blades
• Design: • Improved Aerofoil design for better load
distribution across the blade cross section
area which increases reliability and
performance
• Materials:• With increasing length, need for higher
strength-to-weight ratio material
• Mixture of fiber glass and carbon fiber to
improve the stiffness and tensile strength
in the fiber direction
• Process:• Process improvement to reduce total
production time
• Lower life cycle cost: • Improving reliability
• Reducing manufacturing cost
• Lower operation and maintenance cost
Lower life cycle cost
with increased
power output
Design
ProcessImproved materials
21
Source: Lucintel
Source: Lucintel

Creating the Equation for Growth
Table of Content
22
• Executive Summary
• Composites Competitiveness and Market Opportunity
• Market Trends and Opportunity
• Growth Opportunities in 2011 and Beyond
• Conclusions
• About Us
22

Creating the Equation for Growth
Global Composite Materials Market Growth by Segment
23
3,732
5,180
2,712
4,043
0
5,000
10,000
15,000
20,000
25,000
30,000
27,438
838
1,615
4,369
2,791
4,067
3,708
828
17,755
5511,083
3,119
2,075
1,969
2,043
471
Others
Consumer goods
E&E
Construction
Pipe & tank
Aerospace
Wind energy
Marine
Transportation
Sh
ipm
en
t($
mil)
Global composite materials shipment ($ mil)
by market segment • Global composite materials industry
reached $17.7B in 2010, with YOY
growth of 10.3%
• Global composites end product market
expected to grow @7.8% CAGR to 2016
– Positive sign of healthy growth with
gradual bounce back of automotive,
construction, electronics and
consumer goods markets
• Asia will drive future growth of composite
materials to 2016
• Europe to see moderate growth2010 2016
Key Insights
Source: Lucintel

Creating the Equation for Growth
• Attractiveness comparison is analyzed among different market segments in the same region
• Attractiveness is analyzed by taking different parameters such as current and future market potential
Relative Market Attractiveness by Region: Aerospace and Wind
Energy segments show most attractive markets for growth
Market Segment North
America
Europe Asia Rest of World
Transportation
Marine
Aerospace
Pipe & tank
Construction
Wind
Consumer Goods
High Medium Low- Medium Low No
24

Creating the Equation for Growth
Table of Content
25
• Executive Summary
• Composites Competitiveness and Market Opportunity
• Market Trends and Opportunity
• Growth Opportunities in 2011 and Beyond
• Conclusions
• About Us
25
Creating the Equation for Growth
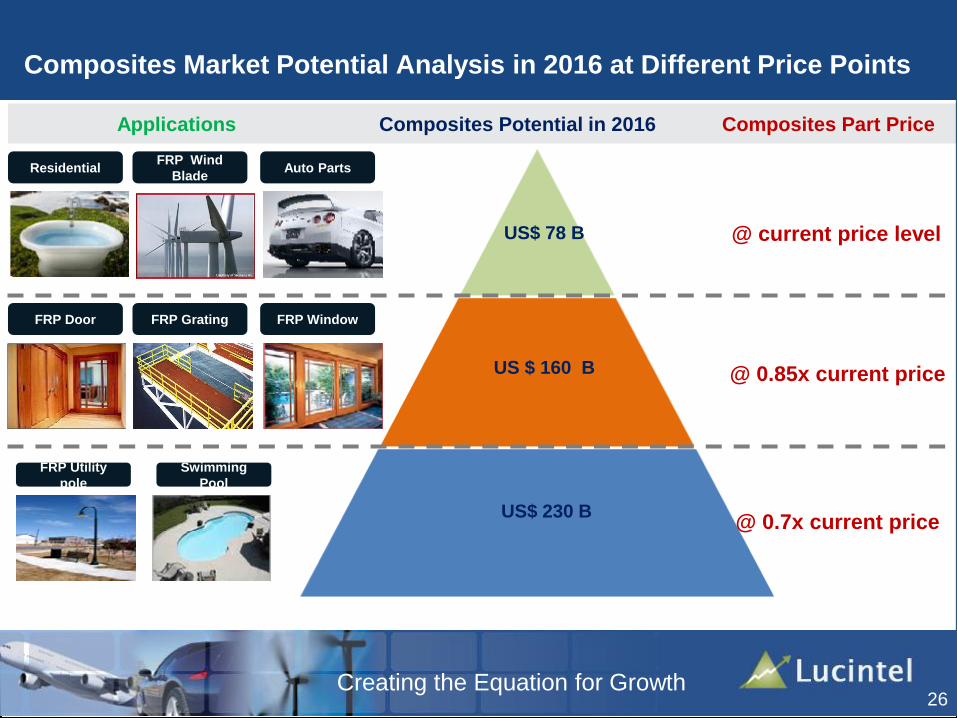
Applications Composites Potential in 2016 Composites Part Price
@ current price level
@ 0.85x current price
@ 0.7x current price
Composites Market Potential Analysis in 2016 at Different Price Points
FRP Utility
pole
Swimming
Pool
FRP Window FRP Grating FRP Door
Auto PartsFRP Wind
BladeResidential
26
US$ 78 B
US $ 160 B
US$ 230 B

Creating the Equation for Growth
Conclusions
• Composites industry is sustainable with +30,000 composite applications
• Strong growth expected in the foreseeable future, led by accelerated BRIC growth
• Weight savings, fuel economy and other performance benefits will fuel the growth of composites
consumption in Automotive
• High cost of materials and lack of suitable manufacturing processes for high volume automotive
applications continue to be limiting factors for future growth
• New reality in various emerging countries will change geo-political and geo-economical elements of
market. . . .players must react accordingly
• New business models need to be re-invented to address fast changing complex world
– Quarterly demand for composites shipments monitored by Lucintel show significant changes (up to
40% change Quarter by Quarter) in various market segments
• Companies driven by innovation in developing nations will maintain and gain market share
• Population growth, new infrastructure projects, urbanization, increase in middle class population, green
movement will drive composites growth to new horizons
• Innovations aimed at lowering cost of end products by 30% have potential to grow composites market by a
factor of 3x
27

Creating the Equation for Growth
Table of Content
28
• Executive Summary
• Composites Competitiveness and Market Opportunity
• Market Trends and Opportunity
• Growth Opportunities in 2011 and Beyond
• Conclusions
• About Us
28

Creating the Equation for Growth29
Lucintel is the leading global management consulting & market
research firm
Lucintel creates your equation for growth and is committed to
actionable results that deliver significant value and long term growth
to our clients.
Lucintel has been creating measurable value for over 10 years and
for thousands of clients in 70 + countries worldwide.
Visit http://www.lucintel.com/imovie/ for a short 3.5-minute movie on
Lucintel solutions.
About Lucintel
Creating the Equation for Growth
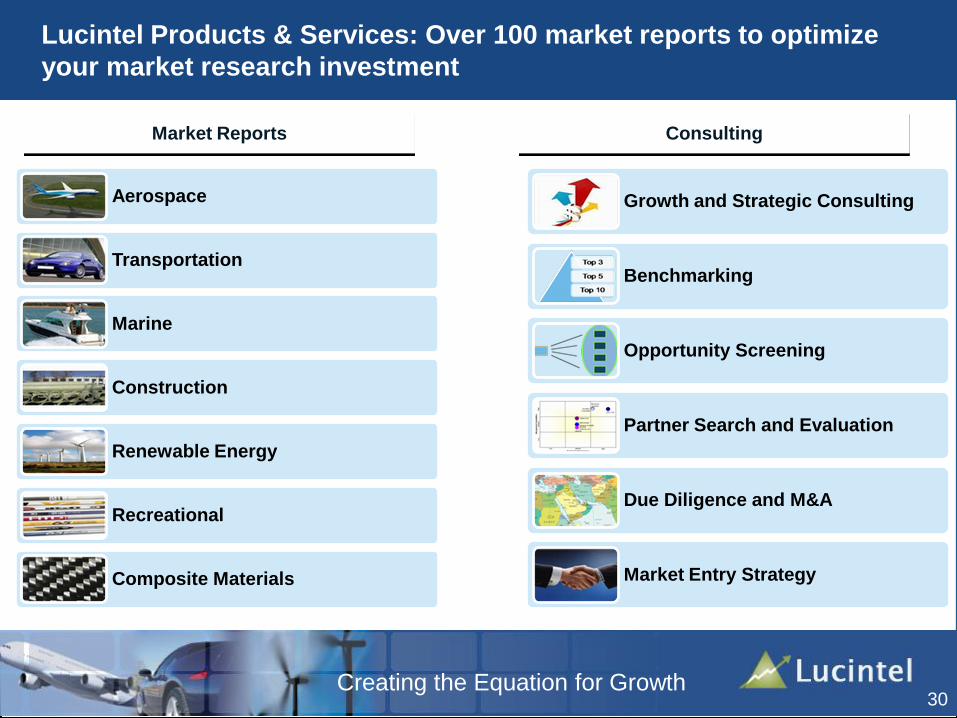
Lucintel Products & Services: Over 100 market reports to optimize
your market research investment
30
Aerospace
Transportation
Marine
Construction
Renewable Energy
Recreational
Composite Materials
Market Reports Consulting
Growth and Strategic Consulting
Benchmarking
Opportunity Screening
Partner Search and Evaluation
Due Diligence and M&A
Market Entry Strategy
Creating the Equation for Growth
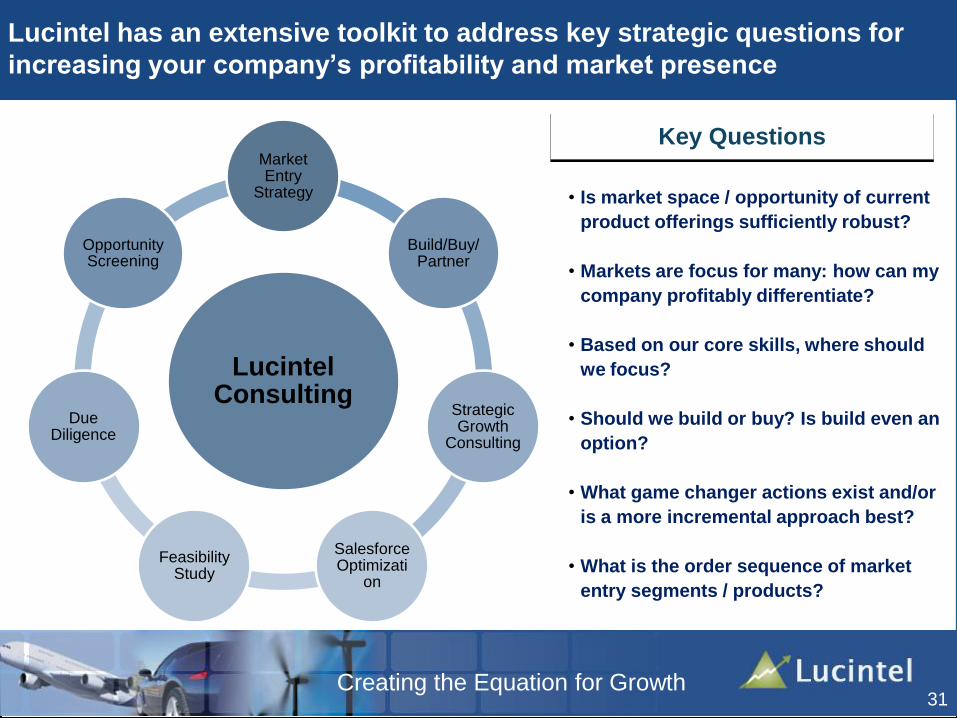
Lucintel has an extensive toolkit to address key strategic questions for
increasing your company’s profitability and market presence
31
• Is market space / opportunity of current
product offerings sufficiently robust?
• Markets are focus for many: how can my
company profitably differentiate?
• Based on our core skills, where should
we focus?
• Should we build or buy? Is build even an
option?
• What game changer actions exist and/or
is a more incremental approach best?
• What is the order sequence of market
entry segments / products?
Key Questions
Lucintel Consulting
Market Entry
Strategy
Build/Buy/Partner
Strategic Growth
Consulting
Salesforce Optimizati
on
Feasibility Study
Due Diligence
Opportunity Screening

Creating the Equation for Growth
Clients around the world value our services
32

Creating the Equation for Growth
Roy Almaguer
Sales Manager, USA
Email: [email protected]
Tel. : +1-210-878-7693 (Office)
Alan Clark
Director of Sales, UK
Tel :+44 (0) 7875 708825
Nigel Odea
Business Development Manager, UK
Cell : +44 (0) 207 558 8798
Reach Lucintel
For your business requirements and cutting edge consulting solutions, contact
Lucintel at [email protected] or Tel. +1-972-636-5056 or call one of the
following.
33