guatemala investing for peace: a public investmernt revie · guatemala investing for peace: a...
TRANSCRIPT

Report No. 16392-CU
GuatemalaInvesting for Peace:A Public Investmernt ReviewJuly 15, 1997
Dcumentl A rit of theWr tBan.Litinl A'nicri'ia ind11t ( tirihbel'<,letuifi k t, l
Document of the World Bank
Pub
lic D
iscl
osur
e A
utho
rized
Pub
lic D
iscl
osur
e A
utho
rized
Pub
lic D
iscl
osur
e A
utho
rized
Pub
lic D
iscl
osur
e A
utho
rized

CURRENCY EQUIVALENTSCurrency Unit: Quetzal (Q)
US$1.0 =Q.5.91 (July 1, 1997)
GOVERNMENT FISCAL YEARJanuary 1 to December 31
GLOSSARY OF MAIN ACRONYMS AND ABBREVIATIONS
BCIE- Central American Bank for Economic Integration ISR Income TaxBEST Stabilization Bonds KfW German Aid Agency
BOG Central Bank of Guatemala MCTOP Ministry of Communications, Transport andCG Consultative Group Public WorksCIEN National Center for Research and Studies MOE Ministry of EducationCNEE National Commission for Power MOF Ministry of FinanceCONALFA National Literacy Commission MOH/MSPAS Ministry of HealthlMinisterio deCONAMA National Enviromental Commission Salud Publica y Asistencia SocialCOPECAS Permanent Commission for Coordinating NFPS Non Financial Public Sector
Water and Sanitation NGO Non-Governmental OrganizationCOVIAL Roads Commission NSPI National System of Public InvestmentDGC General Directorate of Roads PAYSA Water and Sanitation Program for the AltiplanoDGOP General Directorate of Public Works PHC Primary Health CareDTP Technical Budget Directorate PIP Peace Investment PlanEEGSA Electricity Enterprise of Guatemala PLADES Social Development PlanEMPAGUA Guatemala City Municipal Water POA Annual Operational Plan
Corporation PPA Power Purchase AgreementFIS/SIF Fondo de Inversi6n Social/Social PRONADE National Program for Self-Management in
Investment Fund EducationFODIGUA Guatemalan Fund for Indigenous Development SEGEPLAN Economic Planning SecretariatFOGUAMA Guatemalan Environmental Fund SIAF-SAG Integrated Financial Management System-FOGUAVI Guatemalan Housing Fund Government Auditing SystemFONAGRO National Fund for Agriculture SINISEP National Information System on PublicFONAPAZ National Peace Fund InvestmentFONATIERRA National Land Fund SRH Secretariat of Water ResourcesFOSUVI Housing Subsidy Fund TRS Tax Revenue SuperintendencyFSDC Solidarity and Community Development Fund UDAF Financial Administration UnitGIS Geographic Information System UEP Project Execution UnitGTZ German Technical Cooperation Agency UNEPAR Executing Unit for Rural Water ProjectsGUATEL Guatemalan Telecommunications Enterprise UNICEF United Nations International Children'sIDB Inter-American Development Bank Education FundIGSS Guatemalan Social Security Institute USAID United States Agency for InternationalINDE National Electrification Institute DevelopmentINFOM Municipal Development Institute VAT Value Added TaxIPP Private Owned Generators
Managers and Staff Responsible
Vice President : Mr. Shahid Javed BurkiDirector : Ms. Donna Dowsett-CoiroloLead Economist : Mr. Ian BannonStaff Member : Mr. Josd R. L6pez-Calix

TABLE OF CONTENTS
PrefaceRESUMEN EJECUTIVOEXECUTIVE SUMMARY
INTRODUCTION .................................................................. 1
Chapter I: AN OVERVIEW OF PUBLIC SPENDING ALLOCATION ...........................................3
A. Trends in Public Finance ................................................................. 3B. Spending Pattern .................................................................. 6C. Budget Execution ................................................................. 8
Chapter II: INSTITUTIONAL FRAMEWORK AND THE PUBLIC INVESTMENT CYCLE.... 10
A. The Investmnent Cycle: Main Issues ................................................................. 10B. The Market Approach to the Public Investrnent Cycle ................................................................ 11
Chapter III: PEACE AND THE RECOVERY OF SOCIAL INVESTMENT .. 14
A. Education ................................................................. 14B. Health ................................................................. 17C. Social Safety Net: The Social Funds ................................................................. 20
Chapter IV: BASIC INFRASTRUCTURE PROVISION: WATER, ELECTRICITY,TELECOMMUNICATIONS AND ROADS ................................................................. 24
A. Roads .24B. Power .26C. Telecommunications .28D. Water and Sanitation .30
TECHNICAL ANNEXES
ANNEX 1: The PIP and the Macroeconomnic FramneworkANNEX 2: The Budget: Terminology and ConceptsANNEX 3: Investment Programs in InfrastructureANNEX 4: Recent Legal ChangesANNEX 5: Water and Sanitation: The Institutional Nightmare
BIBLIOGRAPHY
STATISTICAL APPENDIX
TEXT TABLES
1.1 Total Expenditures of Central Government ........................................................... 81.2 Budget and Actual Expenditures of Central Government ......................................................... 811.1 Education Structure of Recurrent Expenditures . .......................................................... 5111.2 Coverage and Regional Distribution of Recurrent Expenditures in Primary Education .................. 15111.3 Regional Variations in Health Conditions .......................................................... 17111.4 Distribution of Health Expenditures by Level of Care ...... .................................................... 18111.5 Regional Distribution of Health Expenditures .......................................................... 19111.6 Health: Existing Investment Projects and Proposed PIP .......................................................... 20111.7 Basic Features FONAPAZ, FIS, FSDC .......................................................... 21
TEXT FIGURES
1.1 Level of Public Expenditures ........................................................... 41.2 Change in the Use of Treasury Bonds ........................................................... 51.3 Trend of Public Floating Debt ........................................................... 51.4 Public Expenditures in Central America ........................................................... 71.5 Allocation of Budget Among Major Expenditure Categories .........................................................71.6 Trends of Official Disbursements .......................................................... 9
TEXT BOXES
0.1 Peace Accords: Quantitative Targets: Socioeconomic and Agrarian Issues ....................................1I. 1 Macroeconomic Scenarios .......................................................... 31.2 Recent Trends in Domestic Debt ................................. 411.1 Expanding the SLAF Information System .............................. 13TI1.1 The Govermment's Education Strategy .............................. ; 16111.2 The Government's Health strategy 1996-2000 .............................. 18111.3 The New Approach to Local Service Delivery .............................. 23IV. 1 The Disincorporation of GUATEL .............................. 29IV.2 The Program Water Source of Peace ....................... 2........ 32
.hi .................. lx~LWG)wAiaragd4(dD N)hvcei ~miu~0f~to Gatemala duing hate 19 eadyi99, ... ..... .. eGve .nt(ScttaiaoPJmi~ Enwtie ~fl*w U omas~oio~ rwpot ndPuli Wrk, ne4v B'. q
Gaatemal~~), (7LIATEL,..N........... . O APZ iE))C...G m n h C r ~ n uwt%Ae Wo ~ ~~r.. .?11 .....~t serpr ee JnB mn av ejo L D~ ejeM ad
Annex l quad malys* Fac.........alat,wte) Cna U r, CnsktUIWOJPMP.ca4iin~~~~~)i Vent~~ara sgoechea (L4SW-wter); Cedar Fe ~~~~~~~~,dez(ConsuIman, infOJ.1~~~~~ar4on syse,n ....
Eduar.do Wieuner (Consrdtwu~~~~~ institutional Luues)~~~~ Peer reviewer.s were~~~~ RCrnA(~~er.(C~~a$.~~9u... . ..w....orI~,.Wee tahr (haper119 8enarJ(gie (Rta ocal,ChaterL.......arg P.....(.I
selecomnuanicationundheulth~~...... .
Guatemala: Investing for Peace:A Public Investment Review
Preface
This report was prepared by the World Bank as a contribution to the policy dialogue withthe Government and donors who are supporting development and the peace process in Guatemala.The World Bank initiated an active policy dialogue with the current Administration in March 1996with a presentation to the members of the new Cabinet of the Bank's report: Building Peace withRapid and Equitable Growth, Country Economic Memorandum (August 22, 1996; Report No.15352-GU). The main message of that report was that ensuring macroeconomic stability will becritical not only to accelerate growth, but also to finance peace and advance in the battle againstpoverty, since the modest growth of the past few years would not be sufficient to make a dent onpoverty. The Report was published in English in August 1996 and widely disseminated inGuatemala. Its preparation provided a valuable input for the negotiations of the Socioeconomicand Agrarian Peace Accord and contributed to the design of new Bank operations in the areas ofpublic sector modernization.
In mid-1996, as the Government was preparing for its first, formal Consultative GroupMeeting, it became clear that a key challenge to be faced after peace signing was improving themanagement of public expenditure and provision of basic infrastructure services. The verycomprehensive and detailed targets agreed in the Peace Accords could not be implemented withouta major restructurng of the Government's overall expenditure program. The Government and theInternational Monetary Fund requested that the World Bank undertake a study to makerecommendations in this area. GTZ, the German Technical Cooperation Agency, also contributedto its realization.
Preparations for the study were fully supported by the Economic Cabinet, and particularlyby the Ministries of Finance, Communications, Transport and Roads, Energy, Education andHealth, by SEGEPLAN, the Bank of Guatemala, GUATEL, FONAPAZ and INFOM, who alsoprovided valuable comments on drafts of this report. A formal discussion of an early draft of thereport was held with the Economic Cabinet in January 1997 and the final draft was cleared by theAuthorities in late May 1997. The conclusions reached during those discussions are reflected inthe final report. Throughout preparation of the report most of the key recommendations have beendiscussed and reviewed with key Government agencies. In many instances, the Government hasalready begun acting on these recommendations. To the extent possible, the report has tried to noteareas where Government efforts or actions are underway to address the constraints identified in theanalysis.


RESUMEN EJECUTIVO
La firma de la paz proporciona una oportunidad uinica para acelerar el crecimiento y reducir lapobreza.
i. El Programa Econ6mico y Social del Gobiemo 1996-2000 expone una estrategia para acelerar elcrecimiento y reducir la pobreza. Alcanzar la paz marc6 un hito clave para dicha estrategia, perosostenerla requiere de mas que el cese de violencia. La paz duradera requerira de un marcomacroecon6mico firme, asegurando el financiamiento apropiado de las necesidades relacionadas con la pazy redefiniendo la relaci6n entre los sectores puiblico y privado, para permitirle al sector privado encabezarel crecimiento econ6mico y fortalecer las funciones reguladoras y de subsidio del sector piublico mientras sealeja de las actividades directamente productivas. Este Reporte identifica las areas prioritarias del gastopuiblico para respaldar la paz. Enfoca las reformas actuales de modernizaci6n al sector puiblico y analiza elPrograma de Inversiones de la Paz (PIP), sometido por el Gobierno en la reuni6n de enero de 1997 alGrupo Consultivo (GC), y otras inversiones sectoriales prioritarias. El Reporte expone las inquietudes dela comunidad intemacional acerca de la importancia de orientar los recursos hacia las prioridadessectoriales claves, mientras asegura la absorci6n apropiada de los recursos extemos y una ejecuci6nefectiva y eficiente de la inversi6n piiblica.
Una pre-condici6n para la paz duradera es asegurar la estabilidad macroecondmica
ii. La baja y fluctuante recaudaci6n tributaria ha significado que las metas de estabilizaci6n han sidologradas en su mayoria a traves de un severo control del gasto piiblico. Aunque esto ha asegurado politicasfiscales relativamente adecuadas, la cobertura de la infraestructura social y basica sigue siendo la mas bajade la regi6n. Ademas, la calidad de los servicios puiblicos es extremadamente pobre y, debido a los gastosde la paz, existe un margen limitado para una mayor reducci6n del gasto piiblico.
iii. La d6bil recaudaci6n tributaria tambien se ha convertido en una carga inapropiada para la politicamonetaria en su objetivo de preservar la estabilizaci6n macroecon6mica. Una estricta politica monetaria,tendiente a contrarrestar los desequilibrios fiscales de 6pocas anteriores - basada en requerimientos deencaje con altas tasas y en operaciones de mercado abierto-aunada a las necesidades de financiamientodel gobierno satisfechas principalnente en el mercado domestico de corto plazo, han elevado las tasas deinteres domdsticas e incrementado la carga del servicio a la deuda interma. Como resultado, mAs de uno decada cuatro d6lares recaudados como impuesto-y mas de una quinta parte del total de gastos delGobiemo Central - es utilizado para pagar intereses de la deuda intema. En cuanto avance laimplementaci6n de la paz, reducir y reestructurar la deuda intema es esencial para crear un espacio fiscaladicional que permita financiar los gastos relacionados con la paz. Esto requiere de: (i) la aprobaci6n delas reformas a la Ley Organica del Banco de Guatemala (BG), la cual es necesaria para reducir loscoeficientes de encaje y, por lo tanto, las tasas de interes domesticas; (ii) la mejora de la administraci6nfinanciera por el Ministerio de Finanzas, respaldado por el Sistema Integrado de Administraci6n Financiera(SIAF), para evitar la tradicional emisi6n de bonos a corto plazo que cubren dificultades temporales decaja; (iii) seguir ampliando el plazo de vencimiento de los Bonos del Gobiemo; y (iv) mantener un enfoqueconservador en la politica de emisi6n de bonos en d6lares.
iv. El Gobiemo estA consciente de que para mantener la estabilidad macroecon6mica durante laimplementaci6n de la paz, se requiere de un ahorro interno considerablemente mayor. Esto es esencial nosolamente para financiar mayores gastos, sino tambien para crear suficiente soporte fiscal en caso de que elrespaldo externo se materializase mas lentamente de lo esperado. AdemAs, la carga tributaria podria bajar
ii Resumen Ejecufivo
en un escenario pasivo en 1997. Para incrementarla de 7.9 por ciento del PIB (8.5 por ciento del PIB conel impuesto temporal) en 1996 a las metas 1997-1999 establecidas en los Acuerdos de Paz, las medidasrequeridas incluyen: (i) cambios de politica tributaria urgentes (incluyendo alzas de los impuestos y laeliminaci6n de exenciones de impuestos) y cambios en la administraci6n tributaria (la creaci6n de laSuperintendencia de Administraci6n Tributaria-SAT); (ii) modificaciones adicionales al c6digo tributariopara fortalecer la SAT; (iii) la emisi6n de nuevas normas judiciales para respaldar el cumplimientotributario y la sanci6n efectiva por evasi6n fiscal. La disciplina fiscal tambien requiere de: (i) mantener lapolitica de gastos bajo control, mientras cambia el orden de prioridades hacia las metas de gastos sociales yde paz establecidas en los Acuerdos de Paz; (ii) ajustar las tarifas de servicios publicos para incrementar elahorro piiblico; (iii) proceder a desincorporar las empresas publicas y utilizar los recursos de su ventamayoritariamente para reducir la deuda intema (incluyendo las perdidas del BG); y (iv) en cuanto se hayareducido significativamente la deuda intema, considerar nueva legislacion apropiada para poner un limitemiximno, en forma permanente, al deficit del sector puiblico.
v. Guatemala tiene una carga de deuda externa baja, la cual debera manejar cuidadosamente. Luegoque el Gobierno anterior concluyera acuerdos bilaterales con cinco de los seis participantes de lareprogramaci6n del Club de Paris de 1994, Guatemala disfruta una posici6n firme en cuanto a su deudaexterna. Los indicadores de deuda han mejorado en los ultimos afios como resultado no solo de lareprogramaci6n de la deuda, sino de las politicas conservadoras y tradicionales de endeudamiento y lasdecrecientes tasas de interes mternacionales. Los donantes comprometieron aproximadamente $1.9 milmillones durante la reuni6n del GC para financiar el PIP y otras inversiones puiblicas. La absorci6n deestos fondos deberia estar acompafiada por una estrategia de endeudamiento externo prudente.
Es esencial incrementar el nivel y mejorar la calidad y eficiencia de la inversidn relacionada con lapaz
vi. Asegurar el uso eficiente de los recursos es tan esencial como elevar los ingresos tributarios, parapoder cumplir con los compromisos de paz. La paz requerira solucionar los problemas de pobreza y dedesigualdad social en Guatemala, especialmente en las areas rurales y con fuerte concentraci6n en laspoblaciones indigena y femenina. Esto requerira mAs que el simple incremento de los recursos. Aim conuna base tributaria domestica mas fuerte y el apoyo significativo de los donantes, sera necesario que elGobiemo equipare las prioridades de la agenda de la paz con los recursos disponibles. Balancearcuidadosamente estas prioridades es el primer reto del Gobiemro; puesto que el financiamiento puede nofluir de manera uniforme, lo que conllevaria tomar decisiones dificiles de asignaci6n de recursos.
vii. Un mayor nivel de inversiones requiere de: (i) la reducci6n de los costos recurrentes de su altaparticipaci6n actual del 79 por ciento del total de los gastos; (ii) el mantenimiento consistente de laasignaci6n efectiva de los fondos con el monto presupuestario original; (iii) el incremento de la capacidadde absorcion limitada del sector puiblico para desembolsar financiamiento externo; (iv) el asegurar lacompleta ejecuci6n de las inversiones presupuestadas, principalmente en los Ministerios de Salud y deEducaci6n; y (v) la descentralizaci6n operativa de la ejecuci6n hacia los fondos sociales, en primerainstancia, y las mumcipalidades en segunda instancia. Las demandas adicionales a corto plazo de lasnecesidades urgentes de la paz, generalmente no deberian ser cumplidas a costa de las necesidadesprioritarias de infraestructura social y bAsica a largo plazo-esenciales para el crecimiento sostenido y lareducci6n de la pobreza.
viii. Aunque las asignaciones de gastos a traves de los sectores han sido paralelas con los objetivosenunciados en la estrategia establecida por el Programa de Gobiemo-recibiendo las comunicaciones(carreteras), trabajo municipal (agua), salud y educaci6n, la porci6n mas grande-sus asignaciones dentro

Resumen Ejecutivo Hi-
de los sectores no han sido siempre consistentes con las prioridades econ6micas y sociales enunciadas porel Gobierno. Por ejemplo, el gasto en educaci6n pre-prirnaria y primaria es parcial a favor de la regi6nmetropolitana en relacion a las areas rurales mas pobres. Ocurre una situaci6n similar en salud, en cuantoa que los hospitales siguen recibiendo mas de la mitad del presupuesto de salud en detrimento del cuidadoprimario y preventivo, el cual tiende a beneficiar al pobre rural. La acumulaci6n de necesidades derehabilitaci6n de caminos primarios y secundarios justifica el esfuerzo actual del Ministerio deComunicaciones, Transportes y Obras Publicas (MCTOP) para rehabilitar esta red.
La implementacion del PIP requiere de un nuevo marco institucional e instrumentos de gesti6n
ix. Desde una perspectiva institucional, aunque el sector piiblico es pequen'o, es excepcionalmenteineficiente en el suministro de los servicios que ofrece, su administraci6n y sus funciones reguladoras. Lainversi6n puiblica ocurre dentro de cuatro bloques principales, con considerable autonomia y pocacoordinaci6n en todas las fases del ciclo de inversi6n: la infraestructura y la inversi6n social de losministerios sectoriales, la inversi6n en infraestructura de empresas puiblicas, y la inversi6n por los fondossociales y por las municipalidades. La sub-ejecuci6n de grandes presupuestos de la inversi6n puiblica y lapoca capacidad de desembolso de fondos extemos, son justamente el reflejo de problemas institucionalesacumulados durante muchos afnos, incluyendo: (i) con la excepci6n del MCTOP y el Ministerio deEducaci6n (ME), la ausencia de mecanismos institucionales para conectar el disenjo del proyecto con lasprioridades sectoriales, lo cual hace que las decisiones de inversi6n se tomen frecuentemente en funci6n dela disponibilidad de financiamiento externo, en vez de las prioridades sectoriales; (ii) la debil capacidad delos ministerios de linea (con la excepci6n del MCTOP y del ME) y SEGEPLAN de evaluar las inversionespropuestas; (iii) la ausencia de un ente regulador efectivo para la planificaci6n de inversiones, en partedebido a la dispersi6n de SEGEPLAN en demasiadas funciones; (iv) la falta de recursos tecnicos yfinancieros adecuados en SEGEPLAN y en el Ministerio de Finanzas (MF) para dedicarse a laplanificaci6n, monitoreo y evaluaci6n de inversiones, asi como para negociar y desembolsar fondosextemos efectivamente; (v) la centralizaci6n de la ejecuci6n presupuestaria en el MF, que conlleva a lainhabilidad de los ministerios de linea de operacionalizar las estrategias sectoriales; (vi) fondos decontraparte no siempre disponibles para respaldar la implementaci6n de los proyectos financiadosexternamente, lo cual define que las prioridades del gasto efectivamente sean determinadas por ladisponibilidad de efectivo del MF; (vii) deficiencias organizacionales y gerenciales dentro de los ministeriosde linea; (viii) incipiente coordinaci6n y control de la inversi6n por los fondos sociales y empresas estatales,lo cual conHleva a traslapes efectivos, ineficiencia de escala y asignaciones de inversi6n no-coordinadasentre sectores; y (ix) con la excepci6n del mantenimiento de caminos, escasa o ninguna participaci6n delsector privado en la ejecuci6n de proyectos.
x. La implementaci6n del Sistema Integrado de Administraci6n Financiera (SIAF) por el MF yalgunos ministerios de linea (MF, MCTOP, Educaci6n y Salud) ya esta dando respuesta a varios de estosproblemas mediante: (i) la centralizaci6n de las 6rdenes de compra y pago por cada ministerio en una solaunidad (UDAF), reduciendo los tranites de 130 a 19 pasos y eliminando un promedio de 600 chequesdiarios que previamente eniitia el tesorero de la naci6n; (ii) el control por cada ministerio, a trav6s de laUDAF y las Unidades de Control Interno (UDAI), de la formulaci6n, ejecuci6n y control de su propiopresupuesto mediante un programa mensual de caja acordado con el MF; y (iii) la formulaci6n delpresupuesto 1998 en base a una nueva metodologia que ha reducido la estructura programitica de 1,007actividades a 50 unidades. El SIAF es consistente con el programna de modernizaci6n del estado quetambi6n incluye: reformas a la administraci6n tributaria y el servicio civil, la desincorporaci6n de lasempresas del Estado, y la reforma de la estructura y el funcionamiento del Gobierno Central por medio dela Ley del Ejecutivo propuesta, la cual considera agrupar al Ministerio de Finanzas y SEGEPLAN en unsolo Ministerio de Economia

iv Resumen Ejecutivo
xi. El principio de centralizaci6n normativa con descentralizaci6n operativa requiere de un nuevoenfoque de mercado-basado no s6lo en nuevos arreglos institucionales sino en nuevos instrumentos degesti6n-dirigido hacia una asignaci6n 6ptima y eficaz de la inversi6n puiblica. Dicho enfoque deberiamejorar la calidad tecnica de los proyectos, y unificar y fortalecer los mecanismos recientes decoordinaci6n ad hoc-Gabinete ministerial social, Fondos Sociales-acordados para su preparaci6n yevaluaci6n entre ministerios, empresas puiblicas, fondos sociales y municipalidades en 1997. Este incluiria:(i) la creaci6n de un Sistema Nacional de Inversi6n Publica (SNIP) integrado por un Consejo de Ministros;(ii) la simplificaci6n de las funciones rectoras de SEGEPLAN en el SNIP en dos principales: lacoordinaci6n de la planificaci6n y politicas de pre-inversi6n, y la evaluaci6n de proyectos; (iii) elfortalecimiento t6cnico de SEGEPLAN para Ilevar a cabo PIP-anuales y plurianuales-consistentes conlas proyecciones macroecon6micas, el sistema (banco) de proyectos, el sistema de preinversi6n y el sistemade informaci6n geografica; (iv) el fortalecimiento de las unidades descentralizadas localizadas en losministerios sectoriales, consejos de desarrollo urbano y rural, fondos sociales, municipalidades y ONGs enel disenlo de inversi6n, ejecuci6n presupuestaria y monitoreo; (v) el aumento de la participaci6n del sectorprivado en la pre-inversi6n (en parte financiado por SINAFIP), ejecuci6n y evaluaci6n del proyecto,contratados extemamnente por el Gobiemo; (vi) la creaci6n de un nuevo subsistema de credito-externo einterno-publico en el MF que simplifique/mejore el marco mstitucional que rodea la contratacion deprestamos extemos y apoye la ventanilla uinica recientemente creada mediante la Comisi6nInterinstitucional para la Agilizaci6n de la Cooperaci6n Internacional (CIACI) y el tratamiento de "fasttrack" recientemente aprobado por el Congreso para las donaciones externas; y (vii) la creaci6n de unnuevo subsistema de informaci6n de mversi6n puiblica en el MF para pernitir el control de la ejecucionfinanciera y fisica de los proyectos por la futura Secretaria de Finanzas, SEGEPLAN y el SNIP. Los dosItimos subsistemas formarian parte de la ampliaci6n del SIAF.
Los Acuerdos de Paz estdn orientados a incrementar significativamente la eficiencia del gasto social
xii. El reto de mejorar las condiciones sociales requiere enfocar las deficiencias claves, tales como:mejorar la asignaci6n de fondos en linea con prioridades declaradas; mantener la consistencia del PIP conlos balances macroecon6micos y las prioridades de paz, y asegurar que las reformas institucionales (y suimplementaci6n) requeridas para alcanzar las metas de inversi6n social est6n bien enfocadas, alentandomayor participaci6n comunitaria y su sostenibilidad. Debe especificarse que criterios seran utilizados paraque la inversion sea consistente con las necesidades prioritarias del sector; lo cual se vuelve mias importanteque simplemente estimar cuanta inversi6n deberia hacerse a corto y mediano plazo.
xiii. El PIP propuesto para el sector de educaci6n es factible y consistente con las prioridadessectoriales, pero el de salud es excesivamente alto para la capacidad de absorci6n del Ministerio. En amboscasos, es esencial duplicar la capacidad de absorci6n de los fondos sociales para satisfacer loscompromisos de paz.
xiv. El PIP del sector educaci6n se propone: (i) ampliar la cobertura de los servicios educativos en lasareas rurales a traves de PRONADE, un modelo de escuelas primarias manejadas por la comunidad;programas de educaci6n pre-primaria acelerados; alternativas de modelos para el suministro modular de losservicios de educaci6n primaria y de becas para satisfacer las necesidades de grupos especiales; losprogramas de alfabetizaci6n y de post-alfabetizaci6n de CONALFA en espafiol y en lenguas indigenas; yprogramas especiales para grupos directamente afectados por el conflicto armado; (ii) fortalecer y ampliarla educaci6n bilingue, el adiestramniento de maestros, el adiestramiento en la administraci6n de escuelas delas juntas escolares, e iniciativas de educaci6n civil; y (iii) aumentar la inversi6n piiblica en la construcci6ny provisi6n de equipo de escuelas, pero ejecutados por los fondos sociales. La cartera de este sector esrealizable, pero se deben seguir varios pasos:

Resumen Ejecutivo v
* asegurar el puntual aporte financiero del MF de la contraparte de los fondos extemos;* Ilevar a cabo un esfuerzo de reestructuraci6n intema del Ministerio coherente y global orientado hacia
la redefinicion de sus funciones y nuevas responsabilidades en diversos niveles; y la focalizaci6n, comoprimer paso, en los programas prioritarios orientados hacia mejorar el suministro de los serviciosclaves;
* la descentralizaci6n efectiva de la ejecuci6n presupuestaria a traves de la pronta creaci6n de la unidadde administraci6n financiera (UDAF) en el ME para iniciar la implementaci6n del SIAF;
* la contrataci6n externa de servicios de consultoria para la ejecuci6n de proyectos, hasta que seaaprobada y puesta en vigor una legislaci6n nueva sobre el servicio civil;
* el fortalecimiento efectivo de la estructura administrativa y de ejecuci6n de PRONADE; y* la inversi6n en contrataci6n externa para infraestructura escolar de los fondos sociales y el sector
privado.
xv. El PIP propuesto para el sector salud tiene cinco objetivos clave, que son consistentes con la saludpreventiva y los cuidados primarios de la salud, prioridades de la estrategia sectorial y de los Acuerdos dePaz: (i) ampliar la cobertura a traves del sumninistro de un paquete basico de servicios; (ii) construir,rehabilitar y ampliar los puestos y centros de salud; (iii) proyectos de agua y saneamiento; (iv)rehabilitaci6n de la infraestructura y del equipo, asi como el desarrollo institucional de los hospitalesregionales; y (v) apoyo a la medicina Maya. Sin embargo, la cartera es demasiado ambiciosa, ya querepresenta cuatro veces mas su presente nivel de capacidad de ejecuci6n. Su reducci6n a un tamaflo masrealista deberia ser detenninada por:
* la probable contribuci6n de cada proyecto para con las metas estrategicas y las prioridades sectoriales;* la selecci6n de proyectos de hospitales que sean absolutamente esenciales para lograr las estrategias de
salud preventiva y cuidados prinmarios de la salud, asi como la puesta de atenci6n para evitar laduplicaci6n y mejorar la coordinaci6n entre las actividades del Ministerio de Salud (MS) y del IGSS;
* las implicaciones del costo recurrente incrementado de cada proyecto propuesto;* la efectiva contribuci6n de fondos extemos y de contraparte;* el progreso del reciente Programna de Mejoras de Servicios de Salud que incluye: (i) la reestructuraci6n
del MS, (ii) la introducci6n de un modelo recien desarrollado de suministro de servicios, y (iii) unnuevo programa administrativo para hospitales piublicos; y
* la efectiva descentralizaci6n de la ejecuci6n presupuestaria a traves de la creaci6n de la unidad deadrninistraci6n financiera (UDAF) en el MS y la contratacion extema de ONGs, el sector privado,cooperativas, municipalidades, y grupos comunitarios para la ejecuci6n de programas prioritarios.
xvi. Los fondos sociales tienen la capacidad potencial de duplicar el nivel de sus operaciones durantelos siguientes cuatro afnos al mismo tiempo que lograr una mas eficiente utilizaci6n de sus recursos. Sinembargo, ello solo es posible dentro de un nuevo marco institucional que redefina sus funciones yresponsabilidades, elimine la duplicaci6n y la fragmentaci6n, integre su sistema de informaci6n sobreinversiones al sistema SLAF y considere la conveniencia de transferir la responsabilidad de las inversionespublicas a los ministerios. Esto requerira que se tomen medidas para:
* evitar que siga la dispersi6n y la fragmentaci6n institucional a trav6s de la creaci6n de mas fondos;* desarrollar un modelo de suministro de servicio local que involucre directamente no s6lo a las
municipalidades y ONGs, sino tambien las poblaciones indigenas y pobres que seran las principalesbeneficiarias de los programas rurales;
* llevar a cabo una completa reestructuraci6n de sus tranites y procedimientos internos con el prop6sitode unificar las normas tecnicas entre los ministerios de linea y simplificar sus procedimientos;

vi Resumen Ejecutivo
* fortalecer y facilitar la participaci6n del sector privado en la preparaci6n de proyectos tanto a nivellocal (comunidad, municipalidad) como a nivel de ministerio de linea;
* ampliar los mecanismos de coordinacion existentes por medio de mas especializaci6n de cada fondo enciertas actividades, de un sistema de informaci6n geogrifica (SIG), de la unificaci6n de la informaci6nbAsica de demanda, y del establecimiento de un sistema periodico nacional de encuestas a hogares queayudaria a monitorear y evaluar las necesidades de las comunidades y el impacto de los proyectos.
La infraestructura bdsica actual existente es perjudicialpara la consolidacidn de la paz
xvii. La existencia actual de infraestructura bAsica en Guatemala es debil y claramente perjudicial parala aceleraci6n del crecimiento, la reducci6n de la pobreza imperante y, como consecuencia, la consolidacionde la paz. Mucho de este desempeflo pobre se le puede atribuir al papel dominante del Estado en elsuministro de servicios de infraestructura, la ausencia de mecanismos de mercado, y un marco institucionalque no es adecuado. Esto resulta en la sub-ejecuci6n, el mal disenio, el pobre monitoreo y evaluaci6n de losproyectos de inversi6n; deficiencias comunes que se comparten con el resto de la inversi6n piiblica.
xviii. Debido a su papel critico en facilitar el acceso a servicios y mercados, las carreteras son laprincipal necesidad de infraestructura del pais, seguida por agua y saneamiento (debido a su papel clave enlas condiciones de salud), energia y telecomunicaciones (debido a su impacto sobre el crecimiento). Elprograma de inversiones de carreteras estA bien enfocado y, dada la capacidad de ejecuci6n actual delMinisterio, de contarse con el financiamiento apropiado podria ejecutarse en un alto porcentaje; elprograma de energia continuara siendo poco apegado a la realidad, a menos que se encuentre una soluci6nlegal a los impedimentos para efectuar los ajustes tarifarios; el programa de telecomunicaciones se limita enla inversi6n hasta 1997, debido a la esperada desincorporaci6n de GUATEL durante 1997; y no existe unPIP realista para el sector de agua y saneanuiento, lo que muestra la falta de un marco institucionalapropiado y la ausencia de una estrategia sectorial global.
xix. El programa de inversiones para carreteras 1997-00, que no se limita al PIP, pone un enfasisadecuado en la rehabilitaci6n. Superar la rehabilitaci6n acumulada durante los ultimos 5 aAosrepresentaria un monto de $864 millones, de los cuales aproximadamnente una quinta parte ($170 millones)seria para los caminos de ZONAPAZ. A pesar de la significativa mejora en los niveles de ejecuci6n delMCTOP en 1996 (arriba del 90 por ciento), la inversi6n anual en carreteras es aun dos tercios de lo querequiere el programa propuesto, las agencias de gobiemo y las empresas nacionales de construcci6n notienen aun la capacidad financiera e institucional para ejecutar un programa tan ambicioso, los fondos delexterior son limitados y la participaci6n privada es auin baja. Inplementar dicho programa requiere no s6Lode financiamiento suficiente, sino de acciones (algunas ya bajo implementaci6n):
* La Direcci6n General de Caniinos (DGC) debe fortalecer su capacidad institucional en cuanto a lapreparaci6n de la planificaci6n de inversi6n sectorial y a la ampliacion de su esquema innovador decontrataci6n extema de empresas del sector privado pam darle mantenimiento a las carreterasprincipales (prirarias) y caminos secundarios. La inversi6n en caminos terciarios y ruralesprioritarios puede ser Ilevada a cabo por la DGC, pero pernitiendo la sub-contrataci6n a los fondossociales y gobiernos locales para Ilevar a cabo su ejecucion.
* Se requiere de mas coordinaci6n bajo el futuro SNIP, entre el MCTOP con el futuro Ministerio deEconomia, y entre el MCTOP y los fondos sociales, principalmente en lo que se refiere a laconstrucci6n, la rehabilitaci6n y el mantenimiento de caninos terciarios.
* Para poder darle apoyo a la implementaci6n de futuros tratados de libre comercio con America delNorte y Central, es prioritario que se continue con el financianmiento para la rehabilitaci6n de carreteras

Resumen Ejecutivo vii
(primarias) entre las fronteras. La construcci6n de by-pass (tramos ampliados) ya ha sido consideradapara facilitar el trafico.
* Para reducir los costos de rehabilitaci6n, tres estrategias complementarias estan siendo implementadasy debiesen fortalecerse: (i) permitir la participaci6n de empresas de construcci6n no-guatemaltecas enel proceso de licitaci6n; (ii) lograr una mayor descentralizaci6n que conlleve a proyectos de gastoscompartidos con los gobiernos locales; y (iii) mejorar (asfaltar) los caminos terciarios en base a unanalisis de caso por caso.
* El fortalecimiento tecnico del fondo para caminos (COVIAL) creado recientemente y el posible uso depeajes (e.g.,. Palin-Escuintla) son mecanismos apropiados para obtener recursos adicionales.
xx. A falta de un ambiente propicio para el ajuste tarifario, las compafiias electricas van canmino a labancarrota, luchando contra su actual ineficiencia, insolvencia y constantes crisis de racionamiento. Lacalidad del servicio continuarA en deterioro en vista de que no habra fondos para invertir. Debido a sudificil situaci6n financiera, las empresas puiblicas de energia no estan en la posici6n de contribuir con unprograma de inversi6n. Para poder mejorar el ambiente regulador, la reciente Ley de Electricidad requiere:
* normas reguladoras complementarias para apoyar la nueva Ley y promover la competencia en lageneraci6n, permitiendo el desarrollo de un mercado mayorista.
* poner atenci6n a la desesperada situaci6n financiera de la EEGSA y el INDE para lo cual seranecesario que la cuasi-aut6noma Conmisi6n de la Electricidad-parte del Ministerio de Energia-proceda a fijar y sostener las nuevas tarifas (incluyendo aquellas que aplican a EEGSA) y prepare unmecanismo transparente de actualizaci6n de tarifas, como estA provisto en la Ley, el que deberia sercapaz de afrontar retos legales futuros. Adicionalmente, ambas empresas deberian de: (i) reducir suscostos de personal; (ii) promover la participaci6n privada en la distribuci6n, ademas de la generacion;(iii) concluir con las negociaciones de deuda cruzada entre las empresas estatales y el Gobiemo; (iv)desincorporar sus activos; y (v) introducir terminos comerciales en la relaci6n con las municipalidadesque compran al por mayor, solicitandoles que le compren a empresas de distribuci6n privadas en vez deal INDE.
xxi. GUATEL no tiene proyectos de inversi6n previstos para 1997, ya que se asume que habrA unanueva administracion representando los intereses de los nuevos accionistas. Apoyado por un nuevo marcolegal, el sector de telecomunicaciones se prepara para una mayor competencia, lo que resultara en unamejor cobertura y calidad de servicio. El futuro precio de GUATEL sera determinado en parte por losrecientes ajustes tarifarios, los costos de reducci6n de personal y la cantidad que se pague enindenunizaciones.
xxii. Desde una perspectiva estrategica o de politica, s6lo recientemente se han iniciado esfiuerzos pordefinir un sector de agua y saneamiento de por si. Como resultado no existe aun un PIP efectivo y bienarticulado para dicho "sector". El Programa de Gobiemo contempla un incremento en la cobertura deservicios de agua en comunidades rurales con una inversi6n anual promedio de $300 millones. Sinembargo, esto seria 25 veces los niveles de inversi6n actual. En mayo de 1997, como un primer paso paraenfrentar este reto, el Gobiemno aprobo el documento "Politicas y Estrategias del Sector Agua Potable ySaneamiento" y decidi6 delegar a INFOM la gesti6n de su implementaci6n, incluyendo la ejecuci6n de losprogramas y proyectos de agua potable y saneamiento, y la coordinaci6n de la asistencia t6cnica yfinanciera con los ministerios, fondos sociales, entidades descentralizadas e intemacionales. Las medidasadicionales a considerarse incluyen:
viii Resunen Ejecutivo
* Como primer paso, completar la elaboraci6n de la estrategia de agua y saneamiento, cuyaadministraci6n estaria bajo la responsabilidad de una sola agencia (el nuevo Ministerio de RecursosNaturales o el INFOM). Tal estrategia deberia incluir: (i) una nuova ley de agua, cuyo anteproyectoesta bajo preparaci6n; (ii) la definici6n de una politica de tarifas nacionales, quizas basada en un"reglamento municipal" consensuado con las autoridades locales que INFOM propone como pre-requisito; (iii) una adecuada supervisi6n de su implementaci6n; (iv) el establecimiento de criterios deinversi6n y en la supervisi6n de la calidad de servicios de agua y de saneamiento a nivel nacional; y (v)en el seno del SNIP, y bajo coordinaci6n del INFOM, la formulaci6n de un programa de inversi6n delsector que asigne claras responsabilidades a cada entidad participante.
* El INFOM deberia ser reacondicionado para convertirse en el principal ente regulador, proveedor deasistencia tecnica y financiera del sector, a fin de apoyar a las municipalidades en la administraci6n yoperaci6n exitosa de los sistemas rurales de suministro de agua. El modelo Agua, fuente de paz, unasoluci6n de provisi6n de agua rural participativa y a bajo costo, con auditoria social compartida conlos fondos sociales y las comunidades locales podria ser el enfoque apropiado y iunico adoptado por elGobiemo. El INFOM y las municipalidades deberian solucionar la mayoria de los cuellos de botellaasociados a su implementaci6n (preinversi6n, el disen'o de acueductos y la ejecuci6n de proyectos) atraves de la subcontrataci6n al sector privado y el monitoreo descentralizado.
Medidas adicionales para desarrollar un PIP sostenible
xxiii. El Gobiemo ha tomado decisiones s6lidas para desarrollar un PIP sostenible, pero retosimportantes persisten. La mayoria de esos esfuerzos es descrita previamente, pero es valiosos anladiralgunos comentarios sobre iniciativas mas recientes: (i) una coordinaci6n muy estrecha se requiere entrevarios esfuerzos interinstitucionales dirigidos a elaborar un PIP Global en consistencia con el PIP del GC,un eventual PIP para Desarrollo Rural y los trabajos de la Comisi6n Interinstitucional de ProyeccionesMacroecon6micas, o severas inconsistencias inter e intra-sectoriales podrian surgir; (ii) la revisi6n porparte del SIAF del ciclo del proyecto por donante (identificaci6n-preparaci6n-negociaci6n-implementaci6n-evaluaci6n), no detallada aqui, debiese conducir hacia un mayor enfoque de demanda de proyectospreparados; (iii) una vez aprobada la nueva Ley del Ejecutivo, la creaci6n del SNIP requerira del apoyo deun entorno legal y reglamentario que establezca sus principios, objetivos, estructura, instrumentos,metodologias y normas; tal entorno, sin embargo, tambien deberia estar estrechamente vinculado a una(aum faltante) estrategia de descentralizaci6n del Estado; y (iv) el estado precario de los indicadoresecon6micos y sociales no permite un efectivo monitoreo del desarrollo de los proyectos y la evaluaci6n desu impacto, requiriendo la formulaci6n (en gestaci6n con el Instituto Nacional de Estadisticas) del"Programa de Indicadores Econ6micos y Sociales".
0

EXECUTIVE SUMMARY
The signing ofpeace provides a unique opportunity to accelerate growth and reduce poverty
i. The Government's Economic and Social Program 1996-2000 articulates a strategy to accelerategrowth and reduce poverty. Achieving peace was a key milestone for such a strategy, but sustaining itrequires more than the cessation of violence. Lasting peace will require a sound macroeconomicframework, ensuring appropriate financing of peace-related needs, and redefining the relationship betweenthe private and public sectors, to allow the private sector to lead economic growth and to strengthen thepublic sector's regulatory and subsidiary functions, while moving away from directly productive activities.This report identifies priority areas of public spending to support peace. It focuses on the on-going reformsaimed to modernize the public sector and, in particular, the Peace Investment Program (PIP) submitted bythe Government to the Consultative Group (CG) meeting in January 1997 and other investment sectorpriority needs. The report addresses the need to shift resources in line with sectoral priorities, whileensuring appropriate absorption of external resources, and an effective and efficient execution of publicinvestment.
Ensuring macroeconomic stability is a pre-condition for lasting peace
ii. inadequate and irregular tax revenues has meant that stabilization goals have been met largelythrough tight expenditure controls. Although this has ensured relatively adequate fiscal policies, social andbasic infrastructure coverage remains the lowest in the region. In addition, service quality is extremely lowand there is only limited scope for further reduction of public outlays.
iii. The public sector's weak revenue base has placed an undue burden on monetary policy to meet theGovernment's stabilization objectives. However, tight monetary policy to offset fiscal imbalances and theissuance of short-term government bonds to meet the financing needs of the Central Government, havepushed up domestic interest rates and increased the burden of servicing domestic debt. As a result, morethan one of every four dollars collected in tax revenues-and more than one fifth of total CentalGovernment spending-goes to service interest payments on domestic debt. As peace implementationprogresses, reducing and restructuring domestic debt is essential to create additional fiscal space to financepeace-related expenditures. This will require: (i) approving reformns to the Bank of Guatemala (BOG)Organic Law, which are necessary to reduce reserve requirements and, hence, domestic interest rates; (ii)improving financial management by the Ministry of Finance, supported by the Integrated FinancialManagement System (SIAF) to prevent issuing short-term bonds to cover temporary cash flow difficulties;(iii) continuing to lengthen the maturity of Treasury Bonds; and (iv) maintain a cautious approachregarding the further issuance of dollar bonds.
iv. The Government is aware that to maintain macroeconomic stability throughout peaceimplementation, a considerably greater domestic revenue effort is required. This is essential not only tofinance higher spending, but also to build a sufficient fiscal cushion in the event that external supportmaterializes more slowly than expected. Moreover, tax revenues could decrease under a passive scenarioin 1997. To raise the tax ratio from 7.9 percent of GDP (8.5 percent of GDP with the temporary tax) in1996 to tax targets set in the Peace Accords for 1997-99, required measures would include: (i) reforrns intax policy (including raising rates and eliminating exemptions) and tax administration (creation of theSuperintendency of Tax Administration-SAT); (ii) additional modifications to the tax code to strengthen theSAT; and (iii) issuance of new judicial norns to support tax enforcement and effective penalties for tax

ii Executive Summory
evasion. Fiscal discipline also requires: (i) keeping expenditure policy under control, while assigningpriority to social and peace expenditure targets set in the peace accords; (ii) adjusting tariffs of publicservices to raise public savings; (iii) disincorporating public enterprises and using the proceeds mainly toreduce domestic debt; and (iv) once domestic debt (including BOG losses) is reduced significantly,considering legislation to limit the size of the combined public sector deficit permanently.
v. Guatemala has a low external debt burden which it should manage carefully. After the previousGovernment concluded bilateral agreements with five of six participants in the 1994 Paris Clubrescheduling, Guatemala enjoys a sound external debt position. Debt indicators have improved in the lastfew years as a result not only of debt rescheduling, but of traditionally conservative indebtedness policiesand decreasing international interest rates. Donors pledged about $1.9 billion at the CG meeting to financethe PIP and other public investments. Absorbing such funds should be accompanied by a prudent extemalborrowing strategy.
Increasing the level and improving the targeting of peace-related investment is essential
vi. Ensuring an efficient use of increased resources is as essental as raising tax revenues in order tofulfill peace commitments. Peace will require addressing Guatemala's poverty and social inequality,especially prevalent in rural areas and strongly associated with ethnicity and gender. This will require morethan just increased resources. Even with a stronger domestic revenue base and significant donor support, itwill be necessary for the Government to match the priorities of the peace agenda with available resources.A careftl balancing of priorities is a first challenge for the Government; but funding may not flow evenlyand trade-offs will have to be made over time.
vii. An increased level of investment requires: (i) reducing recurrent costs from their current high shareof 79 percent of total spending; (ii) keeping the effective allocation of funds consistent with the originalbudget amount; (iii) increasing the public sector's limited absorptive capacity to disburse foreign financing;(iv) ensuring full execution of budgeted investments, mainly at the Ministries of Health and Education; and(v) effective decentralization of execution capacity toward the social funds and the municipalities.Additional short-term demands of urgent peace needs should not generally be met at the expense of longer-term priority social and basic infrastructure needs-the latter will be essential for sustained growth andpoverty reduction.
viii. Although expenditure allocations across sectors have been in line with the objectives spelled out inthe strategy set by the Government's Program-with communications (roads), municipal works (water),health and education receiving the largest shares-allocations within sectors are not always consistent withthe Government's stated social and economic priorities. Spending on pre-primary and primary education isbiased in favor of the metropolitan region relative to poorer rural areas. A similar situation occurs inhealth, with hospitals continuing to receive more than half of the health budget to the detriment ofpreventive and primary care which tends to benefit the rural poor. The rehabilitation backlog in primaryand secondary roads justifies the efforts currently being made by the Ministry of Communications,Transport and Public Works (MCTOP) to improve (rehabilitate) this network.
Implementing the PIP requires an improved institutional setting and new management tools
ix. From an institutional perspective, the public sector is small but it is exceptionally inefficient in its servicedelivery, management and regulatory functions. Public investment takes place witin four major blocks, withconsiderable autonomy and litde coordination among all stages of the investment cycle: infiastructure and socialinvestment by sector ministries, infiastructure investment by public enterprises, and investment by social funds

Executive Summary iii
and by the municipalities. Large budget underexecution of public investment and low capacity to disburseexternal funds reflect long-standing institutional problems, including: (i) absence of institutional mechanisms(except for MCTOP and the Ministry of Education) to link project design to sectoral priorities, whichmakes investment decisions frequently tied to the availability of external financing rather than sectoralpriorities; (ii) weak capacity by line ministries (except for MCTOP and the MOE) and SEGEPLAN to evaluateproposed investnents; (iii) absence of an effective regulatory body for investment planning, partly due toSEGEPLAN's dispersion over too many functions; (iv) lack of adequate technical and financial resources atSEGEPLAN and the Ministry of Finance (MOF) to devote to investment planning, monitoring and evaluation, aswell as to negotiate and disburse external funds effectively; (v) cenralization of budget execution at the MOF,leading to the inability of line ministries to operationalize their sector strategies; (vi) unreliable counterpartfunds to support implementation of externally-financed projects, which makes spending priorities effectivelydetermined by MOF cash availability; (vii) organizational and managerial deficiencies within line ministries;(viii) little control of investment by social funds and state enterprises, which leads to effective overlaps,inefficiencies of scale and uncoordinated investment allocations among sectors; and (ix) little or no participationof the private sector in project execution, except for road maintenance.
x. The on-going Integrated Financial Management System (SIAF) being implemented by MOF and otherline ministries (MCTOP, Education and Health) is addressing some of these problems by: (i) cetalzgpurchase orders in a single unit (UDAF), thus reducing the number of processing steps from 130 to 19 andeliminting the need for an average of 600 daily checks previously issued by the Treasury; (ii) UDAF and thebiternal Management Units (UDAI) in line ministries are taking control of the preparation, monitoring andexecution of their budgets, agreed with MOF; and (iii) preparing the 1998 budget with a new methodology thatreclassified 1,007 activities into 50 program units. SIAF is an important component of the state modernizationprogram that also includes: civil service and tax administration reforms, disincorporation of state enterprises andthe reform of the structure and functioning of the Central Government based on a new Law of the Executive; thelatter includes grouping MOF and SEGEPLAN in a single ministry.
xi. The principle of normative centralization with operative decentalization requires a new market approachto public investment based not only on new institutional arrangements, but also on new management tools, aimingtoward a more efficient allocation of public investment. Such approach should improve the quality of projects,while unifying and steghemng recently created ad hoc coordmation mechanisms-the Social Cabinet, socialfunds-agreed between line ministries, public enterprises, social funds and municipalities. The new approachwould include: (i) creation of a National System of Public Investment (NSPI) headed by a council of ministries;(ii) simplification of SEGEPLAN's normative functions under the NSPI to a minimum, focusing on coordinationof investment planning and policy, and project evaluation; (iii) technical strengthening of SEGEPLAN to preparePIPs-annual and multiannual-consistent with macroeconomic projections, the bank of projects, thepreinvestment system, the project evaluation system and the geographic information system; (iv) effectivedecentralization of investment design, budget execution and monitoring to the sector ministries, the social funds,NGOs and local organizations; (v) increased competition of the private sector for project pre-investment,execution and evaluation conracted-out by the Government; (vi) creation of a new subsystem of public-extenaland internal-credit at MOF to improve the institutional framework for the contracting of borrowed resources,including support for the "single window" recently created through the Comisi6n Interinstitucional para laAgilizacion de la Cooperaci6n Internacional (CIACI) and the "fust track" treatment recendy approved byCongress for the processing of grants; and (vii) creation of a public investment information subsystem to monitorthe financial and physical execution of projects by the future Secretariat of Finance, SEGEPLAN and NSPI. Thelatter two subsystems should be part of the on-going expansion of the SIAF.

iv Executive Summary
Peace accords aim to increase the efficiency of social spending significantly
xii. The challenge of improving social conditions requires addressing key shortcomings, such as:improving the allocation of funds in line with stated priorities, maintaining consistency of the PIP submittedto the CG meeting with macroeconomic balances and peace priorities, and ensuring that institutionalreforms (and their pace) required to meet social investment targets are well-focused, encourage increasedcommunity participation and are sustainable. Focusing on what criteria should be used to make investmentconsistent with sector priority needs, then becomes more important than just assessing how muchinvestment should be done in the short- and medium-tenn.
xiii. The proposed PIP for education is feasible and consistent with sectoral priorities, but the healthPIP is exceedingly high relative to the Ministry's absorptive capacity. In both cases, doubhng the socialfunds' absorptive capacity will be essential to fulfill peace commitments.
xiv. The education PIP aims to: (i) expand education coverage in rural areas through PRONADE(community-managed primary schools), accelerated pre-primary education programs, alternative modelsfor modular provision of primary education, targeted scholarships, CONALFA's literacy and post-literacyprograms in Spanish and indigenous languages, and special programs for groups directly affected by thearmed conflict; (ii) strengthen and expand bilingual education, teacher training, school administrationtraining for school boards (juntas escolares), and civil education initiatives; and (iii) increase publicinvestment in school construction and equipment, but executed by the social funds. This portfolio isfeasible, but several actions should be taken:
* ensure timely counterpart financing from MOF in line with availability of external funds;* comprehensive internal restructuring effort to define the functions and new responsibilities of the
various sector levels, concentrating initially on priority programs to improve key services;* effective decentralization of budget execution with the creation of the financial management unit
(UDAF) at MOE to start implementing the SIAF;* contracting-out consulting services for project execution, until a new civil service legislation is
approved and operational;* effective strengthening of PRONADE's management structure and execution; and* contracting-out investment in school infrastructure to the social funds and the private sector.
xv. The proposed PIP for health has five key objectives, which are consistent with the preventive andprimary health care priority of the sector strategy and the Peace Agreements: (i) expand coverage throughdelivery of a basic package of services; (ii) construction, rehabilitation and expansion of health posts andhealth centers; (iii) water and sanitation projects; (iv) rehabilitation of infrastructure and equipment andinstitutional development for regional hospitals; and (v) support to Mayan medicine. Its size, however, istoo large, at over four times current execution capacity. Reducing it to a more realistic size should bedetermined by:
* the likely contribution of each project to strategic goals and sectoral priorities;* selecting those hospital projects that are essential to the achievement of the preventive and primary
health care strategy, also avoiding duplication and improving coordination between MOH and IGSS;* the incremental recurrent cost implications of each proposed project;* the likely availability of counterpart and external funds;

Executive Summary v
* progress in the recent Health Services Improvement Program, including: (i) MOH restructuring, (ii)introduction of the newly-developed service delivery model, and (iii) a new management program forpublic hospitals; and
* effective decentralization of budget execution with the creation of the financial management unit(UDAF) at MOH and the contracting out to NGOs, private sector, cooperatives, municipalities, andcommunity groups the execution of priority programs.
xvi. Social funds have the potential to double the level of their operations in the next four years, whileachieving a more efficient utilization of resources. A new institutional framework, however, shouldredefine their functions and responsibilities, eliminating duplication and fragmentation, integrating theirinvestment information systems to the SIAF and considering the convenience of transferring theirinvestment portfolio to line ministries. This requires steps to:
* prevent further dispersion and institutional fragmentation by creating more funds;* develop a model of local service delivery that involves directly not only municipalities and NGOs, but
also indigenous populations who will be the main beneficiaries of rural programs;* re-engineer their internal procedures and processes to standardize technical standards with line
ministries and simplify their procedures;* strengthen and facilitate private sector participation in project preparation both at the local level
(community, municipality) and the line ministry;* strengthen coordination mechanisms through increased specialization of each fund, a geographic
information system (GIS), unification of basic demand information and establishment of a system ofperiodic national household surveys to monitor and evaluate community needs and project impacts.
T7he current provision of basic infrastructure is detrimentalfor peace consolidation
xvii. The provision of basic infrastructure in Guatemala is weak and clearly detrimental to flister growth,reduction of widespread poverty and, hence, peace consolidation. Much of this poor performance can beattributed to the dominant role of the state in the provision of infstructure services, the absence of marketmechanisms, and an inadequate institutional framework. As a result, underexecution, poor design, weakmonitoring and evaluation of investment projects are common deficiencies shared with the rest of publicinvestment.
xviii. Because of its critical role in facilitating access to services and markets, roads is the main infastructureneed of the country, followed by water (due to its impact on health), energy and telecommunications (due to theirimpact on growth). The investment program for roads is well focused and realistic, given the Ministry'scurrent execution capacity and likely financing availability; the program for energy will remain unrealistic,unless a solution can be found to the legal constraints on adjusting tariffs; the telecommunication programis limited to investment up to 1997, due to the expected disincorporation of GUATEL in 1997; and there isno PIP for water, due to the lack of an appropriate institutional framework and the absence of acomprehensive sector strategy.
xix. The 1997-00 investment program for roads, including the PIP, appropriately emphasizes rehabilitation.Overcoming the rehabilitation backlog in five years would represent a program of $864 million, of which aboutone fiffh ($170 million) would be in ZONAPAZ roads. Despite the significant improvetnent in the MCTOP'sexecution capacity in 1996 (above 90 percent), the present annual investnent in roads still is two-third of whatwould be required under the proposed program, Government agencies and the domestic construction sector do nothave the financial and institutional capacity to execute such an ambitious program, external funds are limited and
vi Executive Summary
private participation still is low. Investing in roads requires not just financing, but the following actions (some oftheim already under imnplmentation):
* DGC should stengthen its institutional capacity in preparing sector investnent planning and in expanding itsinnovative scheme of contracting-out private sector participation in the maitenance of the main highways(primary) and secondary roads. Investment in key tertary and rural roads could be undertaken by DGC, butallowing subcontracts to social funds and local governments to carry out their execution.
* improved coordination under the NSPI, between MCTOP and the future Ministry of Economy, and betweenMCTOP and the social funds is required, maily for tertary roads (construction, rehabilitation andmaintenance);
* to support the implementation of future free trade agrements with North and Central America, continuerehabilitation of highways (primary) connecting national borders, which could include construction ofbypasses (enlarged roads) to facilitate border traffic;
* to reduce rehabilitation costs three complementary strategies are being implemented and should bestrengthened: (i) non-Guatmmlan construction firms should be allowed greater participation in biddingprocesses; (ii) increased decentzlhzaton should provide opportunities for joint-financing of projects withlocal goverunments; and (iii) selected upgrading (paving) of tertiary roads; and
* technical strengthening of the recently created road fund (COVIAL) and the possible use of tolls (e.g., Palin-Escuintla) could help to raise additional resources.
xx. Due to problems in implementing appropriate tariff adjustments, the electricity companies are headingtoward bankruptcy, struggling with their current inefficiency, insolvency and recurrent bouts of rationing.Service quality will continue to deteriorate as there will be no funds to invest. Given their difficult financialsituation, the public power companies are in no position to contribute to an investment program. To improve theregulatory environment, the recently-approved Electricity Law requires:
* complementary regulatory norns to support operation of the new Law, to promote competition in generationand allow the development of a wholesale market;
* addressing the difficult financial situation of EEGSA and INDE, which will require that the quasi-autonomous Commission of Electricity-it is part of the Ministry of Energy-set new tariffs (including thoseapplied to EEGSA) and prepare a transparent tariff setting mechanism that would be able to sustain futurelegal challenges. In addition, the two companies should: (i) reduce personnel costs; (ia) promote privateparticipation in distribution, in addition to generation; (iii) conclude cross-debt negotiations between bothstate firms and the Government; (iv) disincorporate their assets; and (v) introduce commercial terms in therelationship with municipalities that buy in bulk, requesting them to buy from private distribution companies,rather than from INDE.
xi. GUATEL has no investment projects contemplated after 1997, because it is assumed that it will beoperating under new management representing the interests of new shareholders and workig in a competitiveenvironment. Supported by a new legal franmework, GUATEL is preparing for its disincorporation and privatesector participation. The future price of GUATEL will partly be determined by recent tariff adjustments,reduction of personnel costs, and the amount of severance payments.
xxn. From a strategic or policy perspective, efforts have started only recently to define a water and sanitationsector as such. As a result, there is as yet no effective and well-articulated PIP program. The Government'sProgram aims to increase coverage of water sevices in rural communities with an estmated average annualinvestment of $300 million. However, this would be 25 times current investnent levels. As a first step, on May1997 the Government approved the document "Politicas y Estrategias del Sector Agua Potable y Saneamiento"

Executive Summary vii
and delegated to INFOM (the Municipal Body) the managemnent of its imnplementation, including the execution ofwater and sanitation programs and projects, and the coordination of fiancial and technical assistance with lineministries, social funds, decentalized institutions and international orgamzations. Additional neasures to beconsidered include:
* the first step is the conpletion of a water and sanitation strategy, whose management would be responsibiltyof just one agency (the new Ministry of Natural Resources or INFOM). Such a strategy should include: (i)passage of a new water law, whose draft is being prepared; (ii) definition of a national tariff policy, perhapsbased on a reglamento municipal (as proposed by INFOM) previously agreed in consensus with localauthorities; (iii) adequate supervision of its implementation; (iv) establishing criteria for investing in andsupervising the quality of water and sanitation services nationwide; and (v) under the NSPI, and coordinatedby INFOM, the formulation of a sector's investment program that assigns clear responsibilities to each entityinvolved; and
* INFOM should be reengineered to become the main financial and technical body to support municipalities inthe administation and operation of rural water supply systems. Agua, fuente de paz, a low-cost rural watermodel, with shared responsibility with the social funds and local communities, seems an appropriate andunique approach. INFOM should provide continuous training to the municipalities, while most of its currentbottlenecks (preinvestment, the design of aqueducts and project execution) could be solved throughsubcontratg to the private sector and decenthalized monitoring.
Further steps to inmpement a sustainable PIP
xxiii. The Govenmment has taken solid steps to develop a sustainable PIP, but important challenges remain.This report has analyzed the key ones, but some additional points on recent initiatives should be noted: (i) closecoordination is required among several interinstitutional efforts working on a Global PIP consistent with the CG-PIP, an eventual PIP for Rural Development and the Commission worldng on macroeconomic projections; (ii) adetailed review under the SIAF framework of the project cycle by donor (identification-preparation-negotiation-implementation-evaluation), which is not detailed here, should lead to a more demand-driven approach for publicinvestment; (iii) once the new Law of the Executive is approved, the creation of NSPI will require a supportinglegal and regulatory framework that sets its principles, objectives, structure, instruments, methodologies andnorms; such a framework, however, should also be closely related to a much-needed decentralization strategy;and (iv) the lack of a good economic and social data base prevents any effective monitoring of projectimplementation or evaluation of and requires the formulation (under preparation by the National Data Istitute)of the Programa de Indicadores Econ6micos y Sociales.

m

INTRODUCTION
1.1 The signing of a Peace Agreement presents Guatemala with a unique opportunity toachieve rapid and equitable growth, while pursuing an ambitious agenda of structural reforms-focused on the modernization of the state, fulfilling its commitments to the peace process andsolving long-standing macroeconomic and social imbalances. Having the largest economy ofCentral America and abundant natural resources, the lack of a stable political, social and economicenvironment had prevented Guatemala from reaching the necessary pre-conditions for sustaineddevelopment. An almost uninterrupted military rule until the nid-eighties, three decades of warfarebetween successive Governments and the guerrilla, and a sharply segmented society were majorobstacles to faster growth and sustained development. Peace should help not only to strengthendemocracy and consolidate economnic reform, but to address long-standing challenges, such as lowhuman capital accumulation, poor social indicators, a highly skewed income distribution, a weakand inefficient state and an outdated economic infrastructure.
1.2 Takig advantage of such a XA 1vhistorical opportunity needs more thanthe cessation of violence. The athcomprehensive set of peace accords - w 9 au 1:99.signed is only a first step in addressing Pb - d ( prGuatemala's development needs, but its bM tie anf i a n 20 wiimplementation is another story. This - 9 _ s 0 e xe* ited.lX _ threport addresses public sector issues ..> ... i.. rthat are critical to its success, such as: e t o flow domestic savings-partly due to - bi .netmet... p 2
poor tax collection-insufficient and - .974 99.misallocated spending, slow absorption Corg.Edcin:i)aclteteacssotheof external fnds and weak project - teexecution capacity. Solving these - Xo r in 2000.problems is urgent, since the number of X (i 199 i commitments made in the peace accords - b - t ber t y 2 ais impressive (more than 600), includinga series of key quantitative targets (Box - l -uli0. 1). ~fddLeoa i 0pretices nteeeuo
1.3 Peace consolidation also . 00.i..t..requires social and basic nfrastructureinvestment. A fundamnental tool that the i ots.(i) raete l Government has designed to support d9peace accord commitments is an . - (j) t aambitious Peace Investment Program -- i xeud y(PIP).' The PIP was submitted to the b : iidonor community in the Consultative A ( e mbpGroup meeting held in Brussels inmP 5sgt i)rdueam nnbr y3January, 1997. Most PIP investments pare located in ZONAPAZ, the regioncontaining the nine departments mainly affected by the conflict and where 57 percent of the
1 Since early-1997, the Govemrnment has also been prepaing a Global-PIP and a PIP for Rural Development in agreementwith the CG-PIP.

2 Introducion
population-overwhelmingly rural, poor and indigenous-lives. The PIP comprises a set ofprojects under preparation, negotiation or execution and is organized in four areas:* Reinserfion and Demobilization, which includes three sub-programs: (i) displaced
populations, (ii) demobilization of ex-combatants, and (iii) community development.* Integral Human Development, which includes eight sub-programs: (i) emergency needs for the
poor, (ii) indigenous people, (iii) education, (iv) health, (v) social security, (vi) housing, (vii)basic inrastructure, and (viii) women participation.
* Sustained Productive Development, which includes four programs: (i) labor reform andtraining, (ii) rural development, (iii) a Land Fund, and (iv) support for investment, employmentand exports.
* Modernization of the State, which includes eleven programs: (i) legal and constitutionalreforms, (ii) human rights, (iii) modernization of the executive, (iv) modernization of theLegislative, (v) modernization of the Judiciary, (vi) civil security, (vii) tax administration, (viii)development councils, (ix) municipal strengthening, (x) property registry and cadaster, and (xi)support to the Secretariat of Peace.
1.4 Comparing projections of two alternative PIP scenarios for 1997-2000 (Box 0.1 andAnnex 1) leads to the following conclusions:* Moving from a low case to a high case scenario will critically depend on the Government's
ability to improve its savings performance-mainly through raising tax revenues and publicutility rates-and to disincorporate public enterprises (while paying-off domestic debt).
* Rapid growth with stability is achievable under a high case scenario only. In case domesticsavings remain low and minimum compulsory peace outlays have to be financed, peacecommiitments would not be fully met, and the economy would continue to face a weak fiscalbase and external position, somewhat vulnerable to adverse external developments.
* Progress on structural reforms-especially to modermize the institutional and legalframework and improve the delivery of public services-will be critical to consolidate peaceand effectively use the increasing volume of external support promised to assist theGovernment meet its peace comnitments. In the short-term, however, quick-disbursingexternal financing would support Government efforts while longer-term structural andinstitutional reforms take hold.
1.5 The donor community pledged a significant amount (about $1.9 billion for 1997-2000) ofexternal aid to finance the PIP, but also expressed several concerns. This report addresses some ofthem, mainly the importance of: (i) a sound macroeconomic framework for a sustainable PIP(Chapter I); (ii) an adequate institutional framework to ensure an efficient absorption ofinternational cooperation and an efficient and effective execution of public investment (Chapter II);and (iii) ensuring that social (Chapter III) and basic infrastructure (Chapter IV) investment areincreased and more efficiently allocated to key inter-and intra-sectoral priorities, in such a way thatthe peace dividend is widely shared within Guatemalan society. The donor community alsoemphasized the need to enhance donor coordination and develop appropriate mechanisms to ensurea regular monitoring and verification of peace accords implementation.

CIAPTER I
AN OVERVIEW OF PUBLIC SPENDING ALLOCATION
1.1 Macroeconomic stability is a precondition for sustained peace and faster growth. Themacroeconomic environment needs to be strengthened in three key areas: enhanced public revenuemobilization to finance peace commitments, better control over domestic liquidity, and a sounderexternal position to reduce dependence on volatile capital flows (World Bank 1996). Meetingpeace commitments and implementation of the PIP will exert considerable macroeconomicpressures, especially if domestic financing Seia .is =iadequate, expectations on the peacedividend arising from a reduction of ..:..T o m 'ed .e s s aedmilitary expenditures prove to be .. :leffert e : tof .eoptimistic, and exteral support prse a soum1. a. Iroe.nomic .......framew.rk.(A"'ex">.materializes more slowly than expected. .OhighIIase e threiemnt necess.y.t..meet mos.Under these conditions, it will be important i tlaepeace accords under'aveiy active stance. Then.. .to ensure strict control of public spending -ethe i,'p'.,atio's',f p.r,.,,t,s i,o.e,.,'s,ii
while continuing efforts to improve the poicy sn where y
public sector's capacity to efficiently .........e-.s pa rt... -allocate and execute the public investment tA ih .. rd.. c'oec o X s-whie IW1y iipeHntn h I n ec omtetprogram. id :
1.2 This chapter depicts overall blic developments in public finance, with a R ofover $ mi perfocus on public expenditure issues that will * :-eedn th. isin 'i j-son p - - - ises............. t......be critical for consohdating peace. It : . eti.det, asw as aoassesses public expenditure patterns- q...tyofsproisio;mainly in the social and basic * givng. pj'" '' ''' n ' ., ':. winfrastructure sectors-stressing the need n: vesimei o.er es, ni e jhe. i wto: (i) ensure a prudent overall fiscal liS0, Wp n .r-wth..
* epnigad tngmr deiairno envelope for imnplementation of the peace at'epcayovrulgteistutnlfamwkaccords, so as to prevent the emergence of rt to the pblemacro imbalances; (ii) reduce andrestructure domestic debt; (iii) shift outlays toward social and basic infrastructure investment, (iv)increase the level of public investment execution; and (v) improve capacity to absorb externalfinancing, while maintaining a prudent external debt management strategy.
A. Trends in Public Finance
1.3 Guatemala underwent a severe balance of payments crisis in the late 1980s, causedprincipally by the deterioration of public finances. By 1990, the tax ratio fell to a low 6.9 percentof GDP and the combined public sector deficit (including Bank of Guatemala-BOG-losses) rose to4.2 percent of GDP. As a result, inflation reached 60 percent, gross international reserves droppedto 1.8 months of imports and the country accumulated significant external arrears.
1.4 Since the 1991 crisis, Governments have adopted stabilization programs with moderatesuccess (World Bank, 1996). Despite a weak tax mobilization effort-the tax ratio oscillatedbetween 7 and 8.5 percent of GDP and public sector revenues stagnated at around 11 percent ofGDP over the period-fiscal policies succeeded in reducing the combined public sector deficit from4.2 percent of GDP in 1990 to an estimated 0.9 percent in 1996 (Stat. Appendix, Table 3).
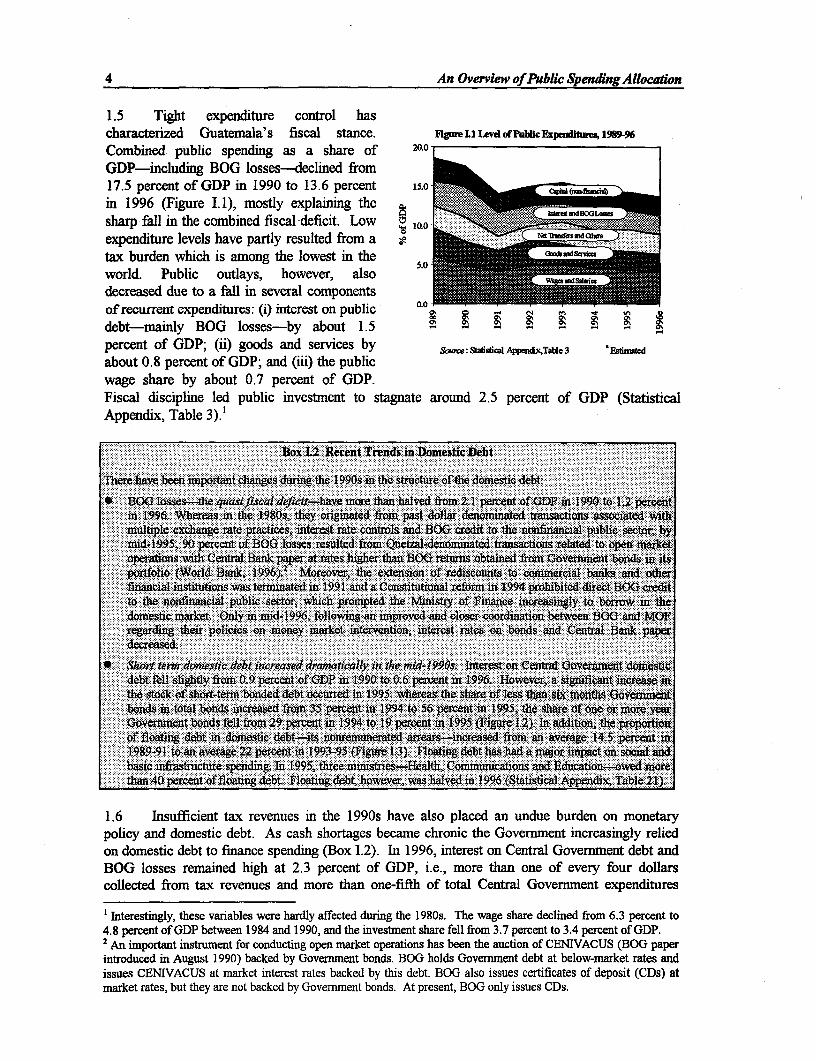
4 An Overview of Public Spending AUocation
1.5 Tight expenditure control hascharacterized Guatemala's fiscal stance. Figue LI Levd ef PublicExpwuMim 1X9896
Combined public spending as a share of 20.0
GDP-including BOG losses-declined from17.5 percent of GDP in 1990 to 13.6 percent 15.0
in 1996 (Figure 1.1), mostly explafining the 0sharp fall in the combined fiscal-deficit. Low 0expenditure levels have partly resulted from a Ar llii--tax burden which is among the lowest in theworld. Public outlays, however, also 5l0
decreased due to a fall in several componentsof recurrent expenditures: (i) interest on public 0r0debt-mainly BOG losses-by about 1.5percent of GDP; (ii) goods and services by Saare: Stasfica Appemx,TaUe 3 'Esfiad
about 0.8 percent of GDP; and (iii) the publicwage share by about 0.7 percent of GDP.Fiscal discipline led public investment to stagnate around 2.5 percent of GDP (StatisticalAppendix, Table 3).'
l ,,,, , ,X$_. :;~~........ .........re hae eifane during the 19si h tutr tedmsi et
in .'".. Wheeasn th S."'"'"--, th-y o'gintd from p '- denom'ted tR'.s acti.S. ... ..
,.R.'.,R . b...: .'5 n.......... ' '' ... .......* portfolio~~~- (Wrl Bak`99) Mrevr te xenin redscon_ to ommrcilbnaadoh
erase.. 9 te .k
['' ~~~~~~~~~.,'.. ....'-if... ....... I-'.......... ... ....,- R
| ' i -n R' :-:- :::. :''':i':':'i: .t d R.....r.....r....e Won Ceutt...... .t wti.........S
the istoc of sh:-ter bon.dedaXc .debt cc.rred .1995 whereas the sha-e of less than Six 'ohaovert.
[ , Rl , S , S R ' S --- ~~~~~~~~....S.R.-..-..... S .S....R-....tS S1995.,t~~~~~~r NE ........
- is Q~~~~~.t sa.. ;.... ...... ........... ...... .... -.....
bo6ndsufinitota bond inreasedue inr3 phern a1990s tav al6 percent an 19 ndute sbarde ne or mon etarypoliyanvomesti bodsellt.o As~ pcent shor94taels percam hoi h oenent inc19rFgr .).I diin.teasnl prtiedof floaetinc debt tfinadnetc dpebt-itg(Boxr.2).unead 1996a,intereast rom aentralGverngen1t. perbt ind
1BOG 9 tose reainaera hge a2ert in.193-9 (ecnfiGu P, i.e., mortngebthasna oneor iepact fonr soillandbolsect iframstaxctrevsending and m9otre thnionires-fifth,o CotamuCnctiorand G dvernmentoexpenditres
tha 40nercntreslotingly dhs aibebt Feehrloafeting debt, howev, wa8s. Thal aevhrdied fnrom(taitia 6pex.3apercn 21)
1.6 Insufient taxGD ret even18anue i90nd the investmn h hav e a elsplacedm an7 unduen bu3.prdent on montarpoic Aniprand domsticudebt. Asr c ashcin sortnagkes bpecameon chrobeni the Gutovenmn ifCNcreACSinBGl raelieontdomuestic debut to90 fianceksending (Boxenmn 1on2). InO996 interstoCera Government debtatblwmrerts and
importan iENstrCUment forkcodutingees opten market operthios hasbeen the alssuscetioofCEicaCesoeoi (BOG) pape
market rates, but they are not backed by Governrnent bonds. At present, BOG only issues CDs.

An Overview of Public Spending Allocation 5
(Statistical Appendix, Tables 6 and 8). Increasing recourse to domestic borrowing by theGovernmuent and tight monetary policy-through increased reliance on reserve requirements-haveraised real interest rates (over 20 percent), well above the average of those reported for CentralAmerica (Rodriguez, 1994). In a liberalized financial environment, high interest rates haveboosted private capital inflows and helped to rebuild reserves, mainly in 1996. In order to keepinflation under control and on the target agreed by the monetary authorities, dollar inflows had tobe sterilized-mainly through open market operations-but this has kept interest rates high,placing a heavy burden on domestic debt servicing.
Figure L2 Change in the Use of treasury Bonds1.7 Guatemala has a low
1-5 external debt. External debtor lm indicators have significantly
2W. ~~~~~~~~~~~improved in the last fewyears as a result of debtrescheduling, traditionallyconservative indebtednesspolicies and decreasing
___- linternational interests rates._l Interest paid on public
1994 6-1 1995 external debt remained at a368/. low 0.7 percent of GDP over
Souw: Sta Appendix, Table 23. the 1990s. Debt service (asa share of exports of goods
and nonfactor services) decreased from 19 percent in 1990 to 9.2 percent in 1995. Public externaldebt presently totals about $2.4 billion (15.9 percent of GDP). After the previous Governmentconcluded bilateral agreements with five of six participants in the 1994 Paris Club rescheduling,small pending arrears to Spain are expected to be cleared in 1997. Bonds placed in foreignmarkets (indexed to the U.S. dollar) amounting to about $40 million in 1995-3 percent of publicexternal debt-are projected to increase significantly to $195 in 1997, as the Government isreplacing domestic with external debt.
1.8 Recommendations. TaxFigure 13 Trend of Public Floating Debt revenues are insufficient and peace will
25.0 increase pressures to finance anminimum of priority emergency and
X 20-0 t / \ / \ I social expenditures. After several20.0 | / \ years of expenditure restraint, there is15.0 only limited scope for further cuts and
expenditure reallocations. Peace10.0 targets are attainable, provided fiscal
4- policy can be considerably improved.. 5.0 Required measures could include:
0.0 6 i l l l l | 4 * Increasing tax revenues. In the1989 1990 1991 1992 1993 1994 1995 1996 absence of any tax changes, the
Source: Statisfical Appendix, Table 22. 1996 tax ratio of 8.5 percent ofGDP would fall in 1997. This is
due to a combination of measures with negative fiscal impact-external tariff reductions (0.3percent of GDP) and the allowed credit on the special temporary tax (ISET) from the incometax (ISR) (0.2 percent of GDP)-only partly compensated by tax hikes (such as the gasoline

6 An Overview of Public Spending Allocation
tax (0.2 percent of GDP) or the small extra-VAT receipts arising from service expansionassociated to GUATEL's disincorporation (Box IV.2). The Government should consideroffsetting such losses through a combination of tax policy and tax administration reforms,including: raising tax rates (VAT, excises); elimination of most VAT and ISR exemptions;rapid installation of the autonomous Tax Administration Superintendency (SAT) to increasecollection and simplify tax payment procedures; additional modifications to the tax code tostrengthen SAT powers; and new judicial norms to support tax enforcement and effectivepenalties for tax evasion, recently defined as a criminal offense (delito penal).
* Maintaining control on public spending, i.e., strictly in line with effective increases in the taxratio and disbursements of external grants and loans.
* Reducing military spending and shifting it to social expenditure. Military expenditure wasreduced from 1.2 percent of GDP in 1992 to 0.8 percent in 1996. The Accord on the Role ofthe Army targets a 33 percent budget reduction in 1999 with respect to 1995.
* Reducing domestic debt through: (i) approval of the reforms to the Organic Law of the BOGwhich, with the support of half of the disincorporation revenues that will be allocated to reduceBOG domestic debt, would enable monetary authorities to lower reserve requirements, andthus decrease domestic interest rates and their spread; (ii) sound cash flow and public creditmanagement by the Ministry of Finance (MOF)-supported by an integrated financialmanagement system (Chapter II)-rather than ad hoc issuing of short-term bonds to covertemporary financing shortfalls; (iii) enhanced coordination of open market operations betweenthe Govermment and the BOG, by making a clear distinction between short-term securitiesauctioned for the purpose of liquidity management by the BOG and medium-term Governmentbonds to finance the public sector deficit; (iv) lengthening the maturity of new placements ofGovernment bonds to three-to-five years (last July, the Government increased them from 6months to 2 years in the domestic market, and from 1-3 months to 3-6 months in foreignmarkets); and (v) maintaining a very cautious approach to further issuance of dollar bonds, notonly because BOG sterilization of liquidity generated by their domestic monetization requirescostly open market operations (OMAs), but because they bear an exchange risk that mightbecome significant in the future, especially if markets and the public were to expect adevaluation.
* Minimizing BOG losses through: (i) keeping the level of OMAs strictly in line with what isneeded to achieve monetary policy targets (and transparency, preferably through a gradualshift from BOG paper to Government paper), which also contributes to lower domestic interestrates; (ii) preventing an inflationary impact of the monetization of peace inflows with recentlyapproved BOG certificates of deposit in dollars; and (iii) considering an increase in theproportion (currently 50 percent) of funds from disincorporation of state enterprises that areearmarked to pay-off BOG stock of Government bonds and a small amount of external BOGdebt in stabilization bonds (BESTs).
* Once domestic debt and BOG losses are significantly reduced, assess the convenience ofestablishing a rule (backed by legislation) to limit the size of the combined public sectordeficit (to, say, 1 percent of GDP).
* Keeping external debt low, by attempting to maximize the concessionality of external aid.
B. Spending Pattern
1.9 Public resources are insufficient and too irregular to finance the investment required forgrowth and poverty alleviation. Public investment is the lowest in Central America (Figure 1.4)and, as a percentage of gross domestic investment, the second lowest in Latin America and theCaribean. The high share required for recurrent costs and public debt management explain its lowlevel. In 1996, 77 percent of public sector spending was recurrent, of which 30 percent was

An Overview of Public Spending Allocation 7
devoted to wages and salaries and 18 percent to public debt servicing (Statistical Appendix, Table2). Tight control of public expenditures explains an irregular Central Government investmentpattem-fluctuatmg between 1.5 percent of GDP and 3.1 percent during 1990-96 (Table .1).
1.10 The Central Govermnent expenditure pattern shows that:
* social sectors account for the largest share (Figure 1.5)-about 36 percent of total expendituresin 1996-followed by public debt servicing (interest and BOG losses) and economicinfrastructure and services (about 22 percent);
* spending on economic infrastructure, especially energy, fell markedly during the 1990s;* other than debt service, the largest sectors of public spending are labor intensive: education,
defense, public administration, roads and transport, and health. They should increase theirparticipation as peace investment programs are implemented; and
* in contrast, the capital intensive sectors-energy and communications-had low shares.
Figure L4 Public Expenditu In Central Anwrica Figure 1.5 Albo=don of Budget Anong Major
Expenture Categries ()100
Nicaragua _10
Zosta Ria _S0o i m @
P.. 60
Hondas_ 40
El Salvader IaPubhc Irqest0- lc 1 1
Total Pubh EVmxtitm20
Cuatemala P' Debt -1 tgt lm 1
0 10 20 30 40 50 1990 1991 1992 1993 1994 1995 1996
Source: WorddBank 1997. &wew: Staistical Appendix,Table &
1.11 Budget cuts in the 1980s fell heavily on social investment. In the 1990s, however, socialand basic infrastructure investment has increased and become more decentralized through greaterreliance on social funds. The ratio of social investment expenditures to total expenditures felldramatically between 1980 and 1990-from 41 percent to 12.5 percent in health and from 16.6percent to 6.3 percent in education (Acefia, 1996 and Chinchilla, 1996). Between 1992 and 1996,however, the large drop in energy investments (1.0 percent of GDP), due to the Government'sinability to raise electricity rates, was offset by increases in economic infrastructure and socialsectors (0.8 percent of GDP). As a result, 1996 investment in two sectors-roads and transport,and housing and urban development-were the largest at 40.2 percent and 27.6 percent of totalinvestment respectively, followed by a second group of social investment-health (10 percent) andeducation (7 percent) (Table 1.1). Although the share of social funds in total social investment rosesignificantly, by more than 50 percent between 1992 and 1996,3 the ratio of investment-to-totalexpenditures remained unchanged in education (10 percent) and did not improve significantly inhealth (10 percent). This is partly explained by the misclassification, in some cases, of humancapital investments as recurrent expenditures (Annex 2).
3 hIvestment data by social funds are overestimated, smce the Government records as investment the full amount oftransfers assigned to them, with little control over its effective allocation to agreed needs or its composition betwoenrecurrent and investment outlays. Their administrative overhead is low. 7-20 percent of total costs (Z6iga, 1996).

8 An Overview of Public Spending AUlocation
1.12 Recommendations. Social Table LI TotalEpndituresofCentralGovernment(%ofGD
sectors and economic infrastructure are .=receiving the largest share of non-debt Administration and Gen. Services 1.3 0.8 1.3 1.4 1.0 1.2 10
spending, which is in line with the (0.0) (0.1) (0.) (0.3) (0.2) (0.4) (0.1), , , , Defense and Public Order 1.5 1.4 1.5 1.4 1.4 1.3 1.1
objectives for growth and accelerated (0.1) (0.2) (0.1) (0.) (0.1) (0.2) (0.1)
poverty reduction spelled out in the Economic Infrastructure & Services 2.4 1.7 2.9 2.3 1.8 1.7 2.3
Govermment's Program 1996-2000. Road and Transport 0.9 0.8 1.0 0.8 (0° (10.9 1
Such a situation, however, might be Co umcations (0.5) (0.5) (0.7) (0.6) (0.6) (a a) ob Commniatons0.1 0.1 0. 0. 0.1 0.1 0.0affected by peace requirements, and there (a0) (0o.) (a0.) (Q0) (a0) (ao) (.0)
Energy 0.1 0.1 1.1 0.6 0.1 0.1 0.1is a need to reconcile short-term n (0.1) (0.0) (1.1) (0.6) (0.1) (0.) (0.1)
emergency needs with medium-term Agriculture and Mining 0.9 0.3 0.3 0.4 0.4 03 0.3(0.2) (0. 1) (0. 1) (0. 1) (0.2) (0.2) (0.2)
social investment. Although chapters III- Finance. industry and Others 0.4 0.3 0.3 0.4 0.3 0.3 0.8(0.1i) (a.0) (0.0) (0.) (0.0o) (0.0) (0.0o)IV look at social investment and basic Social Sectors 3.9 3.6 4.1 4.5 4.2 3.9 3.8
infrastructure, some recommendations (0.7) (0.7) (aQ8) (1.2) (1.0) (1.0) (1.1)Education 1.6 1.5 1.7 1.8 1.8 1.7 1.6
are: (Ql2) (0.2) (0.2) (a.1) (0.2) (0.2) (a02)
* The budget should allocate higher Health 0.9 0.9 1.O 1.0 0.9 0.9 0.8(0.1) (0.1) (0.1) (0.2) (0.2) (0.2) (a.)
amounts to investment spending than Housing Water and Sanitation 0.5 0.4 0.6 0.9 0.6 0.6 0.7(0.5) (0.4) (0.5) (0.9) (0.6) (0.6) (0.7)
to recurrent costs. CornmunityDcv& Social Services 0.8 0.7 0.8 0.8 0.8 0.7 0.7
* After education, the major (0.0) (0.0) (0.0) (0.0) (0.0) (0.0) (0O0). . Total 12.7 10.3 11.8 11.7 10.6 10.4 10.6
nvestment pnonties are roads and (0.7) (2.5) (2.9) (3.1) (2.3) (2.6) (2.6)
water/sanitation. Roads are a Figures im parenthcses refer to capital expenditures.
instrumental for poverty alleviation So..:es Statistical Appendix, Tables 6 and 10.
and to enhance productive capacity. Water/sanitation is critical for basic health needs.* Public spending on energy and communications should remain low, but urgent and long-
delayed investment needs should be filled by attracting private-including foreign-capital.The recent approval of the Law of Electricity and the Law of Telecommunications shouldimprove prospects for increased private investment in these sectors (Annex 4).
* Since administration and defense are minor components of public spending, the statemodernization program should only lead to a small reduction in public sector employment.
* Investment in human capital, actually classified as recurrent expenditure, should also beconsidered as part of social investment.
Table L2 Budget and Actual Expenditures of Central Government (Q ruillonp C. Budget Execution
E E t_ S 1 1 t S 1.13 Underexecution of the budgetAdmiidtrationandGerL Seivies 939.9 1062.3 13.0 1102.0 942.0 -145 severely distorts spending priorities,Defnse and Public Order 1105.8 1132.0 2.4 1115.8 10743 -3.7 especially as it discriminates against basicEconomic Infcuutuce& Services 2093.0 1471.8 -29.7 2286.7 2232.6 -2.4 infrastructure and the social sectors.Roads and Trausprt 1212.1 783.1 -354 1035.4 10897 52 Energy, communiCationS, and agrCommunicatons 68.1 49.1 -27.9 65.4 43.9 -32 9 EacultureEnerw 133.0 88.7. -33.3 206.6 114.2 .44.7 de lomn udrxcu iir 19AgriculireandMining 363.0 291.4 -19.7 362.8 262.1 -27.'8 underexecuted their 1996Fmance, ndustryiandOthers 316.8 259.5 -18.1 616.5 722. 17.2 budgets by 45 percent, 33 percent and 28
SocialSectogs 3976.6 3296.5 -17.1 4853.1 3636.2 -25.1 percent respectively (Table 1.2). HealthEducatim 1693.4 1411.9 -16.6 1905.6 1504.6 -21.0Health 1058.9 750.4 -29.1 1439.3 805.7 -44.0 and education also underexecuted theirHousin, Water and Sanitaion 611.0 534.4 -12.5 806.9 693.4 -14.1ComintvDev&Socal Sevices 613.3 599.8 -2.2 701.3 632.5 -9.8 1996 budgets by 44 percent and 21
Souce: StisisIicaA4App,end, Table 13. percent. Poor execution is a major reason
for the increasing role played by social funds in social investment, especially in the health sector.Execution of health investment expenditures averaged about 58 percent of actual allocationsbetween 1980 and 1990, and less than 50 percent in 1995 (Chinchilla, 1996). Execution ofeducation investment expenditures averaged 67 percent of actual allocations in 1980-95 (Acefia,1996).

An Oervniew of Publc Spendin Alocaon 9
1.14 The public sector has a very low capacity to absorb external resources. In 1993-95,disbursements averaged about $175 million annually (Figure I.6). This level is well below the$450 million annually which the Government estimates will be required to finance peace needs(GOG, 1997). According to MOF data, actual disbursements were 40 percent of the levelsprojected for 1995, and lower among bilaterals than multilaterals (Statistical Append., Table 19).
1.15 Low absorption of external official financing has had an irregular pattern mainlydetermined by a decreasing trend from bilaterals, partly compensated by increasing resources frommultilaterals and foreign private creditors. In contrast to the 1980s, when bilaterals were the majorsource of external financing, in 1995 multilaterals represented half of external loans, foreignprivate creditors (mostly bond holders) 30 percent, and bilaterals 20 percent. This was mainly dueto the significant reduction of US bilateral aid (Statistical Appendix, Table 21).
1.16 Underexecution and weak disbursement Figure 16 Trends of Ofcial Disbursement
capacity appear closely linked to:* insufficient tax revenues, which leads to 300
limited availability of counterpart funds; 250
* thie lack of an appropriate institutional 8 200 - ..7- : #
framework for public investment; ii 15
3 budget centralization at MOF, with "revised l loobudgetary allocations" that change what 50-_ ll____ _ _ _ _
Congress "approves"; Private
0% 03an outdated civil service law that does not Ot- 00 X 0 ggfigpromote salaries competitive with the 2 - a, -- -
private sector and adequate labor mobility; Source: Statistical Appendix, Table 20.
e inadequate knowledge and management ofan outdated procurement law, its regulations and procedures; and
3 weak ability to negotiate and execute externally funded projects, including poor knowledge byline ministries of procedures required for disbursing external funds.
1.17 Additional factors specific to the social sectors include:* inability of line agencies to formulate sectoral strategies, with clear priorities, implementation
arrangements and resource allocation implications;* major organizational and managerial deficiencies within line mmistries, including duplication
of functions in several agencies/offices, fiagmentation of administrative units (52 atEducation), and poor coordination among agencies involved in investment execution; and
* ineffective project administration arrangements coupled with weak managerial oversight,including the creation of separate project coordinating/implementation units (financed bydonors), which sometimes are out of the chain of authority in the ministry.
1.18 Enhancing budget execution and upgrading the disbursement capacity of externally fundedprojects are preconditions for a successful implementation of the PIP. The poor implementationrecord of line ministries suggests that unless major efforts are made to reform them, additionalresources are unlikely to have a significant impact on service delivery and coverage. Chapter IIaddresses institutional issues related to investment planning and execution.

CHAPTER H
INSTITUTIONAL FRAMEWORKAND THE PUBLIC INVESTMENT CYCLE
2.1 Low public savings, high domestic debt, on-going public sector efforts to decalize public investmentand the need to fulfill peace commitments make an optimal allocation of scarce public resources a top priority.This requires reforming the way the public sector performs its functions, while improving the effectiveness andtimeliness of its investments. Under the framework of the draft Law of the Executive, this chapter focuses onlong-standing issues that affect the execution of public investment, and offers a new strategic approach foroverhauling the institutional structure, procedures, and policy framework as well as for transitional anrangementsbefore a new structure and framework can be fully operational.
A. The Investment Cyde: Main Issues
2.2 Despite its snall size, the Guatemalan public sector is inefficient in its service delivery, management andregulatory functions (World Bank, 1996). Large budget underexecution of public investment and lowdisbursement capacity of external funds (para. 1.16) are a reflection of long-standing institutional problems.
2.3 Current institutional arrangements do not guarantee the consistency of public investment projects withthe sectoral strategies and macroeconomic balances. MOF and SEGEPLAN are endeavoring to build a coherentinvestment program including, as a first step, a PIP for the January 1997 CG Meeting. Nevertheless, constraintson the efficiency of public investment planning remain in particular, the increasing dispersion of similarinvestment functions across many institutions makes setting priorities difficult. Three major blocks of institutionsplay a role in what has become a de facto decenalized investment program-since decision-making andexecution authority no longer fully rests with the Central Government: sector ministries oversee infrastructureand social investment; public enterprises cover some infrastructure investments; and social funds andmunicipalities are responsible for an important share of social investment. This fiagmentation introducesconsiderable complexity in the management of the public investment program. First, the investments by publicenterprises have been low recendy: only GUATEL has a significant investment program, while the electricity andwater companies have reduced theirs to a minimum since they have not been able to raise tariffs sufficiendy tofund their capital needs (Chapter IV). Second, although investment by social funds is increasing (representinghalf of social investment), a mechanism to coordinate allocations and priorities among social funds has beenestablished only recently (under the authority of the Social Cabinet). Third, although the Constitution guaranteesthat 10 percent of the Government's revenues will go to municipal projects, these projects are not included in thebudget, nor are they coordinated with other public investments.
2.4 Long-standing institutional shortcomings affecting the project cycle are well known:Pre-investmenf* Many line ministries do not evaluate project design to ensure that projects fit into the sectoral strategy.* SEGEPLAN's role in project design is weak. It is limited to issuing a validation statement (dictamen) that
endorses or rejects the investment project. Rejection is rare, so that validation is often only a formality.SEGEPLAN has too much discretion in some cases, where no other approval mechanism or screening takesplace. Most projects show design faults and low rates of execution, which party reflects weak pre-investment analysis.
* MOF and SEGEPLAN lack adequate technical capacity and financial resources to assess the consistency ofthe PIP withi macroeconomic balances.
* Social funds have autonomy over their investment decisions, but insufficient capacity to identify andformulate projects. More importantly, draft pre-investment norms were only issued recently and the poor

Institutional Framework and the Public Investment Cycle 11
coordination among them, and between the funds, sector ministries and municipalities, has led to overlaps,inefficiencies of scale, and inefficient use of sectoral investment allocations.
* Public enterprises also have relative autonomy over their investment decisions, but as a result, many largeprojects are implemented without a full evaluation of their economic rationale or financial soundness (Urizarand Vidal, 1996; and Cosenza 1996).
Executon:
* There are inadequate human and technical resources for project management due to: (i) the lack of incentivesfor project executors, including low salaries; (ii) frequent changes in the management of projects for politicalreasons; and (iii) outdated information systems (Box 1. 1).
* Local counterpart financing for projects with external funding is unreliable due to: (i) frequentunderestimation of the impact of investment projects on future recurrent expenditures; and (ii) MOF's lack ofa debt management policy, which prevents the use of public credit as the instrument for planning reasonableprovisions of liquidity in the medium-term. Frequent changes in projected counterpart financing usuallyrequires altering original investment plans. As a result, criteria used to allocate spending priorities amongprojects are frequently inconsistent with sector policies and instead determined by MOF's cash availability.
* The country's ability to negotiate and disburse external funds is weak, as well as the capacity to manage orstreamline the implementation procedures required by donors.
Evaluaton
- No ex-post evaluation is developed, unless it is required by the foreign institution that financed the project;therefore, it is rarely known what impact projects have produced.
B. The Market Approach to the Public Investment Process
2.5 The Government has set forth a comprehensive program of modemization and strengthening of theExecutive Branch. In the past sixteen months, the Government's comprehensive efforts to modernize the publicsector included preliminary work to initiate the following programs: establishment of an integrated financialmanagement system (SIAF); reforming tax and customs administation, civil service reform; and disincorporationof state enterprises where there is scope to attract private capital and management.
2.6 On-going imxplementation of the SIAF at the MOF and other line ministries (MCTOP, Education andHealth) is dealing with some of those institutional shortcomings by: (i) ceralizing purchase orders in a singleunit (UDAF), thus reducing the number of processing steps from 130 to 19 and eliminating the need for anaverage of 600 daily checks previously issued by the Treasury; (ii) UDAF and the Internal Management Units(UDAI) in line ministries are exercising control of the preparation, monitoring and execution of their own budgetsas agreed with MOF; and (iii) preparing the 1998 budget with a new methodology that has reclassified 1,007activities into 50 program units.
2.7 A new market approach to public investment is based on the principle of normative centralization withoperative decentalization. This involves not only new institutional arrangements, but new management tools.Aimed toward an opbmal and more efficient allocation of public investment, such an approach should improvethe quality of projects, while unifying and strengthening recently created ad hoc coordination mechanisms-theSocial Cabinet, Social Funds Cabinet and bIstitutional Arrangements-agreed between line ministries, publicenterprises, social fimds and municipalities. The Government has also drafted a Law of the Executive Branch,which, when passed, would alter the structure and operations of the Executive. In line with other reforms, theLaw would limit the State's participation in productive activities, eliminate unnecessary functions, reduce thenumber of ministies and define clear regulatory roles for the remainig entiies. Another key transformationwould place the current Ministry of Finance and SEGEPLAN as Secretariats within a consolidated Ministry ofEcoomy.

12 Institutional Framework and the Public Investment Cycle
2.8 The main components of the proposed market approach to public investment are: (i) the creation of aNational System of Public Investment (NSPI) headed by a Council of Ministers; (ii) the simplification ofSEGEPLAN's normative functions under the NSPI to a minimum, focusing on coordination of investmentplanning and policy, and project evaluation, (iii) the technical strengthening of SEGEPLAN to prepare PIP-annual and multiannual-consistent with macroeconomic projections, the bank of projects, the preinvestmentsystem, the project evaluation system and the geographic information system; (iv) effective decentralization ofinvestment design, budget execution and monitoring to the sector ministries, the social funds, NGOs and localorganizations; (v) increased competition of the private sector for project pre-investment, execution and evaluationcontracted-out by the Government; (vi) the creation of a public investment information subsystem; and (vii) thecreation of a new subsystem of public-external and internal-credit at MOF which would support both the"single window" recently created through the "Comisi6n Interinstitucional para la Agilizaci6n de la Cooperaci6nInternacional" (CIACI) and the "fast track" treatment for grants recently approved by Congress (GovernmentDecree 3 89-97, May 14, 1997).
2.9 The NSPI should be the main authority in charge of public investment. It would consist of a Council ofMinisters, supported by the future SEGEPLAN and Secretariat of Finance, with a mandate to: (i) approve theannual investment policy; (ii) approve the annual and multi-year investment budget; (iii) approve the quarterlyreview of investment execution; (iv) approve the annual review of bilateral and multilateral external assistanceprograms; and (v) ensure an effective cross-coordination of project implementation among line ministries, socialfunds, municipalities and state enterprises (until their privatization), ensunng that projects are consistent andcomplementary with the key sectoral needs.
2.10 SEGEPLAN should reduce its range of functions, but strengthen its two key normative ones:Coordination of Investment Planning and Policy* prepare the annual public investment policy guidelines (including those for social funds);* prepare the annual and multi-year Global PIP, based on proposals by line ministries and social funds. The
Global PIP should be the instrument to reconcile all public investment plans with macroeconomic constraints(including the BOG monetary program, the public debt program, and the fiscal budget) and prioritiesstemming from the Peace Accords, while preventing duplications and gaps; and
* collaborate in the preparation of technical tools-like a geographic (mapping) information system (GIS) orhousehold surveys-to enhance coordination and properly assess the impact of investment projects.
Projedt Evaluation* set standard norms for the formulation of projects (manuals, forms) to be used by public institutions and,
only if requested, make pre-investment studies, but contraing them out to the private sector;* ensure that projects, programs and studies are properly evaluated ex-ante, and develop and disseminate its
methodology (e.g., cost-benefit analysis with common social prices for capital and labor);* coordinate ex-post evaluation (mainly for medium-to-large projects), but contracted-out.
2.11 An increased coordination of investment planning by the NSPI and SEGEPLAN should be coupled withan increased decentralization of investment design, execution and monitoring to the sector line ministries, thesocial funds, municipalities, NGOs and local groups. This also requires three elements:* a definite solution to the cash crunch problem at the future Secretariat of Finance;* financial autonomy to manage their own approved and transferred budget by line ministnes; and
Institutional Framework and the Public Investment Cycle 13
* private sector participation in and increased competition for project pre-investment, execution and evaluationcontracted out by the Government which would eliminate a major bottleneck in project preparation andprevent undue delays in project execution due to faulty design.
The_SIf wil prvd n intgate control:by the :Mhinityof Fnce(MOF): of fthe~~q bugetn,acutig za.: .-.X .SS .<. ..n ................. : : is ) f ...................... -b --~~~~~~~~~~~~~~~ ... . .......... . .......
.audtigad p.ouremntoperations ofo inistres. At present,there is noinfomtionesyste on. S,~~~~~~T . 9.. ..... e.: ..... ...t.of..ocontrol,mouiorng,athe firancia and phsca sesm of prqjects;which leads to te ek~o acuat ifontofrivset
t.a..-~~~~~~~~~~~~~~~~~~~~~~~~~~X - -. .. ,- -management inoafprecmh create a ta110wioade inforaito a t hae.
us. For its pat SEEIANsdtssen SN )i a poiie u ufcetefr: it is we. ocpulzd eaothe inanial nd hysial0p :** of nvesmen poets,adi nsald inan ectia i ......m.o....eer,ar
its old hada(ndsfwr) adisisoaion incprtiveunit in eto musxe :n te oeiin gnisd o rvdhe equetedinfrmatonn Mtm. mngte o ia fund, th Soil n estm n at Fund SF steol neta a noe
APmsnt exA ddSA ol otmlt tedvlpeto nitgae inomton sytm htuild aloit" rai~~~~~~~~~~~~~~~......... . ... .- -. e. s::.. ...)
s4e: at n wou 's sd h :in t p is ut: o ti T e l
...- d 40u-pX -.. : f- '.' .'".,. .,'.,- .'.. ' ..... ...... ,... .. -' ......:
-ffi.~ ~ ~~~~~~~. ... (i) .....t
.infr ation sy ithM it _wn........ .twi is wn s .. e
2.12 Institutional restructuring is not a "once for all change " but a gradual process that involves processre-engineering. Two new modules are essential: one on public credit (para. 2.13), and another on publicinvestment, which would include the financial and physical monitoring of project implementation. In the latterone, the control of projects would be coordinated between the future Secretariat of Finance (in its financialaspects) and the implementing agencies (in its physical aspects). SIAF should be expanded to the social funds(Chapter mI), which also involves the hannonization of their data systems (Box 11.1).
2.13 A Public Credit Division is inthe process of being created at the future Secretariat of Finance to unify-external and interal-public credit operations and to simplify the process of negotiating and disbursing externalloans. This would guarantee that adequate local counterpart and external resources are allocated to the executionof public investment in a timely manner. In particular, such a unit should focus on:* making accurate estimates of monthly cash-flow investment needs;* making quarterly financial projections of revenues from internal bond revenues and external disbursement
flows; and* drastically simplifying procedures for identifying, negotiating, and disbursing external funds. The recent
proposal by the Government to create a "single window" for managing external cooperation is a positive stepin such a direction.

CHAPTER III
PEACE AND THE RECOVERY OF SOCIAL INVESTMENT
3.1 Lasting peace and faster growth require not only the cessation of violence, but addressingGuatemala's poverty and social inequality. Poverty is widespread, deep, concentrated in rural areas andstrongly associated with ethnicity, gender, education and health conditions. Two thirds of Guatemalans arepoor, and of these, 58 percent live in extreme poverty. Among the indigenous populations, 90 percent arepoor. Nearly one in six Guatemalan households are headed by a female; of these households, 70 percentare poor and 49 percent are extremely poor. The poorest regions of the country are the North and theNorthwest which are also the regions most affected by the conflict. Social indicators in the country areamong the lowest in Latin America. Overall adult illiteracy is 37 percent, but reaches 72 percent amongindigenous people and 53 percent among women. On average, indigenous males have 1.8 years ofschooling and indigenous females 0.9 years, compared with 4.5 and 4.0 years of schooling for non-indigenous males and females, respectively. Infant mortality averages 55 per 1,000 but reaches over 100per 1,000 in the poorest rural areas.
3.2 The Peace Accords aim to increase social spending significantly, but the challenge of improvingsocial conditions requires more than a stronger revenue base and significant amounts of external funds.This chapter addresses other key issues affecting social investment, such as: misallocation of funds relativeto stated priorities and strategies; some inconsistencies of the health sector strategy with the PIP submittedto the CG meeting; and the institutional reforms required to make increased social investment (mainly thatimplemented by the social funds) more focused, participatory, and sustainable. Thus, the chapter focuseson which criteria should be used to make investment consistent with sector priority needs and assess thesoundness of proposed investment in the medium-term. In particular, regarding the proposed PIP, it findsthat: (i) the proposal for education is feasible; (ii) the proposal for health is high relative to the absorptivecapacity of the Ministry of Health; and (iii) although the three social funds-FONAPAZ, FDSC and SIF-could double their execution capacity and make a more efficient allocation of their investment resources,they would need to upgrade their management tools, improve coordination mechanisms among themselvesand with line ministries and municipalities, and deepen their own areas of specialization.
A. Education
3.3 Higher human capital accumulation is fundamental for sustained development, to increase laborproductivity, augment its contribution to growth, raise income and reduce poverty. The education sector,however, suffers from major deficiencies of coverage, equity, quality and internal efficiency. Today, netenrollment in primary school is estimated at 73 percent for boys and 66 percent for girls, which leaves over540,000 primary school-age children out of school. Although close to half of the population is indigenous(and speaks 23 different languages), there is an enormous difference in the coverage of the educationsystem between the indigenous and non-indigenous populations and a significant difference in theeducational attainment between males and females (para. 3.1). The education system is characterized byhigh rates of failure, particularly high repetition-for first grade, repetition is around 47 percent, for secondgrade 33 percent, and for third grade 30 percent. As a result, it takes the education system an average of6.4 years of schooling to produce a student who completed 4 years of primary education. Moreover,learning outcomes are poor, due not only to widespread poverty, but also to poorly prepared teachers(especially with regard to indigenous languages), inadequate educational materials and textbooks (quantityand quality), insufficient initial instruction and materials in the students' mother tongues, and a faultyevaluation system.

Peace and the Recovery of Social Investment 15
3.4 Not only is the level of public expenditures in education low, but the allocation of availableresources is inefficient, inequitable and biased in favor of the metropolitan region. In sum, it does notalways reflect the Government's priorities, as the following observations show:* The Ministry of Education's (MOE) administrative expenditures alone are higher than expenditures for
secondary education (Table III. 1).* Although the education system faces the challenge of providing primnary education to more than 1.5
million children, the budgetary share of pre-primary and primary education has not increased in the1980-1994 period. About one-fifth of the education budget is allocated to higher education, whichserves less than 100,000 students.
* Major regional imbalances exist in coverage of the school-age population: the metropolitan regionreceives a larger share of expenses than iswarranted by its share of total enrollment Table IIL 1(Table 1II2). Education: Structure of Recurrent Expenditures(%)
* A disconnect between the Government's Administration n/a 14 10 11 11policy to reduce recurrent expenditure in Initial Ed. n/a 2 4 5 2.5
favor of increasing social investment is Pimnary Ed. 57 48 45 46 47.5Secondary Ed. 14 12 11 10 11found in the large proportion of Ser Ed 17 19 17 16 16.4Hfigher Ed. 17 19 17 16 1.
educational spending going to teacher Out-of-school n/a 5 5 4 4salaries: less than 5 percent of total Other 10 0.2 8 5 7.6expenditures goes to investment (including Source: World Bank, Guatemala Basic Education, 1995.
school infrastructure and equipment,didactic materials, textbooks, libraries, and science equipment), whereas international research hasdemonstrated that about 15-20 percent of expenditures at the primary level should be allocated to non-salary items and investment to improve teacher effectiveness.
3.5 Limited implementation capacity is the main constraint in the education sector. This in turn is theresult of four major problems:* MOE is a fragmented, oversized, and Table 1L2 Coverage and Regional Distribution of
inefficient institution that lacks Recurrent Expenditures in Primary Educationcoordination of its centralized operations. .. .Its organizational structure includes 52 *... .. ~ administrative units, leading to misuse of Me.opolita 88 18.5 29.5 1.59resources, and unnecessary duplication of North 41.1 8.7 6.7 0.77functions and procedures. Available North-East 71.2 9.1 9.1 1.00estimates indicate that administrative and South-East 78.5 9.0 8.7 0.97
support staffepresetabot19prce Central 72.4 11.1 9.3 0.84support staff represent about 19 percent South-West 69.3 26.3 21.9 0.83of MOE's workers, which is high by North-West 46.5 14.7 12.2 0.83international standards. Peten 56.5 3.0 2.5 0.83
Source: World Bank, op. cit. and World Bank, Guatemala An Assessmeit of* MOE's weak management fully reflects v 1995.
the overall inefficiencies of public sectorfinancial management practices and civil service regulations. Centralization in the management offinancial resources is unavoidable because MOF performs almost all financial operations for MOE. Asa result, MOE lacks the basic systems and qualified staff to actually manage the sector's financialresources and unable to be accountable for the management of funds. The present financialarrangements have doomed MOE's past decentralization efforts to failure and renders its budgetunmanageable: in 1994, the MOE budget had 127 programs, 290 subprograms, 985 activities, and 11projects for a total of 1,413 budgetary units.

16 Peace and the Recovery of Social Investnent
* Inefficient personnel management hampers institutional capacity. There are constraints on hiring,dismissal and staff allocation imposed by an obsolete civil service regulatory framework and practices.In addition, teachers are governed by a special statute (Legislative Decree No. 1485) including a salaryscale that does not provide incentives to encourage teachers to work in rural areas and with indigenousgroups. In practice, salary increases are not linked to performance.
* Whereas the quality of teacher training in normal schools is deficient, there is excess supply ofteachers.
3.6 In support of its new education strategy (Box 111. 1), the Government prepared a preliminary PIP ofabout $272 million (Q. 1,667 million) for the 1997-2000 period (Acefia, 1996). It is consistent with thesector strategy and aims to: i - Xi
* expand coverage of education services in e a rrural and poorest areas through: (i) b .. r..e... se t...PRONADE, a scheme based onft.iiit 9600Prga,aet:community-managed primary schools ie r o o eP mary 4and parent-run COEDUCAS; (ii) pimary educatjon(t tu h daccelerated pre-primary education .... .. .. .e
programs to prepare disadvantaged eduischildren for school; (iii) strengthening - . .....alternative models for modular and the adminisatio f the ed ctiflexible provision of primary education lu e t o fservices and scholarships to em e--.n o scho.ls, . .accommodate the needs of special .....eeUcec i h ueo ....a rsure; n
groups; (iv) strengthening CONALFA's lta ds.aysauliteracy and post-literacy programs m Themaionunitents iieaeArent(especialyteSpanish and indigenous languages; and cauoe(v) special programs for groups directly G..e..ns.stra o 0.1)affected by the armed conflict;
- improve the quality and relevance of educational services to lower repetition and drop-out levels,including school administration training for school boards (juntas escolares), civil education, and theexpansion of bilingual education through teacher training in bilingual and multigrade education, andmaterial provision;
* in coordination with the public sector modernization program and the SIAF, restructure theorganization and management of MOE, which includes an effective decentralization of MOE throughdepartment offices, elimination of redundant units and implementation of a performance evaluationsystem; and
* increase public investment in school construction and equipment, mainly through the social funds-FSDC, FONAPAZ and SIF-which have $15 million to invest in the next iwo years.
3.7 Recommendations. For the education PIP to be implemented, several actions should be taken:* MOF should provide timely counterpart financing for externally funded projects. The incremental
recurrent costs of the proposed program are estimated at about $43 million per year-18 percent ofthe 1995 education budget-for a program that would entail a total annual spending increase of about$68 million per year (Q.267 million) in the education budget. Such figures are well within the goal ofraising education spending to 2.4 percent of GDP by the year 2000 (Acefia, 1996).
* MOE's poor coordination and administrative fragmentation should be addressed through projectedinternal restructuring. This restructuring should define the functions and responsibilities of the various

Peace and the Recovery of Social Investmnent 17
levels (central, departmental, and school level) and participants (juntas escolares, managers, teachers,communities, and parents). In the short term, this effort should concentrate on priority programs aimedto improve the provision of key services: PRONADE, CONALFA, bilingual education, teachertraining, textbooks and educational materials.
* Effective decentralization should remove public sector financial management bottlenecks caused bycumbersome and centralized planning, budgeting and budget execution procedures, includingprocurement and disbursement procedures (para. 3.5). In the short term, the prompt creation of thefinancial management unit (UDAF) at MOE to start implementing the SIAF already initiated by MOFis an important first step (para. 2.6).
* The constraints imposed by the civil service regime on hiring highly qualified staff should be overcomeby contracting consulting services, until a new civil service legislation is approved and put in place.
* PRONADE should ensure the achievement of the targets for expanding coverage over the next fouryears. Doing this efficiently will require defining its role and relationship with the rest of the Ministryto avoid duplication of functions, legal establishment of the instrument by which funds would betransferred to it (fideicomiso or revolving fund), strengthening its management structure, andenhancing its execution capacity by simplifying mechanisms to transfer financial resources fromPRONADE's account to community-managed schools, and from MOE to school boards.
* Investment in school infrastructure should be transferred to the main social funds, but contracted out tothe private sector (para. 3.6). Hence, special attention should be paid to establish clear coordinationmechanisms between MOE, the NSPI and the funds (para. 2.9), so that they comply with technicalconstruction and equipment standards and follow MOE's coverage expansion priorities, especiallythose of PRONADE. This would also require strengthening MOE's planning capacity.
B. Health
3.8 The nation faces extremely poor health conditions and suffers from deficiencies in coverage,quality, and equity. Life expectancy is 62 years, the lowest in Central America. Mortality of childrenbetween 1 and 5 years of age represents one fifth of all deaths, a proportion two to three times higher thanin countries with better health and nutrition indicators. Approximately 70 percent of these deaths arecaused by diarrhea, acute respiratory infections, and malnutrition. It is estimated that the Ministry ofHealth (MOH) covers about Table U325 percent of the population, Regional Variations in Health ConditionsIGSS 17 percent, and the ; ;t E _private sector about 14 ::.:::: tl~W)
percnt,hil over pMetropolitan 51 29 7 52percent, while over 50 percent North 62 38 19 42of the population remains Northeast 53 26 9 49uncovered (World Bank, Southeast 66 34 10 451995). Judged by almost any Central 69 32 11 45indicator, national health Southwest 72 39 11 29
Northwest 56 44 23 47conditions are not only lower Peten 57 23 23 34than in countries of similar Source: World Bank, Guatemala An Assessment of Poverty. April 1995.income level, but haveimproved more slowly throughout the 1980s: i.e., infant mortality among children aged 1 to 4 has declinedby only 4.7 percent in Guatemala as opposed to declines of 10 percent or more anmually in other LatinAmerican countries in the 1980s. Health conditions are far worse in the poorest regions of the country-North and Northwest (Table 111.3)-and among indigenous populations and women: infant mortalityamong indigenous people is 71 per 1,000 compared to 38 per 1,000 among non-indigenous people, and

18 Peace and the Recovery of Socia Investment
only 8 percent of indigenous women receive any kind of medical attention at birth compared to 39 percentamong non-indigenous women.
Table 11m43.9 Halth xpendturesare nt onl low- Distribution of Health Expenditures by L,evel of Care (%)13.9 Health expenditures are not only low-
about 1 percent of GDP (Table I)-but do nt7 0 6 39 5.' Hospitals 7 0 6 39 5.reflect the Govenmment's priorities. The Prev.+Primary Care 25 20 39 46.1 46.3Government's health strategy has correctly Source: Chinchilla,1996; *allocated budget.emphasized Lpreventive rural health, maternal andchild care (Box III.2), but expenditure trends contrast sharply with these priorities:* Up to the early 1990s, about 80 percent of health expenditures was allocated to hospitals and only 20
percent to preventive and primary health care services (Table 111.4). The operating expenses of the twolargest hospitals in the metropolitan area(San Juan de Dios and Roosevelt)...... .......exceeded the operating expenses of all -- e oee.e......health centers and health posts in the The n cive ihcountry. Although the share of PHC has vuner'ablepouati. by-increasing cvag etimproved since 1993 to reach 46 percent re services'n in he. ra ara.- K goias 'icd owerof the sectoral budget, available funds for ...... .. e. tmorUeM tratep Then maif .n..et are....non-hospital preventive and primary H casit a p er to .t..ati-
year). he ancing gap is about $30 40 _ ...... ........... ... . -..... ----
health care was i the range of $4-5 per capita, still significantly short of the s..as.wellestimated cost of delvering a basic e.p i
bias i resouce allcationtoward Coverae expasion _1 80.0 1 30.hospitalcare alo leadsto a hihly medicfalstupplie is 96n e37.3et
package of services that would address ..Hdeiv acg e ta.3 12
more tfh 80 percent of the diseases evborne by children ($8 per capita per t thantre acgitis to the localevel, inlyear). The financig gap is about $3040 c.. ......... .dptmillion more per year (24-32 percent of .divnsrain se rimethe MOH executed budget in 1995). .contrin th tser.ie ivery rit t t o
*As hospitals are concentrated in the NOO . ........
metropolitan and other urban areas, the MOHT's PIP 1996- 2000 m mbias in resource allocation toward Coverage expansion 80.0 30.9hospital care also leadns to a highly PHO infrastrture 96.5 37.3skewed regional distribution of health Hospitals 33.3 12.9
expenditures, where the greater the Water and sanitation 34.0 13.1expendtures wher the geaterthe ther health/traditional medicine 14.6 15.6
degree of urbanization, the greater theresources spent on the region (Table II1.5). As a result, Guatenmla City receives the bulk of the budgetand a per capita allocation more than three timnes higher tha the regions with the greatest poverty andindigenous populations.
3.10 Compounding overall public sector financial management and civil service constraints, limitedimplementation capacity by MOH is the main constraint in the sector. This is the result of:
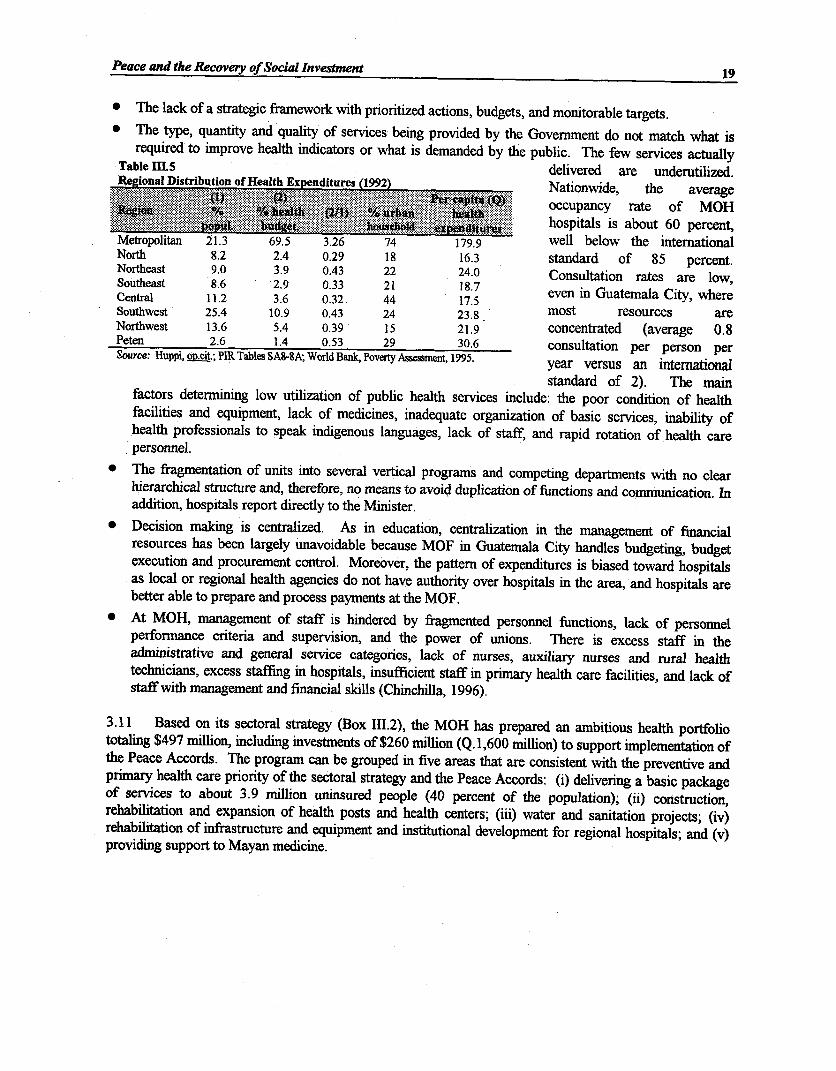
Peace and the Recovery of Social Investmnent 19
* The lack of a strategic framework with prioritized actions, budgets, and monitorable targets.
* The type, quantity and quality of services being provided by the Government do not match what isrequired to improve health indicators or what is demanded by the public. The few services actually
Table 1115 delivered are underutilized.Reg ional Distribution of Health Expenditures (1992) Nationwide, the average
occupancy rate of MOH
i___________________________________________________________ hospitals is about 60 percent,
Metropolitan 21.3 69.5 3.26 74 179.9 well below the internationalNorth 8.2 2.4 0.29 18 16.3 standard of 85 percent.Northeast 9.0 3.9 0.43 22 24.0 Consultation rates are low,Southeast 8.6 2.9 0.33 21 18.7 even in Guatemala City, whereCentral 11.2 3.6 0.32 44 17.5 ms eore rSouthwest 25.4 10.9 0.43 24 23.8 most resources areNorthwest 13.6 5.4 0.39 15 21.9 concentrated (average 0.8Peten 2.6 1.4 0.53 29 30.6 consultation per person perSource: Huppi, o.cit.;PIR Tables SA-8A; World Bank, Poverty Assessment, 1995. year versus an international
standard of 2). The mainfactors determining low utilization of public health services include: the poor condition of healthfacilities and equipment, lack of medicines, inadequate organization of basic services, inability ofhealth professionals to speak indigenous languages, lack of staff, and rapid rotation of health carepersonnel.
- The fragmentation of units into several vertical programs and competing departments with no clearlierarchical structure and, therefore, no means to avoid duplication of functions and communication. Inaddition, hospitals report directly to the Minister.
* Decision making is centralized. As in education, centralization in the management of financialresources has been largely unavoidable because MOF in Guatemala City handles budgeting, budgetexecution and procurement control. Moreover, the pattern of expenditures is biased toward hospitalsas local or regional health agencies do not have authority over hospitals in the area, and hospitals arebetter able to prepare and process payments at the MOF.
* At MOH, management of staff is hindered by fragmented personnel functions, lack of personnelperformance criteria and supervision, and the power of unions. There is excess staff in theadministrative and general service categories, lack of nurses, auxiliary nurses and rural healthtechnicians, excess staffing in hospitals, insufficient staff in primary health care facilities, and lack ofstaff with management and financial skills (Chinchilla, 1996).
3.11 Based on its sectoral strategy (Box III.2), the MOH has prepared an ambitious health portfoliototaling $497 million, including investments of $260 million (Q. 1,600 million) to support implementation ofthe Peace Accords. The program can be grouped in five areas that are consistent with the preventive andpfimary health care priority of the sectoral strategy and the Peace Accords: (i) delivering a basic packageof services to about 3.9 million uninsured people (40 percent of the population); (ii) construction,rehabilitation and expansion of health posts and health centers; (iii) water and sanitation projects; (iv)rehabilitation of infrastructure and equipment and institutional development for regional hospitals; and (v)providing support to Mayan medicine.

20 Peace and the Recovery of Social Investnent
3.12 Recommendations. The success of the Government's health strategy depends on a realistic reviewof both the sector investnent
Table 1.6 Health: Existing Investment Projects and Proposed PIP pipeline and the Ministry's own1997-2000 (US$ million) project implementation capacity.
(m) = The size of the health PIP is too. ~ ~ ~ Totl 1~~~~~eac. ~~~~~w ~~~ large, given the existing
Water & Sanitation 99.8 45.9 145.7 34.0 179.7 portfolio and the absorptivePrinryHealthCare 54.8 17.1 71.9 192.0 263.9 capacity of the sector. TheCurative Care 1.8 17.2 19.0 34.0 53 0TOTAL 156.4 80.2 236.6 260.0 496.6 Government is proposing toSource: Chinchilla, 1996, Tables 4,5 and 6. * Differences due to rounding. increase investments to an
annual average of over $120million per year, or four times more than the level of investment-$28 million executed in 1996 (Table 11.6and Statistical Appendix, Table 16). As execution rates in health remain the lowest in the social sector(Table I.2), the proposed portfolio is well beyond the Ministry's capacity. The Government should reduceit to a more realistic size determined by the likely contribution of each ongoing and proposed project tostrategic goals and sectoral priorities:* Priority should be given to infrastructure needs of the new model of service delivery, the integrated
system of health care (SIAS) and to rehabilitation of infrastructure and equipment over newconstruction in target areas. The SIAS aims to reduce infant mortality through an innovative healthcare system reaching 100 percent of the population living in pilot communities.
* An order of priority (and financing needs) among hospitals is absolutely essential to the achievement ofthe preventive and primary health care strategy, while paying special attention to prevent duplicationand improve coordination between MOH and IGSS activities.
* The incremental recurrent cost implications of each proposed project, including staff, medical suppliesand materials, phannaceuticals and maintenance, should be carefully evaluated, as well as the likelycontribution (and likelihood of a timely disbursement) of counterpart and external funds.
* There is a need to assess the scope for transferring project responsibility to social funds-which isparticularly relevant in the case of water and sanitation projects (36 percent of the health's PIP)-whilecontracting execution to NGOs, private sector, cooperatives, municipalities, and community groups.
* Ensure effective progress in the on-going health services improvement program that would play a keyrole in: (i) restructuring and reforming MON, (ii) supporting the expansion of coverage andstrengthening of the SIAS, and (iii) improving efficiency in public hospitals. These efforts should beconsistent with on-going SLAF project reforms aimed to decentralize public sector financialmanagement (para. 2.6).
C. Social Safety Net: The Social Funds
3.13 Social funds are responsible to a large extent for the recovery of social investments (Chapter I) andtheir performance vis-a-vis the line agencies demonstrates the inadequacy of the traditional publicinvestment system to finance and manage small projects, and reach rural areas and local communities. Asof February 1997 there were nine active funds: four of them under the Office of the Presidency of theRepublic (FONAPAZ, FIS, FSDC, FODIGUA) and the other five belonging to line ministries(PRONADE, FONATIERRA, FONAGRO, FOGUAVI and FOSUVI). Moreover, there were two morefunds in the process of being created: the Fondo Nacional para la NiIez at MOH and the FondoGuatemalteco de Medio Ambiente (FOGUAMA) attached to the Presidency. This chapter focuses onFONAPAZ, FIS and FSDC because they executed over 70 percent of the resources allocated to socialfunds in the 1994-96 period (Table 1II.7) and examines the role of the social funds in public sectormodernization. While they provide an option to get social investment executed rapidly, their performance

Peace and the Recovery of Social Investnent 21
has not been linked or fully integrated into the overall public sector reform effort and, if not reoriented,could actually delay reform in the line ministries.
Table 1117Basic features FONAPAZ FTS, FSDC
Date of creation July 1991 March 1993 1992Target population population affected by the poor and extreme poor urban and rural population
conflict and poor-ZONAPAZ population in rural areasTargeting criteria FIS poverty map poverty map noneType of project *Peace related projects *Health (infrastructure, *Health (infrastructure)
*Health (infrastructure, equipment, services) *Education (ifrastrture)equipment, services) *Education (infrastructure, *Rural Water & Sanitation*Education (infrastructure, equipment, services) *Productive projectsequipment, services) *Rural Water & Sanitation *Small Roads*Rural Water & Sanitation *Productive projects *Energy*Productive projects *Small Roads *Housing*Small Roads
US$ completed (up to 1995) 31 million 18 million 82 millionCost-sharing percentage 21% 32% 46%(municipalities,beneficiaries)Average project cost (US$) 26,500 12,800 31,600per education project 8,741 12,487 13,954per health project 26,868 7,253 28,508per transportation project N/A 20,542 30,948
Average days from project 255 330 165identification to completion
3.14 A number of features characterize the social funds (Arguello and Vannini, 1996):* They operate with special regulations. They are not affected by budget regulations because they
actually receive lump-sum-cash and, sometimes, bonds-transfers from MOF to their own trust fundor revolving funds (fideicomiso), are exempt from the civil service law and public sector pay scale.Although FONAPAZ is exempt from local procurement law it follows its procedures as does FSDC.FIS is exempt from local procurement law but it has followed more stringent ceilings for pricequotations than local law. FSDC hires its personnel mainly from the Central Government and operateswith resources from the ordinary budget approved by legislative decree.
* Until a recent agreement signed in January 1997 between FIS and FONAPAZ, there was nospecialization either along sectoral or geographical lines among the social funds.
* The funds have developed a greater capacity to execute projects than that of the line ministries. In thelast two and a half years, about 85 percent of the investment in infrastructure and equipment for healthcenters and posts, 62 percent of the investment in school infrastructure and equipment, and about 50percent of the rural water and sanitation investment was financed through the social funds.
* They have been very effective in channeling resources to rural areas and the poor outside GuatemalaCity. Less than 5 percent of their resources were allocated to the Metropolitan region.
* They mainly finance small projects. The three funds financed about 7,000 projects at an average costof $33,000. Average FONAPAZ education projects and FIS health projects seem less expensive thansimilar ones executed by the other funds.
* They mobilize additional resources through cost-sharing arrangements-cash, kind and labor-frommunicipalities, NGOs, communities, and beneficiaries.

22 Peace and the Recovery of Social Investment
* Finally, although there are major technical differences among the funds, they each have a set ofprocedures for a complete project cycle.
3.15 Several issues arise from the parallel operation of the social funds.
* There is a contrast between the demand-driven approach used by the social funds to identify projectsand the frequent supply-driven approach used by sectoral ministries or SEGEPLAN. At present, themultiplicity of funds induces negative externalities: overlapping and waste of resources, use of differentcriteria and standards for the projects they finance, and there is no (FSDC) or limited (FIS,FONAPAZ) assurances that recurrent expenditures will be actually provided by line agencies onceinvestments are completed.
* The almost complete absence of preventive maintenance schemes for physical infrastructure projectsfinanced by social funds limits the duration and returns to such investments. Although the health andeducation ministries have made social funds accountable for the preparation, financing, andmanagement of small infrastructure and equipment projects, their specialized units have not adequatelysupervised those projects: e.g., PAYSA and UNEPAR in rural water and sanitation at MOH.
3.16 Recommendations. There are divergent opinions on the future role of the major social funds. Inthe 1997-2000 period, there is consensus they will need to play a critical transitory role in facilitatingimplementation of the PIP, while public sector modernization efforts get off the ground. There would be noother way of ensuring a rapid increase in investment flows. Over the medium term, however, it is unclearwhether their investments would decrease, since progress in the public sector modernization programincludes a very ambitious decentralization effort. Over time, it may be that the social funds will need toplay an important role in this decentralization effort in line with increased channeling of social investmentthrough municipalities and community groups. For this reason, the recommendations focus on how toimprove the effectiveness of the social funds during this transitory period, leaving aside for now adiscussion of their longer-term role:* The first recommendation is not to promote further dispersion and institutional fragmentation by
creating more funds. Under the framework of the on-going process of modernization of the state, thenew institutional framework should redefine their functions and responsibilities under the NSPI,eliminating project duplication and fragmentation (para. 2.8), and proceed to gradually integrate theirinvestment information system to the SLAF (Box 11. 1).
* An increased coordination could help to ensure a more efficient utilization of fund resources and todouble the level of their operations in the next four years (Zufiiga 1996, Arguello and Vannini 1996).This requires:
* Conducting a detailed reengineering of their internal procedures and processes with a view toadopting uniform technical standards, simplifying and providing greater homogeneity amongproject forms, and speeding-up project approval and execution. Most of their projects can besubject to common standards. With the support of the NSPI and SEGEPLAN (paras. 2.9-10),fimds should only regulate decision-criteria, technical standards, project forms, procedures andmethodologies for community participation. A modified version of the FIS's informationsystem could be adapted by the other funds.
* Strengthening and facilitating private sector participation in project preparation both at thelocal level (community, municipality) and the line ministry level. This would increase thepipeline of well prepared projects ready for financing.
* Introducing new coordination mechanisms through the recently installed Social and InterfundCabinet, headed by the Vicepresident of the Republic and supported by the future NSPI. Thiswill be crucial to ensure that social fund investments support national priorities and sectoralpolicies in a coordinated way, that a timely provision of recurrent expenditures is provided by

Peace and the Recovery of Social Investment 23
the ministries, and that technical standards and prototypes set by the NSIP are applied. Thesecoordination mechanism should be complemented by specific tools, including: (i) developing ageographic information system (GIS) to consolidate data on microlocation of existing supply ofsocial infrastructure and services coupled with population information; (ii) unifying availablecommunity demand information based on the 1994 census data at the departmental and locallevels; and (iii) developing and implementing a periodic national household survey system tohelp monitor and evaluate actual implementation and targeting of resources and programs.Gradually specializing not only by department, but by type of project. The presentconcentration of fund activities in similar ZONAPAZ regions should be modified by bilateralor multifund agreements (Statistical Appendix, Table 24). The recent one signed betweenFONAPAZ and FIS is a beginning. In addition, FSDC might specialize in the areas ofmunicipal institutional strengthening and cofinancing of small projects; FIS is well staffed tohandle infrastructure projects (provided it solves its cumbersome procedures and lengthyresponse time to beneficiary requests); and FONAPAZ might handle projects with a strongcommunity base and which require larger and longer-term commitments (Box M.3).
* The focus and coverage of their operations can be greatly enhanced by adopting a new model of localservice delivery, directly involving not only municipalities and NGOs, but also the key beneficiaries ofrural programs-poor and indigenous communities. FONAPAZ is designing and testing such anapproach (Box 11.3).
~~~~~~~~~~~~~~~~~~~~~~~~~~~~~~~~~~~~~~~~~. .... .. .... ._
.i i"..t...e'r . ....... ' t'e ' ' ' ' 'l': 'd'
+ ,!,,,,,*,,,. .................. ... ......... tt~ sppoit1tON~PAZ t ftin " autul a'poah)i S: c : an.ooca. Th wgai ist nnt oa
ui4en It ain [F i ure aTh agt ra r suece munZicpite <n< d ixuents th iihcnetaiz
~~VJW .....# ~ . .. l putiu netnepwry
mainly idigenM -ous.3~~~~~~~~~~~~~~~~~~~~~~~~~~~~~~~~~..... ... . i,.. m .= .. ................ ~ -'
prograni, the FONAPAZ Regional I ~ ~ ~ ~ ~ WON ....
all ~~bers of the progra.,m,nsgemena* heDICPA pora wud inne ~ononnttsoia nfasnctre(chol,techn mteils hathunt
raan) (i aicifatrcuesa rdctv evie rrl od,elcr rn,tlpons n cei) ad(m2
technical asistance in lcal prc~ect onnulation ad training. re-estalihahd ceding..wold.g.aran.eea least S(pereinof ota fiancng o eucaionandheath iees!Theallcaton f te rmaiderwoud b deine atthebo
comnmiuiity level.~~~PTi"S' A

CHAPTER IV-
BASICINFRASTRUCTURE PROVISION: ROADS, ELECTRICITY,TELECOMMUNICATIONS AND WATER
4.1 The provision of basic infiastructure in Guaemala is weak and clearly detrimental to faster growth,poverty reduction and, hence, peace consolidation. Much of this poor performance can be attributed to thedominant role of the state in the provision of infastructure services, the absence of market mechanisms, and aninadequate institutional fiamework, too concentrated in a single entity-such as GUATEL intelecommunications-or too dispersed in a large number of ministenal departments and municipal offices-suchas water supply. As a result, underexecution, poor design, and weak monitoring and evaluation of investmentprojects are comm deficiencies shared with the rest of public investment.
4.2 This Chapter addresses key sector shortcomings such as its traditionally optimistic investment portfolio,an apparent lack of financing, and a permanen "disconnect" between the sector investmet program and the restof public investment allocated within and across sectors. These are somewhat related to: (i) the type ofexternality involved in the provision of the public service-health in the case of water; productivity in the case ofpower, telecommunications and roads; (ii) the role of a "lead state agency" as service provider-ministry orsocial fund in the case of transport municipal dependencies in the case of water or public enterprises in the caseof power and telecommunications; and (iii) people's perception as to whether (almost free) access to the publicservice is a right because it is a basic need (water and sanitation), a less-essential need that has to be paid for(telephone services), or a mix of both (roads and electricity services).
A. Roads
4.3 Because of its role in facilitating access to services in a country with rugged terrain, long intercitydistances and the traditional isolation of most poor communities, the provision of roads is the main basicinfastructure necessity. The road network has a total length of 12,761 kln, of which barely 28 percent is paved.Most roads (40 percent) are tertiary and a great proportion (78 percent) are in bad condition. Most transport (75percent) uses roads in a country where there are about 600,000 vehicles (13 percent trcks), two irds of themconcentrated in the capital's metropolitan area. The main agencies involved in the tansport sector are: (i) theGeneral Directorate of Roads (DGC) of the Mnistry of Commwunications, Transports and Public Works(MCTOP), who manages the entire primary, secondary and rural road network with an annual budget of about$150 a year in 1996; (ii) the social funds, who finance some local tertiary roads (with little tecbnicalspecifications and no maintenance plan), with a roads budget of $13.3 million in 1996 (FONAPAZ with $5million, FIS with $2 million, and FSDC with $6.3 million); (iii) the municipalities, whose direct tansfers nmghtbe devoted to local roads; and (iv) the Vice-presidency, which has recently taken a coordination role.
4.4 The sector has several institutional shortcomings:* Effective execution of ivestment projects has significantly improved in 1996, but still is insufficient to cover
the ambitious investment program projected for the next 4 years (para. 4.5). Despite adverse weather anduntimely counterpart fund releases, MCTOP budget execution was over 90 percent in 1996, an extraordinaryachievement relative to the Ministry's previous record.
* DGC reorganization has improved its planming process and increased private participation in roadmaintenance substantially in 1996, but still needs considerable strengthening in project execution,procrmnt procedures, and trainig aimed to improve the bidding and contracting cycle, work supervision,the processing of contractor bills and the management of tertiary (rural) roads. DGC merged severalprograms, gave autonomy to "Zonas Viales" to allow them to coordinate with municipalities, increased its

Basic Infrastructure Provision: Roads, Electricity, Tekeonmmunications and Water 25
budget and created a new Maintenance by Contract Division. As a result, DGC halved its labor force, frommore than 11,000 workers in 1994 to close to 6,000 (only 23 professionals) by early-1997, and awardedcontracts for close to $25 million through formal bidding.
* Despite institutional changes, rehabilition costs still are high due to limited competition in the constructionbusiness, and the frequent and acute problems in procurement processes. Only recently more finms (bothiternational and local) are participating in the bids and unit prices are likely to decrease. High costs reducecost-effectiveness of investment in roads with traffic below 200 vehicles a day and contribute to thesignificant backlog in highway rehabilitation (close to $1 billion). In addition, as ZONAPAZ has 5,000 kmof mostly unpaved and badly deteriorated roads, and low vehicle density, it is difficult to justify roadinvestments in the ZONAPAZ region on purely economic grounds.
* Decmtlization at the MCTOP is only begimiing in Peten, where local authorities now have budgetautonomy for roads maintenance; but in other departments, there is limited participation by local authoritiesin decision making, even through regional bodies.
* Coordination medhanisms under the Vice-presidency are at an early stage and there is still a need to developsimple institutional arrangenents with funds and local authorities to execute tertiary roads, includingZONAPAZ. Final engineering designs for such projects need to be prepared, and social funds have a limitedinstitutional capacity to cope with an intensive roads investment program.
4.5 The proposed investment plan for 1997-2000 is well focused, but still in excess of DGC capacity.Expditure for roads has been very low in the past (typically less than 1 percent of GDP and less than 10percent of the Government's budgetS which partly explains the sector backlog). Rehabilitation of primary andsecondary roads is, appropriately, the focus of the investment program, but overcoming the bacldog in four yearsexceeds present possibilities (Caraballo, 1996). Based on MCTOP data, the proposed investment programn isestimated to total $864 milion for 1997-2000, or $216 million per year, of which about one fifth-$170million-in ZONAPAZ roads (Annex 2, Table A3.3). Current investment in roads has significantly improvedfrom $106 million in 1995 to about $155 million in 1996, but this amount remains about two thirds of thetargeted annual estimate. Hence, existing government agencies and domestic construction firms need to expandtbeir financial and institutional capacity significantly to absorb such an ambitious investment program,irrespective of the availability of external financing.
4.6 Recommendations. Given its indispensable role for rapid growth and poverty alleviation, investing inroads requires not only more resources (and private participation), but further strengtheing of the executioncapacity of MCTOP and other agencies. The following actions should be considered:* DGC should strengthen its institutional capacity in preparing sector investment planning and in
expanding its innovative scheme of contracting-out private sector participation in the maintenance of themain highways (primary) and secondary roads. Investment in key tertiary and rural roads could beundertaken by DGC, but subconrting execution to social funds and local governments. The advantages ofcreating a Sub-Direcci6n General de Caminos Terciarios with specific financing mechanisms should beassessed.
* Improved coordinaton under the future NSPI, between MCTOP and the future Ministry of Economy andbetween MCTOP and the social funds, is required, especially for construction of tertiary roads, as well astheir rehabilitation and maintenance is concerned Work standards should be established. Social funds staffshould also be trained in procurement, payment and maintenance of road projects. Preparation of finalengineering designs for ZONAPAZ road projects should be subcontracted.
* To support the inplementation of future free trade agreements with North and Central Ameica, continuefinancing of rehabilitation of highway or primary roads between borders is a priority. The Ministry hasalready considered the construction of bypasses (enlarged roads) to facilitate border traffic.

26 Basic Infrastructure Provision
* To reduce rehabilitation costs three complementary strategies are being implemented and should bestrengthened. (i) non-Guatemalan construction finns should be allowed more participation in biddingprocesses, wuhich would considerably open the construction markdet to competition; (ii) increaseddeetalization should led to greater cost-sharing with local govemments; and (iii) upgrading (paving)terbary roads might be conveient on a case-by-case basis if, given similar geometical characteistics, theaditional cost is not so great relative to the extension of the useful life of the road, thereby reducing the needfor fuure maint ce and increasing the economic efficiency of the project (Caraballo, 1996).
* Technical strengthening of the recently created roadfund (COVJAL)-an eamarked surcharge on gasolinesales-is required as it is expected to raise about Q.200 million per year for roads maintenance. Curnty,the Ministry is preparing terms of reference for the technical assistance required for its functiomng stages.The concessioning and possible use of tolls may be appropnate in selected cases to raise addtonalresources-e.g., Palin-Escuinta, the highway leading to Puerto Quetzal. Revenues from fuel taxesrepresetted about 10 percent of totl fiscal revenues in 1996, which is well below the figure for othercountries in the region (Honduras, 17 percent and Nicaragua, 45 percent).
B. Power
4.7 The status of the power sector is a major obstacle to faster growth. It is severely damaged by the lack offinancing, underinvestment and a difficult process to disincorporate its assets. Legal constwaints have had a majorimpact on the efficiency of the sector. Approval of the new Electricity Law and adoption of new regulations inaccordance with the Law may not fully resolve the legal problems the Government has encountered in adjustingelecticity tariffs. Despite the new legal frameworlk it is not certain that proposed tariff adjustments willwihstand the practice of requesting injunctions by the Consftitional Court.
4.8 There are three main actors in the sector: (i) INDE, a state-owned generation, transmission anddistribution company; (ii) EEGSA, a corporation mainly owned by the state and mainly distributing electncity inGuaenala City; and (iii) a number of smaller, privately-owned generators (IPPs), which includes subsidiaries ofENRON (110 MW) and Tampa Electric (78 MW), as well as several co-generators (sugar-mills and a steel mill).The main buyers of electricity are EEGSA, municipalities and final users.
4.9 The overriding issue in the power sector is the poor financial position of both INDE and EEGSA, whichhas brought to a virtual stop investment in expansion of existng facilities, poor quality of maintenance services,and exhaustion of reserve margins in transmission, substation and distribution facilities. In addition, it has meantthere is no capacity to connect new customers in a country with one of the lowest electrification penetration ratiosin Latin America. The problem is rooted in a complex legal process followed to set tariffs, which suffers frompolitical manipulation and repeated challenges in the Courts. After almost two years of legal stuggles in theCourts, EEGSA and INDE are still unable to increase tariffs close to their long-run marginal cost. As a result:* EEGSA has been accumulating losses and arrears with its main provider, INDE (Q.800 million). As tariffs
had not been adjusted, its financial statements have been posting losses that would have exceeded its paidcapital, had the latter not been increased to avoid fialing into baruptcy. As more energy is purchased fromIPPs who are higher-cost producers, a new contract will need to be negotiated with INDE, which shouldcontemplate an increase in INDE's prices. Heavy losses and no tariff adjustment would also preclude asuccessful disincorporation of EEGSA.
* INDE's financial situation is no better. Although showing modest profits in the books, it faces severeliquidity problems and is also in arrears with the Governmnt (Q. 1,000 million). Its cash flow wouldimprove after EEGSA pays its arrears, but it still has a number of unpaid bills by municipalities and otherfinal users. By end-1995, INDE was owed about Q.500 million (roughly one year of sales). As partial

Basic Infrastructure Provision: Roads, Electricity, Telecommunications and Water 27
payment for its debt, EEGSA has decided to sell its two thermal power stations, Laguna and Stewart-Stevenson, and to use the proceeds as partial payment to INDE. For its part, INDE transferred to theGovernnent the shares of EEGSA that it owned with a book value of about Q.270 million.
* Due to rationing in the early 1990s, Guatemala decided to involve the private sector in generation, and toenact legislation that provided tax incentives to private generators who used renewable resources. PowerPurchase Agrements (PPAs) were signed with several IPPs for electricity generation using conventionalfuels. Whereas these contracts have eliminated rationing, because of their cost and terms (with a fewexceptions, they include take-or-pay provisions on both capacity and energy) they have aggravated theaheady poor financial condition of EEGSA and INDE (Cosenza, 1996).' Also, they have introducedrigidities in system dispatch that lead to a more expensive system operation that would otherwise be possible,rendenng competition in the market difficult and setting a bad precedent.
4.10 The new Electricity Law and its recently approved reglamento are important steps in developing aregulatory and legal framework that would permit opemng the sector to competition (Annex 4). According to theauthorities, however, at least 23 complementary norms are still needed to address the main sector problems-thelack of an adequate tariff setting mechanism at the distribution level, the lack of real competition at the generationlevel (the state is simultaneously regulator, operator and owner of the two biggest companies), and politicalinterference that leads to poor management of the electricity companies. EEGSA has suffered less, since itoperates as if it were a private corporation (which it was until the 1980s) and therefore shows less operationalinefficiencies. INDE, however, has a more difficult situation. Its customer-to-employee ratio is close to 80,which is half that of other power utilities in Central America and authorities estimate that about 1,500 workersare redundant. On April 22,1997, INDE started its restructuring in three divisions: generation, distribution anduansmission, which would allow it to split the real costs for each type of operation.
4.11 There is little public financing available for an electricity investment program. INDE and EEGSA haveselected a list of projects that could be carried out, but their implementation crucially hinges on tariff adjustments(Annex 3). Most of the proposed works are lines, substations or distribution projects needed to alleviateoverloads, to serve load growth or new customers. Since only 14 percent of the rural population has access topower, INDE also has a $30 million rural electrification program that would extend the network to areas targetedfor special Government attention as a consequence of the peace accords. Although these are high-priorityprojects, their execution is uncertain, since the financial situation of the two companies is poor and transfers fromthe Government and financing from multlateral agencies unlikely. Appropriately, neither institution hascontemplated investment in new generation.
4.12 Recommendations. Unless the recently enacted legislation is promptly and properly implemented, theelectricity companies are heading toward bankruptcy, stugging with their current inefficiency, insolvency andrecurrent bouts of rationing. Service quality will continue to deteriorate as there will be no fimds to invest.Finally, electricity coverage will stagnate or may even decline. The main recommendations are:* To complete regulations and norms that will support the new Electricity Law.* Addressing the desperate financial situation of EEGSA and INDE will require that the quasi-autonomous
Electncity Commission-it will be under the Ministry of Energy-proceed to set new tariffis (including thoseapplied to EEGSA), implement the transparent tariff settng mechanism contemplated in the Law (and whichmay withstand legal challenges), and speed up the setting up of Commission. In addition, the companiesshould: (i) complete restructuring in the case of NDE, or disincorporation in the case of EEGSA; (ii)
The cost of electricity supply, as measured by the price paid by EEGSA contracts, varies significantly, from $0.04/kWh to INDE to$0.13 to Tampa Electric, an IPP. Tampa Electric is the most expensive because it is the only IPP vAwich does not have a take-or-paycornract and so is forced to be a peaking plant.

28 Basic Infrastructure Provision
promote private participation in distribution, in addition to generation; (iii) divest their assets; (iv) before itssale and assuming tariff adjustments are made, split EEGSA into two companies serving non-overlappingareas of Guatenala City, to generate yardstick competition; (v) conclude cross-debt negotiations betweenstate firms and the Government; and (vi) introduce coumercial terms in the relationship with municipalitiesthat buy in bulk requesting them to buy from private distribution companies, rather than from INDE.
* To promote competition in generation and allow the development of a wholesale market, PPA contractsshould be avoided. Insa4, supply contracts to EEGSA should only guarantee payment of the capacitycharge (fixed costs).
* Given their difficult financial situation, the two power companies are in no position to contribute to aninvestment program. Such a program should be very modest and driven by the availability of fumds providedby the Government, donors, the private sector and customers.2 All new generation Will have to be undertakenby the private sector (IPPs). The Generation Expansion Program prepared by EEGSA and INDE, and theinterconnection with Mexico might be delayed, as it is not clear when the negotiations will be completed.
* Rural electrification projects should be handled by the local commumities, not by INDE. Small municipalelectricity companies could be created, supported by the Mnistry's technical assistance.
C. Telecommunications
4.13 The Guatemalan Telecommunications Company (GUATEL) is a state monopoly that provides alltelecommunications services, except cellular telephony which it subcontacts to a private corporation The Statemakes the rules, designs and implements sector policies, and operates the services. As a result:* GUATEL has only 350,000 lines in operation for a population of over 10 million, one of the lowest densities
in Latin America. Unsatisfied demand is estimated at over 1 million.* GUATEL is inefficient. It has about 20 employees for each 1,000 lines compared to the international norm
of 4 employees per 1,000 lines.- Before adjustments in February 1997, tariffs were highly distorted. While international calls were very
expensive (e.g., $1.50 per minute to the US), the local tariff was very low ($0.67 per month for 400 one-and-a-half minute pulses). Rebalanced tariffs included a six-fold reduction in international calls and aconrsponding increase in local calls.
_ GUATEL's historical investment has been unbalanced. While the internal plant has a capacity of 670,000lines, due to the lack of an external plant (wires, cable) only 350,000 are connected to the users.
* GUATEL is profitable, but most of its surplus (45 percent) is transferred to the Treasury.
4.14 The Govermnent's Program intends to increase the quality and quantity of services by introducing newregulations to promote widespread competition for all services. On October 17, 1997, an innovative Law ofTeleconmmunications (Annex 4) was approved, including the creation of a Superintendency ofTelecommunications (SM, the dismantling of monopoly rights, new regulations on interconnections and services,and the disincorporation of GUATEL in 1997. As with the Electricity Commission, SIT has budgetaryautonomy and a detailed set of provisions guiding the regulator's decisions.
4.15 No investment projects are contemplated for GUATEL after 1997, assuming that a new managementwill be in charge representing the interests of new shareholders and working in a competitive environmnent. Hence,its investment program only covers 1996-97 (Annex 2). It shows 21 projects financed and under executionduring 1996 (19 in their last stages of development) and, for 1997, special attention on the national transport
2 11 INDEs program, it is assuned that FONAPAZ would finance the complete nural electrification pngrarm

Basic Infrastructure Provision: Roads, Electricity, Telecommunications and Water 29
network (SDH).3 Furthermore, in preparing for competition, GUATEL is building a strategic advantage by"sinking" its investment, which should result in a higher price for GUATEL shares.
BoxV. 1. 6heD aC4 rationofGUATEX Fg t. .4.16 To implement its reform agenda, te.....-.- :.- : Goverment has emnbazked upon an ambitious
The isincoporaion of GAT was dslegislative program. On March 5, 1997, Congress.. n . iiiind nd addiional bnefits rom IDpWCd e Iieapproved an amendmnent to the Ley de Contrataciones
:-p~titioit According to the 1997 Central GQv (Procurement Law) that per mts, inter alia, the sale ofpolicy:by pa~,4n-off BOG stock of Government t~o~s ii~shares of autonomous pubic sector entities such asaid the ot-er h g i:lese GUATEL. Since Cuatemalan law requires a two-
of the e .pc'sztive fiscal -pacr are .mavabbut T an bethirds majority in Congress to create or dissolve ana acedasa result of five factors . d 996; autonomous Government agency and GUATEL's
WrdBank 1997; ,ando ,6ezChx :-d Shped 9a)*.-. Dire.t revenues from .isincorpora : assumed : b porganic law does not provide a legal framework for
the range of $00-600 millionthe, sale of its shares, this amendment-approved by aenefits rom debt-writ do.n.al f h poceeds($25 sipe majority-governs the process in a
million> to be -used for debt redUctio n are estimated to supplemetary fashion. However, it is facingplcent: savig of $1SI51.9 xwlrninDoetcnertrepayments-durng a51997 -20.injunctions of unconstitutionalty filed in the
.+-Benefts -frosm disincorporatin proceeds for soci Constitional Court.^ s ~~~~~isihi*i X X - : : 4invstent hlf f he roeed t b used for sca
ivesatunet are. eqvalnti to. about 1 : pec:ltoth1997 4.17 Recommendations. Supported by anGovernm ent b t an.X2 .ercent ofProjc ted.oc dadequate legal framework; GUATEL is opening to..vestment . * private sector participation. As a result, serce
* Cost ofseverance-payments: a negtve psvae seVA of atles .. '.-$20 million-'for''GIATEL 1997,'.' :'''' quaity should improve as major investment, co-shared
* Net mpac,t on taxes and transfers. afte net' neativ: by the private sector, takes place. Overallfiscal impact uld be a combination ,'- t'edctioi telecommunications coverage should improve. Thetr.nsfers ..om SGUATL to theX .centra . X :-.nt (5 main recommendations are:
:: -een its net.:e_arnmp-a.md Ahie .:.unaE o1apercent-of is net rm. o: the V aiOiI -*d ... It is essential to design the complementaryGUATL a the additional revenev expectedfro regulatory norms that wil support the new LawincreasedVT e of Telecommunications and the establshment ofe -xp:nsi.: the new SIT.
* Recent tariff policy changes and competition will determine the future price of GUATEL shares and its fiscalimpact (Box IV.1). Adjusted local and international rates have raised its value. In addition, GUATELshould: (i) reduce personnel costs; (ii) negotiate with the Government the amount of its annual transfer, (iii)find a viable mechanism to finance rural telephone services.
D. Water and Sanitation
4.18 The poor state of water and sanitation infrastructure is a major contributing factor to Guatemala'sextremely poor healt conditions. Only recently are efforts being made to define clear strategies, policies andinvestment programs for water and sanitation. Data are disperse and-non-reliable. With the exception ofGuatemala City, water services are provided by municipal offices, but an accounting registry is maintained inonly 12 of the 329 municipalities. Water losses are high (over 50 percent) and water is of poor quality. Serviceinterruptions are frequent, with less than 20 percent of aqueducts operating more than 19 hours per day. Peopleare not used to paying for the service and tariffs are so low that they do not even cover administrative costs.
3 SDH is fiber optic line divided in two parts: The first one crosses Guatemala from Mexico to El Salvador, the second is a loop fronGuatemala City to Ciudad Flores, Peten, and back-south townard Honduras. Given its high cost, there are concems about theconvenience of imderting this project, but since it takes place in a competitive market, there are incentives for private investors.

30 Basic Infrastructure Provision
4.19 Coverage is extremely low. The proportion of the population with access to potable water and sewerageservices is only higher than Haiti in Latin America. In 1994, 54 percent of Guatemalans had access to waterservices and 49 percent to sanitation services, but these figures hide a wide rural-urban disparity. Niney percentof urban residents had access to water services and 70 percent to sanitation, but coverage in rural areas was 32percent and 35 percent. These data, however, do not fully reflect the extent of the dispanty as the effectiveservice is on average much less than 24 hours a day, the quality of water is poor (only 108 out of 329municipalities have chlonnated water) and many communities are served by aguaccntaros (water trucks), ratherthan being connected to a piped network. In the case of sanitation, the majority of rural areas have noconventional sewerage, but rather latrines. About half of the country's 20,000 rural conmmunities have noservice.
4.20 A well-fimctioning market for water rights does not exist. The 1985 Constituton established that allwaters in Guatemala belong to the State, while in practice water rights are assigned free to private personsaccording to the Civil Code. Successive governments have tried to pass a special Water Law that would makethe constitutional provision operative, but they have failed as private interest have effectively opposed any changein the status-quo. The prevailing ambiguity makes pricing water a very difficult task. The Government'sprogram contemplates a new attempt to pass a water law, in which the Secretariat of Hydro-Electric Resources(SRH) has the role of defining and coordinating water policy in terms of the regulation of usage, conservation andprotection.
4.21 The tariff system is poorly regulated and does not differentiate by user. Tariffs are set by themunicipaWes themselves. This poses a severe political economy problem since mayors and municipal councils,on the one side, want to expand and improve water and santation services, for which they need to increase tariffs;but on the other, they are reluctant to do so because they would lose votes and popular support. As a result, themunicipal authorities usuaIly opt for not increasing tariffs and request more resources from the CeralGovernment, which confirrns people's perception that access to water and sanitation services, no matter how badthey are, is a free good and should be provided by the State at almost zero cost. It is nomial to find charges ofQ. 1 per month ($0.16), i.e., less than half the price of a soft drink. Tariffs are also distorted. In Guatemala City,the first ten cubic meters are priced at Q.2 ($0.16 per cubic meter), while the poor in the outslirts pay Q.15($2.50) per cubic meter to water trucks, i.e., 75 times what is paid by EMPAGUAs clients, simply because theyare not connected to its grid. Recent INFOM estimates show that in order to cover operation costs (includmgmaintenance), tariffi should be in the $2.504.00 fixed rate per month range, but most current tariffs are wellbelow this range, which coupled with the financial fragility of municipalities, imply a continuous deterioration inservice delivery.
4.22 A sound investment program for the sector has yet to be developed. Between 1990 and 1995, investmentin water and sanitation averaged around $13 million per year, two-thirds in the rual sector (especially in waterservices). Coverage indicators are extremely low, reflecting insufficient investment. The Government's prograncontemplates an ambitious increase in the coverage of water services in rural communities to 73 percent and inurban areas to 100 percent; and provision of secondary treatment of collected disposed water to 80 percent of the329 municipalities. In sanitation, the target is to build 300,000 latrines by the year 2000 (compared to 52,000now) in 2,200 out of 20,000 rural communities. These targets imply an estimated total investment of $708million in water services and $494 million in sanitation, i.e., an average annual investment of $300 million, or 25times its current figure. Given its present execution record, such an amount looks overly optimistic, not onlybecause of low execution capacity but also because of lack of domestic financing-1I percent of the budget thatthe Constitution guarantees to the municipalities.

Basic Infrastructure Provision: Roads, Electricity, Telecommunications and Water 31
4.23 Water and sanitation also underexecutes its limited investnent program dramatically. Underexecution atthe Cental Government reached 63 percent in 1995. This reflects the lack of appropriately formulatedinvestent projects, the ngid system of acquisitions, and the discretion of the Mnistry of Finance in transferringresources to the corresponding sector agencies. Only the social funds have speeded up investment execution inwater and sanitation services. The average time for formulation and approval of projects is 6 months inFONAPAZ and FIS, and 2 months in FSDC. This is far better ftan the average of one year needed by INFOM.
4.24 The institutional frmework has been widely .-dispersed for several decades, on top of which he Government created in 1985 COPECAS, or aPermanent Conmission for Coordinating Water and .i. X. i Sanitation. It was composed of INFOM, UNEPAR, c .. 1hn -&DSM, SEGEPLAN and ENPAGUA, but its role in b:* - n c;practice was almost nil. As a frst step, in May 1997 e dthe current administration reshuffled the institutional . i t t setup by: (i) approving the document Politicas y OXh; X H " (is) 'Estrategias del Sector Agua Potable y Saneamiento; -- w(ii) delegating to INFOM the management of its .............imnplementation, including the execution of water and ....i.......
sanitation programs and projects, and the . l. a .ieu, bcoordiation of financial and technical assistance with diline ministries, social funds and other institutions, (iii) e s aayadopting an unique model Agua: Fuente de Paz, forthe rural sector; and the role of EMPAGUA for Guatemala City; (iv) preparing the phasing-out of UNEPAR andPAYSA, while transfering their functions to INFOM; and (v) considering the creation of a Ministry of NaturalResources under the proposed draft- Law of the Executive.
4.25 Some concerns remain regarding the capacity of the new institutional setup to solve problems:* Sector reform is no longer in the hands of the Executive, since management of the sector reforms will also
rest with INFOM. International experience shows, however, that separating the water and the sanitationregulatory functions is not adequate from technical and social points of view, since it leads to unnecessaryinstitutional overlaps in an already messy institutional framework. SRH, Ministry of Health, INFOM and apossible Ministry of Natunal Resources would have close or similar mandates in the sector.
* INFOM is not fully empowered by the Govenmment, neither is it supported by the necessary financialresources to undertake this new task. It also requires complete re-engineering, since its actual projectbuilding capacity is estimated at 100-150 water projects per year, well below what is needed;
* The draft water law will face a difficult approval process.* The program Agua: Fuente de Paz (Box IV.2) lacks enough financial resources, which could slow down its
implementation.
4.26 Recommendations. To deal with such problems, the following actions are recommended:* Under the NSPI the completion of a water and sanitation sector strategy and policy should be
concentrated in just one agency (Ministry of Naturl Resources or INFOM). Such a strategy shouldexplicitly consider the power and budget required by the agency to effectively govern and administer thesector. It also needs the following normative functions: (i) a new water law, (ii) a national tariff policy (thecurrent administation has planned to set a proposal for a national program of tariffs based in actual costsand to cover operational costs and a portion of investnent), perhaps based on a reglamento municipal
32 Basic Infrastrucure Provi on
previously agreed with local authorities; (iii) adequate supervision of its implemeon; (iv) establish criteriafor and supvise the quality of water and sanitation services nationwide; (v) the formulation of the sectorinvestnent program with clear responsibilities for each entity involved, and (vi) diferent water policies forurban conglomeates, than for ruraL small and dispersed populations.
* INFOM should be totally re-engineered to become the matn regulator and provider of financial andtechnical assistance to the sector. INFOM has already started some work in this direction. In the short-run,however, the Agua, Fuente de Paz program seems to be a promising and appropriate approach, under co-shared responsibilty with the social funds, municipalities and local groups.
* Local capacity building and cnmunity participation for the municipalities will be essential elements if theyare to effectively administer and operate water supply systems. INFOM should provide prompt financal andtechnical assistance, technology transfer and training to municipalities.
* The on-going phasing out of UNEPAR and PAYSA should be completed, but without losing some of thirskills in promoting low-cost mral technology solutions: wells, boreholes, handpumps and latines.
* Most of Agua Fuente de Paz functions, as well as JNFOM's key bottlenecks (preinvestment and the designof aqueducts), should be subcontracted with the private sector.
0

TECHNICAL ANNEXES
ANNEX 1: The PIP and the Macreoeconomic FrameworkANNEX 2: The Budget: Terminology and ConceptsANNEX 3: Investment Programs in InfrastructureANNEX 4: Recent Legal ChangesANNEX 5: Water and Sanitation: The Institutional Nightmare
STATISTICAL APPENDIX


ANNEX 1Page 1 of 2
The PIP and the Macroeconomic Framework
Two medium-term scenarios are developed to illustrate alternative fiscal outcomes which theGovernment could face in financing the PIP, while preserving a stable macroeconomic framework. A HighCase Scenario estimates the requirements necessary to meet the targets in the Peace Accords under a veryactive policy stance. A Base Case Scenario illustrates the implications of pursuing a more passive policystance, with the Government being able to meet the Peace Accords conunitments only partially.
Policy Framework
Under the High-Case Scenario, the Government implements a policy framework that favorsmacroeconomic stability and rapid growth, while pursuing key structural reforms and meeting allquantitative peace targets. To reach a target 6 percent economic growth rate by the year 2000 the keyassumptions are:* a significant increase in domestic savings of about 2.4 percent of GDP between 1996 and the year
2000-mainly through an increase in tax revenues from 7.9 percent of GDP in 1996 to 11.4 percent in2000-necessary to finance peace-related incremental expenditures;
* increased public savings also result from the timely adjustment of public utility rates-mainlyelectricity;
* a sharp decline in domestic debt by allocating disincorporation proceeds to pay off both the floatingdebt and bonded domestic debt with the Central Bank, contributing to lower domestic interest rateswhich would stimulate investment and growth;
- adequate and timely availability of external financing to complement the domestic revenue mobilizationeffort; and
- a gradual build up of international reserves to about 3 months of imports through improved exportperformance, increased external assistance to finance peace expenditures, and increased foreigninvestment flows attracted an improved policy framework and sustained economic recovery.
Under the Low-Case Scenario, the Government is not able to fully implement major structuralreforms, leading to lower domestic resource mobilization and external assistance. Efforts to meet peaceexpenditure targets, which combined with insufficient tax revenues, would exert fiscal pressures and wouldlikely translate into continued growth in the stock of domestic debt (including Central Bank losses). Themain assumptions are:* Domestic savings are lower than expected because the Government is unable to reach the target tax
ratios set in the Peace Accords; disincorporation of public enterprises is postponed; public utility ratesare not adjusted; and the modernization of the state moves slowly;
* domestic interest rates remain high, dampening private domestic investment and growth; growth wouldaverage 4.5 percent during 1998-2000.
* external financing is assumed at one-half of the projections in the High Case Scenario, as officialassistance to finance the PIP faces absorption problems due to low execution levels and lirnitedavailability of domestic counterpart financing; and
* international reserves remain stable throughout the period, but at a low level of 2.4 months of imports.
Results
Table Al summarizes the main results of the projections for both scenarios. In the High-Case,commitments made under the Peace Accords are met. The results of this scenario would clearly hinge onthe Govemment's ability to increase the tax burden to agreed levels, successful privatization, adjustmentsin utility tariffs and a significant improvement in the public sector's execution capacity. As a result,

ANNEX 1Page 2 of 2
* Total investment increases from 13.9 percent of GDP in 1996 to 16.4 percent in 2000, as a result ofhigher private and public investment levels.
* The nonfinancial public sector (NFPS) balance rises from 0.6 percent of GDP in 1996 to 2.4 percent ofGDP in 2000.
* To complement the considerable fiscal effort embodied in this scenario, Guatemala disbursements ofexternal assistance to finance the PIP would amount to about $1.4 billion during 1997-2000 (about$346 million per year, more than twice its present level).
* The impact of the increased external financing on Guatemala's external debt would be manageable,provided the High-Case Scenario projections for strong export and GDP growth materialize. Underthese assumptions, the debt service ratio actually drops from 9.7 percent of GDP in 1995 to 6.7 percentin 2000. Total external debt to GDP also declines from 19.9 percent of GDP in 1996 to 15.6 percentin 2000.
In the Low-Case Scenario, the conmnitments made in the Peace Accords are only partially met.* Total investment remains flat at around 13.7 percent of GDP, leading to low average growth of about
4.5 percent per year.* The nonfinancial public sector (NFPS) balance drops from a surplus 0.6 percent of GDP in 1996 to a
deficit of 0.3 percent in 2000, due to slow progress on the tax front and the inability to raise publicutility rates.
* There is still significant support from the international community to help implement the Peace Accordsbut at a level commensurate with the weak fiscal effort and domestic capacity to finance the peace-related programs. External disbursements to finance the PIP during 1997-2000 would amount to $803million (or about $200 million per year). This is roughly one-half of the resources assumed under theHigh Case.
* Due to weak export-performance and modest economic growth, the current account deficit deterioratesmore than in the high-case scenario, peaking at 3.5 percent of GDP in 1999.
Table Al Peace Investment and Macroeconomic ConsistencyLow Case -Hilh Case
Growth and Inflation _
GDP growth (%/o) 4.9 3.1 4.0 4.5 4.5 4.5 3.1 4.5 5.0 5.5 6.0Inflation (%) 8.4 10.4 9.5 10.0 9.0 8.0 10.4 9.5 11.0 10.0 9.0National Accounts/o of GDP) _==_
Total Investment 14.9 13.7 13.4 13.5 13.5 13.6 13.7 14.2 14.5 15.5 16.4Private ivestment 12.4 11.2 10.8 10.9 10.7 10.6 11.2 11.4 11.6 12.2 12.6Public Investment 2.5 2.5 2.6 2.7 2.7 2.9 2.5 2.8 2.8 3.3 3.7Total Savings 14.9 13.7 13.4 13.5 13.5 13.6 13.7 14.2 14.5 15.5 16.4National Savings 10.9 10.9 10.5 10.3 10.0 10.5 10.9 11.5 11.8 12.5 13.4External Savings 4.0 2.9 2.9 3.2 3.5 3.1 2.9 2.7 2.7 3.0 3.0Flscal Accounts (% of GDP)Tax Burden 7.7 8.4 8.4 8.8 9.0 9.1 8.4 8.6 10.0 11.0 11.5NFPS Savings 2.9 3.6 3.4 3.5 3.6 3.7 3.6 3.0 4.6 5.7 6.6NFPS Balance 0.0 0.6 -0.1 -0.2 -0.3 -0.3 0.6 -0.2 0.5 1.8 2.4Central Government Balance -0.6 0.0 -0.8 -0.7 -0.4 -0.1 0.0 -0.1 0.4 1.8 2.6Restof NFPS* 0.6 0.6 0.7 0.5 0.1 -0.1 0.6 -0.1 0.0 -0.1 -0.2NFPS Recurrent Expenditr 8.8 8.8 9.1 9.1 9.0 8.8 8.8 8.9 8.9 8.7 8.2Official MLT Ext. Loans ($m) 183.2 132.9 163.6 229.7 264.4 145.1 132.9 258.3 350.3 399.7 377.9Extemnil Sector I _
Cufent Acc. Def. (%of GDP) 4.0 2.9 2.9 3.2 3.5 3.1 2.9 2.7 2.7 3.0 3.0Gross Reserves (m./imports) 1.9 2.4 2.5 2.4 2.4 2.3 2.4 2.7 2.9 2.9 3.0Debt Sevice Ratio (%) 11.9 9.7 8.4 8.4 8.0 6.4 9.7 8.4 8.6 8.1 6.7External Debt(% of GDP) 22.2 19.9 17.5 16.0 15.0 13.5 19.9 18.3 17.3 16.4 15.6* Operating surplus of nonfinancial public entrprises (GUATEL, INDE and IGSS) . Source: LUpez-Cilix and Shepherd (1997b)

ANNEX 2Page 1 of 1
The Budget: Terminology and Concepts
A number of difficulties arise in analyzing public expenditures in Guatemala due to differences interminology and classifications.
First, differences in terminology often obscure the analysis of public expenditure patterns:+ Gastos causados or realizados include effective payments (reported in the quarterly expenditure
liquidation) and the bills unpaid by the State (floating debt).* Gastos corrientes, gastos de funcionamiento and gastos recurrentes have the same meaning; for
practical purposes, they are those whose destination and amount is realized on a regular or recurrentbasis, e.g., wages and salaries and interests.
* Liquidacion de gastos is a process in which contractual or binding appropriations are examined vis-a-vis registered expenditures to determine the level of budget execution. It is a quarterly procedure, withan annual liquidation, containing the effective payments reported to the central authorities and externalofficial agencies.
Second, the registry of capital investment by categories of expenditure is not made uniformly forthe different sectors: e.g., in some exceptional case, repairs of equipment are registered as capitalexpenditures, while in most cases these appear under current expenditures. Most notably, depreciation offixed assets is not computed regularly at the end of fiscal year, e.g., the value of a Ministry building isshown in the books at its original purchase value.
Third, by definition, the budget system only counts investments in physical infrastructure asactual investment. In practice, however, the classification not only depends of the nature of outlays(physical or financial capital), but also of the modality of execution. All activities included under a specificproject (such as those of the social funds) are classified as investment, although they may include little orno traditionally-defined capital expenditures (such as literacy campaigns). In addition, these "investment"costs also include recurrent costs associated with projects, such as salaries and administration.Expenditures on textbooks, teaching materials or teacher training (which by definition are human capitalinvestment) are registered as either investment or recurrent expenditures depending on who is executingthem.
Fourth, since the Government includes gross amortization on medium and long-term debt as partof its budgeted outlays, amortization appears in government accounts as an expenditure item. Followingbudgetary and national accounts conventions, this report classifies amortization below the line as part ofnet financing of the budget. Thus, aggregate public expenditure figures in this report are lower thanofficial estimates. Rollover of short-term debt (less than one year) is also not classified as budgetexpenditure, in line with IMF convention.


ANNEX 3Page l of 3
Investment Programs in Infrastructure
ENERGY
TABLE A3.1 INVESTMENT PROGRAM IN ELECTRICITY(USS '000)
_~. '
PROJECTS c - T ocl .n . TOTMajor rehabilcnHydro generation 3500 2200 5700 3000 7500 10500 200 800 1000 0 0 0
Substations 2700 3000 5700 2500 3300 5800 1300 3400 4700 0 0 0Lines 10000 1200 11200 7000 01 7000 5500 I 0 5500 o0 0 °°
New Works/Distrib _
Substation & feeders 600 1400 2000 600 1400 2000 600 1400 2000 400 1000 1400Secondary network 390 2600 6500 4200 2800 7000 4500 3000 7500 4800 3200 8000
TrasnilssloD/230kVMexico interconnect 0 0 0 3600 4200 7800 4500 5300 9800 900 1100 2000To cornect generation 0 0 0 1300 1500 2800 0 0 0 3100 3600 67000
Other 230 kV works 2000 2000 4000 0 0 0 3000 3000 6000 10000 10000 20000
Trsansmssion/69 kV _ _To comect generation 400 500 900 350 350 700 400 400 800 350 350 700Other 69 kV works 1000 1000 2000 0 0 0 1000 1000 2000 1000 1000 2000Rural Electrifcation 0 0 015000 15000 30000 15000 15000 30000 15000 15000 30000
TOTAL 24100 13900 38000 37550 36050 73600 36000 33300 69300 35550 35250 70800
FINANCING _Cudomers 5000 0 5000 5500 0 5500 6000 0 6000 6500 0 6500INDE 0 0 0 0 0 0 0 0 0 0 0 0
FONAPAZ 0 O0 015000 15000 30000 15000 15000 30000 12000 15000 2700
Multilateral 0 O0 0 5000 6000 11000 8500 9300 17800 15000 1 5500 30500
Goverment 19100 13900 33000 12050 15050 27100 6500 9000 15500 2050 4750 6800
PROJECTS e . . Loeal t. A Ia . A L.a. e.ADistribution
Substation and feedds 600 1400 2000 600 1400 2000 600 1400 2000 400 1000 1400
Secondary network 3900 2600 6500 4200 2800 7000 4500 3000 7500 4800 3200 8000
Tranmiton
230 kV 1750 1750 3500 2500 2500 5000 2500 2500 5000 2500 2500 50069kV 1100 1100 2200 350 350 700 400 400 8OO 350 350 Too-
TOTAL 7350 6850 14200 7650 7050 14700 8000 7300 15300 8050 7050 15100
FINANCINGCustomers 5000 0 5000 5500 0 5500 6000 0 6000 6500 O0F 6500
EEGSA O O 0 0O 0 O 0 0 0 0 0 0Others 2350 6950 9200 2150 7050 9200 2000 7300 9300 1550 7050 8600

ANNEX 3Page 2 of 3
TELECOMMUNICATIONS
TABLE A3.2 INVESTMENT PROGRAM OF GUATEL, 1996-1997(USS '000)
MetropoIitantelecommunications - 88,105 88,105 7,883 7,880First metropolitan expansion - 20,797 20,797Interconnection and infrastr. for metropolitan telecom. 1,753 36,246 37,999Central Amencan Regional Network - 4,292 4,292Expansion suburban and metropolitan areas - 45,685 50,646 8,506 8,506Rural telephony via VSAT - 13,210 13,210 77 77National digital transmission network _ 10,393 10,393 574 574
Second expansion suburban and metropolitan areas - 6,323 6,323 13,300 13,300Expansion of services in Escuintla and Coatepeque - 19,778 19,778 10,802 _ 10,802Expansion of departmental plants 2,595 55,430 58,025 24,382 24,382Phase II of expansion of departmental plants 4,161 4,161 16,878 1 16,878Rural telephony, Phase IV 9,212 9,212 1,897 1,897Alternative route to Honduras, West and North 55,157 55,157 13,091 13,091
West interurban plant 180 1,021 1,201 665 665Aerolux 1,115 1,115205,000 lines of external plant 12,795 72,505 85,300Contel 161 161Tubofort T 463 463Sistec 630 630Iiplementation services Esquipulas plant 140 140 2,330 2,330Fifth project of metropolitan telecommunications 1,123 6,362 7,485 8,152 8,152National optical fiber network (SDH) _ l_L_l_l _ 17,856 17,85650,000 lines in metropolitan area l_l_l _ 123 1,660 1,783Acquisition of 6,000 public card-operated public teleph. 163 163Acquisition of land 328 328Expansion of Quetzaltenango plant 1,952 1,952Expansion of metropolitan network 295 295Execution and supervision division 5,043 5,043Design external plant 603 603Installation department 251 251Administration and project control department 196 196Corporate building 492 492Relocation of departments 309 309External plant emergency unit 2,475 2,475Synchronization project 33 33Complementary projects 6,930 6,930Guatemala's intelligent network 1,721 1,721Expansion of international centrals _ 246 246
Access system 1,640 1,640System for managing users network 266 266System for managing telecommunications network 1,332 1,332Cellular mnobile telephony 227 227Rural telephony, phase III 82 82Channeling and posting section - 1,896 1,896Metropolitan installation section _ 1,078 1,078Drawing services 374 374Regional maintbuilding for Quetzaltenango and Zacapa 654 654
TOTAL

ANNEX 3Page 3 of 3
ROADS
TABLE A3.3 ZONAPAZ: MAIN ROADS INVESTMENT PLAN FOR 1997-2000(Quetzales)
Long. Inversi6n Inversi6n Inversi6n Inversi6n InversionPROYECTO Kns. 1997- 2000 1997 1998 1999 2000
RN 19, Sanarate - Jalapa (P) 46.00 88,818,763 40,000,000 30,000,000 18,818,763Los Encuentros - 4 Caminos (R) 54.35 40,000,000 40,000,000 -
Pachalun - Pachalin 31.00 18,600,000 6,232,760 7,440,000 4,927,240(Camino de Acceso) (P) ICA-01 Santa Clara la Laguna 15.00 9,000,000 6,300,000 2,700,000(Camino de Acceso) (P)Chiantla - Paquix (Camino de 20.00 12,000,000 7,200,000 4,800,000Acceso) (P)San Marcos - Tejutla (Camino de 31.00 18,600,000 6,042,818 7,440,000 5,117,182Acceso) (P) I _I_I_I_I
San Francisco el Alto - 16.00 10,733,970 7,853,970 2,880,000Momostenango (Camino deAcceso) (P)
Total 21335 197,752,733 113,629,548 55,260,000 28,863,185 J
ESTUDIOS DE INGENIERIA ENEJECUCIONRD 7, Cobin-Chisec-Xuctzul (P) | 75.00 | 2,086,067 1 2,086,067 | - [ -
ESTUDIOS DE INGENIERIA PENDIENTE DE INICIOSan Pedro Jocopilas - Nebai (P) 75.00 4,529,250 4,529,2507W, Chiantla-Sacapulas-Santa 168.00 10,584,000 10,584,000Cruz Verap-az (P)San Pedro Carcha-Fray Bartolom6 103.00 5,940,000 5,940,000de Las Casus (P)
Total 346.00 21,053,250 21,053,250 -
OBRA CIVILAINICIAR EN 1997RN 15, San Pedro Jocopilas- 90.00 85,602,834 22,193,327 31,176,341 32,233,166Nebaj (r)RD 7, Cobdn-Chisec-Xuctzul (R) 89.00 87,601,974 22,711,622 43,260,235 21,630,117Cuatro Caniinos-Totonicapin (R) 13.00 15,600,000 9,828,000 5,772,000San Juan Ostuncalco-San -Muarc 35.00 42,000,000 30,870,000 11,130,000tR)
Total 227.00 230,804,808 85,602,949 91,338,576 53,863,233 1
ESTUDIOS DE INGENIERIA EN GESTIONCA-OI Occ., Cuatro Caminos - 71.00 2,270,789 2,270,789 -
Hudhetenango (R)CA-OI Occ., Huhetlnngo - La 82.74 2,646,268 2,646,268Mesilla (R)RN 19, Jalapa - Sanarate (R) 41.58 1,330,560 1,330,560 .CA-14, El Rancho - LaCumbre - 131.12 4,195,840 4,195,840 _Coban (R)San Pedro Carchi - Fray 103.00 5,150,000 5,150,000Bartolom6 de Las Casas (R) I
Total 429.44 15,593,457 15,593,457 - - I
PROYECTOS DE OBRA CIVIL EN GESTIONCA-01 Occ., Cuatro Caminos - 153.79 154,100,000 - 61,640,000 61,640,000 30,820,000La Mesilla (R) l l l_l____CA-14, E Ranho-La Cumbre- 131.12 101,847,548 - 50,000,512 32,072,820 19,774,216Cobin (R)7W, Sacapulas-Satda Cz 105.00 150,000,000 - - 75,000,000Verapaz (R) _ ______ |_ 75,000,000Caminos Rurales San Marcos (R) 85.00 60,000,000 - 15,000,000 2718,000,000San Pedro Carcha - Fray 103.00 92,700,000 37,080,000 55,620,000Bartolom6 de Las Casas (P)
Total 577.91 558,647,543 - 163,720,512 251,332,820 143,594,216Note: P--Pavimentaci6n; R=Rehabilitaci6n


ANNEX 4Page 1 of 2
Recent Legal Changes
The New Electricity Law
In October of 1996, the Congress of Guatemala approved the new Electricity Law (Ley General deElectricidad). Its main features are:* It separates the policy setting function from regulation and from operation. The first function is reserved for the
Ministry of Energy, the second for the Regulatory Commission (CNEE) and the last for the utilities (which canbe privately owned).
** CNEE becomes the technical arm of the Ministry.' It has functional independence and its own budget andincome (it levies a fee on the utilities that operate in the sector). Its three members are appointed by thePresident of the Republic from three sets of three candidates each, one set proposed by the Council of UniversityPresidents, another by the participants in the Wholesale Market (all participants in the operation of the sector),and the third by the Minister of Energy. The Commissioners will serve for five years2 and can only be removed(presumably by the President) due to negligence or to demonstrated noncompliance of their obligations. Themain functions of CNEE are: (i) protect the rights of customers and prevent actions which limit competition; (ii)set transmission and distribution tariffs in those cases where these tariffs are subject to regulation; (iii) settledifferences between participants in the sector; and (iv) issue regulations and technical norms.
* The Law requires the unbundling into separate companies of existing and future utilities by area of activity(generation, transmission and distribution), but does not require the privatization of existing assets.EEGSA's two thermal generation plants are being disincorporated, for which no special legislation isneeded, but the privatization of INDE's assets might require additional legislation.
* No permit or authorization (with some exceptions) will be required for thermal power stations. Authorizations(granted by the Ministry of Energy) will be required for the study and use of natural resources (hydro,geothermal), as well as for nuclear energy and for transmission and distribution. The authorization for theconstruction and operation of a generating plant or transmission line would be requested by the interested partyand the Ministry would then publish their request in the local newspapers. If no other party is interested, itwould be awarded. Otherwise, a public tendering process would be used. For distribution, a public tenderwould always be required. Authorizations would not be for exclusive rights and would last a maximum of 50years.
+ For generation, the Law stipulates competition in a 'Vholesale Market" to be established. It would in essencebe an independent system operator that will oversee the operation of a wholesale and spot market. The lawentrusts it with the following functions: (i) coordinate least cost system operation and dispatch; (n) define spotprices; and (iii) guaraktee system secunty and supply.
* In the distribution area, there is the obligation to serve anyone who requests service and who is located within200 meters from where the distribution lines end. Companies engaged in supply to final consumers mustdemonstrate that they have contracted with generation companies for at least two years. The contracts shall bethe result of public bidding.
* Tariffs for the final consumer will be set for a period of 5 years. They will include an automatic adjustmentformula (details are left to the Reglamento which will define the variables to be included in the formula, as well
1 Originally, the CNEE was proposed as an autonomous institution, which would have given it more independence from theMinistry of Energy. However, it requires a two thirds majority in Congress, which could not be secured. As a second best, theGovernment opted for a commission which is part of the Ministry. However, the matner in which the commissioners areappointed and in which they can be removed limits significantly the discretion of the Mnister. Given the fact that theCommission will not depend on the Ministry for its budget and that the Minister will not directly appoint or remove theCommissioners, it certainly has been granted more independence than other commissions that operate in Latin America.2 All terms end simultaneously, thus affecting the continuity of CNEE policies, but its members can be reappointed.

ANNEX 4Page 2 of 2
as the mechanism for their application and penalties). Tariffs will be reviewed before the five year period if theirvalue (due to automatic adjustments) exceeds three times the original value. The Law exempts tariffs fromcompliance with Article 1520 of the Civil Code (which requires Presidential approval and has been the basis forall the challenges in the Courts).
* Regulated tariffs include: (i) short term transfers that are not part of a contract (spot prices); (ii) wheelingcharges for the use of transmission and distribution lines when the affected parties have failed to reach anagreement between them; and (iii) tariff for final users who do not meet the requirements to be classified as alarge consumer. Tariffs to large consumers are not regulated. The regulated tariffs for final users who are notclassified as large consumers will be derived by adding generation costs (the result of a public bid), wheelingcharges and distribution costs (based on the value-added methodology and assuming an ideal and efficientdistribution network). Cross subsidies are prohibited by the Law.
There are important transient articles in the Law that address the following: (i) the first Regulatory Commission wasto be in operation by April 1, 1997-at most ten days after the Law is effective-and while the Commission startsoperation, a Committee (with representatives from INDE, EEGSA and the Engineering Association) will be set up todefine the tariffs that will apply until the Commission issues its first ruling on tariffs; (ii) by May 15, 1997 theCoommission must have issued its first tariffs, following the methodology specified in the Law; (ii) INDE shallseparate itself into different companies in at most one year after the Law is effective; (iv) within 90 days after itseffectiveness, the Reglamento of the Law must be issued; and (v) the Wholesale Market must be in operation withinsix months after the Law is effective.
The New Telecommunications Law
The new Telecommunications Law (Ley General de Telecomunicaciones, Decreto Nuimero 94-96) waspublished on November 18, 1996. A notable and innovative feature is that it opens the sector to full competitionfrom day one. The Law also creates a Superintendency to oversee the granting of licenses for the use of the radiofrequency spectrum, to manage the Telecommunications Registry, and to solve disputes among operators. Inparticular:* The new Law opens the sector to full competition, deregulates prices, with the exception of essential resources:
access to the network signaling, billing data, phone directory information, calling party identification number,telephone number. In those cases, the Superintmdency could fix the price if there is no agreement betweenparties, according to long term marginal cost price principles.
* The Law establishes a Register and obliges all commercial operators to register. Operators must interconnectwith other operators. Disputes among operators could be solved by the Superintendency through external expertopinion.
* The Radio Frequency spectrum is divided into 3 parts: regulated, reserved. (for Government use) and radioamateur use. Regulated spectrum is by definition all the spectrum that is not of the other 2 categories and willbe granted through auctions organized by the Superintende.
* The Superintendency is defined as a technical entty of the Ministry of Communications, Transport and PublicWorks. The Superintendent, appointed by the Minister, will have the legal representation of the entity, and willoperate on a budget ceiling of 5 percent of the operating fund (Fondo Privado) constituted by 30 percent of theproceeds ofthe spectrum auctions, up to Q.250 million.
* The Law fixes the penalties and fines for non-compliance to the Law, and the procedures to appeal.

ANNEX 5Page 1 of 1
Water andSanitation: The InstitutionalNightmare
Water and sanitation is affected by lack of coordination and overlapping roles and functions. This is theresult of a multitude of institutions and organizations which operate in the sector at the national, regional,departmental and municipal levels, as well as NGOs and international donors:
At the planning and coordination level, the main institutions are: the Vice-presidency of the Republic,the Ministry of Health (MSPAS), the General Secretariat of Planning (SEGEPLAN), the Secretariat of Hydro-electric Resources (SRH), the National Commission for the Environment (CONAMA) and the social funds.
The execution of investment and maintenance is the task of the following institutions:
* Rural Areas: UNEPAR, the MSPAS unit presumably in charge of the national plan of rural water; DSM,the sanitation unit in MSPAS which is in charge of PAYSA (the water and sanitation program for theAltiplano); the social funds: FONAPAZ (in charge of the program Water, Source of peace), FIS andFSDC; municipalities; and NGOs.
+ Urban Areas: INFOM, Institute for Municipal Promotion; DGOP, General Directorate of Public Works;and municipalities.
* Metropolitan Area: EMPAGUA, Guatemala City Municipal Water Corporation; Aguas Mariscal (private);and other (small) private corporations that supply water with trucks.


BIBLIOGRAPHY
Arguello, Alejandro and Frank Vannini (1996), "Guatemala Public Investment Review, Analisis de los Fondos Sociales",Consultant's Report to The World Bank.
Acefia, Maria del Carmen (1996), "Guatemala Public Investment Review, Anrlisis del Sector Educaci6n," Centro deInvestigaciones Econ6micas Nacionales -CIEN-.
Banco de Guatemala (1996), "Evaluaci6n de la Actividad Econ6mica y de los Resultados de la Politica Monetaria, Cambiaria yCrediticia durante 1996," Guatemala City.
Caraballo, Joaquin (1996), "Guatemala Public Investment Review-Highway Sector," Consultant's Report to The World Bank.
Chinchilla, Ligia (1996), "Revisi6n del Sistema de Programaci6n de Inversiones: Sector Salud," Consultant's Report to TheWorld Bank-SEGEPLAN-GTZ.
Cosenza, Luis (1996), "Guatemala Public Investment Review-Power Sector," The World Bank.
Femnandez, Carlos (1996), Guatemala Public Investment Review: Informe de Cambio sobre el Sistema de Tnformaci6n deInversion Publica de Guatemala," Consultant's Report to The World Bank.
Gobierno de Guatemala, (1997), "Programa de Paz: La Oportunidad de Guatemala," Bruselas.
, (1996), "Programa de Gobiemo 1996-2000", Guatemala City.
Huppi, Monica (1991), "Guatemala: Social Sector Expenditure", mimeo.
L6pez-Calix, Jose and Jorge Shepherd (1997a), "Interest Savings on Public Domestic Debt from GUATEL's Disincorporation",mimeo, The World Bank, Guatemala City.
(1997b), "Unified Survey," mimeo, The World Bank, Washington, D.C.
Marques, Jose (1996), "Guatemala Public Investment Review-Macroeconomic envelope", Consultant's Report to The WorldBarnk.
Ministerio de Finanzas (1997), "Las Finanzas Publicas durante el Ejercicio Fiscal 1996", Guatemala City.
Ochoa, Francisco (1996), "Analisis Sector de Agua y Saneamiento", Consultant's Report to The World Bank.
Pradhan, Sanjay (1996), "Evaluating Public Spending", World Bank Discussion Paper No.323, The World Bank,Washington, D.C.
Rodriguez, Carlos A.(1994), "Interest Rates in Latin America", LAC hnternal Discussion Paper, The World Bank,Washington, D.C.
RUTA SOCIAL (1996), "Guatemala, El Gasto Social y su Eficiencia", Guatemala City.
SEGEPLAN (1997), "Balance General de las Politicas Econ6micas y Sociales 1996", Guatemala City.
Urizar, Carmen and Vidal, Eloy (1996), "AnAlisis del Sector de Telecomunicaciones", Consultant's Report to The World Bank-CIEN-SEGEPLAN-GTZ.
World Bank (1997), "PAD on a Proposed Loan for a Private Participation in Infrastructure," Washington, DC.
(1996), Building Peace with Rapid and Eauitable Growth, Washington, DC.
(1989), Guatemala: Public Sector Expenditure Review, Washington, DC.
Zufiiga, Alberto (1996), "AnAlisis de los Fondos de Inversi6n Social", Report to The World Bank-SEGEPLAN-GTZ.


STATISTICAL APPENDIX
Table 1 Guatemala: Growth and InvestmentTable 2 Guatemala: Combined Public Sector Expenditures, 1984-96 (Million of
Quetzales)Table 3 Guatemala: Combined Public Sector Expenditures, 1984-96 (As percent of GDP)Table 4 Guatemala: Combined Public Sector Expenditures, 1984-96 (Million of 1992
Quetzales)Table 5 Guatemala: Total Expenditure of Central Government by Sector (Million of
Quetzales)Table 6 Guatemala: Total Expenditure of Central Government (% of GDP)Table 7 Guatemala: Total Expenditure of Central Government (Million of 1992 Quetzales)Table 8 Guatemala: Total Expenditure of Central Government (% of Total Current
Quetzales)Table 9 Guatemala: Capital Expenditures of Central Government by Sector (Million of
Quetzales)Table 10 Guatemala: Capital Expenditures of Central Government (% of GDP)Table 11 Guatemala: Capital Expenditures of Central Government (Million of Quetzales)Table 12 Guatemala: Capital Expenditures of central Govermnent (% of Current Quetzales)Table 13 Guatemala: Programmed and Actual Expenditures of the Central Government
(Million of Quetzales)Table 14 Guatemala: Financial Situation of Selected Non-financial EnterprisesTable 15 Guatemala: Financing of Public Capital Expenditures, 1995-96Table 16 Guatemala: Public Fixed Investment (Million of Quetzales)Table 17 Guatemala: Composition of Public Fixed InvestmentTable 18 Guatemala: Level of Fixed InvestmentTable 19 Guatemala: Programmed and Effective Official Loan DisbursementsTable 20 Guatemala: Official DisbursementsTable 21 Guatemala: Outstanding Public Domestic DebtTable 22 Guatemala: Outstanding Public External DebtTable 23 Central Government Bonded Debt MaturitiesTable 24 Social Funds: Social Investments in 1996


Table 1. Guatemala: Growth and Investment% GDP As % of GDP Pub Inv/
Period growth ICOR Priv.Inv. Pub. Inv. Gross Inv
1950-54 2.3 4.9 6.1 2.8 31.91955-59 5.4 3.1 8.7 4.9 35.51960-64 4.9 2.7 7.8 2.5 24.41965-69 5.5 2.5 9.9 2.8 22.61970-74 6.4 1.9 11.4 3.0 21.11975-79 5.4 3.3 15.2 4.4 22.41980-84 -0.2 6.6 8.6 5.6 38.81985-89 2.2 10.1 10.0 2.5 20.11990-94 3.9 2.6 13.2 2.5 16.11995-96 4.0 2.8 11.4 2.3 17.2
1950-59 4.0 3.9 7.4 3.8 33.71960-69 5.2 2.6 8.8 2.7 23.51970-79 5.9 2.6 13.3 3.7 21.81980-89 1.0 8.4 9.3 4.1 29.51990-96 3.9 2.6 12.7 2.5 16.5Sources: Bank of Guatemala and Ministry of Finance.

Table 2 Guatemala: Combined Public Seetor Expenditures, 1984-96(Million of Quetzales)
1984 1985 1986 1987 1988 1989 1990 1991 1992 1993 1994 1995 1996'
Total Expenditure 1539.4 1872.7 2375.9 2830.1 3843.2 4400.3 5996.4 6613.2 8059.0 9943.0 10748 5 12077.0 13022.4o/wTotalnon-debt 1375.2 1439.6 1864.9 2240.2 2943.7 3449.6 4389.9 5027.1 6596.5 8086.0 8273.2 9307.6 9983.9
Recurrent 1186.5 1555.9 2042.6 2413.5 3084.1 3516.9 4839.0 5318.3 6666.6 7827.0 8441 9 9331.6 10047.0Wages & Salaries 595.0 653.4 903.8 1083.8 1276.9 1452.7 1640.0 1944.1 2629,6 3152.3 3377.2 3674.2 3886.2Goods & Services 321.4 336.7 437.7 545.6 707.6 826.2 1074.0 1246.6 1734.2 1765.6 1719.3 2027.1 2193.5Interest& BOG losses 152.5 427.6 487.4 545.9 735.0 761.1 1343.9 1416.0 1386.5 1505.3 1949.4 2015.3 2313.8
Foreign interest 51.3 33.7 74.4 90.0 146.6 189.6 291.4 317.3 384.8 321.6 5392 580.9 597.0Domestic interest 58.8 60.9 182.6 202.8 260.4 274.5 324.5 349.1 376.4 461.0 449.0 592.0 537.9BOGlosses' 42.4 333.0 230.4 253.1 328.0 297.0 728.0 749.6 625.3 722.7 961.2 842.4 1178.9
Other recurrent 117.6 138.2 213.7 238.2 364.6 476.9 781.1 711.6 916.3 1403.8 1396.0 1615.0 1653.5Recurrent (excl. Interest) 1034.0 1128.3 1555.2 1867.6 2349.1 2755.8 3495.1 3902.3 5280.1 6321.7 6492.5 7316.3 7733.2
Capital Expenditures 352.9 316.8 333.3 416.6 759.1 883.4 1157.4 1294.9 1392.4 2116.0 2306.6 2745.4 2975.4o/wCapital (non-financial) 341.2 311.3 309,7 372.6 594.6 693.8 894.8 1124.8 1316.4 1764.3 1780.7 1991.3 2250.7
Revenues 1129.9 1298.4 1856.9 2282.1 2850.4 3230.9 4217.2 5798.2 7261.1 8272.8 8800.0 10980.6 12402.8
Fiscal Surplus/Deficit -350.0 -482.1 -359.3 -419.7 -865.9 -1238.6 -1446.3 -848.1 -22.6 -1442.6 -1950.6 -881.4 -846.1Memo:CurrentGDP 9470.3 1.1180.0 15838.1 17711.1 20545.1 23684.6 34316.9 47302.3 53985.4 64243.5 746692 85016.3 95613.9
CPI(1992=100) 21.4 25.4 34.9 39.1 43.4 48.3 68.2 90.9 100.0 111.8 124.0 134.4 147.9World Bank estimates.
Actual data for the whole period.Source: IMF.
Table 3 Guatemala: Combined Public Sector Expenditure, 1984-96(As percent of GDP)
1984 1985 1986 1987 1988 1989 1990 1991 1992 1993 1994 1995 1996'
Total Expenditure 16.3 16.8 15.0 16.0 18.7 18.6 17.5 14.0 14.9 15.5 14 4 14.2 13.6o/wTotalnon-debt 14.5 12.9 11.8 12.6 14.3 14.6 12.8 10.6 12.2 12.6 11.1 10.9 10.4
Recurrent 12.5 13.9 12.9 13.6 15.0 14.8 14.1 11.2 12.3 12.2 11.3 11.0 10.5Wages&Salaries 6.3 5.8 5.7 6.1 6.2 6.1 4.8 4.1 4.9 4.9 4.5 4.3 4.1Goods& Services 3.4 3.0 2.8 3.1 3.4 3.5 3.1 2.6 3.2 2.7 23 2.4 2.3Interest&BOGlosses 1.6 3.8 3.1 3.1 3.6 3.2 3.9 3.0 2.6 2.3 2.6 2.4 2.4
Foreign interest 0.5 0.3 0.5 0.5 0.7 0.8 0.8 0.7 0.7 0.5 0 7 0.7 0.6Domestic interest 0.6 0.5 1.2 1.1 1.3 1.2 0.9 0,7 0.7 0.7 0.6 0.7 0.6BOGlosses' 0.4 3.0 t.5 1.4 1.6 1.3 2.1 1.6 1.2 1.1 1 3 1.0 1.2
Other recurrent 1.2 1.2 1.3 1.3 1.8 2.0 2.3 1.5 1.7 2.2 19 1.9 1.7Recurrent (excl. Interest) 10.9 10.1 9.8 10.5 11.4 11.6 10.2 8.2 9.8 9.8 8.7 8.6 8.1
Capital Expenditures 3.7 2.8 2.1 2.4 3.7 3.7 3.4 2.7 2.6 3.3 31 3.2 3.1o/w Capital (non-financial) 3.6 2.8 2.0 2.1 2.9 2.9 2.6 2.4 2.4 2.7 24 2.3 2.4
Revenues 11.9 11.6 11.7 12.9 13.9 13.6 12.3 12.3 13.5 12.9 11.8 12.9 13.0
Fiscal Surplus/Deficit -3.7 -4.3 -2.3 -2.4 -4.2 -5.2 -4.2 -1.8 0.0 -2.2 -2.6 -1.0 -0.9Memo: Nettransfers 1.4 1.3 1.5 1.6 2.6 2.8 3.0 1.9 1.8 2.7 2.6 2.8 2.5
World Bank estimates.
Actual data for the whole period.Source: Statistical Appendix, Table 2.

Table 4 Guatemala: Combined Public Sector Expenditure, 1984-96(Million of 1992 Quetzales)
1984 1985 1986 1987 1988 1989 1990 1991 1992 1993 1994 1995 1996'
Total Expenditure 7179.6 7359.2 6817.4 7230.2 8859.2 9106.3 8787.2 7277.1 8059.0 8891.5 8671.0 8983.1 8805.7o/wTotalnon-debt 6413.8 5657.3 5351.1 5723.1 6785.7 7138.8 6433.0 5531.8 6596.5 7230.9 6674.1 6923.2 6751.1
Recurrent 5533.7 6114.3 5861.0 6165.9 7109.4 7278.1 7091.1 5852.3 6666.6 6999.3 6810 2 6941.0 6793.8Wages & Salaries 2775.0 2567.7 2593.4 2768.8 2943.5 3006.3 2403.3 2139.3 2629.6 2818.9 2724.4 2732.9 2627.8Goods& Services 1499.0 1323.1 1255.9 1393.9 1631.1 1709.8 1573.9 1371.8 1734.2 1578.9 1387.0 1507.8 1483.2Interest& BOG losses 711.2 1680.4 1398.5 1394.6 1694.3 1575.1 1969.4 1558.2 1386.5 1346.1 1572.6 1499.0 1564.6
Foreign interest 239.3 132.4 213.5 229.9 337.9 392.4 427.0 349.2 384.8 287.6 435.0 432.1 403.7Domestic interest 274.2 239.3 524.0 518.1 600.3 568.1 475.5 384.1 376.4 412.2 362.2 440.3 363.7BOGlosses' 197.7 1308.6 661.1 646.6 756.1 614.6 1066.8 824.9 625.3 646.3 775.4 626.6 797.2
Otherrecurrent 548.5 543.1 613.2 608.5 840.5 986.9 1144.6 783.1 916.3 1255.3 1126.2 1201.3 1118.1Recurrent (excl. Interest) 4822.5 4433.9 4462.5 4771.2 5415.1 5703.0 5121.8 4294.1 5280.1 5653.2 52376 5442.0 5229.2
Capital expenditures 1645.9 1244.9 956.4 1064.3 1749.9 1828.2 1696.1 1424.9 1392.4 1892.2 1860.8 2042.1 2012.0o/w Capital (non-financial) 1591.3 1223.3 888.7 951.9 1370.7 1435.8 1311.2 1237.7 1316.4 1577.7 1436.5 1481.2 1521.9
Revenues 5269.8 5102.4 5328.2 5830.2 6570.7 6686.3 6179.9 6380.3 7261.1 7397.9 7099.1 8167.6 8386.8
Fiscal Surplus/Deficit -1632.4 -1894.5 -1031.0 -1072.2 -1996.0 -2563.2 -2119.5 -933.3 -22.6 -1290.0 -1573.6 -655.6 -572.1' World Bank estimates.
Actual data for the whole period.Source: Statistical Appendix, Table 2.

Table 3. Guatemala: Total Expenditlre of Central Government, by ector VMWlon of Qetalea)199Q 1991 I992 1993 1994 2995 1996 1997
Sector Actual Actual Actua Acual Actual Actual PreL Budget
Public Debt Management' 1243.9 1298.3 1157.0 1357.5 1779.4 1872.5 2223.8 1874.9Imernal 322.0 346.0 363.5 443.3 426.1 580.3 587.0 516.3Extemal 193.9 202.7 168.2 191.5 392.1 449.8 457.9 367.1BOGlosses' 728.0 749.6 625.3 722.7 961.2 842.4 1178.9 991.5
Administration and General Services 445.8 391.2 691.0 900.5 751.6 1062.3 942.0 1066.0
Detense and Public Order 502.1 661.4 7S5,1 869.1 1008.4 1132.0 1074.3 1214.3
Economic Infrastructure 4 Services 831.3 801.7 1541.9 1491.0 1307.4 1471.8 2232.6 3472.1Roads and Transport 322.5 393.5 5S2.1 498.8 582.6 783.1 1089.7 1456.0Communications 26.2 36.2 44.2 45.9 51.6 49.1 43.9 55.8Energy 30.7 62.0 585.3 398.4 111.0 88.7 114.2 80.9Agriculture and Mining 321.8 161.3 182.5 259.5 313.9 291.4 262.1 334.0Finance. Industry and Others 130.1 148.7 177.8 288.4 248.3 259.5 722.8 1545.4
Social Sectors 1325.0 1700.4 2203.4 2895.2 3100.5 3296.5 3636.2 5517.4Education 564.5 731.3 922.4 1158.0 1346.2 1411.9 1504.6 1991.6Health 31S.0 416.0 525.7 623.5 701.5 750.4 805.7 1564.1Housing and Urban Development 183.4 208.0 298.5 597.8 461.3 534.4 693.4 1136.9Housing; 20.5 13.7 22.1 50.6 23.7 14.2 25.8 n.a.Municipal Works 140.3 175.5 228.7 368.7 368.7 497.8 563.5 n.a.
Community Devel. & Social Services 259.1 345.1 458.8 515.9 591.5 599.8 632.5 824.8
Total 4348.1 4853.0 6380,4 7513.3 7947.3 8835.1 10108.9 13144.7Memo: Central Govemment Deflcit -959.7 -222.7 -510.5 .1207.7 -1362.4 -497.6 -57.4 -110.2
Expenditures by Social Funds 3.7 12.5 47.3 192.5 351.6 395.8 401.4 1000.9CurrentGDP 34316.9 47302.3 53985.4 64243.5 74669.2 85016.3 95613.9 110161.9CPI (1992=100) 68.2 92.2 100.0 111.8 124.0 134.4 149.0 163.9
IMF data for 1990-95. It excludes capital amortization.Estimated IMF figure for 1997.Includes FOGUAVI and other housing subsidies since 1994.
Source: Ministry of Finance.
Table 6. Guatemala: Total Expenditure of Ceatral Government (%6 of RD2'1990 1991 1992 1993 1994 1995 1996 1997
Sector Actual Actual Actual Actual Actual Actual Prel. Budget
Public Debt Management' 3.6 2.7 2.1 2.1 2.4 2.2 2.3 1.7Intemal 0.9 0.7 0.7 0.7 0.6 0.7 0.6 0.5Extemal 0.6 0.4 0.3 0.3 0.5 0.5 0.5 0.3BOG losses2 2.1 1.6 1.2 1.1 1.3 1.0 1.2 0.9
Administration and General Services 1.3 0.8 1.3 1.4 1.0 1.2 1.0 1.0
Defense and Public Order 1.5 1.4 1.5 1.4 1.4 1.3 1.1 1.1
Economic Infrastructure & Services 2.4 1.7 2.9 2.3 1.8 1.7 2.3 3.2Roads and Transport 0.9 0.8 1.0 0.8 0.8 0.9 1.1 1.3Communications 0.1 0.1 0.1 0.1 0.1 0.1 0.0 0.1Energy 0.1 0.1 1.1 0.6 0.1 0.1 0.1 0.1Agriculture and Mining 0.9 0.3 0.3 0.4 0.4 0.3 0.3 0.3Finance. Industry and Others 0.4 0.3 0.3 0.4 0.3 0.3 0.8 1.4
Social Sectors 3.9 3.6 4.1 4,5 4.2 3.9 3.8 5.0Education 1.6 1.5 1.7 1.8 1.8 1.7 1.6 1.8Health 0.9 , 0.9 1.0 1.0 0.9 0.9 0.8 1.4Housing and Urban Development 0.5 0.4 0.6 0.9 0.6 0.6 0.7 1.0
Housing3 0.1 0.0 0.0 0.1 0.0 0.0 0.0 n.a.Municipal Works 0.4 0.4 0.4 0.6 0.5 0.6 0.6 n.a.
Community Dev & Social Services 0.8 0.7 0.8 0.8 0.8 0.7 0.7 0.7
Total 12.7 10.3 11.8 11.7 10.6 10.4 10.6 11.9Memo: Central Govemment Deficit .-2.8 -0.5 -0.9 r.9 -1.S -0.6 -0.1 -0.1
Expenditures by Social Funds 0.0 0.0 0.1 0.3 0.5 0,5 0.4 0.9IMF data for 1990-95. It excludes capital amortization.
2 Estimated IMF figure for 1997.Includes FOGUAVI and other housing subsidies since 1994.
Source: Statistical Appendix, Table 5.
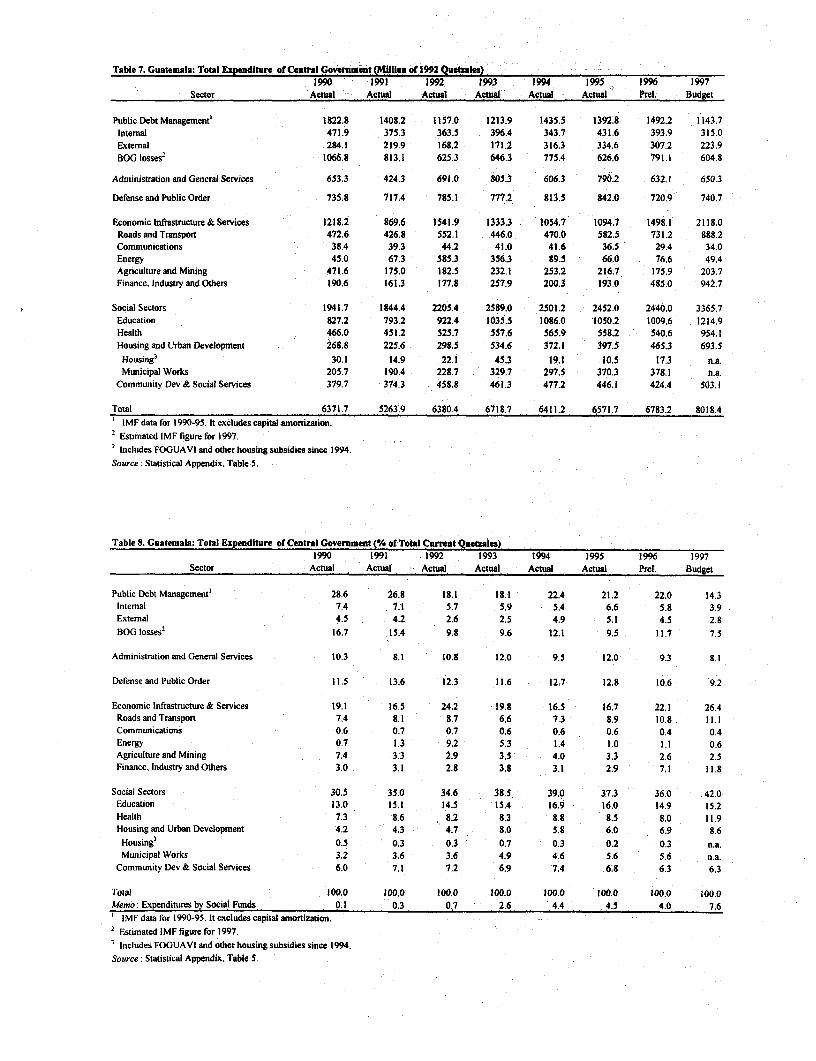
Table 7. Guatemala: Total Expenditure of Central Goviernment (Mllion of 1992 Quetiae)1990 1991 1992 1993 1994 1995 1996 1997
Sector Actual Actual Actual Actual Actual Actual Prel. Budget
Public Debt Management' 1822.8 1408.2 1157.0 1213.9 1435.5 1392.8 1492.2 1143.7Intemal 471.9 375.3 363.5 396.4 343.7 431.6 393.9 315.0Extemal 284.1 219.9 168.2 171.2 316.3 334.6 307.2 223.9BOG losses2 1066.8 813.1 625.3 646.3 775.4 626.6 791.1 604.8
Administration and General Services 653.3 424.3 691.0 805.3 606.3 790.2 632.1 650.3
Defense and Public Order 735.8 717A 785.1 777.2 813.5 842.0 720.9 740.7
Economic infrastructure & Services 1218.2 869.6 1541.9 1333.3 1054.7 1094.7 1498.1 2118.0Roads and Transport 472.6 426.8 552.1 446.0 470.0 582.5 731.2 888.2Communications 38.4 39.3 44.2 41.0 41.6 36.5 29.4 34.0Energy 45.0 67.3 585.3 356.3 89.5 66.0 76.6 49.4Agriculture and Mining 471.6 175.0 182.5 232.1 253.2 216.7 175.9 203.7Finance. Industry and Others 190.6 161.3 177.8 257.9 200.3 193.0 485.0 942.7
Social Sectors 1941.7 1844.4 2205.4 2589.0 2501.2 2452.0 2440.0 3365.7Education 827.2 793.2 922.4 1035.5 1086.0 1050.2 1009.6 1214.9Health 466.0 451.2 525.7 557.6 565.9 558.2 540.6 954.1Housing and Urban Development 268.8 225.6 298.5 534.6 372.1 397.5 465.3 693.5Housing3 30.1 14.9 22.1 45.3 19.1 10.5 17.3 n.a.Municipal Works 205.7 190.4 228.7 329.7 297.5 370.3 378.1 n.a.
Community Dev & Social Services 379.7 374.3 458.8 461.3 477.2 446.1 424.4 503.1
Total 6371.7 5263.9 6380.4 6718.7 6411.2 6571.7 6783.2 8018.4IMF data for 1990-95. It excludes capital amortization.
2 Estimated IMF figure for 1997.i Includes FOGUAVI and other housing subsidies since 1994.Source: Statistical Appendix. Table 5.
Table 8. Guatemala: Total Expenditure of Central Government (% of Total Current Quatzales)1990 1991 1992 1993 1994 1995 1996 1997
Sector Actual Actual Actual Actual Actual Actual Prel. Budget
Public Debt Management' 28.6 26.8 18.1 18.1 22.4 21.2 22.0 14.3Intemal 7.4 7.1 5.7 5.9 5.4 6.6 5.8 3.9Extemal 4.5 4.2 2.6 2.5 4.9 5.1 4.5 2.8BOG losses
2 16.7 15.4 9.8 9.6 12.1 9.5 11.7 7.5
Administration and General Services 10.3 8.1 10.8 12.0 9.5 12.0 9.3 8.1
Derense and Public Order 11.5 13.6 12.3 11.6 12.7 12.8 10.6 9.2
Economic Infrastructure& Services 19.1 16.5 24.2 19.8 16.5 16.7 22.1 26.4RoadsandTranspon 7.4 8.1 8.7 6.6 7.3 8.9 10.8 11.1Communications 0.6 0.7 0.7 0.6 0.6 0.6 0.4 0.4Energy 0.7 1.3 9.2 5.3 1.4 1.0 1.1 0.6Agriculture and Mining 7.4 3.3 2.9 3.5 4.0 3.3 2.6 2.5Finance.lndustryandOthers 3.0 3.1 2.8 3.8 3.1 2.9 7.1 11.8
Social Sectors 30.5 35.0 34.6 38.5 39.0 37.3 36.0 42.0Education 13.0 15.1 14.5 15.4 16.9 16.0 14.9 15.2Health 7.3 8.6 8.2 8.3 8.8 8.5 8.0 11.9Housing and Urban Development 4.2 4.3 4.7 8.0 5.8 6.0 6.9 8.6Housing3 0.5 0.3 0.3 0.7 0.3 0.2 0.3 n.a.Municipal Works 3.2 3.6 3.6 4.9 4.6 5.6 5.6 n.a.
Community Dev & Social Services 6.0 7.1 7.2 6.9 7.4 6.8 6.3 6.3
Total 100.0 100.0 100.0 100.0 100.0 100.0 100.0 100.0Memo: Expenditures by Social Funds 0.1 0.3 0.7 2.6 4.4 4.5 4.0 7.6' IMF data for 1990-95. It excludes capital amortization.2Estimated IMF figure for 1997.
Inclides FOGUAVI and other housing subsidies since 1994.Soutrce: Statistical Appendix, Table 5.

Table 9. Guatemala: Capital Expenditures of Central Government, by Sector (Million of Quetzales)1990 1991 1992 1993 1994 1995 1996 1997
Sector Actual Actual Actual Actual Actual Actual Prel. Budget
Administration and General Services 14.6 43.1 75.7 207.8 133.2 355.5 96.4 147.0
Defense and Public Order 33.8 76.4 54.9 36.0 44.0 130.6 73.7 36.0
Economic Infrastructure & Services 294.6 289.7 997.2 940.4 760.5 904.3 1212.9 2044.5Roads and Transport 174.7 225.5 353.5 383.7 476.9 672.6 996.2 1164.3Communications 0.8 3.5 2.0 6.7 1.6 0.6 0.1 102.7Energy 29.4 2.5 583.4 364.7 94.9 47.7 54.9 0.0AgricultLtre and Mining 67.3 42.4 53.4 117.6 166.4 167.2 157.8 272.3Finance. Industry and Others 22.4 15.8 4.9 67.7 20.7 16.2 4.0 505.2
Social Sectors 244.1 321.4 436.4 777.1 781.6 856.3 1096.6 1955.4Education 35.8 73.1 83.3 90.5 163.3 152.3 163.3 176.2Health 39.8 49.9 73.0 104.5 164.6 181.8 246.1 532.5Housing and Urban Development 16S.1 197.7 279.7 581.6 451.1 519.8 684.2 1246.7
Housing' 20.5 13.7 22.0 50.3 23.7 13.5 25.2 n.a.Municipal Works 140.3 175.5 228.7 368.7 368.7 497.8 563.5 n.a.
Community Devel. & Social Services 0.4 0.7 0.4 0.5 2.6 2.4 3.0 0.0
Total 587.1 730.6 1564.2 1961.3 1719.3 2246.7 2479.6 4182.9Memo: Central Govemment Deficit -959.7 -222.7 -510.5 -1207.7 -1362.4 -497.6 -57.4 -110.2
Expenditures by Social Funds 3.7 12.5 47.3 192.5 351.6 395.8 401.4 1000.9Includes FOGUAVI and other housing subsidies since 1994
Source: Ministry of Finance
Table 10. Guatemala: Capital Expenditures of Central Government (% of GDP)1990 1991 1992 1993 1994 1995 1996 1997
Sector Actual Actual Actual Actual Actual Actual Prel. Budget
Administration and Gen. Services 0.0 0.1 0.1 0.3 0.2 0.4 0.1 0.1
Defense and Public Order 0.1 0.2 0.1 0.1 0.1 0.2 0.1 0.0
Economic Infrastructure & Services 0.9 0.6 1.8 1.5 1.0 1.1 1.3 1.9Roads and TTansport 0.5 0.5 0.7 0.6 0.6 0.8 1.0 1.1Communications 0.0 0.0 0.0 0.0 0.0 0.0 0.0 0.1Energy 0.1 0.0 1.1 0.6 0.1 0.1 0.1 0.0Agriculture and Mining 0.2 0.1 0.1 0.2 0.2 0.2 0.2 0.2Finance. Industry and Others 0.1 0.0 0.0 0.1 0.0 0.0 0.0 0.5
Social Sectors 0.7 0.7 0.8 1.2 1.0 1.0 1.1 1.8Education 0.1 0.2 0.2 0.1 0.2 0.2 0.2 0.2Health 0.1 0.1 0.1 0.2 0.2 0.2 0.3 0.5Housing and Urban Development 0.5 0.4 0.5 0.9 0.6 0.6 0.7 1.1
Housing' 0.1 0.0 0.0 0.1 0.0 0.0 0.0 n.a.Municipal Works 0.4 0.4 0.4 0.6 0.5 0.6 0.6 n.a.
Community Dev & Social Services 0.0 0.0 0.0 0.0 0.0 0.0 0.0 0.0
Total 1.7 1.5 2.9 3.1 2.3 2.6 2.6 3.8Memo Central Govemment Deficit -2.8 -0.5 -0.9 -1.9 -1.8 -0.6 -0.1 -0.1
Expenditures by Social Funds 0.0 0.0 0.1 0.3 0.5 0.5 0.4 0.9Includes FOGUAVI and other housing subsidies since 1994
Sources: Statistical Appendix, Tables 5 and 9.

Table 11. Guatemala: Capital Expenditures of Central Government (Million of 1992 Quetzales)1990 1991 1992 1993 1994 1995 1996 1997
Sector Actual Actual Actual Actual Actual Actual Prel. Budget
Administration and General Services 21.4 46.7 75.7 185.8 107.5 264.4 64.7 89.7
Defense and Public Order 49.5 82.9 54.9 32.2 35.5 97.1 49.4 22.0
Economic Infrastructure & Services 431.7 314.2 997.2 840.9 613.5 672.6 813.9 1247.2Roads and Transport 256.0 244.6 353.5 343.1 384.7 500.3 668.4 710.2Communications 1.2 3.8 2.0 6.0 1.3 0.4 0.0 62.6Energy 43.1 2.7 583.4 326.1 76.6 35.5 36.8 0.0Agriculture and Mining 98.6 46.0 53.4 105.2 134.2 124.4 105.9 166.1Finance, Industry and Others 32.8 17.1 4.9 60.5 16.7 12.0 2.7 308.2
Social Sectors 357.7 348.6 436.4 694.9 630.5 636.9 735.9 1192.8Education 52.5 79.3 83.3 80.9 131.7 113.3 109.6 107.5Health 58.3 54.1 73.0 93.4 132.8 135.2 165.2 324.8Housing and Urban Development 246.3 214.4 279.7 520.1 363.9 386.6 459.1 760.5Housing' 30.0 14.9 22.0 45.0 19.1 10.0 16.9 n.a.Municipal Works 205.7 190.4 228.7 329.7 297.5 370.3 378.1 n.a.
Community Dev & Social Services 0.6 0.8 0.4 0.4 2.1 1.8 2.0 0.0
Total 860.3 792.5 1564.2 1753.9 1387.0 1671.1 1663.8 2551.6Memo: Expenditures by Social Funds 5.4 13.6 47.3 172.2 283.7 294.4 269.4 610.5
' Includes FOGUAVI and other housing subsidies since 1994Sources: Statistical Appendix, Tables 5 and 9.
Table 12. Guatemala: Capital Expenditures of Central Government (% of Total Current Quetzales)1990 1991 1992 1993 1994 1995 1996 1997
Sector Actual Actual Actual Actual Actual Actual Prel. Budget
Administration and General Services 2.5 5.9 4.8 10.6 7.7 15.8 3.9 3.5
Defense and Public Order 5.8 10.5 3.5 1.8 2.6 5.8 3.0 0.9
Economic Infrastructure & Services 50.2 39.7 63.8 47.9 44.2 40.3 48.9 48.9Roads and Transport 29.8 30.9 22.6 19.6 27.7 29.9 40.2 27.8Communications 0.1 0.5 0.1 0.3 0.1 0.0 0.0 2.5Energy 5.0 0.3 37.3 18.6 5.5 2.1 2.2 0.0Agriculture and Mining 11.5 5.8 3.4 6.0 9.7 7.4 6.4 6.5Finance, Industry and Others 3.8 2.2 0.3 3.5 1.2 0.7 0.2 12.1
Social Sectors 41.6 44.0 27.9 39.6 45.5 38.1 44.2 46.7Education 6.1 10.0 5.3 4.6 9.5 6.8 6.6 4.2Health 6.8 6.8 4.7 5.3 9.6 8.1 9.9 12.7Housing and Urban Development 28.6 27.1 17.9 29.7 26.2 23.1 27.6 29.8
Housing' 3.5 1.9 1.4 2.6 1.4 0.6 1.0 n.a.Municipal Works 23.9 24.0 14.6 18.8 21.4 22.2 22.7 n.a.
Commntmity Dev & Social Services 0.1 0.1 0.0 0.0 0.2 0.1 0.1 0.0
Total 100.0 100.0 100.0 100.0 100.0 100.0 100.0 100.0Memo: Expenditures by Social Funds 0.6 1.7 3.0 9.8 20.5 17.6 16.2 23.9
' Includes FOGUAVI and other housing subsidies since 1994Sources: Statistical Appendix, Tables 5 and 9.
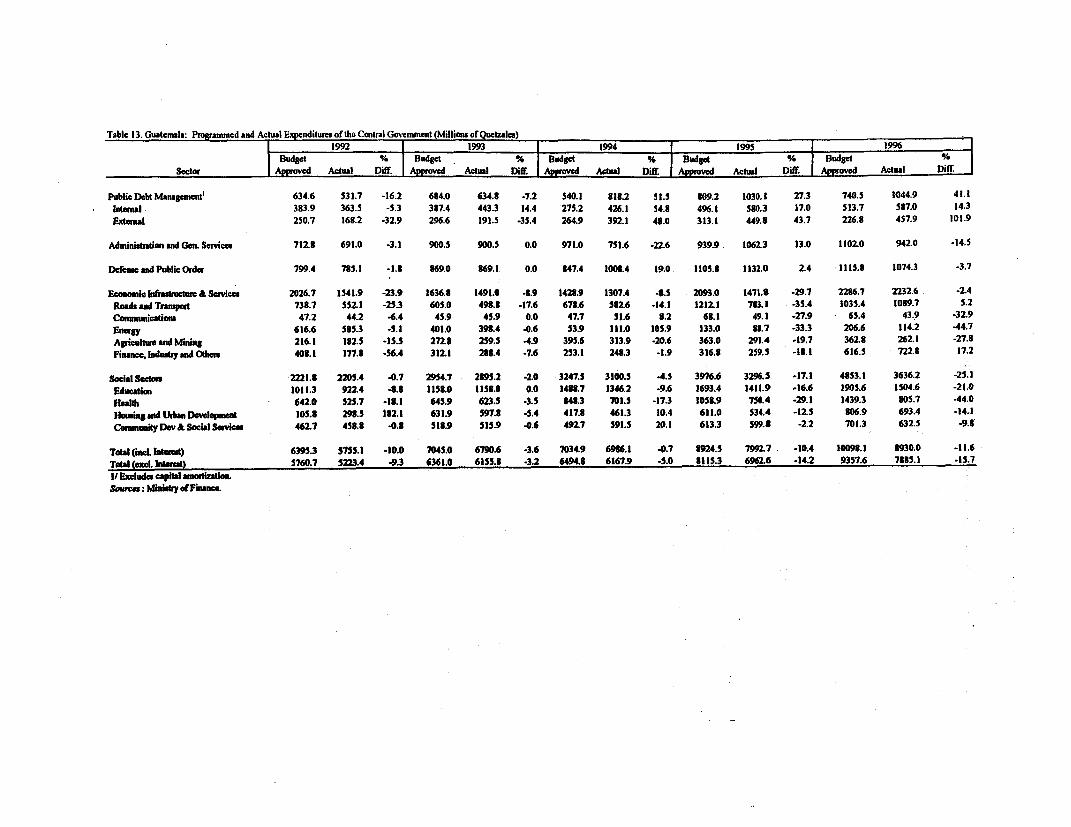
Table 13. Guatemala: Progranuned and Actual Expendilurm of the Central Go nunent (Milliona of Quctulcs)1992 199 1994 1995 1996
Budget % Budget % Budget % Budgt % Budget 1Sector | Approved Actual DiEf. Approved Actu l Duff. Approved Actual Diff. Actwl Diff. Approved Actual Diff.
Public Debt Manaement' 634.6 531.7 -16.2 684.0 634.8 -7.2 540.1 818.2 51.5 809.2 1030.1 27.3 740.5 1044.9 41.1ntemal 383.9 363.5 -5.3 387.4 443.3 14.4 275.2 426.1 54.8 496.1 580.3 17.0 513.7 587.0 14.3Extemal 250.7 168.2 *32.9 296.6 191.5 -35.4 264.9 392.1 48.0 313.1 449.8 43.7 226.8 457.9 101.9
Aeministntion andGen.Servicer 712.8 691.0 -3.1 900.5 900.5 0.0 971.0 751.6 -22.6 939.9 1062.3 13.0 1102.0 942.0 -14.5
Defena andPublicOrder 799.4 785.1 -1.8 869.0 869.1 0.0 847.4 1008.4 19.0 1105.8 1132.0 2.4 1115.8 1074.3 -3.7
Economic Ifaitucture& Service 2026.7 1541.9 -23.9 1636.8 1491.0 4.9 1428.9 1307.4 -1.5 2093.0 1471.8 *29.7 2286.7 2232.6 -2.4Roada and Trampod 738.7 552.1 -25.3 605.0 498.8 -17.6 678.6 582.6 -14.1 1212.1 783.1 -35.4 1035.4 1089.7 5.2Conmunicatiom 47.2 44.2 -6.4 45.9 45.9 0.0 47.7 51.6 8.2 61.1 49.1 .27.9 65.4 43.9 -32.9Energy 616.6 585.3 -5.1 401.0 398.4 40.6 53.9 111.0 105.9 133.0 88.7 -33.3 206.6 114.2 -44.7Agricultwe and Mining 216.1 182.5 *15.5 272.8 259.5 -4.9 395.6 313.9 -20.6 363.0 291.4 *19.7 362.8 262.1 .27.8Finnce led"uIyandOthera 408.1 1778 -56.4 312.1 288.4 -7.6 253.1 248.3 -1.9 316.8 259.5 -18.1 616.5 722.8 17.2
Social Sctom 2221.8 2205.4 -0.7 2954.7 2895.2 .2.0 3247.5 3100.5 .4.5 3976.6 3296.5 *17.1 4853.1 3636.2 -25.1Educatin 1011.3 922.4 -8.8 1158.0 1158.0 0.0 1488.7 1346.2 -9.6 1693.4 1411.9 -16.6 1905.6 1504.6 -21.0Healh 642.0 525.7 -18.1 645.9 623.5 -3.5 848.3 701.5 -17.3 1052.9 750.4 .29.1 1439.3 805.7 44.0HomingandUtbanDeDdvelopet 105.8 291.5 182.1 631.9 597.8 -5.4 417.8 461.3 10.4 611.0 534.4 -12.5 806.9 693.4 -14.1CormnunifyDev&SoclalSeSvice 462.7 458.8 -0.8 518.9 515.9 -0.6 492.7 591.5 20.1 613.3 599.8 -2.2 701.3 632.5 -9.8
Total (incl. Intt) 6395.3 5755.1 -10.0 7045.0 6790.6 -3.6 7034.9 696.1 4.7 924.5 7992.7 -10.4 10098.1 8930.0 -11.6TOdal(ex1el_dt) 5760.7 5223.4 -9.3 6361.0 6155.8 -3.2 6494.8 6167.9 -5.0 8115.3 6962.6 -14.2 9357.6 7885.1 -15.7I/Excludes capital siotizatien.Sorces: Mmins of FjiDnaC.

Table 14. Guatemala: Financial Situation of Selected Non-financial Enterprises
GUATEL GUATEL(Millions of Quctzales) (% of GDP)
1 1992 1993 1994 1995 1992 1993 1994 1995Revenues 828.0 1020.5 1031.1 1157.9 Revenues 1.53 1.59 1.38 1.36Expenditures 781,5 1248.2 1068.6 1039.5 Expenditures 1 45 1 94 1.43 1.22
- Current 546.5 845.7 624.0 778.5 - Current 1.01 1.32 0.84 0.92olwTransferstoGovt 190.0 419.1 173.5 222.8 o/wTransferstoGovt 0.35 0.65 0.23 0.26
-Capital 235.0 402.5 444.6 261.0 -Capital 0.44 0.63 0.60 0.31DeficitlSuperavit 46.5 -227.7 -37.5 118.4 Deficit/Superavit 0.09 -0.35 -0.05 0.14
INDE INDE(Millions of Quetzales) (% of GDP)
1992 1993 1994 1995 1992 1993 1994 1995Revenues 1069.2 914.9 620.0 676.2 Revenues 1.98 1.42 0.83 0.80Expenditures 575.2 489.4 479.9 533.2 Expenditures 1.07 0.76 0.64 0.63
-Current 490.2 323.6 362.0 455.2 -Current 0.91 0.50 0.48 0.54-Capital 85.0 165.8 117.9 78.0 -Capital 0.16 0.26 0.16 0.09
Deficit/Superavit 494.0 425.5 140.1 143.0 Deficit/Superavit 0.92 0.66 0.19 0.17
EMPAGUA . EMPAGUA(Millions of Quetzales) (% of GDP)
_ 1992 1993 1994 1995 1992 1993 1994 1995Revenues 68.8 69.3 116.3 101.5 Revenues 0.13 0.11 0.16 0.12Expenditures 47.8 63.7 86.0 106.2 Expenditures 0.09 0.10 0.12 0.12
-Current 32.7 53.1 77.0 84.9 -Current 0.06 0.08 0.10 0.10-Capital 15.1 10.6 9.0 21.3 -Capital 0.03 0.02 0.01 0.03
Deficit/Superavit 21.0 5.6 30.3 -4.7 Deficit/Superavit 0.04 0.01 0.04 -0.01
Rest of Nonfinancial Public Enterprises Rest of Nonfinancial Public Enterprises(Millions of Quetzales) (% of GDP)
1992 1993 1994 1995 1992 1993 1994 1995Revenues 275.3 398.6 372.8 461.3 Revenues 0.51 0.62 0.50 0.54Expenditures 224.1 311.4 383.2 389.0 Expenditures 0.42 0.48 0.51 0.46
-Current 277.7 237.2 343.9 331.8 -Current 0.51 0.37 0.46 0.39- Capital -53.6 74.2 39.3 57.2 - Capital -0.10 0.12 0.05 0.07
Deficit/Superavit 51.2 87.2 -10.4 72.3 Deficit/Superavit 0.09 0.14 -0.01 0.09
Consolidated Nonfinancial Public Enterprises Consolidated Nonfinancial Public Enterprises(Millions of Quetzales) (% of GDP)
1992 1993 1994 1995 1992 1993 1994 1995Revenues 2172.5 2334 2023.9 2295.4 Revenues 4.02 3.63 2.71 2.70Expenditures 1580.8 2049 1931.7 1961.7 Expenditures 2.93 3.19 2.59 2.31
-Current 1314.4 1406.5 1329.9 1565.5 -Current 2.43 2.19 1.78 1.84-Capital 266.4 642.5 601.8 396.2 -Capital 0.49 1.00 0.81 0.47
D)eficit/Superavit 591.7 285 92.2 333.7 Deficit/Superavit 1.10 0.44 0.12 0.39
EEGSA EEGSA(Millions of Quetzales) (% of GDP)
___________________ 1 1992 1993 1994 1995 _ 1992 1993 1994 1995Revenues 673.6 827.9 966 1027.4 Revenues 1.25 1.29 1.29 1.21Expenditures 669.5 871.7 849.4 967.9 Expenditures 1.24 1.36 1.14 1.14
-Current 647.7 809.8 844.3 945.6 -Current 1.20 1.26 1.13 1.11-Capital 21.8 61.9 5.1 22.3 -Capital 0.04 0.10 0.01 0.03
Deficit/Superavit j 4.1 -43.8 116.6 59.5 Deficit/Superavit 0.01 -0.07 0.16 0.07
Sources: IMF arnd EEGSA.

Table 15. Guatemala: Financing of Public Capital Expenditures, 1995-96
(Millions of Quetzales)1 995 - 996
Total Local Extermal Financtng Total Local Extemal FinancingInvestment Financing Total Bilateral Multilateral Donations Counterpart Investnent Financing Total Bilateral Multilateral Donations Counterpart
TOTAL 36432 2583.3 436.4 66.4 279.1 40.7 621.1 44S4.5 2913.7 775.0 15;3 570.2 841, 7958
CENTRALGOVERNMENT 2246.7 1696.3 386.2 66.4 279.1 40.7 161.8 2479.6 1757.4 670.1 153 570.2 846 521
Administration&GeneralSemvices 355.5 272.4 31.0 0.0 31.0 0.0 52.1 96.4 34.8 44.4 00 35.5 8.9 172
DefenseandPublicOrder 130.6 130.6 0.0 0.0 0.0 0.0 0.0 73.7 73.7 0.0 0.0 0.0 00 00
Economic Infrastructulre&Services 904.3 574.4 245.0 45.7 185.2 14.1 84.9 1212.9 888.5 313.4 147 278.9 198 11.0RoadsandTransport 672.6 439.4 161.4 8.7 152.7 0.0 71.8 996.2 759.8 2329 14.7 218.2 00 35Conuounications 0.6 0.6 0.0 0.0 0.0 0.0 0.0 0.1 0.1 0.0 00 0.0 0.0 0.0Energy 47.7 46.7 1.0 0.0 1.0 0.0 0.0 54.9 54.7 00 0.0 0.0 0.0 02Agricultureand Mining 167.2 71.5 82.6 37.0 31.5 14.1 13.1 157.8 72.0 785 0.0 58.7 19.8 73Finance. Industry and Others 16.2 16.2 0.0 0.0 0.0 0.0 0.0 4.0 2.0 2.0 0.0 2.0 0.0 0 0
Social Sectors 856.3 718.9 110.2 20.7 62.9 26.6 24.8 1096.6 760.4 312.3 0.6 255.8 55.9 23.9Education 152.3 116.0 30.4 4.8 25.6 0.0 5.9 163.3 99.8 63.5 0.0 63.5 0.0 0.0Health 181.8 96.3 70.2 15.4 28.2 26.6 15.3 246.1 18.4 2277 0.6 171.2 55.9 0.0HousingandUrbanDevelopment 519.S 506.6 9.6 0.5 9.1 0.0 3.6 684.2 639.2 21.1 00 21.1 0.0 23.9Comxnnity Dev. & Social Services 2.4 0.0 0.0 0.0 0.0 0.0 0.0 3.0 3.0 0,0 0.0 0.0 00 0.0
NF PUBLIC ENTERPRISES 499.3 0.0 40.0 0.0 0.0 0.0 459.3 828.6 0.0 84.9 0.0 0.0 0.0 743.7GUATEL 338.8 0.0 18.7 n.a. n.a. n.a. 320.1 512.3 0.0 52.0 n.a. n.a. n.a. 460.3INDE 95.5 0.0 14.1 n.a. na. n.a. 81.4 155.3 0.0 9.5 n.a. n. nMa. 145.8EMPAGUA 21.4 0.0 7.2 n.a. n.a. n.a. 14.2 93.1 0.0 23.4 n.a. n.a. n.a. 69.7Puertos Quetzal & Santo Tonas 33.3 0.0 0.0 0.0 0.0 0.0 33.3 64.9 0.0 0.0 0.0 0.0 0.0 64.9Others 10.3 0.0 0.0 0.0 0.0 0.0 10.3 3.0 0.0 0.0 0.0 0.0 0.0 3.0
REST OF GENERAL GOVERNMENT 897.2 887.0 10.2 0.0 0.0 0.0 0.0 1176.3 1156.3 20.0 0.0 0.0 0.0 0.0IGSS 289.5 289.5 0.0 0.0 0.0 0.0 0.0 264.6 264.6 0.0 0.0 0.0 0.0 0.0tNTECAP 34.2 34.2 0.0 0.0 0.0 0.0 0.0 43.1 43.1 0.0 0.0 0.0 0.0 0.0IRTRA 28.0 28.0 0.0 0.0 0.0 0.0 0.0 80.6 80.6 0.0 0.0 0.0 0.0 00University of San Carlos 20.3 20.3 0.0 0.0 0.0 0.0 0.0 24.0 24.0 0.0 0.0 0.0 0.0 0.0Other decentraliced 32.9 32.9 0.0 0.0 0.0 0.0 0.0 112.0 112.0 0.0 00 0.0 0.0 0.0Local governments 492.3 482.1 10.2 n.a. n.a. n.a. 0.0 652,0 632.0 20.0 n.a. n.a. n.a. 0.0
Source: Ministty of Finance
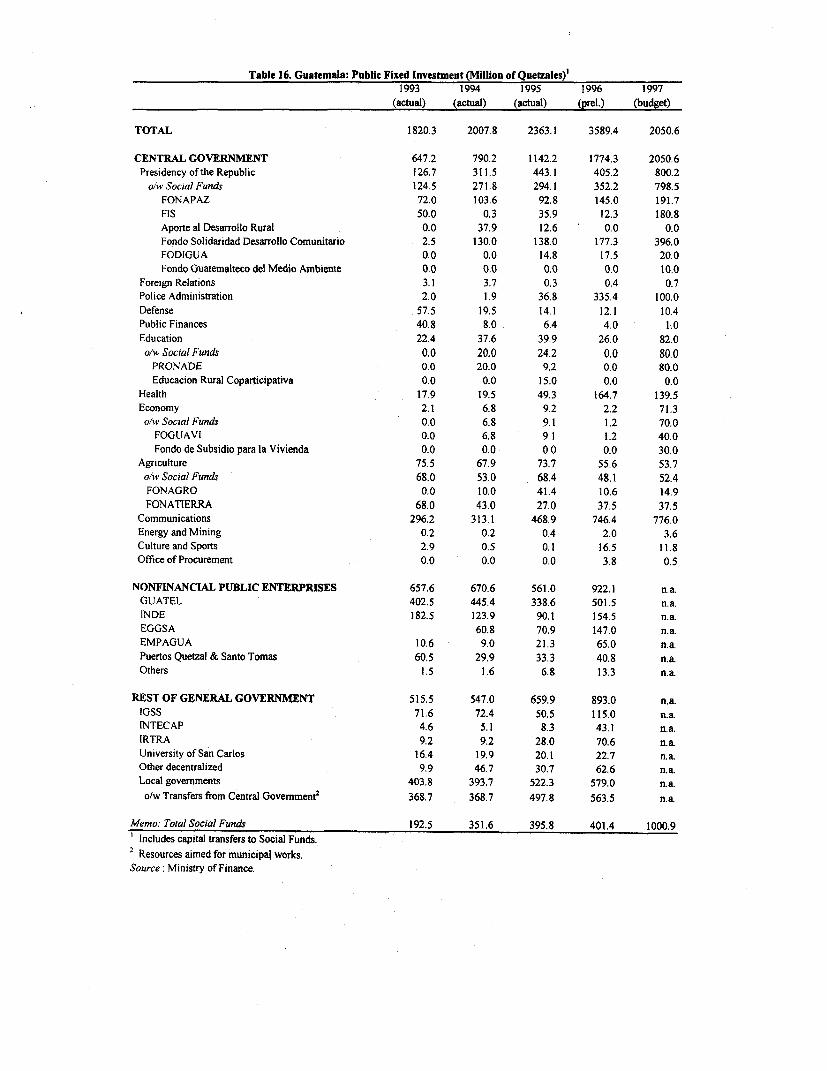
Table 16. Guatemala: Public Fixed Investment (Million of Quetzales)l1993 1994 1995 1996 1997
(actual) (actual) (actual) (prel.) (budget)
TOTAL 1820.3 2007.8 2363.1 3589.4 2050.6
CENTRAL GOVERNMENT 647.2 790.2 1142.2 1774.3 2050.6Presidency ofthe Republic 126.7 311.5 443.1 405.2 800.2
o/w Social Funds 124.5 271.8 294.1 352.2 798.5
FONAPAZ 72.0 103.6 92.8 145.0 191.7FIS 50.0 0.3 35.9 12.3 180.8Aporte al Desarrollo Rural 0.0 37.9 12.6 0.0 0.0Fondo Solidaridad Desarrollo Comunitario 2.5 130.0 138.0 177.3 396.0FODIGUA 0.0 0.0 14.8 17.5 20.0Fondo Guatemalteco del Medio Ambiente 0.0 0.0 0.0 0.0 10.0
Foreign Relations 3.1 3.7 0.3 0.4 0.7Police Administration 2.0 1.9 36.8 335.4 100.0Defense 57.5 19.5 14.1 12.1 10.4Public Finances 40.8 8.0 6.4 4.0 1.0Education 22.4 37.6 39.9 26.0 82.0
o/w Social Funds 0.0 20.0 24.2 0.0 8o.0PRONADE 0.0 20.0 9.2 0.0 80.0Educacion Rural Coparticipativa 0.0 0.0 15.0 0.0 0.0
Health 17.9 19.5 49.3 164.7 139.5Economy 2.1 6.8 9.2 2.2 71.3o/w Social Funds 0.0 6.8 9.1 1.2 70.0
FOGUAVI 0.0 6.8 9.1 1.2 40.0Fondo de Subsidio para la Vivienda 0.0 0.0 0.0 0.0 30.0
Agriculture 75.5 67.9 73.7 55.6 53.7o/w Social Funds 68.0 53.0 68.4 48.1 52.4FONAGRO 0.0 10.0 41.4 10.6 14.9
FONATIERRA 68.0 43.0 27.0 37.5 37.5Communications 296.2 313.1 468.9 746.4 776.0Energy and Mining 0.2 0.2 0.4 2.0 3.6Culture and Sports 2.9 0.5 0.1 16.5 11.8Office of Procurement 0.0 0.0 0.0 3.8 0.5
NONFINANCIAL PUBLIC ENTERPRISES 657.6 670.6 561.0 922.1 n.a.GUATEL 402.5 445.4 338.6 501.5 n.a.INDE 182.5 123.9 90.1 154.5 n.a.EGGSA 60.8 70.9 147.0 n.a.EMPAGUA 10.6 9.0 21.3 65.0 n.a.Puertos Quetzal & Santo Tomas 60.5 29.9 33.3 40.8 n.a.Others 1.5 1.6 6.8 13.3 n.a.
REST OF GENERAL GOVERNMENT 515.5 547.0 659.9 893.0 n.a.IGSS 71.6 72.4 50.5 115.0 n.a.INTECAP 4.6 5.1 8.3 43.1 n.a.IRTRA 9.2 9.2 28.0 70.6 n.a.University of San Carlos 16.4 19.9 20.1 22.7 n.a.Other decentralized 9.9 46.7 30.7 62.6 n.a.Local govemments 403.8 393.7 522.3 579.0 n.a.
o/w Transfers from Central Government2 368.7 368.7 497.8 563.5 n.a
Memo: Total Social Funds 192.5 351.6 395.8 401.4 1000.9
Includes capital transfers to Social Funds.Resources aimed for municipal works.
Source: Ministry of Finance.

Table 17. Guatemala: Composition of Public Fied Investment (%)'1993 1994 1995 1996 1997
(actual) (actual) (actual) (prel.) (budget)
TOTAL 100.0 10. 100.0 100.0 100.0
CENTRAL GOVERNMENT 35.6 39.4 48.3 49.4 100.0Presidency of the Republic 7.0 15.5 18.8 11.3 39.0
o/w Social Funds 6.8 13.5 12.4 9.8 38.9FONAPAZ 4.0 5.2 3.9 4.0 9.3FIS 2.7 0.0 1.5 0.3 8.8Aporte a] Desarrollo Rural 0.0 1.9 0.5 0.0 0.0Solidaridad para Desarrollo Comunitaio 0.1 6.5 5.8 4.9 19.3FODIGUA 0.0 0.0 0.6 0.5 1.0Fondo Guatemalteco del Medio Ambiente 0.0 0.0 0.0 0.0 0.5
Foreign Relations 0.2 0.2 0.0 0.0 0.0Police Administration 0.1 0.1 1.6 9.3 4.9Defense 3.2 1.0 0.6 0.3 0.5Public Finances 2.2 0.4 0.3 0.1 0.0Education 1.2 1.9 1.7 0.7 4.0olw Social Funds 0.0 1.0 1.0 0.0 3.9
PRONADE 0.0 1.0 0.4 0.0 3.9Educacion Rural Coparticipativa 0.0 0.0 0.6 0.0 0.0
Health 1.0 1.0 2.1 4.6 6.8Economy 0.1 0.3 0.4 0.1 3.5o'w Social Funds 0.0 0.3 0.4 0.0 3.4
FOGUAVI 0.0 0.3 0.4 0.0 2.0Fondo de Subsidio para la Vivienda 0.0 0.0 0.0 0.0 1.5
Agriculture 4.1 3.4 3.1 1.6 2.6o/w Social Funds 3.7 2.6 2.9 1.3 2.6FONAGRO 0.0 0.5 1.8 0.3 0.7FONATIERRA 3.7 2.1 1.1 1.0 1.8
Communications 16.3 15.6 19.8 20.8 37.8Energy and Mining 0.0 0.0 0.0 0.1 0.2Culture and Sports 0.2 0.0 0.0 0.5 0.6Office of Procurement 0.0 0.0 0.0 0.1 0.0
NONFINANCIAL PUBLIC ENTERPRISES 36.1 33.4 23.7 25.7 n.a.GUATEL 22.1 22.2 14.3 14.0 n.a.INDE 10.0 6.2 3.8 4.3 n.a.EGGSA 0.0 3.0 3.0 4.1 n.a.EMPAGUA 0.6 0.4 0.9 1.8 n.a.Puertos Quetzal & Santo Tomas 3.3 1.5 1.4 1.1 n.a.Others 0.1 0.1 0.3 0.4 n.a.
REST OF GENERAL GOVERNMENT 28.3 27.2 27.9 24.9 n.a.IGSS 3.9 3.6 2.1 3.2 n.a.INTECAP 0.3 0.3 0.4 1.2 n.a.IRTRA 0.5 0.5 1.2 2.0 n.a.University of San Carlos 0.9 1.0 0.9 0.6 n.a.Other decentralized 0.5 2.3 1.3 1.7 n.aLocal governments 22.2 19.6 22.1 16.1 n.a.
o/w Transfers from Central Govemmene 20.3 18.4 21.1 15.7 n.a.
Memo: Total Social Funds 10.6 17.5 16.7 11.2 48.8
Includes capital transfers to Social Funds.
Resources aimed for municipal works.Source: Statistical Appendix, Table 16.
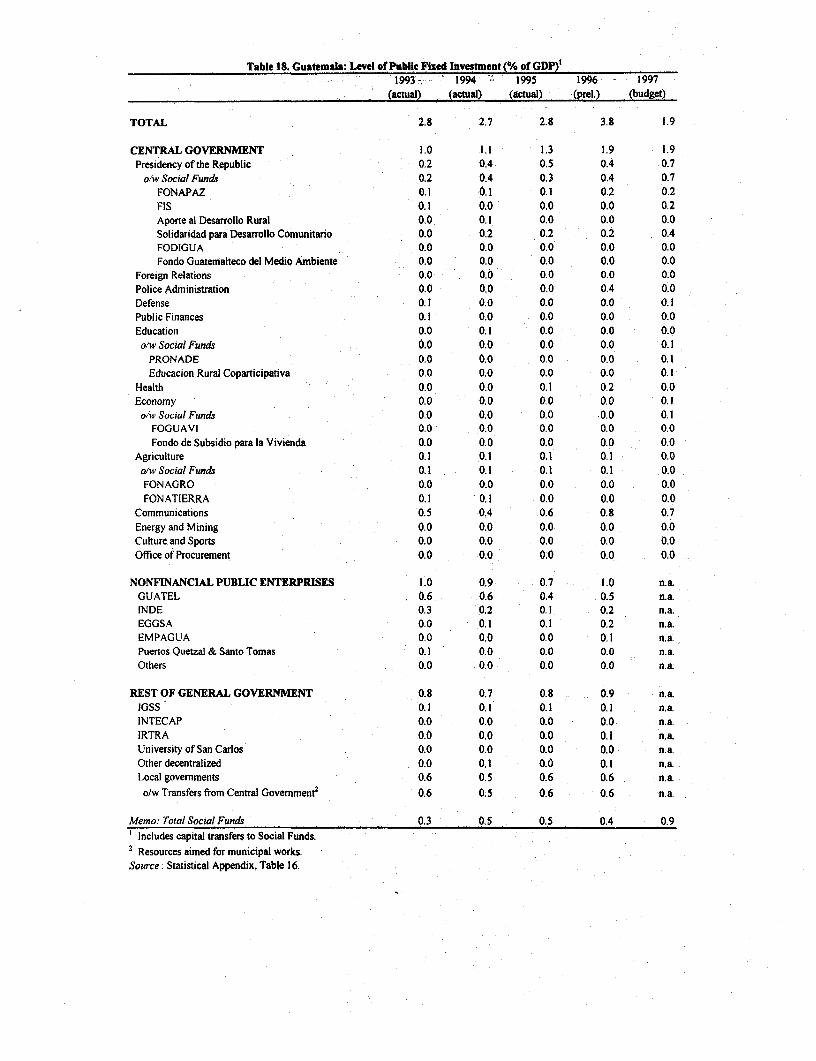
Table 18. Guatemala: Level of Public Fixed Investment (% of GDP)'1993- 1994 1995 1996 - 1997
(actual) (a(actlal)actual) (prel.) (budget)
TOTAL 2.8 2.7 2.8 3.8 1.9
CENTRAL GOVERNMENT 1.0 1.1 1.3 1.9 1.9Presidency of the Republic 0.2 0.4 0.5 0.4 0.7
o.'w Social Funds 0.2 0.4 0.3 0.4 0.7FONAPAZ 0.1 0.1 0.1 0.2 0.2FIS 0.1 0.0 0.0 0.0 0.2Aporte al Desarrollo Rural 0.0 0.1 0.0 0.0 0.0Solidaridad para Desarrollo Comunitario 0.0 0.2 0.2 0.2 0.4FODIGUA 0.0 0.0 0.0 0.0 0.0Fondo Guatemalteco del Medio Ambiente 0.0 0.0 0.0 0.0 0.0
Foreign Relations 0.0 0.0 0.0 0.0 0.0Police Administration 0.0 0.0 0.0 0.4 0.0Defense 0.1 0.0 0.0 0.0 0.1Public Finances 0.1 0.0 0.0 0.0 0.0Education 0.0 0.1 0.0 0.0 0.0oliv Social Funds 0.0 0.0 0.0 0.0 0.1
PRONADE 0.0 0.0 0.0 0.0 0.1Educacion Rural Coparticipativa 0.0 0.0 0.0 0.0 0.1
Health 0.0 0.0 0.1 0.2 0.0Economy 0.0 0.0 0.0 0.0 0.1oAw Social Funds 0.0 0.0 0.0 0.0 0.1
FOGUAVI 0.0 0.0 0.0 0.0 0.0Fondo de Subsidio para la Vivienda 0.0 0.0 0.0 0.0 0.0
Agriculture 0.1 0.1 0.1 0.1 0.0o/w Social Funds 0.1 0.1 0.1 0.1 0.0FONAGRO 0.0 0.0 0.0 0.0 0.0FONATIERRA 0.1 0.1 0.0 0.0 0.0
Communications 0.5 0.4 0.6 0.8 0.7Energy and Mining 0.0 0.0 0.0 0.0 0.0Culture and Sports 0.0 0.0 0.0 0.0 0.0Office of Procurement 0.0 0.0 0.0 0.0 0.0
NONFINANCIAL PUBLIC ENTERPRISES 1.0 0.9 0.7 1.0 na.GUATEL 0.6 0.6 0.4 0.5 n.a.INDE 0.3 0.2 0.1 0.2 n.a.EGGSA 0.0 0.1 0.1 0.2 n.a.EMPAGUA 0.0 0.0 0.0 0.1 n.aPuertos Quetzal & Santo Tomas 0.1 0.0 0.0 0.0 n.a.Others 0.0 0.0 0.0 0.0 n.a.
REST OF GENERAL GOVERNMENT 0.8 0.7 0.8 0.9 n.a.IGSS 0.1 0.1 0.1 0.1 n.aINTECAP 0.0 0.0 0.0 0.0 n.a.IRTRA 0.0 0.0 0.0 0.1 n.a.University of San Carlos 0.0 0.0 0.0 0.0 n.aOther decentralized 0.0 0.1 0.0 0.1 n.a.Local governments 0.6 0.5 0.6 0.6 n.ao/w Transfers from Central Government2 0.6 0.5 0.6 0.6 n.a.
Memo: Total Social Funds 0.3 0.5 0.5 0.4 0.91 Includes capital transfers to Social Funds.2 Resources aimed for municipal works.Source: Statistical Appendix, Table 16.

Table 19. Guatemala: Programmed and Effective Official Loan Disbursements(Millions of US$)
1994 1995 1996Debtor/Creditor ammedEffective Rate Disb Progr ned Effective Rate Disb Programmed Effective Rate Disb
TOTAL 365.8 214.8 58.7% 300.7 118.7 39.5% 190.2 139.8 73.5%
Central Government 312.9 191.3 61.1% 281.9 114.5 40.6% 190.2 139.5 73.4%IDB 153.6 114.7 74.7% 72.3 47.3 65.4% 46.0 21.2 46.0%IBRD 69.0 27.9 40.4% 72.0 14.5 20.1% 83.5 79.5 95.3%BCIE 9.9 1.1 11.1% 53.1 37.1 69.9% 41.5 31.0 74.7%FIDA 2.5 3.8 152.0% 5.1 2.7 52.9% 3.5 3.4 98.5%OPEP 4.7 0.5 10.6% 1.6 0.7 43.8% 1.1 0.0 0.0%USAID 20.0 1.6 8.0% 14.6 0.6 4.1% 2.0 0.0 0.0%KFW 4.6 2.7 58.7% 11.7 4.3 36.8% 9.8 4.1 41.7%MCC 1.0 5.3 530.0% 8.0 2.0 25.0% 0.0 0.0FIV 15.1 1.3 8.6% 21.2 5.1 24.1% 2.8 0.0 0.0%Govt. of Switzerland 2.5 2.4 96.0% 2.3 0.2 8.7% 0.0 0.3Eximbank-China 30.0 30.0 100.0% 20.0 0.0 0.0% 0.0 0.0OECF-Japan 0.0 0.0 0.0 0.0 12.3 0.0 0.0%
GUATEL 32.0 23.2 72.3% 13.8 3.8 27.5% n.a. n.a. n.a.OECF-Japan 30.0 23.1 76.8% 12.0 3.8 31.7% n.a. n.a. n.a.BCIE 2.0 0.1 5.0% 1.8 0.0 0.0% n.a. n.a. n.a.
EMPAGUA 6.0 0.3 5.0% 5.0 0.4 8.0% n.a. n.a. n.a.OECF-Japan 6.0 0.3 5.0% 5.0 0.4 8.0% n.a. n.a. n.a.
RNDE 14.9 0.0 0.0% 0.0 0.0 n.a. 0.0 0.3 n.a.IDB 10.0 0.0 0.0% 0.0 0.0 n.a. n.a. n.a. n.a.MCC 4.9 0.0 0.0% 0.0 0.0 n.a. n.a n.a n.a
Source: Ministry of Finance
Table 20. Guatemala: Official Disbursements (US$ mn)'(Millions of US$)
1986 1987 1988 1989 1990 1991 1992 1993 1994 1995
Bilaterals 96.1 42.8 96.3 31.8 61.6 74.5 59.1 41.3 53.6 48.7Multilaterals 69.3 27.6 105.1 85.3 68.2 69.7 95.2 28.8 118.3 100.3.Private Creditors 17.9 16.4 12.8 43.8 28.1 18.4 36.7 13.5 104.1 61.8
Total Official 183.3 86.8 214.2 160.9 157.9 162.6 191.0 83.6 276.0 210.8' Data include disbursements to Bank of Guatemala.Source: World Bank based on data provided by the Ministry of Finance

Table 21. Guatemala: Outstanding Public Domestic Debt(Million of Quetzales)
Balance Balance Balance Balance Balance Balance Balance Balance31/12/89 31/12/90 31/12/91 31/12/92 31/12/93 31/12/94 31/12/95 31/12/96
1. FLOATING DEBT 530.8 580.6 522.3 696.6 1153.1 1075.8 1271.0 657.4
PROGRAMA DEFUNCIONAMIENTO 309.5 345.0 280.3 432.9 662.1 577.2 530.1Organismo Legislativo 0.6 3.2 3.0 5.5 20.0 6.0 4.4Presidencia de la Republica 48.6 58.9 18.7 46.2 57.6 28.0 29.5Ministerio de Relaciones Exteriores 7.6 10.3 6.5 7.8 16.0 28.4 19.8Ministerio de Gobemacion 8.8 11.4 9.1 20.7 36.9 18.8 16.8Ministerio de la Defensa Nacional 46.0 69.3 47.6 55.7 47.6 62.0 24.1Ministerio de Finanzas Publicas 52.0 53.5 33.0 96.8 145.1 87.1 82.9Ministerio de Educacion 38.9 29.4 30.9 32.1 53.1 96.7 119.7Ministeriode SaludPublicayA.S. 61.0 74.9 76.6 110.4 183.0 164.6 175.6Ministerio de Trabajo y Prev Soc 0.7 0.6 1.0 2.0 7.3 3.2 2.2Ministerio de Economia 1.7 2.2 0.7 8.9 14.1 4.7 4.6Ministerio de Agricultura Ganad. Alim. 21.8 14.2 13.1 16.3 38.5 38.2 19.6Ministerio de Comunicaciones T. y O.P. 8.2 8.3 14.2 19.6 23.1 22.5 18.0Ministerio de Energia y Minas 0.5 0.5 19.0 1.0 5.6 2.6 1.2Ministerio de Asuntos Especificos 1.4 0.5 0.0 0.0 0.0 0.0 0.0Ministerio de Cultura y Deportes 8.5 2.8 2.6 5.3 6.3 6.6 7.8Ministerio de Desarollo Urbano y R. 3.1 4.3 1.0 1.4 1.4 1.4 0.0Ministerio Publico 0.0 0.1 0.8 1.1 3.5 0.9 0.0Procuradoria Gral de la Nacion 0.0 0.0 0.0 0.0 0.0 0.9 0.2Contraloria General de Cuentas 0.1 0.6 2.5 2.1 3.0 4.6 3.7
PROGRAM4 DE INVERSION 221.3 235.6 242.0 263.7 491.0 498.6 740.9Presidencia de la Republica 21.4 6.5 1.4 2.9 51.2 64.3 106.8Ministerio de Relaciones Exteriores 0.3 0.1 0.5 1.5 2.5 2.6 0.5Ministerio de Gobernacion 1.3 1.2 0.0 0.0 2.0 2.5 56.1Ministerio de la Defensa Nacional 1.8 11.4 45.6 1.4 4.9 3.2 2.7Ministerio de Finanzas Publicas 87.0 123.5 43.5 62.8 216.6 193.3 261.4Ministerio de Educacion 3.0 2.1 20.9 10.2 8.1 35.3 25.7Ministerio de Salud Publica y A.S. 10.7 3.4 7.5 11.2 25.6 21.9 17.2Ministerio de Trabajo y Prev Soc 0.3 0.0 0.4 0.1 0.0 1.5 1.7Ministerio de Economia 0.0 14.3 4.0 0.0 0.0 7.8 19.5Ministerio de Agricultura Ganad. Alim. 14.8 11.8 26.7 13.3 14.5 23.7 59.6Ministerio de Comunicaciones T. y O.P. 41.4 50.9 83.2 154.3 139.2 133.7 167.7Ministerio de Energia y Minas 32.6 6.7 2.3 0.4 0.4 4.5 0.9Ministerio de Cultura y Deportes 4.0 1.9 4.0 3.4 3.6 2.0 20.6Ministerio de Desarollo Urbano y R. 2.7 1.8 2.0 2.2 16.3 0.1 0.0Contraloria General de Cuentas 0.0 0.0 0.0 0.0 6.1 2.2 0.5
2. BONDED DEBT 3099.3 3408.7 3712.6 3684.5 4153.5 4463.5 4241.9 5541.93. CARRYOVER DEBT 0.1 2.2 88.1 51.6 32.2 200.1 241.64. CIRCULATING SECURITIES 0.0 0.1 0.2 0.4 0.6 1.0 1.25. OTHERS 2.1 1.5 1.8 6.2 6.1 7.9 22.3
TOTAL DOMESTIC PUBLIC DEBT 3632.3 3993.1 4325.0 4439.3 5345.5 5748.3 5778.0 6199.3(as%ofGDP) 15.3 11.6 9.1 8.2 8.3 7.7 6.8 6.5Memo: Current GDP 23684.6 34316.93 47302.32 53985.42 64243.45 74669.2 85016.3 95613.9Source: Ministry of Finance

Table 22. Guatemala: Outstanding Public External Debt(Millions of US$)
1990 1991 1992 1993 1994 1995
Total 2402.4 2345.1 2283.9 2243.1 2404.7 2350.6
Nonfinancial public sector 1309.2 1315.1 1341.6 1368.3 1623.5 1609.0Multilateral 824.1 789.2 763.1 713.4 784.6 807.0
IDB 516.7 508.3 497.7 477.9 558.6 570.8World Bank 202.0 174.5 172.3 146.3 140.6 123.9BCIE 103.1 103.6 86.6 81.5 75.1 100.5IFAD 0.7 1.0 3.0 4.2 6.0 7.8OPEC 1.6 1.8 3.5 3.5 4.3 4.0
Bilateral 406.2 437.8 475.4 521.0 554.7 603.0Commercial Banks 23.0 21.5 31.9 40.6 60.8 59.6Bonded debt 0.0 0.0 0.0 40.0 40.3 38.3Short-term 55.9 66.6 71.2 53.3 183.1 101.1
CORFINA 350.3 373.0 389.9 404.1 423.8 440.6o/w Banco Exterior de Espana 203.3 203.3 188.7 370.9 370.9 370.9
Bank of Guatemala 742.9 657.0 552.4 470.7 357.4 301.0MLT debt 474.7 390.4 394.3 368.6 298.0 256.9Short-term 268.2 266.6 158.1 102.1 59.4 44.1
Memo: Current GDP 7626.0 9460.5 10381.8 11472.0 12874.0 14582.5Official extemal debt/GDP (%) 31.5 24.8 22.0 19.6 18.7 16.1
Source: IMF

Table 23. Central Government Bonded Debt Maturities(Millions of Quetzales)
1994 1995 1996
Total 3046.3 3129.7 4561.0
1 month 763.4 483.5 391.02 months 23.2 641.8 657.33 months 107.5 245.4 284.84 months 67.0 307.1 536.55 months 92.7 101.3 242.36 months 227.2 149.9 251.07 months 158.0 245.9 178.68 months 103.6 113.5 193.79 months 208.8 100.4 88.110 months 366.4 140.8 181.711 months 40.8 20.7 457.412 months 141.8 69.0 314.12 years 274.9 179.7 651.33 years + 471.0 330.7 133.2Source: Bank of Guatemala

Table 24: Social Funds: Social Investment in 1996(Million of Quetzales)
FUND/ REGION I n III IV V VI VII VIII MULTI TOTALFOGUAVI 25.4 0.1 0.1 0.9 2.2 3.9 0.4 - 33.0FIS 1.5 15,9 8.4 3.8 8.8 21.8 11.4 5.6 77.2INFOM 1.9 1.5 7.7 3.9 6.9 11 1.6 1.5 - 36.0FODIGUA 3.4 0.8 1.8 0.2 0.3 6.6 1.8 - 15.1 30.0FONATIERRA 4 - - 8.6 - 10 - - - 22.6FONAPAZ - 31.7 - - 9.4 22.1 18.8 - 21.2 103.2FSDC 5.6 14 10.4 10.7 11 21.3 13.6 3.4 58.1 148.1TOTALS 41.8 64.0 28.4 28.1 38.6 96.7 47.6 10.5 94.4 450.2
(% w.r.t. Region Totals)FUND/ REGION I II III IV V VI VII VIII MULTI TOTALFOGUAVI 60.8 0.2 0.4 3.2 5.7 4.0 0.8 - - 7.3FIS 3.6 24.8 29.6 13.5 22.8 22.5 23.9 53.3 17.1INFOM 4.5 2.3 27.1 13.9 17.9 11.4 3.4 14.3 - 8.0FODIGUA 8.1 1.3 6.3 0.7 0.8 6.8 3.8 - 16.0 6.7FONATIERRA 9.6 - - 30.6 - 10.3 1 - - 5.0FONAPAZ - 49.5 - - 24.4 22.9 39.5 - 22.5 22.9FSDC 13.4 21.9 36.6 38.1 28.5 22.0 28.6 32.4 61.5 32.9TOTALS 100 100 100 100 100 100 100 100 100 100DEPARTMENTS BY REGION: I: Ciudad de Guatemala; II: Baja Verapaz, Alta Verapaz; III: El Progreso, Izabal,Zacapa, Chiquimula; IV: Santa Rosa, Jalapa, Jutiapa;V: Zacatepequez, Chimaltenango, Escuintla; VI: Solola, Totonicapan,Quetzaltenango, Retalhuleu, Suchitepequez, San Marcos; VII: Huehuetenango, Quich6; VIII: Peten. .
Source: SEGEPLAN
Note: Data on this table differ from MOF's figures.


IMAGING
Report No.: 16392 GUType: ER