handbook of emergy evaluation - university of florida · preface, handbook of emergy evaluation ......
TRANSCRIPT

Handbook of Emergy Evaluation
A Compendium of Data for Emergy ComputationIssued in a Series of Folios
Folio #2Emergy of Global Processes
Howard T. Odum
(Draft Version for Comment)
May 2000
Center for Environmental PolicyEnvironmental Engineering Sciences
Box 116450University of Florida
Gainesville, 32611-6450

Preface, Handbook of Emergy Evaluation
Emergy, spelled with an "m," is a universal measure of real wealth of the work ofnature and society made on a common basis. Calculations of emergy production andstorage provide a basis for making choices about environment and economy follow-ing the general public policy to maximize real wealth, production and use (maximumempower). To aid evaluations, this handbook provides data on emergy contents andthe computations on which they were based. A series of Folios are to be issued.Folio #1 introduces concepts and evaluates the empower of the geobiosphere.
There may be Folios by many authors, who take the initiative to make new calcula-tions or assemble results from the extensive but dispersed literature. Data on emergycontent are in published papers, books, reports, theses, dissertations, and unpublishedmanuscripts. Tabulating unit emergy values and their basis is the main purpose ofthis handbook. Presentations document the sources of data and calculations. As re-ceived, Folios will go to reviewers, back to authors for revision and back for publica-tion. Each will have an index to indicate the page where emergy is evaluated. EachFolio should be usable without reference to other Folios.
Policy on Literature Review and ConsistencyThis handbook is based on emergy evaluations assembled from various reports andpublished literature plus new tables prepared by Folio authors. Our policy is to pre-sent previous calculations with due credit and without change except those requestedby original authors. This means that unit emergy values in some tables may be dif-ferent from those in other tables. Some tables may be more complete than others.No attempt is made to make all the tables consistent. Explanatory footnotes are re-tained. The diversity of efforts and authors enriches the information available tousers, who can make changes and recalculate as they deem desirable to be morecomplete, update, or otherwise revise for their purposes.
The increase in global emergy base of reference to 15.83 E24 sej/yr (Folios #1 and#2) changes all the unit emergy values which directly and indirectly are derived fromthe value of global annual empower. Two alternatives are suggested when using thevalues from this handbook with previously published unit emergy value: Either in-crease the older values or decrease the new values by a factor for the change in thebase used. For example, to use unit emergy values based on the 1996 solar em-power base (9.44 E24 sej/yr), multiply those values by 1.68. Or, multiply theemergy values of this handbook by 0.60 to keep values on the older base. --Howard T. Odum and Mark T. Brown

Introduction to Folio #2
This Folio #2 evaluates emergy for some of the physical processes of the geobio-sphere. The solar emergy of tidal energy and deep earth heat were estimated by thespecial procedure of setting two inputs making the same product as equivalent. Theatmosphere, ocean, and plastic earth each contain a hierarchy of coupled operatingunits on different scales that build potential energy and circulate materials. Tablesare given evaluating emergy of these energy hierarchies, which include oceanicheating, winds and storms, ocean currents, and earth cycles.
An emergy equation sets the empower of inputs into an energy transformation pro-cess equal to the empower of an output, where each term contains a flow multipliedby its emergy/unit. For example, the empower of global rain equals the sum of em-power input terms for solar energy, tidal energy, and energy from the earth belowthe crust. If there are common terms, two or more emergy equations can be usedto determine unit emergy values. Patterson (1993, 1996) and Collins (1997, 1998;Collins and Odum, 2000) developed matrix procedures for determining a set of unitemergy values from a set of equations for energy flows. In the first part of thisFolio, two emergy equations are used to calculate the unit emergy of tidal energyand deep earth heat.
1. Inputs to the Geobiosphere
Three main emergy inputs to the geobiosphere are the solar energy, the tidal en-ergy, and the deep earth heat. An emergy equation was written for the joint contri-butions of these inputs to crustal heat and another for the joint contributions to thegeopotential energy of ocean water. With the transformity of solar equal one, bydefinition, the two equations are used to evaluate transformities of global tidal en-ergy and global deep heat contribution.
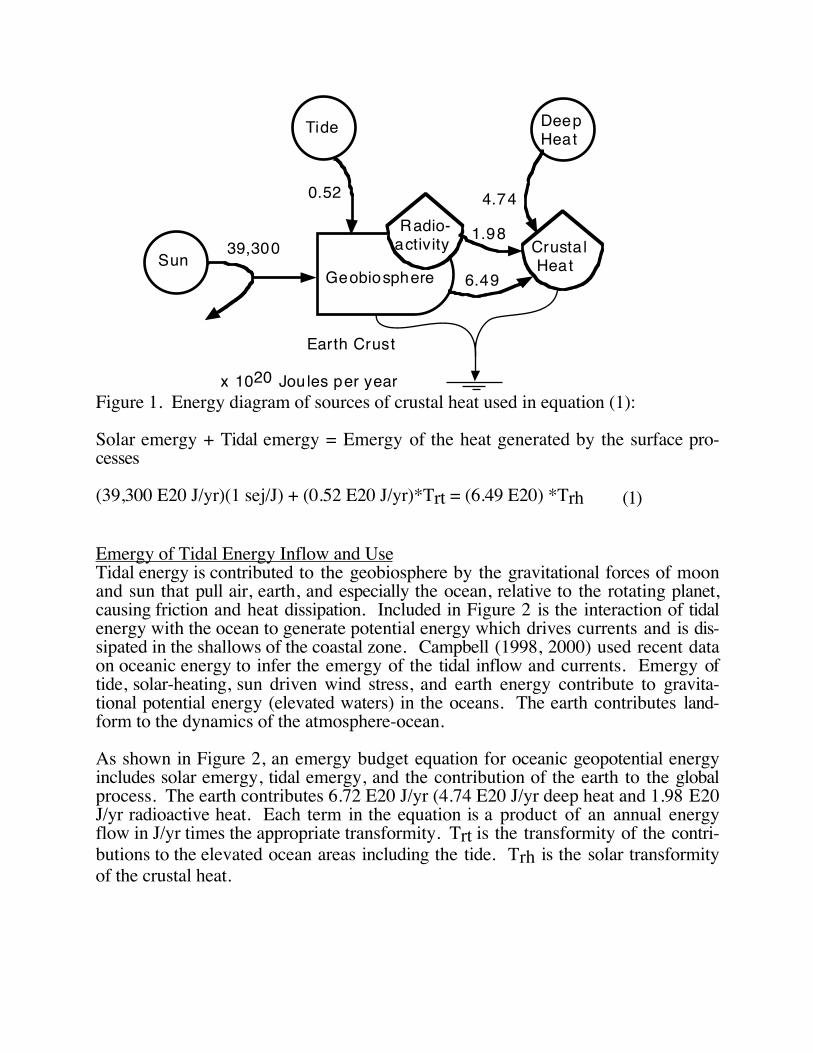
Emergy of Heat in the CrustPictured in Figure 1 are the main processes contributing 13.21 E20 J/yr heat to theearth's crust as given by Sclater et al. (1980). By subtracting the estimate for ra-dioactivity generation (1.98 E20 J/yr) and heat flux up from the mantle (4.74 E20J/yr), the remaining annual flow of 6.49 E20 joules per year can be attributed to thesources from above, the sun and tide that drive the atmosphere, ocean, hydrological,and sedimentary cycles. These processes contribute heat downward by buryingoxidized and reduced substances together, by friction, and by compressing sedimen-tary deposits. In the following emergy equation, each term is a product of solartransformity and energy flow. Trh is the transformity of the crustal heat flow andTrt the transformity of the tidal input.
Sun
Tide DeepHeat
Geobiosphere
Radio-activity Crusta l
Heat39,300
x 1020 Joules per year
4.74
1.98
6.49
0.52
Earth Crust
Figure 1. Energy diagram of sources of crustal heat used in equation (1):
Solar emergy + Tidal emergy = Emergy of the heat generated by the surface pro-cesses
(39,300 E20 J/yr)(1 sej/J) + (0.52 E20 J/yr)*Trt = (6.49 E20) *Trh (1)
Emergy of Tidal Energy Inflow and UseTidal energy is contributed to the geobiosphere by the gravitational forces of moonand sun that pull air, earth, and especially the ocean, relative to the rotating planet,causing friction and heat dissipation. Included in Figure 2 is the interaction of tidalenergy with the ocean to generate potential energy which drives currents and is dis-sipated in the shallows of the coastal zone. Campbell (1998, 2000) used recent dataon oceanic energy to infer the emergy of the tidal inflow and currents. Emergy oftide, solar-heating, sun driven wind stress, and earth energy contribute to gravita-tional potential energy (elevated waters) in the oceans. The earth contributes land-form to the dynamics of the atmosphere-ocean.
As shown in Figure 2, an emergy budget equation for oceanic geopotential energyincludes solar emergy, tidal emergy, and the contribution of the earth to the globalprocess. The earth contributes 6.72 E20 J/yr (4.74 E20 J/yr deep heat and 1.98 E20J/yr radioactive heat. Each term in the equation is a product of an annual energyflow in J/yr times the appropriate transformity. Trt is the transformity of the contri-butions to the elevated ocean areas including the tide. Trh is the solar transformityof the crustal heat.

Sun
Tide
39,300
x 1020 Joules per year
0.52
OceanGeopot.Energy
6.72
1.62
EarthDeepHeat
Figure 2. Energy diagram showing sources of oceanic geopotential used in equation(2):
Solar emergy + Tidal emergy + Deep Earth emergy = Oceanic geop. emergy
(39,300 E20)*1.0 + (0.52 E20)*Trt + (6.72 E20)*Trh = (2.14 E20)*Trt (2)
Combining EquationsTo obtain the unit emergy values (solar transformities), equation (1) was subtractedfrom equation (2) to obtain:
(6.72 E20)*Trh = (2.14 E20) *Trt - (6.49 E20) Trh
From this the solar transformity for tide was found to be
Trt = 6.17 Trh
which was substituted in equation 1 to obtain the solar transformity of crustal heat:
Trh = 11,981 sej/J
and the solar transformity of tide:
Trt = 6.17*11,945 = 73,923 sej/J

Transformities of renewable inputs to the geobiosphere are summarized in Table 1.These were also used in Folio #1 to estimate the total annual emergy budget of thegeobiosphere as 15.82 E24 sej/yr (solar emjoules per year).
Table 1Emergy of Inputs to the Geobiosphere
__________________________________________________________________Note Inflow Solar Transformity Empower*
sej/J 1024 sej/yr__________________________________________________________________1 Solar energy absorbed 1 3.93
2 Crustal heat sources 1.20 x 10⁴ 8.06
3 Tidal energy absorbed 7.37 x 10⁴ 3.83
Total Global Empower -- 15.83__________________________________________________________________sej/J = solar emjoules per joule* Global annual energy flow times solar transformity
Footnotes for Table 1
1 Transformity is 1.0 by definition; energy flow: 3.93 E24 J/yr based on solar con-stant 2 gcal/cm2/min, 70 % absorption, and 1.27 E14 m2 cross section facing thesun.
2 Transformity from emergy equation for crustal heat solved in previous section;heat release by crustal radioactivity 1.98 E20 J/yr plus 4.74 E20 J/yr heat flow fromthe mantle (Sclater et al., 1980) (Figure 1)
3 Transformity from emergy equation for geopotential of oceans in previous sec-tion. Energy flow 0.52 E20 J/yr (Miller, 1966) (Figure 2)
2. Emergy of Atmospheric Circulation
The abundant small circulation cells of the atmosphere converge and trans-formtheir energy into larger scale storms. These have less total energy flow but higherconcentration, more potential energy storage, kinetic energy, transformity, and con-trol action. Then these converge, concentrate, and transform into even larger circu-lation units that last longer and impact more. Low level circulation over the broadocean surface collects latent heat which contributes to the convection over land,somewhat higher in the energy hierarchy. Table 2 evaluates transformities for thekinetic energy of the atmosphere.

Table 2Energetics of Atmospheric Circulation Units
__________________________________________________________________Note Circulation Unit Kinetic Energy Flow Transformitya
J/yr sej/J__________________________________________________________________1 Over ocean circulation
Latent heat into air 9.3 E23 12Kinetic energy used 2.33 E21 192
2 Cumulus land circulation 9.45 E21 485
3 Mesosystems 1.73 E22 912
4 Temperate cyclones 4.9 E21 3230
5 Hurricanes 6.1 E20 6487
6 Hemisphere general circulationSurface winds 1.61 E22 983Average circulation 6.4 E21 2473Tropical jets 3.7 E21 4278Polar jet 1.61 E21 9832
__________________________________________________________________Abbreviations: J/yr = joules per year; sej/yr = solar emjoules per year
a Solar transformity indicates position in the levels of energy hierarchy and quality.All or an appropriate fraction of the global annual emergy (15.83 x 1024 sej/yr) wasdivided by the annual energy flow for that earth process.
Footnotes for Table 2
1 Latent heat from low level ocean circulation:Latent heat of whole ocean from Peixota and Oort (1992 p.172)(1066 mm/yr)(1000 g/m2/mm)(0.58 kcal/g)(4186 J/kcal)(3.6 E14 m2/ocean) = 9.3E23 J/yr latent heat into air
(0.2 w/m2)(3.7 E14 m2 ocean)(3.15 E7 sec/yr) = 2.33 E21 J k. energy useTransformity: emergy split by energy 96% latent, 4% kinetic and 71% of area.Latent heat (0.96)(0.71)(15.83 E24 sej/yr)/9.3 E23 J/yr = 11.6 sej/J
Vertical circulation, kinetic energy(0.04)(0.71)(15.83 E24 sej/yr)/2.33 E21 J/yr = 192 sej/J

2 Land cumulus circulation: eddy kinetic energy flow from Peixota and Oort(1992) and Reiter (1969) for land, 2 watts/m2
(2 J/m2/sec)(1.51 E14 m2 land) (3.15 E7 sec/yr) = 9.45 E21 J/yrTransformity for land area (0.29)(15.83 E24)/9.45 E21 J/yr = 485 sej/J
3 Mesosystems: kinetic energy generation and use (Lin and Coover, 1988; Lin andShen, 1991). Large thunderstorm, 13.5 w/m2; squall line, 8.1 w/m2; area of earthoccupied by mesoscale storms 1%)(10.8 J/m2/sec)(3.15 E7 sec/yr)(5.1 E14 m2/earth)(0.01) = 1.73 E22 J/yr
4 Dissipation of extra-tropical cyclones, 9780 cyclones/5 yr(Wiin-Nielsen and Chen, 1993)(0.3 J/m2/sec)(3.15 E7 sec/yr)(5.21 E14 m2/earth) = 4.9 E21 J/yrTransformity: (15.83 E24 sej/yr)/(4.9 E21 j/yr) = 3230
Related data:Palmen and Holopainen (1962) kinetic energy generation(11.7 E13 J/sec)(3.15 E7 sec/yr) = 3.7 E21 J/yr
Related data:Palmen and Newton (1969), generation rate16-21 w/m2;assume 15% of earth in temperate storms:(18 J/m2/sec)(3.15 E7 sec/yr)((5.1 E14 m2/earth)(0.15) = 4.3 E22 J/y
Related data:Eddy dissipation in zonal analysis (Wiin-Nielsen and Chen, 1993)(1.8 J/sec)(3.15 E7 sec/yr)(5.21 E14 m2/earth) = 2.95 E22 J/yr
Smith (1980) summary of extra-tropical cyclone kinetic energy dissipation(6.3 J/m2/sec)(3.15 E7 sec/yr)(5.21 E14 m2/earth) = 1.01 E23
5 Tropical hurricanes, kinetic energy flow in global hurricanesChang (1972, page 103): 2-6 E19 J/day of latent heat release;at 3% conversion to kinetic energy and dissipation: 0.6-1.8 E18 J/day. Riehl (1979)kinetic energy dissipation 1.29 E18 J/day.With 78 storms/yr and lifetime of 6 days(1.3 E18 J/day)(6 days/storm)(78 storms/yr) = 6.1 E20 J /yrSplit of the whole-earth emergy: assume the area and time for hurricanes requires25% of earth in course of a year.(15.83 E24 sej/yr)(0.25)/6.1 E20 J/yr = 6487 sej/J
6 Hemisphere circulation:Surface winds, kinetic energy dissipation: 1 w/m2

(1 J/m2/sec)(3.15 E7 sec/yr)(5.1 E14 m2/earth) = 1.61 E22 J/yrTransformity: (15.83 E24 sej/yr)/(1.61 E22 J.yr) = 983 sej/J
Average circulation, zonal dissipation of general circulation:Wiin-Nielsen and Chen (1993) 8.8 E20 J/yr standing kinetic energyquotes Oort composite diagram on page 82(0.4 J/sec)(3.15 E7 sec/yr)(5.21 E14 m2/earth) = 6.4 E21 J/yr
Kinetic energy of main wind flow dissipation from Peixota and Oort (1992)(0.18 J/sec/m2)(5.1 E14 m2/earth)(3.15 E7 sec/yr) = 2.9 E21 J/yr
Kinetic energy production in cross latitude circulation(Palmen and Newton, 1969)Winter 19 E13 watts; summer 1 E13 watts;(10 E13 J/sec)(3.15 E7 sec/yr) = 3.15 E21 J/yrTransformity 15.83 E24/3.15 E21 = 5025 sej/J
Tropical jet: Krishnamurti (1961); Wiin-Nielsen and Chen (1993)Rate of dissipation of mean flow of tropical jet: 0.23 w/m2
(0.23 J/sec/m2)(3.15 E7 sec/yr)(5.1 E14 m2/earth) = 3.7 E21 J/yr/jet
Polar jet: zonal kinetic energy dissipation (Oort and Peixoto (1974)(0.1 J/m2/sec)(3.15 E7 sec/yr)(5.12 E14 m2/yr) = 1.61 E21 J/yrTransformity: (15.83 E24 sej/yr)/(1.61 E21 J/yr) = 9832 sej/J
Emergy of the Circulation Units in the AtmosphereExtensive research in recent decades has estimated the transformations of energyinto available potential energy and the resulting kinetic energy of circulation.Circulation units of different size form an energy hierarchy.
Energy flow is largest with small scale circulation, often marked by cumulus cloudsnear the surface over land and ocean. Mesoscale systems such as large thunder-storms, squall lines and fronts, have less energy but higher transformities.Temperate cyclones and tropical hurricanes are next in the global hierarchy. Theupper westerlies and jet streams have least energy, highest transformity and controlactions, a familiar property among forecasters who find the movements of thesmaller systems are controlled by the air flows above.
Table 2 evaluates energy flows for the various kinds of circulation and derives trans-formities. Where the main categories of circulation are necessary to the whole sys-tem, the emergy budget of the whole geobiospere is appropriate for estimating unitemergies. As footnotes indicate, some categories were identified as in parallel andcalculated as splits. Items are arranged from top to bottom in order of increasingscale and transformity. In general, the scale and transformities increase with altitude.

Emergy of Latent Heat Flux and Rain with AltitudeAir high in the atmosphere is supported by air underneath. Like air in a stack ofpillows, the air at the bottom is compressed by the weight above. The populationsof molecular motions at the bottom support those higher up. Even for this staticsituation, more energy is involved at the bottom to support less at the top.Available energy flows from the solar-heated earth surface upward, much of it in thelatent heat of evaporated water, especially from the oceans. Some of the water va-por that carries the heat of vaporization drawn from the sea surface is transferredupward as part of successive transformations in larger and larger whirlcells. The en-ergy-containing water vapor is converted into rain at each stage as part of what isnecessary to transfer a smaller amount to the next altitude. As a result, water vaporat high altitudes has higher transformity as suggested by Table 3, which estimatesthe average water vapor with altitude, the annual flux of latent heat reaching thesealtitudes, and the transformity of that latent heat, based on global annual emergybudget.
Table 3Emergy of Global Water Vapor Flux with Altitude
__________________________________________________________________Note Level Emergy* Latent Heat Transformity**
m E24 sej/yr E23 J/yr sej/J__________________________________________________________________1 Surface 15.83 12.9# 12.22 990 15.83 7.4 21.43 1950 15.83 6.3 25.14 3010 15.83 3.7 42.75 4200 15.83 1.4 113.06 5570 15.83 0.90 176.07 7180 15.83 0.65 244.0 __________________________________________________________________* Solar emergy inputs (solar empower) to the geobiospheric system from Table 1 ofFolio #1 not including non-renewable consumption (fossil fuel and mineral use).
# Global latent heat, evapotranspiration 1020 mm/yr,(1020 mm/yr)(1000 g/m2/mm)(0.58 kcal/g)(4186 J/kcal)(5.21 E14 m2)= 1.29 E24 J/yr
** Solar transformity calculated by dividing emergy flow from column 3 by the la-tent heat flux in column 4.Abbreviation: sej/yr = solar emjoules per year
2-7 Latent heat reaching levels in the atmosphere calculated in proportion to thefraction of surface water vapor at each level. Precipitable water for each level wascalculated from a global diagram of water vapor with pressure and latitude fromNewell et al. (1972) given by Houghton (1977). Water vapor with altitude was cal-

culated for pressures, temperature and density of standard atmosphere (Berry et al.,1945):
Altitude Mixing Ratio Absolute Humidity Fraction of Surfacem g/kg g/m3 %110 7.72 10.3 100990 5.43 6.0 58
1950 4.94 5.0 493010 3.28 3.0 294200 2.11 1.1 115570 1.06 0.7 77180 0.83 0.5 5
Precipitation varies with altitude, is affected by mountains, and depends on theweather systems in complex ways. For example, Glazir (1997) found the rainfallvarying with altitude in mainland Asia. Rainfall increased with altitude in summer,but decreased with altitude in winter. Rains and snows that fall at high altitudes havehigher real wealth value because of the high transformity of the processes in the up-per air. In order to estimate global emergy per unit rainfall with altitude, the percentof global rainfall at each altitude was assumed to be proportional to the percent ofsurface latent heat flux reaching that altitude (last two columns in Table 3). Thesevalues of emergy per unit rain by altitude are useful for estimating inputs to moun-tain landscapes.
The evaluations in Table 3 are for the whole earth with 70% ocean. Regarding theland to be a higher level in the hierarchical organization of the geobiosphere, thenrain over the land represents a convergence of oceanic resources. From line 1 inTable 4, transformity of continental rain is 2.9 E4 sej/J, and emergy/mass is 14.5 E4sej/g.
Table 4Evaluation of Continental Rainfall with Altitude*
__________________________________________________________________Note Level Emergy* Rain# Emergy/Mass Transformity**
m E24 sej/yr E20g/yr E4 sej/g E4 sej/J__________________________________________________________________1 Surface 15.83 1.09 14.5 2.92 990 15.83 0.63 25.1 5.03 1950 15.83 0.53 29.9 6.04 3010 15.83 0.31 50.3 10.05 4200 15.83 0.12 131.0 26.16 5570 15.83 0.08 198.0 39.57 7180 15.83 0.05 315.0 63.1__________________________________________________________________* Emergy flow based on flux of latent heat in Table 3.

# Continental rain at each level is estimated by multiplying the total continental rain(1.09 E20 g/yr from Ryabchikov, 1975) by the percentage of global latent heat fluxabove that level from note 2-7 in Table 3.
** Solar transformity calculated by dividing the emergy/mass in column 5 by 5joules Gibbs free energy per gram of fresh water relative to sea water.
Emergy of Dry AirOrganization of the atmosphere cascades water vapor upward in its up currents, butit also generates dry air in parts of its circulation, in descending air, over deserts,removing waters from air masses by chilling and condensing in upper altitudes andat the poles. Dry air has available energy relative to wet surfaces. Thus, dry windsare a principal energy source, driving transpiration of water from stomata of leaves,the predominant integrating process in terrestrial photosynthetic production on land.The potential energy in dry air is the Gibbs free energy of the saturation deficit(difference between the air's vapor pressure and saturation vapor pressure).Especially when rains are not limiting, energy of dry air in wind flows is a valuableresource, one of the reasons for rapid growth of trees in New Zealand and the westcoast of the United States. The energy of dry air contributes to the rapid geologicalcycles of arid areas.
Tilley (1999) evaluated the energy and transformity of dry air over land (Table 5).Transformity of dry air energy increases with elevations, since properties at higherlevels are mostly based on the emergy contributed to the atmosphere at the surface.Higher altitudes contain higher levels in the energy hierarchy.
Table 5Emergy of Saturation Deficit with Altitude over Land
(Tilley, 1999)__________________________________________________________________Note Height Saturation Deficit Energy* Energy Flux# Transformity**
m Millibars 1019 J 1021 J/yr sej/J__________________________________________________________________1 0 8.1 36.1 16.1 9822 1,500 6.2 10.9 13.6 1,1633 3,010 4.0 8.5 8.8 1,7984 4,750 1.3 8.7 5.0 3,1665 7,200 0.3 2.2 1.14 13,885__________________________________________________________________* Energy at each level calculated with data on atmospheric temperature and humid-ity over land from global climate data set (New et al., 1998) and upper air (Peixotoand Oort, 1996 and Haurwitz and Austin, 1944) were used to prepare a table of wa-

ter vapor pressure (e) and saturation deficit (e-es) by latitude and altitude.Saturation vapor pressure es = air pressure/622.Gibbs free energy G was calculated for vapor pressure difference in J/g: G = (1/m)RT Ln (e/es)= (1/18 mole/g)(8.33 E3 J/mole-deg)(T deg K)(Ln e/es).Energy in saturation deficit for air volumes at each altitude level was obtained fromthe product of air density, vapor mixing ratio, and energy per mass: (g/m3 air)(gvapor/kg air)(G in J/g vapor)/1000
#Energy flux replacing dry air energy at the level and above; 0.35 E19 J above the7,200 m level. Sum of energy at the level and above from column 4 was divided by8.2 days replacement time and multiplied by365 days/yr.
**Global annual emergy budget, 15.83 E24 sej/yr from Table 1 divided by flux, toreplace the dry air energy at and above the altitude in Column 5.
1 Mean annual saturation deficit energy in whole atmosphere: 36.1 E19 joules;turnover time 8.2 days; mean value/turnover time = 16.1 E21 J/yr
2-5 Altitudes from standard atmosphere for levels with air pressures 1000, 850,700, 550, and 400 millibars
3. Emergy of Ocean Processes
This section evaluates emergy flows in the ocean.
Emergy of Ocean CirculationThe circulation of the oceans is a major part of the geobiosphere. Like the atmo-sphere, it forms a hierarchy of circulation units. Available energy for ocean currentscomes from the stress of atmospheric winds, from differences in geopotential densitygradients from differential heating, from density differences due to salinity gradients(river discharges, melting ice, and differential evaporation), from tidal energy, andgeomorphology of the ocean basin affected by earth processes. The most energy isin the small scale circulation at the ocean surface. Less energy and higher trans-formities are in the mesoscale gyrals (medium scale eddies in coastal waters and ed-dies from jets). The large scale general circulation of the oceans have highest trans-formities, with less energy overall, especially as emergy is converged in jets like thegulf stream.
Table 6 uses data from various sources to evaluate the transformities of four cate-gories of circulation. Transformities for kinetic energy of ocean currents are muchhigher than those for winds on which they partly depend. Values for ocean currentsare similar in magnitude for those in the largest rivers

Table 6Energetics of Ocean Circulationa
_________________________________________________________________Note Circulation Unit Annual Transformityc
Energy sej/unitd
J/yrb_________________________________________________________________1 Surface eddies, J 3.0 x 10²⁰ 5.3 x 10⁴ sej/j
2 Mesoscale gyrals, J 1.78 x 10¹⁹ 8.9 x 10⁴ sej/J
3 Sea Ice, g 3 x 10¹⁹ 5.3 x 10⁵ sej/g
4 Sea ice, J 9.0 x 10¹⁹ 1.76 x 10⁵ sej/J
5 Ocean circulation, J 8.5 x 10¹⁷ 1.87 x 10⁷ sej/J
6 Jet currents, J 1.67 x 10¹⁷ 9.4 x 10⁷ sej/J_________________________________________________________________a Ocean mass: 1.37 x 1024 g; surface area, 3.61 x 10⁸ km2; average depth 3,795m (Monin et al., 1977). One meter per second (m/sec) = 2.237 miles per hour(mph)
b Abbreviation: joules per year = J/yr
c Solar transformity indicates position in the levels of energy hierarchy and quality.Global annual emergy (15.83 x 1024 sej/yr) divided by the annual energy flow fromcolumn 3.
d Abbreviation: solar emjoules per joule = sej/J
Footnotes for Table 6
1 Energy in surface eddies for the area of all oceans, from wind waves, heating,density differences, etc. Energy in transient eddies to 200 m depth from Oort et al.(1989): 2.5 E 18 J; assume replacement time 3 days:(2.5 E18 J/eddies)(121 eddies/year) = 3.025 E20 J/yr
2 Coastal gyrals, Gulf Stream eddies, scale about 10-300 kmSample of kinetic energy in mesoscale eddies of the northwest Atlantic Ocean fromcoast to central ocean from Richardson (1993)(165 cm2/sec2/g)(1 E6 cm3/m3)(1.025 g/cm3)(1000 m thick)/1 E7 erg/J)

= 16,500 J/m2 stored energyEnergy replacement time, Oort et al., weeks to months: 0.33 year(16,500 J/m2)(3 times/yr)(3.6 E14 m2/ocean) = 1.78 E19 J/ocean/yr
3 Sea Ice; estimates from N. Untersteiner in Fairbridge (1966):Mean total mass of sea ice: 4.5 E4 km3; annual freezing and melting:3 E4 km3/yr (67%). (3 E13 m3/yr/earth)(1 E6 g/m3) = 3 E19 g/yr/earth
4 Sea Ice, reversible energy of crystallization relative to meltwater;(3 E19 g/yr)(0.080 kcal/g ice)(4186 J/kcal) = 1.0 E22 J/yr (state change).Calculation of transformity made on the premise that sea ice is a necessary compo-nent of the oceanic-atmosheric system.
Ice energy in note 4 is available energy when advection of surrounding air and wa-ter temperature is different from 0 deg C. Calculation uses 5 deg C difference toestimate Carnot fraction (5 deg/278 deg Kelvin = 0.018) and operation of energytransfer at optimum efficiency = half of Carnot)(1.0 E22 J/yr)(0.018)(0.5) = 9.0 E19 J/yr.
5 Total current energy of the oceans estimated by Oort et al. (1989) as1.8 x 1018 J based on average velocity of 5.0 cm/sec. Replacement time assumed 2years:(0.5)(1.37 x 10²¹ kg)(0.05*0.05 m2/sec2)(2 yr) = 8.5 E17 J/yr
6 Jet Currents estimated for 5 oceans based on Gulf Stream transport (Monin et al.,1977); energy based on assumed velocity 0.5 m/sec:(0.5)(8.5 E6 m3/sec)(1000 kg/m3)(0.5*0.5 m2/sec2)(3.15 E7 sec/yr)(5 oceans) = 1.67 E17 J/yr
Heated Surface Waters and Ocean Thermal Energy Conversion (OTEC)The available energy between the heated upper waters of tropical seas and thecolder waters below has been much studied as a potential energy source for operat-ing a heat engine for mechanical or electric power. Table 7 is the result of an OTECevaluation of a proposed land-based installation in Taiwan, where detailed economicevaluations were made. Trans-formities of the warmed surface waters of the oceanare small. The trans-formity found for electric power is similar to the average ofmany other power generating processes (Odum, 1996, appendix).

Table 7Transformities of Surface Ocean Heat*
__________________________________________________________________Note Available Energy Solar Transformity
sej/J__________________________________________________________________1 Warm-cold stratification 3.7
2 Available energy in ocean heat 60
3 Electric power from OTEC 1.76 E5__________________________________________________________________* Modified from Odum (2000)
Footnotes for Table 7
1 Annual production of energy of thermal difference: triangular hypsographic sec-tion multiplied by half of area of ocean and the temperature difference and dividedby 1 year replacement time(0.5)(1000 m)(0.5)(1.5 E14 m2)(27.5 deg)(1 gcal/cm3/deg)(1 E6 cm3/m3)(4.186 J/gcal) = 4.3 E24 J/yr
Transformity using earth emergy from Table 1 Folio 1.(15.83 E24 sej/yr/earth)/(4.3 E24 J/yr) = 3.7 sej/J
2 Earth Emergy input divided by half the Carnot fraction of the heat productionfrom note #1(11.82 E24 sej/yr)/[(0.5)(27.5/300.5)(4.3 E24 J/yr)] = 60 sej/J
3 Electric Power transformity from sum of emergy inputs divided by net poweroutput.
Input emergy of equipment, services, and investment costs estimated by Tseng et al.(1991) multiplied by emergy/money ratio for Taiwan (2 E12 sej/$): 1.46 E19 sej/yr.
Aluminum pipe use per yr, with 2 E10 sej/g: 0.046 E19 sej/yr
Warm water use times heat content and Carnot fraction: 3.0 E16 J/yrEmergy from available energy in water times transformity from Note 2(3.0 E16 J/yr)(60 sej/J) = 0.12 E 19 sej/yr
Emergy input sum: (1.46 + 0.46 + 0.12) E19 = 2.04 E19 sej/yr
(Empower: 2.09 E19 sej/yr)/(Net power, 1.19 E14 J/yr) = 1.75 E5 sej/J

4. Emergy of Earth Processes
After several billion years of development, the land of the geobiosphere has beenself organized into a hierarchy of components and cycles on many scales.Circulation of the land is driven by the atmosphere, ocean, hydrological cycle, anddeep convection of the hot mantle below. Emergy of the geobiospheric enginesconverge materials to build rock and sustain continents against the flows of dispersaland recycle. Included are processes of chemical concentration and crystallizationand erosion. Within the continents, mountains are hierarchical energy centers. Inthis section data from the literature are used to evaluate the emergy of principalparts of the earth cycles. Available energy is stored and transformed in geopotentialand chemical potential form. For many purposes emergy evaluations on a mass ba-sis (emjoules per gram) are the most useful for making calculations. Tables 8-10evaluate the flows supporting the main features of the solid earth, the global hydro-logical cycle, and some principal ores and mineral resources of the earth.
Emergy of Main Features of the LandSome major categories such as sedimentary cycle and mountain building can beevaluated in the aggregate as necessary to and requiring the global emergy budget(Table 8). An average annual emergy value of land is obtained from the averagerate of erosion and replacement.
Table 8Emergy of Continental Parts of the Global Energy System
__________________________________________________________________Note Componetnt and Units Emergy* Production Emergy/Unit
E24 sej/yr Units/yr sej/unit__________________________________________________________________1 Earth heat flux, J 15.83 2.74 E20 5.8 E4 sej/J2 Glaciers, mass, g 15.83 2.48 E18 6.4 E6 sej/g
crystal heat, J 15.83 8.3 E20 1.91 E4 sej/Jgeopotential, J 15.83 2.11 E19 7.5 E5 sej/J
available heat, J 15.83 1.38 E19 1.14 E6 sej/J3 Land area sustained, ha 15.83 1.5 E10 1.05 E15 sej/ha4 Land, global cycle, g 15.83 9.36 E15 1.69 E9 sej/g5 Continental sediment, g 15.83 7.4 E15 2.13 E9 sej/g6 Volcanoes, g 15.83 3.05 E15 3.8 E9 sej/g7 Mountains, g 15.83 2.46 E15 6.43 E9 sej/g8 Cratons, g 15.83 0.81 E15 19.5 E9 sej/g__________________________________________________________________
* Main empower of inputs to the geobiospheric system from Table 1, not includingnon-renewable consumption (fossil fuel and mineral use).
Footnotes for Table 81 Earth heat flux out from the land 2.74 E20 J/yr (Wylie, 1971)

2 Glaciers: 2.406 E16 m3; replacement time 9700 yr (Voskresensky, 1978);mass/turnover time = 2.48 E12 m3/yr(2.48 E12 m3/yr)(1 E6 g/m3) = 2.48 E18 g/yr
Reversible energy of heat of Crystallization:(0.080 kcal/g)(4186 J/kcal)(2.48 E18 g/yr) = 8.3 E20 J/yr
Geopotential energy of elevated glacier relative to sea level(870 m avg. land elevation)(9.8 m/sec2)(1 E3 kg/m3)(2.48 E12 m3/yr)= 2.11 E19 J/yr
Available heat if surroundings of ice are 5 deg C warmer. Heat of crystallizationtimes Carnot fraction: (5o/300o K)(8.3 E20 J/yr) = 1.38 E19 J/yr
3 Land area sustained: annual global emergy budget divided by the area of theland sustained in hectares: 1.5 E10 ha/yr.
4 Land cycle: 2.4 cm/1000 yr from Garrels et al. (1975); density 2.6 g/cm3
(0.0024/yr)(2.6 g/cm3)(1.5 E18 cm2 land area) = 9.36 E15 g/yr
5 Continental sediments; calculation by McGrane (1998): mass from Ronov andYaroshevskiy (1976) 1850 E21 g; turnover time 2.5 E8 yr from Veizer (1988);mass/turnover time = 7.4 E15 g/yr
6 Volcanoes: 25.3% of mountains = 3.41 E23 g; turnover 112 E6 yrMass/turnover = 3.05 17 g/yr
7 Moutains: from Veizer (1988): mass in orogenic zones 1.35 E24 g; turnover time548 E6 yr; mass/turnover time = 2.46 E15 g/yr
8 Cratons: Continental blocks of metamorphic and igneous rock; calculation afterMcGrane (1998). 20.1 E24 g from Ronov and Yaroshevskiy (1976); turnover time:half life 1.73 E9 years/0.693 (Veizer (1988); mass/turnover time = 0.81 E15 g/yr
Emergy and the Spatial Organization of the LandBecause of the spatial organization of earth processes there are large differences inrates of earth cycle, energy flux, and unit emergy between the high energy moun-tain centers and the broad low level areas in between. The larger scale features havelonger turnover times, mass storages and unit emergy values. Figure 3, fromChorly et al. (1984), shows the erosion rates increasing with altitude. Here higheraltitude means more mass converging as uplift (Figure 3b), balanced on the averageby higher rates of geologic replacement from below. Higher land elevation repre-sents smaller total quantity but circulating at higher concentration per area.

0.5
0.4
0.3
0.2
0.1
0 1000 2000 3000Altitude of Quadrat, m
Ave
rage
Rat
e of
Ero
sion
, m
/100
0 yr
s
0
Dispersed Sediment
Emergy ofSolar, ti dal & Eart h Energy
Erosion
UpliftProcess
(a)
(b)
(c)
Figure 3. Erosion rate as a function of the altitude of 400 km2 quadrats in theUnited States and Europe (Chorly, 1984, using data of Schumm, 1963.

Land area from the earth's hypsographic curve (area of land versus altitude) wasmultiplied by the erosion rate from Figure 3a to obtain the areal distribution of earthcycling. This pattern of mass flow is interpreted as the result of successive energytransformations by the lower altitudes supporting uplift at higher altitudes (Figure3c). Hence, the mass flow at each level is related to the whole earth emergy to ob-tain the emergy per mass with altitude (Table 9). The unit emergy values are alsoappropriate for evaluating sediments generated in the earth cycle.
Table 9Annual Emergy Contributions to Elevated Lands*
_________________________________________________________________Altitude Areaa Erosion Rateb Mass Upflowc Emergy/massd
km 1012 m2 103 g/m2/yr 1015 g/yr 109 sej/g_________________________________________________________________
0 148.1 -- 9.36 1.7
1 42.3 0.15 6.34 2.5
2 19.7 0.29 5.71 2.8
3 8.5 0.44 3.74 4.2
4 2.7 0.60 1.62 9.8
5 0.5 0.76 0.38 41.6_________________________________________________________________Abbreviations: sej = solar emjoules; yr = year; E3 means multiplied by 103
a From global hypsographic curve for land (Scheidegger, 1963)
b See Figure 3 from Chorly et al. (1984). Y = 0.1535 X - 0.0108
c Product of column #2 and #3
d For sea level, average value for earth replacement from item 4, Table 8 For upperlevels: 15.83 E24 sej/earth from Table 1 divided by mass flow in column #4
Emergy of RocksThe self organizational processes of the earth circulation generate many kinds ofrock. Sediments become cemented, reefs are generated by eco-systems, sedimen-tary rocks are metamorphosed, etc. Table 10 estimates unit emergy for some rockswhich are major, necessary components of the earth cycles for which the total earth

emergy was assigned, a procedure appropriate for co-products. Perhaps evaluationof rock types with data from smaller scale case histories can be assembled in the fu-ture for comparison.
Table 10Emergy of Sediments and Rocks
__________________________________________________________________Note Component and Units Emergy* Production Emergy/Unit
E24 sej/yr E15 g/yr E9 sej/g__________________________________________________________________1 Global land cycle, g 15.83 9.36 1.69
2 Continental sediment, g 15.83 0.4-9.4 1.7-42
3 Pelagic-abyssal sediment, g 15.83 9.7 E15 1.63
4 Shale 15.83 3.9 E15 4.1
5 Sandstone 15.83 1.87 E15 8.5
6 Limestone 15.83 1.68 E15 9.5
7 Evaporites 15.83 0.094 169.0
8 Oceanic basalt, g 15.83 63.4 0.25__________________________________________________________________* Main empower of inputs to the geobiospheric system from Table 1 not includingnon-renewable consumption (fossil fuel and mineral use). Total global emergy bud-get is used for items believed mutually necessary to the global system as presentlyorganized to be regarded as co-products.
1 Total land cycle repeated from item #4 in Table 8: 9.36 E25 g/yr
2 Continental sediment values for different altitudes from Table 7
3 Pelagic Sediment: storage 0.63 E24 g; turnover time 64.9 E6 yrs (Veizer, 1988;storage/turnover time = 9.7 E15 g/yr
4 Shale: mass circulation = 42% of continental area (item #1)
5 Sandstone: mass circulation = 20% of continental area (item #1)
6 Limestone:mass circulation = 18% of continental area (item #1)
7 Evaporites: mass circulation = 1% of continental area (item #1)

8 Oceanic basalt: Storage 5.4 E24 g; turnover time 85.1 E6 yrs (Veizer, 1988);storage/turnover time = 63.4 E15 g/yr
Literature Cited
Berry, F.A., E. Bollay and N.R. Beers. 1945. Handbook of Meteorology. McGrawHill, NY. 1068 pp.
Campbell, D. 1998. Emergy analysis of human carrying capacity and regional sus-tainability: an example using the state of Maine (Appendix). EnvironmentalMonitoring and Assessment 51:531-569.
Campbell, D. 2000. A revised transformity for tidal energy received and tidal en-ergy dissipated globally: implications for emergy analysis. Proc. of Energy Qualityand Transformity Conference, Gainesville, FL.
Chang, J. 1972. Atmospheric Circulation Systems and Climates Honolulu. OrientalPubl. Co., Hawaii. 328 pp. (p. 103)
Chorly, R.J., S.A. Schumm, and D.E. Sudggen. 1984. Geomorphology. Metheun,London, U.K.
Collins, D. and H.T. Odum. 2000. Evaluating Emergy and Transformity fromEnergy Transformation Equations (manuscript submitted).
Fairbridge, R.W. 1966. Encyclopedia of Oceanography. Reinhold Press, NY.1021 pp.
Garrels, R.M., F.T. Mackenzie, and C. Hunt. 1975. Chemical cycles and the globalenvironment. William Kaufmann, Los Altos, CA. 206 pp.
Glazir, G.E. 1997. Precipitation distribution with altitude. Theoret. and AppliedClimatology 58(3-4):141-145.
Haurwitz, B. and J.M. Austin. 1944. Climatology. McGraw Hill, NY.
Houghton, J.T. 1977. The Physics of Atmospheres. Cambridge Univ. Press,London, U.K.
Kinsman, B. 1965. Wind, Waves, Their Generation and Propagation on the OceanSurface. Prentice-Hall, Englewood Cliffs, NJ. 676 pp.
Krishnamurti, T.N. 1961. The subtropical jet stream of winter. J. Meteorology18:172-191 & 647-670.

Lin, Y. and H. Shen. 1991. Kinetic energy budgets of a subtropical squall line de-termined from TAMEX l Dual Doppler Measurements. Monthly Weather Review119:2654-2663.
Lin, Y.J. and Coover. 1988. A kinetic energy analysis of a microburst-producingthunderstorm based on JAWS dual Doppler data. J. Atmospheric Science 45:2764-2771.
McGrane, Guy. 1998. Simulating Whole-earth Cycles Using Hierarchies and OtherGeneral Systems Concepts. Ph.D. Dissertation, Univ. of Florida, Gainesville. 372pp.
Monin, A.S., V.M. Kamenkovich, V.G. Kort . 1977. Variability of the Oceans (Engl.Translation). Wiley, NY. 241 pp.
Miller, G.A. 1966. The flux of tidal energy out of the deep oceans. J. GeophysicalRes. 71:2485-2489.
New, M., M. Hulme and P.D. Jones. 1998. Representing twentieth century space-time climate variability; Part 1: development of a 1961-90 mean monthly terrestrialclimatology. J. Climate ????
Newell. R.E., J.W. Kidson, D.G. Vincent, and G.J. Boer. 1972. The GeneralCirculation of the Tropical Atmosphere, Vol. 1. M.I.T. Press, Boston, MA.
Odum, H.T. 1996. Environmental Accounting, Emergy and Decision Making. J.Wiley, NY. 370 pp.
Odum, H.T. 2000. Emergy evaluation of an OTEC electrical power system.Energy 25: 389-393.
Odum, H.T. and E.C. Odum, eds. 1983. Energy Analysis Overview of Nations.Working Paper WP-83-82. International Institute for Applied Systems Analysis,Laxenburg, Austria. 469 pp.
Oort A.H. and J.P. Peixoto 1974. The annual cycle of the energetics of the atmo-sphere on a planetary scale. J. Geophys. Res. 79: 2705-2719.
Oort, A.H., S.C. Ascher, S. Levitus, and J.P. Peixoto. 1989. New estimates of theavailable potential energy in the World Ocean. J. Geophysical Research 94:3187-3200.
Palmen, E. and C.W. Newton. 1969. Atmospheric Circulation Systems, TheirStructure and Physical Interpretation. Academic Press. 602 pp.

Palmen, E. and E.O. Holopainen. 1962. Divergence, vertical velocity and conver-sion between potential and kinetic energy in an extratropical cyclone. Geophysica8:89-112.
Patterson, M. 1993. Approaches to energy quality in energy analysis. Int. J. ofGlobal Energy Issues 5:19-28.
Patterson, M. 1996. What is energy efficiency? Concepts indicators and methdo-logical issues. Energy Policy 24:377-390.
Peixoto, J.P. and A.H. Oort. 1992. Physics of Climate. Amer. Inst. of Physics, NY.520 pp.
Peixoto, J.P. and A.H. Oort. 1996. The climatology of relative humidity in the at-mosphere. J. Clim. 9(12):3443-3463.
Reiter, E.R. 1969. Atmospheric Transport Processes, Part I, Energy Transfers andTransformations. AEC Critical Review Series. U.S. Atomic Energy Commission,Division of Technical Information, Oak Ridge, TN. 253 pp.
Richardson, P.L. 1993. Tracking ocean eddies. American Scientist 81:261-271.
Riehl, H. 1979. Climate and Weather in the Tropics. Academic Press, NY. 611pp.
Ronov, A.B. and A.A. Yaroshevskiy. 1976. A new model of the chemical structureof the earth's crust. Geokhymia (aka Geochemistry International) n12, p. 1761.
Ryabchikov, A. 1975. The Changing Face of the Earth. Translated by J. Williams.Progress Publishers, Moscow. 203 pp.
Sclater, J.F., G. Taupart, and I.D. Galson. 1980. The heat flow through the oceanicand continental crust and the heat loss of the earth. Rev. Geophys. Space Phys.18:269-311.
Smith, P.J. 1980. The energetics of extra tropical cyclones. Reviews of Geophysicsand Space Physics 18(2):378-386.
Scheidegger, A.E. 1963. Principles of Geodynamics. Academic Press, NY.
Tseng, T.G.H., M.Y. Kao, and J.C. Yang. 1991. Optimal design of a pilot OTECpower plant in Taiwan. J. Energy Res. Technol. 113:294-299.
Tilley, D.R. 1999. Energy Basis of Forest Systems. Ph.D. Dissertation,Environmental Engineering Sciences, Univ. of Florida, Gainesville. 295 pp.

Untersteiner, N. 1966. Sea Ice. pp 777-781 in Fairbridge (1966).
Veizer, J.M. 1988. The evolving exogenic cycle. pp. 175-219 in Chemical Cyclesin the Evolution of the Earth, ed. by C.B. Gregor, R.M. Garrels, F.T. Mackenzie andJ.B. Maynard. Wiley, NY. 276 pp.
Voskresensky, K.P. 1978. Water of the Earth; Water Cycle on Earth. pp 42-45;104-117 in World Water Balance and Water Resources of the Earth, UNESCO.663 pp.
Wiin-Nielsen, A. and T. Chen. 1993. Fundamentals of Atmospheric Ener-getics.Oxford Press, NY. 376 pp.
Wylie, P.J. 1971. The Dynamic Earth. Wiley, NY. 415 pp.

Index of Emergy Evaluations in Folio #2
Basalt, oceanic, 24
Cratons, 21
Crustal heat sources, 6
EarthDeep heat, global, 6Heat flux, 20Available Heat, 6Continents, 20, 24
Erosion, altitude, 22-23
GlaciersMass, 20Crystal heat, 20Geopotential, 20
GlobalLand cycle, 24Emergy budget, 6
Ice, sea, 16
LandGlobal cycle, 20Area sustained, 20Elevated, altitude, 23Erosion, 22-23
Latent heat from the sea, 7, 12
Mountains, 21
Oceanic current, 16
Ocean circuclationSurface eddies, 16Mesoscale gyrals, 16Jet currents, 16
Ocean heat, surface, 18

Oceanic production of geopotential, 6
Ocean thermal energy conversion OTEC, 18
Precipitation over land, 13
Radioactive heat from crust, 6
Rainfall, continental with altitude, 13
Renewable resources, global use, 6
Sandstone, 24
Saturation deficit, over land with altitude, 14
Sea ice, 16
SedimentsContinental, 24Global cycle, 24Continental, 24Pelagic, 24Shale, 24Sandstone, 24Limestone, 24Evaporites, 24
Shale, 24
Solar insolation, 6
Tide, 6
Volcanoes, 20
Warm-cold stratification, 18
Water vapor flux, with altitude, 12
Wind, kinetic energyCirculation over ocean, 7Cumulus land circulation, 7Mesosystems, 7

Temperate Cyclones, 7Hurricanes, 7Hemisphere general circulation, 7
Surface winds, 7Average Circulation, 7Tropical Jets, 7Polar Jets, 7