emergy and landscape development intensity... · emergy and landscape development intensity also…...
TRANSCRIPT
Emergy and Landscape Development Intensity
Also…
Pollutant Density Index (PDI)
Pollutant Empower Density (PED)
Lecture 12
LDI…
Landscape Development Intensity
An index of human disturbance
• An index of Landscape Development Intensity (LDI) was proposed by Brown and Vivas (2004) following on earlier work of Brown (1980) and evaluation of relationship of development intensity to water quality in the St. Marks Watershed in Florida (Brown, et al., 1998).
• The LDI has been used as a human disturbance gradient in developing wetland bio-indicators of ecosystem health (Lane and Brown, 2006; Reiss and Brown, 2006) and in developing a Stream Condition Index (Fore et al. 2007).
• Recently the LDI was tested as an indicator of human disturbance against a large wetland data set in Ohio (Mack, 2006)
LDI…
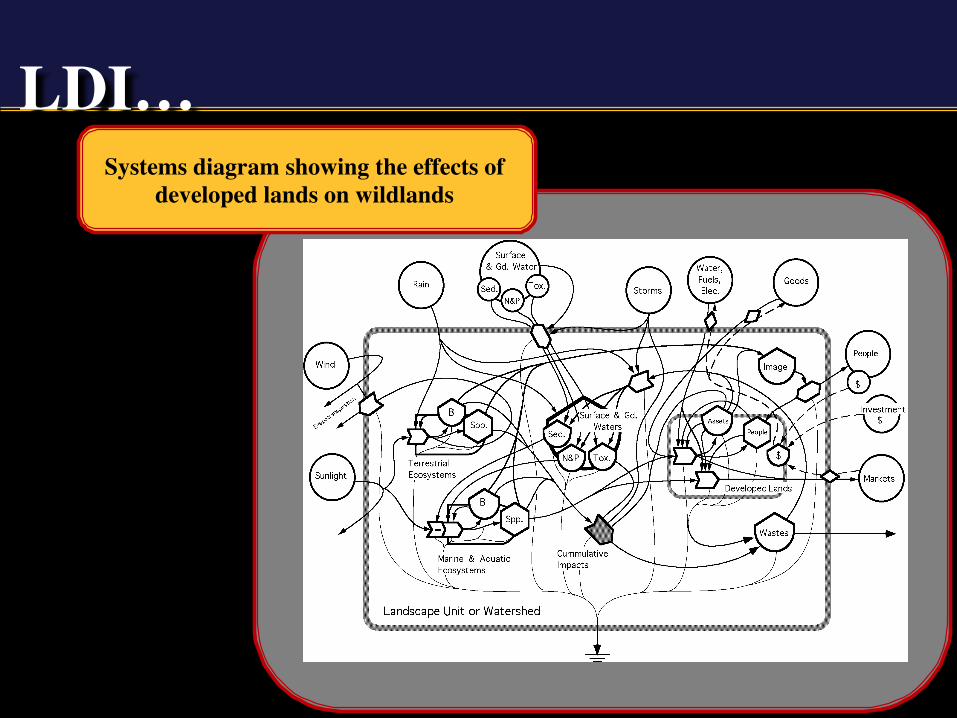
Systems diagram showing the effects of developed lands on wildlands
LDI…
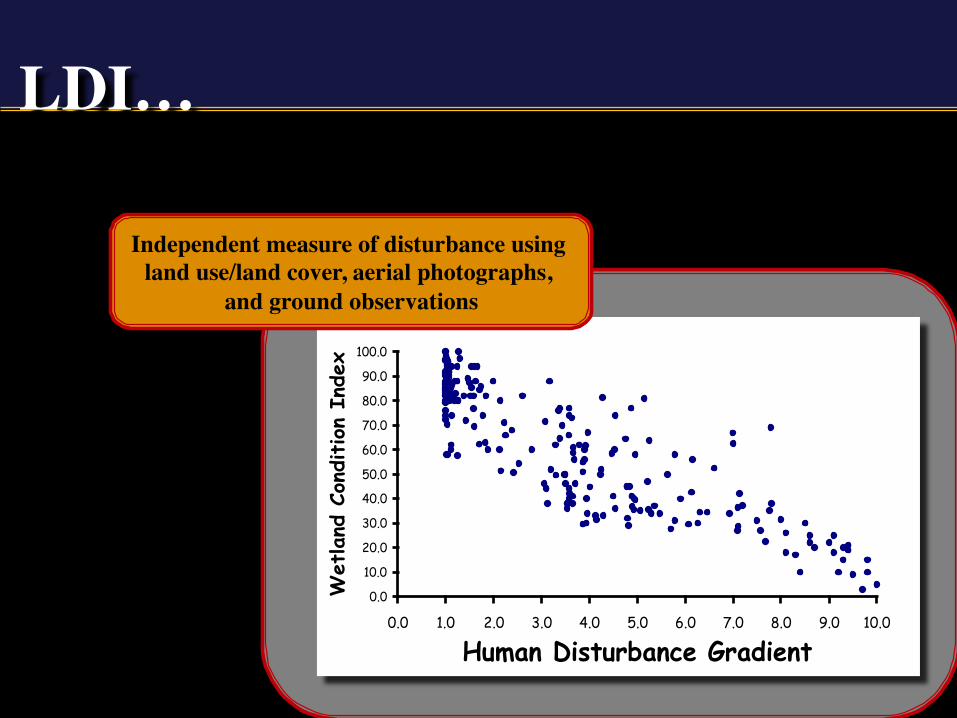
0.0
10.0
20.0
30.0
40.0
50.0
60.0
70.0
80.0
90.0
100.0
0.0 1.0 2.0 3.0 4.0 5.0 6.0 7.0 8.0 9.0 10.0
Human Disturbance Gradient
Wet
land
Con
dition
Ind
ex
LDI…
Independent measure of disturbance using land use/land cover, aerial photographs,
and ground observations
LDI…
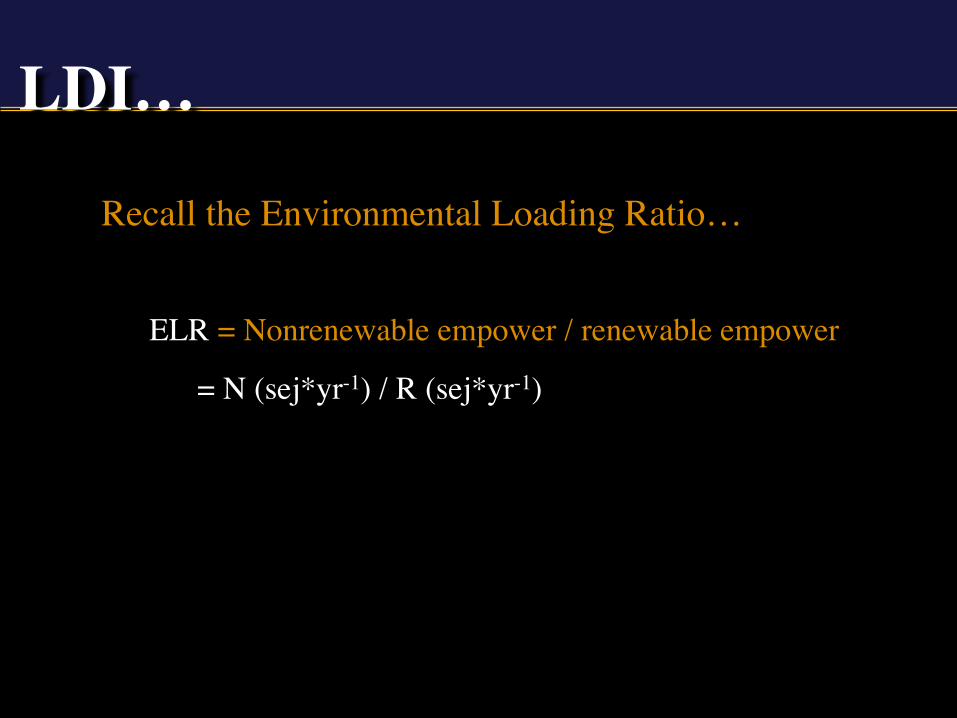
Recall the Environmental Loading Ratio…
ELR = Nonrenewable empower / renewable empower
= N (sej*yr-1) / R (sej*yr-1)
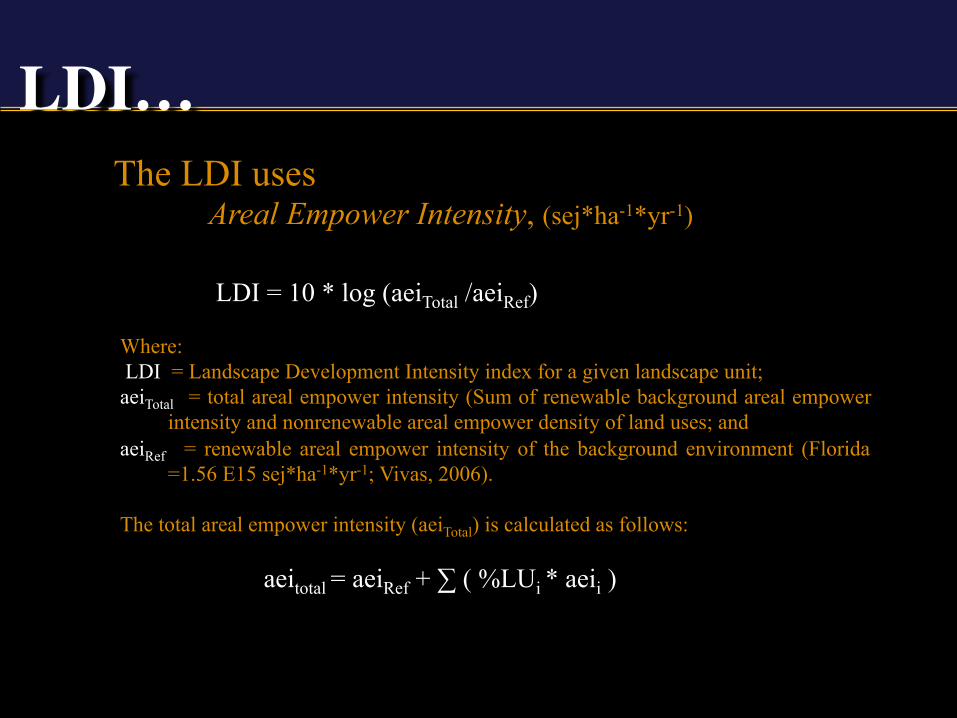
The LDI uses Areal Empower Intensity, (sej*ha-1*yr-1)
LDI = 10 * log (aeiTotal /aeiRef)
Where: LDI = Landscape Development Intensity index for a given landscape unit; aeiTotal = total areal empower intensity (Sum of renewable background areal empower
intensity and nonrenewable areal empower density of land uses; and aeiRef = renewable areal empower intensity of the background environment (Florida
=1.56 E15 sej*ha-1*yr-1; Vivas, 2006). The total areal empower intensity (aeiTotal) is calculated as follows:
aeitotal = aeiRef + ∑ ( %LUi * aeii )
LDI…
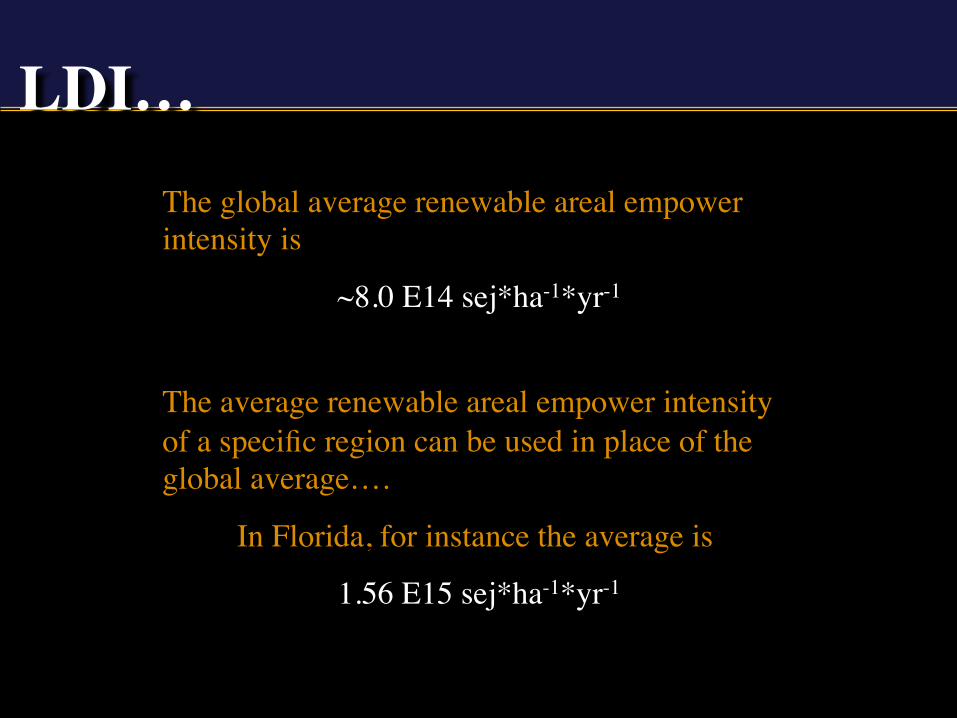
The global average renewable areal empower intensity is
~8.0 E14 sej*ha-1*yr-1
The average renewable areal empower intensity of a specific region can be used in place of the global average….
In Florida, for instance the average is
1.56 E15 sej*ha-1*yr-1
LDI…
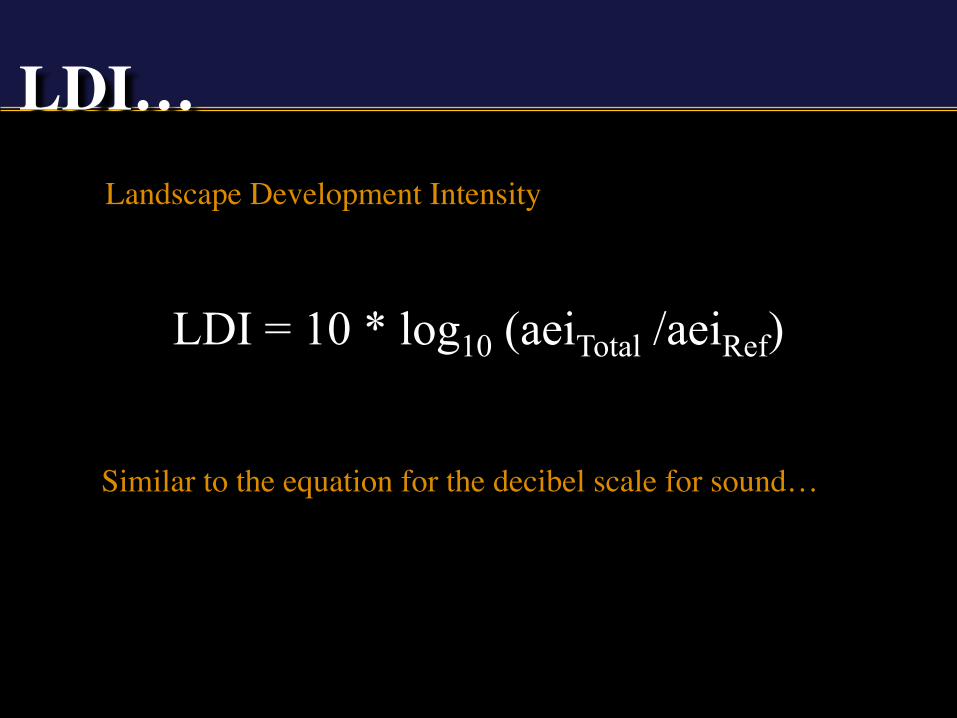
LDI = 10 * log10 (aeiTotal /aeiRef)
LDI…
Similar to the equation for the decibel scale for sound…
Landscape Development Intensity

LDI…
Example emergy evaluations of one hectare of citrus grove
LDI…
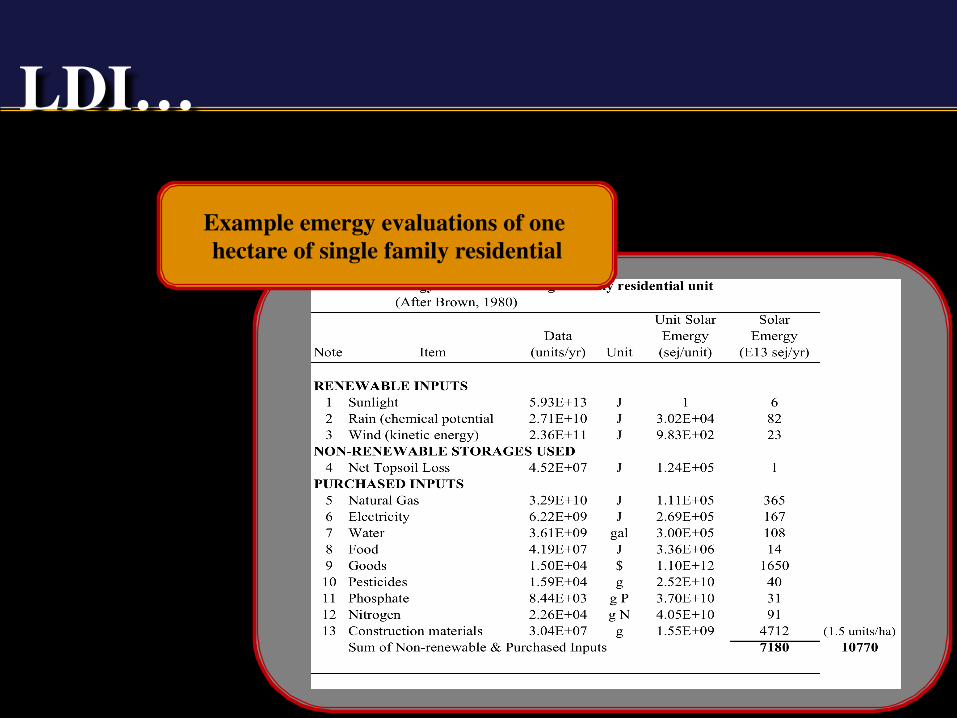
Example emergy evaluations of one hectare of single family residential
LDI… Non-Renewable
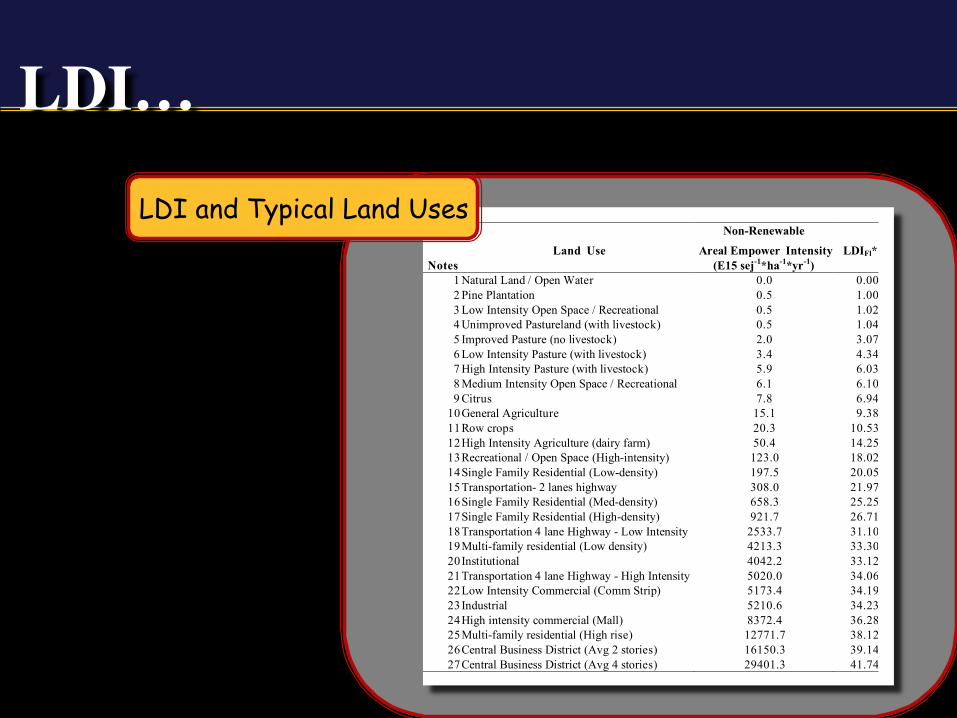
Land Use Areal Empower Intensity LDIFl* Notes (E15 sej-1*ha-1*yr-1)
1 Natural Land / Open Water 0.0 0.00 2 Pine Plantation 0.5 1.00 3 Low Intensity Open Space / Recreational 0.5 1.02 4 Unimproved Pastureland (with livestock) 0.5 1.04 5 Improved Pasture (no livestock) 2.0 3.07 6 Low Intensity Pasture (with livestock) 3.4 4.34 7 High Intensity Pasture (with livestock) 5.9 6.03 8 Medium Intensity Open Space / Recreational 6.1 6.10 9 Citrus 7.8 6.94
10 General Agriculture 15.1 9.38 11 Row crops 20.3 10.53 12 High Intensity Agriculture (dairy farm) 50.4 14.25 13 Recreational / Open Space (High-intensity) 123.0 18.02 14 Single Family Residential (Low-density) 197.5 20.05 15 Transportation- 2 lanes highway 308.0 21.97 16 Single Family Residential (Med-density) 658.3 25.25 17 Single Family Residential (High-density) 921.7 26.71 18 Transportation 4 lane Highway - Low Intensity 2533.7 31.10 19 Multi-family residential (Low density) 4213.3 33.30 20 Institutional 4042.2 33.12 21 Transportation 4 lane Highway - High Intensity 5020.0 34.06 22 Low Intensity Commercial (Comm Strip) 5173.4 34.19 23 Industrial 5210.6 34.23 24 High intensity commercial (Mall) 8372.4 36.28 25 Multi-family residential (High rise) 12771.7 38.12 26 Central Business District (Avg 2 stories) 16150.3 39.14 27 Central Business District (Avg 4 stories) 29401.3 41.74
LDI and Typical Land Uses
LDI…
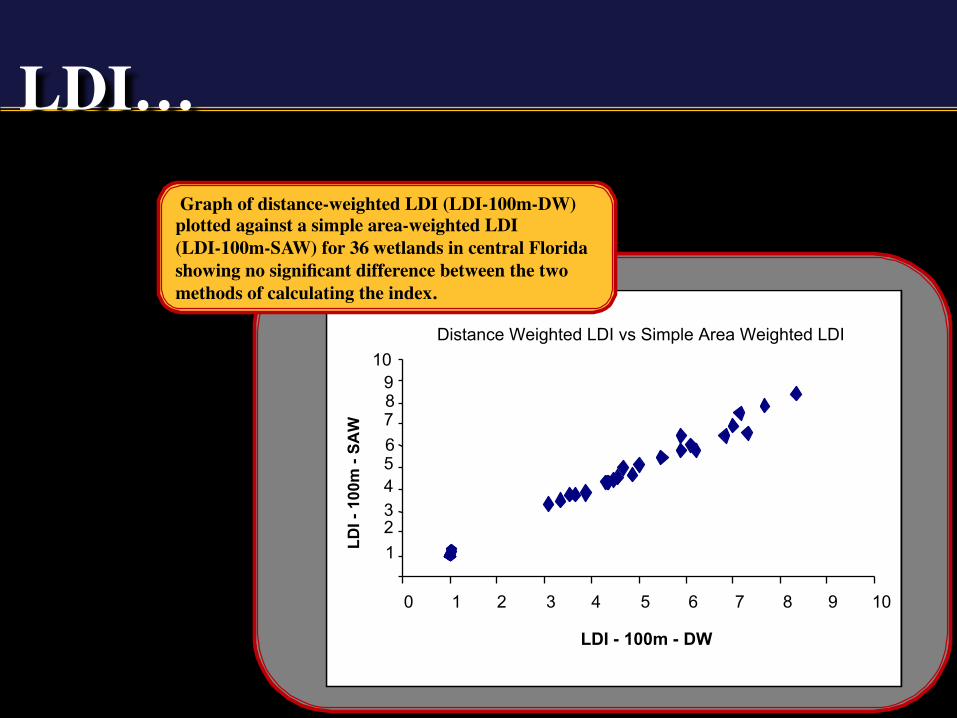
Distance Weighted LDI vs Simple Area Weighted LDI
1 2 3 4 5 6 7 8 9
10
0 1 2 3 4 5 6 7 8 9 10
LDI - 100m - DW
LDI -
100
m -
SAW
Graph of distance-weighted LDI (LDI-100m-DW) plotted against a simple area-weighted LDI (LDI-100m-SAW) for 36 wetlands in central Florida showing no significant difference between the two methods of calculating the index.
LDI…
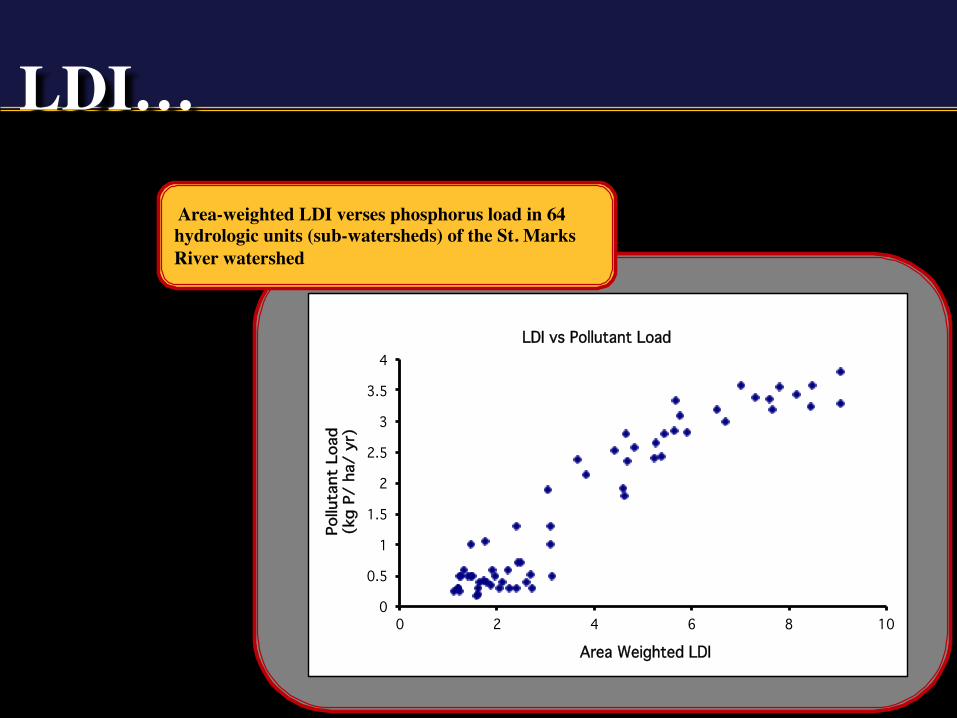
Area-weighted LDI verses phosphorus load in 64 hydrologic units (sub-watersheds) of the St. Marks River watershed
0!
0.5!
1!
1.5!
2!
2.5!
3!
3.5!
4!
0! 2! 4! 6! 8! 10!
Pollu
tant
Loa
d !
(kg
P/ h
a/ y
r)!
Area Weighted LDI!
LDI vs Pollutant Load !
LDI…
0.00
0.50
1.00
1.50
2.00
2.50
3.00
3.50
0 1 2 3 4 5 6 7 8 9 10
TP (k
g/ /h
a/ y
r)
LDI
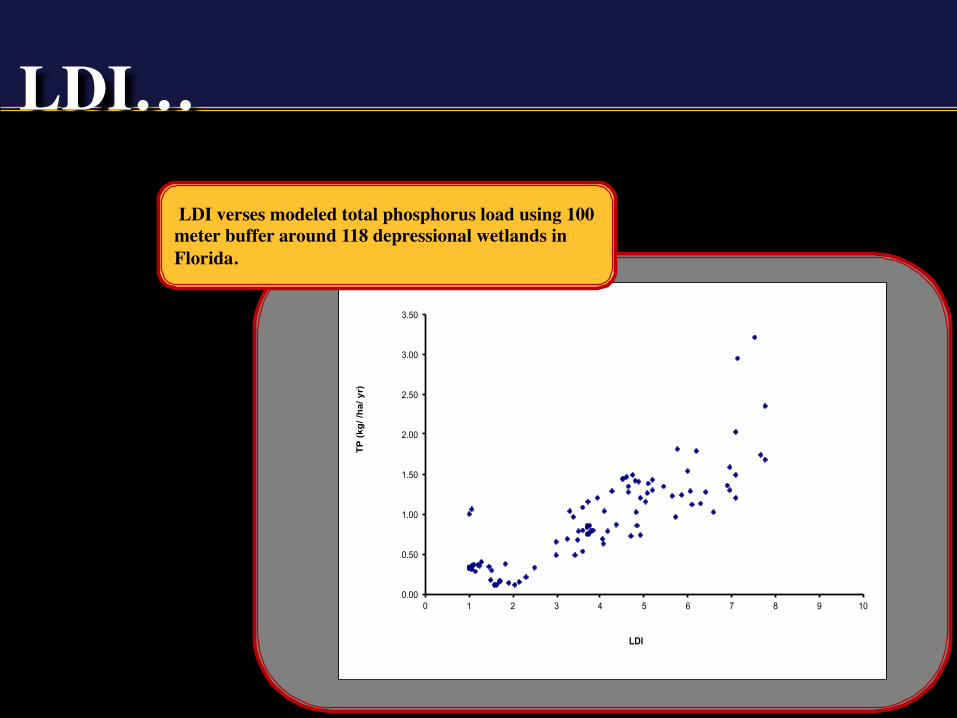
LDI verses modeled total phosphorus load using 100 meter buffer around 118 depressional wetlands in Florida.
Some applications of the LDI
LDI and Water Quality at the Watershed ScaleLDI and Wetland Ecological Health
LDI and BuffersLDI and Global Ecosystem Health
LDI…
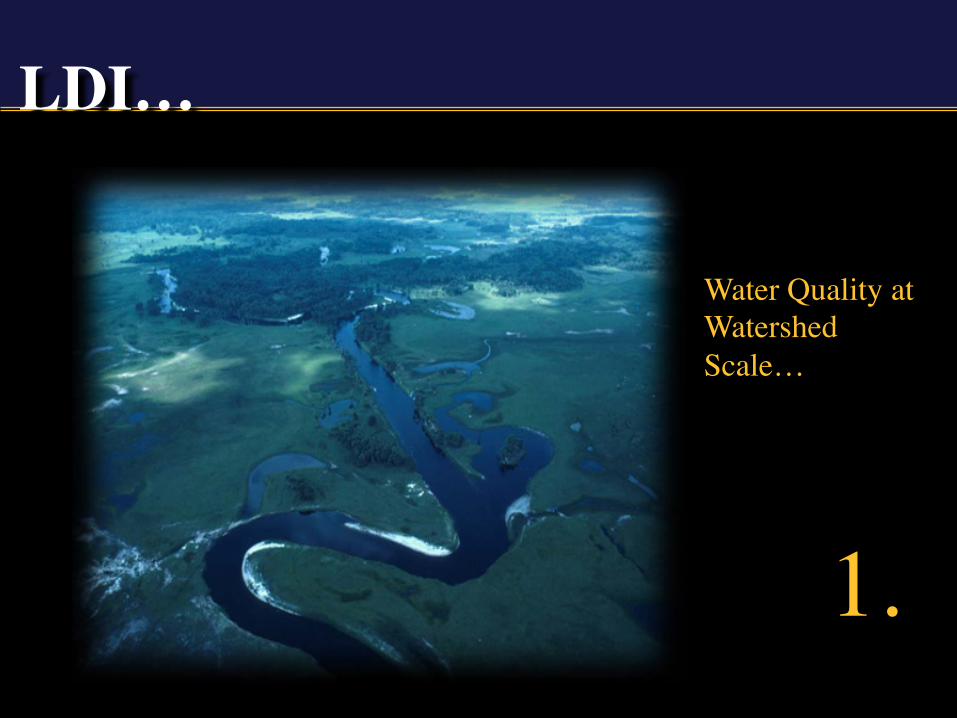
Water Quality at Watershed Scale…
1.
LDI…
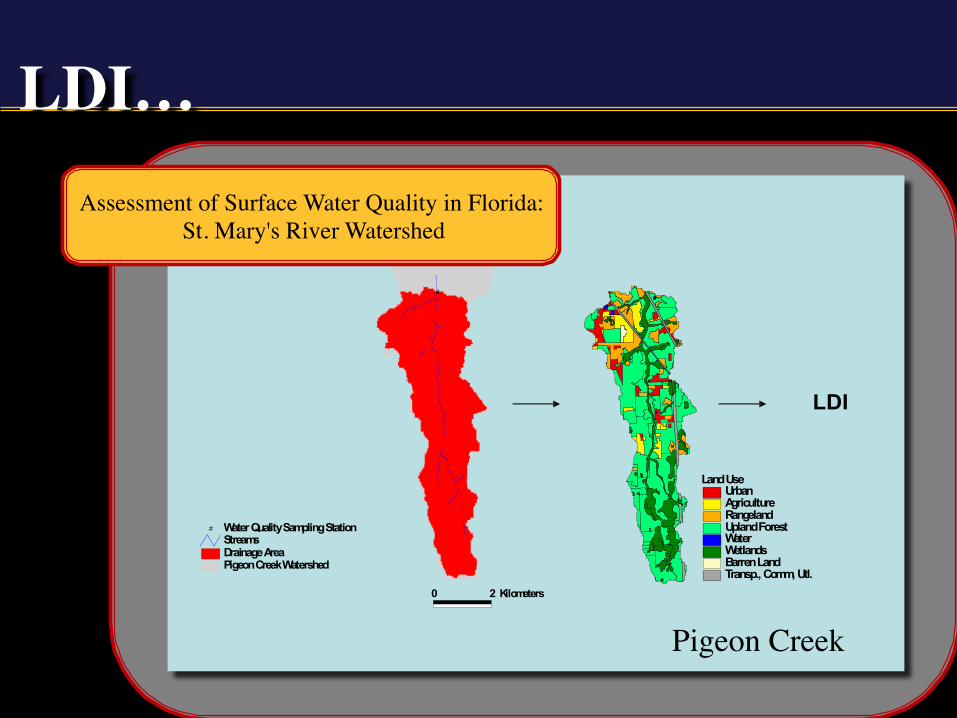
#
Pigeon Creek WatershedDrainage AreaStreams
# Water Quality Sampling Station
0 2 Kilometers
N
LDI
Land UseUrbanAgricultureRangelandUpland ForestWaterWetlandsBarren LandTransp., Comm, Utl.
Pigeon Creek
Assessment of Surface Water Quality in Florida:� St. Mary's River Watershed
LDI…
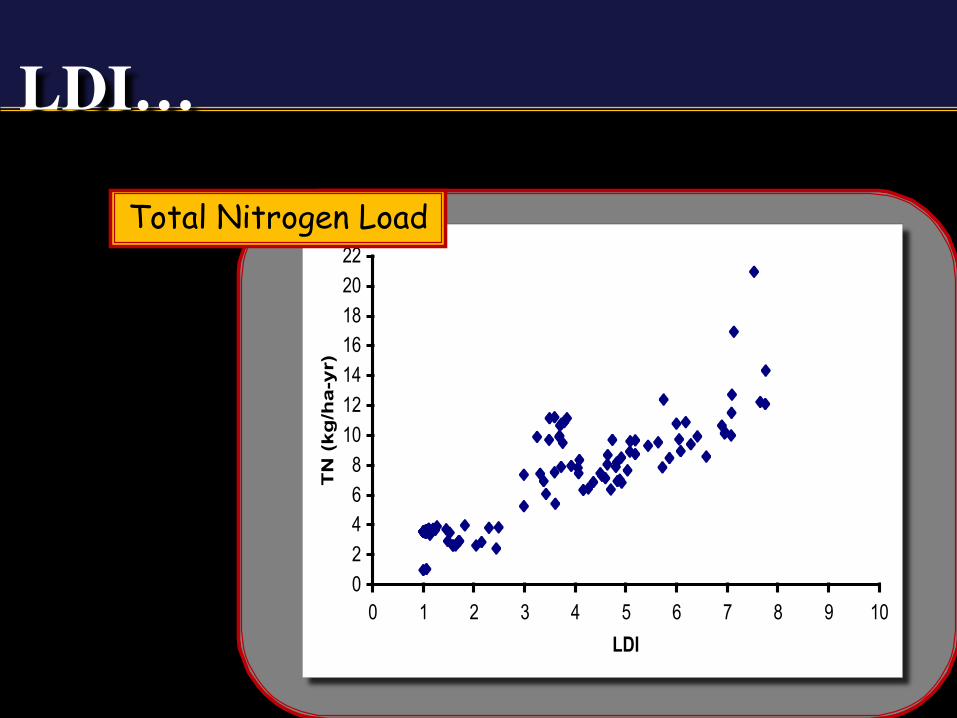
0246810121416182022
0 1 2 3 4 5 6 7 8 9 10LDI
TN
(k
g/h
a-y
r)
Total Nitrogen Load
LDI…
LDI…
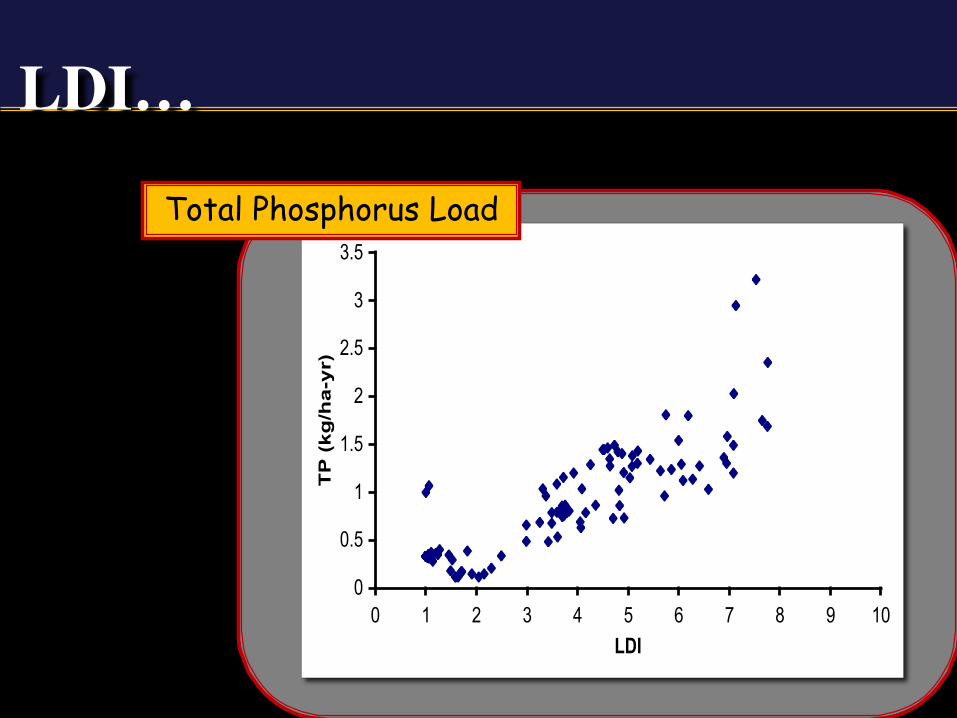
0
0.5
1
1.5
2
2.5
3
3.5
0 1 2 3 4 5 6 7 8 9 10LDI
TP
(k
g/h
a-y
r)
Total Phosphorus Load
LDI…
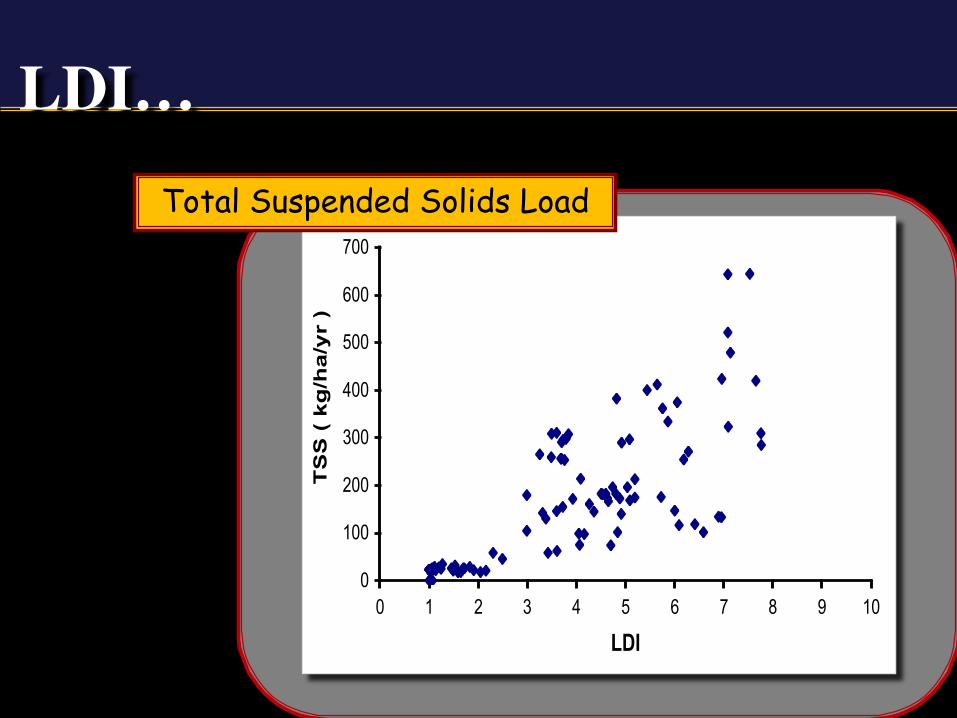
0
100
200
300
400
500
600
700
0 1 2 3 4 5 6 7 8 9 10
LDI
TS
S (
kg
/ha
/yr
)
Total Suspended Solids Load
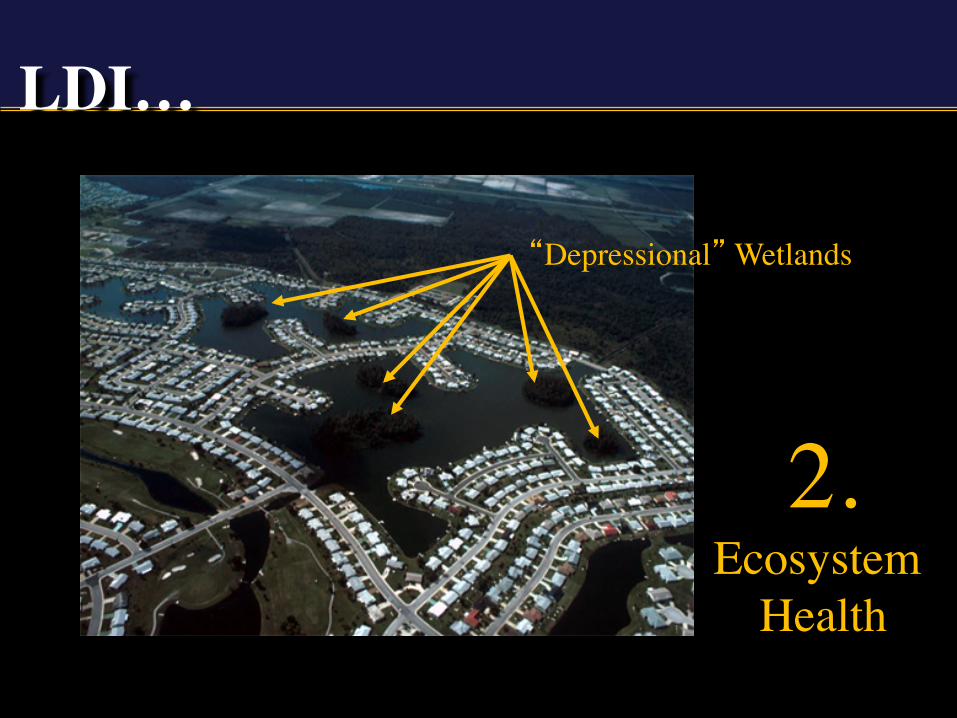
“Depressional” Wetlands
2.Ecosystem
Health
LDI…
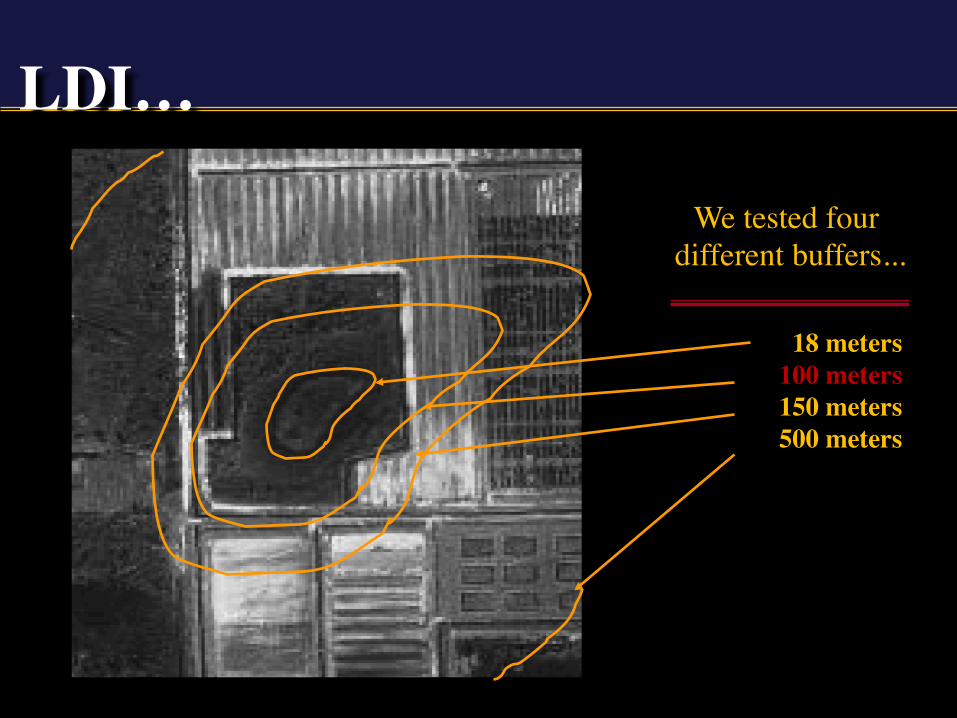
18 meters100 meters150 meters500 meters
We tested four different buffers...
LDI…
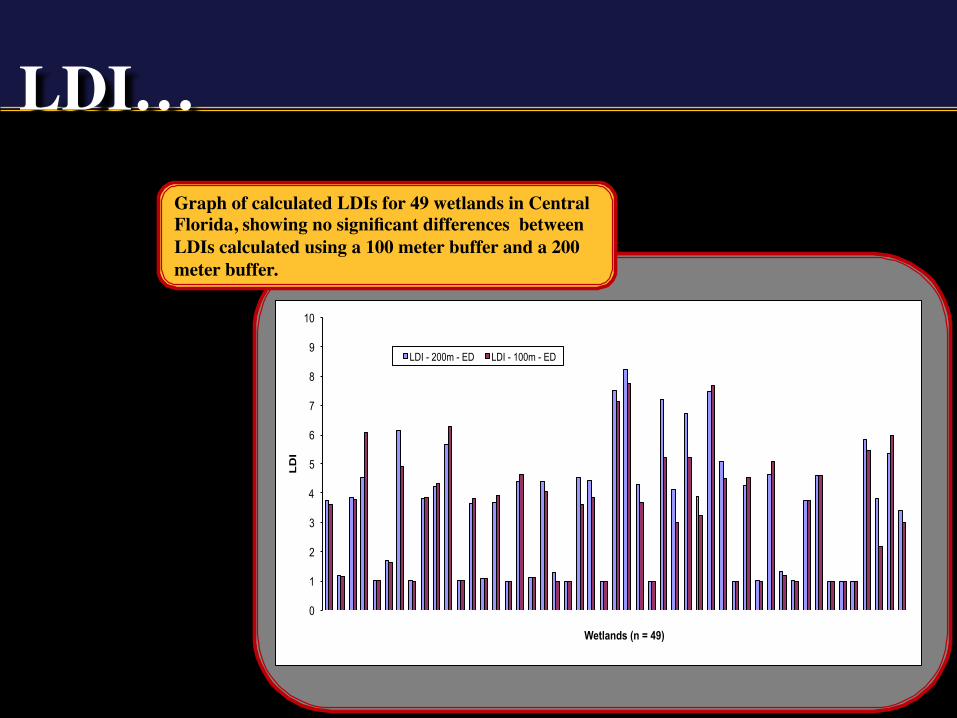
Graph of calculated LDIs for 49 wetlands in Central Florida, showing no significant differences between LDIs calculated using a 100 meter buffer and a 200 meter buffer.
LDI…
0
1
2
3
4
5
6
7
8
9
10
LD
I
Wetlands (n = 49)
LDI - 200m - ED LDI - 100m - ED
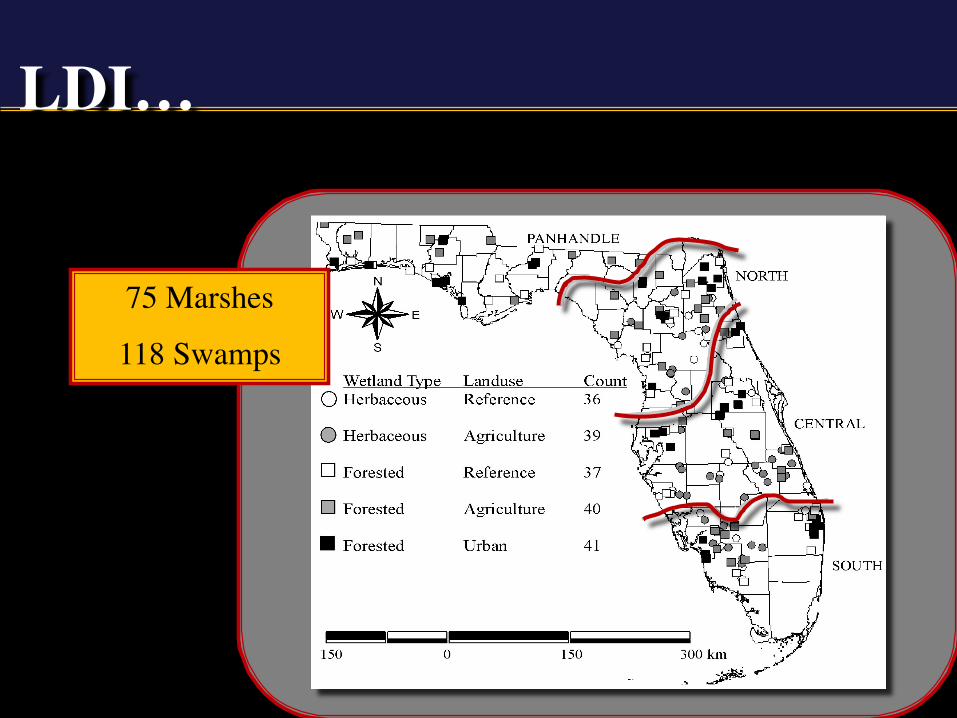
75 Marshes
118 Swamps
LDI…
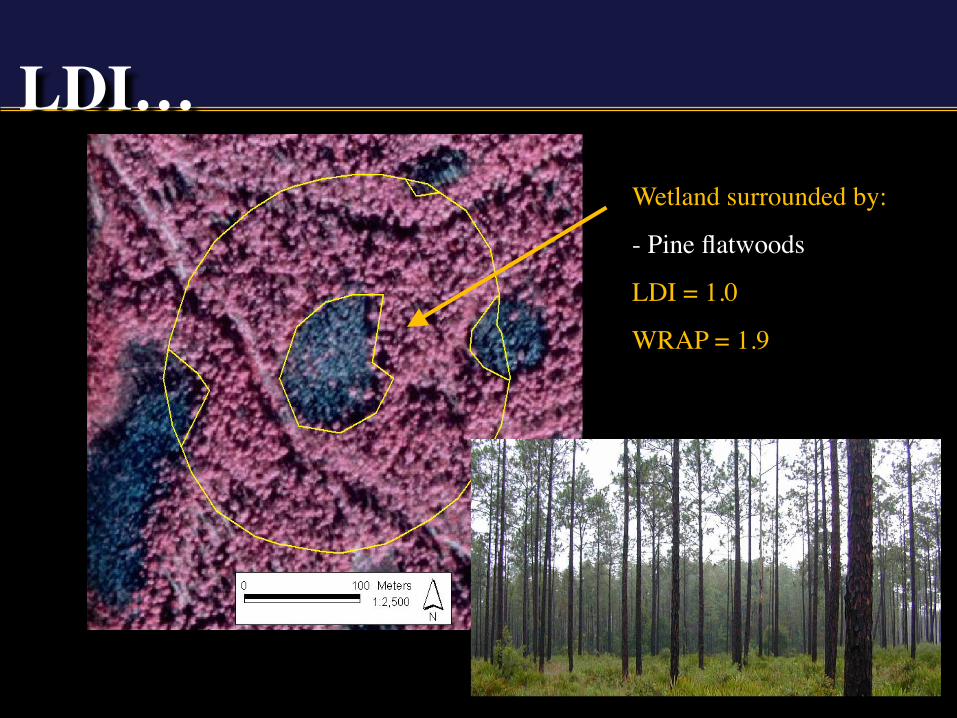
Wetland surrounded by:
- Pine flatwoods
LDI = 1.0
WRAP = 1.9
LDI…
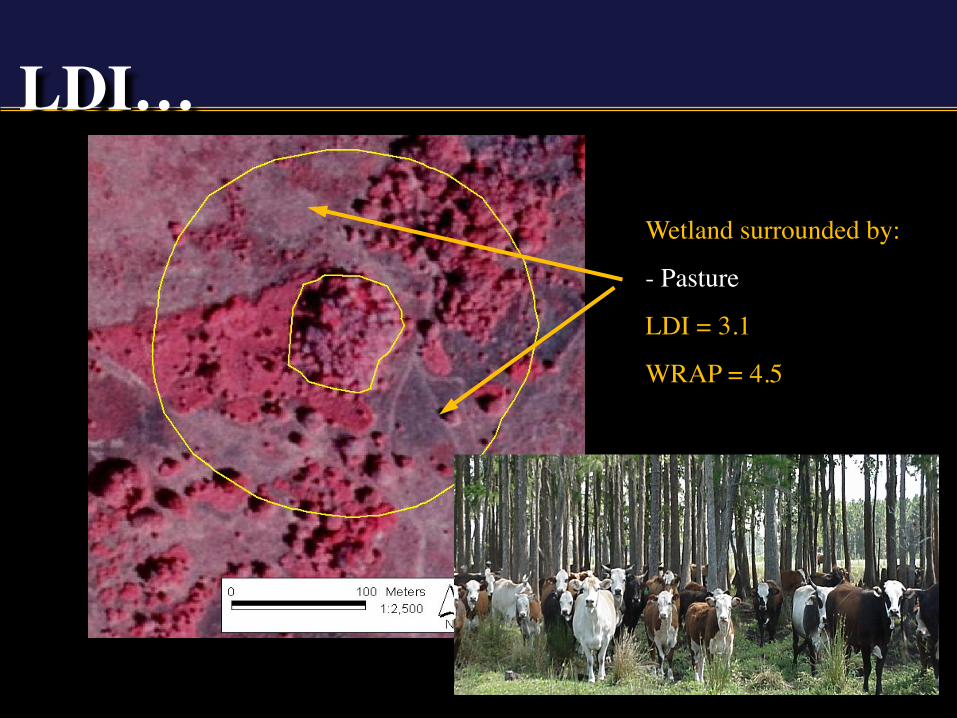
Wetland surrounded by:
- Pasture
LDI = 3.1
WRAP = 4.5
LDI…
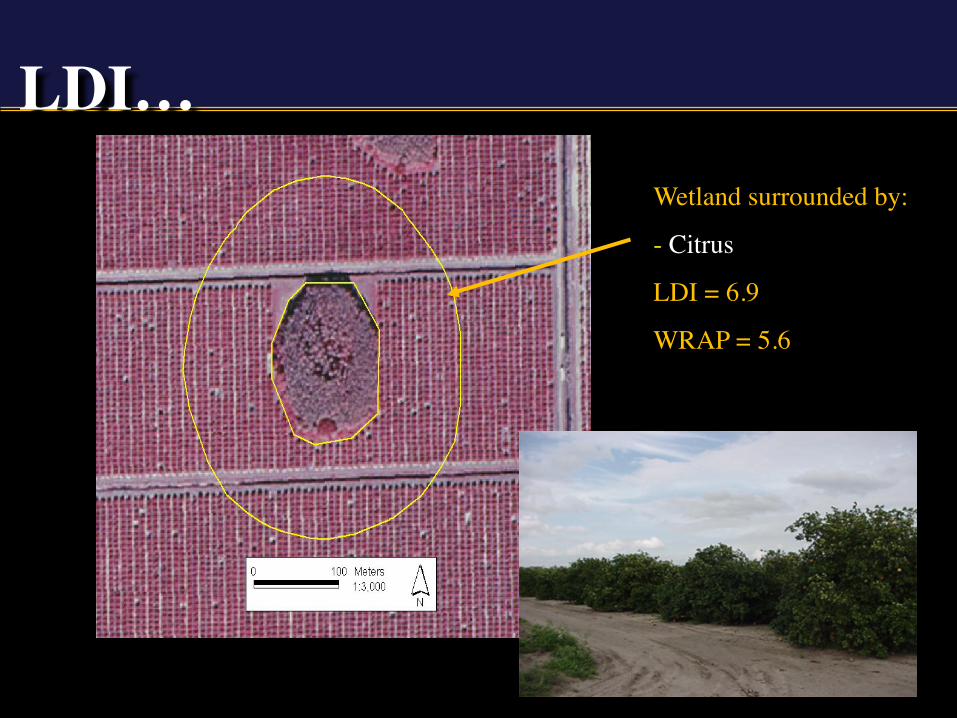
Wetland surrounded by:
- Citrus
LDI = 6.9
WRAP = 5.6
LDI…
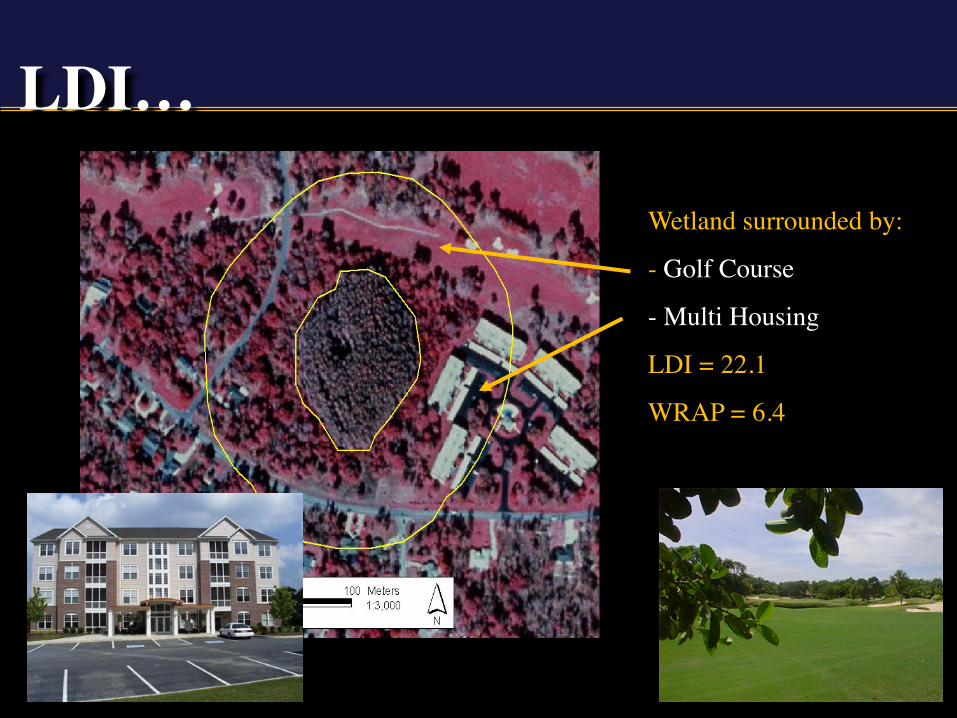
Wetland surrounded by:
- Golf Course
- Multi Housing
LDI = 22.1
WRAP = 6.4
LDI…
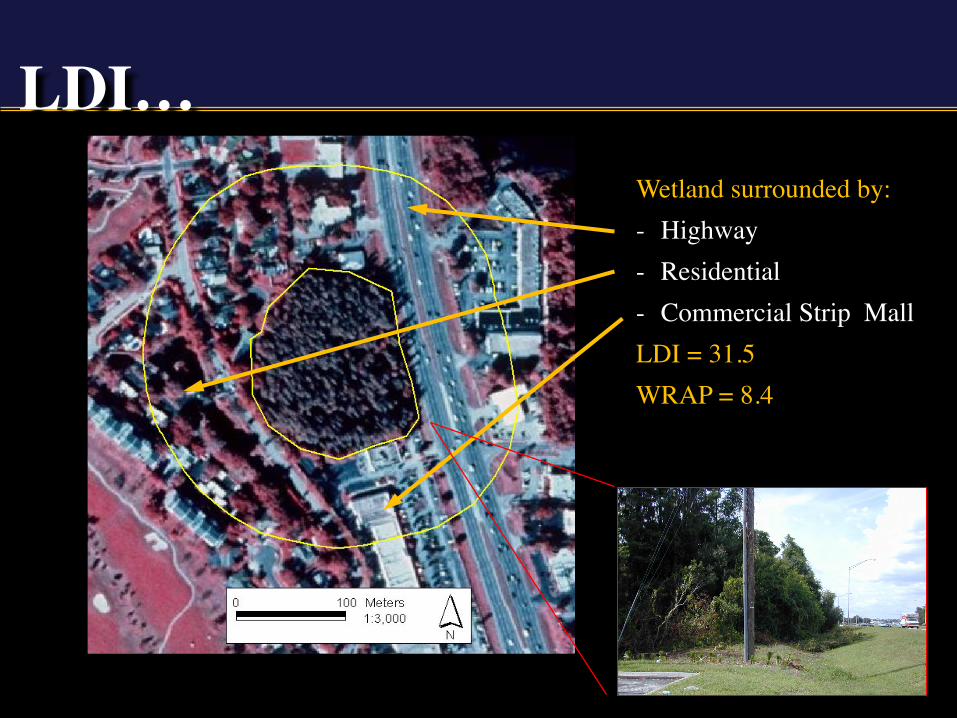
Wetland surrounded by:- Highway- Residential- Commercial Strip MallLDI = 31.5WRAP = 8.4
LDI…
LDI…
012345678910
0 1 2 3 4 5 6 7 8 9 10
LDI
WRAP
AgriculturalReferenceUrban
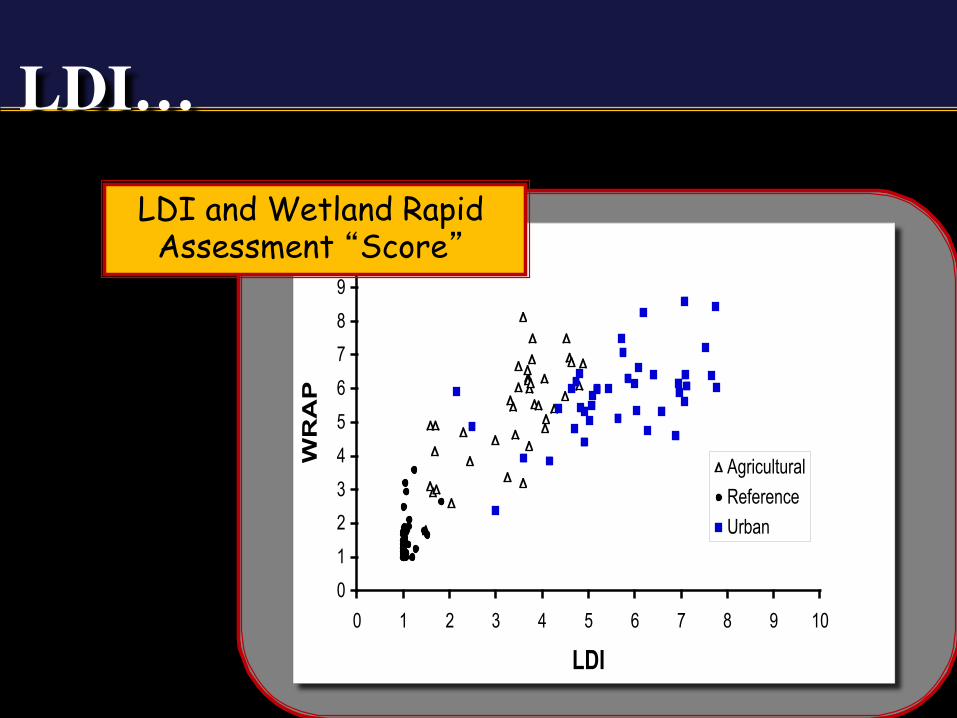
LDI and Wetland Rapid Assessment “Score”
LDI…
0
20
40
60
80
100
0 1 2 3 4 5 6 7 8 9 10
LDI
Flor
ida
WCI
ReferenceAgriculturalUrban
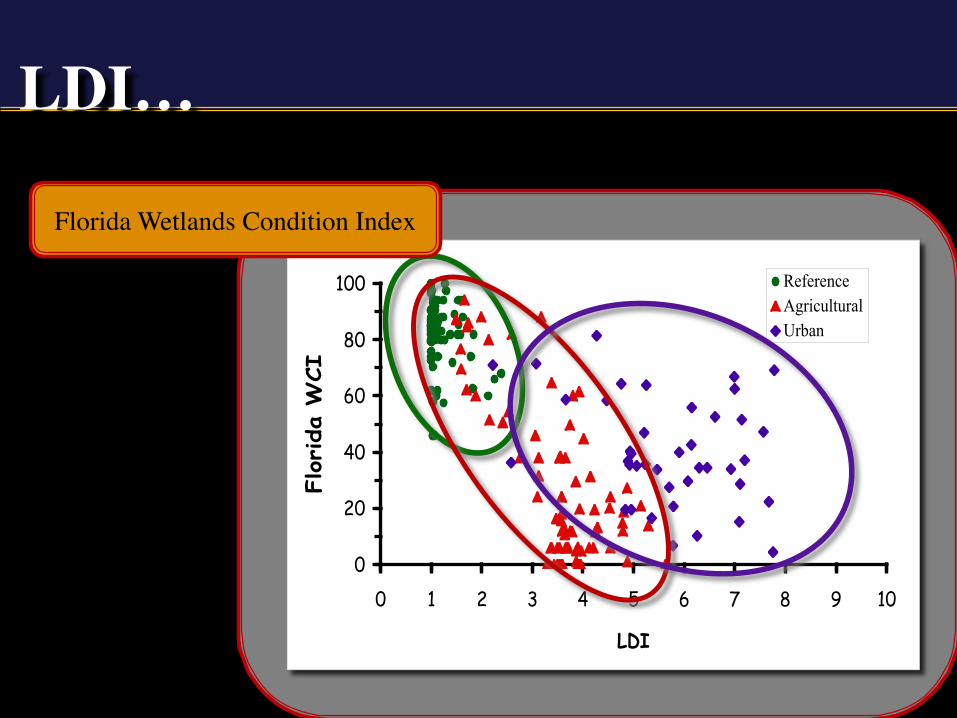
Florida Wetlands Condition Index
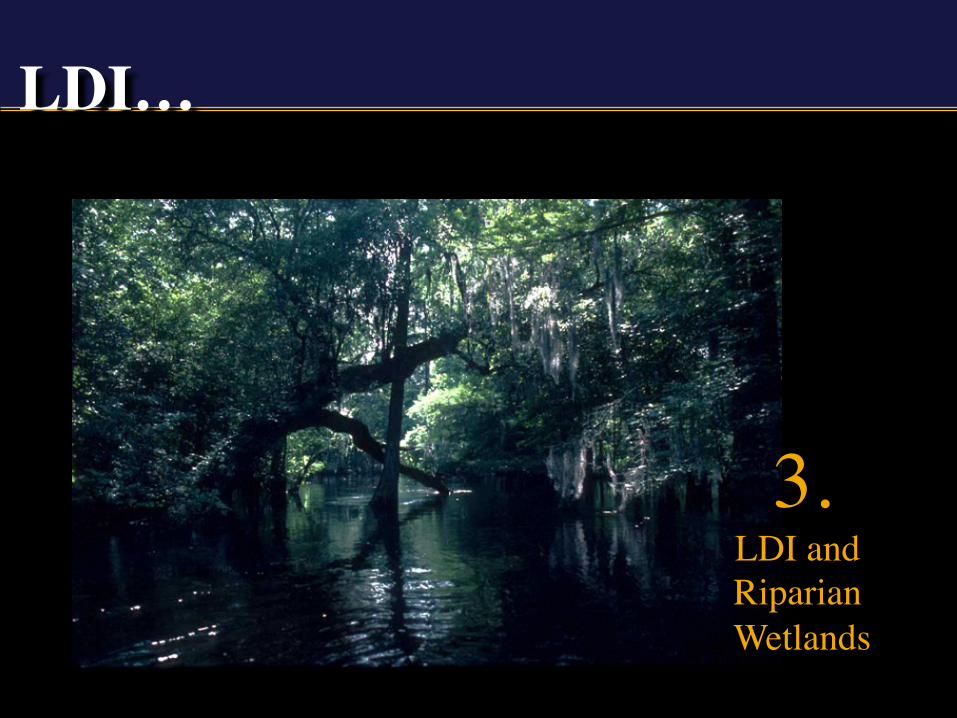
3.LDI and Riparian Wetlands
LDI…
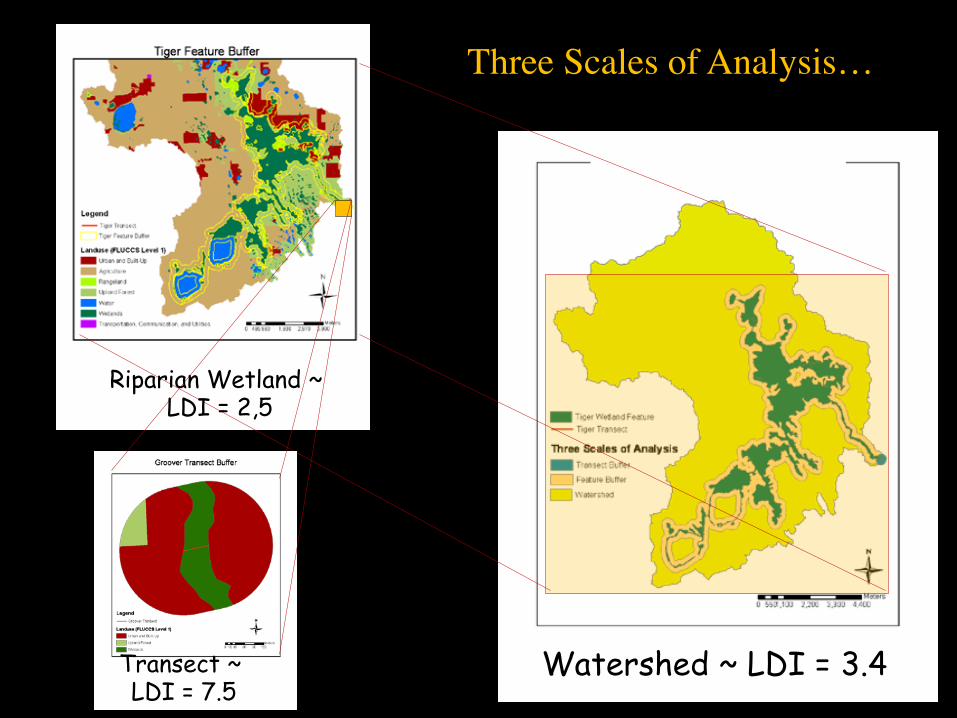
Watershed ~ LDI = 3.4
Riparian Wetland ~ LDI = 2,5
Transect ~ LDI = 7.5
Three Scales of Analysis…
? ? ? ? ?
?
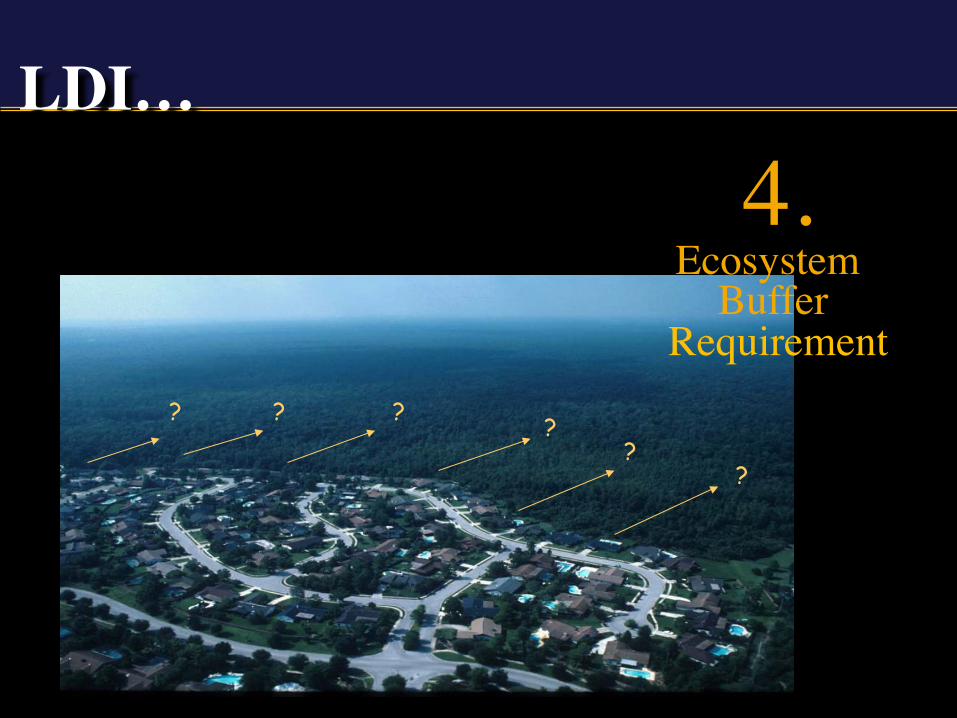
4.Ecosystem
Buffer Requirement
LDI…
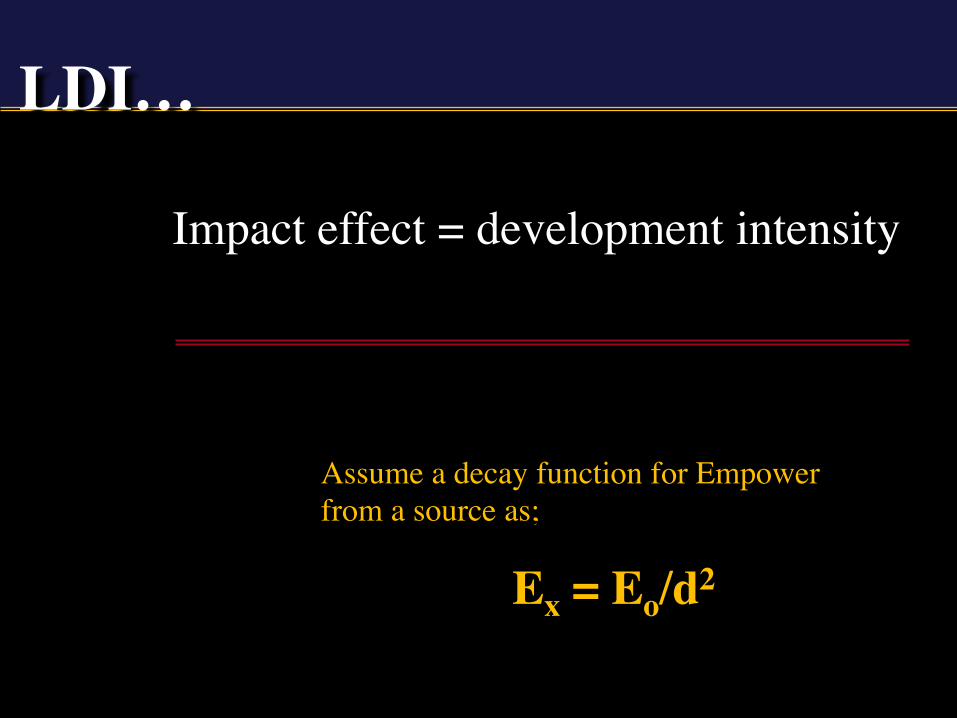
Assume a decay function for Empower from a source as;
Ex = Eo/d2
Impact effect = development intensity
LDI…
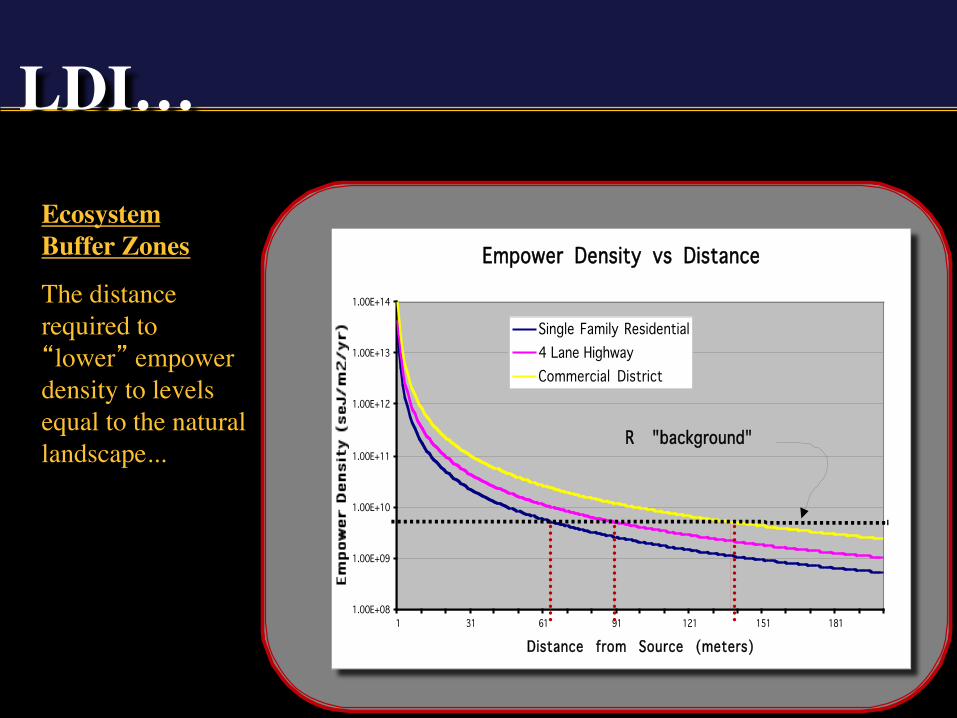
Empower Density vs Distance
1.00E+08
1.00E+09
1.00E+10
1.00E+11
1.00E+12
1.00E+13
1.00E+14
1 31 61 91 121 151 181
Distance from Source (meters)
Single Family Residential4 Lane HighwayCommercial District
R "background"
Ecosystem Buffer Zones
The distance required to “lower” empower density to levels equal to the natural landscape...
LDI…
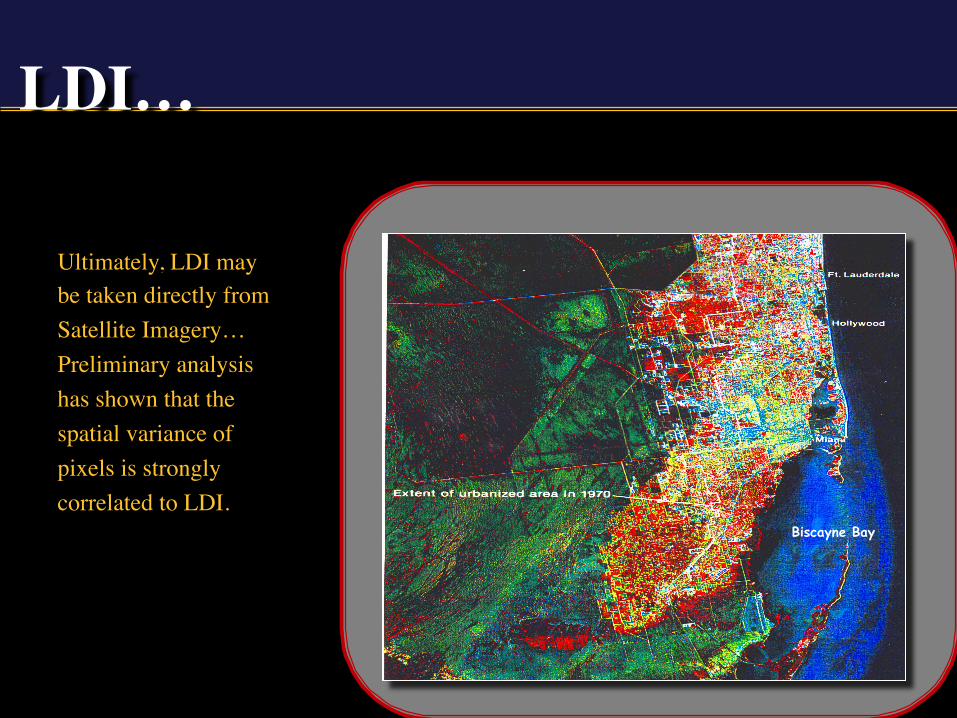
Biscayne Bay
Ultimately, LDI may be taken directly from Satellite Imagery… Preliminary analysis has shown that the spatial variance of pixels is strongly correlated to LDI.
LDI…
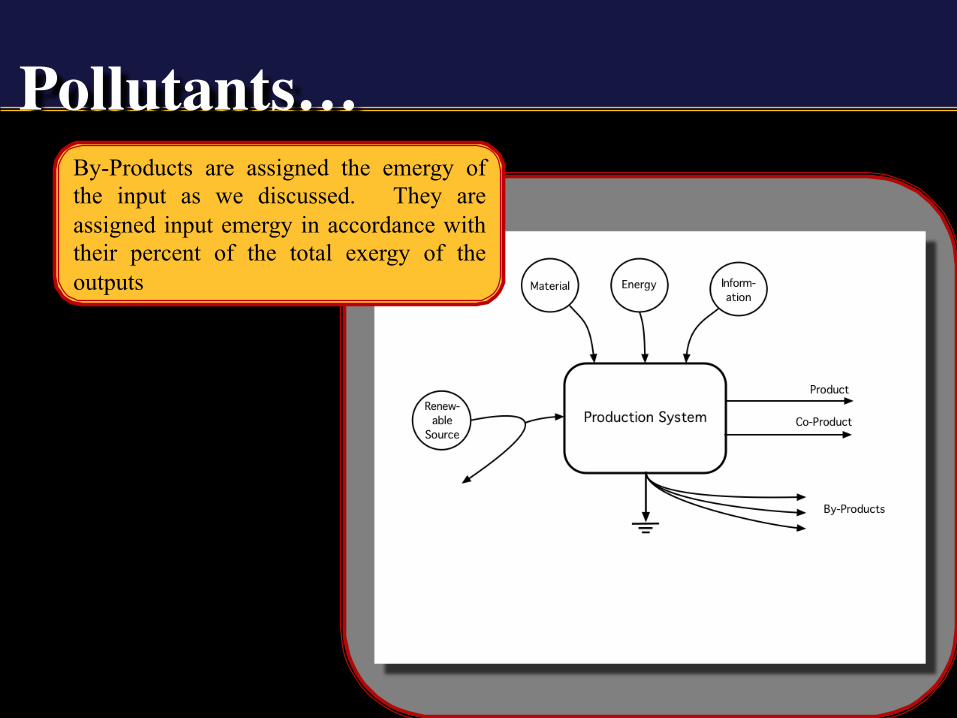
Pollutants…By-Products are assigned the emergy of the input as we discussed. They are assigned input emergy in accordance with their percent of the total exergy of the outputs
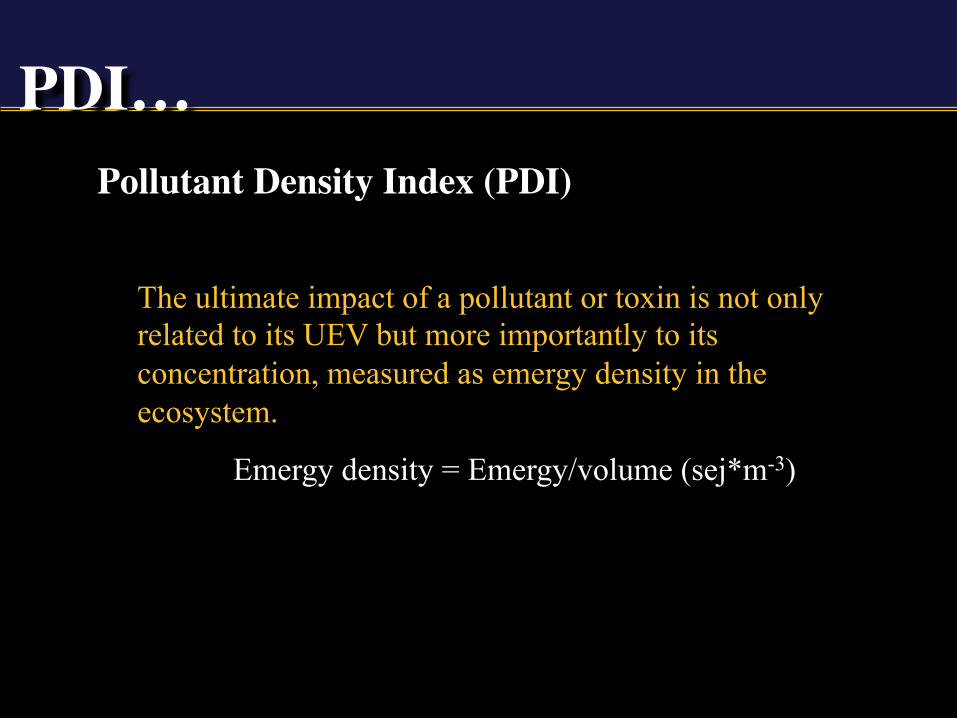
The ultimate impact of a pollutant or toxin is not only related to its UEV but more importantly to its concentration, measured as emergy density in the ecosystem.
Emergy density = Emergy/volume (sej*m-3)
PDI…Pollutant Density Index (PDI)
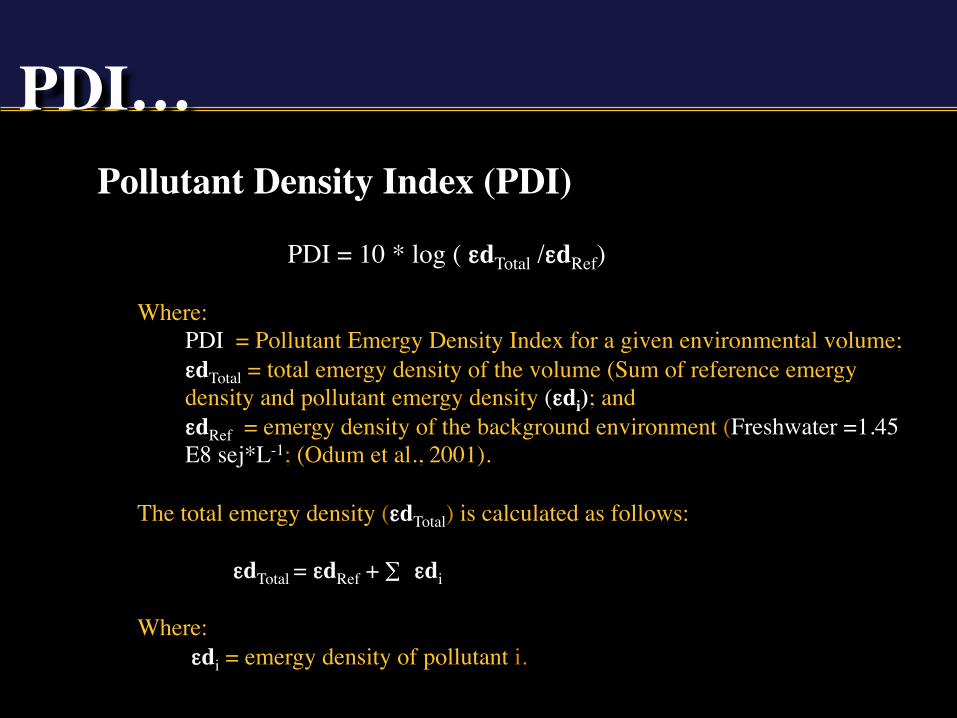
PDI…Pollutant Density Index (PDI)
Where:PDI = Pollutant Emergy Density Index for a given environmental volume;εdTotal = total emergy density of the volume (Sum of reference emergy density and pollutant emergy density (εdi); and εdRef = emergy density of the background environment (Freshwater =1.45 E8 sej*L-1; (Odum et al., 2001).
The total emergy density (εdTotal) is calculated as follows:
εdTotal = εdRef + ∑ εdi Where:
εdi = emergy density of pollutant i.
PDI = 10 * log ( εdTotal /εdRef)
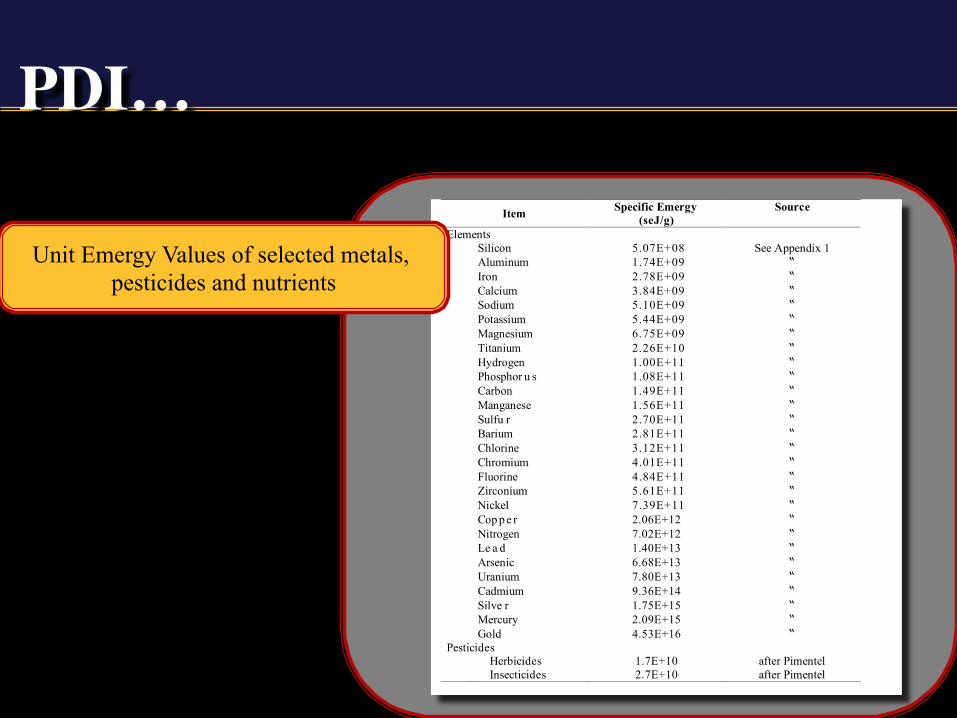
Item Specific Emergy (seJ/g)
Source
Elements Silicon 5.07E+08 See Appendix 1 Aluminum 1.74E+09 “ Iron 2.78E+09 “ Calcium 3.84E+09 “ Sodium 5.10E+09 “ Potassium 5.44E+09 “ Magnesium 6.75E+09 “ Titanium 2.26E+10 “ Hydrogen 1.00E+11 “ Phosphor u s 1.08E+11 “ Carbon 1.49E+11 “ Manganese 1.56E+11 “ Sulfu r 2.70E+11 “ Barium 2.81E+11 “ Chlorine 3.12E+11 “ Chromium 4.01E+11 “ Fluorine 4.84E+11 “ Zirconium 5.61E+11 “ Nickel 7.39E+11 “ Cop p e r 2.06E+12 “ Nitrogen 7.02E+12 “ Le a d 1.40E+13 “ Arsenic 6.68E+13 “ Uranium 7.80E+13 “ Cadmium 9.36E+14 “ Silve r 1.75E+15 “ Mercury 2.09E+15 “ Gold 4.53E+16 “ Pesticides Herbicides 1.7E+10 after Pimentel Insecticides 2.7E+10 after Pimentel
PDI…
Unit Emergy Values of selected metals, pesticides and nutrients
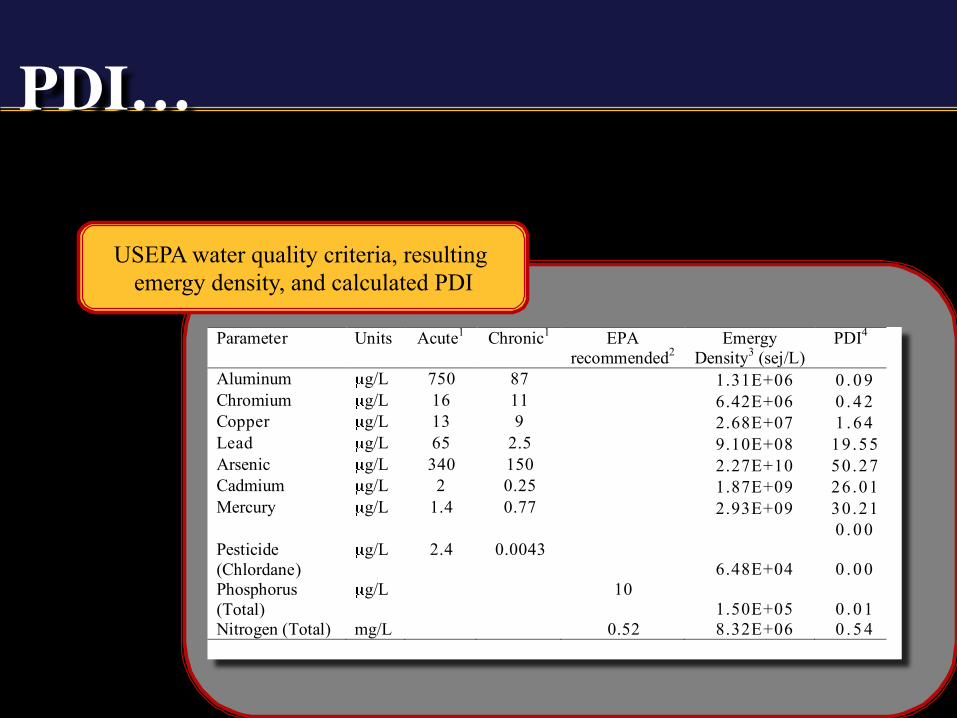
Parameter Units Acute1 Chronic1 EPA recommended2
Emergy Density3 (sej/L)
PDI4
Aluminum g/L 750 87 1.31E+06 0 . 0 9 Chromium g/L 16 11 6.42E+06 0 . 4 2 Copper g/L 13 9 2.68E+07 1 . 6 4 Lead g/L 65 2.5 9.10E+08 19.55 Arsenic g/L 340 150 2.27E+10 50.27 Cadmium g/L 2 0.25 1.87E+09 26.01 Mercury g/L 1.4 0.77 2.93E+09 30.21 0 . 0 0 Pesticide (Chlordane)
g/L 2.4 0.0043 6.48E+04 0 . 0 0
Phosphorus (Total)
g/L 10 1.50E+05 0 . 0 1
Nitrogen (Total) mg/L 0.52 8.32E+06 0 . 5 4
PDI…
USEPA water quality criteria, resulting emergy density, and calculated PDI
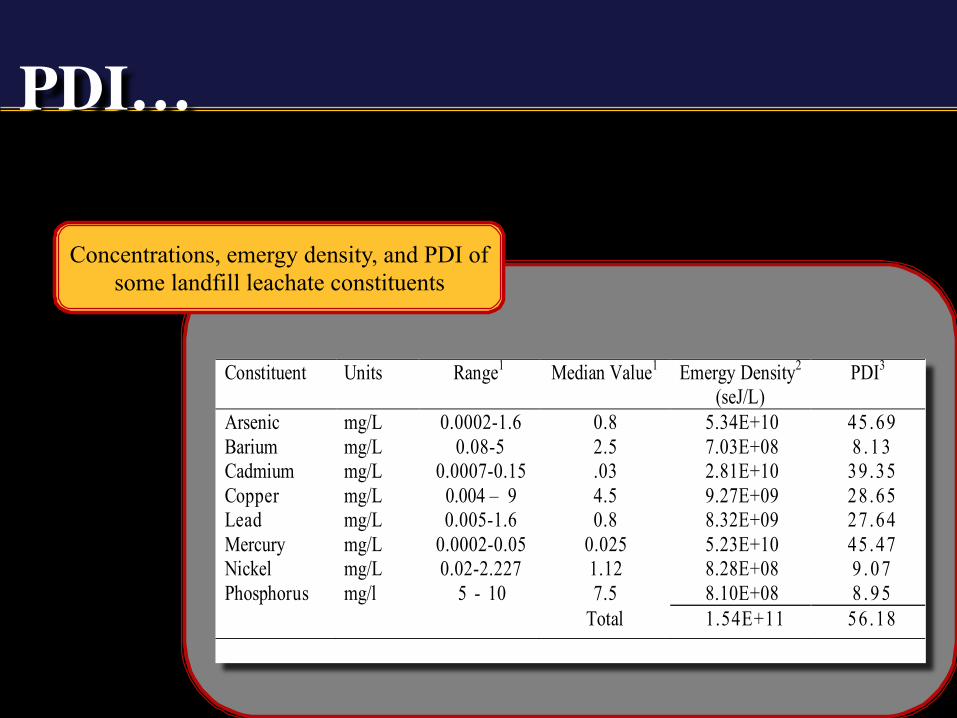
Constituent Units Range1 Median Value1 Emergy Density2 (seJ/L)
PDI3
Arsenic mg/L 0.0002-1.6 0.8 5.34E+10 45 .69 Barium mg/L 0.08-5 2.5 7.03E+08 8 . 1 3 Cadmium mg/L 0.0007-0.15 .03 2.81E+10 39 .35 Copper mg/L 0.004 – 9 4.5 9.27E+09 28 .65 Lead mg/L 0.005-1.6 0.8 8.32E+09 27 .64 Mercury mg/L 0.0002-0.05 0.025 5.23E+10 45 .47 Nickel mg/L 0.02-2.227 1.12 8.28E+08 9 . 0 7 Phosphorus mg/l 5 - 10 7.5 8.10E+08 8 . 9 5 Total 1.54E+11 56.18
PDI…
Concentrations, emergy density, and PDI of some landfill leachate constituents
PED…
Where pollutants are discharged into the aquatic environments their flux in the environment can be deleterious to productive processes. Concentrations at any one point can be calculated but more important is the flux of the pollutant measured as the empower per unit volume (sej*time-1*volume-1) as compared to the empower of the background environment.
Pollutant Empower Density (PED)
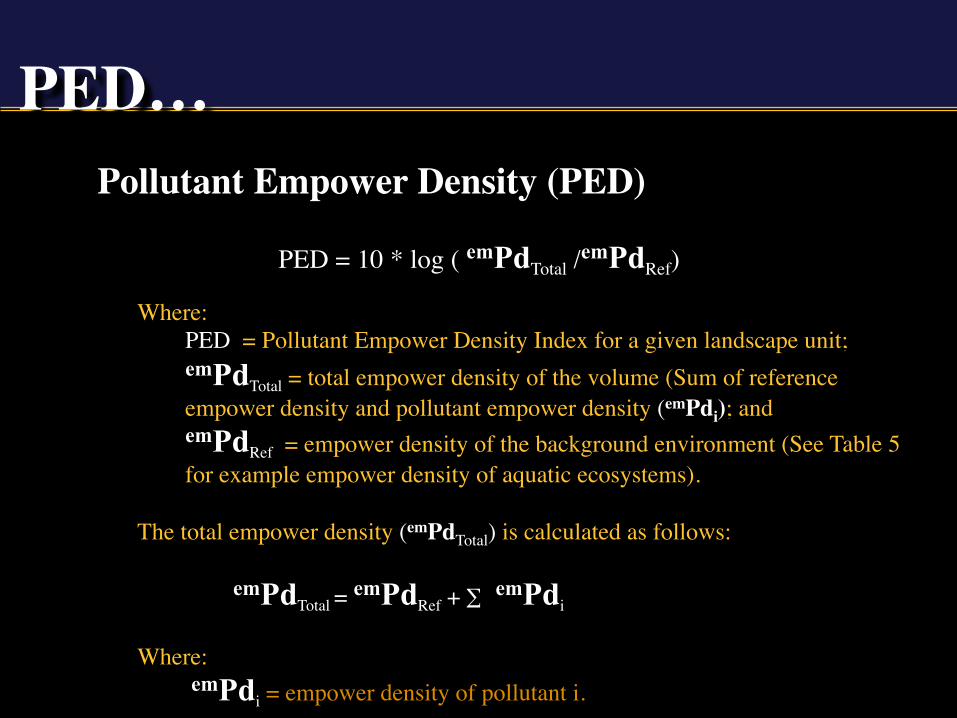
PED…Pollutant Empower Density (PED)
Where:PED = Pollutant Empower Density Index for a given landscape unit;emPdTotal = total empower density of the volume (Sum of reference empower density and pollutant empower density (emPdi); and emPdRef = empower density of the background environment (See Table 5 for example empower density of aquatic ecosystems).
The total empower density (emPdTotal) is calculated as follows:
emPdTotal = emPdRef + ∑ emPdi Where:
emPdi = empower density of pollutant i.
PED = 10 * log ( emPdTotal /emPdRef)
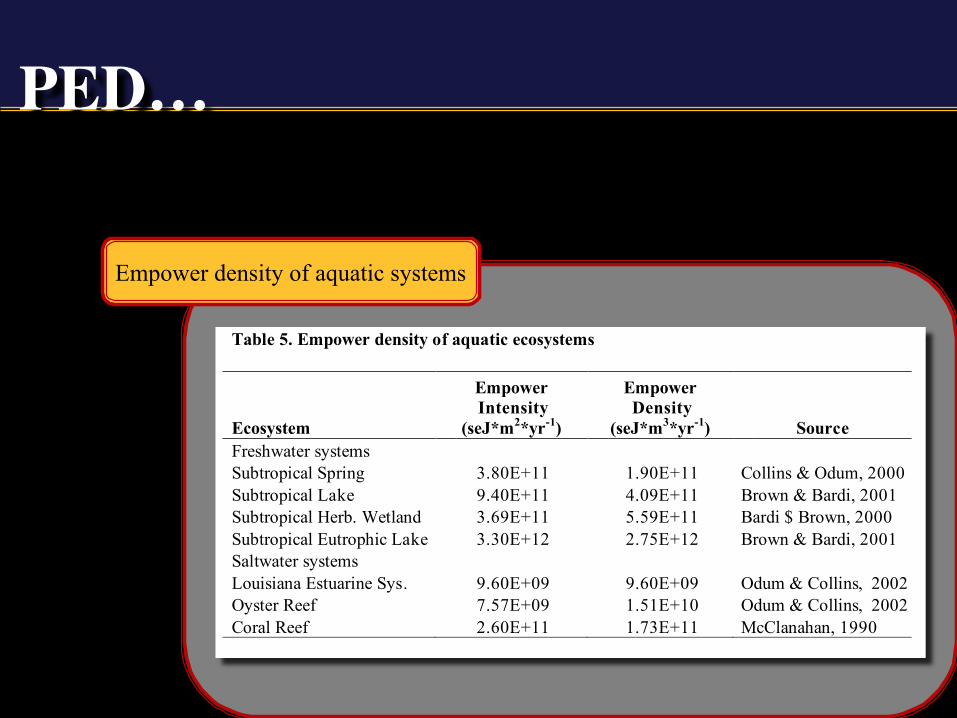
Table 5. Empower density of aquatic ecosystems
Ecosystem
Empower Intensity
(seJ*m2*yr-1)
Empower Density
(seJ*m3*yr-1) Source Freshwater systems Subtropical Spring 3.80E+11 1.90E+11 Collins & Odum, 2000 Subtropical Lake 9.40E+11 4.09E+11 Brown & Bardi, 2001 Subtropical Herb. Wetland 3.69E+11 5.59E+11 Bardi $ Brown, 2000 Subtropical Eutrophic Lake 3.30E+12 2.75E+12 Brown & Bardi, 2001 Saltwater systems Louisiana Estuarine Sys. 9.60E+09 9.60E+09 Odum & Collins, 2002 Oyster Reef 7.57E+09 1.51E+10 Odum & Collins, 2002 Coral Reef 2.60E+11 1.73E+11 McClanahan, 1990
PED…
Empower density of aquatic systems
Questions?Comments? Concerns?