hanno friedrich carina thaller christiane geiger...
TRANSCRIPT

Series Editors: Uwe Clausen · Michael ten Hompel · Robert de SouzaLecture Notes in Logistics
Uwe ClausenHanno FriedrichCarina ThallerChristiane Geiger Editors
Commercial TransportProceedings of the 2nd Interdisciplinary Conference on Production, Logistics and Traffic 2015

Lecture Notes in Logistics
Series editors
Uwe Clausen, Dortmund, GermanyMichael ten Hompel, Dortmund, GermanyRobert de Souza, Singapore, Singapore

More information about this series at http://www.springer.com/series/11220

Uwe Clausen • Hanno FriedrichCarina Thaller • Christiane GeigerEditors
Commercial TransportProceedings of the 2nd InterdisciplinaryConference on Production, Logistics andTraffic 2015
123

EditorsUwe ClausenInstitute of Transport LogisticsTU Dortmund UniversityDortmundGermany
Hanno FriedrichInstitute of Traffic and TransportChair of Commercial TransportTU DarmstadtDarmstadtGermany
Carina ThallerInstitute of Transport LogisticsTU Dortmund UniversityDortmundGermany
Christiane GeigerInstitute of Transport LogisticsTU Dortmund UniversityDortmundGermany
ISSN 2194-8917 ISSN 2194-8925 (electronic)Lecture Notes in LogisticsISBN 978-3-319-21265-4 ISBN 978-3-319-21266-1 (eBook)DOI 10.1007/978-3-319-21266-1
Library of Congress Control Number: 2015944739
Springer Cham Heidelberg New York Dordrecht London© Springer International Publishing Switzerland 2016This work is subject to copyright. All rights are reserved by the Publisher, whether the whole or partof the material is concerned, specifically the rights of translation, reprinting, reuse of illustrations,recitation, broadcasting, reproduction on microfilms or in any other physical way, and transmissionor information storage and retrieval, electronic adaptation, computer software, or by similar or dissimilarmethodology now known or hereafter developed.The use of general descriptive names, registered names, trademarks, service marks, etc. in thispublication does not imply, even in the absence of a specific statement, that such names are exempt fromthe relevant protective laws and regulations and therefore free for general use.The publisher, the authors and the editors are safe to assume that the advice and information in thisbook are believed to be true and accurate at the date of publication. Neither the publisher nor theauthors or the editors give a warranty, express or implied, with respect to the material contained herein orfor any errors or omissions that may have been made.
Printed on acid-free paper
Springer International Publishing AG Switzerland is part of Springer Science+Business Media(www.springer.com)

Foreword
The Interdisciplinary Conference on Production, Logistics and Traffic (ICPLT)addresses the interfaces between the three eponymous disciplines. The secondICPLT in particular deals with economic, ecological and societal issues aroundcommercial transport as the essential link for production, logistics and society. Ittook place during July 21–22, 2015, at TU Dortmund University, representing ajoint effort by TU Dortmund University and TU Darmstadt University.
Today, transport and mobility are affected by manifold trends including newproduction technologies (like 3D printing or automation), urbanization ande-commerce. The international markets are integrating rapidly, promoting economicgrowth and in this way fulfilling a fundamental prerequisite for prosperity. To fosterthis development, technical, social and political barriers to international competitionare more and more abolished, resulting in the development of intercontinentalnetworks realizing an intensified division of labour. Starting and end point of theassociated global passenger and goods flows are mostly agglomerations.
Worldwide, concentration tendencies of population and economic activities incities are therefore observable. These flows are further marked by high-frequencysmall-scale deliveries, arising from retail and industry and their endeavour to reducetheir inventory in order to save storage costs and valuable land and sales space.Besides, also e-commerce demands in particular of private households as well asoffered e-commerce activities within most sectors are increasing.
All these forces again create an augmenting demand for commercial transport,especially in agglomerations, provoking a higher transport performance and puttingpressure on traffic infrastructure.
Besides, conflicting goals of different interest groups fuel the discussion aboutcommercial transport. On the one hand, commercial transport ensures adequatesupply and distribution. Therefore, it is a fundamental prerequisite for economicactors to operate their business as well as for customers to receive goods andservices. On the other hand, commercial transport has negative effects on envi-ronment and society, since it endangers the quality of life by external effects, e.g. airquality, noise and traffic safety.
v

In this way, the authorities of politics, municipalities and interdisciplinaryplanning, actors of production and logistics, habitants as well as all further groupsof interests are involved and affected by this topic in various forms.
For this reason, this book comprises over 28 contributions examining trends andchallenges for commercial transport as the essential link for production, logisticsand society. Therefore, innovative technologies and strategies are presented anddiscussed to better understand the interdependencies and conflicts of interestbetween the areas of production, logistics and traffic.
Hence, the focus of this book is on the following core topics:
• Modelling of freight transport considering logistics, production and society• Potentials for usage of e-mobility in commercial transport• Balancing and reducing the environmental impacts (like noise, air pollution and
greenhouse gases)• Logistics hubs as interlinkages for intermodal commercial transport• ICT system integration in production, logistics and traffic• Supply chains and networks• Empirical studies and data mining for analysing commercial transport• Urban commercial transport• Innovative approaches for production, logistics and transport systems
This book is addressed to all representatives of research and practice from thedisciplines production, logistics as well as spatial and transport planning, who areinterested in scientific and practice-oriented approaches.
The contributions had been evaluated and selected on the basis of a double-blindreview process.
vi Foreword

Acknowledgments
We as the editors of the book would like to thank all involved members of thescientific committee of the second ICPLT, who reviewed the presented contribu-tions to assess their scientific and practical relevance, quality and originality.
The following professors were decisively involved in the selection of the fol-lowing contributions:
• Prof. Dan Andersson, Chalmers University of Technology, TechnologyManagement and Economics, NORTHERN LEAD Logistics Centre
• Dr.-Ing. Wulf-Holger Arndt, TU Berlin, Center for Technology and Society• Prof. Dr.-Ing. Manfred Boltze, TU Darmstadt, Institute of Traffic and Transport• Prof. Ph.D. Michael Browne, University of Westminster, Faculty of
Architecture and the Built Environment• Prof. Dr. Laetitia Dablanc, University of Paris-Est, French Institute of Science
and Technology for Transport, Development and Networks• Prof. Dr. Gerard DeJong, University of Leeds, Institute for Transport Studies• Prof. Dr.-Ing. Jochen Deuse, TU Dortmund University, Institute of Production
Systems, Professor for Operating and Production Systems• Prof. Dr. Ralf Elbert, TU Darmstadt, Department of Management and Logistics• Prof. Dr.-Ing. Heike Flämig, Hamburg University of Technology, Institute for
Transport Planning and Logistics• Prof. Dr. George A. Giannopoulos, National Centre for Research &
Development, Hellenic Institute of Transport• Prof. Ph.D. Genevieve Giuliano, University of California, Margaret and John
Ferraro Chair in Effective Local Goverment, METRANS• Prof. Dr.-Ing. Evi Hartmann, Friedrich-Alexander-University
Erlangen-Nuremberg, Chair of Supply Chain Management• Prof. Dr. Michael Henke, TU Dortmund University, Institute for Corporate
Logistics• Prof. Dr.-Ing. Bernd Kuhlenkötter, Ruhr University Bochum, Chair for
Production Systems
vii

• Prof. Dr.-Ing. Bert Leerkamp, University of Wuppertal, Institute for FreightTransport Planning and Logistics
• Prof. Dr. Barbara Lenz, German Aerospace Center, Institute of TransportResearch
• Prof. Dr. rer. pol. Gernot Liedtke, German Aerospace Center, Institute ofTransport Research, Commercial Transport
• Prof. Dr. Alan McKinnon, Kühne Logistics University, Logistics Department• Prof. Dr.-Ing. Joachim Metternich, TU Darmstadt, Institute of Production
Management, Technology and Machine Tools• Prof. Dr. Dr. h.c. Hans-Christian Pfohl, TU Darmstadt, Department of Supply
Chain and Network Management• Prof. Dr.-Ing. Markus Rabe, TU Dortmund University, Department of IT in
Production and Logistics• Prof. Dr.-Ing. Dipl.-Wirt. Ing. Günther Schuh, RWTH Aachen University, Chair
for Production Engineering• Prof. Dr. Lóránt Tavasszy, Delft University of Technology, Professor Freight
Transport and Logistics• Prof. Dr. Michael ten Hompel, TU Dortmund University, Chair of Materials
Handling and Warehousing• Prof. Dr. Eddy Van de Voorde, University of Antwerp, Departement Transport
en Ruimtelijke Economie• Prof. Dr. Johan Woxenius, University of Gothenburg, Logistics and Transport
Research Group
We thank them and all authors particularly. With their help, support and efforts,it was possible to realize this publication.
Dortmund Uwe ClausenDarmstadt Hanno FriedrichMay 2015 Carina Thaller
Christiane Geiger
viii Acknowledgments

Contents
Part I Modelling of Freight Transport Considering Logistics,Production and Society
1 Redeveloping the Strategic Flemish Freight Transport Model . . . . 3Stefan Grebe, Gerard de Jong, Dana Borremans,Pieter van Houwe and Hans-Paul Kienzler
2 Building a Model of Freight Generation with a CommodityFlow Survey . . . . . . . . . . . . . . . . . . . . . . . . . . . . . . . . . . . . . . . . 23Duy-Hung Ha and François Combes
3 Freight Transport Demand Modelling . . . . . . . . . . . . . . . . . . . . . 39Carina Thaller, Benjamin Dahmen, Gernot Liedtkeand Hanno Friedrich
4 System Dynamics Based, Microscopic Freight TransportSimulation for Urban Areas . . . . . . . . . . . . . . . . . . . . . . . . . . . . 55Carina Thaller, Uwe Clausen and Raymond Kampmann
5 Analysing the Connection Between Gross Value Addedof Industries and Freight Transport Demand—The Meritof Supply and Use Tables in the Identification of RelevantEconomic Activities for Freight Transport Demand . . . . . . . . . . . 73Stephan Müller, Axel Wolfermann and Sandra Burgschweiger
6 Requirements for Traffic and Transport Models . . . . . . . . . . . . . 99Wulf Hahn and Werner Frey
ix
Part II Potentials for Usage of e-Mobility in Commercial Transport
7 Who Are the Early Adopters of Electric Vehicles in CommercialTransport—A Description of Their Trip Patterns . . . . . . . . . . . . 115Ina Frenzel
8 Potentials of e-Mobility for Companies in Urban Areas . . . . . . . . 129Wolfgang Trummer and Norbert Hafner
Part III Balancing and Reducing the Environmental Impacts
9 Global Standardisation of the Calculation of CO2 EmissionsAlong Transport Chains—Gaps, Approaches, Perspectivesof the Global Alignment Process . . . . . . . . . . . . . . . . . . . . . . . . . 143Verena Ehrler, Aad van den Engel, Igor Davydenko,Daniel Diekmann, Jan Kiel, Alan Lewis and Saskia Seidel
10 Role of Cargo Weight and Volume: Minimizing Costs and CO2
Emissions in Container Transport . . . . . . . . . . . . . . . . . . . . . . . . 159Radoslav Rajkovic, Nenad Zrnic, Sanja Bojic and Đorđe Stakic
11 Determination of GHG-Emissions of Handling Operationsin Multimodal Container Terminals . . . . . . . . . . . . . . . . . . . . . . 175Zoran Miodrag, Jan Kaffka, Uwe Clausen and Lars Munsel
Part IV Logistics Hubs as Interlinkages for Intermodal CommercialTransport
12 Developing Dry Ports Through the Use of Value-AddedServices . . . . . . . . . . . . . . . . . . . . . . . . . . . . . . . . . . . . . . . . . . . 191Dan Andersson and Violeta Roso
13 Outlying Location of Logistics Activities: The Exampleof the Burgundy in France . . . . . . . . . . . . . . . . . . . . . . . . . . . . . 205Cecilia Cruz and Christine Belin-Munier
Part V ICT System Integration in Production, Logistics and Traffic
14 Networking of Information Flows—Improved Conceptfor the Inland Waterway Transport on the Danube . . . . . . . . . . . 219Milosav Georgijevic, Sanja Bojic and Miljan Matijevic
x Contents

15 CargoSwApp—Short-Term Replacement of Cancelled CargoTransports . . . . . . . . . . . . . . . . . . . . . . . . . . . . . . . . . . . . . . . . . 231Mathias Bös, Patrick Crucq and Bioniko Tauhid
16 ORFE to AFEX—A Conceptual Look into the Futureof Online Freight Exchange . . . . . . . . . . . . . . . . . . . . . . . . . . . . 241René Föhring and Stephan Zelewski
17 Delivery Time Windows for Road Freight Carriersand Forwarders—Influence of Delivery Time Windowson the Costs of Road Transport Services . . . . . . . . . . . . . . . . . . . 255Ralf Elbert, Dominik Thiel and Daniel Reinhardt
Part VI Supply Chains and Networks
18 Application of Service Engineering Methods for Developinga Functional Model for a Supply Chain Service Usingthe Example of the Air Cargo Supply Chain Service“CairGoLution” . . . . . . . . . . . . . . . . . . . . . . . . . . . . . . . . . . . . . 277Hans-Christian Pfohl and Tamer Kurnaz
19 A Holistic Approach to Measure Quality of Service in FreightTransport Networks . . . . . . . . . . . . . . . . . . . . . . . . . . . . . . . . . . 287Albert Mancera, Dirk Bruckmann and Ulrich Weidmann
20 Supply Chain Collaboration or Conflict? Information Sharingand Supply Chain Performance in the Automotive Industry . . . . . 303Liyuan Wang, Hans-Christian Pfohl, Ulrich Berbnerand Anna Katharina Keck
Part VII Empirical Studies and Data Mining for AnalysingCommercial Transport
21 Empirical Analysis of Freight Transport Prices Using the FrenchShipper Survey ECHO . . . . . . . . . . . . . . . . . . . . . . . . . . . . . . . . 321François Combes, Julien Harache, Martin Koning and Eric Morau
22 An Inventory-Focused Analysis of German Food Supply Chains:The Case of Dairy Products . . . . . . . . . . . . . . . . . . . . . . . . . . . . 337Ole Hansen and Hanno Friedrich
Contents xi

Part VIII Urban Commercial Transport
23 Factors Influencing the Performance of Urban ConsolidationSchemes . . . . . . . . . . . . . . . . . . . . . . . . . . . . . . . . . . . . . . . . . . . 351Sönke Behrends
24 Ho.Re.Ca. Logistics and Medieval Structured Cities: A MarketAnalysis and Typology . . . . . . . . . . . . . . . . . . . . . . . . . . . . . . . . 369Thomas Verlinden, Eddy Van de Voorde and Wouter Dewulf
25 Capacity for Freight in Urban Railway Networks—An AnalyticalModel for Capacity Consumption of Freight Trainsin Urban Networks . . . . . . . . . . . . . . . . . . . . . . . . . . . . . . . . . . . 385Tobias Fumasoli, Dirk Bruckmann and Ulrich Weidmann
Part IX Innovative Approaches for Production, Logisticsand Transport Systems
26 Automatic Robot-Based Unloading of Goods Outof Dynamic AGVs Within Logistic Environments. . . . . . . . . . . . . 397Adrian Böckenkamp, Frank Weichert, Yan Rudalland Christian Prasse
27 PROduction Plan Based Recovery of VEhicle Routing PlansWithin Integrated Transport Networks . . . . . . . . . . . . . . . . . . . . 413Michael Schygulla and Andreas Stadler
28 Monte-Carlo Tree Search for Logistics . . . . . . . . . . . . . . . . . . . . 427Stefan Edelkamp, Max Gath, Christoph Greulich, Malte Humann,Otthein Herzog and Michael Lawo
xii Contents

About the Editors
Prof. Dr.-Ing. Uwe Clausen is Managing Directorof the Institute of Transport Logistics at TUDortmund University and—in joint appointment—also Director of the Fraunhofer-Institute for MaterialFlow and Logistics in Dortmund (since 2001) andChairman of the “Fraunhofer Traffic andTransportation Alliance” (since 2003). He worked inthe logistics service industry as European OperationsDirector at Amazon.com and Logistics Manager at
Deutsche Post DHL. In July 1995 he achieved the title of Dr.-Ing. with his doctoralthesis on transportation network optimisation at TU Dortmund University.
He is member of the board of ECTRI European Conference of TransportResearch Institutes, since 2012 (representative of Fraunhofer within ECTRI since2005). He is Advisory Council Member of the Association of GermanTransportation Companies (VDV) and Member of the scientific advisory boardof the Bundesvereinigung Logistik (BVL) e.V.
He was member of the DFG (German Research Foundation) experts board“System technology” on the subject “Traffic and transportation systems, logistics,quality management”, from 2004 to 2012. From July 2002 till July 2005, Prof.Clausen was Dean of the Engineering Faculty at TU Dortmund University.
His research areas include green logistics, commercial transport modelling,intermodal transportation, mathematical optimization, network optimization anddistribution systems.
xiii

Prof. Dr. Hanno Friedrich studied IndustrialEngineering at the Karlsruhe Institute forTechnology (KIT). After having finished his studiesin 2004, he worked for six years at McKinsey &Company, a strategic management consulting firm.Within this time, he did his Doctorate, which hefinished in 2010 at the KIT under the supervision ofProf. Dr. Werner Rothengatter. After working forone year as a Postdoc at the KIT he received a callfor a Junior Professorship in the area of commercialtransport at the TU Darmstadt in 2011. SinceSeptember 2015 he is Assistant Professor at the
Kühne Logistics University (KLU) in Hamburg. His research topics include freighttransport demand modelling, transport economics, risk management in transportand logistics and food logistics.
Dipl.-Geogr. Carina Thaller studied HumanGeography at the Ludwig-Maximilans-University inMunich. Her study focus was in the fields of trans-port planning und traffic techniques, as well a urbanand rural planning. While her study she worked ontransport planning projects for motorized individualand public transport as a student assistant at gevashumberg & partner. In addition, she absolvedinternships successfully as a trainee for TransportPolitics and Transport Concepts at ADAC e.V. in theSection “Representation of Interests in Transport” aswell as at BMW AG in the Department of Traffic
Techniques and Transport Management in Munich. In the framework of herdiploma thesis she has researched in the field of intermodalility in individualtransport. Her main focus was on the potentials of public bikes in suburban areas.Her recommendation served the principal Munich Public Transports (MVV) as apreparatory study to implement public bikes projects in the suburbs of Munich.
Since 2011 she has been working as a PhD student and research assistant at theInstitute of Transport Logistics, TU Dortmund University, Germany. CarinaThaller’s research focuses on freight transport planning, modelling and analysing aswell as green logistics. Thereby, she concentrates on the effects of interactionsbetween society, economy, transport and environment and evaluates the impacts onfreight transport flows. She is working in the group “Process Management” at theInstitute of Transport Logistics. In this role, she assumes control and research workof national and international research and transfer projects.
xiv About the Editors

Dr.-Ing. Christiane Geiger is Chief Engineer and aMember of the Executive Board of the Institute ofTransport Logistics at TU Dortmund University. Sheis responsible for the administrative managementof the Institute as well as she coordinates and supportsproject work. Additionally, in this position, she holdslectures on waste logistics, planning and optimizinglogistics nodes and logistics and traffic management.
Christiane Geiger studied logistics at TU DortmundUniversity. She joined the Institute of TransportLogistics as scientific assistant in June 2008. Her
methodical focus lies on process analysis and optimization from a cost, perfor-mance and ecological perspective. With this expertise, she took over the leadershipof the group “process management” in October 2011. In technical terms she isengaged in contract logistics and environmentally sustainable freight transport. InNovember 2014, she completed her doctorate on resource rough dimensioning forlaunching automotive contract logistics services.
About the Editors xv

Part IModelling of Freight Transport
Considering Logistics, Productionand Society

Chapter 1Redeveloping the Strategic FlemishFreight Transport Model
Stefan Grebe, Gerard de Jong, Dana Borremans, Pieter van Houweand Hans-Paul Kienzler
1.1 Introduction
The Flemish authorities use a strategic freight model to forecast the demand forfreight transport in the future and to support the decision making process for largeinfrastructure investments. In addition, the estimated truck matrix is input for theFlemish strategic passenger transport model.
The freight model is a classical four-step traffic model with several additions.One of the additions is a time-period choice model, which takes into account shiftsfrom peak periods to off-peak periods due to congestion and allows for instancesimulations of policies with congestion charges during peak hours. Anotherextension is a module for the use of logistical hubs (by mode).
Recently, a new version of the freight model (version 4.1.1) has been developed.In this paper we will discuss the Flemish freight model version 4.1.1 with a mainfocus on the mode and vehicle type choice. We discuss the model structure, the costfunctions, the results of logit model estimations and present the elasticities.Furthermore, we briefly discuss the time-of-day choice model.
S. Grebe (&) � G. de JongSignificance, The Hague, The Netherlandse-mail: [email protected]
G. de JongITS Leeds, Leeds, UK
D. BorremansVerkeerscentrum, Department MOW, Flemish Authorities, Antwerp, Belgium
P. van HouweMINT, Mechelen, Belgium
H.-P. KienzlerPrognos, Basel, Switzerland
© Springer International Publishing Switzerland 2016U. Clausen et al. (eds.), Commercial Transport,Lecture Notes in Logistics, DOI 10.1007/978-3-319-21266-1_1
3

1.2 Model Description
The model starts with the application of production and attraction multipliers onsocio-economic data (for future year these are forecasts themselves) for each zone.The model uses 518 zones within Belgium and 96 larger external zones in Europe.Given the productions and attractions per zone, the distribution is modelled byusing a gravity model.
Mode choice and vehicle type choice are integrated in one model and are esti-mated simultaneously. The mode and vehicle-type choice part of the model con-siders three road vehicle types, three train types and ten inland waterways(IWW) vessel types as direct and intermodal transport modes. Air transport andshort sea shipping are not modelled. To compensate for this, the zones hostingharbors or airports attract and produce the amounts of cargo that is shipped furtheraway in reality.
There are three separate network assignments: for IWW transport, for railtransport and for road transport (the latter takes place simultaneously with theassignment of the cars in the strategic passenger transport model).
Goods are distinguished in 20 product groups (NST 2007 classes) following theclassification system for transport statistics by the Economic Commission forEurope by the United Nations. For three of the commodities (NST 15, 18 and 20)no data is available and no model can be estimated. Table 1.9 in the Appendix givesan overview of the classification of goods per NST class. During the estimationsand the model calculations the commodities are treated independently. In this way,different demands for the different product groups can be taken into account anddifferent trends between them are incorporated correctly.
1.3 Mode and Vehicle Type Choice
1.3.1 Model Specification
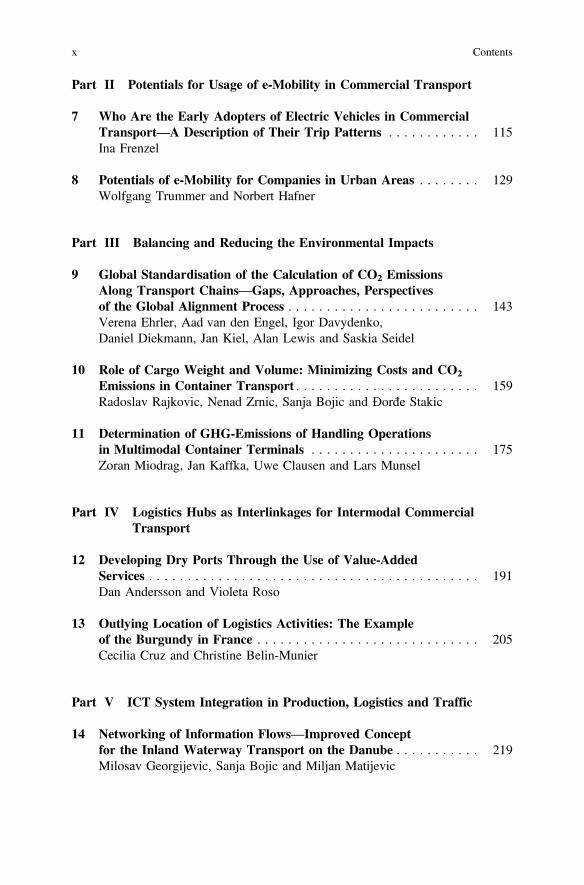
The mode choice and the vehicle-type choice are integrated within one model. Anoverview of the structure and the alternatives is shown in Fig. 1.1. The three modesare road, rail and inland waterways. The latter is split further into direct andintermodal transport. On the lowest level are the different vehicle types. For rail andthe two IWW branches substitution between specific alternatives is taken intoaccount by including nesting coefficients. For road transport a deterministic modelis estimated, due to lack of observations on road vehicle type at the OD level.
In the estimation process, first multinomial logit (MNL) models have beenestimated per NST class. The probability Pi of each alternative i can be calculatedfrom the utilities Ui
4 S. Grebe et al.

Pi ¼ eUi
Pnj¼1
eUj
:
The utility function Ui consists of two terms, the observed utility component ~Ui
and the random (or error) term ei: Ui ¼ ~Ui þ ei.The error term follows the extreme value distribution type 1 (Gumbel) and will
not be further discussed in the rest of this paper. The observed utility consists of analternative specific constant ASCi, a number of coefficients ci times continuousvariables Ki and di coefficients times dummy variables Dið¼0 _ 1Þ
~Ui ¼ ASCi þ ci � Ki þ di � Di:
The problem of a classical MNL model is that it does not take into accountcorrelations between alternatives, which are very often present in reality. Nestedlogit models take the substitution between specific alternatives into account. Thenesting coefficient describes the correlation between the alternatives. The coefficienthas a value between 0 and 1. A value outside this range is not consistent with utilitymaximization and indicates a problem with the estimated model. A coefficient of 1
Model specification
Freight
Road
Van
(Va)
Small truck
(ST)
Large truck
(LT)
Rail
Block train
(T1)
Wagonload
train (T2)
Intermodal
(T3)
Scale rail
Inland
waterways
Direct
300 t
(IWW_D1)
600 t
(IWW_D2)
1350 t
(IWW_D3)
2000 t
(IWW_D4)
4500 t
(IWW_D5)
Scale IWW
direct
Intermodal
300 t
(IWW_I1)
600 t
(IWW_I2)
1350 t
(IWW_I3)
2000 t
(IWW_I4)
4500 t
(IWW_I5)
Scale IWW
intermodal
Fig. 1.1 Schematic overview of the mode and vehicle-type choice model
1 Redeveloping the Strategic Flemish Freight Transport Model 5

means no correlation and 0 full correlation between the alternatives. A schematiccomparison of a MNL model without nesting and a nested model is shown inFig. 1.2.
In a nested model the probability for an alternative with utility H within a nestwith m alternatives is calculated with a similar formula as in the MNL model.
Within a nest the probability of each alternative compared to the m alternatives iscalculated analogously to a MNL model
P\ijA;k[ ¼ eHi=h
Pmj¼1
eHj=h
with Hi the observed utility component, Θ the nesting coefficient and k thenumber of alternatives on the higher level. The probabilities one level higher in thedecision tree with n alternatives are calculated with
PA;k ¼ eGkþhk � LkPnl¼1
eGlþhl � Ll
with Gk the utility term of the top level and the “logsum”-term within the nest
Lk ¼ lnXmi¼1
eHi=h
The probability of alternative i is the product of the probabilities of the twolevels
Pi ¼ PA;k � P\ijA;k[ :
For more details about nested and MNL models see (Train 2003).In the Flemish freight model only utilities on the lowest level are estimated. This
means that in the formulas above Hi ¼ ~Ui and Gk ¼ 0. By multiplication of all
Fig. 1.2 Example of a simple MNL model with 3 alternatives (left) and a nested logit model(right). ϴ is the nesting coefficient
6 S. Grebe et al.

utilities with all nesting coefficients in the model, costs and times have the samemeaning for all alternatives.
1.3.2 Data on Transport Flows and Costs
For the modes and vehicle types the distances and travel times betweenOrigin-Destination (OD) pairs are estimated by skimming each of the three net-works. The results are level-of-service files per vehicle type that contain per ODpair distance, travel time, (road charge) and accessibility. For intermodal transportthe travel times and travel distances are given for both modes. All zones areaccessible by road transport, but not all zones can be reached by rail and IWW. If analternative is not available, it is excluded during the estimation process.
Furthermore, OD matrices for the base year 2010 have been constructed basedon data from available transport statistics. These are aggregate data (zonal level)which are split in the 20 NST classes. For rail and IWW this information isavailable for all vehicle types. For road transport only a national vehicle type split isavailable. Therefore, a deterministic road vehicle-type choice model was built andcalibrated to match the overall shares per vehicle type. Based on the costs the bestvehicle per OD-pair is chosen. The method will be discussed in the next section.
The cost functions used in the mode and vehicle-type choice model includetransport-time dependent cost, transport-distance dependent cost, toll fees, restingperiods, as well as costs for loading, unloading and transshipment. The generalformula is:
Costs ¼ ~aþ b1 � t1 þ c1 � d1 þ D�þ b2 � t2 þ c2 � d2 þ e:
• ~a is the sum of the loading costs a1 in the origin zone and the unloading costs a2in the destination zone. We assume that loading and unloading costs are equaland only depend on the vehicle type. As time and distance costs scale linearly,threshold effects are also incorporated in the costs for loading and unloading.
• b1 and c1 are the time and distance dependent costs for rail or IWW. They aremultiplied with the transport time t1 and transport distance d1 with one of thesemodes. The times and distances are vehicle type dependent.
• D�
are the transshipment costs for intermodal transports. In the model theassumption is made that these costs have to be paid once if the origin ordestination zone is a harbor and otherwise twice. This implies that non-harborzones require pre- and post-carriage by road transport.
• b2 and c2 are the time and distance dependent costs for road transport (eitherdirect or serving as access to and egress from rail or IWW). They are multipliedwith the transport time t2 and transport distance d2 with this mode. Road usercharges ε can add to the transport cost of the road shipment. The distances andtimes are vehicle type dependent.
1 Redeveloping the Strategic Flemish Freight Transport Model 7

For direct trips the equation simplifies:
Costs ¼ 2 � a1;2 þ b1;2 � t1;2 þ c1;2 � d1;2 þeð Þ:
The cost functions are determined based on data from studies in Scandinavia, theNetherlands and Belgium. In addition to the determination of the a;b; c;D and εspecial attention has been given to also determine the shares of fuel, taxes, personal,insurances and other important contributions to the total costs per hour and per km.This is important in the forecast of future years and for the simulation of policyeffects (Table 1.1). An overview of the unit cost inputs per ton is given in Fehler!Verweisquelle konnte nicht gefunden werden.
The capacities and the cost indicators take the average load factors into account.All costs have to be paid for integer numbers of vehicles, wagons or containers. Forroad transport the minimum shipment size is one truck. For (wet en dry) bulk shipsit is the capacity of a ship. For container ships and intermodal rail transport costs areper containers of 12 tons. Carriage trains have a minimum shipment size of 20 ton(one wagon) and for block train only whole trains can be booked. Note that forintermodal shipments (IWW and rail) the road transport part is exclusively withheavy trucks (with containers) in the model.
For IWW the model distinguishes direct and intermodal shipments. For inter-modal shipments the cost indicators of container ships are applied. For directtransport, the assumption is made that all NST classes except 2, 7 and 8 are dry bulkgoods. For the other three classes we assume a mixture of wet and dry bulk withpercentages of 50 % (NST 2), 75 % (NST 7) and 100 % (NST 8) wet bulk.
1.3.3 Deterministic Road Transport Model
For road transports five vehicle types are considered (the three that are in Fig. 1.1,but with container and non-container for small and large trucks). However, theinformation which vehicle is used for specific ODs is lacking (which is required toestimate a logit model). Therefore, the choice of the road-vehicle-type is estimatedusing a deterministic model. Based on the transport costs the cheapest vehicle ischosen for each OD pair and NST class. To match the fraction of containerized andnon-containerized transports an intermediate step is introduced.
The amount of containerization per NST class is deduced from the DutchBasGoed (Significance, NEA en DEMIS (2010)) in which the containerization isdetermined for 10 NSTR classes. Under the assumption that the amount of con-tainerization is the same in both countries the containerization can be approximatedfor the 20 NST classes (see Table 1.2).
For small and large trucks the container-type and the non-container type aremerged into a single vehicle type each. Thus, the deterministic model is estimatedfor three vehicle types only: vans, small trucks and large trucks. For small and large
8 S. Grebe et al.

trucks the costs depend on the amount of containerization per NST class dNST andare calculated as:
Costs ¼ dNST � CostsContainer þ ð1� dNSTÞ � CostsNo�Container:
Table 1.1 Overview of the cost indicators (in Euro per ton) for 2010 in the cost functions of alltransport modes in the freight model
Category Capacity b c a D�
Road Van 1.5 20.087 0.086 14.400 14.400
Road Small truck 12 3.128 0.019 2.700 2.700
Road Small truck (co) 12 2.954 0.019 2.167 1.500
Road Large truck 27 1.741 0.014 1.481 1.481
Road Large truck (co) 27 1.656 0.014 1.541 0.970
IWW dry bulk 600 0.163 0.004 0.800
IWW Wet bulk 600 0.171 0.004 1.000
IWW Container 600 0.120 0.004 0.600
IWW Dry bulk 1350 0.090 0.002 0.700
IWW Wet bulk 1350 0.111 0.002 0.800
IWW Container 1350 0.071 0.002 0.500
IWW Dry bulk 2000 0.075 0.002 0.654
IWW Wet bulk 2000 0.095 0.002 0.754
IWW Container 2000 0.060 0.002 0.454
IWW Dry bulk 4500 0.058 0.001 0.600
IWW Wet bulk 4500 0.077 0.001 0.700
IWW Container 4500 0.047 0.001 0.400
IWW Dry bulk 9000 0.038 0.001 0.600
IWW Wet bulk 9000 0.050 0.001 0.700
IWW Container 9000 0.031 0.001 0.400
Rail Carriage 501 0.898 0.021 1.500
Rail Intermodal 765 0.598 0.014 1.500
Rail Blok train 765 0.598 0.014 1.435
The two vehicle types with the addition (co) are trucks with containers
Table 1.2 Average containerization per NST class for road transport
NST % Cont NST % Cont NST % Cont NST % Cont
1 2.9 % 6 5.1 % 11 6.8 % 16 6.8 %
2 1.5 % 7 1.6 % 12 6.8 % 17 6.8 %
3 1.2 % 8 2.5 % 13 6.8 % 18 –
4 4.5 % 9 2.2 % 14 3.1 % 19 6.8 %
5 4.3 % 10 4.3 % 15 – 20 –
1 Redeveloping the Strategic Flemish Freight Transport Model 9

In the mode and vehicle choice model congestion is not considered as freighttransport takes place only to a small extent during peak hours. Much moreimportant to consider during mode choice are the mandatory rest periods fortruckers. In the model they are added to the transport times for road-shipmentslonger than 270 min. Figure 1.3 gives an overview of the implemented restingperiods. In the calculation of the time-dependent costs the short breaks of 45 minare considered, the long breaks during the night are not.
A not trivial choice in the deterministic model is the trip frequency. The ODmatrixcontains the flows of goods between zone pairs in the base year. This corresponds to atrip frequency ω equal to 1. Per NST class there are many zone pairs where severalshippers and receivers are situated. For most of them the trip frequency will be higherthan once per year. Both effects are arguments for a higher trip frequency.Counteracting this is consolidation of shipments from different zones. By comparingthe amount of ton kilometers per vehicle type in Belgium (see Table 1.3), the optimumtrip frequency is determined. It is 2.6 for national transports and 1.04 for internationaltransports. After the calibration the determined and observed shares per vehicle typeare in good agreement (Federale Overheidsdienst Economie, ADSEI 2010).
Taking into account the containerization per NST class, the rest times and thetrip frequencies, the costs for the three vehicle types can be calculated for each ODpair. Per vehicle type also the minimum number of vehicles is determined. The totalcosts are the product of the costs per vehicle and the minimum number of vehicles(integer number) required. For each OD pair the cheapest type is chosen and itsprice is used in the logit model.
1.3.4 Estimation Results
The logit model is estimated with the ALOGIT software. In the estimations processobservations are weighted by their shipment size. To normalize all shipments arenormalized by the average shipment size per NST class (see Table 1.4).
270min 45min 270min 45min 24min 705min
Fig. 1.3 Overview of driving times (light grey) and resting times (dark grey) for road transport.For shipments longer than 24 h the pattern repeats
Table 1.3 Observed and modelled distribution (after the calibration) of freight in ton kilometerstransported in vans, light and heavy trucks for national and international shipments
Mode Observed Deterministic model
National (%) International (%) National (%) International (%)
Van 0.5 0.0 0.82 0.08
Light 5.5 1.0 4.45 0.91
Heavy 94.0 99.0 94.73 99.01
10 S. Grebe et al.

The model includes a cost term that consists of the monetary transport costs andshadow costs to account for the transport time that is related to the commodities(e.g. for interest on the capital in transit, deterioration, safety stock). For thetransport time different valuation estimates have been tested and compared. In thefinal model the transport time is valuated with 10 % of the transport costs for non-containerized goods and 20 % for containerized goods, which means that transporttime is valuated as shadow costs of 10 of 20 % respectively (Significance et al.2013).
In the model cost coefficients are estimated for road, rail, direct IWW andintermodal IWW. The utilities of all alternatives have the structure
~Ui ¼ ASCi þ cci � CTonTot
þ 0:1 � CTonTot
� �þ Dint
i þ DHavi ;
with ASC the alternative specific constants, cc the cost coefficients, C thetransport costs and TonTot the size of the transport. Dint is a dummy for interna-tional transports and DHav the dummy for trips to harbor zones. The 0.1 in theformula is a 0.2 for containerized shipments. As reference category road transporthas been chosen. Therefore, the ASC for road transport has been fixed to zero.
An overview of all results is given in Table 1.5. The model contains individualcost coefficients for road, rail plus direct and intermodal IWW transport. All costcoefficients have negative values. The absolute values for road transport are thesmallest, for rail transport in the middle and for IWW transport the largest. This is inagreement with our expectations. In addition, significant dummy coefficients havebeen found for international IWW and rail transports and transports by rail to orfrom harbor zones.
Different patterns of substitution between different modes were tested by spec-ifying different nesting structures and testing whether the nesting coefficients weresignificant. Per NST class zero, one or two nesting coefficients are estimated.
Table 1.4 Average flow ofgoods per OD pair and NSTclass
NST Ton per transport NST Ton per transport
1 203.9 10 381.9
2 143.6 11 104.1
3 258.9 12 97.5
4 187.9 13 24.8
5 46.5 14 109.9
6 119.4 16 47.1
7 268.9 17 39.9
8 189.8 19 31.0
9 321.5 Average 159.9
1 Redeveloping the Strategic Flemish Freight Transport Model 11

Tab
le1.5
Overview
oftheestim
ated
coefficientsof
thefinalmod
el
File
NST
01.F12
NST
02.F12
NST
03.F12
NST
04.F12
NST
05.F12
NST
06.F12
Title
VrachtM
odel
VrachtM
odel
VrachtM
odel
VrachtM
odel
VrachtM
odel
VrachtM
odel
Con
verged
TRUE
TRUE
TRUE
TRUE
TRUE
TRUE
Observatio
ns27
5389
1561
0323
3731
2745
7122
0612
2671
09
Finallog(L)
−69
989.2
−92
727
−20
8866
.9−49
407.1
−88
370.8
−11
6294
.7
D.O.F.
2016
2020
718
Rho
2 (0)
0.84
50.67
50.60
50.89
20.7
0.78
Rho
2 (c)
0.08
30.12
40.13
40.10
20.08
80.06
Estim
ated
14-Jan-15
14-Jan-15
14-Jan-15
14-Jan-15
14-Jan-15
14-Jan-15
Scaling
11
11
11
ASC
_Road
0(*)
0(*)
0(*)
0(*)
0(*)
0(*)
ASC
_Rail1
−25
.11(−13
.6)
−8.09
7(−56
.2)
−9.36
7(−88
.4)
−97
.36(−4.4)
−2.00
4(−12
0.4)
−5.48
7(−5.1)
ASC
_Rail2
−27
.93(−13
.6)
−10
.15(−57
.6)
−10
.71(−88
.6)
−98
.70(−4.5)
−2.99
8(−18
6.3)
−6.98
9(−5.1)
ASC
_Rail3
−34
.42(−13
.6)
−13
.63(−55
.1)
−13
.42(−82
.7)
−10
1.1(−4.6)
−4.17
4(−15
0.6)
−9.88
3(−5.1)
ASC
_IWW_D
10(*)
0(*)
0(*)
0(*)
0(*)
0(*)
ASC
_IWW_I1
0(*)
0(*)
−12
.51(−28
.3)
0(*)
0(*)
0(*)
ASC
_IWW_D
2−14
.09(−13
.8)
−5.71
2(−42
.5)
−4.27
4(−99
.7)
−60
.63(−4.5)
0(*)
−13
.98(−5.0)
ASC
_IWW_I2
−21
.99(−16
.0)
0(*)
−7.12
4(−51
.6)
−13
5.1(−4.4)
0(*)
0(*)
ASC
_IWW_D
3−12
.45(−13
.6)
−2.21
4(−32
.7)
−2.33
6(−76
.1)
−43
.68(−4.5)
0(*)
−7.05
4(−5.1)
ASC
_IWW_I3
−16
.87(−13
.9)
0(*)
−4.71
5(−45
.9)
−98
.48(−4.4)
0(*)
−7.20
6(−5.0)
ASC
_IWW_D
4−14
.16(−13
.8)
−2.17
6(−33
.2)
−2.56
1(−80
.9)
−59
.29(−4.5)
0(*)
−7.78
0(−5.1)
ASC
_IWW_I4
−18
.94(−15
.2)
0(*)
−4.17
3(−41
.8)
−15
2.7(−4.4)
0(*)
−4.59
3(−3.6)
ASC
_IWW_D
5−13
.77(−13
.8)
0.86
81(15.9)
−1.20
3(−40
.4)
−49
.80(−4.5)
0(*)
−11
.71(−5.1)
ASC
_IWW_I5
−14
.54(−12
.6)
−0.57
18(−0.2)
−3.89
1(−41
.3)
−17
2.4(−4.3)
0(*)
−3.96
3(−3.1)
InternRail
1.54
0(6.8)
0.84
25(12.5)
2.30
5(43.0)
10.08(4.1)
−0.21
26(−13
.7)
−0.86
02(−5.0)
InternIW
W4.40
1(13.2)
−1.30
9(−25
.2)
2.50
6(73.8)
21.12(4.4)
0(*)
1.03
0(4.4)
(con
tinued)
12 S. Grebe et al.

Tab
le1.5
(con
tinued)
File
NST
01.F12
NST
02.F12
NST
03.F12
NST
04.F12
NST
05.F12
NST
06.F12
Title
VrachtM
odel
VrachtM
odel
VrachtM
odel
VrachtM
odel
VrachtM
odel
VrachtM
odel
Con
verged
TRUE
TRUE
TRUE
TRUE
TRUE
TRUE
Harbo
rRail
5.28
3(12.4)
−1.53
1(−23
.0)
2.61
7(50.3)
21.19(4.3)
0.51
61(36.1)
1.14
2(5.0)
cc_R
oad
−0.09
306
(−12
.8)
−0.13
54(−43
.6)
−0.12
86(−62
.1)
−0.28
72(−5.6)
−0.04
490(−76
.2)
−0.10
86(−5.1)
cc_R
ail
−0.05
573
(−7.9)
−0.13
23(−29
.1)
−0.08
025(−29
.8)
−0.16
94(−11
.3)
−0.07
660(−65
.7)
−0.16
10(−5.1)
cc_IWW_D
−0.45
22(−13
.7)
−1.06
6(−46
.3)
−0.58
32(−72
.8)
−5.02
6(−4.6)
0(*)
−1.17
2(−5.1)
cc_IWW_I
−1.54
0(−11
.7)
−3.43
2(−5.3)
−0.70
38(−49
.8)
−4.13
9(−4.1)
0(*)
−2.09
6(−4.8)
Theta_IWW_I
0.67
34(14.7)
1.00
0(*)
1.00
0(*)
1.00
0(*)
1.00
0(*)
0.42
69(5.1)
Theta_IWW_D
0.32
91(38.0)
0.35
74(63.3)
0.49
05(99.4)
0.58
11(37.6)
1.00
0(*)
1.00
0(*)
Theta_R
ail
1.00
0(*)
1.00
0(*)
1.00
0(*)
0.09
426(4.6)
1.00
0(*)
1.00
0(*)
File
NST
07.F12
NST
08.F12
NST
09.F12
NST
10.F12
NST
11.F12
NST
12.F12
Title
VrachtM
odel
VrachtM
odel
VrachtM
odel
VrachtM
odel
VrachtM
odel
VrachtM
odel
Con
verged
TRUE
TRUE
TRUE
TRUE
TRUE
TRUE
Observatio
ns16
8950
2506
9026
4028
2485
3522
9675
2010
72
Finallog(L)
−80
577.3
−18
3076
.1−99
886.4
−15
5781
.1−99
952.1
−12
5041
.1
D.O.F.
2118
1919
1415
Rho
2 (0)
0.66
80.70
70.80
70.62
60.75
40.60
4
Rho
2 (c)
0.10
30.05
70.07
90.04
10.06
20.15
Estim
ated
16-Jan-15
14-Jan-15
16-Jan-15
14-Jan-15
14-Jan-15
14-Jan-15
Scaling
11
11
11
ASC
_Road
0(*)
0(*)
0(*)
0(*)
0(*)
0(*)
ASC
_Rail1
−12
.83(−5.3)
−6.50
0(−73
.7)
−4.90
3(−35
.1)
−3.79
9(−24
.3)
−3.31
6(−3.8)
−1.96
9(−11
1.2)
ASC
_Rail2
−16
.14(−5.3)
−7.66
8(−74
.3)
−5.57
8(−35
.1)
−5.03
2(−24
.3)
−4.38
8(−3.8)
−2.74
1(−14
1.8)
(con
tinued)
1 Redeveloping the Strategic Flemish Freight Transport Model 13

Tab
le1.5
(con
tinued)
File
NST
07.F12
NST
08.F12
NST
09.F12
NST
10.F12
NST
11.F12
NST
12.F12
Title
VrachtM
odel
VrachtM
odel
VrachtM
odel
VrachtM
odel
VrachtM
odel
VrachtM
odel
Con
verged
TRUE
TRUE
TRUE
TRUE
TRUE
TRUE
ASC
_Rail3
−22
.60(−5.3)
−10
.38(−72
.2)
−7.14
8(−34
.8)
−8.36
9(−24
.4)
−6.34
4(−3.8)
−4.12
6(−12
3.3)
ASC
_IWW_D
1−10
.31(−5.1)
0(*)
0(*)
0(*)
−14
.18(−4.7)
0(*)
ASC
_IWW_I1
0(*)
0(*)
0(*)
0(*)
0(*)
0(*)
ASC
_IWW_D
2−10
.47(−5.3)
−4.29
9(−89
.0)
−5.57
6(−48
.4)
−9.06
2(−26
.4)
−15
.09(−4.8)
0(*)
ASC
_IWW_I2
2.42
1(1.2)
−11
.78(−28
.3)
−1.52
8(−3.4)
−20
.62(−12
.0)
0(*)
0(*)
ASC
_IWW_D
3−1.93
1(−5.0)
−3.06
9(−75
.5)
−4.27
8(−41
.0)
−7.62
1(−23
.3)
−10
.99(−3.8)
−2.94
6(−61
.0)
ASC
_IWW_I3
2.55
0(1.4)
−7.41
9(−31
.2)
−4.35
4(−8.0)
−14
.74(−15
.3)
0(*)
−0.82
00(−7.1)
ASC
_IWW_D
4−2.45
2(−5.1)
−3.08
1(−79
.8)
−3.97
7(−37
.3)
−8.19
4(−25
.9)
−11
.70(−4.2)
−2.20
3(−56
.5)
ASC
_IWW_I4
−2.68
4(−1.5)
−9.64
3(−33
.5)
−2.74
5(−6.0)
−16
.48(−15
.4)
0(*)
3.25
5(60.6)
ASC
_IWW_D
54.32
3(5.3)
−1.55
3(−46
.4)
−3.72
5(−42
.5)
−7.66
9(−24
.4)
0(*)
−1.05
8(−34
.3)
ASC
_IWW_I5
−6.12
6(−3.5)
−5.34
5(−26
.7)
−0.87
86(−2.2)
−15
.27(−15
.7)
0(*)
4.27
1(84.6)
InternRail
0.22
85(1.7)
0.13
95(4.2)
0.46
18(16.8)
−1.42
9(−21
.7)
−0.58
41(−3.7)
−0.33
24(−17
.2)
InternIW
W−2.83
6(−5.3)
0(*)
−0.16
30(−4.1)
−1.74
7(−13
.1)
−5.57
1(−3.6)
−0.79
09(−40
.7)
Harbo
rRail
−2.50
7(−5.2)
0.88
48(27.9)
1.51
6(31.9)
0.85
22(19.5)
0.82
82(3.7)
0(*)
cc_R
oad
−0.12
20(−5.3)
−0.02
492(−29
.6)
−0.04
757(−29
.9)
−0.09
695(−24
.6)
−0.07
789(−3.7)
−0.01
900(−34
.6)
cc_R
ail
−0.10
33(−5.1)
−0.01
958(−16
.7)
−0.03
777(−20
.4)
−0.10
73(−23
.0)
−0.12
47(−3.7)
−0.03
124(−33
.1)
cc_IWW_D
−1.96
0(−5.3)
−0.42
38(−59
.4)
−0.26
38(−25
.3)
−0.37
79(−23
.6)
−0.04
960(−2.2)
−0.29
32(−38
.1)
cc_IWW_I
−4.21
3(−5.3)
−0.60
24(−20
.7)
−1.13
3(−14
.4)
−0.50
89(−6.0)
0(*)
−0.82
11(−91
.6)
Theta_IWW_I
0.27
70(5.3)
1.00
0(*)
1.00
0(*)
1.00
0(*)
1.00
0(*)
1.00
0(*)
Theta_IWW_D
0.73
81(68.3)
0.50
82(79.2)
0.80
11(35.5)
0.40
52(24.8)
0.61
53(3.8)
1.00
0(*)
Theta_R
ail
1.00
0(*)
1.00
0(*)
1.00
0(*)
1.00
0(*)
1.00
0(*)
1.00
0(*)
(con
tinued)
14 S. Grebe et al.

Tab
le1.5
(con
tinued)
Observatio
nsNST
13.F12
NST
14.F12
NST
16.F12
NST
17.F12
NST
19.F12
Finallog(L)
VrachtM
odel
VrachtM
odel
VrachtM
odel
VrachtM
odel
VrachtM
odel
D.O.F.
TRUE
TRUE
TRUE
TRUE
TRUE
Observatio
nsNST
13.F12
NST
14.F12
NST
16.F12
NST
17.F12
NST
19.F12
Finallog(L)
VrachtM
odel
VrachtM
odel
VrachtM
odel
VrachtM
odel
VrachtM
odel
D.O.F.
TRUE
TRUE
TRUE
TRUE
TRUE
Rho
2 (0)
1539
1423
8610
1751
0717
4826
1896
94
Rho
2 (c)
−47
506.3
−14
9214
.4−12
2599
.9−60
910.3
−93
221.3
Estim
ated
719
177
16
Scaling
0.67
10.66
0.61
90.65
50.73
7
ASC
_Road
0.14
0.08
80.16
80.10
70.13
ASC
_Rail1
14-Jan-15
14-Jan-15
14-Jan-15
14-Jan-15
14-Jan-15
ASC
_Rail2
11
11
1
ASC
_Rail3
0(*)
0(*)
0(*)
0(*)
0(*)
ASC
_IWW_D
1−0.85
34(−36
.0)
−7.18
1(−50
.8)
−5.57
0(−35
.7)
−1.36
0(−67
.8)
−1.31
4(−74
.0)
ASC
_IWW_I1
−2.45
5(−11
7.8
−8.94
1(−51
.4)
−8.71
1(−38
.3)
−2.56
5(−13
6.1
−2.57
2(−15
5.6)
ASC
_IWW_D
2−3.56
8(−99
.1)
−12
.21(−50
.7)
−12
.94(−37
.8)
−3.76
5(−11
6.9
−3.73
3(−13
1.4)
ASC
_IWW_I2
0(*)
0(*)
0(*)
0(*)
0(*)
ASC
_IWW_D
30(*)
0(*)
0(*)
0(*)
0(*)
ASC
_IWW_I3
0(*)
−6.13
8(−60
.2)
−2.94
8(−25
.9)
0(*)
−3.15
1(−46
.2)
ASC
_IWW_D
40(*)
−14
.55(−18
.7)
0(*)
0(*)
0(*)
ASC
_IWW_I4
0(*)
−3.91
5(−47
.6)
−0.67
39(−8.0)
0(*)
−1.64
9(−36
.1)
ASC
_IWW_D
50(*)
−3.33
0(−16
.7)
5.43
6(22.5)
0(*)
−2.09
5(−7.9)
ASC
_IWW_I5
0(*)
−3.88
5(−47
.4)
−2.90
7(−30
.5)
0(*)
−1.54
0(−30
.8)
InternRail
0(*)
−6.42
8(−25
.7)
8.06
8(30.0)
0(*)
0(*)
(con
tinued)
1 Redeveloping the Strategic Flemish Freight Transport Model 15