harris county hurricane harvey damage assessment
TRANSCRIPT
HARRIS COUNTY Hurricane Harvey Damage Assessment Date, 2018
FINALMay 2018

1
Table of Contents
Section 1 Introduction ................................................................................................................................................ 1-3
Hurricane Harvey’s Toll on Harris County .............................................................................................................. 1-3 Scope and Purpose.......................................................................................................................................................... 1-12 Data Collection ................................................................................................................................................................. 1-13
A. Housing .......................................................................................................................................................... 1-13 1. FEMA ........................................................................................................................................................ 1-13 2. Local ......................................................................................................................................................... 1-13 3. 2-1-1 ......................................................................................................................................................... 1-13 4. Insurance ............................................................................................................................................... 1-14 5. Small Business Assistance (SBA) Disaster Home Loans ................................................... 1-14 6. Flood Control District’s Buyouts ................................................................................................. 1-14 7. Fair Housing ......................................................................................................................................... 1-14
B. Non – Housing ............................................................................................................................................ 1-14 1. Infrastructure ....................................................................................................................................... 1-15 2. School Districts .................................................................................................................................... 1-15 3. Economic Losses ................................................................................................................................. 1-15
C. Citizen Participation ................................................................................................................................ 1-15 1. Disaster Recovery Community Meetings ................................................................................. 1-15 2. Fair Housing Plan and Meetings .................................................................................................. 1-18
Section 2 Housing ....................................................................................................................................................... 2-19
Owners 2-23 A. Market for Owner-Occupied Housing .............................................................................................. 2-23 B. FEMA .............................................................................................................................................................. 2-26 C. SBA .................................................................................................................................................................. 2-29 D. Insurance ...................................................................................................................................................... 2-30 B. FEMA .............................................................................................................................................................. 2-38 C. Residential Buyout ................................................................................................................................... 2-34
Vulnerable Populations ............................................................................................................................................ 2-46 A. Low-to-Moderate Income (LMI)......................................................................................................... 2-51 B. Limited English-Proficiency LEP ........................................................................................................ 2-52 C. Minority Concentration .......................................................................................................................... 2-53 D. Seniors ........................................................................................................................................................... 2-54 E. Access and functional needs (AFN)................................................................................................... 2-55 F. Homeless ....................................................................................................................................................... 2-56
Unmet Need ...................................................................................................................................................................... 2-46 A. Owner ............................................................................................................................................................. 2-47 B. Renter ............................................................................................................................................................. 2-49 C. Other ............................................................................................................................................................... 2-50
Section 3 Non-Housing Infrastructure ......................................................................................................... 3-59
1. Governor’s Commission to Rebuild Texas ..................................................................................... 3-59 2. Texas Coastal Resiliency Study ........................................................................................................... 3-60 3. FEMA Public Assistance ......................................................................................................................... 3-60 4. Drainage and Water Control ............................................................................................................... 3-62 5. Commercial Buyout.................................................................................................................................. 3-66 6. Public Facilities .......................................................................................................................................... 3-68

2
7. Roadways ..................................................................................................................................................... 3-69 8. Utilities........................................................................................................................................................... 3-69 9. Hazard and Mitigation: Resiliency Solutions and Mitigation Needs .................................. 3-70 10. Response to U.S. Army Corps of Engineers Recovery Work Plan ........................................ 3-71
Section 4 Educational Institutions ................................................................................................................ 4-72
1. Unincorporated Harris County ........................................................................................................... 4-72 2. Total Educational Facility Unmet Needs ........................................................................................ 4-74
Section 5 Economic Losses .............................................................................................................................. 5-75
3
Section 1 Introduction
Harris County is located in the southeastern part of the state near
Galveston Bay. It has a population estimated at 4.7 million residents
as of December 31, 2016 and continues to be the third largest county
in population. Harris County is one of the fastest growing counties
with a 67 percent growth rate since 1990 and over 80 percent of the
growth is in the unincorporated area which represents 43 percent of
the total population.
In the last 20 years, multiple devastating flood events have occurred, including Tropical Storm Allison in 2001, Hurricane Ike in 2008, the Memorial Day Flood of 2015, the Tax Day Flood of 2016, and most recently Hurricane Harvey. As Harris County residents have recovered from each of these disasters, it is clear that flooding is and will always be a threat to the region. While Harris County cannot control flooding events, the region can work together to prepare for future flooding events. The purpose of this document is to demonstrate the damages and unmet needs as a result of Hurricane Harvey for unincorporated Harris County and the 33 cities outside the City of Houston.
Hurricane Harvey’s Toll on Harris County
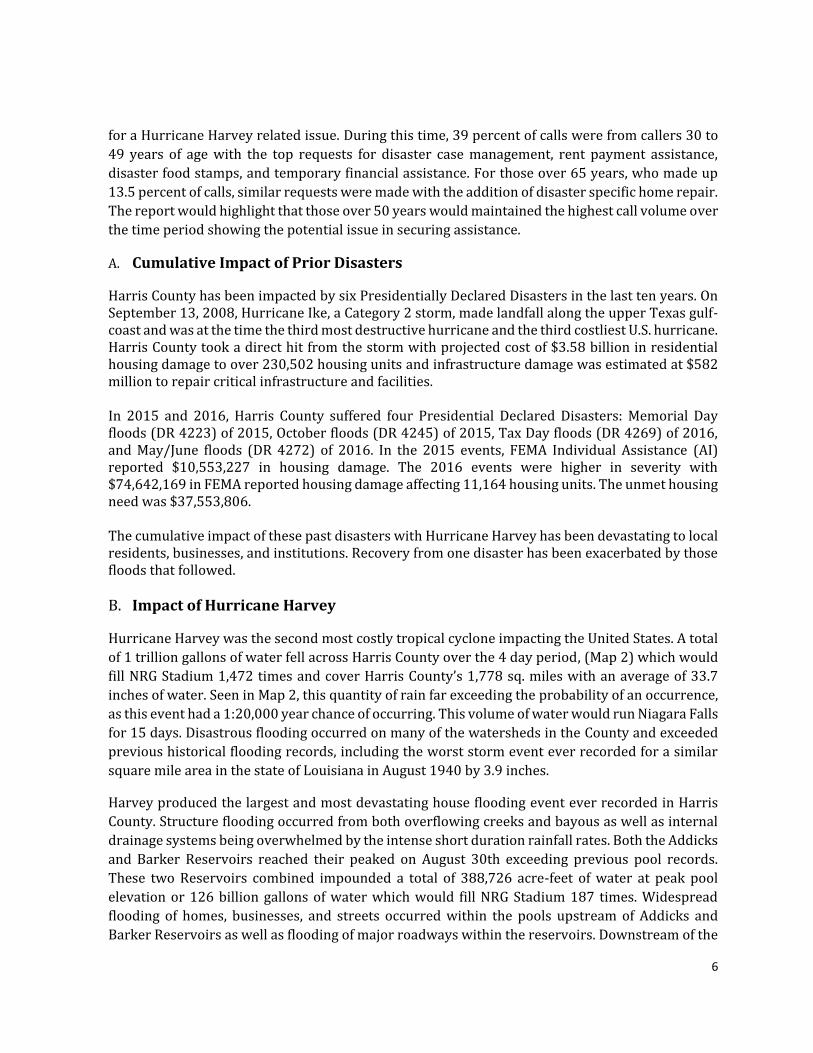
Hurricane Harvey quickly formed into a tropical depression on August 23rd and in just 56 hours, it grew from a tropical depression over the Gulf of Mexico into a Category 4 hurricane as it made landfall near the Texas Gulf Coast late on August 25th. Harvey threatened millions of residents with 130 mph winds, heavy rains, and a massive storm surge that swamped coastal areas. It stalled around southern Texas for days as a weakening hurricane, producing catastrophic flash and river flooding. Over the course of the next four days it would bounce along the Texas coastline (Map 1) causing massive flooding and wind damage to several counties. As Hurricane Harvey moved along the coast, large quantities of rain fell in Harris County. Although the Hurricane’s eye did not make landfall in Harris County, the constant repetition of rain bands made their impact.
By August 27th, the slow moving storm dumped a total of 1 trillion gallons of rain across Harris County over a 4-day period. This amount of water would cover Harris County’s 1,778 square miles with an average of 33 inches of water, according to the Harris County Flood Control District (HCFCD).
By August 28th the U.S. Army Corps of Engineers began controlled water releases from Addicks and Barker Reservoirs in the Buffalo Bayou watershed in an attempt to manage flood
HURRICANE HARVEY
RAINFALL DATA
Category 4 Hurricane - Struck Texas coast three times beginning August 25th, 2017
Maximum diameter of 280 miles
Up to 130mph winds
Received 50+ inches of rain
Hurricane Harvey broke the record for the most rainfall in any tropical system
Approximately 27 trillion gallons of water in Harris County
Weight of 27 trillion gals of water = 300 million tons
Estimated weight of water compressed the land by 1 inch
Estimated 25-30 percent of Harris County was underwater
Approximately 8 million cubic yards of garbage – soggy drywall, flooring, furniture, clothing etc.

4
levels in the immediate area. Despite attempts to alleviate the water rise, the Addicks Reservoir reached capacity on August 29th, spilling out water into homes across several square miles. Harvey made its third and final landfall on August 30th near Port Arthur, Texas and Cameron, Louisiana, continuing to bring widespread catastrophic flooding.
The Harris County Flood Control District (HCFCD) estimated 70 percent of Harris County was flooded by at least 1.5 feet of water, with an estimated 154,170 flooded structures in the county alone. More than 50 inches of rain had fallen over parts of the area, the equivalent of a normal year’s rainfall for the area in one week and inundating homes and requiring rescue attempts for thousands of stranded people. The Houston Police Department rescued more than 3,000 people from flooded neighborhoods. Thirty-six flood related deaths were reported in Harris County during and immediately after the storm.
While authorities and first responders handled as many as 10,000 rescue missions around the
Houston area, at least 30,000 people fled to temporary shelters. Almost 8,000 people fled to the George R. Brown Convention Center, where 1,700 received medical treatment. Another 7,500 people fled to NRG Park and other shelters around the county. FEMA moved 14,900 people into temporary housing and reported that 8,000 families had moved into over 9,000 hotel rooms.
Almost immediately the call for needed resources from those affected was heard. Between August 25 and September 30, 2017, the 2-1-1 system operated by the United Way, Houston received approximately 100,000 calls. The call summaries below shows the top ten calls received pre-Harvey and during Harvey (August 25–September 30). The top call before Hurricane Harvey was in reference to Medicaid applications, while the top calls received during and after Hurricane Harvey were for disaster food stamps and assistance.
Map 1: Graphic Overview of Hurricane Harvey’s Track

5
Figure 1: Top 10 2-1-1 Calls Pre-Harvey
Figure 2: Top 10 2-1-1 Calls Aug. 25 to Sept. 30, 2017
Based on a Rice Kinder Institute for Urban Research report, Hurricane Harvey Relief Fund Needs
Assessment Phase Two, almost 90,000 calls were placed to the 211 system between October 15,
2017 and November 30, 2017. Approximately one-third of those calls were requests for assistance
41,756
39,808
16,549
14,603
5,794
4,881
3,330
1,986
1,921
1,748
MEDICAID APPLICATIONS
FOOD STAMPS/SNAP APPLICATIONS
ELECTRIC SERVICE PAYMENT ASSISTANCE
RENT PAYMENT ASSISTANCE
FOOD PANTRIES
MEDICARE SAVINGS PROGRAMS
CHIP PROGRAMS
CHILD CARE EXPENSE ASSISTANCE
HOUSING SEARCH ASSISTANCE
HOUSING AUTHORITIES
Top 10 2-1-1 Calls Pre Harvey
12,262
8,241
7,012
6,718
5,004
4,609
3,708
3,504
1,826
757
DISASTER FOOD STAMPS
FOOD PANTRIES
FOOD STAMPS/SNAP APPLICATIONS
ELECTRIC SERVICE PAYMENT ASSISTANCE
RENT PAYMENT ASSISTANCE
FEMA DISASTER ASSISTANCE ONLINE/TELE-…
DISASTER UNEMPLOYMENT ASSISTANCE
MASS CARE SHELTERS
UNDESIGNATED TEMPORARY FINANCIAL ASSISTANCE
311 SERVICES
Top 10 2-1-1 Calls Aug 25-Sept 30, 2017
6
for a Hurricane Harvey related issue. During this time, 39 percent of calls were from callers 30 to
49 years of age with the top requests for disaster case management, rent payment assistance,
disaster food stamps, and temporary financial assistance. For those over 65 years, who made up
13.5 percent of calls, similar requests were made with the addition of disaster specific home repair.
The report would highlight that those over 50 years would maintained the highest call volume over
the time period showing the potential issue in securing assistance.
A. Cumulative Impact of Prior Disasters
Harris County has been impacted by six Presidentially Declared Disasters in the last ten years. On September 13, 2008, Hurricane Ike, a Category 2 storm, made landfall along the upper Texas gulf-coast and was at the time the third most destructive hurricane and the third costliest U.S. hurricane. Harris County took a direct hit from the storm with projected cost of $3.58 billion in residential housing damage to over 230,502 housing units and infrastructure damage was estimated at $582 million to repair critical infrastructure and facilities. In 2015 and 2016, Harris County suffered four Presidential Declared Disasters: Memorial Day floods (DR 4223) of 2015, October floods (DR 4245) of 2015, Tax Day floods (DR 4269) of 2016, and May/June floods (DR 4272) of 2016. In the 2015 events, FEMA Individual Assistance (AI) reported $10,553,227 in housing damage. The 2016 events were higher in severity with $74,642,169 in FEMA reported housing damage affecting 11,164 housing units. The unmet housing need was $37,553,806. The cumulative impact of these past disasters with Hurricane Harvey has been devastating to local residents, businesses, and institutions. Recovery from one disaster has been exacerbated by those floods that followed.
B. Impact of Hurricane Harvey
Hurricane Harvey was the second most costly tropical cyclone impacting the United States. A total
of 1 trillion gallons of water fell across Harris County over the 4 day period, (Map 2) which would
fill NRG Stadium 1,472 times and cover Harris County’s 1,778 sq. miles with an average of 33.7
inches of water. Seen in Map 2, this quantity of rain far exceeding the probability of an occurrence,
as this event had a 1:20,000 year chance of occurring. This volume of water would run Niagara Falls
for 15 days. Disastrous flooding occurred on many of the watersheds in the County and exceeded
previous historical flooding records, including the worst storm event ever recorded for a similar
square mile area in the state of Louisiana in August 1940 by 3.9 inches.
Harvey produced the largest and most devastating house flooding event ever recorded in Harris
County. Structure flooding occurred from both overflowing creeks and bayous as well as internal
drainage systems being overwhelmed by the intense short duration rainfall rates. Both the Addicks
and Barker Reservoirs reached their peaked on August 30th exceeding previous pool records.
These two Reservoirs combined impounded a total of 388,726 acre-feet of water at peak pool
elevation or 126 billion gallons of water which would fill NRG Stadium 187 times. Widespread
flooding of homes, businesses, and streets occurred within the pools upstream of Addicks and
Barker Reservoirs as well as flooding of major roadways within the reservoirs. Downstream of the
7
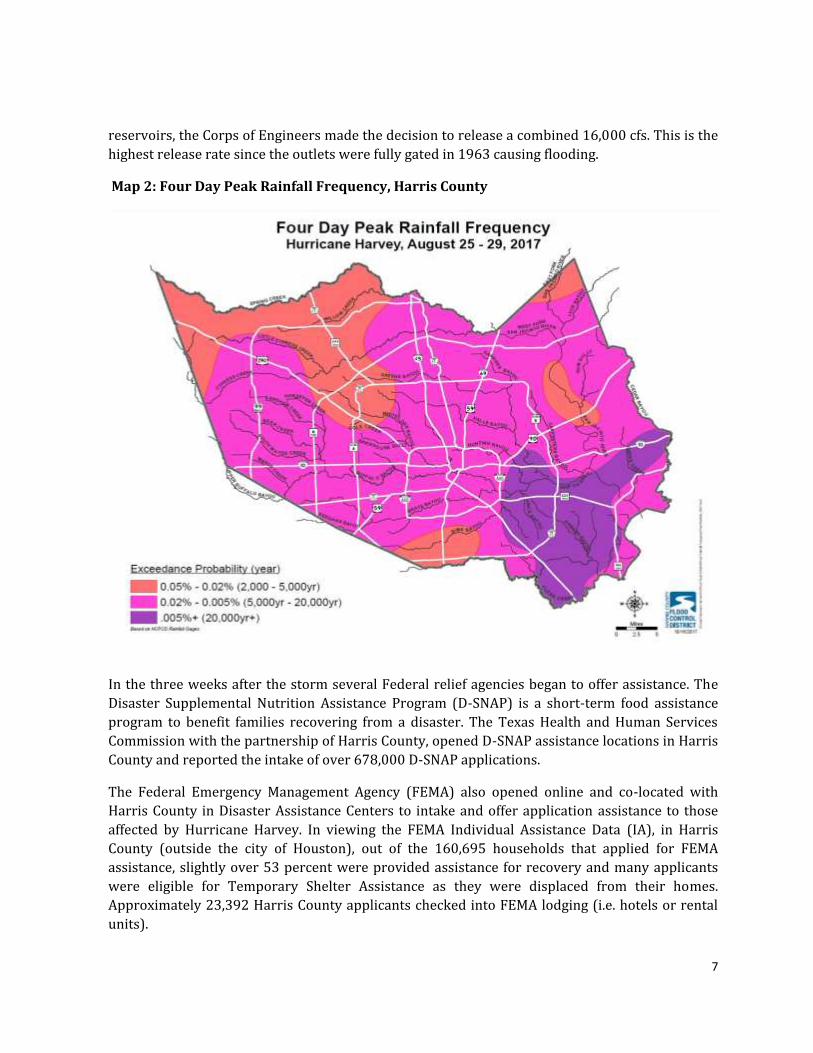
reservoirs, the Corps of Engineers made the decision to release a combined 16,000 cfs. This is the
highest release rate since the outlets were fully gated in 1963 causing flooding.
Map 2: Four Day Peak Rainfall Frequency, Harris County
In the three weeks after the storm several Federal relief agencies began to offer assistance. The
Disaster Supplemental Nutrition Assistance Program (D-SNAP) is a short-term food assistance
program to benefit families recovering from a disaster. The Texas Health and Human Services
Commission with the partnership of Harris County, opened D-SNAP assistance locations in Harris
County and reported the intake of over 678,000 D-SNAP applications.
The Federal Emergency Management Agency (FEMA) also opened online and co-located with
Harris County in Disaster Assistance Centers to intake and offer application assistance to those
affected by Hurricane Harvey. In viewing the FEMA Individual Assistance Data (IA), in Harris
County (outside the city of Houston), out of the 160,695 households that applied for FEMA
assistance, slightly over 53 percent were provided assistance for recovery and many applicants
were eligible for Temporary Shelter Assistance as they were displaced from their homes.
Approximately 23,392 Harris County applicants checked into FEMA lodging (i.e. hotels or rental
units).

8
C. Demographic Profile of Harris County
The demographic profile was generated using data sets from the U.S. Census Bureau and HUD. Harris County continues to be the third largest county in terms of population and one of the fastest growing counties with 63 percent growth since 1990. Of the 4,434,257 million residents, 2,148,717 live in the City of Houston and 2,285,540 persons live in Harris County’s unincorporated areas and 33 small cities (Table 1) (US Census, 2016 ACS). This area is also the focus of the Harris County recovery effort and is called the Harris County Disaster Recovery (DR) Service Area. For vulnerable population, such as seniors, youth, and persons with a disability, these groups gave a comparable percent to the Texas as a whole (Table 1). The DR service area’s population by race/ethnicity, as seen in Figure 3, shows Hispanics as the largest population group followed by Whites. Over 16 percent of the service area are persons with a limited English proficiency compared to the county as a whole at 9.7 percent. The minority concentration is 63.6 percent for the DR service area compared to the county as a whole at 68.8 percent. The Harris County DR Service Area contains 49 percent (750,461) of the county’s 1,536,259 occupied housing units. Of the service area’s housing units, 63.8 percent (478,794) are owner-occupied. The median value of owner-occupied housing units is $145,600 compared to $142,700 in the state of Texas (US Census, ACS 2012-2016). However, a recent Kinder Institute study places the median value at $160,000 for the county. Renter-occupied housing represents 36.2 percent (271,667) of the service area’ housing units with median gross rent of $937, Pre-Harvey (U.S. Census, 2012-2016 ACS). The median household income is $55,584 compared to $54,727 for the state of Texas. Over twelve percent of residents live in poverty in the Harris County DR Service Area.
36.4%
15.2%6.4%
40.0%
1.9%
White Black Asian Hispanic Other
Figure 3: Harris County Disaster Recovery (DR)
Service Area by Race/Ethnicity

9
Table 1: 2016 Demographic Statistics for Harris County (outside the city of Houston) from
the U.S. Census Bureau
Texas
Harris County DR
SERVICE AREA
Fact Estimates Estimates Percent
Population estimates, 2016 27,862,596 2,285,540 8.20%
Population, percent change - April 1, 2010,
(estimates base) to July 1, 2016 10.80% 12.10%*
Persons under 5 years, percent, 2016 7.20% 175,548 7.68%
Persons under 18 years, percent, 2016 26.20% 655,146 28.66%
Persons 65 years and over, percent, 2016 12.00% 213,624 9.35%
White alone, percent, 2016 79.40% 1,562,157 68.35%
Black or African American alone, percent, 2016 12.60% 346,959 15.18%
American Indian and Alaska Native alone, percent,
2016 1.00% 4,265 0.19%
Asian alone, percent, 2016 4.80% 145,033 6.35%
Native Hawaiian and Other Pacific Islander alone,
percent, 2016 0.10% 2,272 0.10%
Two or More Races, percent, 2016 1.90% 37,000 1.62%
Hispanic or Latino, percent, 2016 39.10% 913,743 39.98%
White alone, not Hispanic or Latino, percent, 2016 42.60% 832,131 36.41%
Housing units, 2016 10,753,629 787,507
Owner-occupied housing unit, 2012-2016 61.90% 478,794 63.80%
Renter-occupied housing units, 2012-2016 38.10% 271,667 36.2%
Median value of owner-occupied housing units,
2012-2016 $142,700 $145,600*
Median gross rent, 2012-2016 $911 $937
With a disability, under age 65 years, percent,
2012-2016 8.10% 128,052 5.6%
Median household income (in 2016 dollars), 2012-
2016 $54,727 $55,584*
Persons in poverty, percent, 2012-2016 15.60% 12.87%
Land area in square miles, 2010 261,231.71 1,103.89 0.42%
Minority Concentration, 2016 57.4% 1,453,375 63.6%
*Figure only available for all of Harris County.
10
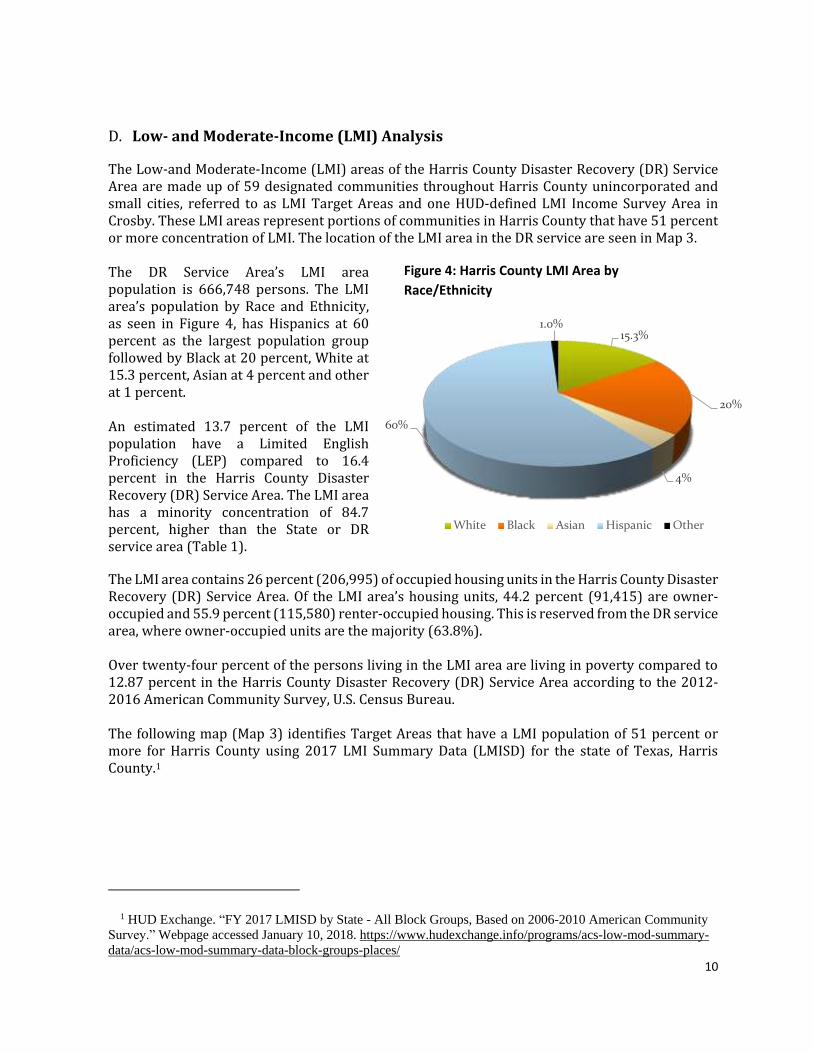
D. Low- and Moderate-Income (LMI) Analysis
The Low-and Moderate-Income (LMI) areas of the Harris County Disaster Recovery (DR) Service Area are made up of 59 designated communities throughout Harris County unincorporated and small cities, referred to as LMI Target Areas and one HUD-defined LMI Income Survey Area in Crosby. These LMI areas represent portions of communities in Harris County that have 51 percent or more concentration of LMI. The location of the LMI area in the DR service are seen in Map 3. The DR Service Area’s LMI area population is 666,748 persons. The LMI area’s population by Race and Ethnicity, as seen in Figure 4, has Hispanics at 60 percent as the largest population group followed by Black at 20 percent, White at 15.3 percent, Asian at 4 percent and other at 1 percent. An estimated 13.7 percent of the LMI population have a Limited English Proficiency (LEP) compared to 16.4 percent in the Harris County Disaster Recovery (DR) Service Area. The LMI area has a minority concentration of 84.7 percent, higher than the State or DR service area (Table 1).
The LMI area contains 26 percent (206,995) of occupied housing units in the Harris County Disaster Recovery (DR) Service Area. Of the LMI area’s housing units, 44.2 percent (91,415) are owner-occupied and 55.9 percent (115,580) renter-occupied housing. This is reserved from the DR service area, where owner-occupied units are the majority (63.8%). Over twenty-four percent of the persons living in the LMI area are living in poverty compared to 12.87 percent in the Harris County Disaster Recovery (DR) Service Area according to the 2012-2016 American Community Survey, U.S. Census Bureau. The following map (Map 3) identifies Target Areas that have a LMI population of 51 percent or more for Harris County using 2017 LMI Summary Data (LMISD) for the state of Texas, Harris County.1
1 HUD Exchange. “FY 2017 LMISD by State - All Block Groups, Based on 2006-2010 American Community
Survey.” Webpage accessed January 10, 2018. https://www.hudexchange.info/programs/acs-low-mod-summary-
data/acs-low-mod-summary-data-block-groups-places/
15.3%
20%
4%
60%
1.0%
White Black Asian Hispanic Other
Figure 4: Harris County LMI Area by
Race/Ethnicity

11
Map 3: Harris County Low- to Moderate-Income Area Map
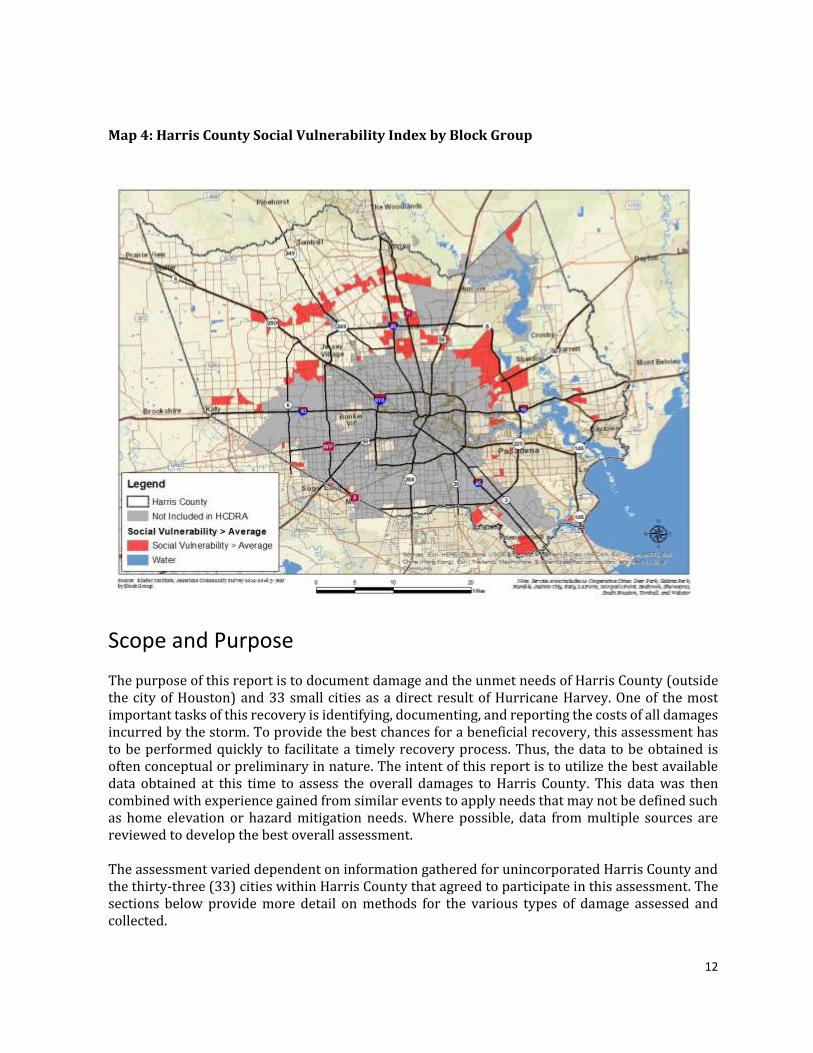
E. Social Vulnerability Index (SoVI)
An additional component to consider when looking at unmet needs is what level of social
vulnerability to natural hazards and the area is experiencing. This index looks at socioeconomic
variables that contribute to the reduction in a community’s ability to prepare, respond and recover
from hazards. Additional factors used in SoVI are special needs populations, persons who are
completely dependent on social services for survival, education, family structure, occupation and
other demographic characteristics that help define social vulnerability for communities and
individuals.
As seen in Map 4, SoVI is measured by block groups in Harris County — in particular, their
vulnerability to environmental hazards. With the assistance of the Rice University Kinder Institute,
Harris County’s block groups were examined based on socioeconomic variables, which contribute
to reduction in a community’s ability to prepare for, respond to, and recover from hazards. Map 4
shows those block groups with the highest vulnerability which are identified in red and there are
a total of 11,383 damaged units in the social vulnerability areas.
12
Map 4: Harris County Social Vulnerability Index by Block Group
Scope and Purpose The purpose of this report is to document damage and the unmet needs of Harris County (outside the city of Houston) and 33 small cities as a direct result of Hurricane Harvey. One of the most important tasks of this recovery is identifying, documenting, and reporting the costs of all damages incurred by the storm. To provide the best chances for a beneficial recovery, this assessment has to be performed quickly to facilitate a timely recovery process. Thus, the data to be obtained is often conceptual or preliminary in nature. The intent of this report is to utilize the best available data obtained at this time to assess the overall damages to Harris County. This data was then combined with experience gained from similar events to apply needs that may not be defined such as home elevation or hazard mitigation needs. Where possible, data from multiple sources are reviewed to develop the best overall assessment. The assessment varied dependent on information gathered for unincorporated Harris County and the thirty-three (33) cities within Harris County that agreed to participate in this assessment. The sections below provide more detail on methods for the various types of damage assessed and collected.
13
Data Collection Data was collected from FEMA, Harris County Community Services Department (HCCSD), Harris County Engineering Department (HCED), Harris County Flood Control District (HCFC), U.S. Army Corps of Engineers USACE), Harris County Appraisal District (HCAD), Harris County Public Health (HCPH) and other agencies servicing Harris County. The data was analyzed to find trends, areas of vulnerability, and determine the unmet needs for Harris County.
A. Housing Housing impacts from Hurricane Harvey were primarily assessed in following categories:
1. FEMA Individual Assistance (IA) is provided by FEMA to individuals and families who have sustained losses due to a federally declared disasters. IA data is collected by FEMA for individual and families who sustained losses due to Hurricane Harvey. Homeowners, renters and business owners who sustained damage to their homes, vehicles, personal property, businesses or inventory may apply for disaster assistance. Assistance from FEMA in the form of grants help pay for temporary housing, emergency home repairs, uninsured and underinsured personal property losses and medical, dental and funeral expenses caused by the disaster. The State of Texas has provide IA assistance claims data for the county. IA claims available from FEMA were reviewed to establish several primary impacts from Hurricane Harvey, which included the number of residents impacted based upon claims filed, the number of residents not assisted by FEMA through unmet claims, and a general assessment of impacts to owners and renters. A review of this data was provided to assess the number of claims filed. The data was used as a basis for estimating the number of units that were displaced by Hurricane Harvey and required temporary rental assistance and other needs. Replacement of these units in areas not prone to flooding was then considered an unmet need. Residents had until November 24, 2017 to register with FEMA to receive disaster assistance.
2. Local Several sources of information were utilized to obtain data on existing damages to housing within unincorporated Harris County and the thirty-three (33) cities outside the City of Houston. Data was collected from several local sources including the Harris County Appraisal District (HCAD), Harris County Engineering Department (HCED), Harris County Public Health, and Harris County Flood Control (HCFCD). These departments collected information on damaged parcels, flood levels and estimated damages for impacted properties.
3. 2-1-1 The United Way of Greater Houston serves as Harris County’s 2-1-1 program administrator. The 2-1-1 system helped Harris County residents connect with local health and human services and disaster resources programs by phone or internet. 2-1-1 is a free, anonymous, social service hotline available 24-hours a day, 7 days a week, 365 days a year. State and local health and human services programs address housing/shelter, employment, food/nutrition, veterans, crisis/emergency, income/expenses, legal aid/victims, criminal justice, aging/disability, health/medical, mental health, child care/education, and issues local residents are experiencing.

14
4. Insurance The Texas Department of Insurance (TDI) collected data from insurance companies on the financial impact of Hurricane Harvey and the monitoring of claims handling. Data collected included number of reported claims, paid claims, claim closed without payment, claims reopened, claims with total losses, total amount paid losses, and total amount of claim reserved. Data was collected from insurance companies that included the Texas Windstorm Insurance Association (TWIA) and the National Flood Insurance Program (NFIP).
5. Small Business Assistance (SBA) Disaster Home Loans Another resource for homeowners that sustained damage from Hurricane Harvey is the Small Business Administration’s (SBA) disaster loans. These loans are the basic form of federal disaster assistance for homeowners whose private property sustained damage that is not fully covered by insurance. Homeowners and renters whose property was damaged by a declared disaster were able to apply for an SBA low-interest loan. Interest rates on these loans are determined by law and are assigned on a case by case basis.
6. Flood Control District’s Buyouts The Harris County Flood Control District (HCFCD) has operated the Harris County Residential Buyout Program since 1985 and acquired and removed approximately 3,000 houses that are hopelessly deep in the floodplain. Homes that were selected for buyout are where flood damage reduction projects, like channel improvements or storm water detention basins, are not cost effective and or beneficial. Once bought out, these parcels are returned to their beneficial function aiding in the storage of floodwaters. Those homeowners who are bought out are assisted to move to an area with a reduced flood risk. This assessment reviews the need for residential buyout to reduce future risk.
7. Fair Housing Data was collected through the community engagement process designed for the Fair Housing Analysis of Impediments Plan (AI) and focused on creating opportunities to participate in whatever format residents preferred, from a survey available online or in a postage-paid mail format, pop-up events where study teams engaged residents attending community events, open house public meetings and focus groups. The comprehensive resident survey included nine questions about the effects of Hurricane Harvey on housing and was available in English, Spanish and Vietnamese. The community participation process provided multiple opportunities in various formats for residents and stakeholders to share their experience and opinions about fair housing choice and access to opportunity in the region.
B. Non – Housing Non-housing impacts for Hurricane Harvey were primarily assessed in three (3) categories: public infrastructure including roads and bridges, water/wastewater, storm water/flood control and debris; impacts to public educational facilities primarily consisting of school buildings; and economic impacts to commercial businesses. The data collection methods for these three (3) categories are described further below.

15
1. Infrastructure For Harris County infrastructure facilities, a detailed assessment of potential damages was provided by the Harris County Engineering Department. An additional assessment was provided by the Harris County Flood Control District (HCFCD), which established debris costs and damages to their storm water/flood control infrastructure. Based upon this assessment a detailed listing of damaged infrastructure and estimated costs was established. These infrastructure projects were also separated by major category and those eligible for FEMA public assistance were submitted to the Texas Division of Emergency Management (TDEM) and then by TDEM to FEMA for approval. Many of these projects required a 10 to 25 percent match from the county. For the local cities, several available methods for determining infrastructure damages were utilized. If available, detailed damage assessments including descriptions of the infrastructure and damage estimates were utilized. For most locations, projects submitted to TDEM/FEMA as the City’s official list of damaged infrastructure was utilized. These lists included the type of infrastructure, a description of damages, and estimated costs. The county also obtained a report from the State of Texas with all submitted projects for FEMA public assistance as of January 2018.
2. School Districts Data was also collected for estimated unmet needs for public school districts within unincorporated Harris County. All data for the schools/school district were obtained from TDEM/FEMA Damage Inventories. The methodology to assess unmet needs was identical to that provided for public infrastructure.
3. Economic Losses Data was collected on economic losses to commercial businesses. The SBA collected data on the number and amount of loans obtained by commercial businesses. Since this data indicated loans to be repaid by the commercial businesses, the complete value of the loans principal and interest was considered in determining the economic impact. Estimates were also made to assess damages for approximately 400 additional commercial properties identified as substantially impacted.
C. Citizen Participation Data was collected for citizen participation through various citizen engagement activities. The goals for community engagement were to engage the public, especially vulnerable populations such as low-income and persons with a disability; housing and civil rights advocates; local community leaders; non-profits; business owners; and other area stakeholders. Harris County provided several methods of engagement that included community meetings, surveys, small focus group meetings, social media, canvasing, and direct mail.
1. Disaster Recovery Community Meetings As a part of its disaster recovery planning and to fulfill the requirement for citizen participation under the CDBG-DR funding, Harris County conducted a series of community meetings. These meetings solicited information from county residents about Hurricane Harvey recovery needs for their families and the community at large. Topics focused on housing and infrastructure needs, fair housing concerns/barriers, general community planning, and discussed possible recovery programs under the CDBG-DR program.
16
Harris County Community Services Department (HCCSD) undertook the planning and facilitation of a series of community meetings held between May 30th to June 23, 2018 to solicit community input on Hurricane Harvey recovery needs and barriers to fair housing. These meetings were held throughout Harris County (outside of the City of Houston, particularly in low- to moderate-income (LMI) and/or minority concentrated communities. HCCSD used diverse methods to market and encourage residents to attend meetings. These methods included creating a recovery blog and website; a Hurricane Harvey Impact Survey in English and Spanish; sending press releases to media; posting the meeting flyer on social media, door to door canvasing, direct emails, calls and texts to residents, sending event flyers through school districts websites and emails to parents; emails to local non-profits; and direct mail. HCCSD also collaborated with BakerRipley and Texas Organizing Project (TOP) to provide outreach to their communities and clients. As a result, close to 1,000 residents attended the community meetings, 591 residents completed the six question Impact Survey and provided input on Hurricane Harvey recovery needs, future program goals, and strategies for funding. In addition, HCCSD created “Meeting in a Box (MIB)” which is a toolkit to help facilitate conversations with our partners and solicit input on Hurricane Harvey Disaster Recovery needs, long term goals, and strategies for funding. Two organizations facilitated meetings using the MIB. HCCSD staff facilitated all meetings in coordination with our Harris County Precincts. Outreach materials were translated to Spanish and the outreach flyer was translated to Spanish and Vietnamese. Meetings were held in English and Spanish and sign language interpreters were present at each meeting. Residents were also able to obtain resources and information from FEMA, Long Star Legal Aide, Harris County Housing and Community Resource Center, and Harris County Precincts to assist in their recovery needs. There were 14 community meetings held throughout Harris County (outside the City of Houston) particularly in low-to-moderate income neighborhoods. At each community meeting, residents were invited to participate in interactive stations set-up as a dot exercise, participants were given 3 dots per station and asked to vote on their top priorities for disaster recovery related to Housing, General Community Planning, Infrastructure Needs, and Fair Housing Concerns/Barriers. These dot exercises were conducted in English and Spanish as seen in Figure 5. There were many issues/concerns that were discussed at the community meetings. However, it did not matter what part of the county you lived in, the issues and concerns were generally consistent across the board. After tabulating the dot priority results of the meetings, the number one issue/concern was residents felt that drainage improvements needed to be made in their neighborhoods to reduce the chance of flooding from future events followed by improving and/or expanding the ditches and culverts in their neighborhoods to reduce flooding, and elevation of repetitively flooded homes in the floodplain as see in Figure 5.

17
Figure 5: Community Meeting Top Issues and Concerns
Residents were also asked to complete a six question Hurricane Harvey Impact Survey. The survey
was available in English and Spanish. HCCSD received 591 completed surveys from residents all
over Harris County. Based on the survey, residents in Harris County felt that drainage
improvements to prevent flooding during heavy rains was a top priority, they needed help or some
type of assistance to repair the homes they owned, and felt that they were not getting the help they
needed to recover from Hurricane Harvey as seen Figure 6.
Figure 6: Top Hurricane Harvey Impact Survey Results
General Planning: Drainage
improvements in my neighborhood to
reduce the chance of flooding
Infrastructue:Improve and/or
expand the ditches and culverts in my neighborhood to
reduce flooding
Housing: Elevation of repetitively
flooded homes in
the floodplain
0.00% 20.00% 40.00% 60.00% 80.00% 100.00%
Drainage improvements to preventflooding during heavy rains
Help repair or rebuild homes forhomeowners
Not getting the help I need

18
2. Fair Housing Plan and Meetings
Harris County entered into a Regional Collaborative Agreement to develop and submit a Regional Analysis of Impediments (AI) to Fair Housing Plan. As part of the process, an extensive community participation process was created and provided multiple opportunities in various formats for residents and stakeholders to share their experiences and opinions about fair housing choice and access to opportunity in the region including Harris County. Outreach activities included resident and stakeholder engagement opportunities and were promoted by each of the participating jurisdictions and community partners. The community engagement process designed for the AI focused on creating opportunities to participate in whatever format residents preferred, from a survey, to attending a community event, to open house meetings or small group focus group meetings. A fourteen page survey was created, translated in Spanish and Vietnamese and posted to the HCCSD website. It was also posted and promoted on social media sites Facebook, Pinterest and Twitter and in a postage-paid mail format. The survey was sent to over 500 persons representing nonprofit organizations that receive funding or are interested in receiving grant funding from HCCSD early in the process. Hurricane Harvey questions were incorporated into the survey allowing HCCSD to gather housing disaster recovery needs as well. HCCSD staff distributed 1,106 paper surveys and 2,125 flyers at Harris County outreach events which included Resource Fairs, Presentations, Conferences, Pop-up Events, Open House Meeting’s and Expo’s. One-thousand (1,000) flyers and 350 paper surveys were also distributed to the MUD’s and Water Districts to place in resident’s water bills, Galena Park ISD also assisted and posted the flyer with the survey link to their website. Approximately, 5,300 residents completed the regional survey and about 2,035 of those residents lived in Harris County, excluding the City of Houston. It was discovered through the results of the survey that the severity of damaged homes sustained from Hurricane Harvey varied by community. About 49 percent of Harris County residents had damage that made their homes unlivable. At the time the survey was conducted from July 2017 to December 2017, only 13 percent of those with damage to their homes had completed repairs; 45 percent had repairs underway and 36 percent did not know when repairs to their home would begin. Of those who experienced damage to their home, 58 percent had applied for FEMA at the time of the survey and 23 percent had applied for SBA assistance. Only one in 20 (5 percent) said that they would like to apply for help but were not sure if they would qualify and only 1 percent of respondents were not sure how or where to apply.

19
Section 2 Housing
The Harris County Disaster Recovery (DR) Service Area contains 750,461 (49%) of the county’s 1,536,259 occupied housing units. Of the service area’s occupied housing units, 63.8% (478,794) are owner-occupied. The median value of owner-occupied housing units is $145,600 compared to $142,700 in the state of Texas. However, a recent Kinder Institute study places the median value at $160,000 for the county. Renter-occupied housing represents 36.2 percent (271,667) of the service area housing units with median gross rent of $937, Pre-Harvey (U.S. Census, 2012-2016 ACS). The median household income is $55,584 compared to $54,727 for the state of Texas and 17.22 percent of residents live in poverty in Harris County. Over 214,000 out of 1,536,259 Harris County households make less than eighty percent of median income and spend more than fifty percent of their total income on housing creating a severe cost burden to these households. The metropolitan area provides only 18 affordable units for every 100 households that are extremely low income (below poverty or less than thirty percent of median income). In a Rice Kinder Institute report, Houston and Harris County Housing Conversation, quality, affordable housing options are highly sought by area residents.
While some population groups – especially non-white residents, low-income households, and immigrants – confront a preponderance of the problem stemming from inadequate housing, the issue extends beyond those groups. Insufficient, unaffordable housing crosses racial and ethnic lines and touches families from many income levels. It is not an urban or suburban issue, but a regional one. Housing is a keystone system, connected to many other elements of an individual’s daily life from education to transportation to healthcare.
Before Hurricane Harvey, Harris County and the region was in a severe affordable housing crisis, Harvey has and will continue to compound the crisis felt by many households especially low-income households. It is estimated that over 150,000 housing units were affected by Hurricane Harvey in the county. Public and private resource will be required to repair existing housing stock and stabilize affected neighborhoods.
Effect of Harvey on Housing In Harris County, 20.9 percent (353,539) of the homes were built between 1970 to 1979. According to a Meyers Research report, less than 3 percent of the houses that flooded after Harvey were built after 2009. After Tropical Storm Allison, newer drainage and detention regulations were put in place. These homes were under newer drainage and detention regulations. It should be noted, Harris County has a significant number of homes 184,546 in the 100-year floodplain. Over twenty-six percent of these homes were affect by Harvey. However, the massive destructiveness of Harvey also affected over 69,000 homes outside 500 year floodplain (Table 2).

20
Table 2: Number of Homes by Floodplain
POPULATION* STRUCTURE COUNT**
HARVEY DAMAGED STRUCTURES***
Inside the 1% (100-year) FEMA floodplain
537,348 184,546 48,939
Inside the 0.2% (500-year) FEMA floodplain
544,104 230,838 35,571
Outside the 0.2% (500-year) FEMA floodplain
3,010,002 1,203,208 69,670
TOTAL 4,091,454 1,618,592 154,180
Source: *Census 2010, **HCAD 2016, ***HCFCD final estimates as of June 2018
According to the American Community Survey, 2012-2016 data, there are 750,461 housing units in the Harris County Disaster Recovery (DR) Service Area with 64 percent are owner-occupied and 36 percent are renter-occupied housing units. Within the Harris County Disaster Recovery (DR) Service area, there are 206,995 occupied units in the Low to Moderate Income (LMI) area. Of the total LMI units, 44 percent are owner-occupied and 56 percent are renter-occupied housing units. Map 5: FEMA Valid Registrations in Harris County

21
In the Harris County Disaster Recovery (DR) Service area, there were a total of 160,695 valid FEMA registrants reporting some type of damage to their dwelling unit to FEMA. This represents 21.4 percent of DR service area occupied housing units. Residents reported between 6-49+ inches of water in their homes. Map 5 shows all the damaged units with a valid FEMA application recorded across Harris County including the City of Houston, which is shaded in gray. As seen in the map, Harris County’s Low-to-Moderate Income areas and cities were greatly impacted by Hurricane Harvey. According to FEMA, there are four categories of flooding residents reported.
Severe/Destroyed (48 or more inches) Homes are a total loss or repair is not feasible. Major (19-48 inches) Homes categorized as having major damage such as structural
damage and required extensive repairs. Minor (7-18 inches) Minor damage that does not affect the structural integrity of the
residence. Affected (0-6 inches) Minimal damage to the exterior and residents can remain in the
home. As seen in Table 3, 13,912 housing units had a damage level of Major to Severe/Destroyed and 7,091 with minor damage. Registrants in the LMI areas of the service area reported 2,333 with minor damage and 2,764 with Major or Severe/Destroyed. FEMA estimates most repair cost average between $72,000 and $100,000 to repair major and severely damaged housing. These homeowners, especially LMI households, will need additional resources to repair damage as FEMA assistance is limited to just over $33,000 in assistance. Table 3: All FEMA Valid Registrants by Level of Damage
Damage Level # Registrants DR
Service Area # Registrants LMI area
Affected 139,692 43,786
Minor 7,091 2,333
Major 7,624 1,783
Severe/Destroyed 6,288 981
Total 160,695 48,883
As seen on Map 6, some of the areas with the highest damage (Major and Severe/Destroyed) can be seen along Cypress and Spring Creeks, the neighborhoods of Riverwood, Blue Bell, Roseberry, Allen Field, and Sequoia Estates. Cities also deeply impacted were Pasadena, Friendswood, Bellaire, Baytown, LaPorte, Deer Park, Katy, Jacinto City, Galena Park and South Houston. Low-to-Moderate Income (LMI) that have a high (Major and Severe/Destroyed) can be seen along Airline, Aldine, Barrett Station, Parkway, Greensbrook Verde First, Sheldon area and Highlands.

22
Map 6: Level of Damage for All FEMA Valid Applicants in the Harris County DR Service Area
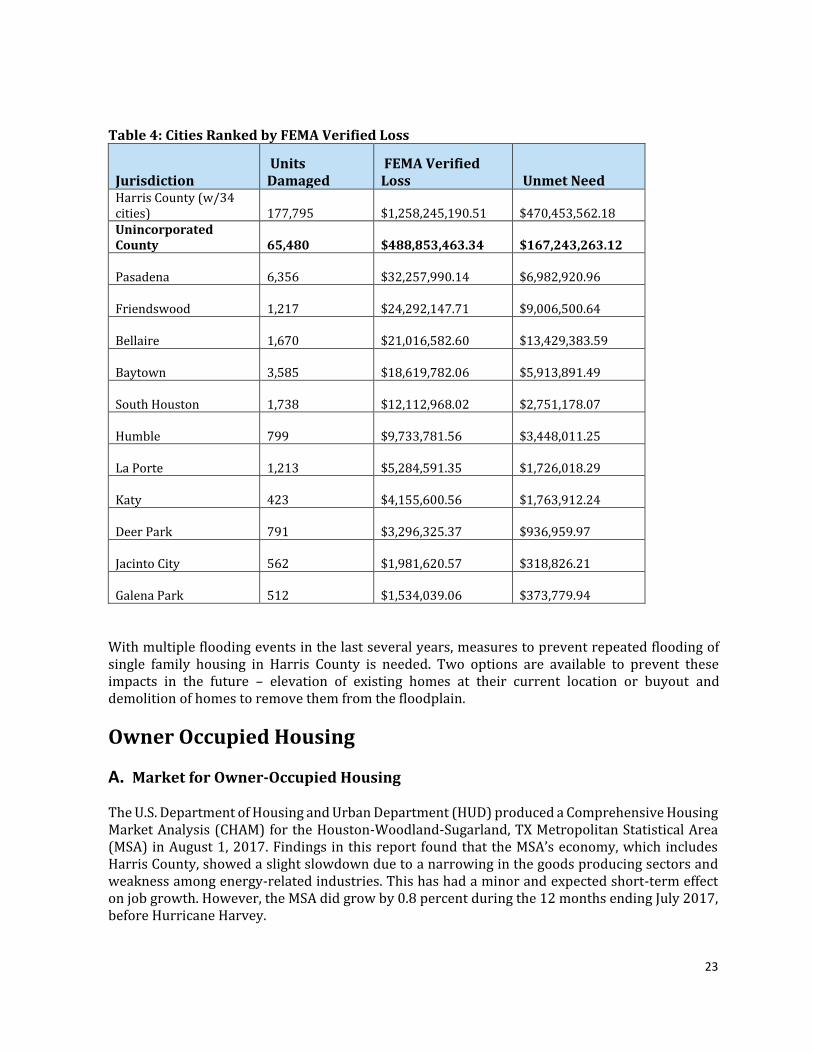
As seen in Table 4, the areas that reported FEMA damage levels of flooding in the Harris County Disaster Recovery (DR) Service Area are ranked according to FEMA Verified Loss (FVL). Based on FEMA Verified Loss (FVL), the top 5 Cities that have the greatest amount of damaged units included Pasadena (6,356), Friendswood (1,217), Bellaire (1,670), Baytown (3,585) and South Houston (1,738).
23
Table 4: Cities Ranked by FEMA Verified Loss
Jurisdiction Units Damaged
FEMA Verified Loss Unmet Need
Harris County (w/34 cities)
177,795 $1,258,245,190.51 $470,453,562.18
Unincorporated County
65,480 $488,853,463.34 $167,243,263.12
Pasadena 6,356 $32,257,990.14 $6,982,920.96
Friendswood 1,217 $24,292,147.71 $9,006,500.64
Bellaire 1,670 $21,016,582.60 $13,429,383.59
Baytown 3,585 $18,619,782.06 $5,913,891.49
South Houston 1,738 $12,112,968.02 $2,751,178.07
Humble 799 $9,733,781.56 $3,448,011.25
La Porte 1,213 $5,284,591.35 $1,726,018.29
Katy 423 $4,155,600.56 $1,763,912.24
Deer Park 791 $3,296,325.37 $936,959.97
Jacinto City 562 $1,981,620.57 $318,826.21
Galena Park 512 $1,534,039.06 $373,779.94
With multiple flooding events in the last several years, measures to prevent repeated flooding of single family housing in Harris County is needed. Two options are available to prevent these impacts in the future – elevation of existing homes at their current location or buyout and demolition of homes to remove them from the floodplain.
Owner Occupied Housing
A. Market for Owner-Occupied Housing The U.S. Department of Housing and Urban Department (HUD) produced a Comprehensive Housing Market Analysis (CHAM) for the Houston-Woodland-Sugarland, TX Metropolitan Statistical Area (MSA) in August 1, 2017. Findings in this report found that the MSA’s economy, which includes Harris County, showed a slight slowdown due to a narrowing in the goods producing sectors and weakness among energy-related industries. This has had a minor and expected short-term effect on job growth. However, the MSA did grow by 0.8 percent during the 12 months ending July 2017, before Hurricane Harvey.

24
The sale housing market in Harris County is currently balanced with an estimated 1.4 percent vacancy rate. During the 12 months before Hurricane Harvey, a 3.5 months inventory of unsold homes was on the market2. The market was showing a strong recovery from the 2010 housing market downturn. With the stronger economy, seriously delinquent loans and real estate owned (REO) properties are reduced. Building activity, however, had not returned post-housing bubble collapse. Single-family homes permitted in the county have also seen a seven year low, a 9 percent decline in home starts since 2010. Of those homes being permitted, the majority are in master-planned communities, like Bridgeland Homes in northwest Harris County, where housing prices are $230,000 to $1 million, not an affordable product. The CHAM report estimated that before Hurricane Harvey, the demand for new sales housing in the $100,000 to $199,000, affordable price range, would represent 25 percent of the total market need in the county. Harris County was already in an affordable housing crisis. According to the Kinder Institute - Rice University Report, there is definitely a need for affordable housing in Harris County. More than 435,000 households make less than 80 percent of the median income or less than $55,440 in the Harris County region and spend more than 30 percent of their income on housing. They also live in substandard conditions which means they live in homes lacking a kitchen or bathroom or both and about 90,000 of those housing units are supported by public subsidies, either rent vouchers, or financed through low-income housing tax credits, or other means. A need for affordable housing existed in Harris County well before Hurricane Harvey and proves even more urgent now. Though the public and private sectors have collaborated to address these issues, quality affordable housing in the Harris County region is still in low supply. Post-Harvey Housing Market
The owner-occupied housing market in the Harris County region came to a standstill after Hurricane Harvey, as homeowners had to procure temporary accommodations while they began their recovery and home rebuilding process. Many residents of single-family homes that had flooded repeatedly since 2015 decided to sell their properties to avoid rebuilding or further flooding, leaving them also in need of affordable housing. Selling their properties also opened the door for investors to turn them into rental units or perform a quick repair and flip of flooded homes. The need for residential buyout in LMI areas is particularly needed to assist homeowners in repetitively high flood areas to relocate into areas of reduce flood risk with a minimum additional financial burden to the LMI household. Prior to Harvey, the county had reduced its level of seriously delinquent loans and real estate owned (REO) properties. With Harvey, county residents have the added housing burdens to repair their homes, find and maintain temporary housing with possible rental fees and pay their mortgage as well as replace personal property such as furniture and vehicles. This is combine with the loss of wages or jobs during the days and weeks of Hurricane Harvey as businesses and schools were closed has left many households in financial straits. In addition, rising mortgage rates, potential foreclosures for homeowners without enough resources to repair, lack of flood insurance, and construction labor shortages have further exacerbated the owner-occupied housing market.
2 U.S. HUD Comprehensive Housing Market Analysis, August 2017. https://www.huduser.gov/portal/publications/pdf/HoustonTX-comp-17.pdf accessed 9/25/2018
25
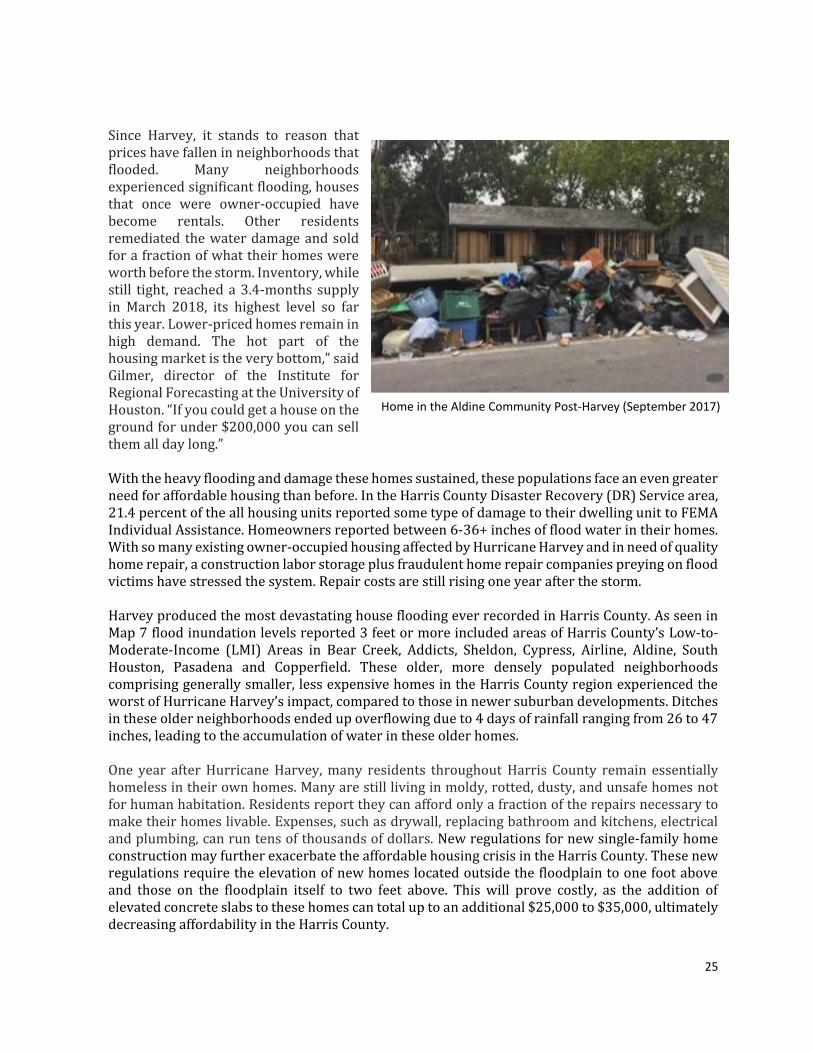
Since Harvey, it stands to reason that prices have fallen in neighborhoods that flooded. Many neighborhoods experienced significant flooding, houses that once were owner-occupied have become rentals. Other residents remediated the water damage and sold for a fraction of what their homes were worth before the storm. Inventory, while still tight, reached a 3.4-months supply in March 2018, its highest level so far this year. Lower-priced homes remain in high demand. The hot part of the housing market is the very bottom,” said Gilmer, director of the Institute for Regional Forecasting at the University of Houston. “If you could get a house on the ground for under $200,000 you can sell them all day long.” With the heavy flooding and damage these homes sustained, these populations face an even greater need for affordable housing than before. In the Harris County Disaster Recovery (DR) Service area, 21.4 percent of the all housing units reported some type of damage to their dwelling unit to FEMA Individual Assistance. Homeowners reported between 6-36+ inches of flood water in their homes. With so many existing owner-occupied housing affected by Hurricane Harvey and in need of quality home repair, a construction labor storage plus fraudulent home repair companies preying on flood victims have stressed the system. Repair costs are still rising one year after the storm. Harvey produced the most devastating house flooding ever recorded in Harris County. As seen in Map 7 flood inundation levels reported 3 feet or more included areas of Harris County’s Low-to-Moderate-Income (LMI) Areas in Bear Creek, Addicts, Sheldon, Cypress, Airline, Aldine, South Houston, Pasadena and Copperfield. These older, more densely populated neighborhoods comprising generally smaller, less expensive homes in the Harris County region experienced the worst of Hurricane Harvey’s impact, compared to those in newer suburban developments. Ditches in these older neighborhoods ended up overflowing due to 4 days of rainfall ranging from 26 to 47 inches, leading to the accumulation of water in these older homes. One year after Hurricane Harvey, many residents throughout Harris County remain essentially homeless in their own homes. Many are still living in moldy, rotted, dusty, and unsafe homes not for human habitation. Residents report they can afford only a fraction of the repairs necessary to make their homes livable. Expenses, such as drywall, replacing bathroom and kitchens, electrical and plumbing, can run tens of thousands of dollars. New regulations for new single-family home construction may further exacerbate the affordable housing crisis in the Harris County. These new regulations require the elevation of new homes located outside the floodplain to one foot above and those on the floodplain itself to two feet above. This will prove costly, as the addition of elevated concrete slabs to these homes can total up to an additional $25,000 to $35,000, ultimately decreasing affordability in the Harris County.
Home in the Aldine Community Post-Harvey (September 2017)

26
Map 7: FEMA Valid Registration in Harris County by Flood Inundation
The reality of recovery has been monumentally slow due to nearly 80 percent of households affected by Harvey did not receive enough or all FEMA assistance, lack the funds for repairs or did not have flood insurance, according to the Federal Emergency Management Agency. Many are living in partially repaired homes or are still displaced living in temporary housing or on a friend or relative’s sofa. Affordable-housing advocates call Harvey one of the largest housing disasters in American history, next to only Hurricane Katrina, which overwhelmed New Orleans in 2005.
B. FEMA To assess overall impacts to the community, FEMA Individual Assistance (IA) data was obtained throughout Harris County. The FEMA IA program provides financial assistance to individuals and households affected as a direct result of a presidentially declared major disaster or emergency. Assistance is available for those who are uninsured or underinsured, have necessary expenses and serious needs, and are unable to meet those expenses or needs through other means. Up to $33,000 is available in financial help, adjusted annually (some forms of IA assistance have other limits). This program supports the recovery efforts by providing the financial means to disaster survivors to secure adequate interim and long-term housing, in addition to funding other necessary expenses and serious needs.
Residents that can participate in the IA Program must meet the following criteria:

27
Whose primary residence has been damaged or destroyed by the disaster. Whose disaster losses are not covered by insurance or residents who are underinsured. Who are citizens of the United States, a non-citizen national or a qualified alien, or is in a
household where a member of the household is a citizen of the United States, a non-citizen national or a qualified alien.
Who are located in a Special Flood Hazard Areas (SFHA) and the homeowner complies with flood insurance purchase requirements and local flood codes and requirements.
As seen in Table 5, in the Harris County (DR) Service Area there were a total of 160,695 registrants that applied for FEMA for assistance and of that total, 94,208 were owner-occupied. In the Low-to-Moderate-Income (LMI) Areas, there were a total of 48,883 registrants that applied for FEMA for assistance. Of that total, 25,132 were owner-occupied and 211 applicants reported that they were renting storage units, storing belongings at church or other businesses, residences or were homeless. Table 5: FEMA Valid Registrants by Occupancy Type and Low-to Moderate-Income (LMI) Status in the Harris County Disaster Recovery (DR) Service Area
Occupancy Type Total Applications in DR Service Area
Total Applications in LMI
Owner 94,208 25,132
Renter 65,922 23,540
Non-housing unit/other 565 211
Totals 160,695 48,883
Homeowners reported between 6-49+ inches of water in their homes. According to FEMA, there are four categories of flooding residents reported (Map 8).
Severely/Destroyed (48 or more inches) Homes are a total loss or repair is not feasible Major (19-48 inches) Homes categorized as having major damage such as structural
damage and required extensive repairs. Minor (7-18 inches) Minor damage that does not affect the structural integrity of the
residence. Affected (0-6 inches) Minimal damage to the exterior and residents can remain in the
home.
28
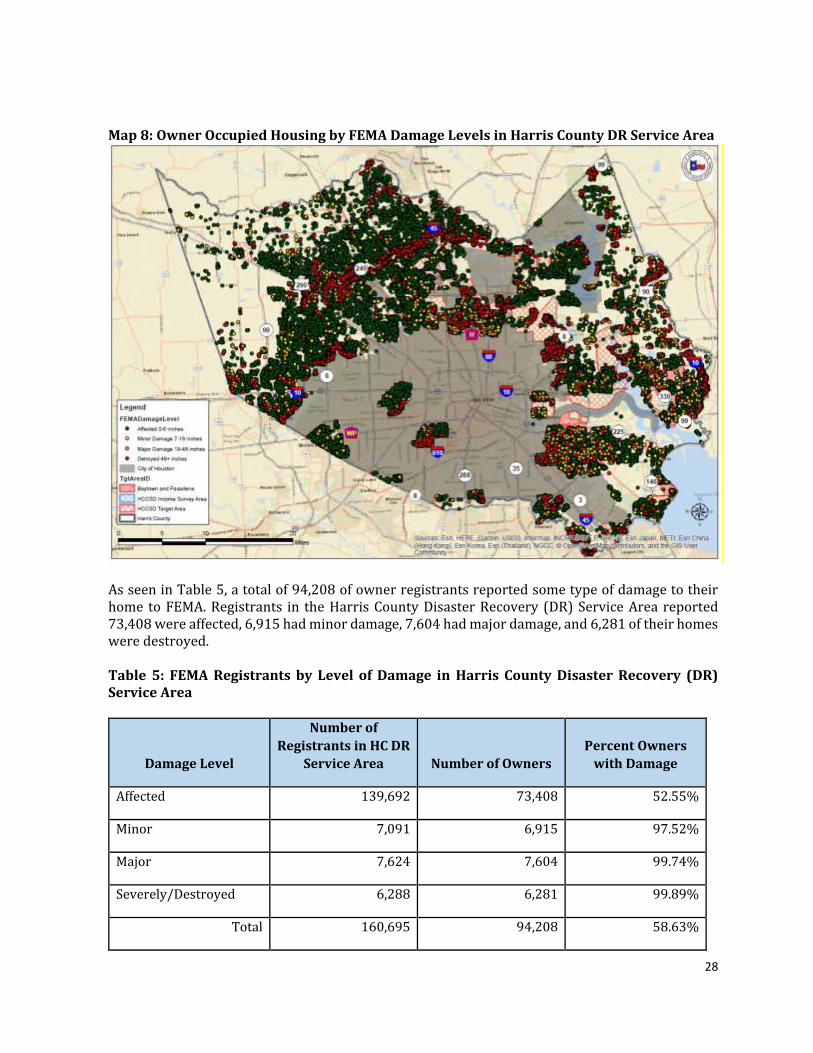
Map 8: Owner Occupied Housing by FEMA Damage Levels in Harris County DR Service Area
As seen in Table 5, a total of 94,208 of owner registrants reported some type of damage to their home to FEMA. Registrants in the Harris County Disaster Recovery (DR) Service Area reported 73,408 were affected, 6,915 had minor damage, 7,604 had major damage, and 6,281 of their homes were destroyed. Table 5: FEMA Registrants by Level of Damage in Harris County Disaster Recovery (DR) Service Area
Damage Level
Number of
Registrants in HC DR
Service Area Number of Owners
Percent Owners
with Damage
Affected 139,692 73,408 52.55%
Minor 7,091 6,915 97.52%
Major 7,624 7,604 99.74%
Severely/Destroyed 6,288 6,281 99.89%
Total 160,695 94,208 58.63%

29
Activities funded through the IA Program includes grants for Housing Assistance (HA) for either temporary housing and/or home repairs assistance, multi-family lease and repair, home replacement assistance, and Other Needs Assistance (ONA). ONA can include assistance for personal property, medical, dental, transportation, and other personal or special needs to help people recover from a disaster. The review of the impact from Harvey as well establishes additional unmet needs for this event and provides an overview of FEMA IA claims for both HA and ONA assistance compared to FEMA verified losses (FVL). For the Harris County Disaster Recovery (DR) Service Area, 94,208 owners were registered and 56,860 received some type of assistance which totaled $350,856,065.34. The LMI Areas, 25,132 owners were registered and 16,653 received assistance which totaled $92,267,183.73 Of that number, 37,348 or 40 percent did not receive any type of assistance, 10,479 or 11 percent received Other Needs Assistance (ONA) which provides for miscellaneous and other expenses, 440 or 0.47 percent received only a Small Business Loan (SBA) and only 115 or 0.12 percent received FEMA assistance. (Table 6).
Table 6: Owners in Harris County Service Area and LMI Areas that Received FEMA Assistance
Assistance Received Number of
Owners HCDR
Amount of Assistance Received
Number of Owners LMI
Amount of Assistance Received
Total Owner Registrants 94,208 $350,856,065.34 25,132 $92,267,183.73
No Assistance 37,348 $0.00 8,479 $0.00
ONA Only 10,479 $5,469,173.38 2,116 $1,190,634.45
SBA Only 440 $8,440,000.00 84 $1,712,100.00
FEMA Only 115 $265,404.24 27 $94,201.17
Combination of Assistance 45,826 $336,681,487.72 14,426 $89,270,248.11
C. Small Business Association
Another resource for homeowners that sustained damage from Hurricane Harvey is the Small Business Administration’s (SBA) disaster loans. These loans are the basic form of federal disaster assistance for homeowners whose private property sustained damage that is not fully covered by insurance. Homeowners and renters whose property was damaged by a declared disaster can apply for an SBA low-interest loan. Interest rates on these loans are determined by law and are assigned on a case by case basis.
30
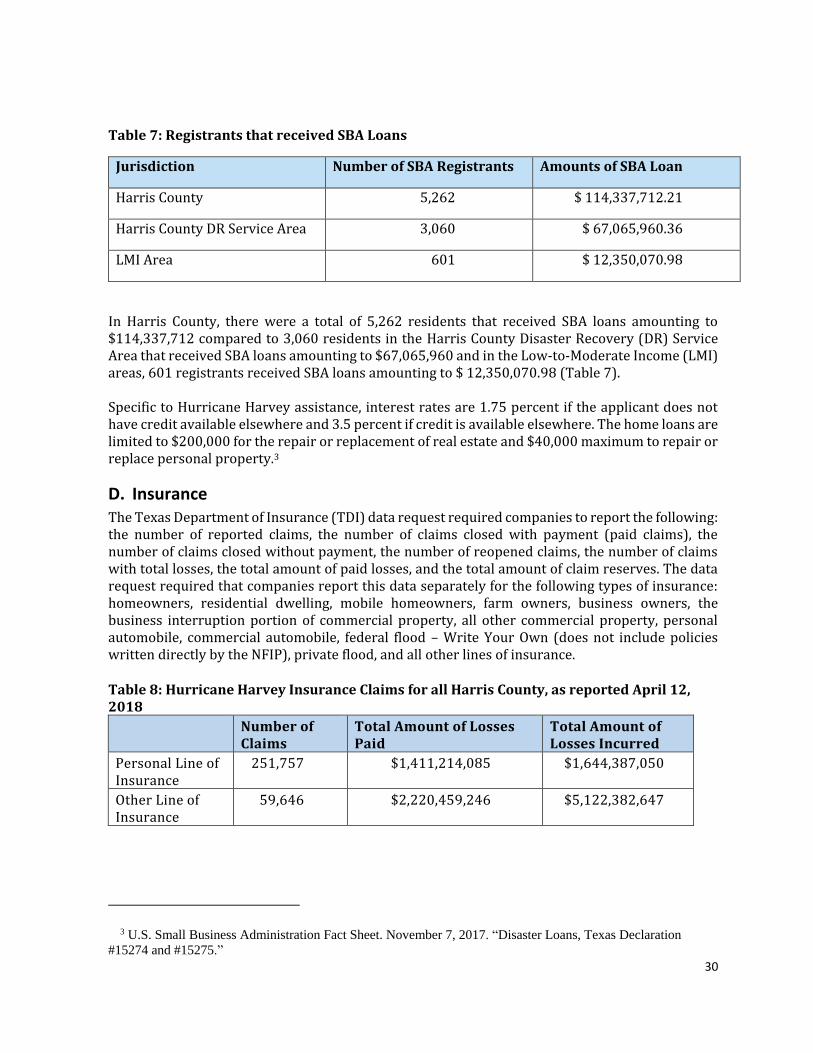
Table 7: Registrants that received SBA Loans
Jurisdiction Number of SBA Registrants Amounts of SBA Loan
Harris County 5,262 $ 114,337,712.21
Harris County DR Service Area 3,060 $ 67,065,960.36
LMI Area 601 $ 12,350,070.98
In Harris County, there were a total of 5,262 residents that received SBA loans amounting to $114,337,712 compared to 3,060 residents in the Harris County Disaster Recovery (DR) Service Area that received SBA loans amounting to $67,065,960 and in the Low-to-Moderate Income (LMI) areas, 601 registrants received SBA loans amounting to $ 12,350,070.98 (Table 7). Specific to Hurricane Harvey assistance, interest rates are 1.75 percent if the applicant does not have credit available elsewhere and 3.5 percent if credit is available elsewhere. The home loans are limited to $200,000 for the repair or replacement of real estate and $40,000 maximum to repair or replace personal property.3
D. Insurance
The Texas Department of Insurance (TDI) data request required companies to report the following: the number of reported claims, the number of claims closed with payment (paid claims), the number of claims closed without payment, the number of reopened claims, the number of claims with total losses, the total amount of paid losses, and the total amount of claim reserves. The data request required that companies report this data separately for the following types of insurance: homeowners, residential dwelling, mobile homeowners, farm owners, business owners, the business interruption portion of commercial property, all other commercial property, personal automobile, commercial automobile, federal flood – Write Your Own (does not include policies written directly by the NFIP), private flood, and all other lines of insurance.
Table 8: Hurricane Harvey Insurance Claims for all Harris County, as reported April 12, 2018
Number of Claims
Total Amount of Losses Paid
Total Amount of Losses Incurred
Personal Line of Insurance
251,757 $1,411,214,085 $1,644,387,050
Other Line of Insurance
59,646 $2,220,459,246 $5,122,382,647
3 U.S. Small Business Administration Fact Sheet. November 7, 2017. “Disaster Loans, Texas Declaration
#15274 and #15275.”
31
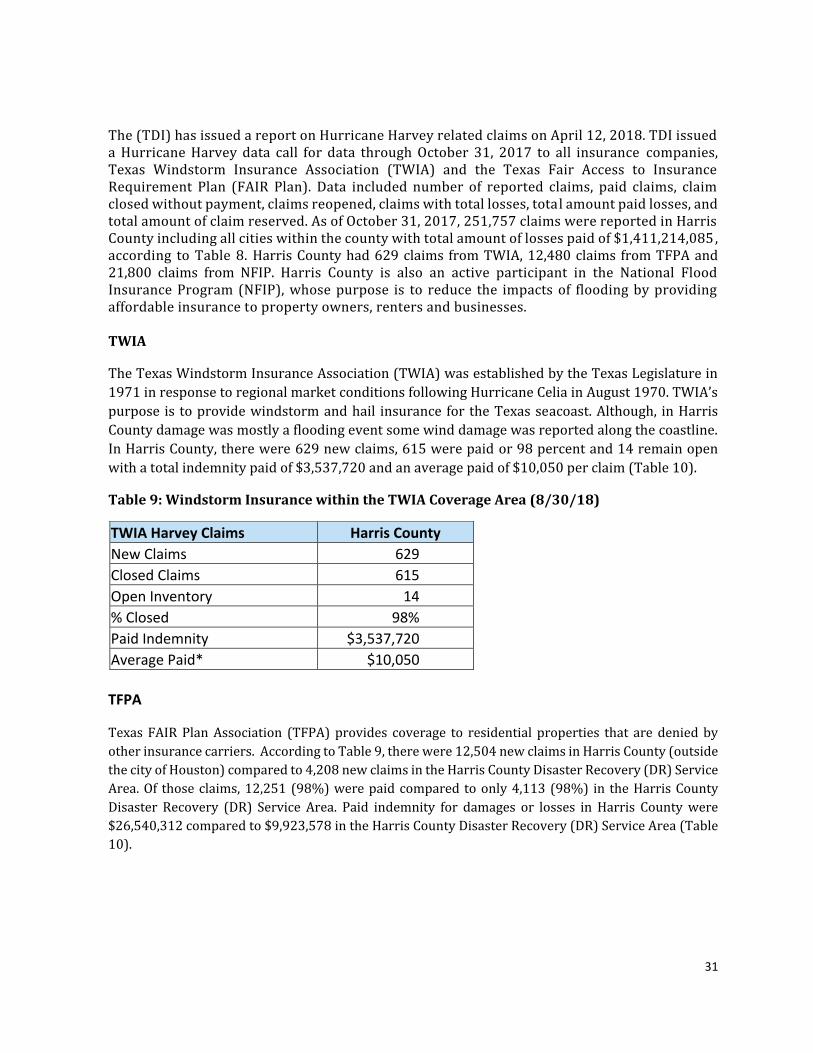
The (TDI) has issued a report on Hurricane Harvey related claims on April 12, 2018. TDI issued a Hurricane Harvey data call for data through October 31, 2017 to all insurance companies, Texas Windstorm Insurance Association (TWIA) and the Texas Fair Access to Insurance Requirement Plan (FAIR Plan). Data included number of reported claims, paid claims, claim closed without payment, claims reopened, claims with total losses, total amount paid losses, and total amount of claim reserved. As of October 31, 2017, 251,757 claims were reported in Harris County including all cities within the county with total amount of losses paid of $1,411,214,085, according to Table 8. Harris County had 629 claims from TWIA, 12,480 claims from TFPA and 21,800 claims from NFIP. Harris County is also an active participant in the National Flood Insurance Program (NFIP), whose purpose is to reduce the impacts of flooding by providing affordable insurance to property owners, renters and businesses. TWIA
The Texas Windstorm Insurance Association (TWIA) was established by the Texas Legislature in
1971 in response to regional market conditions following Hurricane Celia in August 1970. TWIA’s
purpose is to provide windstorm and hail insurance for the Texas seacoast. Although, in Harris
County damage was mostly a flooding event some wind damage was reported along the coastline.
In Harris County, there were 629 new claims, 615 were paid or 98 percent and 14 remain open
with a total indemnity paid of $3,537,720 and an average paid of $10,050 per claim (Table 10).
Table 9: Windstorm Insurance within the TWIA Coverage Area (8/30/18)
TWIA Harvey Claims Harris County
New Claims 629
Closed Claims 615
Open Inventory 14
% Closed 98%
Paid Indemnity $3,537,720
Average Paid* $10,050
TFPA
Texas FAIR Plan Association (TFPA) provides coverage to residential properties that are denied by
other insurance carriers. According to Table 9, there were 12,504 new claims in Harris County (outside
the city of Houston) compared to 4,208 new claims in the Harris County Disaster Recovery (DR) Service
Area. Of those claims, 12,251 (98%) were paid compared to only 4,113 (98%) in the Harris County
Disaster Recovery (DR) Service Area. Paid indemnity for damages or losses in Harris County were
$26,540,312 compared to $9,923,578 in the Harris County Disaster Recovery (DR) Service Area (Table
10).

32
Table 10: Mold Insurance and Wind/Hail Coverage Outside of the TWIA Coverage Area (8/30/18)
TFPA Harvey Claims Harris County HCDR Area
New Claims 12,504 4,208
Closed Claims 12,251 4,113
Open Inventory 253 43
% Closed 98% 98%
Paid Indemnity $26,540,312 $ 9,923,578.00
Average Paid* $ 6,677 $ 2,412.73 *Average paid = average indemnity paid, per paid claim
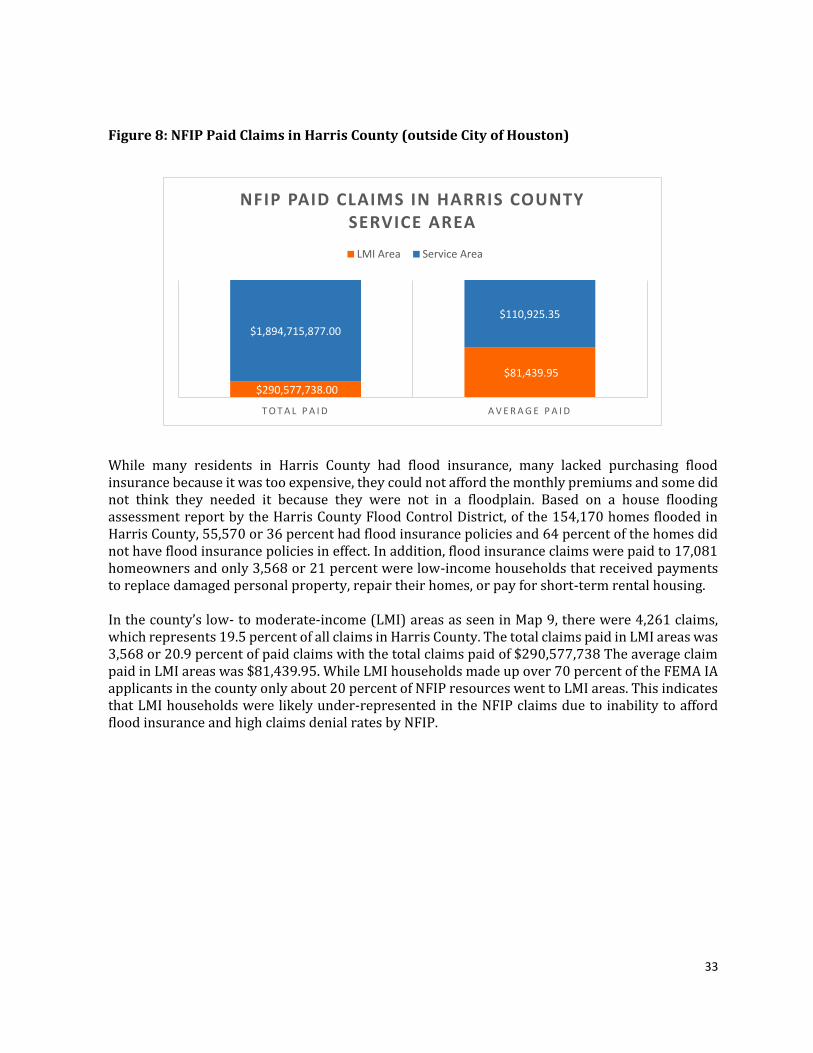
The National Flood Insurance Program (NFIP) is a FEMA program that works to provide affordable insurance to property owners in participating communities and works to encourage communities to adopt and enforce floodplain management regulations. In areas at high risk of flooding, Congress has mandated that federally regulated or insured lenders require flood insurance on mortgaged properties. The NFIP offers two types of flood insurance coverage for homeowners: building property coverage up to $250,000; and personal property coverage (contents) up to $100,000. According to data (Figures 7 and 8) from the NFIP in January 2018, in Harris County (outside the city of Houston), there were 21,800 NFIP claims of which 17,081 or 78.4 percent were paid claims. The total claims paid was $1,894,715,877 with an average claim of $110,925.35 Map 7 displays the closed NFIP claims in Harris County.
Figure 7: NFIP Claims in Harris County (outside City of Houston)
342 351 3,568
2,270 2,449 17,081
T O T A L C L A I M S ( A C T I V E / P E N D I N G )
T O T A L C L A I M S ( W / O P A Y M E N T )
T O T A L C L A I M S C L O S E D
NFIP CLAIMS IN HARRIS COUNTY SERVICE AREA
LMI Area Service Area
33
Figure 8: NFIP Paid Claims in Harris County (outside City of Houston)
While many residents in Harris County had flood insurance, many lacked purchasing flood insurance because it was too expensive, they could not afford the monthly premiums and some did not think they needed it because they were not in a floodplain. Based on a house flooding assessment report by the Harris County Flood Control District, of the 154,170 homes flooded in Harris County, 55,570 or 36 percent had flood insurance policies and 64 percent of the homes did not have flood insurance policies in effect. In addition, flood insurance claims were paid to 17,081 homeowners and only 3,568 or 21 percent were low-income households that received payments to replace damaged personal property, repair their homes, or pay for short-term rental housing. In the county’s low- to moderate-income (LMI) areas as seen in Map 9, there were 4,261 claims, which represents 19.5 percent of all claims in Harris County. The total claims paid in LMI areas was 3,568 or 20.9 percent of paid claims with the total claims paid of $290,577,738 The average claim paid in LMI areas was $81,439.95. While LMI households made up over 70 percent of the FEMA IA applicants in the county only about 20 percent of NFIP resources went to LMI areas. This indicates that LMI households were likely under-represented in the NFIP claims due to inability to afford flood insurance and high claims denial rates by NFIP.
$290,577,738.00
$81,439.95
$1,894,715,877.00
$110,925.35
T O T A L P A I D A V E R A G E P A I D
NFIP PAID CLAIMS IN HARRIS COUNTY SERVICE AREA
LMI Area Service Area

34
Map 9: NFIP Claims Active/Open and Closed without Payment
Residential Buyout The Harris County Flood Control District (HCFCD) has operated the Harris County Residential Buyout Program since 1985 and acquired and removed approximately 3,000 houses that are hopelessly deep in the floodplain where flood damage reduction projects, like channel improvements or storm water detention basins, are not cost effective and or beneficial. Once bought out, these parcels are returned to their beneficial function aiding in the storage of floodwaters. Those homeowners who are bought out are assisted to move to an area with a reduced flood risk. HCFCD has identified 43 areas in unincorporated Harris County or in one of the county’s small cities that fits the above definition. These areas contain approximately 3,300 parcels to acquire. Of the 43 buyout interest areas, the county has identified 13 areas that are in low- to moderate-income areas and or in Social Vulnerable areas as shown in Map 14. Seven of the 13 areas have an average home market value of under $85,000, the lowest average home market value was $27,105 in the community of Allen Field.

35
Map 14: Harris County Buyout Areas in Harris County Low- to Moderate-Income Areas

36
Renter-Occupied Housing
According to the U.S. Census Bureau, there are 1,536,259 occupied housing units in Harris County. Of which, 698,347 are renter-occupied housing units that are made up of apartments, condos or townhomes. In addition, there are 15,776 mobile homes and 519 units that are either boats, RVs, vans, etc. in Harris County. In the Harris County DR service area, there are 271,667 (36.2%) renter-occupied housing units. The median gross rent is $937 in Harris County4, however, 22 percent of renters have an average income of less than $20,000 and thus severely housing cost burdened. These cost-burdened households are usually low-income, minorities, seniors or people with disabilities.
A. Rental Market Rental Housing Market Before Hurricane Harvey In the twelve months leading up to Hurricane Harvey, the Harris County rental housing market was soft with an estimated 10.9 percent vacancy rate5. Due to a strengthening economy, rents increased by one percent to $1,028 and effective rents, which include concessions, declined less than one percent to $997. Due to the softening market, multi-family building activity has declined significantly, 51 percent, in the year before Harvey. The estimated three year demand before Harvey was for 18,450 additional rental units in the county with a high demand for affordable rental units at 26.5 percent of demand. Nationally, Harris County area holds a reputation as a metropolitan area with affordable housing. However, as the Kinder Institute reports in its assessment Growing but Unequal: Mapping High Opportunity Areas and Implications for Affordable Housing6, 30.0 percent of Harris County’s households actually spend more than 30.0 percent of their annual income on housing costs. This level of spending classifies these households – especially those of low-income renters - as “housing cost-burdened” and works as an obstacle to these households paying for other housing-related expenses (e.g., food, clothing, transportation, and education) and adapting to financial shifts that may occur due to unexpected costs, such as from natural disasters. Despite joint efforts with public and private housing sectors to meet the demand for affordable housing in the region, an undersupply of affordable housing units still exists.
4 U.S. Census, American Community Survey 2012-2016 5 U.S. HUD Comprehensive Housing Market Analysis, August 2017. https://www.huduser.gov/portal/publications/pdf/HoustonTX-comp-17.pdf accessed 9/25/2018. 6 Kinder Institute, Growing but Unequal: Mapping High Opportunity Areas and Implications for Affordable Housing
Apartment Flooding during Hurricane Harvey in Harris County
37
Post-Harvey Rental Market Hurricane Harvey, poses unique housing challenges because it affected a much larger swath of population than has been impacted by previous storms. In Harris County, neighborhoods flooded that have never flooded. Several months following Harvey, the multifamily rental market in Harris County is experiencing positive absorption, with tenants desperately searching for housing and homeowners looking to sign short-term leases while their homes underwent repair, and while they awaited permanent relocation expenses. As a result, lower income renters are competing for vacant units and in most cases paying higher rents than they would have before the disaster. Renters seemed to have greater challenges to recovery as FEMA/SBA resources were limited or non-existing to renters, fair housing issues arose with landlords discriminating against minority and limited English proficient populations regarding repairing the rental unit and eviction notices post-Harvey to renters as properties forced out tenants. For all those in search of housing, especially lower-income residents, disabled and seniors, finding housing has been be a major challenge in Harris County. As stated before, Harris County has a shortage of affordable housing. Many of the units that were vacant before the storm were in luxury properties, which was a part of the oil-and-gas boom. Those units were largely spared by Harvey while affordable housing units suffered more damage. Lower-income residents in Harris County already had challenges finding housing, given that the majority of new construction has been at the high end and monthly rents for available units in those areas averages nearly $1,800, compared with the area median rent of $937 for Harris County. Apartment researchers said they anticipate that rents could rise by as much as 10 percent over the next several months. Until recently, rents in the Harris County region were essentially flat. Many landlords had been offering tenants who move in two or even three months’ rent free, these concessions will likely disappear as demand outpaces supply. According to FEMA Individual Assistance registrations, 65,922 renter households reported being affected by Hurricane Harvey in the Harris County DR Service Area. Of this number, 35.7 percent are LMI households. One out of seven renter households in the Harris County may have been residing in buildings directly impacted by Harvey. After Hurricane Harvey, the Apartment Data Services produced a report stating over 6,000 rental units were affected by Hurricane Harvey across Harris County. With the decreasing number of available units and heightened demand means that the gap between the supply of and demand for housing is greater than it was prior to Hurricane Harvey. The repair process for “down” units is slow and associated costs high, as labor and repair materials are in short supply. Map 10 show the location of damaged apartment properties in relation to flood inundation. During a survey by the Houston Apartment Association, many complexes along Cypress Creek that were Class B and C were flooded. For many this was a repeat of the 2016 Tax Day Floods. The Cities of Baytown and Pasadena also had Class B and C properties reporting damage.

38
Map 10: Harvey Flood Inundation and Apartment Condition Classification
B. FEMA To assess overall impacts to the community, FEMA Individual Assistance (IA) data was obtained throughout Harris County. The FEMA IA program provides financial assistance to individuals and households affected as a direct result of a presidentially declared major disaster or emergency. Assistance is available for those who are uninsured or underinsured, have necessary expenses and serious needs, and are unable to meet those expenses or needs through other means. Up to $33,000 is available in financial help, adjusted annually (some forms of IA assistance have other limits). This program supports the recovery efforts by providing the financial means to disaster survivors to secure adequate interim and long-term housing, in addition to funding other necessary expenses and serious needs.
Residents that can participate in the IA Program must meet the following criteria:
Whose primary residence has been damaged or destroyed by the disaster. Whose disaster losses are not covered by insurance or residents who are underinsured. Who are citizens of the United States, a non-citizen national or a qualified alien, or is in a
household where a member of the household is a citizen of the United States, a non-citizen national or a qualified alien.

39
Who are located in a Special Flood Hazard Areas (SFHA) and the homeowner complies with flood insurance purchase requirements and local flood codes and requirements.
Activities funded through the IA Program includes grants for Housing Assistance (HA) for either temporary housing and/or home repairs assistance, multi-family lease and repair, home replacement assistance, and Other Needs Assistance (ONA). ONA can include assistance for personal property, medical, dental, transportation, and other personal or special needs to help people recover from a disaster. As seen in table 11, in the Harris County Disaster Recovery (DR) Service Area there were a total of
160,695 registrants that applied for FEMA for assistance. Of that total, 65,922 were renter-
occupied and 565 applicants reported that they were renting storage units, storing belongings at
church or other businesses, residences or were homeless. In the Low-to-Moderate-Income (LMI)
Areas, there were a total of 23,540 registrants that applied for FEMA for assistance.
Table 11: FEMA Registered Renters in HCDR & LMI Service Area
Occupancy Type Total Applications in HCDR
Total Applications in LMI
Owner 94,208 25,132
Renter 65,922 23,540
N/A 565 211
Totals 160,695 48,883
The review of the impact from Harvey as well establishes additional unmet needs for this event and provides an overview of FEMA IA claims for both HA and ONA assistance compared to FEMA verified losses (FVL). For the Harris County Disaster Recovery (DR) Service Area, 65,922 renters were registered and 26,587 received assistance which totaled $$66,236,003.06. In the LMI Areas, 23,540 renters were registered and 10,749 received assistance which totaled $29,630,003.46 according to Table 12.
Table 12: Renters in HCDR and LMI Areas the Received FEMA Assistance
Assistance Received Number of
Renters HCDR
Amount of Assistance Received
Number of Renters LMI
Amount of Assistance Received
Total Renters Registrants 65,922 $66,236,003.06 23,540 $29,630,003.46
No Assistance 39,335 $0.00 12,791 $0.00
ONA Only 16,562 $14,821,860.56 6,134 $6,582,588.08
SBA Only 186 $2,196,200.00 56 $631,200.00
FEMA Only 2,741 $5,889,650.84 1,141 $2,409,360.14
Combination of Assistance 7,098 $43,328,291.66 3,418 $20,006,855.24

40
However, to note, these figures may represent an undercount of the number of rental units impacted. Renters displaced by the flooding may themselves have submitted renter claims for assistance, as they could not claim property damage due to the flooding and would have primarily requested housing assistance, etc. as a result. These renters might also have not been aware they could claim these benefits.
Map 7: Renter IA by Damage Level
Of the 160,695 Valid FEMA registrants in the Harris County Disaster Recovery (DR) Service Areas,
41.0 percent were rental units reporting some type of damage to their dwelling unit to FEMA.
Renters reported between 6-49+ inches of water in their homes. Map 11 shows all the damaged
units with a valid FEMA application recorded across Harris County, which is shaded in gray. As seen
in the map, LMI areas were greatly impacted by Hurricane Harvey.
According to FEMA, there are four categories of flooding residents reported.
Severe/Destroyed (48 or more inches) Homes are a total loss or repair is not feasible Major (19-48 inches) Homes categorized as having major damage such as structural
damage and required extensive repairs.

41
Minor (7-18 inches) Minor damage that does not affect the structural integrity of the residence.
Affected (0-6 inches) Minimal damage to the exterior and residents can remain in the home.
As seen in Table 13, the majority of rental units damaged by Harvey were affected by level. Registrants in the LMI areas of the service area reported 66 with minor damage and 10 with Major or Severe/Destroyed. Table 13: FEMA Valid Registrants by Level of Damage in Harris County Disaster Recovery (DR)
Service Area and LMI Areas
Damage Level Number of Renters in
DR Service Area
Number of Renters in
LMI Areas
Affected 65,720 23,464
Minor 176 66
Major 19 7
Severe/Destroyed 7 3
Total 65,922 23,540
C. Apartment Damage Survey Data After Hurricane Harvey, data from was used from three sources calculate damaged rental units in Harris County. The sources used were from the Harris County GIS, Apartment Data Sources and Enrichment Data.
1. Houston Apartment Association Survey Shortly after Harvey, the Houston Apartment Association with Apartment Data Services conducted a survey of the marketing that revealed concentrations of 60 flooded apartment complexes with 3,221 total damaged units in specific locations across the county, excluding the city of Houston. The results are as follows as seen in Table 14:
Twenty complexes with 1,252 damaged units concentrated along the Cypress Creek floodplain between US-290 Northwest Freeway to Hardy Toll Road.
Seven complexes with 560 damaged units clustered behind the Addicks and Barker Reservoirs.
Eight complexes with 496 damaged units stretched across Deer Park and Pasadena. Six complexes with 276 damaged units concentrated along Greens Bayou.

42
Five complexes with 192 damaged units found in Baytown along Goose Creek and Cedar Bayou.
Two complexes with 150 damaged units clustered in the Cloverleaf area. Three complexes with 89 damaged units stretched along Clear Lake in Friendswood,
Nassau Bay and Webster. Two complexes with 44 damaged units located near Kingwood in Humble and along Lake
Houston Complexes in Bellaire, Missouri City and minor tributaries comprised the remainder.
Table 14: Post-Harvey Apartment Complex Damage in Harris County
According to Map 12, the highest concentration of damaged units can be found in the Greenspoint/Northborough/Aldine areas of Harris County as well as in the I-10 East/Woodforest/Channelview and Clear Lake/Webster/League City.
Location
# of
Apartment
Complexes
# of
Damaged
Units
Along Cypress Creek floodplain between US-290 Northwest Fwy
and Hardy Toll Road 20 1,252
Behind Addicks and Barker Reservoirs 7 560
Across Deer Park and Pasadena 8 496
Along Greens Bayou 6 276
In Baytown along Goose Creek and Cedar Bayou 5 192
Cloverleaf 2 150
Along Clear Lake in Friendswood, Nassau Bay and Webster 3 89
Near Kingwood in Humble and along Lake Houston 2 44
Bellaire, Missouri City and minor tributaries 7 162
Total 60 3,221
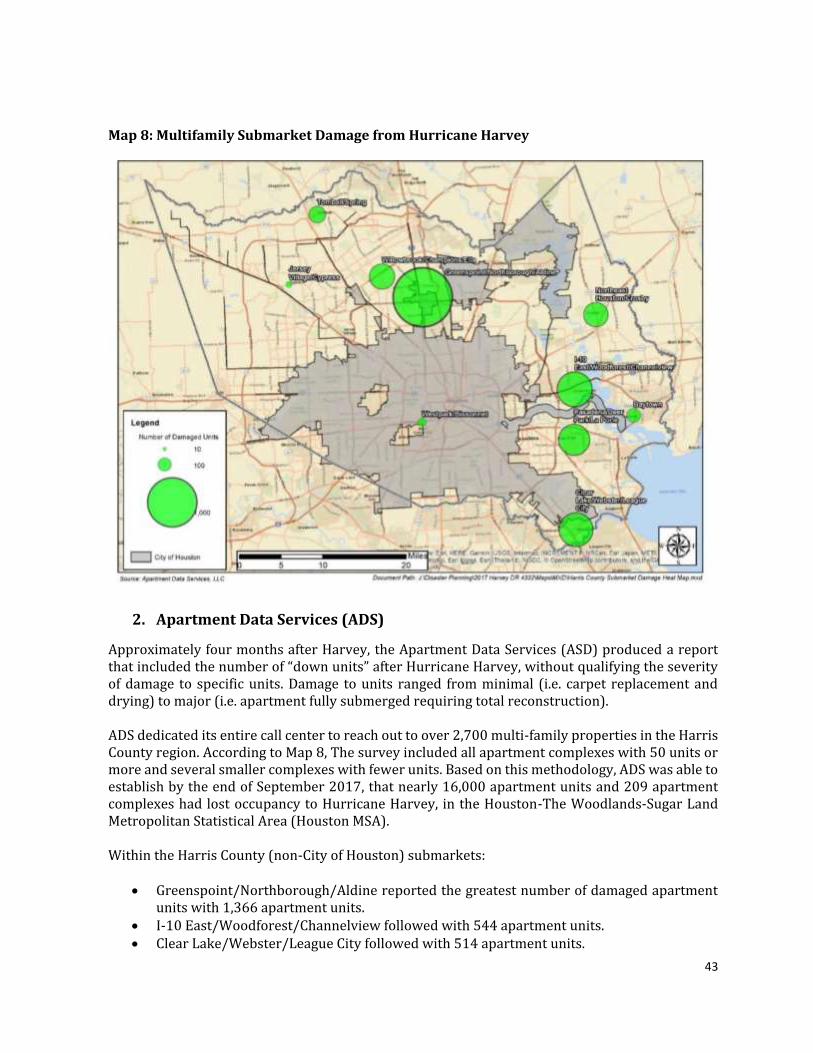
43
Map 8: Multifamily Submarket Damage from Hurricane Harvey
2. Apartment Data Services (ADS)
Approximately four months after Harvey, the Apartment Data Services (ASD) produced a report that included the number of “down units” after Hurricane Harvey, without qualifying the severity of damage to specific units. Damage to units ranged from minimal (i.e. carpet replacement and drying) to major (i.e. apartment fully submerged requiring total reconstruction). ADS dedicated its entire call center to reach out to over 2,700 multi-family properties in the Harris County region. According to Map 8, The survey included all apartment complexes with 50 units or more and several smaller complexes with fewer units. Based on this methodology, ADS was able to establish by the end of September 2017, that nearly 16,000 apartment units and 209 apartment complexes had lost occupancy to Hurricane Harvey, in the Houston-The Woodlands-Sugar Land Metropolitan Statistical Area (Houston MSA). Within the Harris County (non-City of Houston) submarkets:
Greenspoint/Northborough/Aldine reported the greatest number of damaged apartment units with 1,366 apartment units.
I-10 East/Woodforest/Channelview followed with 544 apartment units. Clear Lake/Webster/League City followed with 514 apartment units.

44
Following these submarkets, Pasadena/Deer Park/La Porte reported damage to 441 apartment units, Willowbrook/Champions/Ella reported 312 damaged units, Northeast Houston/Crosby observed damage to 294 units, Tomball/Spring saw damage to 150 units, Baytown reported damage to 112 units, Westpark/Bissonnet stood at 48 damaged apartment units, and Jersey Village/Cypress observed damage to 27 units (Map 9).
However, these trends proved differently from the perspective of the percent of each submarket with damaged apartment units. Though Northeast Houston/Crosby comprises the lowest number of apartment units out of the Harris County (non-City of Houston) submarkets ADS surveyed (3,278 apartment units), it reported the highest percent of apartment units damaged (9.0 percent). Greenspoint/Northborough/Aldine, the next smallest submarket, reported 8.1 percent of its apartment units damaged. The following table and map display additional details on the ADS survey results (Table 15). Table 15: Harris County Region ADS Submarket Data
Submarket Units Damaged
Brookhollow/Northwest Crossing 187 Willowbrook/Champions/Ella 312 Jersey Village/Cypress 127 Bear Creek/Copperfield/Fairfield 488 Katy/Cinco Ranch/Waterside 367 Tomball/Spring 150 I-10 East/Woodforest/Channelview 544 I-69 North 17 Greenspoint/Northborough/Aldine 1,366 Northest Houston /Crosby 294 Beltway 8/I-45 South 354 Pasadena/Deer Park/La Porte 441 Friendswood/Pearland East 154 Clear Lake/Webster/League City 514 Lake Houston/Kingwood 512 Hwy 288 South/Pearland West 100 I-45 South 266 Total 6,193
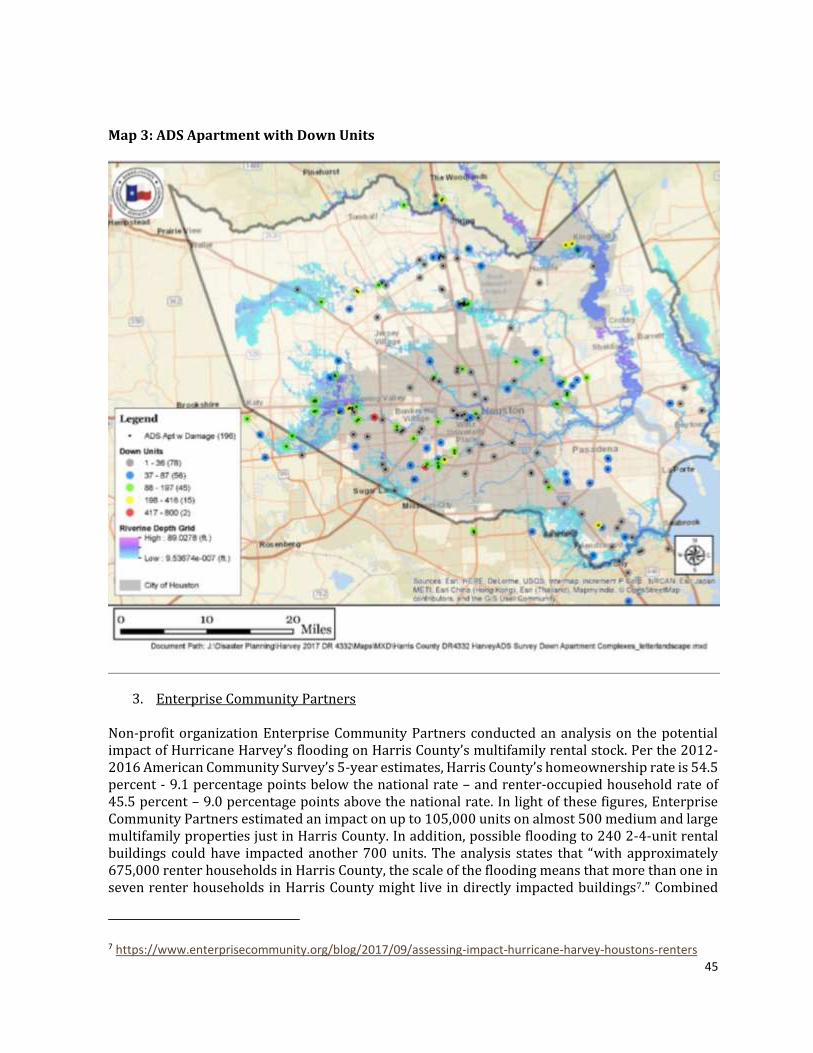
45
Map 3: ADS Apartment with Down Units
3. Enterprise Community Partners Non-profit organization Enterprise Community Partners conducted an analysis on the potential impact of Hurricane Harvey’s flooding on Harris County’s multifamily rental stock. Per the 2012-2016 American Community Survey’s 5-year estimates, Harris County’s homeownership rate is 54.5 percent - 9.1 percentage points below the national rate – and renter-occupied household rate of 45.5 percent – 9.0 percentage points above the national rate. In light of these figures, Enterprise Community Partners estimated an impact on up to 105,000 units on almost 500 medium and large multifamily properties just in Harris County. In addition, possible flooding to 240 2-4-unit rental buildings could have impacted another 700 units. The analysis states that “with approximately 675,000 renter households in Harris County, the scale of the flooding means that more than one in seven renter households in Harris County might live in directly impacted buildings7.” Combined
7 https://www.enterprisecommunity.org/blog/2017/09/assessing-impact-hurricane-harvey-houstons-renters

46
with the impacted 2+-unit rental properties in the neighboring counties of Brazoria, Fort Bend, Galveston, and Montgomery, the total number of potentially impacted 2+-unit rental properties increases to almost 1,000.
Unmet Need Harris County was HUD identified as one of the “most impacted and distressed” areas in the State’s Action Plan and Federal Register, Vol. 83, No. 28, February 9, 2017. This local supplemental action plan primarily considers and addresses unmet housing by allocating 79 percent of CDBG-DR funding to housing related activities. Harris County has developed its program categories based on need and the County’s public consultation process. Housing programs include: homeowner assistance program; buyout/acquisition program; homeowner reimbursement program; a homelessness prevention program; affordable rental program; and single-family new construction program. The programs were developed to meet CDBG-DR, federal and state requirements and regulations, and to implement the long-term recovery of housing as efficiently and expeditiously as possible. It is anticipated that public service type activities may need to be utilized to complement these housing programs. Public service activities may include but not limited to Case management, housing counseling, legal counseling, job training, mental health, and general health services. The majority of the funds have been allocated to assist renters through the affordable rental program (acquisition, rehabilitation, and new construction of affordable rental units) and homeowners through the reimbursement of repairs, rehabilitation and reconstruction of their homes. Funds have been allocated for residential buyouts and acquisition to remove homes from harm’s way and to compliment the removal of unsafe housing the construction of new and the acquisition/rehabilitation of existing single-family housing. Through Harris County’s continued work with homeless populations and in partnership with the Coalition for the Homeless of Houston/Harris County, the county recognizes the need for homeless services to include homelessness prevention and housing of homeless populations. Based on Hurricane Harvey’s impact, homelessness in the county has and will continue to rise without these services, short-term mortgage assistance, utility assistance, and tenant-based rental assistance. Although there are remaining unmet housing needs due to the limitation of funds available, Harris County recognizes that as part of a comprehensive long-term recovery program, the repair and enhancements of local infrastructure and mitigation efforts are crucial components. Infrastructure activities are vital not only for the long-term recovery and restoration of housing but for the long-term recovery, protection, and viability of communities. Especially drainage improvements projects in channels and bayous as well as local neighborhood drainage systems are needed to reduce the flood risk of these areas. Twenty-one (21) percent of the funds will address unmet needs related to infrastructure and economic development. To calculate estimated unmet need, the GLO/Harris County used multipliers provided by HUD. These multipliers are based on the SBA median repair cost for the specific disaster category less the weighted average of expected SBA and FEMA repair costs. Based on FEMA individual assistance data provided to the GLO, the estimated weighted average of expected SBA and FEMA total repair costs for each category is represented in the following table.

47
Table 18: Unmet Need Multiplier by Damage Category
Category Multiplier Amount
Major-Low $58,956
Major-High $72,961
Severe $102,046
A. Owner The FEMA IA data was used to compute all housing applicants impacted by Hurricane Harvey and used to calculate the unmet needs for housing. The unmet need for the LMI population is over $895 million for owners. The unmet need by income category for owner-occupied households for Harris County can be seen in the following Table 19. The following table provides a breakdown of total unmet needs for owner-occupied households. It provides the damage category and the total count and unmet need for those three categories as previously defined. Table 19: Category of Unmet Needs by Owner-Occupied in Harris County (outside city of Houston)
Damage Category/
Multiplier
Total Count Owner-Occupied
Count with Unmet
Need
Total Owner Occupied Unmet
Needs
Major-Low: $58,956 12,587 9,551 $563,088,756
Major-High: $72,961 14,980 10,415 $759,888,815
Severe: $102,046 5,121 3,982 $406,347,172
Totals 32,688 23,948 $1,729,324,743
HUD requirements for this CDBG-DR allocation specify that the GLO and thus Harris County must expend a minimum of 70 percent to benefit LMI populations. In Harris County, approximately 59.8 percent of the unmet need population is below 80 percent in the LMI category. The unmet need by income category for Harris County can be seen in the following Table 20. Table 20. Owner Unmet Need by Income Category in Harris County (outside the city of Houston)
Income Category Count Unmet Need % of Count % of Unmet Need

48
0-30% 5,922 $ 425,034,847 24.7% 24.6%
31-50% 2,805 $ 197,603,740 11.7% 11.4%
51-80% 3,838 $ 272,585,298 16.0% 15.8%
Not LMI 11,383 $ 834,100,858 47.5% 48.2%
Not Reported 0 0 0 0
Totals 23,948 $ 1,729,324,743 100.0% 100.0%
Only the most impacted homes will be included to calculate unmet needs. Home are determined most impacted if they have a real property damage of $8,000 or more. The following criteria was used to calculate real property damage.
Owner-occupied Homes
To calculate the level of real property damage for owner-occupied homes, the following criteria was used: Major-Low: $8,000 to $14,999 of FEMA verified loss. Major-High: $15,000 to $28,800 of FEMA verified loss. Severe: Greater than $28,800 of FEMA verified loss.
Owners in a Floodplain with No Flood Insurance Low- to Moderate-income applicants in Harris County comprise 65.1 percent of the total owners with unmet needs in a floodplain with no flood insurance. Whereas those over 120 percent of AMI are 20.8 percent of the total owners with unmet needs in a floodplain with no flood insurance (Table 21). Table 21: Owners in a Floodplain with No Flood Insurance by Income Category in Harris County (outside city of Houston)
Income Category Count % of Count
0-30% 1,320 32.0%
31-50% 678 16.4%
51-80% 690 16.7%
81-120% 579 14.0%
Over 120% 859 20.8%
Not Reported 0 0%
Totals 4,126 100.0%

49
B. Renter The following table provides a breakdown of total unmet needs for renter-occupied households. It provides the damage category and the total count and unmet need for those three categories as previously defined.
Table 22: Category of Unmet Needs by Owner-Occupied and Renters in Harris County (outside city of Houston) Damage Category/
Multiplier
Total Count Rental Count Total Rental Unmet
Needs
Major-Low: $58,956 12,587 3,036 $178,990,416
Major-High: $72,961 14,980 4,565 $333,066,965
Severe: $102,046 5,121 1,139 $116,230,394
Totals 32,688 8,740 $628,287,775
Rental units are determined to the most impacted if they have a real property damage of $2,000 or more. The following criteria was used to calculate real property damage. Renter-occupied Homes To calculate the level of personal property damage for renters, the following criteria was used:
Major-Low: $2,000 to $3,499 of FEMA verified loss. Major-High: $3,500 to $7,499 of FEMA verified loss. Severe: Greater than $7,500 of FEMA verified loss.
In Harris County, approximately 79.7 percent of the unmet need based on FEMA IA is below 80
percent LMI category. The unmet need for the LMI population is over $500 million for renters. The
unmet need by income category for renters in Harris County can be seen in the following Table 23.
Table 23. Renter Unmet Need by Income Category in Harris County (outside the city of Houston)
Income Category Count Unmet Need % of Count % of Unmet Need
0-30% 3,660 $ 261,132,550 41.9% 41.6%
31-50% 1,693 $ 122,147,793 19.4% 19.4%
51-80% 1,614 $ 116,878,379 18.5% 18.6%
Not LMI 1,773 $ 128,129,053 20.3% 20.4%
Not Reported 0 0 0 0
Totals 8,740 $ 628,287,775 100.0% 100.0%

50
C. Other A summary of Harris County’s unmet need is identified in the table below. As required a needs assessment was completed to identify long-term needs and priorities for CDBG-DR funding allocated as a result of Hurricane Harvey. The assessment takes into account a comprehensive set of data sources that cover multiple geographies and sectors. The needs assessment includes specific details about unmet needs within the eligible and most impacted and distressed communities, and includes details for housing, infrastructure, and economic revitalization. The needs assessment is expected to be amended as additional information is available or updated. Table 24: Harris County Summary of Total Unmet Need
Category Losses/Gap CDBG-DR
Investments*
Other Known
Investments
Remaining Unmet
Need
Housing $7,458,498,829 $837,097,816 $3,671,644,866 $2,949,756,147
Owner-Occupied Housing $1,729,324,743
Residential Property
Insurance/TX Windstorm 1,644,387,050 $1,411,214,085
National Flood Insurance
Program $1,894,715,877 $1,894,715,877
Other Housing and Disaster
Related Expenses $760,850,000 $65,000,000
Rental-occupied Housing $628,287,775
Public Housing Authority
Housing $933,384 $714,904
Harris County Buyout
Program (Pub L. 115-31) $800,000,000 $300,000,000
Infrastructure $10,868,969,302 $222,519,672 $698,910,323 $9,947,539,307
FEMA Public Assistance $868,774,302 $679,910,323
Rebuild Texas $10,000,195,000 $19,000,000
Grand Total (Housing and
Infrastructure) $18,327,468,131 $1,059,617,488 $4,370,555,189 $12,897,295,454
Vulnerable Populations
Harris County’s vulnerable populations can be classified into the following categories: Low-to-Moderate Income (LMI), Limited English Proficiency (LEP), Minority, Senior (60+), Access Functional Needs (AFN) and Homeless. Harris County will promote housing for vulnerable populations, including a description of activities that will address the following: housing for homeless and those at-risk of homelessness; the prevention of low-income individuals and families with children (especially those with incomes below 30 percent of the area median) from becoming homeless; the special needs of persons who are not homeless but require supportive housing (e.g., elderly, persons with disabilities, persons
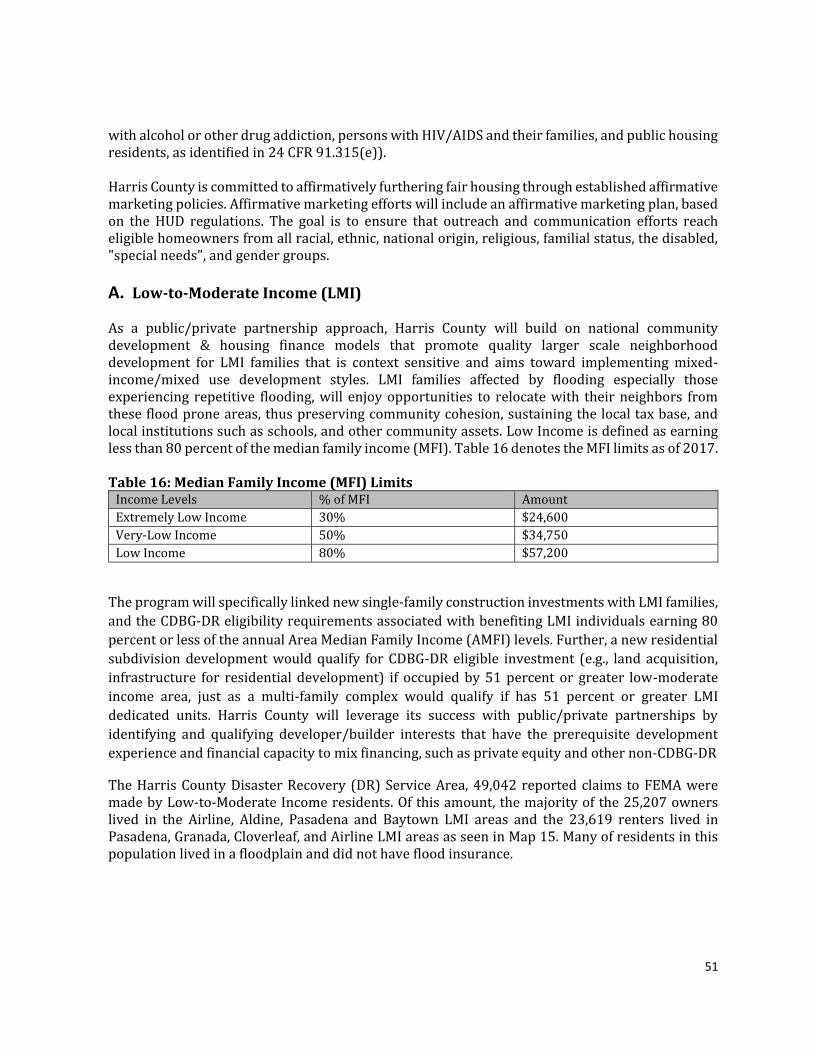
51
with alcohol or other drug addiction, persons with HIV/AIDS and their families, and public housing residents, as identified in 24 CFR 91.315(e)). Harris County is committed to affirmatively furthering fair housing through established affirmative marketing policies. Affirmative marketing efforts will include an affirmative marketing plan, based on the HUD regulations. The goal is to ensure that outreach and communication efforts reach eligible homeowners from all racial, ethnic, national origin, religious, familial status, the disabled, "special needs", and gender groups.
A. Low-to-Moderate Income (LMI) As a public/private partnership approach, Harris County will build on national community development & housing finance models that promote quality larger scale neighborhood development for LMI families that is context sensitive and aims toward implementing mixed-income/mixed use development styles. LMI families affected by flooding especially those experiencing repetitive flooding, will enjoy opportunities to relocate with their neighbors from these flood prone areas, thus preserving community cohesion, sustaining the local tax base, and local institutions such as schools, and other community assets. Low Income is defined as earning less than 80 percent of the median family income (MFI). Table 16 denotes the MFI limits as of 2017. Table 16: Median Family Income (MFI) Limits
Income Levels % of MFI Amount
Extremely Low Income 30% $24,600
Very-Low Income 50% $34,750
Low Income 80% $57,200
The program will specifically linked new single-family construction investments with LMI families,
and the CDBG-DR eligibility requirements associated with benefiting LMI individuals earning 80
percent or less of the annual Area Median Family Income (AMFI) levels. Further, a new residential
subdivision development would qualify for CDBG-DR eligible investment (e.g., land acquisition,
infrastructure for residential development) if occupied by 51 percent or greater low-moderate
income area, just as a multi-family complex would qualify if has 51 percent or greater LMI
dedicated units. Harris County will leverage its success with public/private partnerships by
identifying and qualifying developer/builder interests that have the prerequisite development
experience and financial capacity to mix financing, such as private equity and other non-CDBG-DR
The Harris County Disaster Recovery (DR) Service Area, 49,042 reported claims to FEMA were made by Low-to-Moderate Income residents. Of this amount, the majority of the 25,207 owners lived in the Airline, Aldine, Pasadena and Baytown LMI areas and the 23,619 renters lived in Pasadena, Granada, Cloverleaf, and Airline LMI areas as seen in Map 15. Many of residents in this population lived in a floodplain and did not have flood insurance.

52
Map 15: LMI Areas in Harris County with FEMA Reported Damage Points
B. Limited English-Proficiency LEP
According to the US Census Bureau, 9.7 percent of Harris County’s population has a Limited
English-Proficiency (LEP). The categories are individuals that do not speak English language as
their first language or have a limited ability to understand it and are especially vulnerable during
disasters. The household language categories are: Hispanic with 149,362 households, other Indo-
European languages with 7,432 households, Asian and Pacific Island languages had 20,987
households and 3,392 households spoke other languages.
Many limited English proficiency households were also impacted by Harvey and a great number may lack access to the plans for recovery in their communities. As seen in Map 16 are the locations in Harris County of concentrations of LEP households. In Harris County Disaster Recovery (DR) Service Area there were 9,770 registrants that applied for FEMA assistance in the areas that had a LEP concentration of 33.4 percent or more of the population. The most concentrated damage areas were located in the Airline and Aldine target areas. Of the 9,770 FEMA registrants in the high LEP concentrated areas 5,593 were owners and 4,123 were renters (Map 12).

53
Map 16: LEP Concentrations in Harris County, with Engineering Reported Damage Points
C. Minority Concentration
In Harris County, 68.8 percent of the population live in minority concentrated areas. Growth in minority groups was a key factor in overall population growth of Harris County. According to 2016 census, the minority population (that is, everyone except persons who identified themselves as “White, Not Hispanic or Latino”) represented about 2/3 of the Harris County population. Map 16 displays the areas of minority concentration throughout the Harris County Disaster Recovery (DR) Service Area. There were 86,667 registrants that applied for FEMA assistance in the minority concentration areas. Of that amount, 47,115 were owners and 39,221 were renters. The highest concentration of owners lived in the Airline, Aldine, Pasadena and Copperfield LMI and the highest concentration of renters lived in the Granada, Copperfield, Pasadena and Alief LMI areas as seen in Map 17.

54
Map 17: FEMA damaged units compared to Minority Concentration areas
D. Seniors It should be noted that the FEMA IA for Harris County (outside the city of Houston) listed only 4,460 total applicants who were age 60 and over with only 958 applicants with a FVL over $0 and who received some FEMA assistance. Harris County has more than 300,000 residents over the age of 60. Harris County believes based on anecdotal accounts of canvassers, case management agencies, and rebuilding organizations that the FEMA numbers for seniors, who had a FVL over $0 and received some assistance, significantly underestimate the unmet needs of seniors in Harris County. As seen in Map 18, the concentration of FEMA registrants age 60 and over lived in Pasadena, Baytown, Westborough, and the Cypress areas.

55
Map 18: Harris County’s Senior Concentration based on age 60+
E. Access and functional needs (AFN) Access and functional needs (AFN) describes those in the population that have a disability without labeling them as disabled and are not separated from their support services required for daily community participation. Over 11,000 FEMA registered applicants reported having a household with someone needing assistance. During disasters, this group of individuals can be accommodated in shelters with the general population, provided they have the necessary support. As seen in Map 19, the correlation between the areas with higher damage densities and moderate AFN areas can be seen in the Cloverleaf, Airline, Pasadena, Bough-Lincoln Green, and Kleinwood LMI areas.
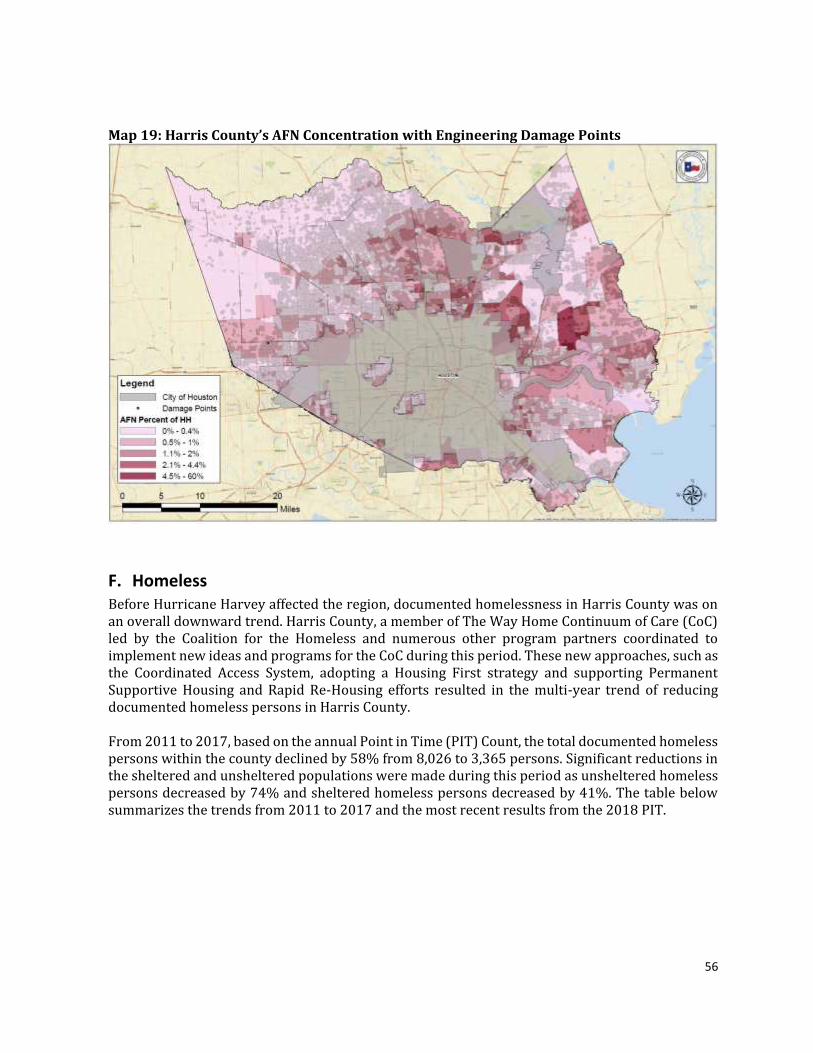
56
Map 19: Harris County’s AFN Concentration with Engineering Damage Points
F. Homeless Before Hurricane Harvey affected the region, documented homelessness in Harris County was on an overall downward trend. Harris County, a member of The Way Home Continuum of Care (CoC) led by the Coalition for the Homeless and numerous other program partners coordinated to implement new ideas and programs for the CoC during this period. These new approaches, such as the Coordinated Access System, adopting a Housing First strategy and supporting Permanent Supportive Housing and Rapid Re-Housing efforts resulted in the multi-year trend of reducing documented homeless persons in Harris County. From 2011 to 2017, based on the annual Point in Time (PIT) Count, the total documented homeless persons within the county declined by 58% from 8,026 to 3,365 persons. Significant reductions in the sheltered and unsheltered populations were made during this period as unsheltered homeless persons decreased by 74% and sheltered homeless persons decreased by 41%. The table below summarizes the trends from 2011 to 2017 and the most recent results from the 2018 PIT.
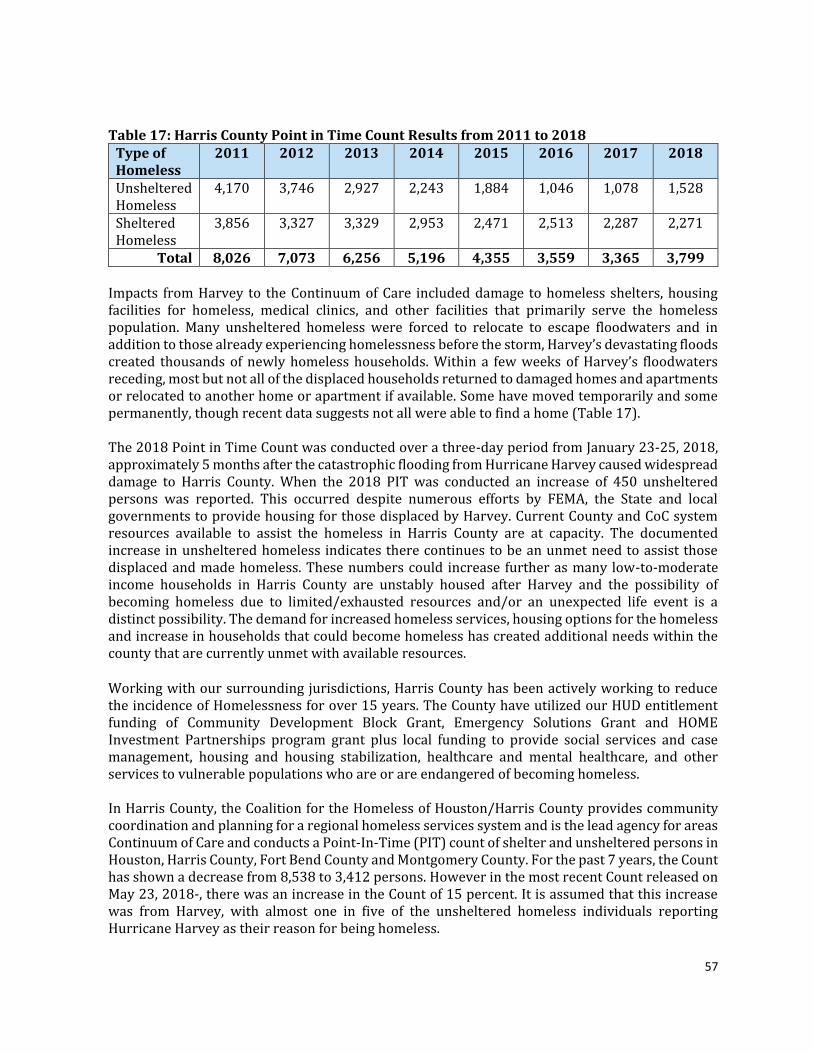
57
Table 17: Harris County Point in Time Count Results from 2011 to 2018 Type of Homeless
2011 2012 2013 2014 2015 2016 2017 2018
Unsheltered Homeless
4,170 3,746 2,927 2,243 1,884 1,046 1,078 1,528
Sheltered Homeless
3,856 3,327 3,329 2,953 2,471 2,513 2,287 2,271
Total 8,026 7,073 6,256 5,196 4,355 3,559 3,365 3,799 Impacts from Harvey to the Continuum of Care included damage to homeless shelters, housing facilities for homeless, medical clinics, and other facilities that primarily serve the homeless population. Many unsheltered homeless were forced to relocate to escape floodwaters and in addition to those already experiencing homelessness before the storm, Harvey’s devastating floods created thousands of newly homeless households. Within a few weeks of Harvey’s floodwaters receding, most but not all of the displaced households returned to damaged homes and apartments or relocated to another home or apartment if available. Some have moved temporarily and some permanently, though recent data suggests not all were able to find a home (Table 17). The 2018 Point in Time Count was conducted over a three-day period from January 23-25, 2018, approximately 5 months after the catastrophic flooding from Hurricane Harvey caused widespread damage to Harris County. When the 2018 PIT was conducted an increase of 450 unsheltered persons was reported. This occurred despite numerous efforts by FEMA, the State and local governments to provide housing for those displaced by Harvey. Current County and CoC system resources available to assist the homeless in Harris County are at capacity. The documented increase in unsheltered homeless indicates there continues to be an unmet need to assist those displaced and made homeless. These numbers could increase further as many low-to-moderate income households in Harris County are unstably housed after Harvey and the possibility of becoming homeless due to limited/exhausted resources and/or an unexpected life event is a distinct possibility. The demand for increased homeless services, housing options for the homeless and increase in households that could become homeless has created additional needs within the county that are currently unmet with available resources. Working with our surrounding jurisdictions, Harris County has been actively working to reduce the incidence of Homelessness for over 15 years. The County have utilized our HUD entitlement funding of Community Development Block Grant, Emergency Solutions Grant and HOME Investment Partnerships program grant plus local funding to provide social services and case management, housing and housing stabilization, healthcare and mental healthcare, and other services to vulnerable populations who are or are endangered of becoming homeless. In Harris County, the Coalition for the Homeless of Houston/Harris County provides community coordination and planning for a regional homeless services system and is the lead agency for areas Continuum of Care and conducts a Point-In-Time (PIT) count of shelter and unsheltered persons in Houston, Harris County, Fort Bend County and Montgomery County. For the past 7 years, the Count has shown a decrease from 8,538 to 3,412 persons. However in the most recent Count released on May 23, 2018-, there was an increase in the Count of 15 percent. It is assumed that this increase was from Harvey, with almost one in five of the unsheltered homeless individuals reporting Hurricane Harvey as their reason for being homeless.

58
As a part of the closing of the NRG and George R. Brown shelters, the Coalition, City of Houston, and Harris County worked with FEMA to create a non-congregant shelter program, which assisted those families and individual who did not have the resources to leave the shelter unaided by temporary shelter assistance. This population included families with children, elderly persons, couples and single individuals – many of whom had special needs including chronic health conditions, mobility limitations, and mental illness. Based on preliminary information, most shelter guests are low or very-low income. At the Non-congregant Shelter program’s height, there were approximately 500 households in the program that received rental assistance and case management. Currently, roughly 200 households are still enrolled and benefiting from case management services.

59
Section 3
Non-Housing Infrastructure
1. Governor’s Commission to Rebuild Texas Texas infrastructure all along the Gulf Coast was affected by Hurricane Harvey. This event caused damage to roadways, bridges, sections of the coastline, and many other infrastructure systems still being determined. Governor Greg Abbott established the Governor’s Commission to Rebuild Texas (the Commission) in the immediate aftermath of Hurricane Harvey for the swift and effective restoration of damaged public infrastructure throughout disaster impacted areas. As stated in the Governor’s Proclamation on September 7, 2017, for the establishment of the Commission, the effective restoration of damaged public infrastructure throughout the disaster area is of paramount importance to the Texas economy and to the people of Texas who live and work in the communities affected by Hurricane Harvey. The Commission will assist local governmental entities and nonprofit organizations to assess and identify rebuilding needs and to navigate state and federal resources available for the rebuilding effort. The Commission will advocate for the interests of state and local governments on matters related to disaster response and provide expertise and assistance to local governmental entities and nonprofit organizations throughout the rebuilding process.8 The “October 31, 2017, Request for Federal Assistance Critical Infrastructure Projects" reported $61 billion in projects identified at state and local levels. This amount does not include current FEMA expenditures or CDBG-DR housing allocations. The $61 billion was compiled based on information available in September and October from impacted communities that identified and prioritized their needs. This amount is expected to increase as more information becomes available. The types of identified projects include restoration and mitigation projects for roads, bridges, schools, government buildings, public facilities, as well as projects to protect coastal infrastructure,
8 RebuildTexas: The Governor’s Commission to Rebuild Texas. “Proclamation.” Webpage assessed January 10, 2018. https://www.rebuildtexas.today/proclamation/
Flooding in North Harris County during
Hurricane Harvey
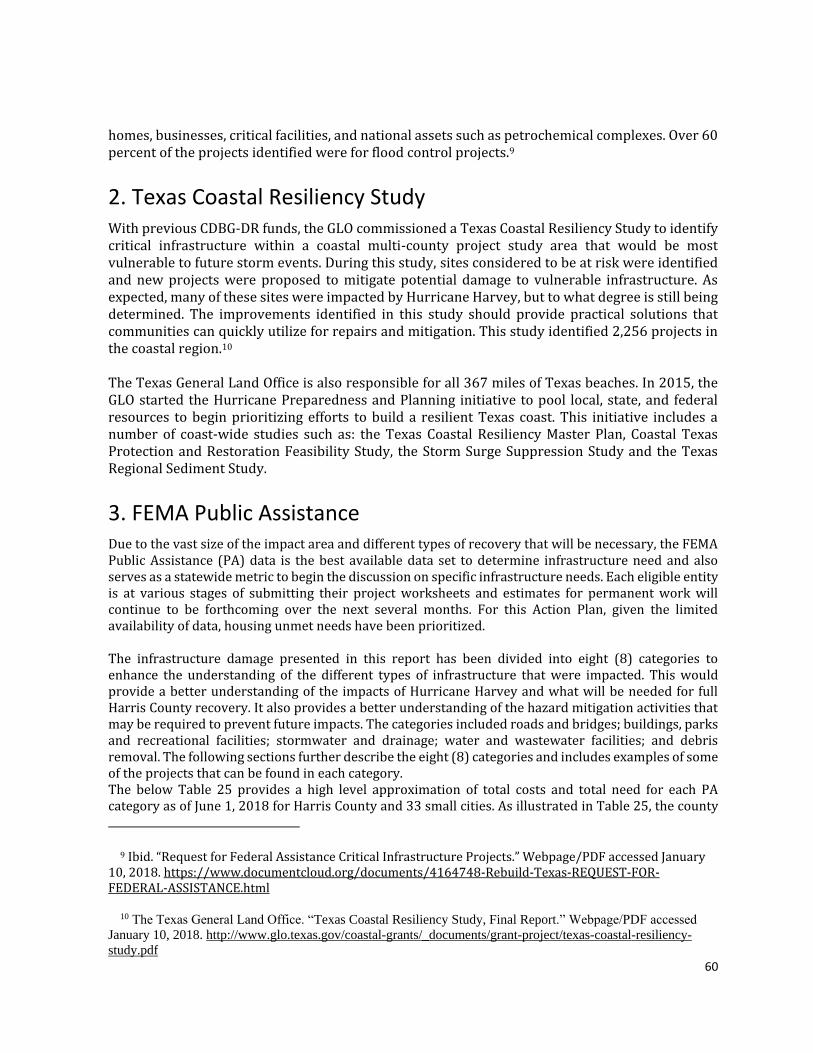
60
homes, businesses, critical facilities, and national assets such as petrochemical complexes. Over 60 percent of the projects identified were for flood control projects.9
2. Texas Coastal Resiliency Study With previous CDBG-DR funds, the GLO commissioned a Texas Coastal Resiliency Study to identify critical infrastructure within a coastal multi-county project study area that would be most vulnerable to future storm events. During this study, sites considered to be at risk were identified and new projects were proposed to mitigate potential damage to vulnerable infrastructure. As expected, many of these sites were impacted by Hurricane Harvey, but to what degree is still being determined. The improvements identified in this study should provide practical solutions that communities can quickly utilize for repairs and mitigation. This study identified 2,256 projects in the coastal region.10 The Texas General Land Office is also responsible for all 367 miles of Texas beaches. In 2015, the GLO started the Hurricane Preparedness and Planning initiative to pool local, state, and federal resources to begin prioritizing efforts to build a resilient Texas coast. This initiative includes a number of coast-wide studies such as: the Texas Coastal Resiliency Master Plan, Coastal Texas Protection and Restoration Feasibility Study, the Storm Surge Suppression Study and the Texas Regional Sediment Study.
3. FEMA Public Assistance Due to the vast size of the impact area and different types of recovery that will be necessary, the FEMA Public Assistance (PA) data is the best available data set to determine infrastructure need and also serves as a statewide metric to begin the discussion on specific infrastructure needs. Each eligible entity is at various stages of submitting their project worksheets and estimates for permanent work will continue to be forthcoming over the next several months. For this Action Plan, given the limited availability of data, housing unmet needs have been prioritized. The infrastructure damage presented in this report has been divided into eight (8) categories to enhance the understanding of the different types of infrastructure that were impacted. This would provide a better understanding of the impacts of Hurricane Harvey and what will be needed for full Harris County recovery. It also provides a better understanding of the hazard mitigation activities that may be required to prevent future impacts. The categories included roads and bridges; buildings, parks and recreational facilities; stormwater and drainage; water and wastewater facilities; and debris removal. The following sections further describe the eight (8) categories and includes examples of some of the projects that can be found in each category. The below Table 25 provides a high level approximation of total costs and total need for each PA category as of June 1, 2018 for Harris County and 33 small cities. As illustrated in Table 25, the county
9 Ibid. “Request for Federal Assistance Critical Infrastructure Projects.” Webpage/PDF accessed January 10, 2018. https://www.documentcloud.org/documents/4164748-Rebuild-Texas-REQUEST-FOR-FEDERAL-ASSISTANCE.html
10 The Texas General Land Office. “Texas Coastal Resiliency Study, Final Report.” Webpage/PDF accessed
January 10, 2018. http://www.glo.texas.gov/coastal-grants/_documents/grant-project/texas-coastal-resiliency-
study.pdf

61
has an overall PA need of over $191 million. The categories with the highest total need are Buildings and Equipment then Emergency Protective Measures showing a total PA need for the County. It should be noted that PA project worksheets are still under development by the local jurisdictions and under review by FEMA and TDEM. These amounts are expected to increase. Table 25: Total Cost and Need by PA Category in Harris County
PA Category Approx. PA Cost 10% Local Match
15% Resiliency on Approx. Cost
Total Need (Local Match +
Resiliency) (49 Counties)
A - Debris Removal
$65,629,614.39 $6,562,961.44 $9,844,442.16 $16,407,403.60
B - Emergency Protective Measures
$200,492,321.33 $20,049,232.13 $30,073,848.20 $50,123,080.33
C - Roads and Bridges
$10,836,227.44 $1,083,622.74 $1,625,434.12 $2,709,056.86
D - Water Control Facilities
$72,069,272.47 $7,206,927.25 $10,810,390.87 $18,017,318.12
E - Buildings and Equipment
$339,883,959.96 $33,988,396.00 $50,982,593.99 $84,970,989.99
F - Utilities $30,061,407.49 $3,006,140.75 $4,509,211.12 $7,515,351.87
G - Parks, Recreational
Facilities, and Other Items
$7,419,760.39 $3,741,976.04 $5,612,964.06 $9,354,940.10
Z - Direct Administrative
Costs $9,184,044.43 $918,404.44 $1,377,606.66 $2,296,011.11
Grand Total $735,576,607.90 $76,557,660.79 $114,836,491.18 $191,394,151.98
(A) Debris Removal – includes removal of debris that occurred immediately after the storm.
(B) Emergency Protective Measures – including activities to eliminate or reduce an
immediate threat to life, public health or safety, or significant damage to improved public
or private property.
(C) Roads and Bridges – includes all roads and bridges throughout unincorporated Harris
County and the cooperative cities. This includes port facilities and similar facilities that
may be under the jurisdiction of FHWA. Both local roads and FHWA funded roads are
included; however, funding for 100% FHWA funded roads are assumed as an unmet need.
(D) Water Control Facilities - Flood Control/Stormwater – this includes all infrastructure
dealing with stormwater management and flood control such as drainage canals, ditches,
culverts, stormwater pipes, etc.

62
(E) Buildings and Equipment - includes publicly owned buildings such as City Departments,
Fire Stations, Police Stations, Call Centers, Emergency Operations Centers, Community
Centers, etc.
(F) Public Utilities – this includes power generation facilities, natural gas, infrastructure
dealing with water production, treatment, and delivery and infrastructure dealing with
wastewater collection and treatment
(G) Parks, Recreational Facilities, and Other Items – this includes all parks and recreational
facilities.
The following Map 20 gives a high-level snapshot of each counties preliminary PA need. Harris County demonstrates the highest need with a total of more than $6.4 billion dollars, or over 95% of the total need for all 49 counties. This can be attributed to a variety of factors, including the significant impact to roads and bridges across Harris County, primarily in the City of Houston. Other counties with high PA needs are Jefferson ($63 million), Fort Bend ($35 million), and Aransas ($22 million). Map 20: Total Public Assistance Need by County
4. Drainage and Water Control The Harris County Flood Control District is a special purpose District created by the Texas legislature in 1937 after community leaders petitioned for assistance in response to devastating floods in 1929 and 1935. Since its creation, the District has successfully partnered with the U.S.

63
Army Corps of Engineers on many projects, and through the years, the District's partnerships and capabilities have expanded significantly. The District was originally given the responsibility of overseeing rivers, streams, tributaries and flood waters in Harris County "for domestic, municipal, flood control, irrigation and other useful purposes." Additionally, the District was responsible for the reclamation and drainage of the overflow land of Harris County, the conservation of forests, and for keeping navigable waters "navigable" by regulating the stormwater that flowed into them. Through the years, the District's roles and responsibilities have become much more complex, but our mission remains simple: Provide flood damage reduction projects that work, with appropriate regard for community and natural values. Flood damage reduction is accomplished by: 1) Devising the flood damage reduction plans; 2) Implementing the plans; and 3) Maintaining the infrastructure11. Disastrous flooding occurred on many of the watersheds in Harris County. Historical records held by previous massive floods in October 1994, Tropical Storm Allison, and April 2016 (Tax Day) were exceeded by Harvey at many locations. Based on house flooding assessments, the estimated total number of homes flooded within Harris County is 154,170. The Table 26 below indicates the number of flooded homes broken down by various watersheds and tributaries across Harris County. Table 26: Harris County Number Homes Flooded by Watershed
Watershed
# Homes Flooded
Watershed
# Homes Flooded
Brays Bayou 23,810 Willow Waterhole 2,940
Buffalo Bayou 17,090 Vince Bayou 2,720
Greens Bayou 12,900 Ship Channel 2,370
Halls Bayou 11,830 Cedar Bayou 2,200
Cypress Creek 8,750 Barker Reservoir 1,910
Berry Bayou 8,510 Spring Gully & Goose Creek 1,890
White Oak Bayou 7,830 San Jacinto River (East Fork) 1,280
Hunting Bayou 7,420 San Jacinto River (Main Stem) 850
Turkey Creek & Mud Gully 6,500 Little Cypress Creek 700
Sims Bayou 6,370 Spring Creek 510
Addicks Reservoir 6,010 Galveston Bay 490
11 https://www.hcfcd.org/hurricane-harvey/hurricane-harvey-faqs/
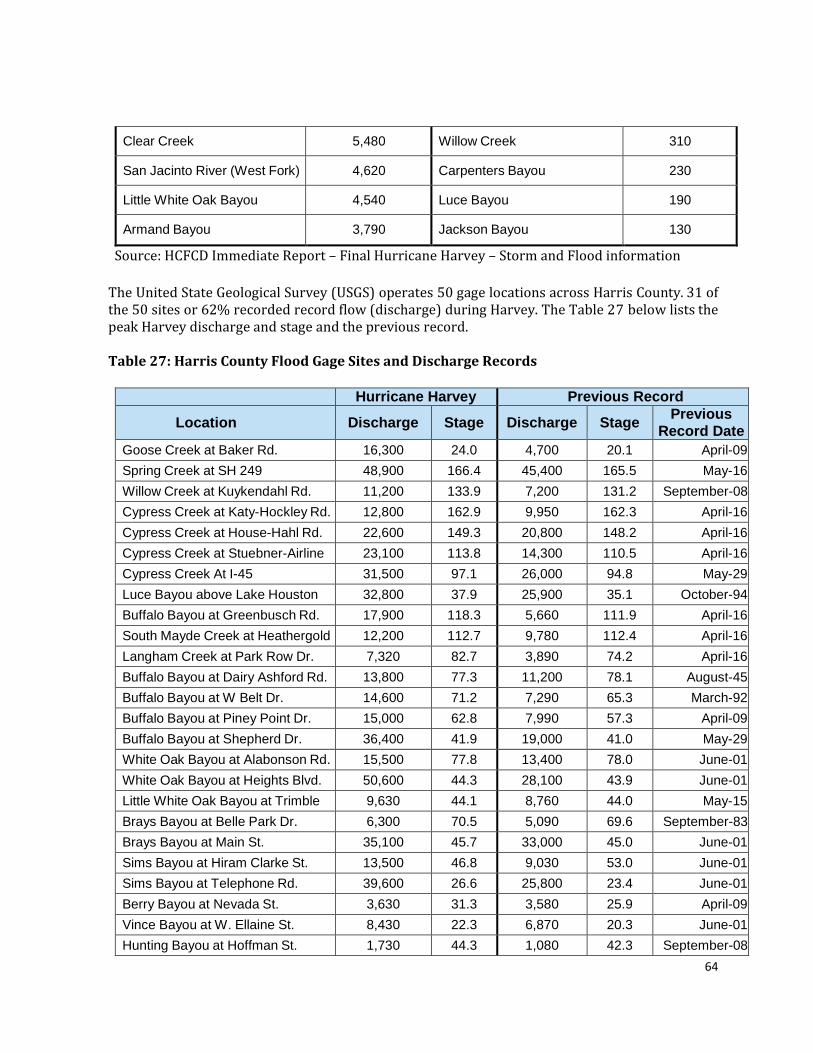
64
Clear Creek 5,480 Willow Creek 310
San Jacinto River (West Fork) 4,620 Carpenters Bayou 230
Little White Oak Bayou 4,540 Luce Bayou 190
Armand Bayou 3,790 Jackson Bayou 130
Source: HCFCD Immediate Report – Final Hurricane Harvey – Storm and Flood information
The United State Geological Survey (USGS) operates 50 gage locations across Harris County. 31 of the 50 sites or 62% recorded record flow (discharge) during Harvey. The Table 27 below lists the peak Harvey discharge and stage and the previous record. Table 27: Harris County Flood Gage Sites and Discharge Records
Hurricane Harvey Previous Record
Location
Discharge
Stage
Discharge
Stage Previous
Record Date
Goose Creek at Baker Rd. 16,300 24.0 4,700 20.1 April-09
Spring Creek at SH 249 48,900 166.4 45,400 165.5 May-16
Willow Creek at Kuykendahl Rd. 11,200 133.9 7,200 131.2 September-08
Cypress Creek at Katy-Hockley Rd. 12,800 162.9 9,950 162.3 April-16
Cypress Creek at House-Hahl Rd. 22,600 149.3 20,800 148.2 April-16
Cypress Creek at Stuebner-Airline Rd.
23,100 113.8 14,300 110.5 April-16
Cypress Creek At I-45 31,500 97.1 26,000 94.8 May-29
Luce Bayou above Lake Houston 32,800 37.9 25,900 35.1 October-94
Buffalo Bayou at Greenbusch Rd. 17,900 118.3 5,660 111.9 April-16
South Mayde Creek at Heathergold Dr.
12,200 112.7 9,780 112.4 April-16
Langham Creek at Park Row Dr. 7,320 82.7 3,890 74.2 April-16
Buffalo Bayou at Dairy Ashford Rd. 13,800 77.3 11,200 78.1 August-45
Buffalo Bayou at W Belt Dr. 14,600 71.2 7,290 65.3 March-92
Buffalo Bayou at Piney Point Dr. 15,000 62.8 7,990 57.3 April-09
Buffalo Bayou at Shepherd Dr. 36,400 41.9 19,000 41.0 May-29
White Oak Bayou at Alabonson Rd. 15,500 77.8 13,400 78.0 June-01
White Oak Bayou at Heights Blvd. 50,600 44.3 28,100 43.9 June-01
Little White Oak Bayou at Trimble St.
9,630 44.1 8,760 44.0 May-15
Brays Bayou at Belle Park Dr. 6,300 70.5 5,090 69.6 September-83
Brays Bayou at Main St. 35,100 45.7 33,000 45.0 June-01
Sims Bayou at Hiram Clarke St. 13,500 46.8 9,030 53.0 June-01
Sims Bayou at Telephone Rd. 39,600 26.6 25,800 23.4 June-01
Berry Bayou at Nevada St. 3,630 31.3 3,580 25.9 April-09
Vince Bayou at W. Ellaine St. 8,430 22.3 6,870 20.3 June-01
Hunting Bayou at Hoffman St. 1,730 44.3 1,080 42.3 September-08
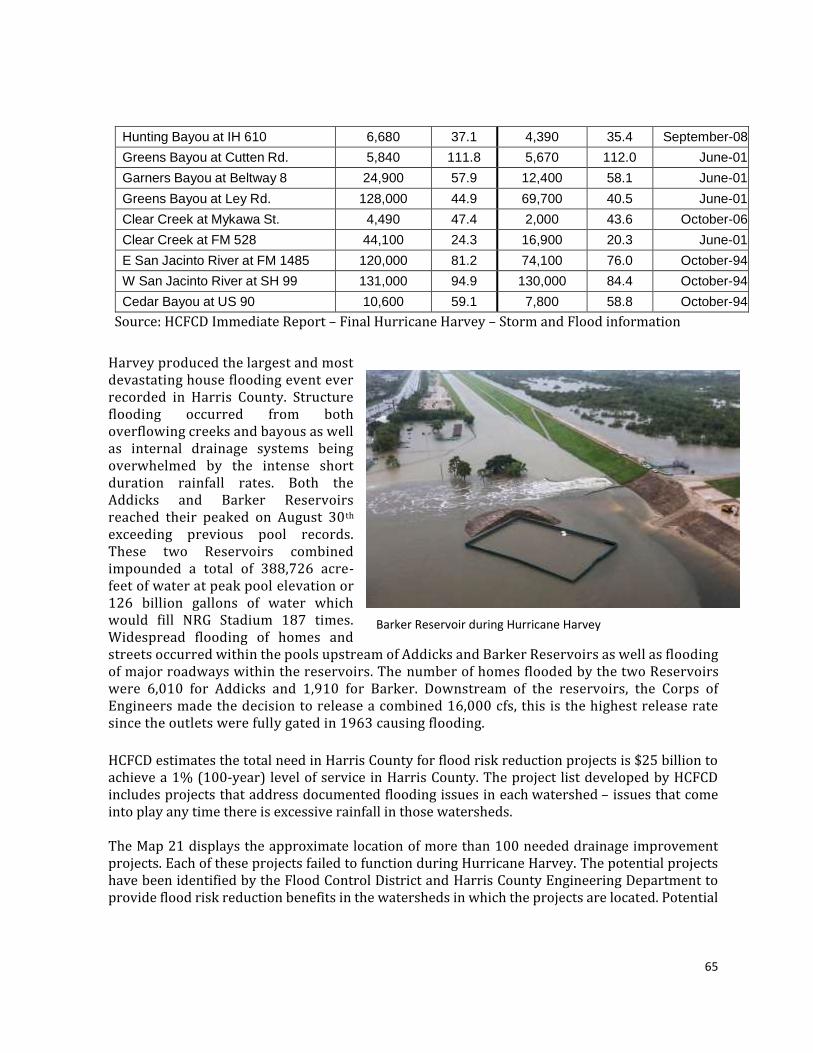
65
Hunting Bayou at IH 610 6,680 37.1 4,390 35.4 September-08
Greens Bayou at Cutten Rd. 5,840 111.8 5,670 112.0 June-01
Garners Bayou at Beltway 8 24,900 57.9 12,400 58.1 June-01
Greens Bayou at Ley Rd. 128,000 44.9 69,700 40.5 June-01
Clear Creek at Mykawa St. 4,490 47.4 2,000 43.6 October-06
Clear Creek at FM 528 44,100 24.3 16,900 20.3 June-01
E San Jacinto River at FM 1485 120,000 81.2 74,100 76.0 October-94
W San Jacinto River at SH 99 131,000 94.9 130,000 84.4 October-94
Cedar Bayou at US 90 10,600 59.1 7,800 58.8 October-94
Source: HCFCD Immediate Report – Final Hurricane Harvey – Storm and Flood information
Harvey produced the largest and most devastating house flooding event ever recorded in Harris County. Structure flooding occurred from both overflowing creeks and bayous as well as internal drainage systems being overwhelmed by the intense short duration rainfall rates. Both the Addicks and Barker Reservoirs reached their peaked on August 30th exceeding previous pool records. These two Reservoirs combined impounded a total of 388,726 acre-feet of water at peak pool elevation or 126 billion gallons of water which would fill NRG Stadium 187 times. Widespread flooding of homes and streets occurred within the pools upstream of Addicks and Barker Reservoirs as well as flooding of major roadways within the reservoirs. The number of homes flooded by the two Reservoirs were 6,010 for Addicks and 1,910 for Barker. Downstream of the reservoirs, the Corps of Engineers made the decision to release a combined 16,000 cfs, this is the highest release rate since the outlets were fully gated in 1963 causing flooding.
HCFCD estimates the total need in Harris County for flood risk reduction projects is $25 billion to achieve a 1% (100-year) level of service in Harris County. The project list developed by HCFCD includes projects that address documented flooding issues in each watershed – issues that come into play any time there is excessive rainfall in those watersheds. The Map 21 displays the approximate location of more than 100 needed drainage improvement projects. Each of these projects failed to function during Hurricane Harvey. The potential projects have been identified by the Flood Control District and Harris County Engineering Department to provide flood risk reduction benefits in the watersheds in which the projects are located. Potential
Barker Reservoir during Hurricane Harvey

66
projects represent projects that would meet the goal of recovery after previous flooding events and to make our county more resilient for the future12. Of the 22 watersheds, seven watersheds have a population of at least 51 percent or greater LMI households (seen on the Map outlined in red). These watersheds include: Sims, Brays, White Oak, Hunting Vince, Spring Gully/Goose Creek and Greens Bayous. Approximately, fifty of the projects are in or nearby LMI areas. These projects include improvements along bayous, channels, and riverine assets, but also neighborhood level drainage improvements. The Harris County Flood Warning System suffered damage to several sites mainly due to the rise of water to heights that flooded the gage structure and the electronics housed. At total of 7
HCFCD gages were completely destroyed with an additional 5 suffering partial damage mainly to the water level measuring devices. A total of 1,200 locations were identified to have damage including erosion, slope failures, sink holes, silt deposits, concrete failures, and drainage pipe separations. A total of 106,000 cubic yards of debris has been removed from HCFCD channels with the majority of the debris removal being along Spring Creek, Cypress Creek, Willow Creek, Langham Creek, and Buffalo Bayou. An additional 30,000 cubic yards of debris is currently in the process of being removed along Buffalo Bayou and Cypress Creek. To date, debris removal efforts have cost $3.3 million dollars. Past voluntary home buyouts throughout the county of homes deep in the floodplain were effective for this storm event. Through a partnership with FEMA, more than 2,000 homes were acquired, the residents moved to higher ground, and the homes demolished. The sites are kept undeveloped and are useful as open space and natural floodplain functions. In addition, the HCFCD has acquired about 1,000 additional homes. Approximately 2,300 homes would have flooded had the HCFCD and FEMA not purchased and removed them. As discussed in the Housing Section, Harris County has identified over 40 Buyout Interest areas across the county of which 13 Buyout Areas are in LMI areas that were highly impacted (4 ft or more flood levels) by Harvey.
12 https://www.hcfcd.org/bond-program/

67
Map 21: Countywide Needed Drainage Improvements

68
5. Commercial Buyout
Harris County has been involved in residential buyout since 1985. HCFCD has identified 43 areas in unincorporated Harris County or in one of the county’s small cities that fits the buyout definition. These areas contain approximately 3,300 parcels to acquire. Some of these parcels are partial home business and small business that will also need buyout and relocation as we relocate the residents around these businesses. The county has identified in its 13 low-income buyout areas approximately 87 commercial and industrial parcels with a 2017 market value for the parcel of roughly $10 million. This number is expected to increase as the value of each business is evaluated in the intake process nor does the count take into effect vacant commercial/industrial lots.
6. Public Facilities Under the FEMA Public Assistance, over $339 million in damage was reported under building and equipment across Harris County. Public buildings such as libraries, courtroom, jury assembly building, county annexes, and healthcare facilities, were damaged by Harvey. The Harris County Library system reported over $4.5 million in damage to four libraries, Baldwin Boettcher, Barbara Bush, Kingwood, and Katherine Tyra Libraries. Most of these locations are still closed a waiting rehabilitation or reconstruction to reduce future flood risk. The Baldwin Boettcher Library is in the Mercer LMI Target Area and served as the community’s access point to community services. During the storm, 44 area hospital and other health facilities evacuated over 1,500 patients, estimates the Southeast Texas Regional Advisory Council, who coordinated the regional response during Harvey. These included 24 hospitals and 20 nursing homes or assisted living centers. Harris Health System provides medical services during Hurricane Harvey, including 123 dialysis procedures, 24 births, and over 1,000 emergency care visits. The LBJ Hospital also served as shelter to over 180 evacuees and provided 14,000+ meals. The hospital also lost medical beds to moisture from the flooding. Ben Taub Hospital also found the flooding a challenge as drainage system backed up into the basement. Pressure would build on a 6-inch plumbing pipe cause it to fail. The rising water threaten food supplies, linens, pharmaceuticals, and kitchen operations. The HCA Healthcare Gulf Coast Division recently announced that due to extensive damage from Harvey and past disaster events, the East Houston Regional Medical Center would cease operations and permanently close its doors. The 131-bed hospital and its emergency care center was flooded with 6 feet of water during Harvey. The closure of this hospital endangers the lives of many county residents, including numerous LMI households, who must travel great distances for emergency care. Several parks were also damaged. Under the FEMA Public Assistance, over $7 million in damage was reported under Parks and Recreational Facilities. One park, Mercer, is in a LMI area and provides access to trails, gardens, and natural assets. Spring Creek flooded the park and deposited debris and sand throughout the park.
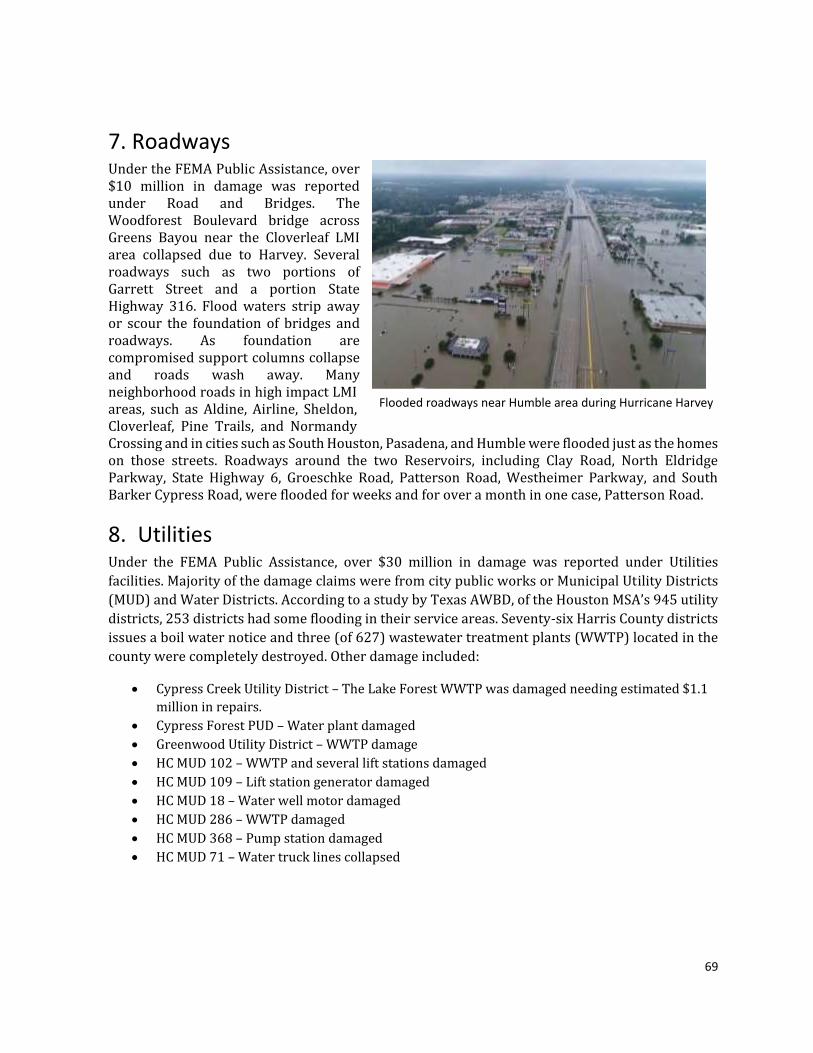
69
7. Roadways Under the FEMA Public Assistance, over $10 million in damage was reported under Road and Bridges. The Woodforest Boulevard bridge across Greens Bayou near the Cloverleaf LMI area collapsed due to Harvey. Several roadways such as two portions of Garrett Street and a portion State Highway 316. Flood waters strip away or scour the foundation of bridges and roadways. As foundation are compromised support columns collapse and roads wash away. Many neighborhood roads in high impact LMI areas, such as Aldine, Airline, Sheldon, Cloverleaf, Pine Trails, and Normandy Crossing and in cities such as South Houston, Pasadena, and Humble were flooded just as the homes on those streets. Roadways around the two Reservoirs, including Clay Road, North Eldridge Parkway, State Highway 6, Groeschke Road, Patterson Road, Westheimer Parkway, and South Barker Cypress Road, were flooded for weeks and for over a month in one case, Patterson Road.
8. Utilities Under the FEMA Public Assistance, over $30 million in damage was reported under Utilities
facilities. Majority of the damage claims were from city public works or Municipal Utility Districts
(MUD) and Water Districts. According to a study by Texas AWBD, of the Houston MSA’s 945 utility
districts, 253 districts had some flooding in their service areas. Seventy-six Harris County districts
issues a boil water notice and three (of 627) wastewater treatment plants (WWTP) located in the
county were completely destroyed. Other damage included:
Cypress Creek Utility District – The Lake Forest WWTP was damaged needing estimated $1.1
million in repairs.
Cypress Forest PUD – Water plant damaged
Greenwood Utility District – WWTP damage
HC MUD 102 – WWTP and several lift stations damaged
HC MUD 109 – Lift station generator damaged
HC MUD 18 – Water well motor damaged
HC MUD 286 – WWTP damaged
HC MUD 368 – Pump station damaged
HC MUD 71 – Water truck lines collapsed
Flooded roadways near Humble area during Hurricane Harvey
70
9. Hazard and Mitigation: Resiliency Solutions and Mitigation Needs
Harris County will follow the State’s resiliency solutions as stated in the State of Texas Plan for Disaster Recovery: Hurricane Harvey – Round 1. Recognizing the state’s long and well-documented history of flooding, hurricanes, wildfires, and droughts, as well as its ongoing efforts to mitigate future disaster effects in its most vulnerable areas, the GLO continues its commitment to rebuilding while prioritizing resiliency. In assessing unmet needs, it is important to consider the additional costs of safeguarding housing and community infrastructure investments from future disasters. As such, Texas will not only assess projects and consider state-run programs that replace or repair lost property but will also seek to invest resources in efforts that promise to mitigate damage from a wide range future disaster types. Although this can increase costs initially, mitigating efforts can greatly reduce the cost of future damages. The success of this long-term recovery practice was seen firsthand during Hurricane Harvey. Resilient-enhanced projects from previous CDBG-DR efforts suffered less damage from Hurricane Harvey: construction projects designed to prevent future flooding, mitigate further loss, and decrease evacuation times. Single family home resiliency solutions are expected to add approximately 10 to 15 percent to the total cost per home; multifamily resiliency solutions add 15 to 20 percent to the total cost per project; and infrastructure resiliency solutions add 15 to 20 percent to the total cost per project. Resiliency solutions are varied and dependent on the respective area’s Threat and Hazard Identification and Risk Assessment (THIRA). Single family home resiliency solutions may include elevating the first floor of habitable area; breakaway ground floor walls; reinforced roofs; storm shutters; use of ENERGY STAR appliances and fixtures; and mold and mildew resistant products. Multifamily resiliency solutions include elevation; retention basins; fire-safe landscaping; firewalls; and landscaped floodwalls. Buyout programs support hazard mitigation, floodplain management goals, and resiliency by removing homeowners from the floodplain, thus eliminating vulnerability to future flooding situations. After homes are purchased, the structures are demolished or relocated. The land reverts to a natural floodplain, converts into a retention area, or is retained as green space for recreational purposes. The buyout option serves multiple objectives and provides a resiliency option versus rebuilding within a floodplain. Buyouts help prevent repetitive loss and extreme risk to human health and safety. Buyouts conducted sooner rather than later prevent homeowners from making repairs and investing funds in properties that they then may not want to sell.
In the case of infrastructure resiliency solutions, improvements may include:
Elevating critical systems, facilities, and roadways above base flood elevation;
Installing backup power generators for critical systems (water, sewer, etc.);
Avoiding an increase in impervious cover by keeping projects in their original footprint and
encouraging the use of building practices that allow for more pervious coverage, when
possible;
71
Replanting with only native vegetation to preserve the natural environment; Installing retention basins, larger culverts and debris guards, erosion control solutions, and
back-up communication systems; and Supporting local community efforts to enhance building codes and regulations. The resiliency multiplier will be a standard 15 percent for both housing and infrastructure activities to calculate unmet need, as has previously been applied in other Texas CDBG-DR programs. Harris County Flood Control District has identified 43 areas for buyout in Harris County. These areas contain approximate 3,300 flood-prone homes damaged by Hurricane Harvey. Once the structures are removed, the land will be dedicated and maintained as open space to conserve natural floodplain functions.
10. Response to U.S. Army Corps of Engineers Recovery Work Plan On July 5, 2018, the U.S. Army Corps of Engineers released a summary of their work plan for studies and construction projects related to funding provided in the Bipartisan Budget Act of 2018, which was passed and signed into law on February 9 of this year. Studies, which are at full federal expense, include:
$3 million for the Section 216 Study led by the Corps, which will evaluate the existing Addicks and Barker reservoirs and recommend operational changes and/or physical projects to improve the effectiveness of the reservoirs in reducing flood risks upstream and downstream; and
$3 million for a county-wide drainage study to look at Harris County’s drainage infrastructure as a system, identifying potential inadequacies and potential improvements to the overall system.
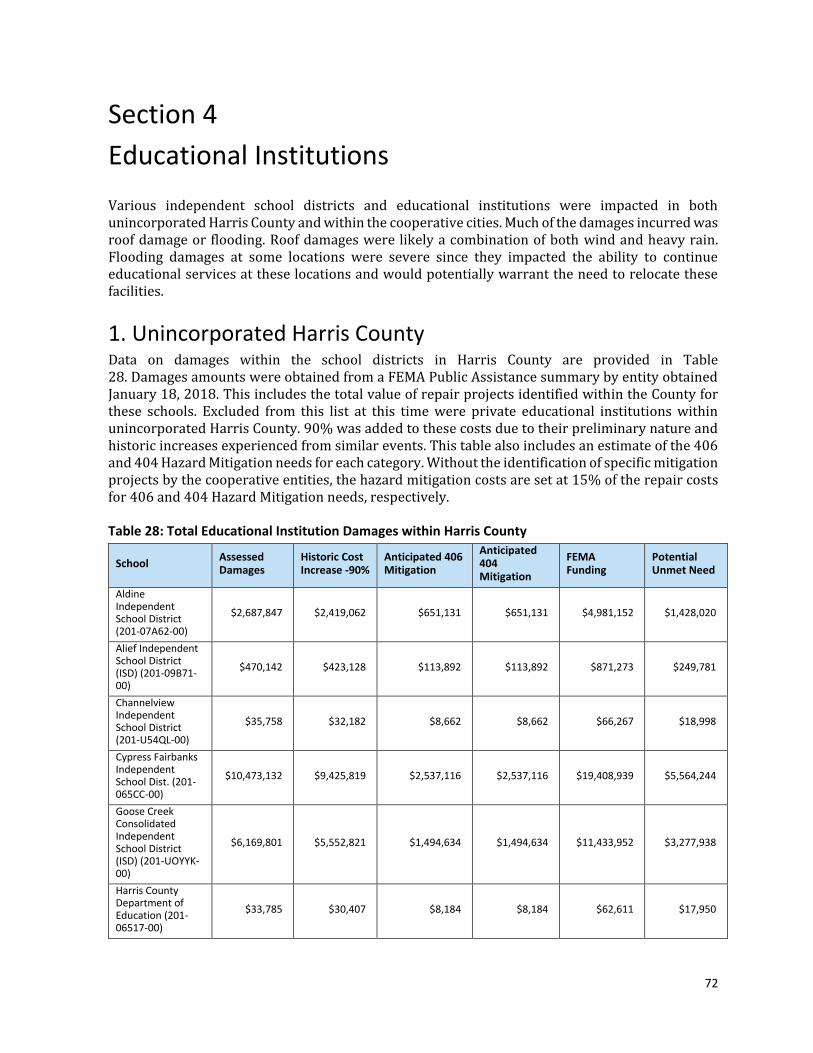
72
Section 4
Educational Institutions
Various independent school districts and educational institutions were impacted in both unincorporated Harris County and within the cooperative cities. Much of the damages incurred was roof damage or flooding. Roof damages were likely a combination of both wind and heavy rain. Flooding damages at some locations were severe since they impacted the ability to continue educational services at these locations and would potentially warrant the need to relocate these facilities.
1. Unincorporated Harris County Data on damages within the school districts in Harris County are provided in Table 28. Damages amounts were obtained from a FEMA Public Assistance summary by entity obtained January 18, 2018. This includes the total value of repair projects identified within the County for these schools. Excluded from this list at this time were private educational institutions within unincorporated Harris County. 90% was added to these costs due to their preliminary nature and historic increases experienced from similar events. This table also includes an estimate of the 406 and 404 Hazard Mitigation needs for each category. Without the identification of specific mitigation projects by the cooperative entities, the hazard mitigation costs are set at 15% of the repair costs for 406 and 404 Hazard Mitigation needs, respectively. Table 28: Total Educational Institution Damages within Harris County
School Assessed Damages
Historic Cost Increase -90%
Anticipated 406 Mitigation
Anticipated 404 Mitigation
FEMA Funding
Potential Unmet Need
Aldine Independent School District (201-07A62-00)
$2,687,847 $2,419,062 $651,131 $651,131 $4,981,152 $1,428,020
Alief Independent School District (ISD) (201-09B71-00)
$470,142 $423,128 $113,892 $113,892 $871,273 $249,781
Channelview Independent School District (201-U54QL-00)
$35,758 $32,182 $8,662 $8,662 $66,267 $18,998
Cypress Fairbanks Independent School Dist. (201-065CC-00)
$10,473,132 $9,425,819 $2,537,116 $2,537,116 $19,408,939 $5,564,244
Goose Creek Consolidated Independent School District (ISD) (201-UOYYK-00)
$6,169,801 $5,552,821 $1,494,634 $1,494,634 $11,433,952 $3,277,938
Harris County Department of Education (201-06517-00)
$33,785 $30,407 $8,184 $8,184 $62,611 $17,950

Section 4 – Educational Institutions
73
School Assessed Damages
Historic Cost Increase -90%
Anticipated 406 Mitigation
Anticipated 404 Mitigation
FEMA Funding
Potential Unmet Need
Huffman Independent School District (201-02B4D-00)
$10,730,000 $9,657,000 $2,599,343 $2,599,343 $19,884,970 $5,700,715
Klein Independent School District (201-02CC6-00)
$4,939,803 $4,445,823 $1,196,667 $1,196,667 $9,154,505 $2,624,456
Pasadena Independent School District (201-0B779-00)
$3,644,914 $3,280,423 $882,980 $882,980 $6,754,800 $1,936,497
Sheldon Independent School District (201-0E7F4-00)
$18,972,394 $17,075,155 $4,596,062 $4,596,062 $35,159,878 $10,079,796
Spring Branch Independent School District (201-UDT8V-00)
$425,890 $383,301 $103,172 $103,172 $789,265 $226,270
Spring Independent School District (201-0649F-00)
$660,575 $594,518 $160,024 $160,024 $1,224,186 $350,955
YES Prep Public Schools, Inc (201-UJ8XG-00)
$161,994 $145,795 $39,243 $39,243 $300,209 $86,065
Clear Creek Independent School District
$18,791,807 $16,912,626 $4,552,315 $4,552,315 $34,825,212 $9,983,852
La Porte Independent School District
$590,233 $531,210 $142,984 $142,984 $1,093,827 $313,583
Katy Independent School District
$36,782,092 $33,103,883 $8,910,462 $8,910,462 $68,165,033 $19,541,866
Humble Independent School District
$64,864,937 $58,378,443 $15,713,531 $15,713,531 $120,208,512 $34,461,930
Galena Park Independent School District
$1,820,822 $1,638,740 $441,094 $441,094 $3,374,370 $967,380
Deer Park Independent School District
$423,684 $381,316 $102,637 $102,637 $785,176 $225,098
ComQuest Academy
$42,000 $37,800 $10,175 $10,175 $77,835 $22,314
Aristoi Classical Academy, Inc.
$30,000 $27,000 $7,268 $7,268 $55,596 $15,939
Total $182,751,610 $164,476,450 $44,271,578 $44,271,578 $338,677,568 $97,093,646
Major damages were experience at multiple school locations due to severe flooding as listed below. These locations may be candidates for relocation, etc., which may be beyond the mitigation costs anticipated in Table 28 above.
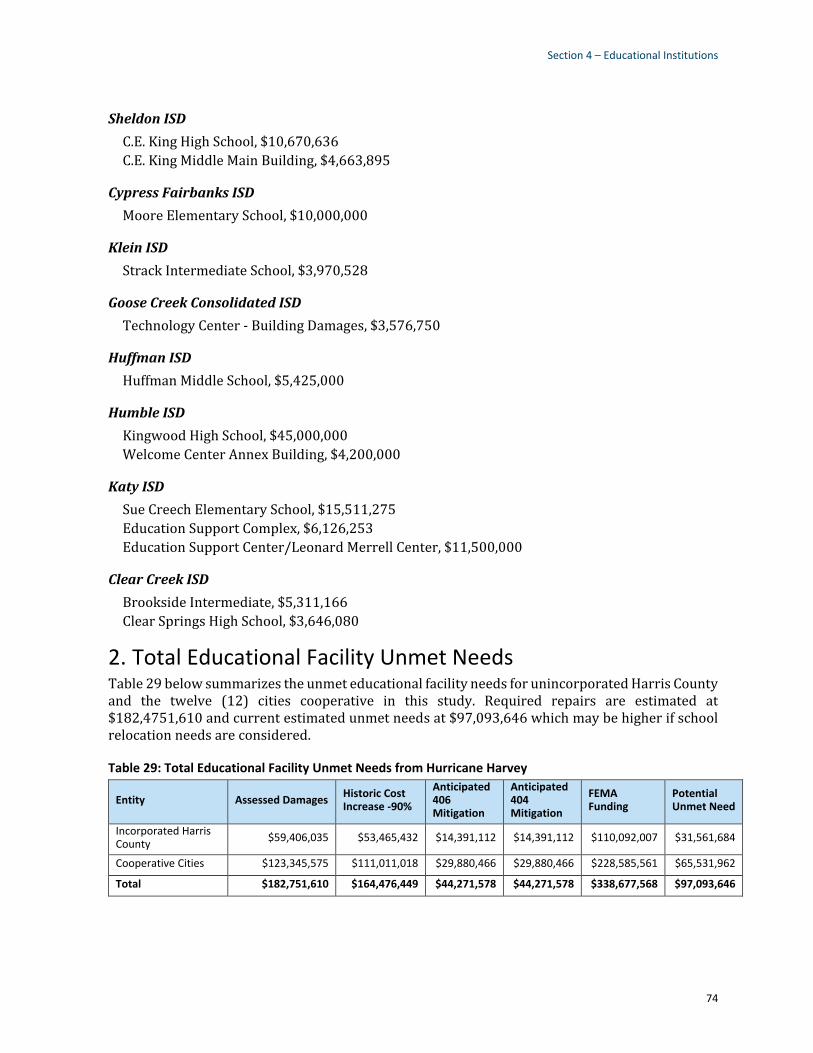
Section 4 – Educational Institutions
74
Sheldon ISD
C.E. King High School, $10,670,636
C.E. King Middle Main Building, $4,663,895
Cypress Fairbanks ISD
Moore Elementary School, $10,000,000
Klein ISD
Strack Intermediate School, $3,970,528
Goose Creek Consolidated ISD
Technology Center - Building Damages, $3,576,750
Huffman ISD
Huffman Middle School, $5,425,000
Humble ISD
Kingwood High School, $45,000,000
Welcome Center Annex Building, $4,200,000
Katy ISD
Sue Creech Elementary School, $15,511,275
Education Support Complex, $6,126,253
Education Support Center/Leonard Merrell Center, $11,500,000
Clear Creek ISD
Brookside Intermediate, $5,311,166
Clear Springs High School, $3,646,080
2. Total Educational Facility Unmet Needs Table 29 below summarizes the unmet educational facility needs for unincorporated Harris County and the twelve (12) cities cooperative in this study. Required repairs are estimated at $182,4751,610 and current estimated unmet needs at $97,093,646 which may be higher if school relocation needs are considered. Table 29: Total Educational Facility Unmet Needs from Hurricane Harvey
Entity Assessed Damages Historic Cost Increase -90%
Anticipated 406 Mitigation
Anticipated 404 Mitigation
FEMA Funding
Potential Unmet Need
Incorporated Harris County
$59,406,035 $53,465,432 $14,391,112 $14,391,112 $110,092,007 $31,561,684
Cooperative Cities $123,345,575 $111,011,018 $29,880,466 $29,880,466 $228,585,561 $65,531,962
Total $182,751,610 $164,476,449 $44,271,578 $44,271,578 $338,677,568 $97,093,646

75
Section 5
Economic Losses
The primary information gathered on economic losses for this report was based upon available data from the U.S. Small Business Administration (SBA). Data obtained from Harris County from August 1, 2017 through December 7, 2017 tracked the businesses within Harris County that received SBA loans for property and content losses. The total of loans for approximately 70 businesses amounted to $39,287,300 throughout the unincorporated county. Since this program is a loan only for businesses that may have difficulty in obtaining conventional loans, it only represents a portion of the business impacts from Hurricane Harvey. It also does not include additional costs that are more difficult to quantify such as business interruption impacts and other types of lost income. However, since it is a loan program and not a grant program, the loans obtained should be considered the minimum economic business impact from this event. Map 22 indicates the location of the impacted businesses. In addition to the commercial businesses applying for SBA loans, Harris County provided an assessment of commercial properties impacted by Hurricane Harvey. A methodology similar to the one used to establish damages to residential properties was used for establishing business properties inundated by Harvey, the Army Corps of Engineers Damage Assessment Curves were applied to establish the level of damages. The location of the 437 businesses identified and their relation to the SBA business locations are provided in Map 23. The total amount of assessed damage to properties was $62,346,950. It should be noted this is an assessment of property damage only and does not account for loss revenue and other business interruption impacts. Accordingly, it should be assumed the total economic losses to businesses can be assessed at $101,634,250. Another essential economic impact of Hurricane Harvey is the population growth of the region has increased significantly, by more than a million residences since Hurricane Ike in 2008, which has also caused property values to rise and business infrastructure to grow. Hurricane Harvey’s impact was greater than that of Hurricane Ike’s because of the economic growth and Hurricane Ike was a wind event versus Harvey being a rain-driven event. While Hurricane Harvey is said to be the nation’s third largest economic disaster behind Hurricane Katrina and September 11th, 2001, the total economic losses are still hard to quantify. The loss of jobs in Harris Country during the month of September 2017 were significant, the City of Houston alone lost 25,000 jobs, the Texas Workforce Commission reported. The majority of these jobs from the service industry. During the disaster period, George Bush Intercontinental Airport (IAH), the fifth-largest metropolitan airport in the United States, was shut down for nearly five days. Flight
HURRICANE HARVEY
ECONOMIC DATA
Moody’s Analytics initially estimated cost at $80 billion
Aon Benfield estimated $100 billion including $30 billion in insured damage
AccuWeather estimated $190 billion
Sept. 3rd Governor Abbot estimated damages would range between $150- $180 billion
In Sept 2017 the Insurance Council of Texas estimated total insured losses from Harvey at $19 billion
$11 billion in flood losses insured by the NFIP
$3 billion in insured windstorm/storm related losses
$4.75 billion in insured private/commercial vehicle losses
By January 1, 2018 payouts from the NFIP reached $7.6 billion against total estimated losses of $8.5-$9.5 billion
Preliminary reporting from NOAA estimated $125 billion

76
Aware, a flight tracking system, reported that 9,400 commercial flights were canceled between IAH and Houston (HOU) airports through the time period of the disaster.
Map 22: Businesses Applying for SBA Loans
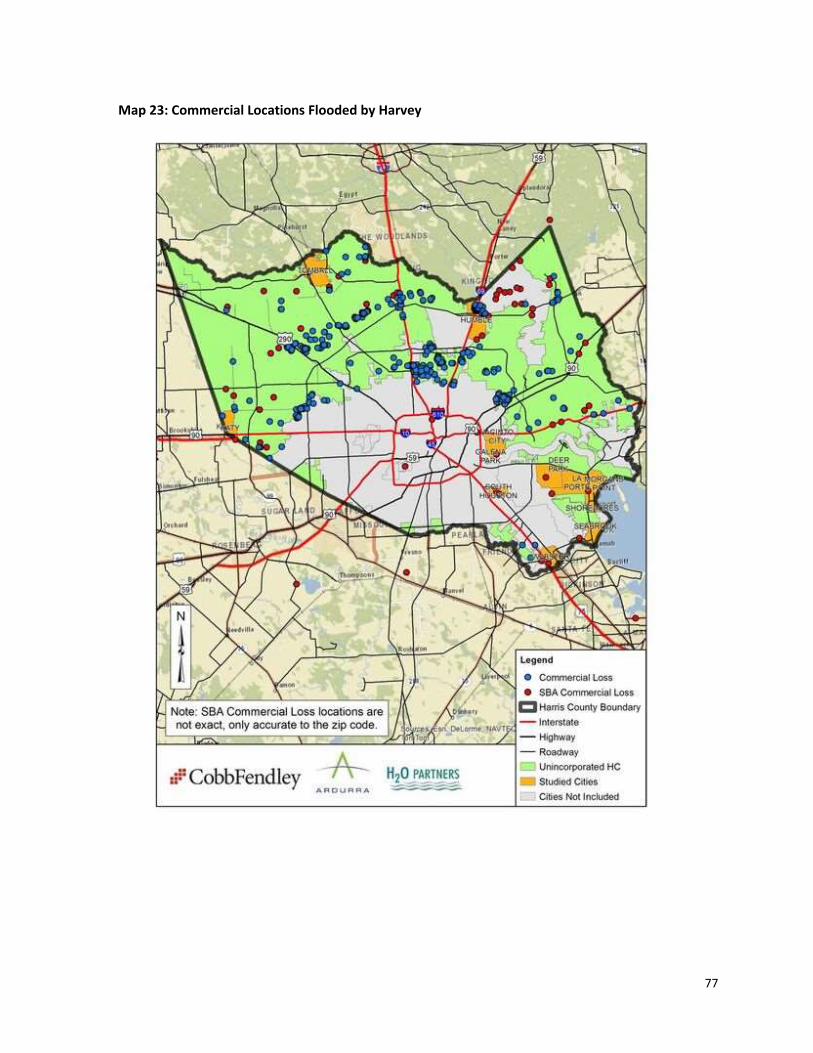
77
Map 23: Commercial Locations Flooded by Harvey