hurricane harvey and equitable recovery - oxfam … harvey and equitable recovery mapping social...
TRANSCRIPT
hurricane harvey and equitable recoveryMapping social vulnerability and intensity of wind and flooding from hurricane harvey in texas
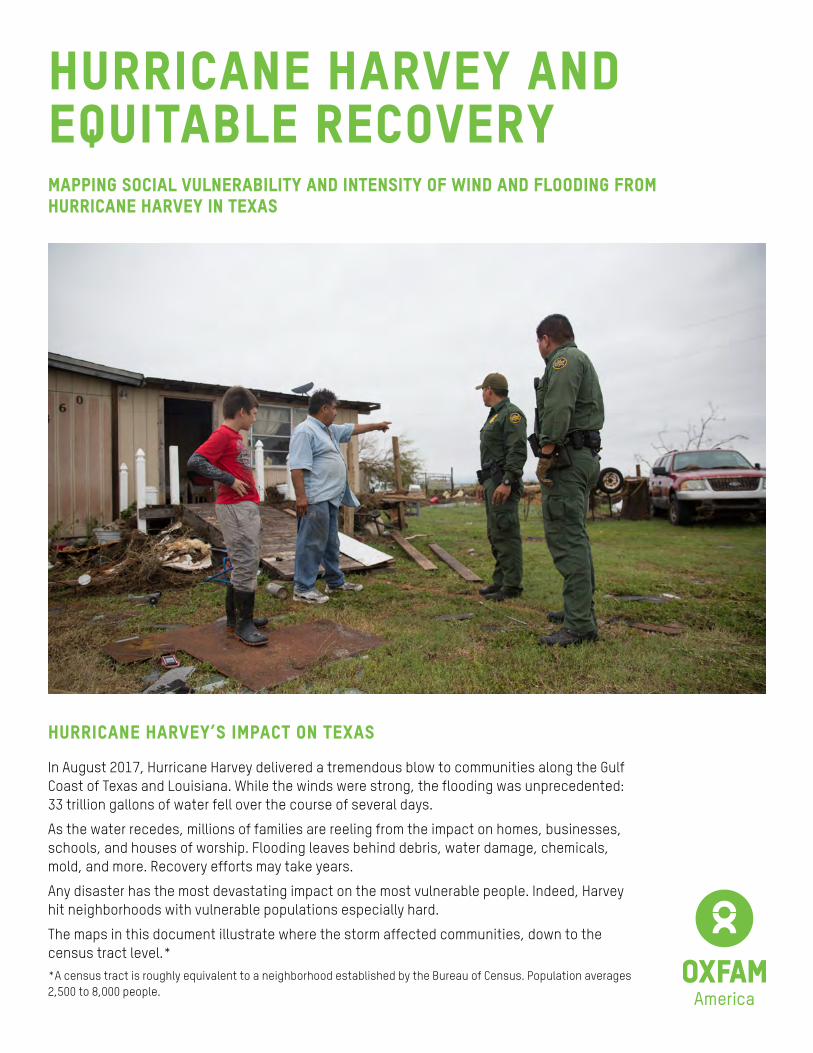
In August 2017, Hurricane Harvey delivered a tremendous blow to communities along the Gulf Coast of Texas and Louisiana. While the winds were strong, the flooding was unprecedented: 33 trillion gallons of water fell over the course of several days.
As the water recedes, millions of families are reeling from the impact on homes, businesses, schools, and houses of worship. Flooding leaves behind debris, water damage, chemicals, mold, and more. Recovery efforts may take years.
Any disaster has the most devastating impact on the most vulnerable people. Indeed, Harvey hit neighborhoods with vulnerable populations especially hard.
The maps in this document illustrate where the storm affected communities, down to the census tract level.*
*A census tract is roughly equivalent to a neighborhood established by the Bureau of Census. Population averages 2,500 to 8,000 people.
hurricane harvey’s iMpact on texas
flooding from hurricane harvey and social vulnerability
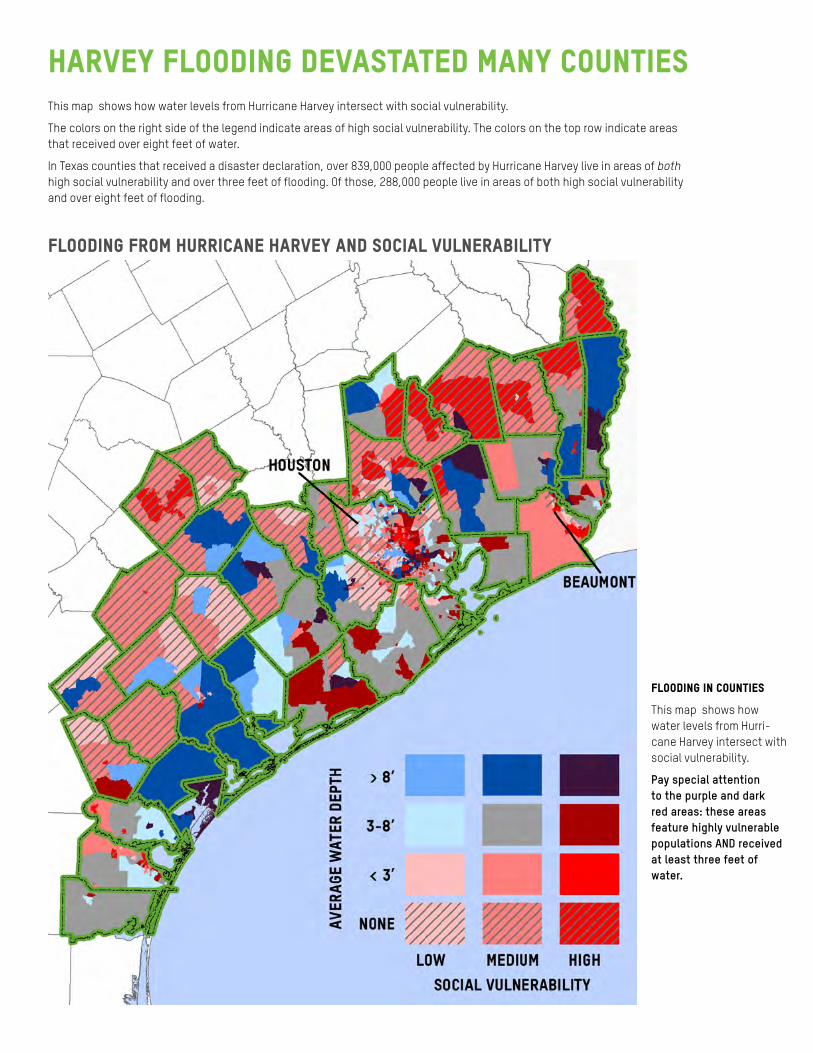
harvey flooding devastated Many counties This map shows how water levels from Hurricane Harvey intersect with social vulnerability.
The colors on the right side of the legend indicate areas of high social vulnerability. The colors on the top row indicate areas that received over eight feet of water.
In Texas counties that received a disaster declaration, over 839,000 people affected by Hurricane Harvey live in areas of both high social vulnerability and over three feet of flooding. Of those, 288,000 people live in areas of both high social vulnerability and over eight feet of flooding.
flooding in counties
This map shows how water levels from Hurri-cane Harvey intersect with social vulnerability.
Pay special attention to the purple and dark red areas: these areas feature highly vulnerable populations AND received at least three feet of water.

• 181,940 live in the Congressional Dis-trict of Representative Gene Green (D).
• 91,638 live in the Congressional District of Representative Sheila Jackson (D).
• 90,932 live in the Congressional District of Representative Al Green (D).
• 49,703 live in the Congressional District
of Representative Blake Farenthold (R).
• 35,305 live in the Congressional District of Representative Randy Weber (R).
• 27,937 live in the Congressional District of Representative Brian Babin (R).
• 25,720 live in the Congressional District of Representative Pete Olson (R).
• 16,197 live in the Congressional District of Representative Kevin Brady (R).
• 7,741 live in the Congressional District of Representative Filemon Vela, Jr. (D).
• 6,180 live in the Congressional District of Representative Ted Poe (R).
flooding in congressional districts
This map shows how water levels from Hurricane Harvey intersect with social vulnerability.
Pay special attention to the purple and dark red areas: these areas feature highly vulnerable populations AND received at least three feet of water.
harvey flooded several congressional districts Of the 7.9 million people affected by Hurricane Harvey, over 540,000 people live in areas that experienced over three feet of flooding and are characterized by high social vulnerability; among these people:
flooding from harvey and social vulnerability by congressional district

Social vulnerability indicates how well a population can prepare for, recover from, and adapt to environmental change and disaster. Some characteristics calculated into the Social Vulnerability Index:
• Economic standing is the number one factor in determining a community’s vulnerability to disaster. Poorer communities have fewer resources to use to cope with disasters and to withstand losses.
• Age extremes (elderly or young) mean people are less mobile and more dependent on care, and are less able to get out of harm’s way.
• Rural and urban communities each face special challenges when disaster strikes, and may have greater difficulty recovering.
• Special needs populations may be less able to cope with physical and social challenges.
• Other factors: race and ethnicity, gender, education and employment rates, home ownership rates.
TEXASDriven by the combination of extreme poverty, race, gender, age, and rural/urban popula-tions, the areas marked in bright red have high rates of social vulnerability.
Two distinct patterns are visible: urbanized and densely populat-ed areas that feature extremes of wealth (very rich to very poor); and rural areas where popu-lations are vulnerable due to poverty, race and ethnicity, and gender.
What Makes a coMMunity vulnerable?
social vulnerability in area of impact of hurricane harvey

harris county: high concentrations of vulnerable populations
Pay special attention to the purple and dark red areas: these areas feature highly vulnerable populations AND received at least three feet of water.
• Houston is located in Harris County. 4.37 million people live in Harris County, out of 7.9 million in counties affected by Hurricane Harvey.
• Within Harris County, 1.1 million people live in areas of high social vulnerability (shown here down to the level of census tracts). This represents 25 percent of the total population of the county.
• Of those 1.1 million people, nearly half (48.7 percent) live in areas that experienced flooding of over three feet.
• Over 839,000 people affected by Hurricane Harvey in the disaster-declared region of Texas live in areas of both high social vulnerability and over three feet of flooding; 64 percent live in Harris County.
• Highly vulnerable people also live in areas that are generally characterized as less vulnerable; it’s critical that policymakers identify these populations and target support to them as well.
houston and harris county: flooding from hurricane harvey and social vulnerability

harvey flooding in texas
flooding from harvey flooding and social vulnerability
flooding during hurricane harvey intersection of flooding and social vulnerability
The flooding devastated many vulnerable towns and neighborhoods.
Of the 1,437 census tracts in 39 counties:
• 124 census tracts feature extremely socially vulnerable populations, and experienced over three feet of flooding.
• 58 census tracts feature extremely socially vulnerable populations, and experienced over eight feet of flooding.
• 66 census tracts feature extremely socially vulnerable populations, and experienced between three and eight feet of flooding.
Areas that feature extremely socially vulnerable populations, and experienced flooding, are located throughout the entire area affected by Hurricane Harvey. Areas stretch as far North as Newton County and as far South as Nueces County.
In Harris County, home to Houston, there is a high concentration of tracts that feature extremely socially vulnerable populations, and experienced extreme flooding.

harvey Wind speeds in texas
Wind from hurricane harvey and social vulnerability
Wind speeds during hurricane harvey intersection of wind speeds and social vulnerability
The areas affected by high wind speeds only partly overlap those affected by flooding. While high winds concentrated on the Southernmost area of the affected region, flooding particularly affected Harris county.
Many of the areas hardest hit by hurricane winds are home to extremely vulnerable populations.
• Of the 1,437 census tracts in 39 counties, 403 census tracts feature extremely socially vulnerable populations, and experienced medium or high wind speeds (>39Mph) .
• 10 census tracts feature extremely socially vulnerable populations, and experienced high wind speeds (>57Mph).
• 393 census tracts feature extremely socially vulnerable populations, and experienced medium wind speeds (39-57Mph).
• Areas that feature extremely socially vulnerable populations, and experienced wind damage, are located throughout the entire area affected by Hurricane Harvey. They include two census tracts in Aransas County, one in Galveston County, two in Matagorda County, one in Nueces County, and four in Victoria County.

1101 17TH ST, NWSuITe 1300
WASHINGTON, DCoxfamamerica.org
This document is based on analysis by Dr. Christopher T. emrich Ph.D. GISP
Associate Professor, School of Public Administration, Boardman endowed Associate Professor of environmental Science and Public Administration, National Center for Integrated Coastal Research
SCHOOL OF PuBLIC ADMINISTRATION,
COLLeGe OF HeALTH AND PuBLIC AFFAIRS
uNIVeRSITy OF CeNTRAL FLORIDA
for an interactive version of the maps: https://oxf.am/2wGFZHW
publications from oxfamCoping with Disaster focuses on Louisiana and Mississippi, and explores the impacts of the four climate hazards on the most vulnerable populations. https://oxf.am/2kj3O2P
Exposed explores all 13 states in the uS Southeast, and illustrates how climate hazards affect vulnerable popula-tions. https://oxf.am/2xOby2r
resources on social vulnerability mappingCutter, S. L. 2017. The perilous nature of food supplies: Natural hazards, social vulnerability, and disaster resil-ience, environment 59(1): 4-15.
Cutter, Susan & Boruff, Bryan & Lynn Shirley, W. (2003). Social Vulnerability to Environmental Hazards. Social Sci-ence Quarterly. 84. 242-261.
Cutter, Susan. (1996). Societal Vulnerability to Environmental Hazards. Progress in Human Geography - PROG HuM GeOGR. 20. 529-539. 10.1177/030913259602000407.
Cutter, Susan L., and Christopher T. emrich. 2011. “Integrating Social Vulnerability into Climate Change Planning and Preparedness at the Local Level for Mississippi and Louisiana.” Hazards and Vulnerability Research Institute (HVRI), university of South Carolina.
Cutter, Susan L., and Christopher T. emrich. 2009. “Social Vulnerability Mapping for the Southeast uS.” HVRI, univer-sity of South Carolina.
Centers for Disease Control and Prevention (CDC) and Agency for Toxic Substances and Disease Registry (ATSDR), Department of uS Health and Human Services.
“The CDC/ATSDR Public Health Vulnerability Mapping System: using a Geographic Information System for Depicting Human Vulnerability to environmental emergencies.” A paper prepared as part of a joint project of the CDC’s Nation-al Center for environmental Health (NCeH) Office of Terrorism Preparedness and emergency Response (OTPeR) and the ATSDR Geospatial Research, Analysis, and Services Program (GRASP) to assist state and local health jurisdic-tions in their preparedness work.
National Research Council. 2006. Facing Hazards and Disasters: Understanding Human Dimensions. Washington, DC: National Academies Press.
notes
© 2017 Oxfam America Inc. All rights reserved. Oxfam is a trademark of Oxfam America Inc., and the Oxfam logo is a registered trademark of Stichting Oxfam International. None of the trademarks may be used without permission of the owner.