hurricane harvey - web.cortland.edu
TRANSCRIPT

Hurricane Harvey MFE634 Quality Engineering/Syracuse University
Student Group one;/April 14, 2018.
Introduction
This presentation is about the quality analysis that we performed on the biggest and the most expensive hurricane to ever hit USA. Hurricane Harvey.
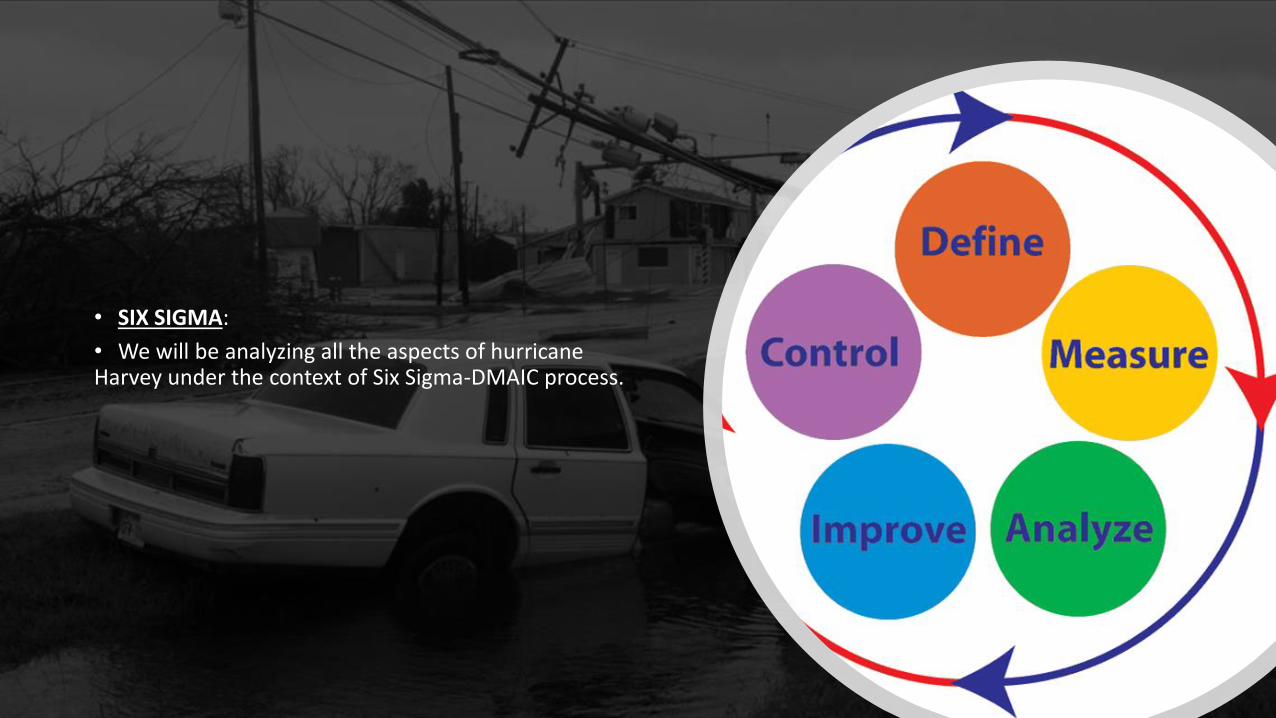
• SIX SIGMA:
• We will be analyzing all the aspects of hurricane Harvey under the context of Six Sigma-DMAIC process.
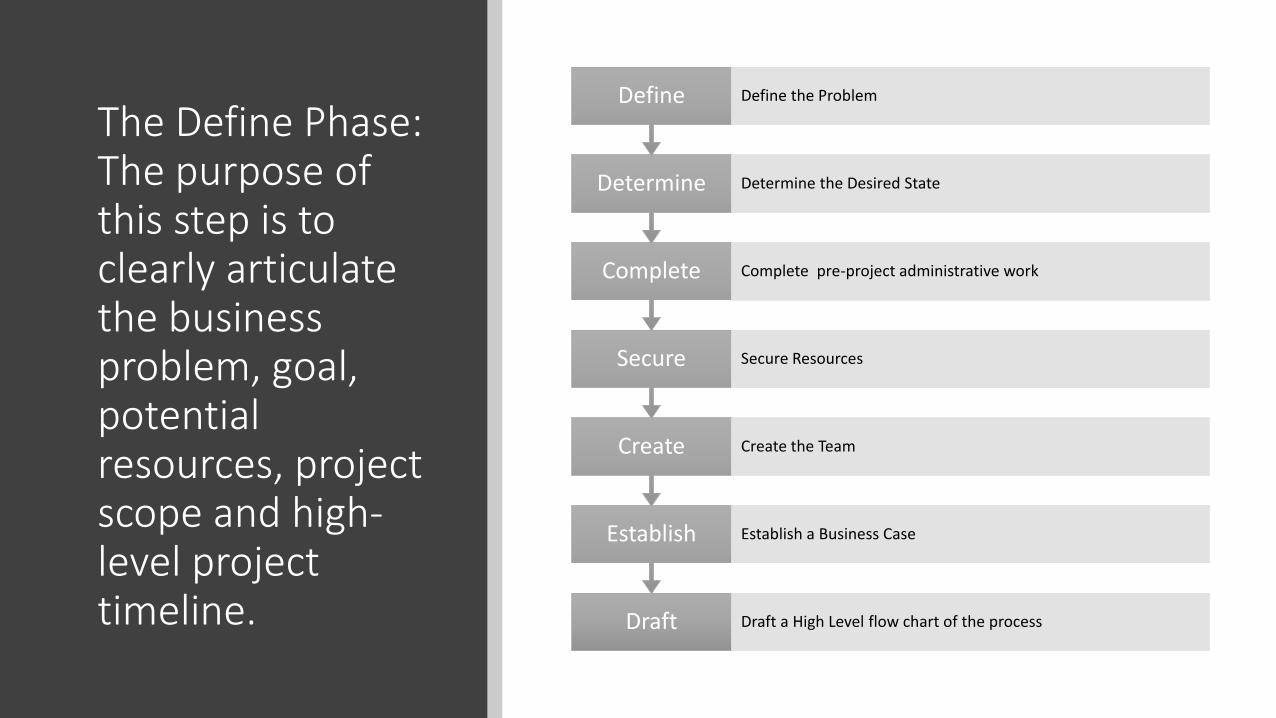
The Define Phase: The purpose of this step is to clearly articulate the business problem, goal, potential resources, project scope and high-level project timeline. Draft Draft a High Level flow chart of the process
Establish Establish a Business Case
Create Create the Team
Secure Secure Resources
Complete Complete pre-project administrative work
Determine Determine the Desired State
Define Define the Problem
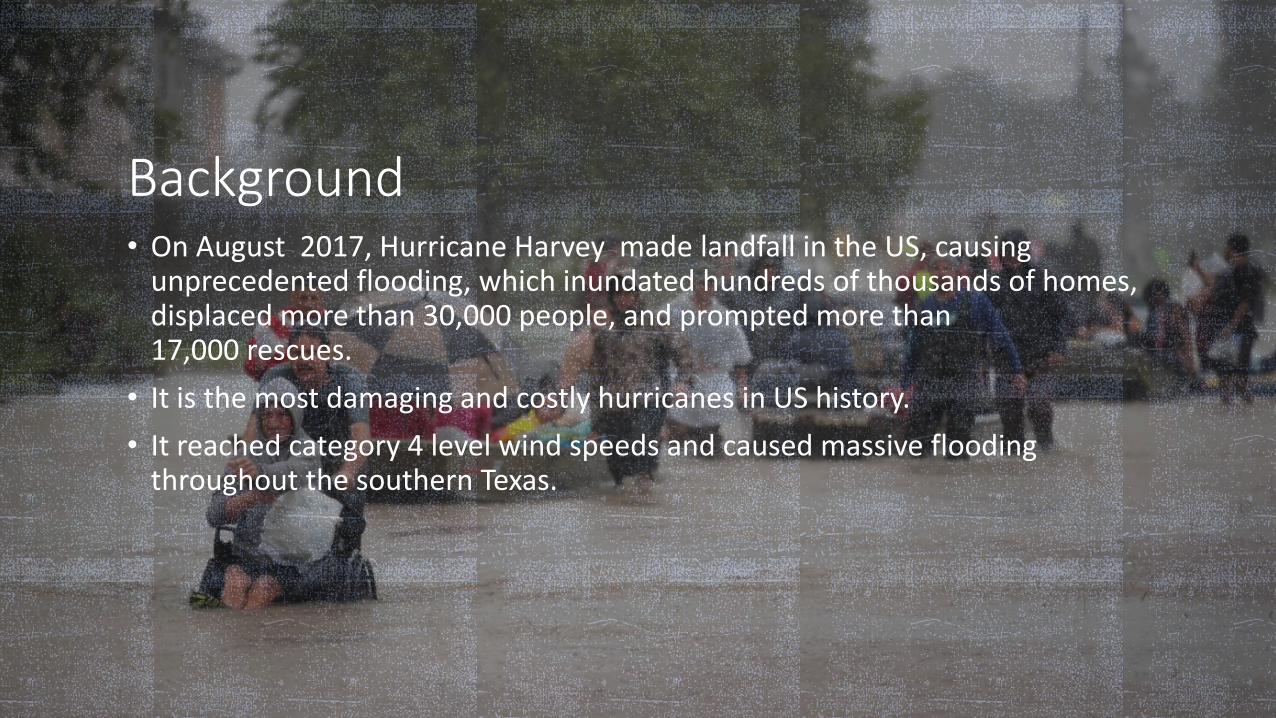
Background • On August 2017, Hurricane Harvey made landfall in the US, causing
unprecedented flooding, which inundated hundreds of thousands of homes, displaced more than 30,000 people, and prompted more than 17,000 rescues.
• It is the most damaging and costly hurricanes in US history.
• It reached category 4 level wind speeds and caused massive flooding throughout the southern Texas.
The Differences
• WHY IT CAUSED SO MUCH DAMAGE?
• Because upper-level winds in the atmosphere usually steer big hurricanes and keep them moving after they make landfall. With Harvey, those steering winds broke down, and a high pressure system to the northwest kept Harvey locked in place. Around 14 trillion to 15 trillion gallons of water had fallen on Houston and its surrounding areas. And 5 trillion more gallons are still expected to come.
• There was no evacuation order issued before the storm hit.
• WHY IT REMAINED ON HUSTON AREA FOR SO LONG?
• In Harvey’s case, a big high-pressure system over the southeastern U.S. is trying to push the storm in one direction, but a big high pressure system over the southwestern U.S. is trying to push the storm in the opposite direction.
• WHY WAS IT THE MOST DISTRUCTIVE STORM OF 2017
• Because it caused extreme rainfall and flood, and it lasted too long.
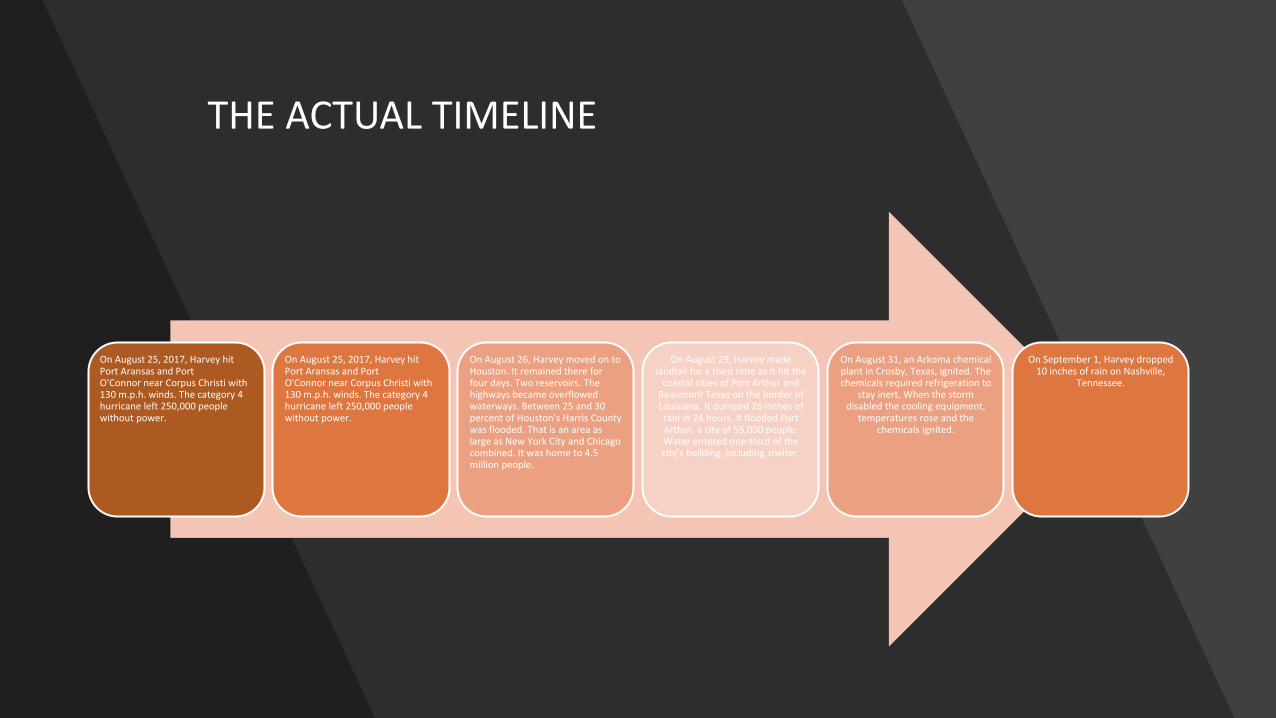
On August 25, 2017, Harvey hit Port Aransas and Port O'Connor near Corpus Christi with 130 m.p.h. winds. The category 4 hurricane left 250,000 people without power.
On August 25, 2017, Harvey hit Port Aransas and Port O'Connor near Corpus Christi with 130 m.p.h. winds. The category 4 hurricane left 250,000 people without power.
On August 26, Harvey moved on to Houston. It remained there for four days. Two reservoirs. The highways became overflowed waterways. Between 25 and 30 percent of Houston's Harris County was flooded. That is an area as large as New York City and Chicago combined. It was home to 4.5 million people.
On August 29, Harvey made landfall for a third time as it hit the
coastal cities of Port Arthur and Beaumont Texas on the border of Louisiana. It dumped 26 inches of rain in 24 hours. It flooded Port Arthur, a city of 55,000 people. Water entered one-third of the city's building, including shelter.
On August 31, an Arkoma chemical plant in Crosby, Texas, ignited. The chemicals required refrigeration to
stay inert. When the storm disabled the cooling equipment,
temperatures rose and the chemicals ignited.
On September 1, Harvey dropped 10 inches of rain on Nashville,
Tennessee.
THE ACTUAL TIMELINE
Damaging Elements of the Hurricane
• FLOODING
• The floods could cause that number to balloon, and additional factors could make Harvey a $30 billion storm.
• TORNADOES
• WIND and STORM SURGE
• Usually, severe winds that tear off roofs and uproot trees are a major source of damage during hurricanes. But in Harvey's case, storm surge damage brought by the storm's winds likely won't be as extensive as inland flood damage from rivers that overflow their banks. The insured losses from just the winds and storm surge could reach more than $2.3 billion.
• HAIL
AREAS OF MAXIMUM DAMAGE
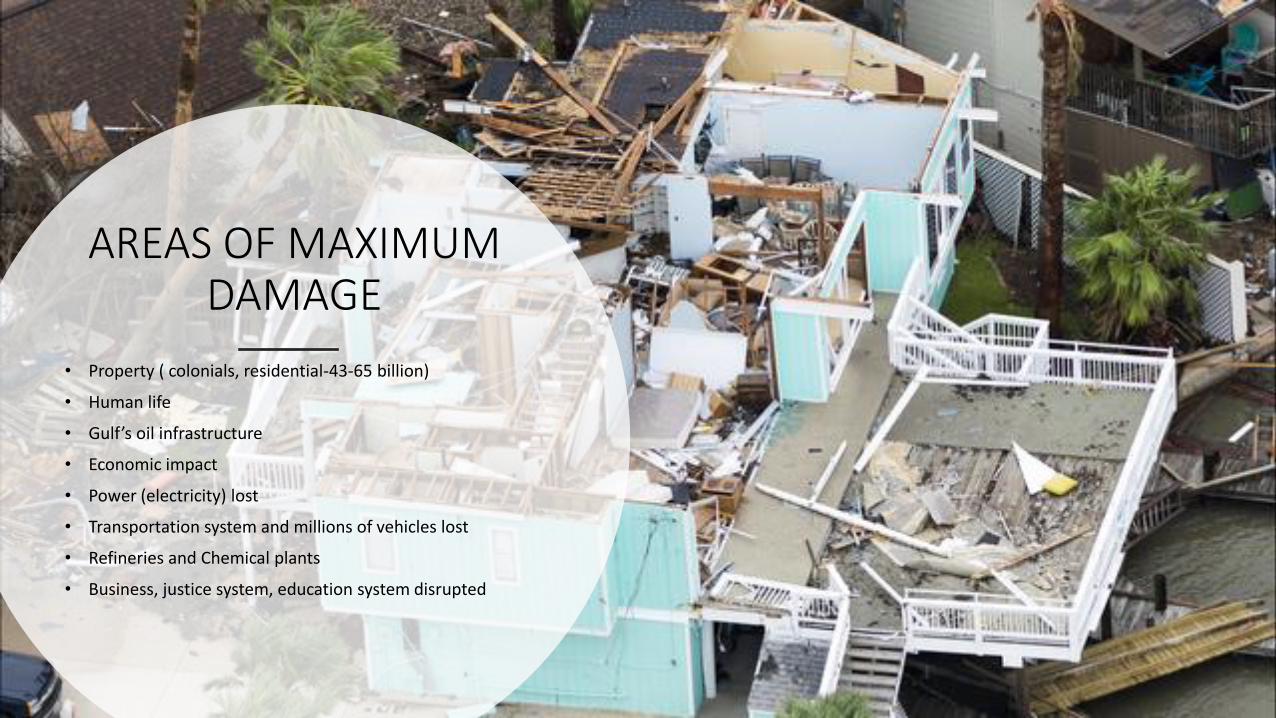
• Property ( colonials, residential-43-65 billion)
• Human life
• Gulf’s oil infrastructure
• Economic impact
• Power (electricity) lost
• Transportation system and millions of vehicles lost
• Refineries and Chemical plants
• Business, justice system, education system disrupted
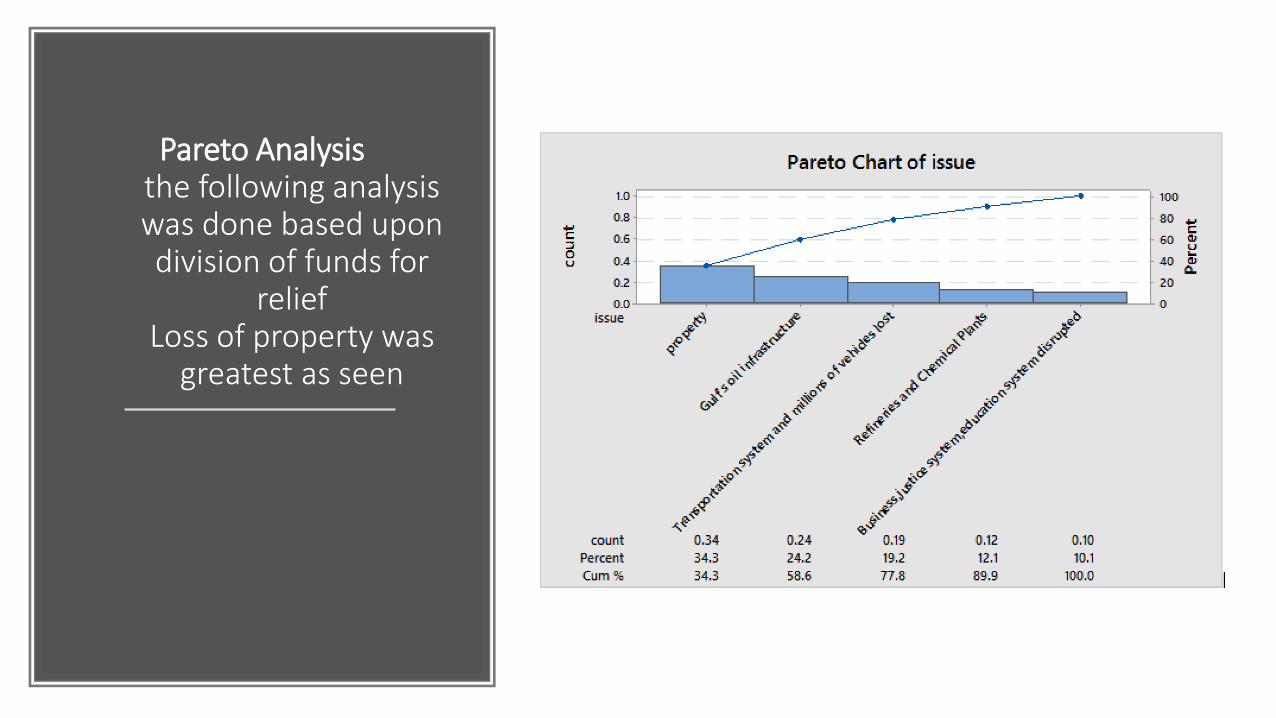
Pareto Analysis the following analysis was done based upon division of funds for
relief Loss of property was
greatest as seen
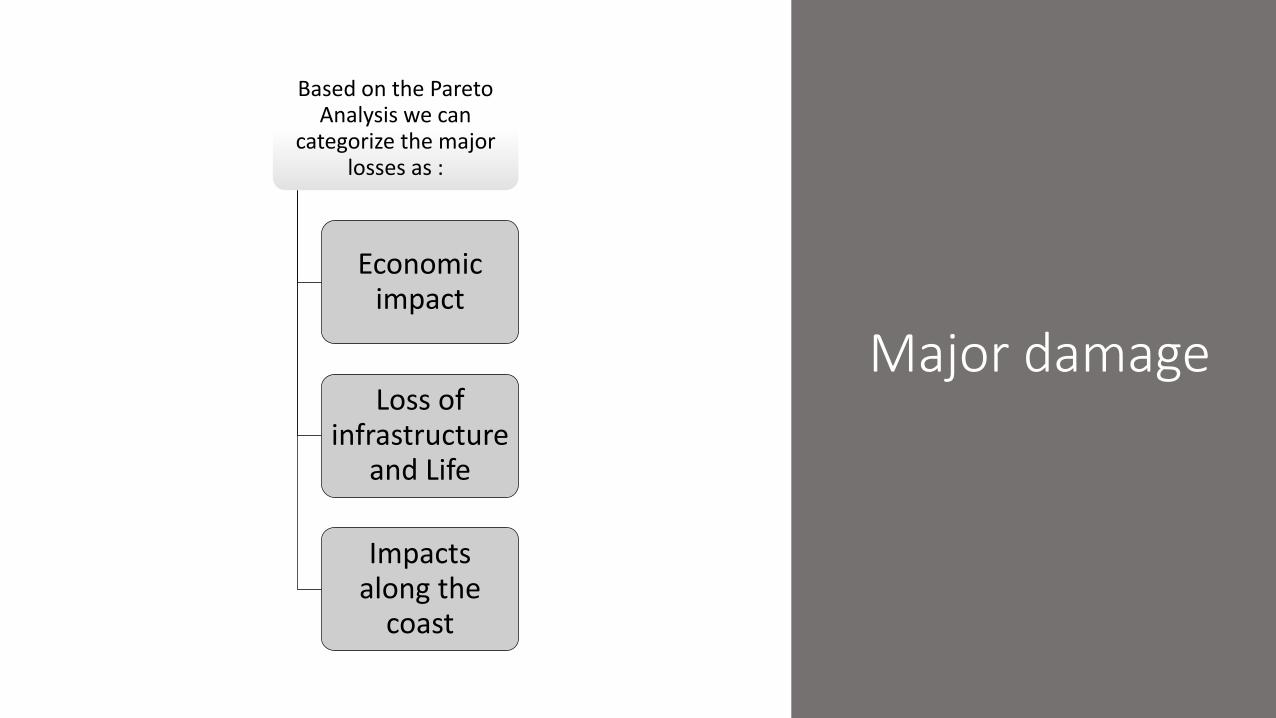
Major damage
Based on the Pareto Analysis we can
categorize the major losses as :
Economic impact
Loss of infrastructure
and Life
Impacts along the
coast
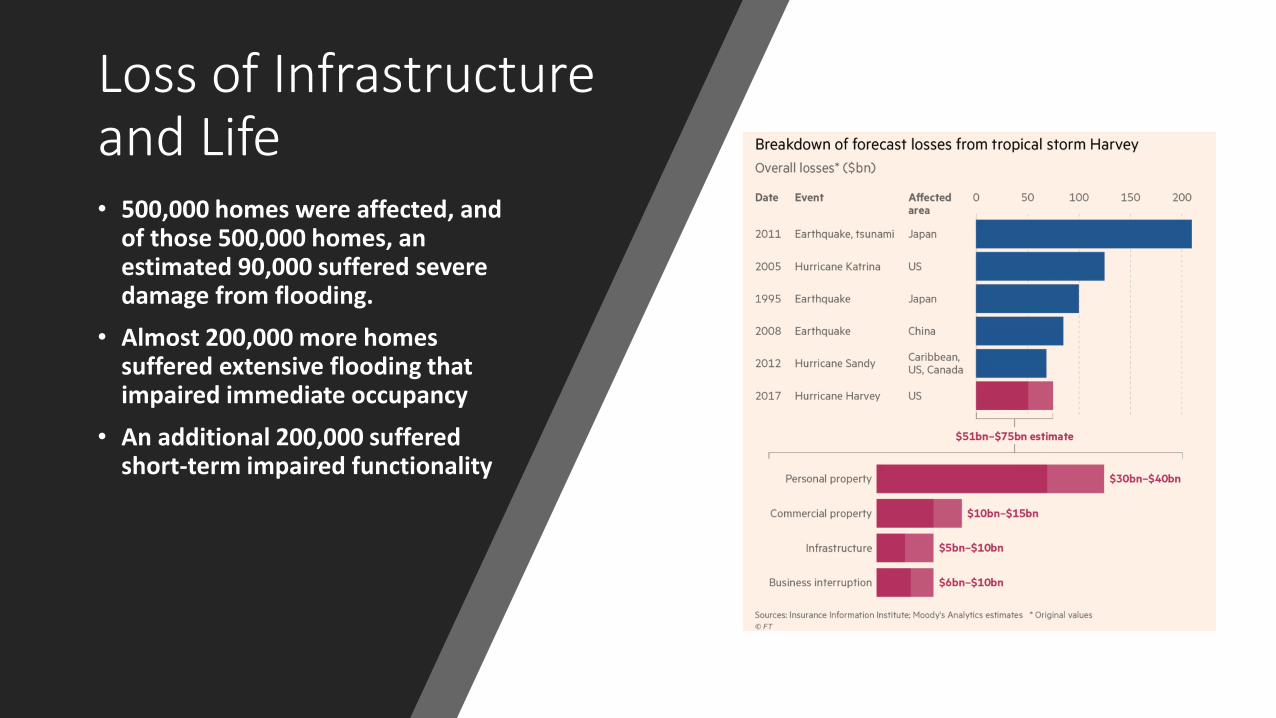
Loss of Infrastructure and Life • 500,000 homes were affected, and
of those 500,000 homes, an estimated 90,000 suffered severe damage from flooding.
• Almost 200,000 more homes suffered extensive flooding that impaired immediate occupancy
• An additional 200,000 suffered short-term impaired functionality
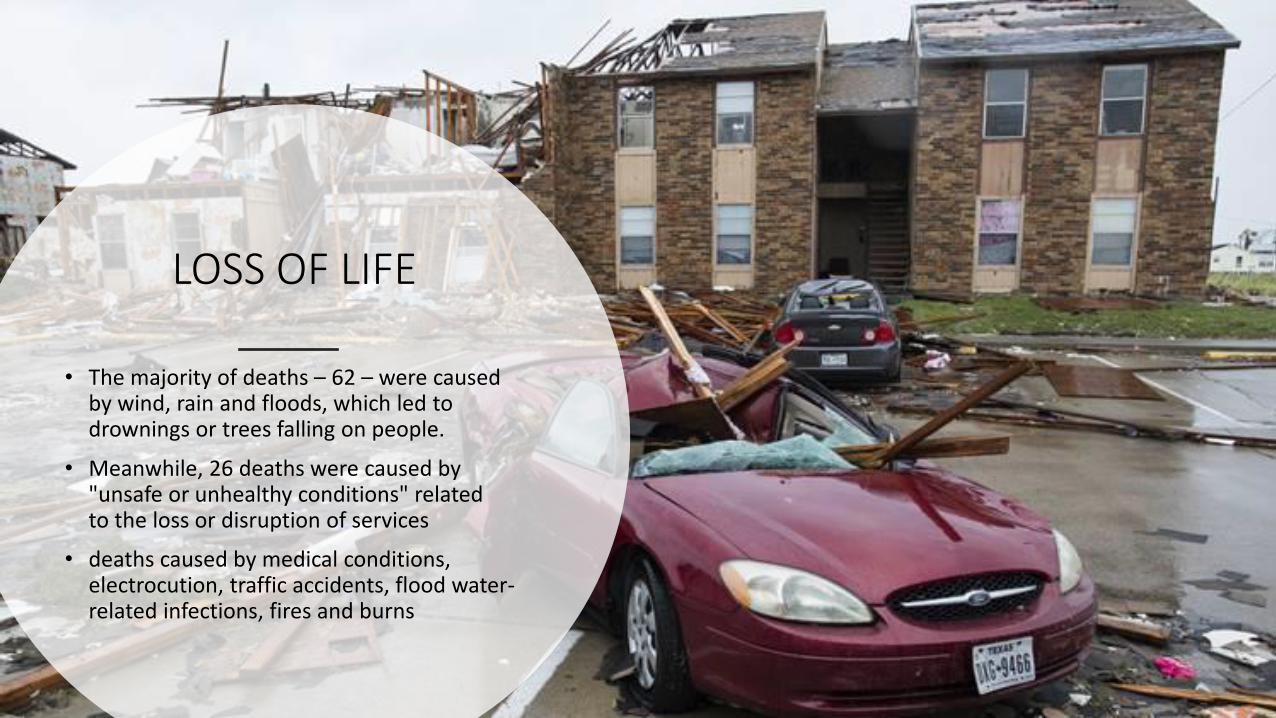
• The majority of deaths – 62 – were caused by wind, rain and floods, which led to drownings or trees falling on people.
• Meanwhile, 26 deaths were caused by "unsafe or unhealthy conditions" related to the loss or disruption of services
• deaths caused by medical conditions, electrocution, traffic accidents, flood water-related infections, fires and burns
LOSS OF LIFE

HUMAN LIFE DISTRUPTED COMPLETELY
Common Problems After a Disaster
• Long-term health problems
- PTSD and Depression
- Stress from loss of possessions
- Stress from loss of job/livelihood
- Communicable disease due to lack of clean water
- Replacing Lost or Damaged Documents like Birth/Death Certificates Driver’s License
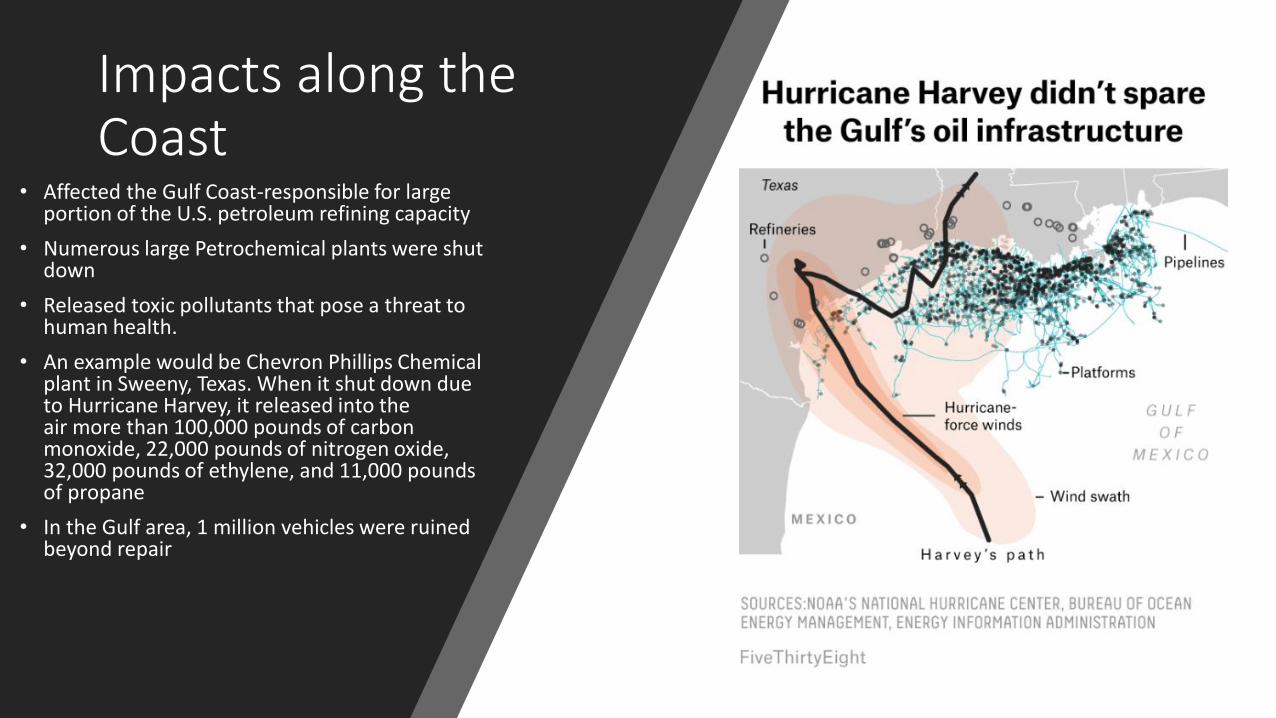
Impacts along the Coast
• Affected the Gulf Coast-responsible for large portion of the U.S. petroleum refining capacity
• Numerous large Petrochemical plants were shut down
• Released toxic pollutants that pose a threat to human health.
• An example would be Chevron Phillips Chemical plant in Sweeny, Texas. When it shut down due to Hurricane Harvey, it released into the air more than 100,000 pounds of carbon monoxide, 22,000 pounds of nitrogen oxide, 32,000 pounds of ethylene, and 11,000 pounds of propane
• In the Gulf area, 1 million vehicles were ruined beyond repair
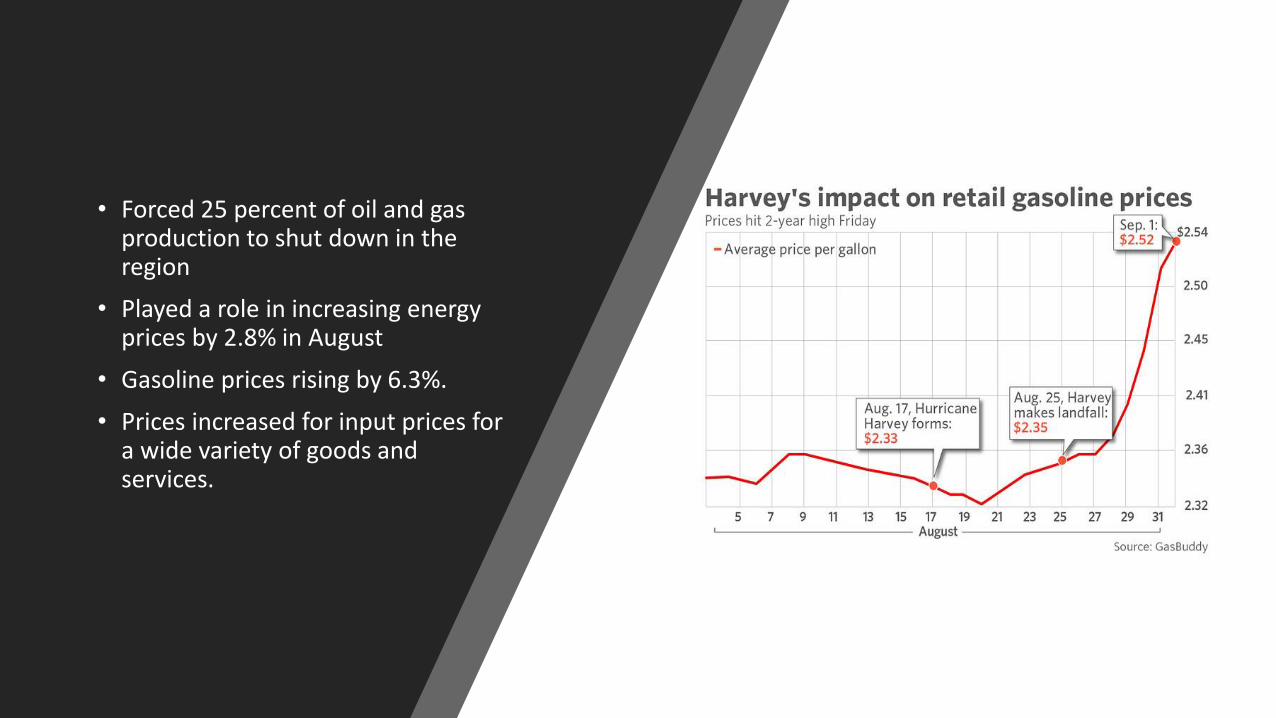
• Forced 25 percent of oil and gas production to shut down in the region
• Played a role in increasing energy prices by 2.8% in August
• Gasoline prices rising by 6.3%.
• Prices increased for input prices for a wide variety of goods and services.
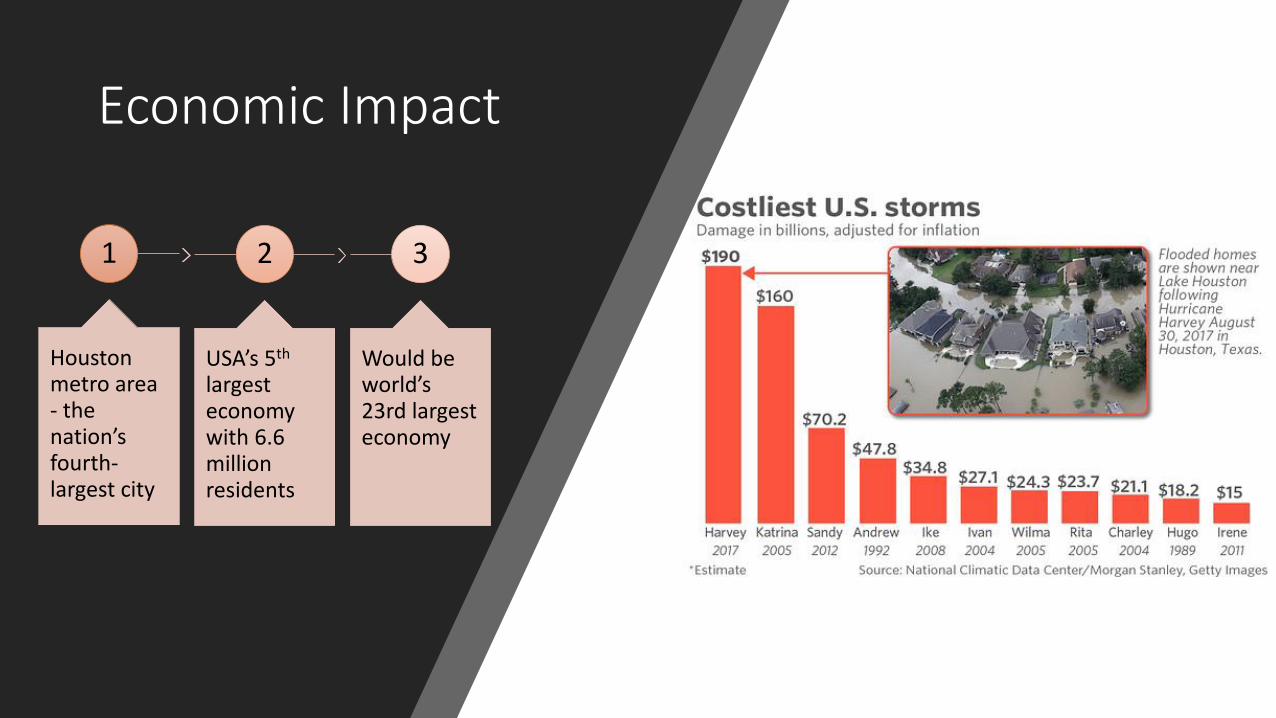
Economic Impact
1
Houston metro area - the nation’s fourth-largest city
2
USA’s 5th largest economy with 6.6 million residents
3
Would be world’s 23rd largest economy
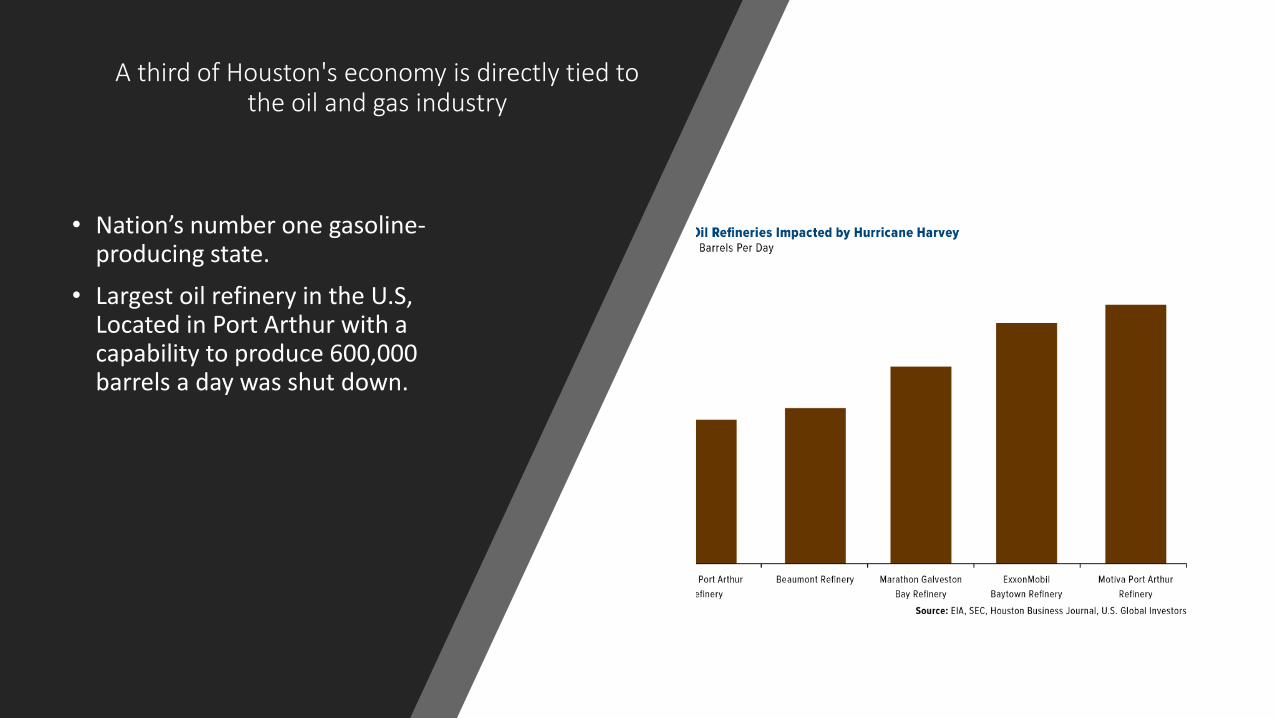
A third of Houston's economy is directly tied to the oil and gas industry
• Nation’s number one gasoline-producing state.
• Largest oil refinery in the U.S, Located in Port Arthur with a capability to produce 600,000 barrels a day was shut down.
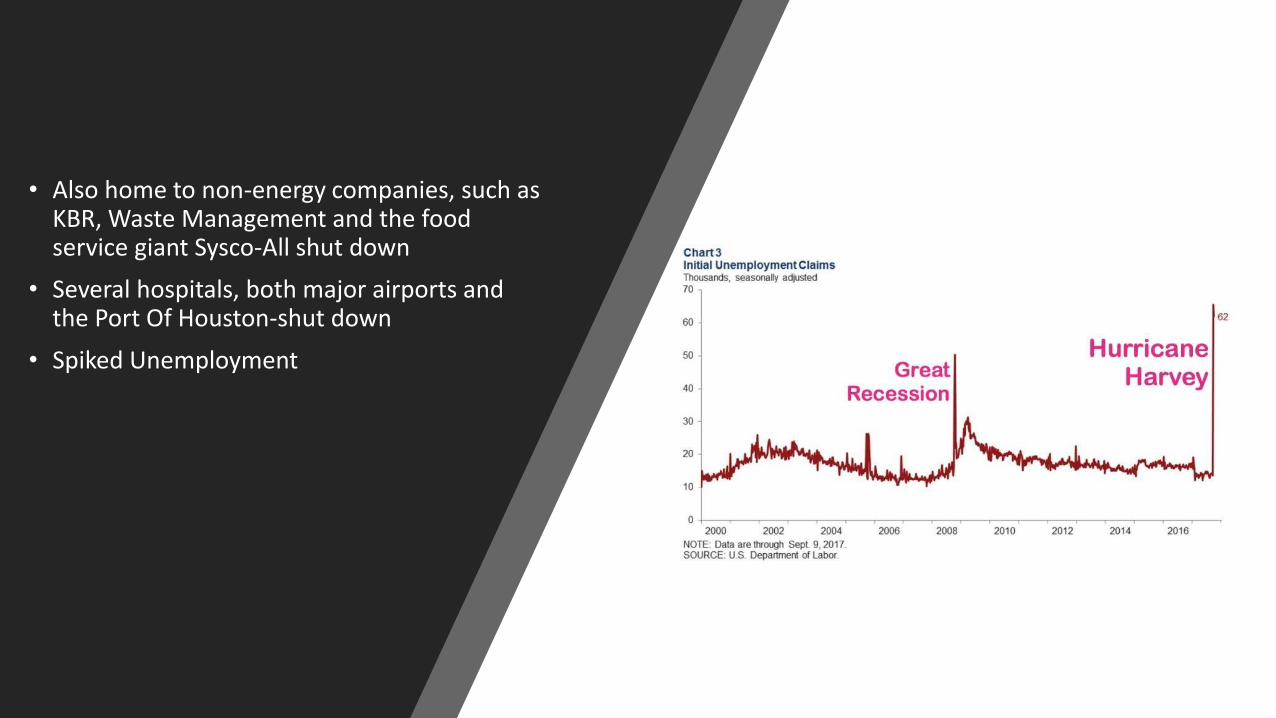
• Also home to non-energy companies, such as KBR, Waste Management and the food service giant Sysco-All shut down
• Several hospitals, both major airports and the Port Of Houston-shut down
• Spiked Unemployment
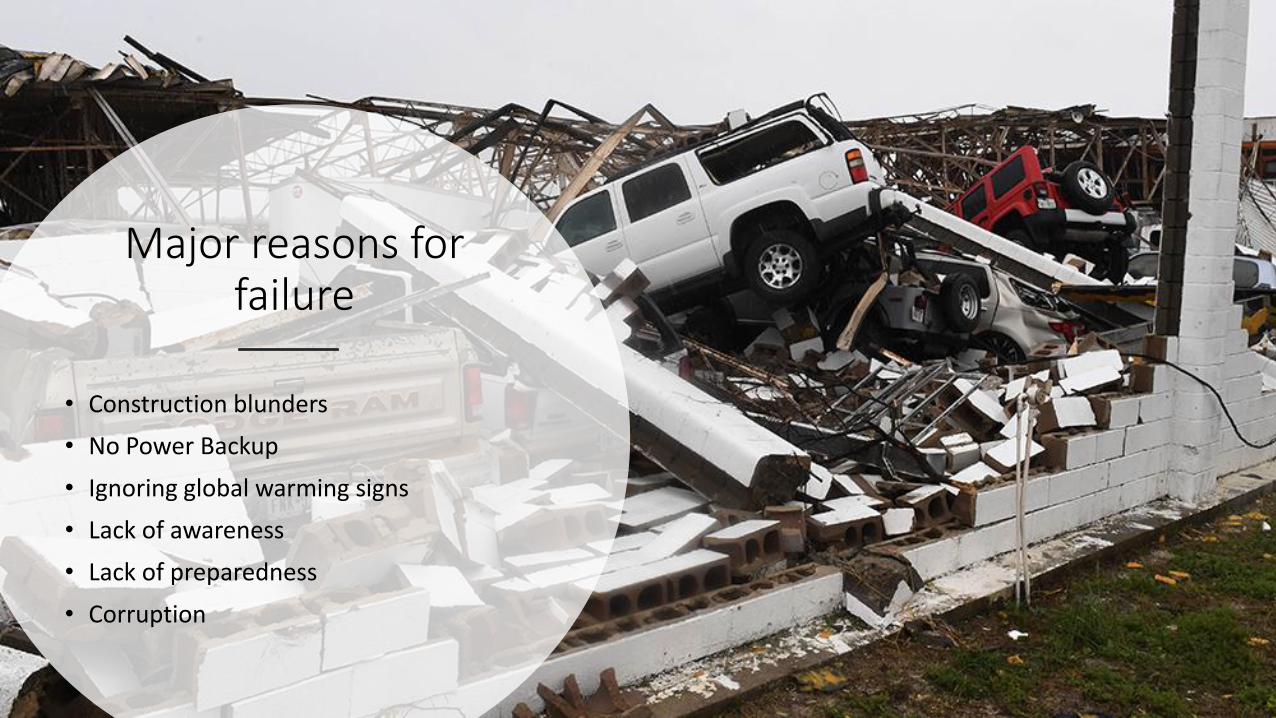
Major reasons for failure
• Construction blunders
• No Power Backup
• Ignoring global warming signs
• Lack of awareness
• Lack of preparedness
• Corruption
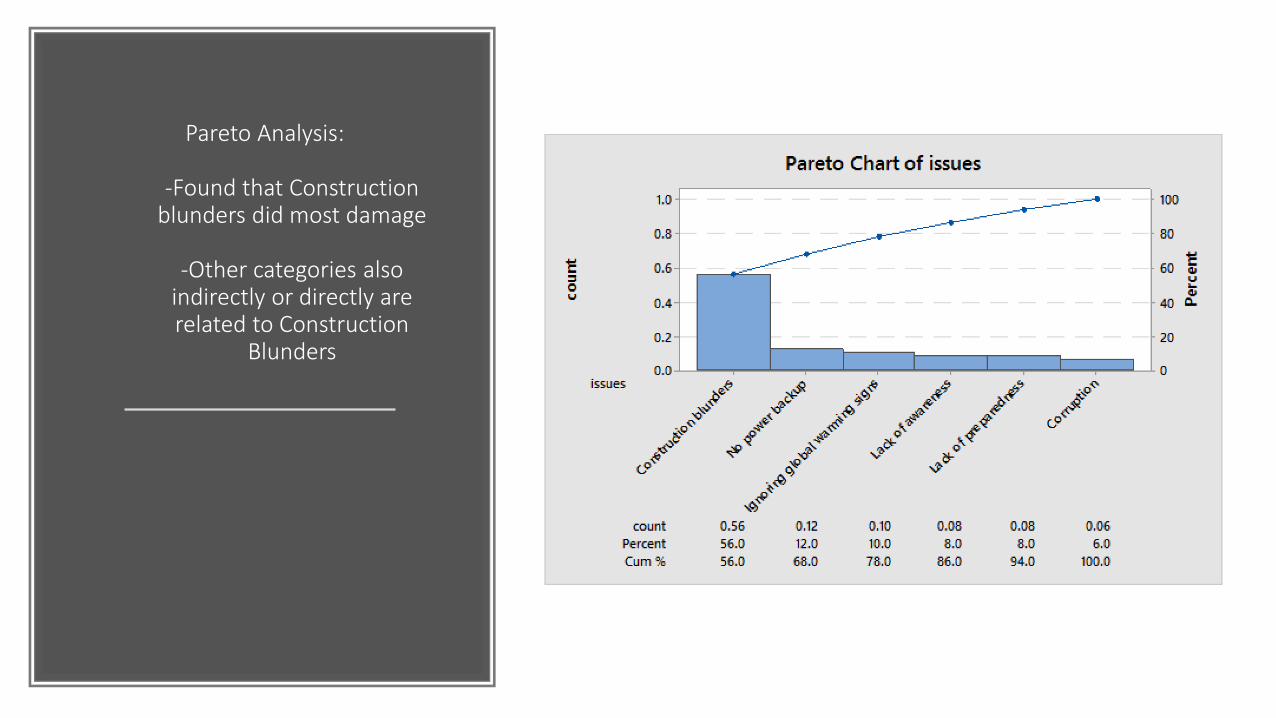
Pareto Analysis:
-Found that Construction blunders did most damage
-Other categories also
indirectly or directly are related to Construction
Blunders
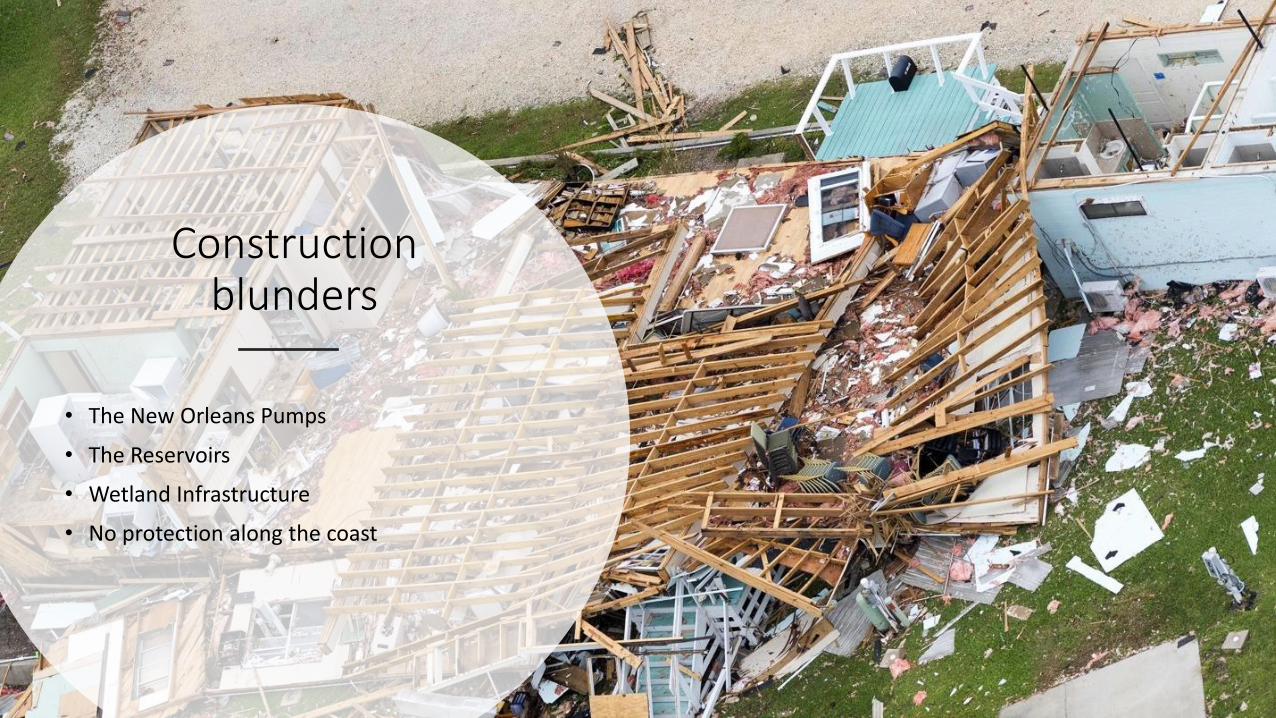
Construction blunders
• The New Orleans Pumps
• The Reservoirs
• Wetland Infrastructure
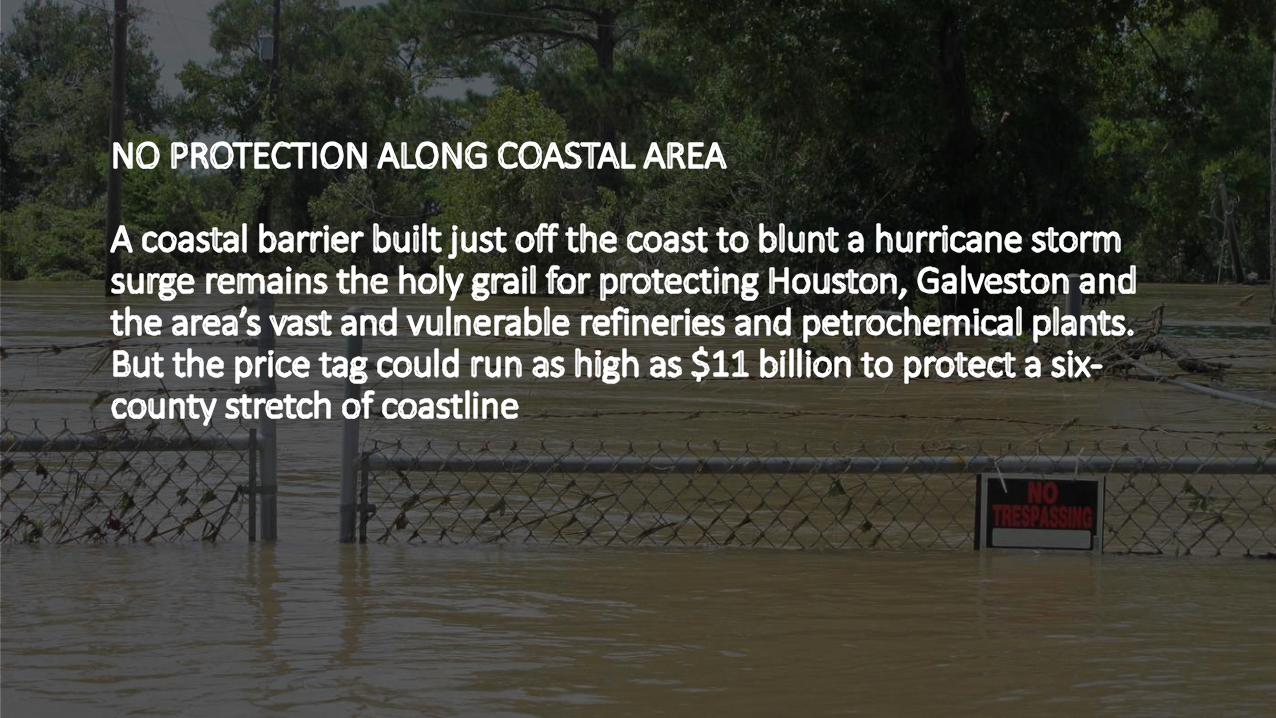
• No protection along the coast
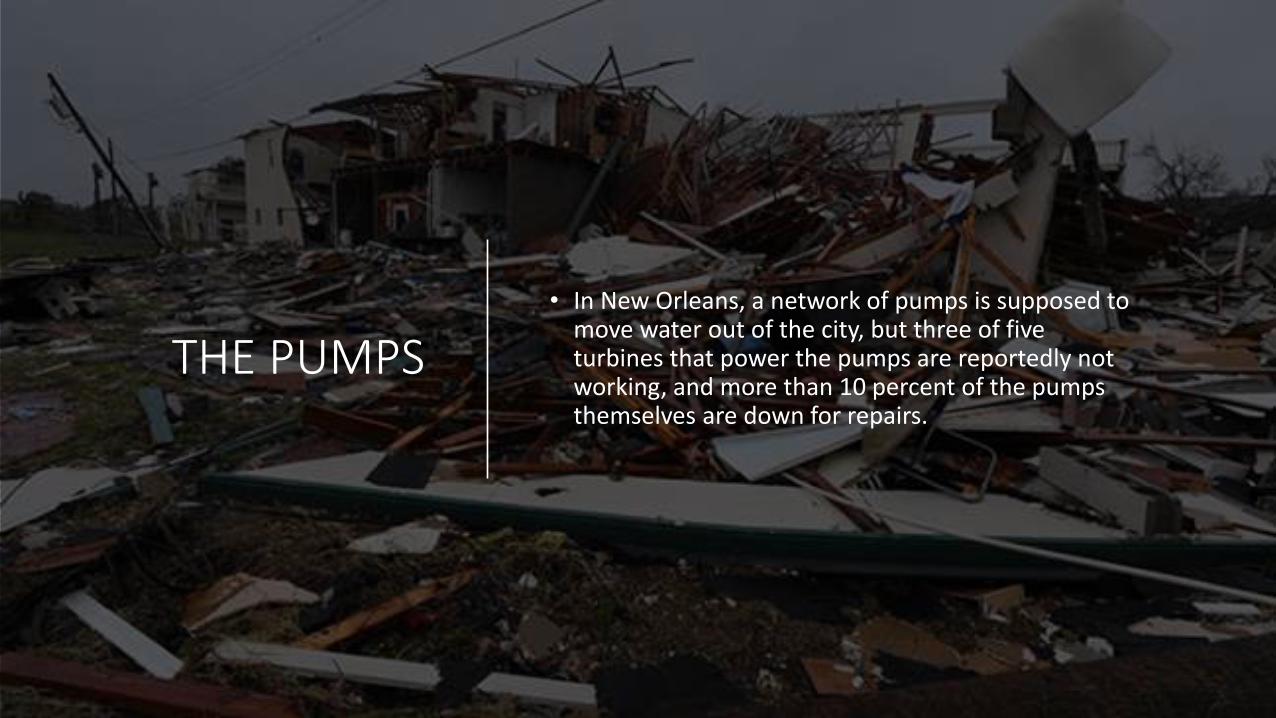
THE PUMPS • In New Orleans, a network of pumps is supposed to
move water out of the city, but three of five turbines that power the pumps are reportedly not working, and more than 10 percent of the pumps themselves are down for repairs.

THE RESERVOIRS
Huston has two major reservoirs:
• THE ADDICKS RESERVOIRS
• THE BARKER RESERVOIRS
These two reservoirs were meant to protect the adjacent regions from flooding, however, sadly they became the major reason why the neighboring regions were flooded.
https://projects.propublica.org/graphics/harvey-reservoirs
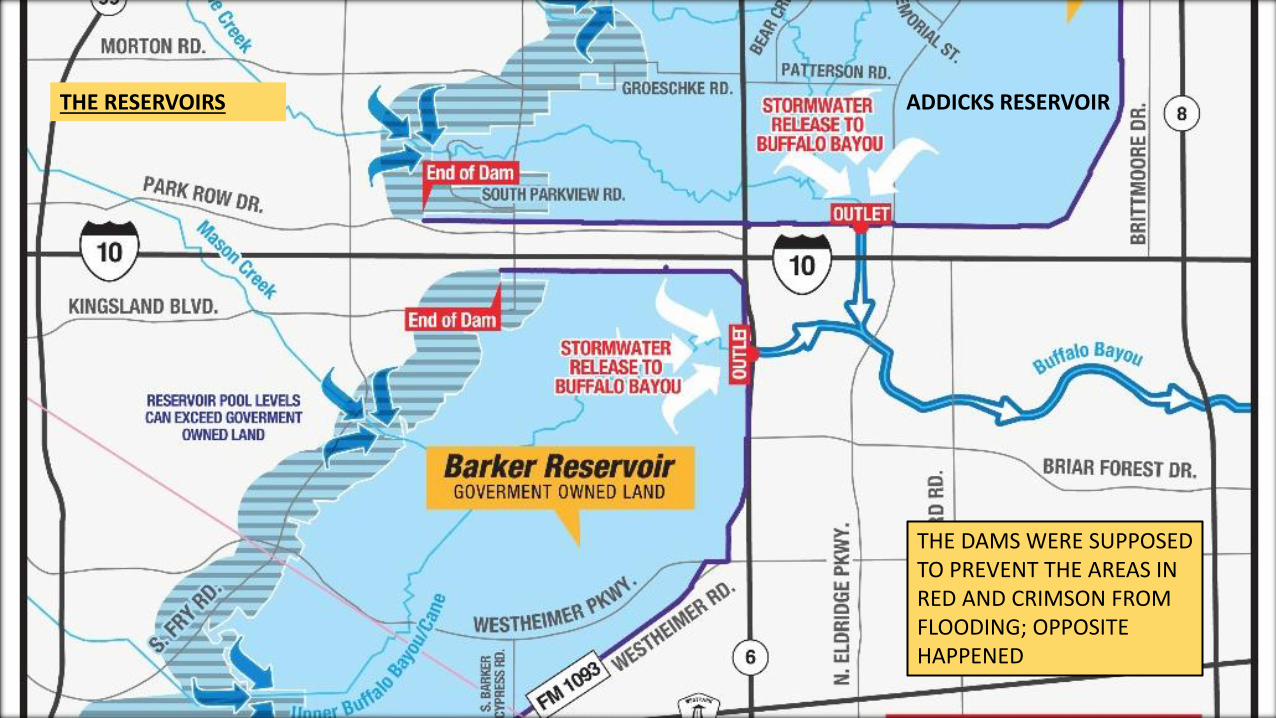
THE RESERVOIRS ADDICKS RESERVOIR
THE DAMS WERE SUPPOSED TO PREVENT THE AREAS IN RED AND CRIMSON FROM FLOODING; OPPOSITE HAPPENED
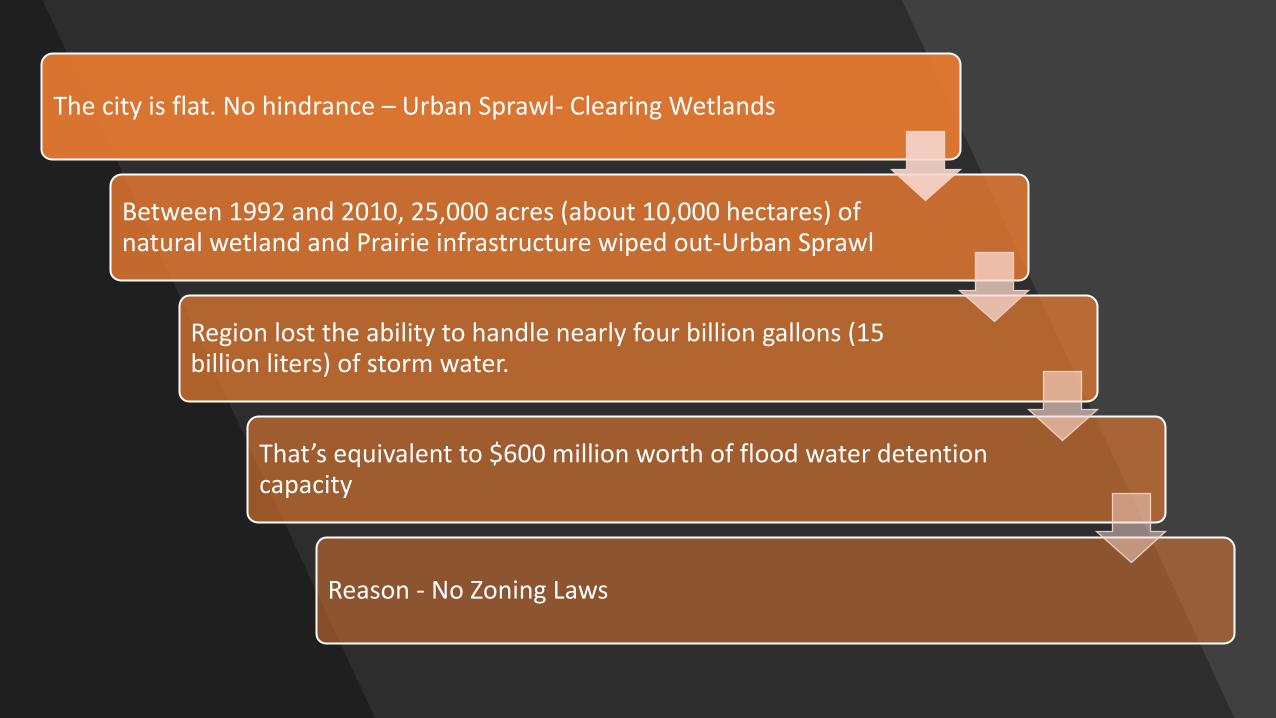
The city is flat. No hindrance – Urban Sprawl- Clearing Wetlands
Between 1992 and 2010, 25,000 acres (about 10,000 hectares) of natural wetland and Prairie infrastructure wiped out-Urban Sprawl
Region lost the ability to handle nearly four billion gallons (15 billion liters) of storm water.
That’s equivalent to $600 million worth of flood water detention capacity
Reason - No Zoning Laws
Critical to Quality Characteristics
CTQs are the key measurable characteristics of a product or process whose performance standards or specification limits must be met in order to make a high quality product which performs the desired functions.
• We will get to know about CTQC’s by doing a doing a COPQ analysis related to the several failures that we have discussed so far.
• To build a COPQ we performed a brainstorming session and created an affinity diagram.
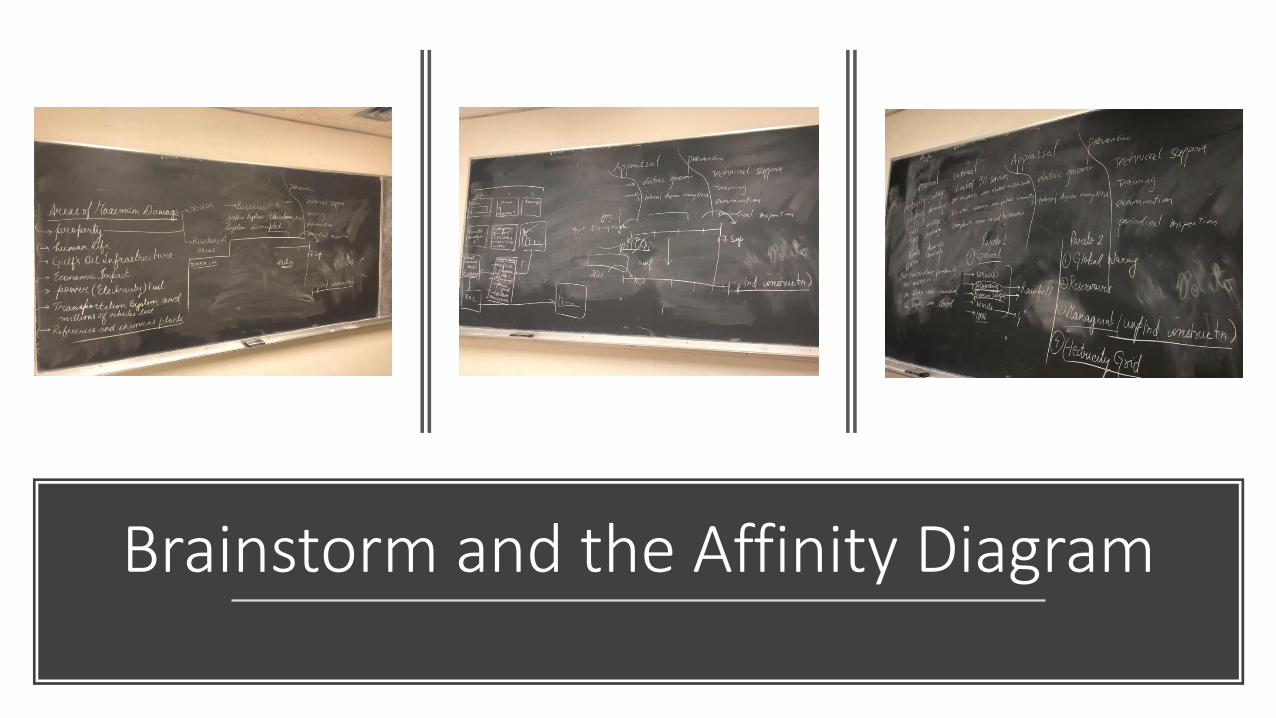
Brainstorm and the Affinity Diagram
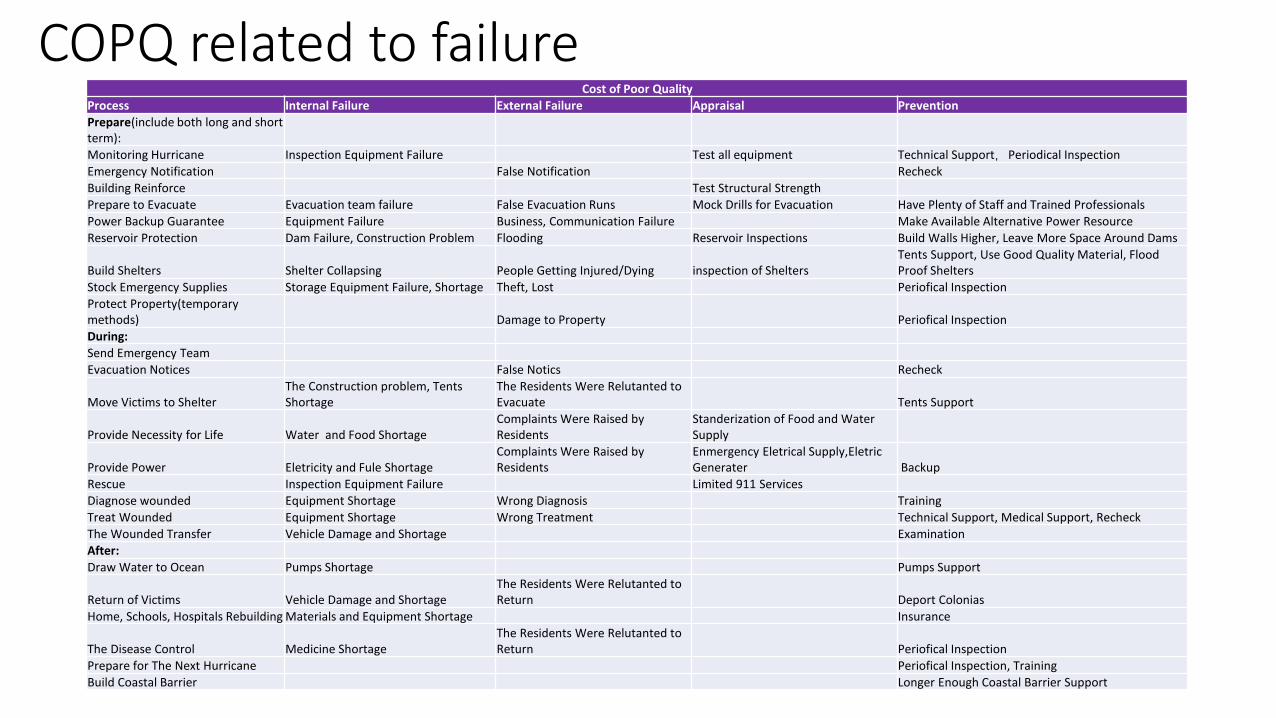
COPQ related to failure Cost of Poor Quality
Process Internal Failure External Failure Appraisal Prevention
Prepare(include both long and short term):
Monitoring Hurricane Inspection Equipment Failure Test all equipment Technical Support,Periodical Inspection
Emergency Notification False Notification Recheck
Building Reinforce Test Structural Strength
Prepare to Evacuate Evacuation team failure False Evacuation Runs Mock Drills for Evacuation Have Plenty of Staff and Trained Professionals
Power Backup Guarantee Equipment Failure Business, Communication Failure Make Available Alternative Power Resource
Reservoir Protection Dam Failure, Construction Problem Flooding Reservoir Inspections Build Walls Higher, Leave More Space Around Dams
Build Shelters Shelter Collapsing People Getting Injured/Dying inspection of Shelters Tents Support, Use Good Quality Material, Flood Proof Shelters
Stock Emergency Supplies Storage Equipment Failure, Shortage Theft, Lost Periofical Inspection
Protect Property(temporary methods) Damage to Property Periofical Inspection
During:
Send Emergency Team
Evacuation Notices False Notics Recheck
Move Victims to Shelter The Construction problem, Tents Shortage
The Residents Were Relutanted to Evacuate Tents Support
Provide Necessity for Life Water and Food Shortage Complaints Were Raised by Residents
Standerization of Food and Water Supply
Provide Power Eletricity and Fule Shortage Complaints Were Raised by Residents
Enmergency Eletrical Supply,Eletric Generater Backup
Rescue Inspection Equipment Failure Limited 911 Services
Diagnose wounded Equipment Shortage Wrong Diagnosis Training
Treat Wounded Equipment Shortage Wrong Treatment Technical Support, Medical Support, Recheck
The Wounded Transfer Vehicle Damage and Shortage Examination
After:
Draw Water to Ocean Pumps Shortage Pumps Support
Return of Victims Vehicle Damage and Shortage The Residents Were Relutanted to Return Deport Colonias
Home, Schools, Hospitals Rebuilding Materials and Equipment Shortage Insurance
The Disease Control Medicine Shortage The Residents Were Relutanted to Return Periofical Inspection
Prepare for The Next Hurricane Periofical Inspection, Training
Build Coastal Barrier Longer Enough Coastal Barrier Support

Hidden Costs
• Indirect costs
• Can be long term or short term
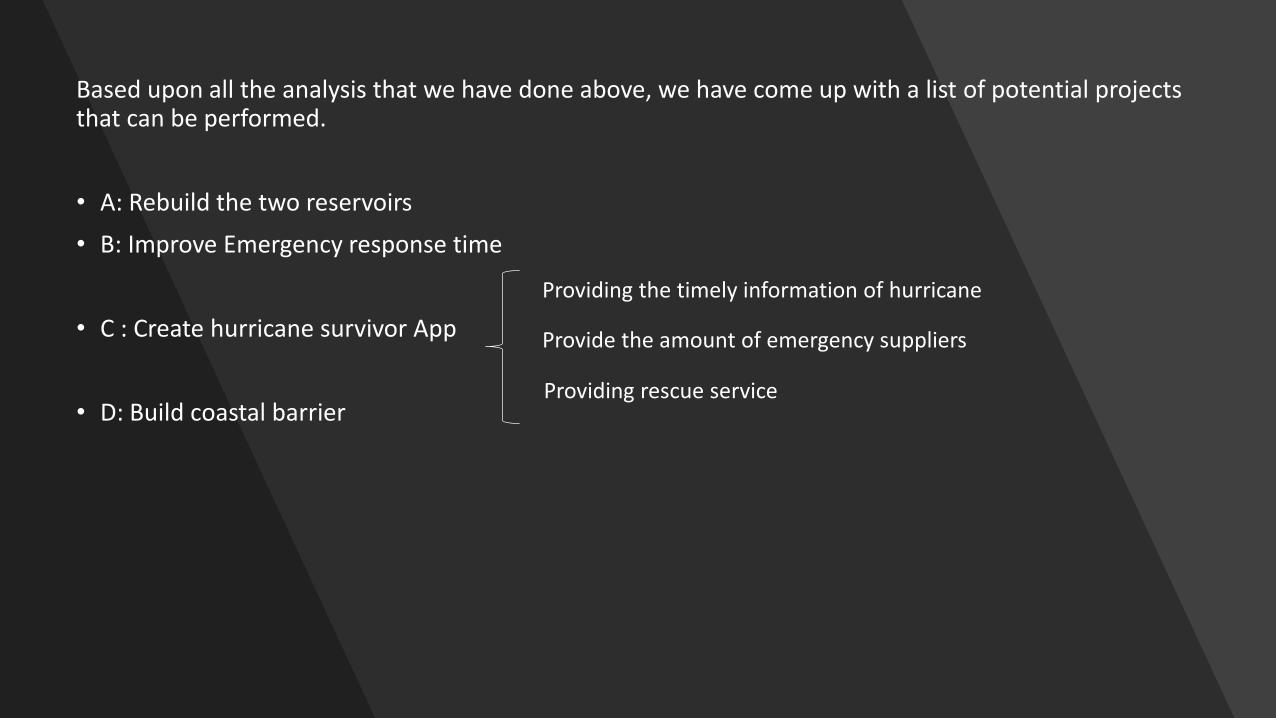
Based upon all the analysis that we have done above, we have come up with a list of potential projects that can be performed.
• A: Rebuild the two reservoirs
• B: Improve Emergency response time
• C : Create hurricane survivor App
• D: Build coastal barrier
Providing the timely information of hurricane
Provide the amount of emergency suppliers
Providing rescue service
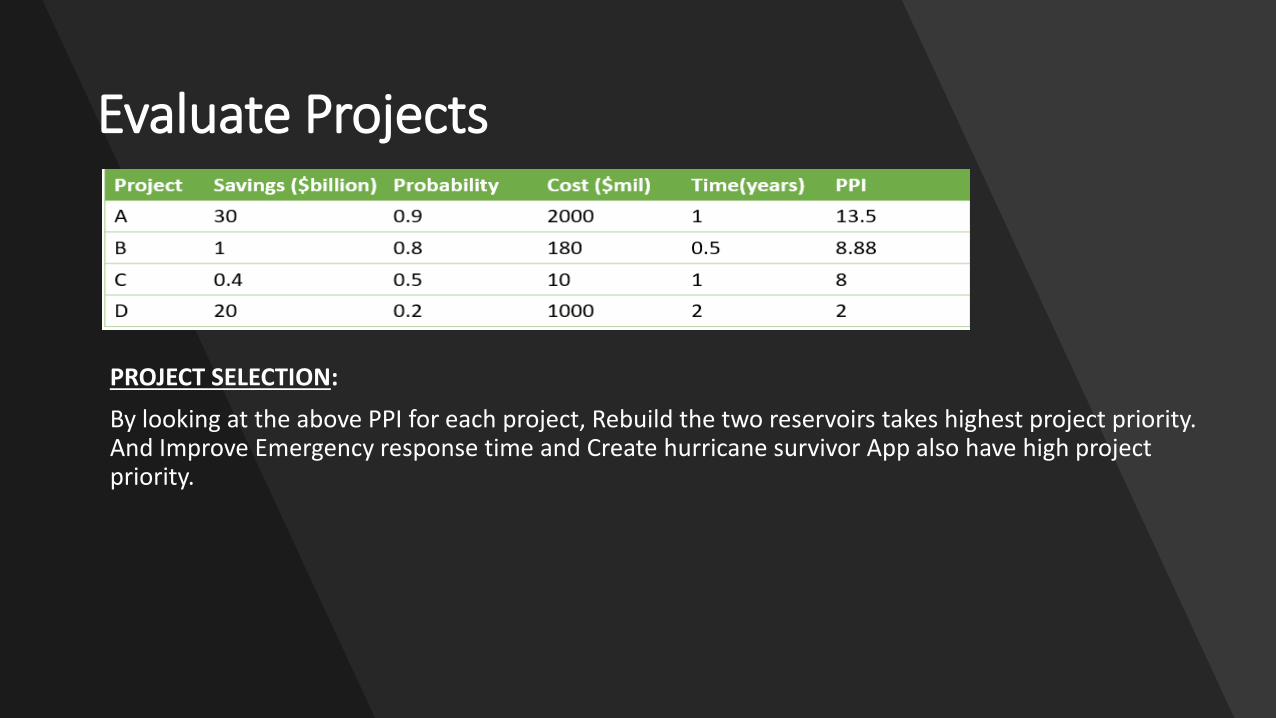
Evaluate Projects
PROJECT SELECTION:
By looking at the above PPI for each project, Rebuild the two reservoirs takes highest project priority. And Improve Emergency response time and Create hurricane survivor App also have high project priority.
Measure Phase
In the Measure Phase, the team refines the measurement definitions and determines the current performance or the baseline of the process Define the Current State Collect Data on the Current State Identify any unforeseen problems/opportunities Create detailed process flow charts/value stream maps
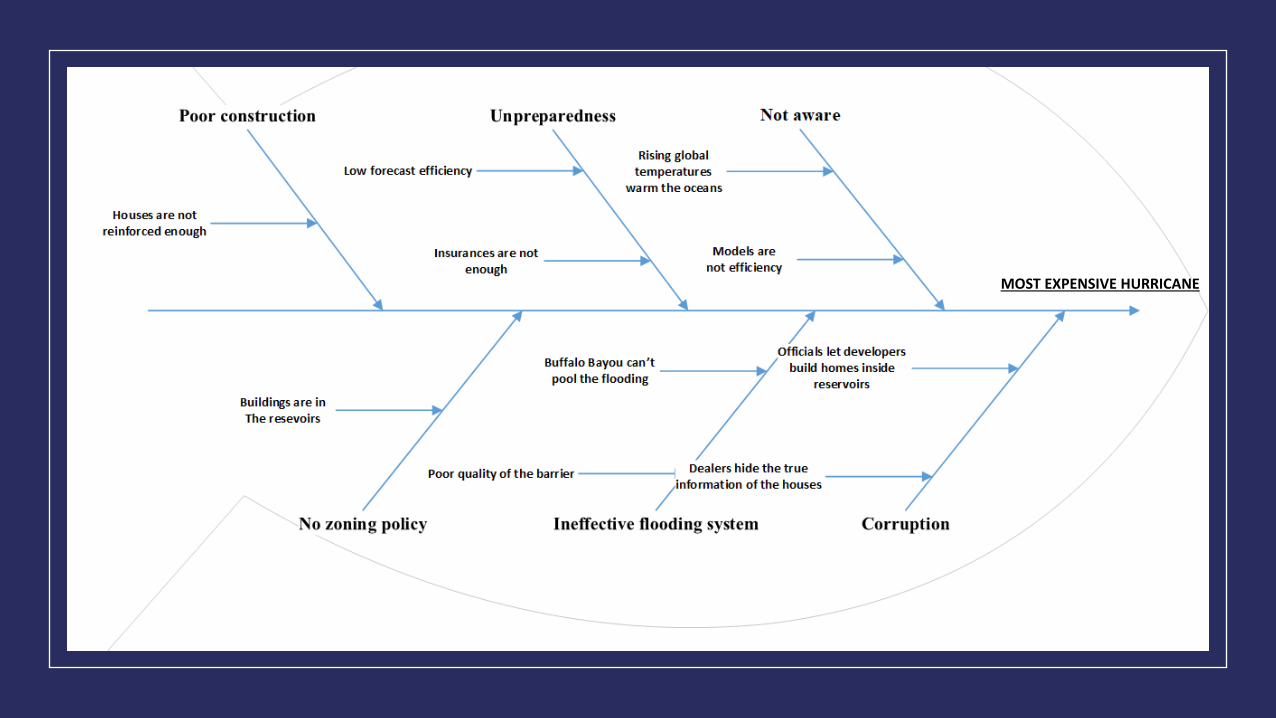
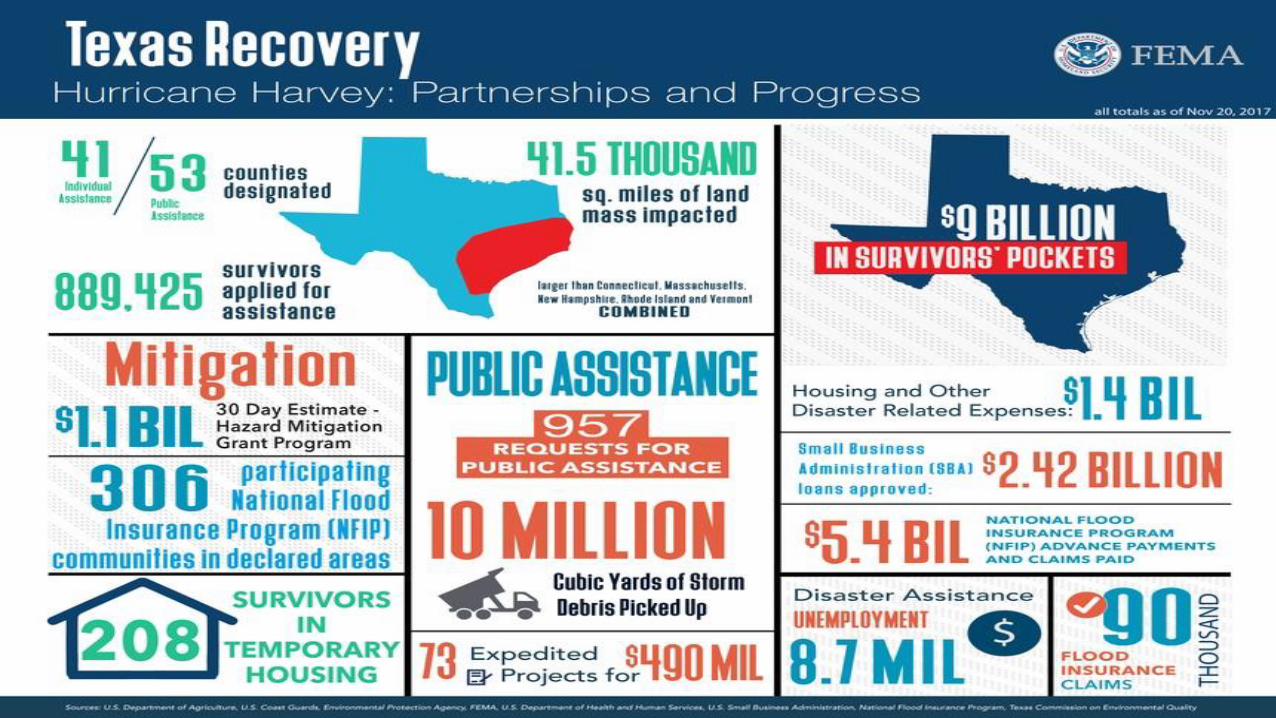
MOST EXPENSIVE HURRICANE
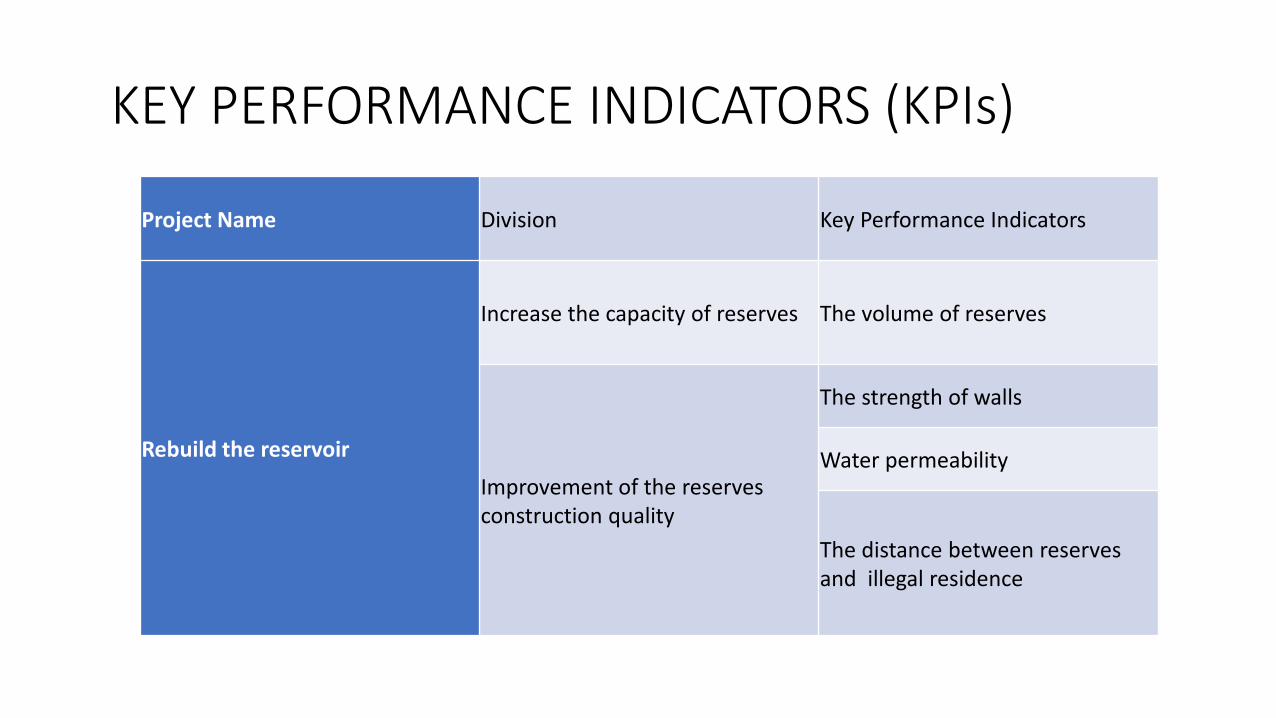
KEY PERFORMANCE INDICATORS (KPIs)
Project Name Division Key Performance Indicators
Rebuild the reservoir
Increase the capacity of reserves The volume of reserves
Improvement of the reserves construction quality
The strength of walls
Water permeability
The distance between reserves and illegal residence
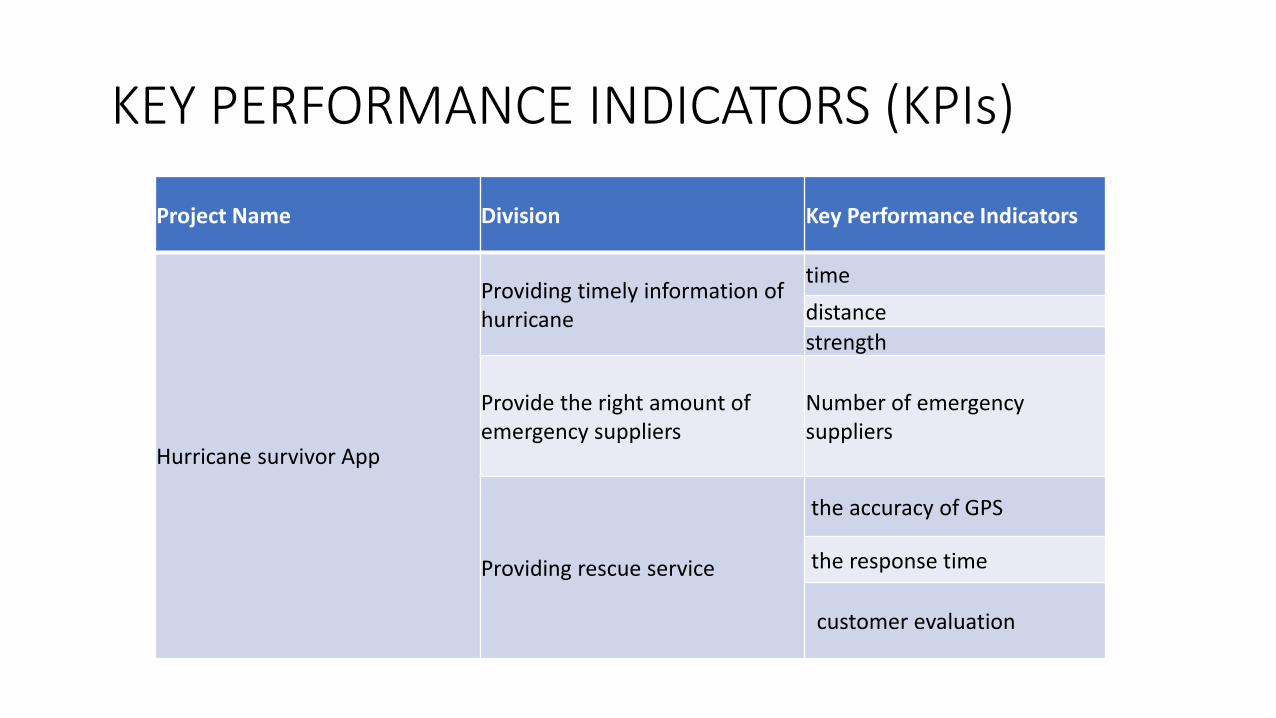
KEY PERFORMANCE INDICATORS (KPIs)
Project Name Division Key Performance Indicators
Hurricane survivor App
Providing timely information of hurricane
time
distance
strength
Provide the right amount of emergency suppliers
Number of emergency suppliers
Providing rescue service
the accuracy of GPS
the response time
customer evaluation
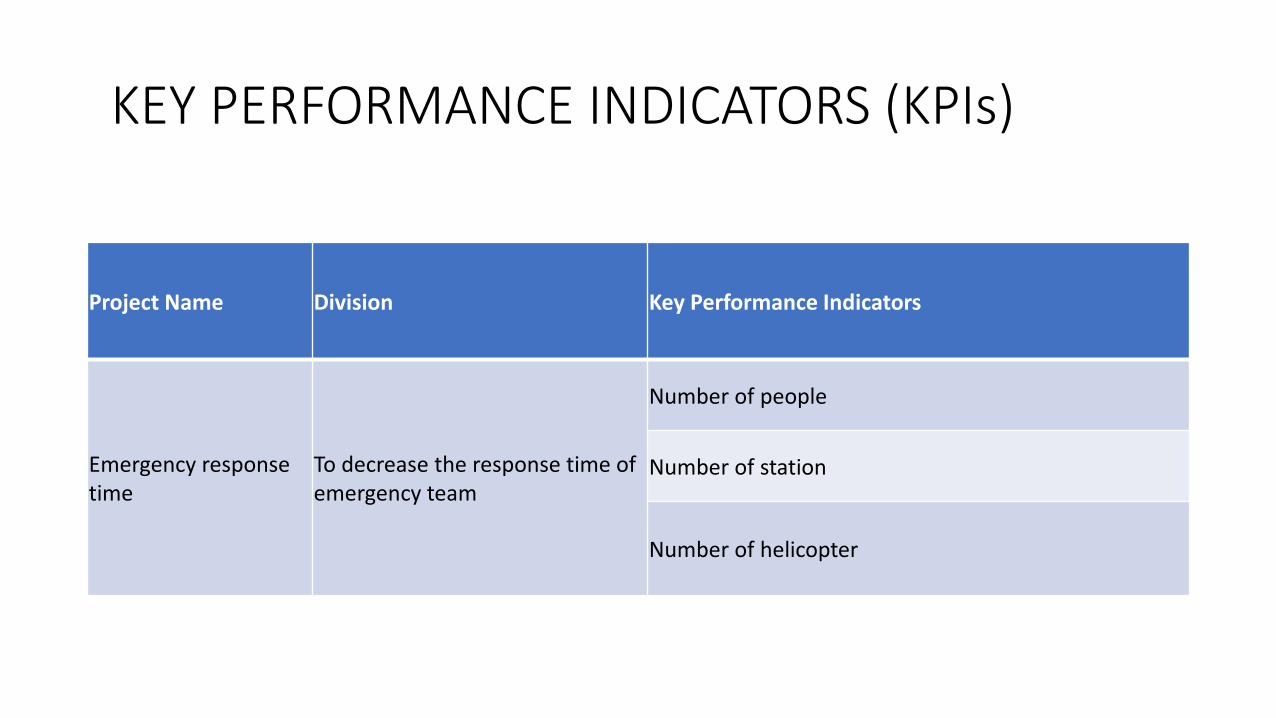
KEY PERFORMANCE INDICATORS (KPIs)
Project Name Division Key Performance Indicators
Emergency response time
To decrease the response time of emergency team
Number of people
Number of station
Number of helicopter
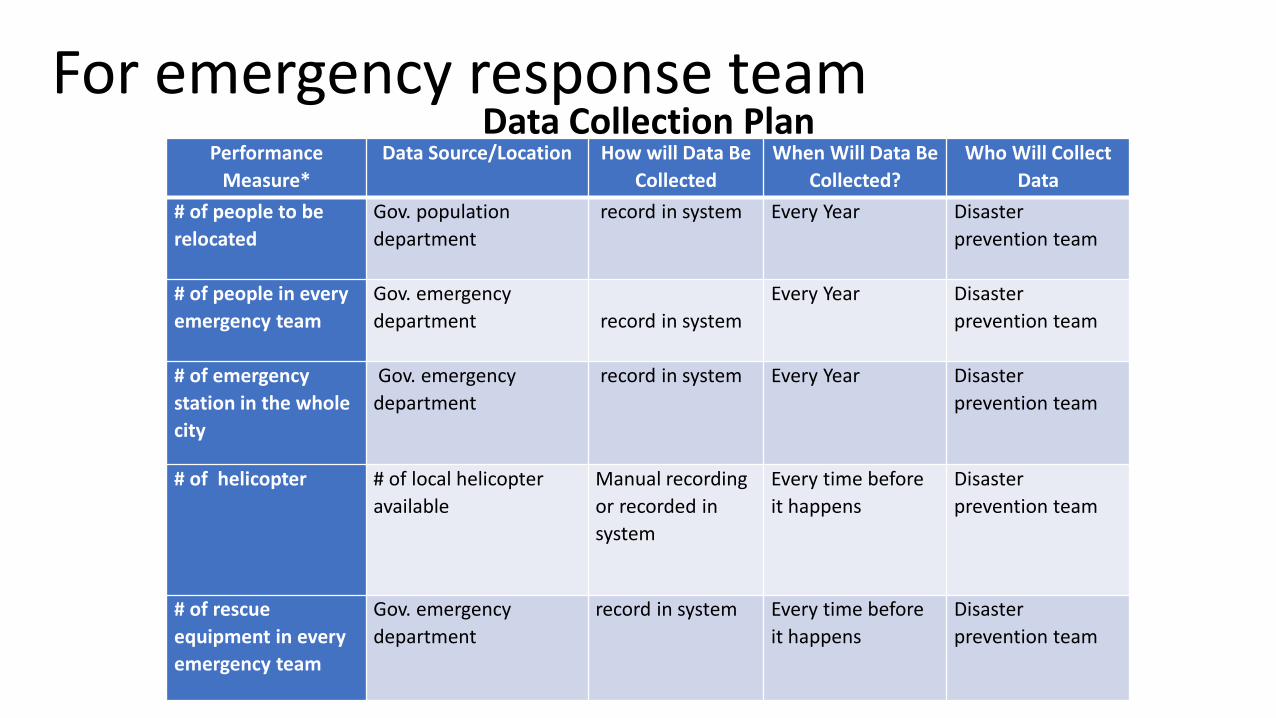
For emergency response team Data Collection Plan
Performance
Measure*
Data Source/Location How will Data Be
Collected
When Will Data Be
Collected?
Who Will Collect
Data
# of people to be
relocated
Gov. population
department
record in system Every Year
Disaster
prevention team
# of people in every
emergency team
Gov. emergency
department
record in system
Every Year
Disaster
prevention team
# of emergency
station in the whole
city
Gov. emergency
department
record in system Every Year
Disaster
prevention team
# of helicopter # of local helicopter
available
Manual recording
or recorded in
system
Every time before
it happens
Disaster
prevention team
# of rescue
equipment in every
emergency team
Gov. emergency
department
record in system Every time before
it happens
Disaster
prevention team
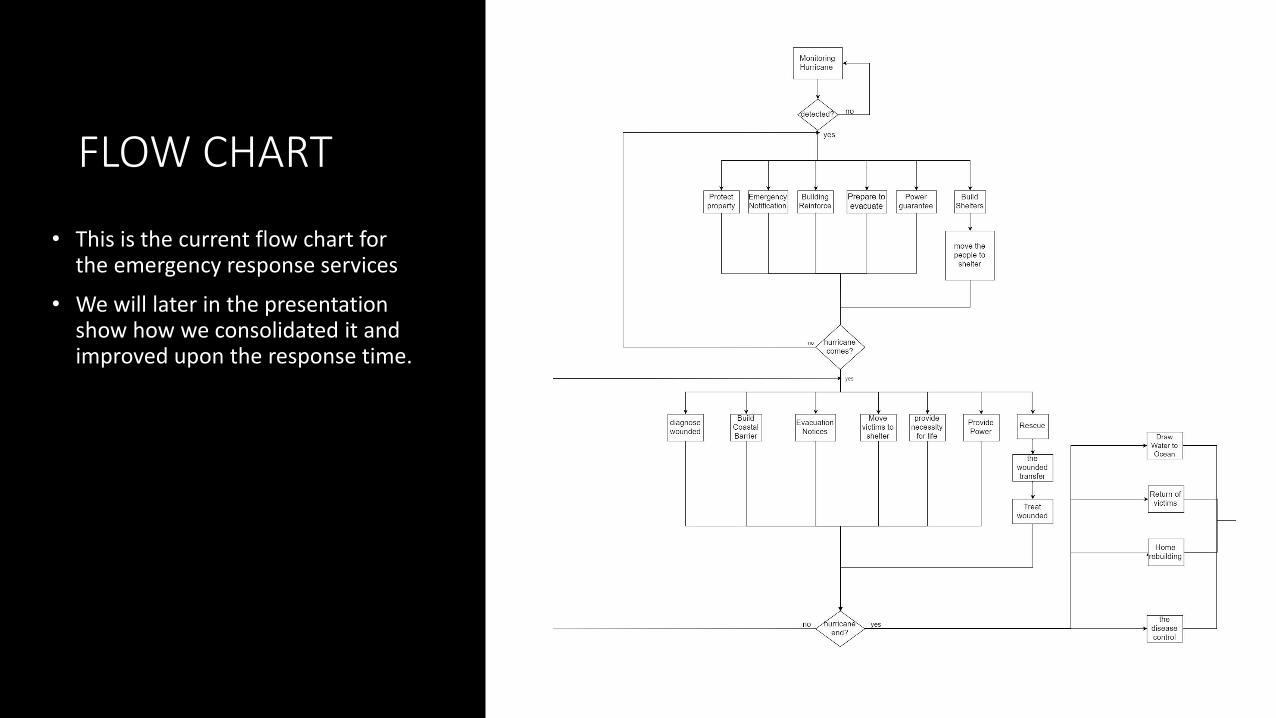
FLOW CHART
• This is the current flow chart for the emergency response services
• We will later in the presentation show how we consolidated it and improved upon the response time.
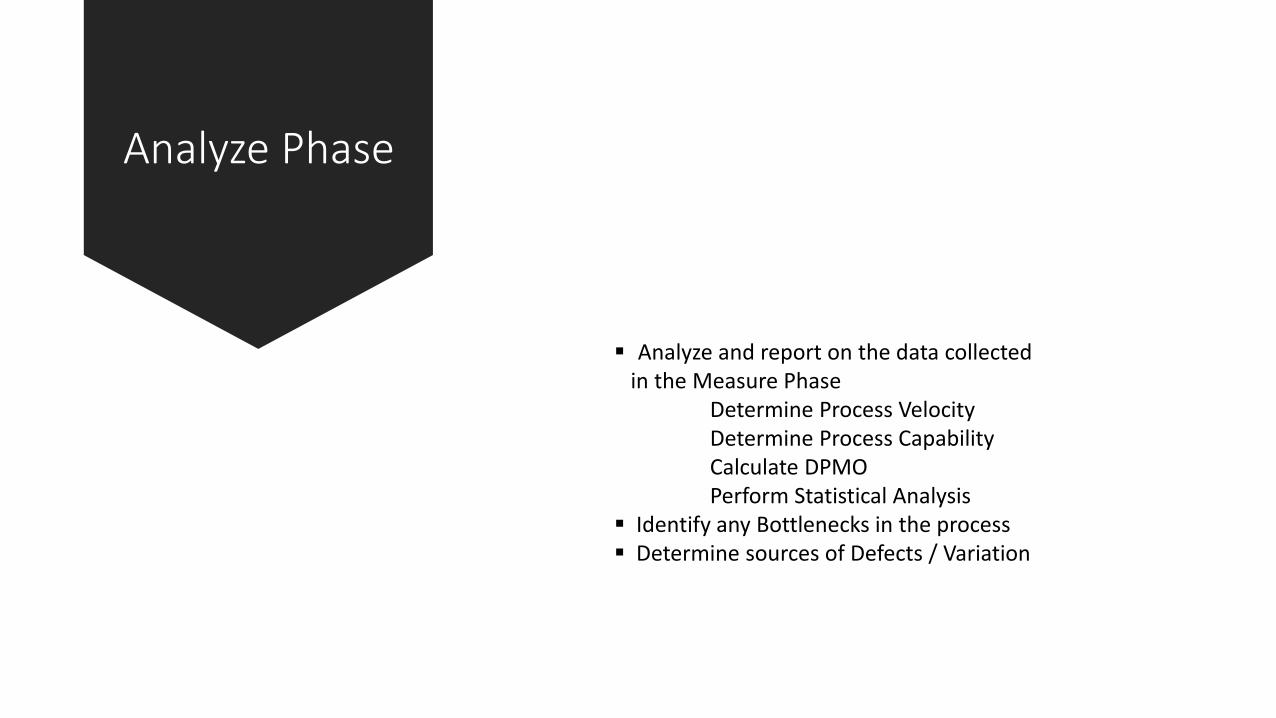
Analyze Phase
Analyze and report on the data collected in the Measure Phase Determine Process Velocity Determine Process Capability Calculate DPMO Perform Statistical Analysis Identify any Bottlenecks in the process Determine sources of Defects / Variation

The Emergency Response Time(DOE) Based on the above results, we have made the
following design of experiments the output being RESPONSE TIME and the 3 factors effecting this output are AIR AID(a), NUMBER OF PEOPLE PER STATION(b) AND THE NUMBER OF STATIONS(c).
After research, we found the following:
16 major stations
It took an average of 12 days to about 2300 rescue service
people to save 780,000 people in need.
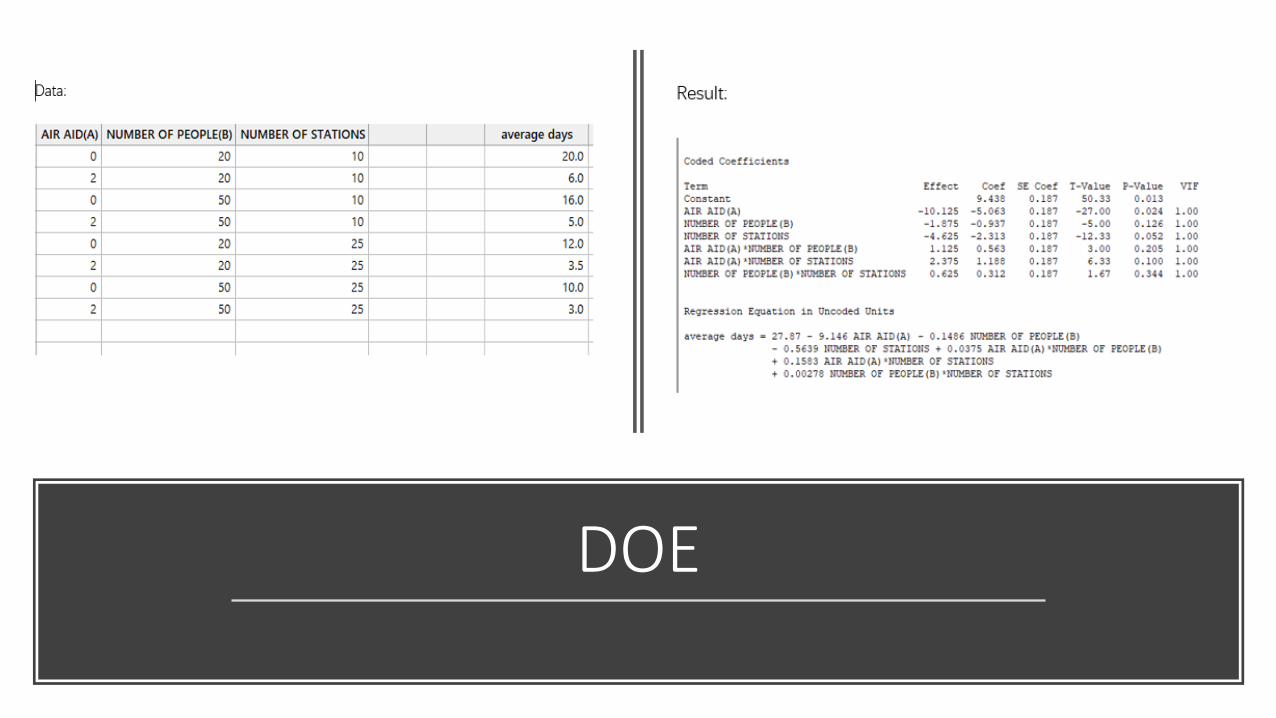
DOE
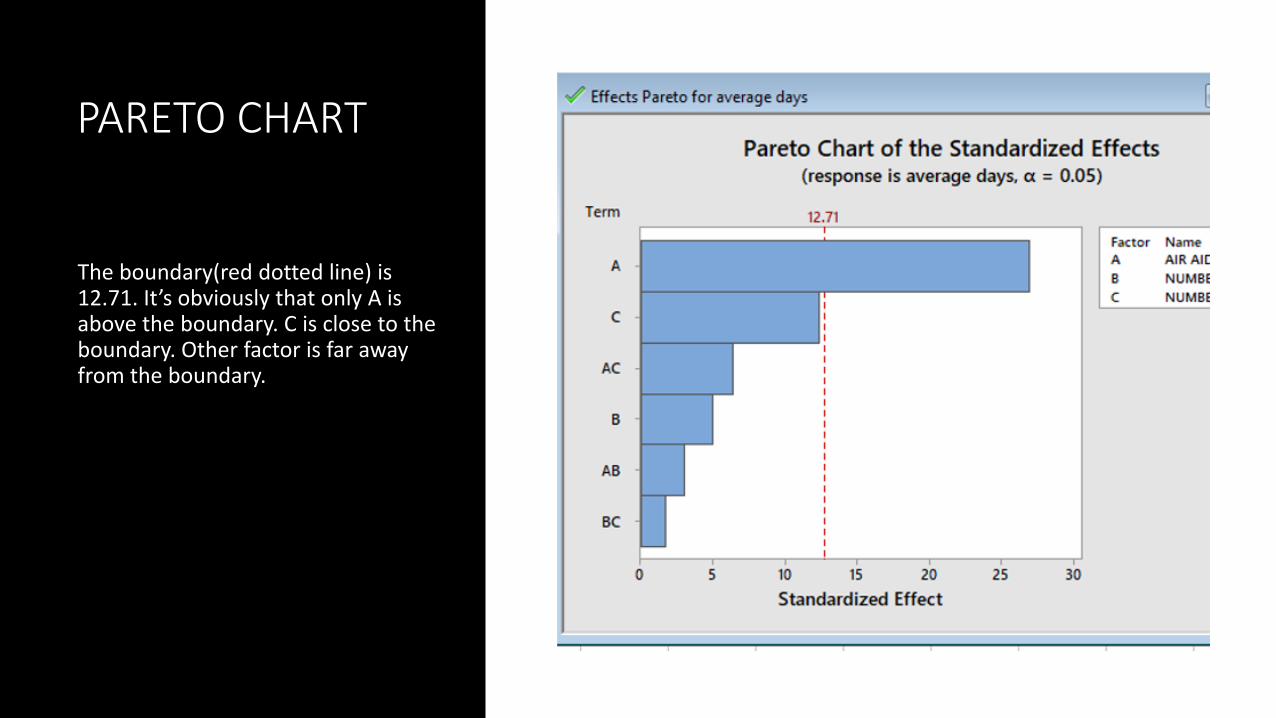
PARETO CHART
The boundary(red dotted line) is 12.71. It’s obviously that only A is above the boundary. C is close to the boundary. Other factor is far away from the boundary.
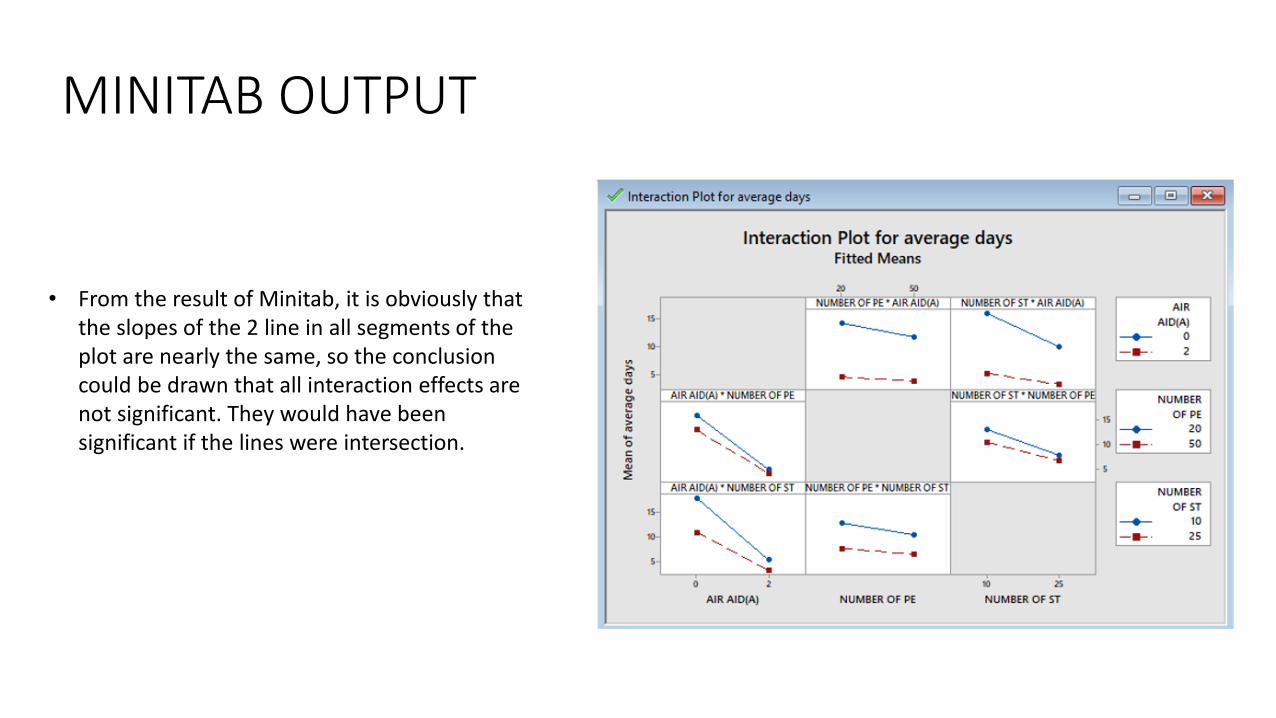
MINITAB OUTPUT
• From the result of Minitab, it is obviously that the slopes of the 2 line in all segments of the plot are nearly the same, so the conclusion could be drawn that all interaction effects are not significant. They would have been significant if the lines were intersection.
THE ANALYSIS
Description: There are 3 factors that might influence response: Air Aid, Number of People, and Number of stations. Holding experiments under 8 situations to find out which factor is most significant to response.
Conclusion: Interaction influences are all not significant to the response. For single factor, only air aid is significant to response, number of stations are close to being significant, and number of people is not significant.

STATISTICAL PROCESS ANALYSIS
Statistical process control (SPC) is a method of quality control which employs statistical methods to monitor and control a process.
Here we are attempting to analyze the capacity of the current reservoirs in Huston which were incapable of storing the rain water and lead to massive flooding.
The current holding capacity of the two reservoirs combined is about 510 GL
We are using the capability six pack for doing this.

CAPABILITY ANALYSIS
• So, we can observe that the process is not very capable as both Cpk and Ppk are below 1.
• We have the X bar which has 1 outlier.
• In the R chart we can see that about 4 points are dangerously close to becoming outliers
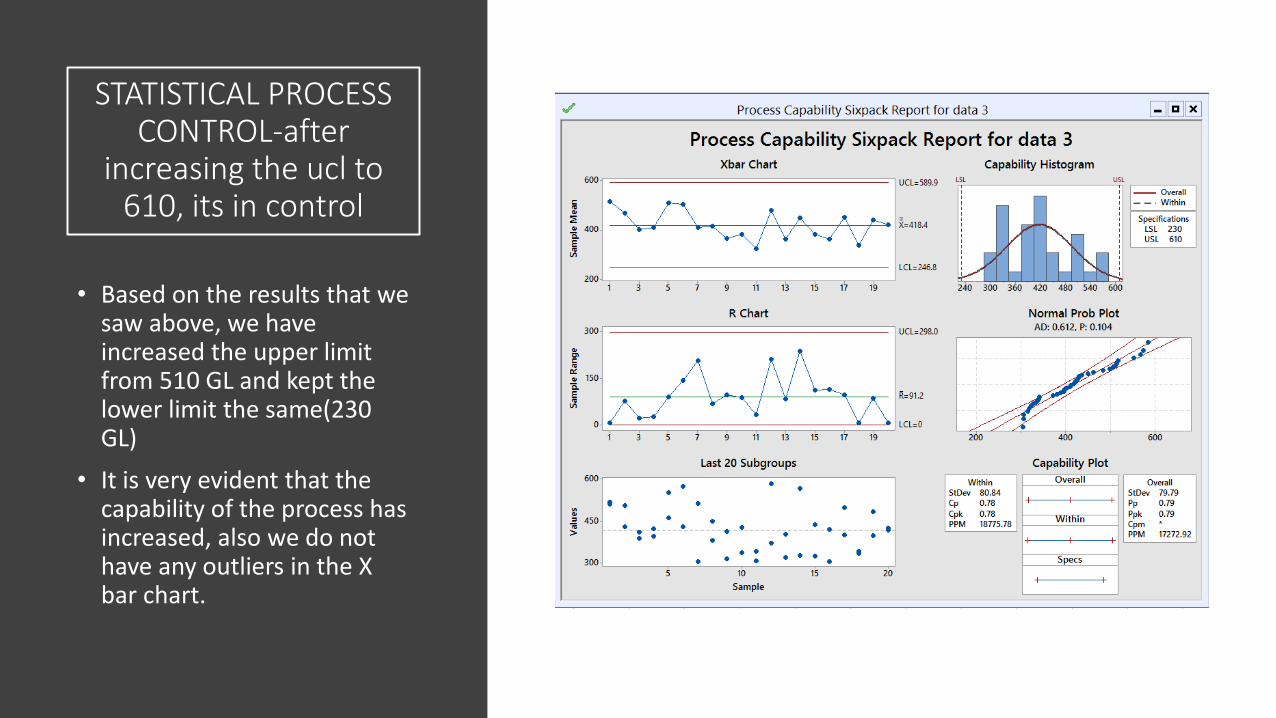
STATISTICAL PROCESS CONTROL-after
increasing the ucl to 610, its in control
• Based on the results that we saw above, we have increased the upper limit from 510 GL and kept the lower limit the same(230 GL)
• It is very evident that the capability of the process has increased, also we do not have any outliers in the X bar chart.
THE ANALYSIS
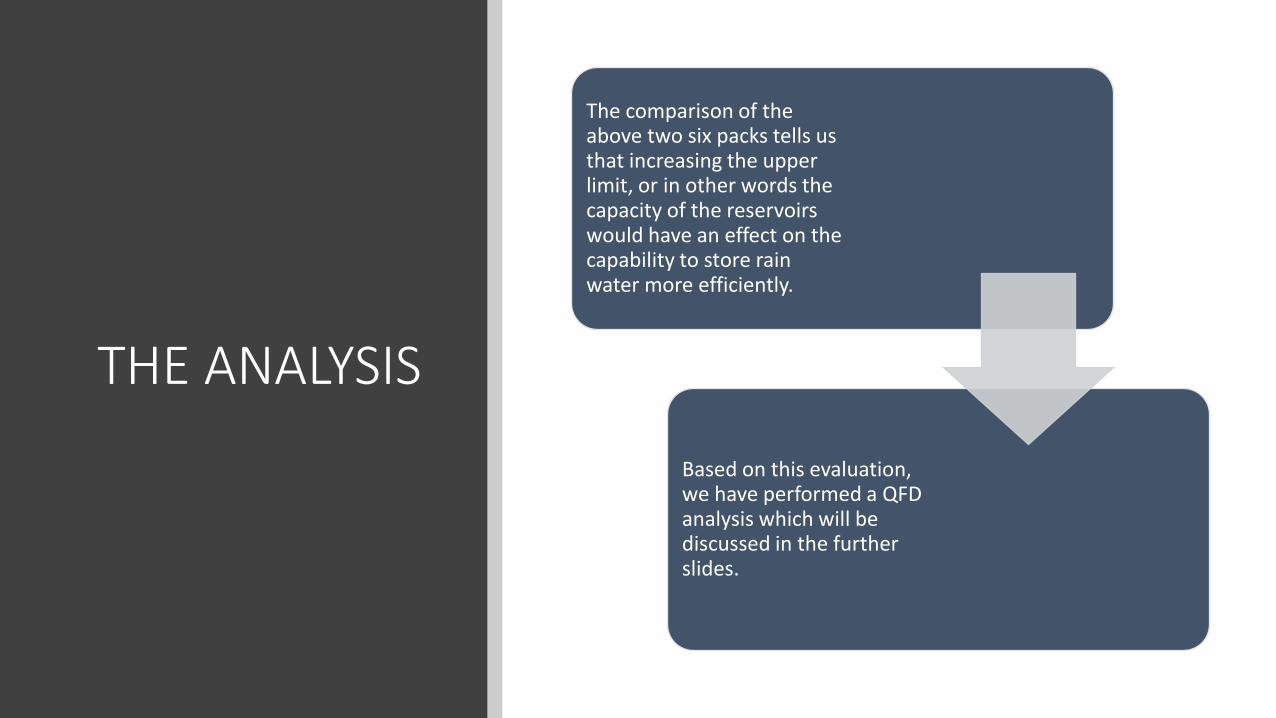
The comparison of the above two six packs tells us that increasing the upper limit, or in other words the capacity of the reservoirs would have an effect on the capability to store rain water more efficiently.
Based on this evaluation, we have performed a QFD analysis which will be discussed in the further slides.
VALUE STREAM MAPPING
VSM is a technique used to document, analyze and improve the flow of information or materials required to produce a product or service.
Here we have used VSM to make the emergency response services more efficient.
CURRENT PROCESS
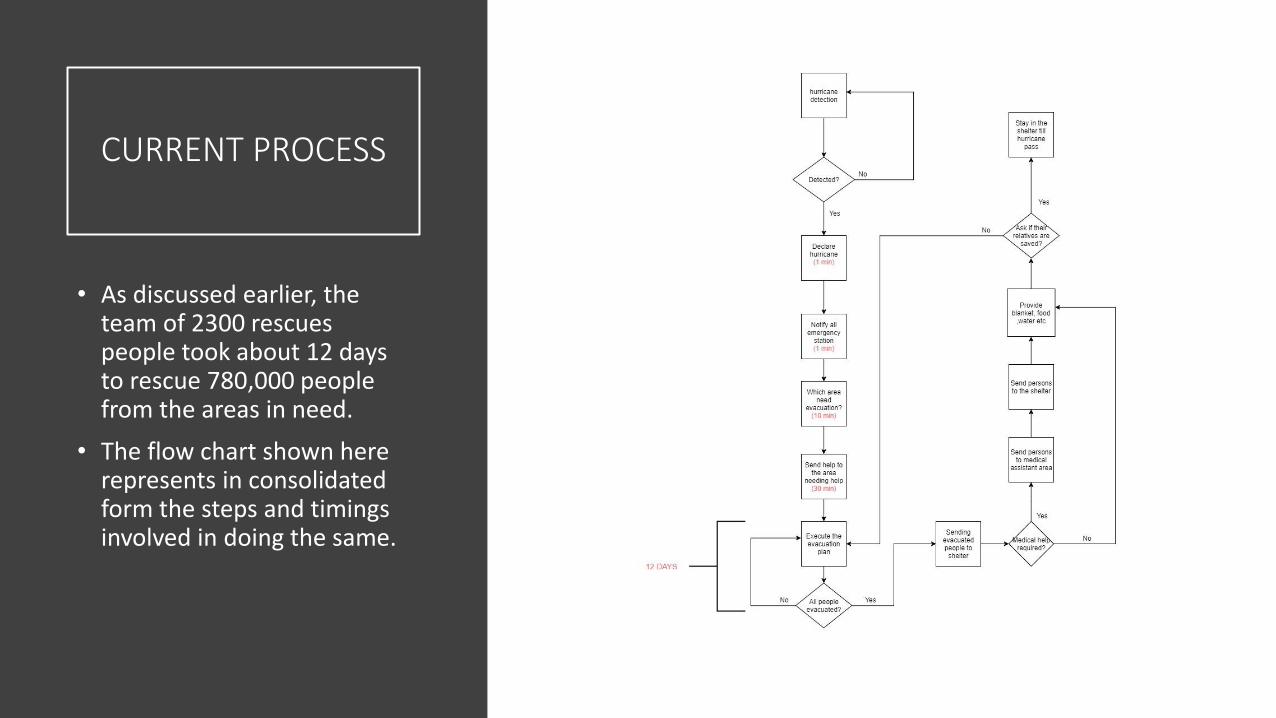
• As discussed earlier, the team of 2300 rescues people took about 12 days to rescue 780,000 people from the areas in need.
• The flow chart shown here represents in consolidated form the steps and timings involved in doing the same.
THE FUTURE PROCESS
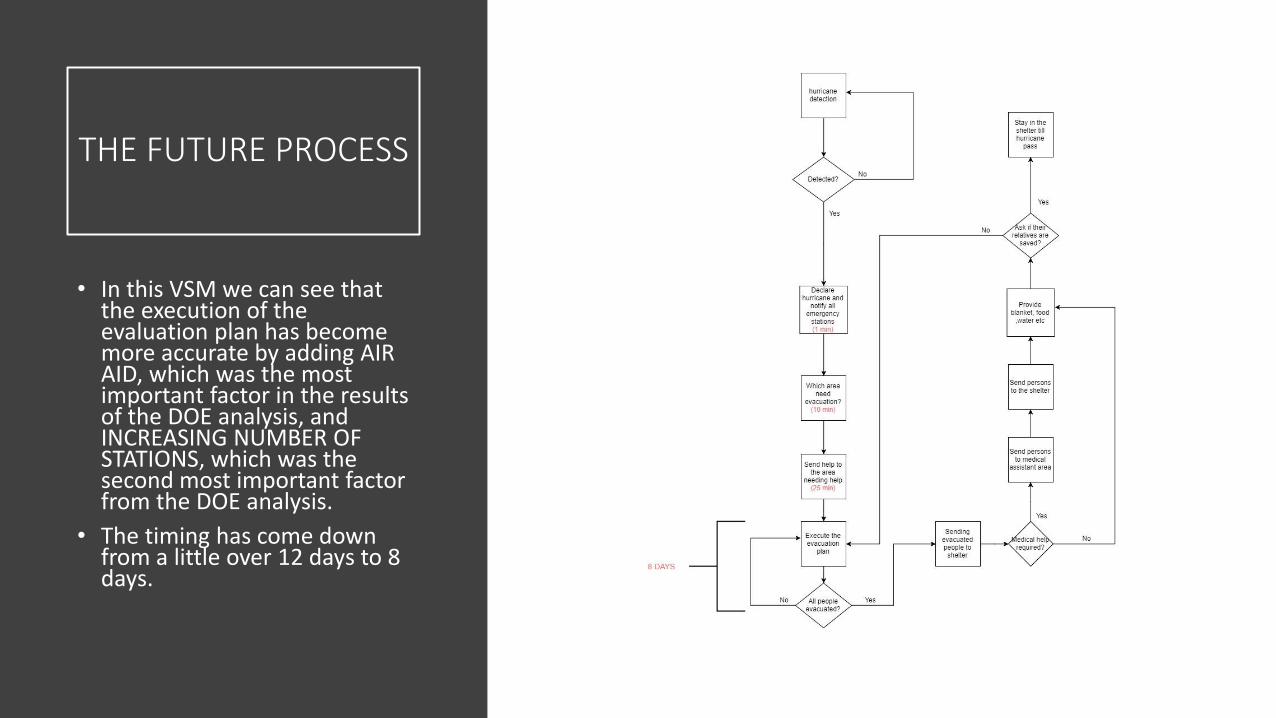
• In this VSM we can see that the execution of the evaluation plan has become more accurate by adding AIR AID, which was the most important factor in the results of the DOE analysis, and INCREASING NUMBER OF STATIONS, which was the second most important factor from the DOE analysis.
• The timing has come down from a little over 12 days to 8 days.
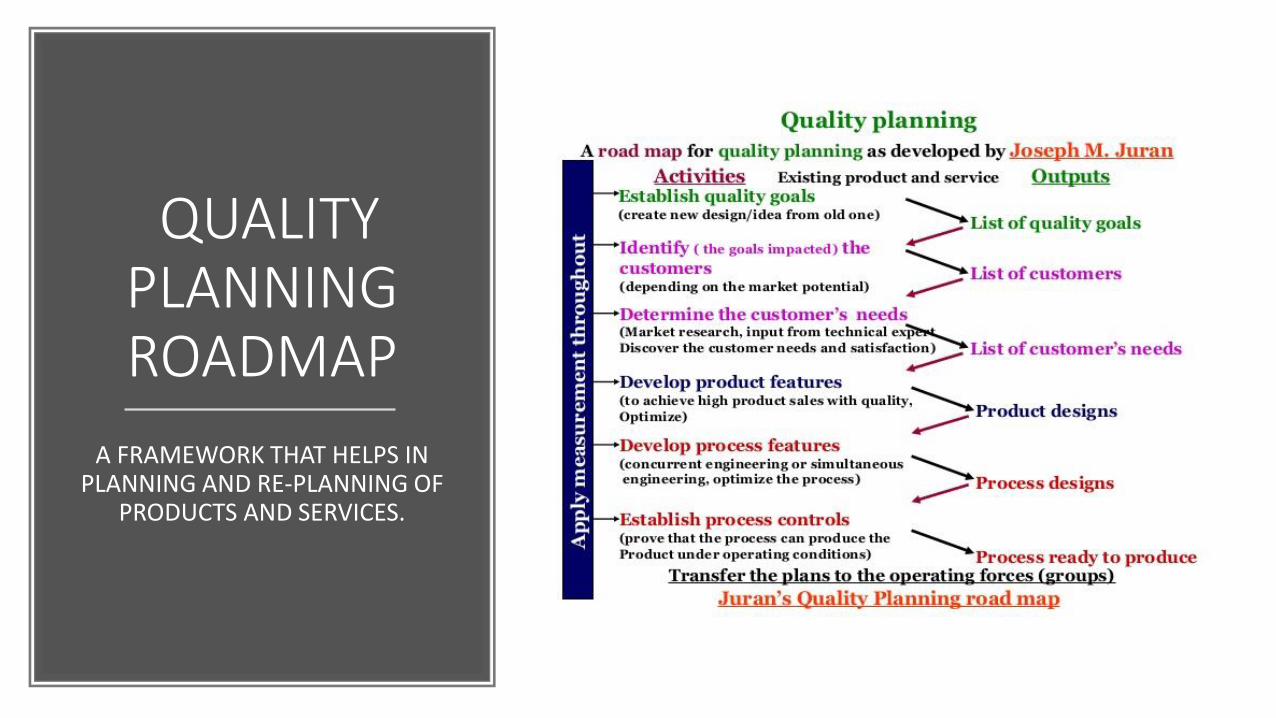
QUALITY PLANNING ROADMAP
A FRAMEWORK THAT HELPS IN PLANNING AND RE-PLANNING OF
PRODUCTS AND SERVICES.
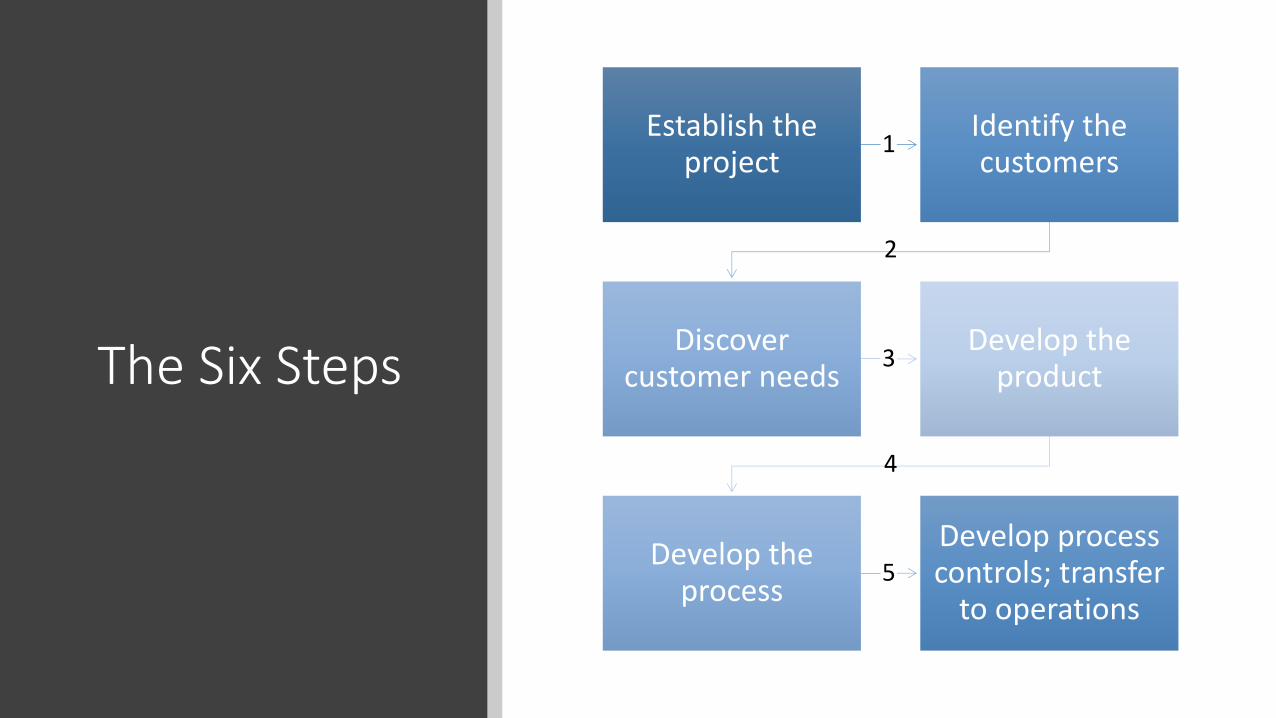
The Six Steps
1 Establish the
project
2
Identify the customers
3 Discover
customer needs
4
Develop the product
5 Develop the
process
Develop process controls; transfer
to operations
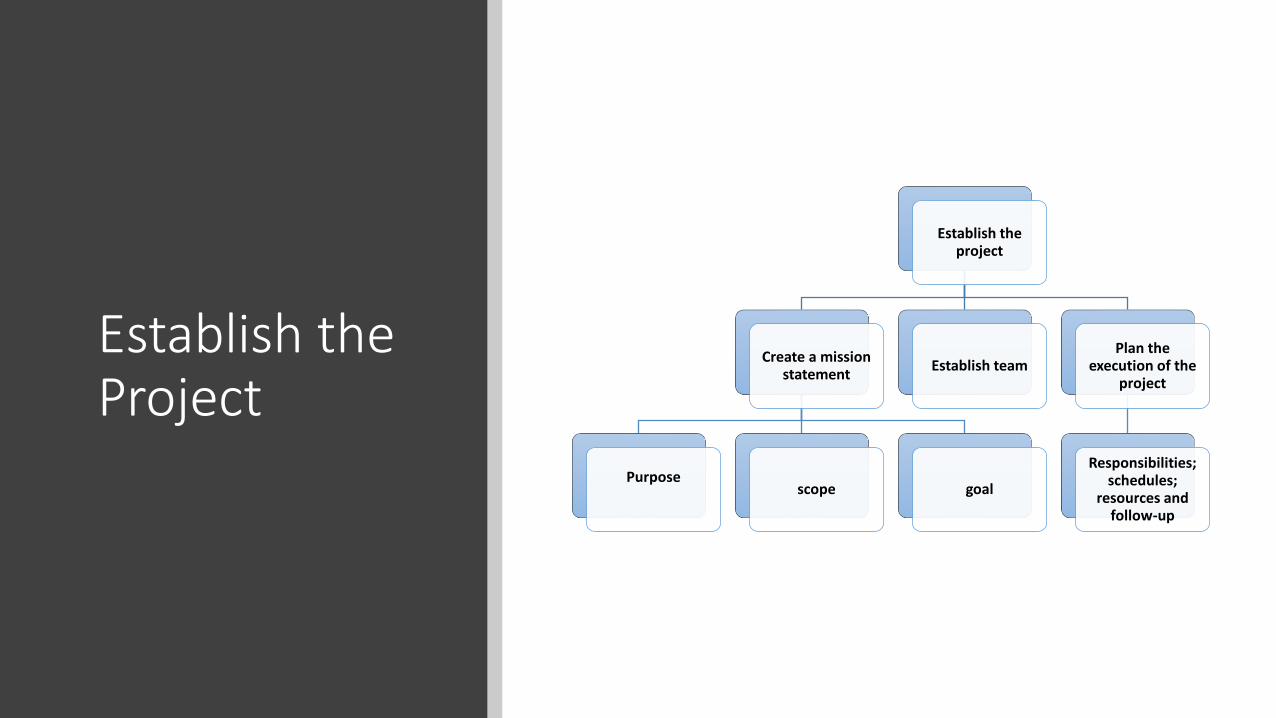
Establish the Project
Establish the project
Create a mission statement
Purpose
scope goal
Establish team Plan the
execution of the project
Responsibilities; schedules;
resources and follow-up
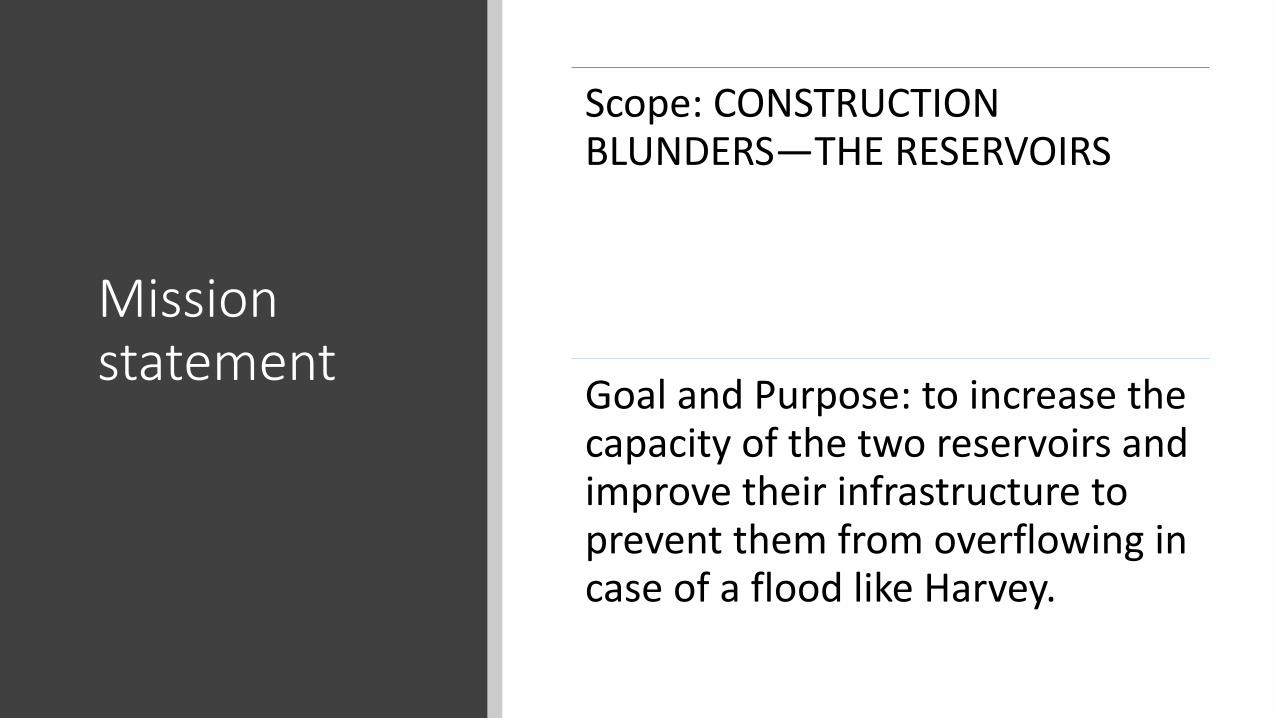
Scope: CONSTRUCTION BLUNDERS—THE RESERVOIRS
Goal and Purpose: to increase the capacity of the two reservoirs and improve their infrastructure to prevent them from overflowing in case of a flood like Harvey.
Mission statement
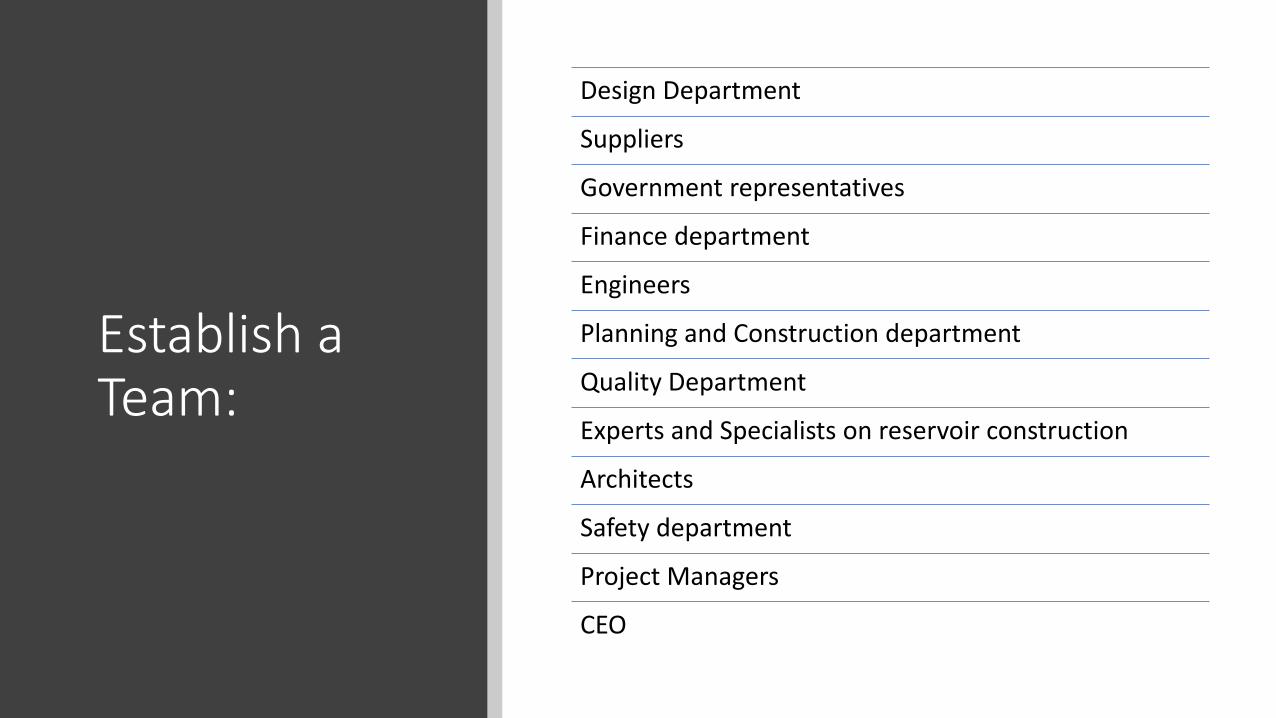
Design Department
Suppliers
Government representatives
Finance department
Engineers
Planning and Construction department
Quality Department
Experts and Specialists on reservoir construction
Architects
Safety department
Project Managers
CEO
Establish a Team:
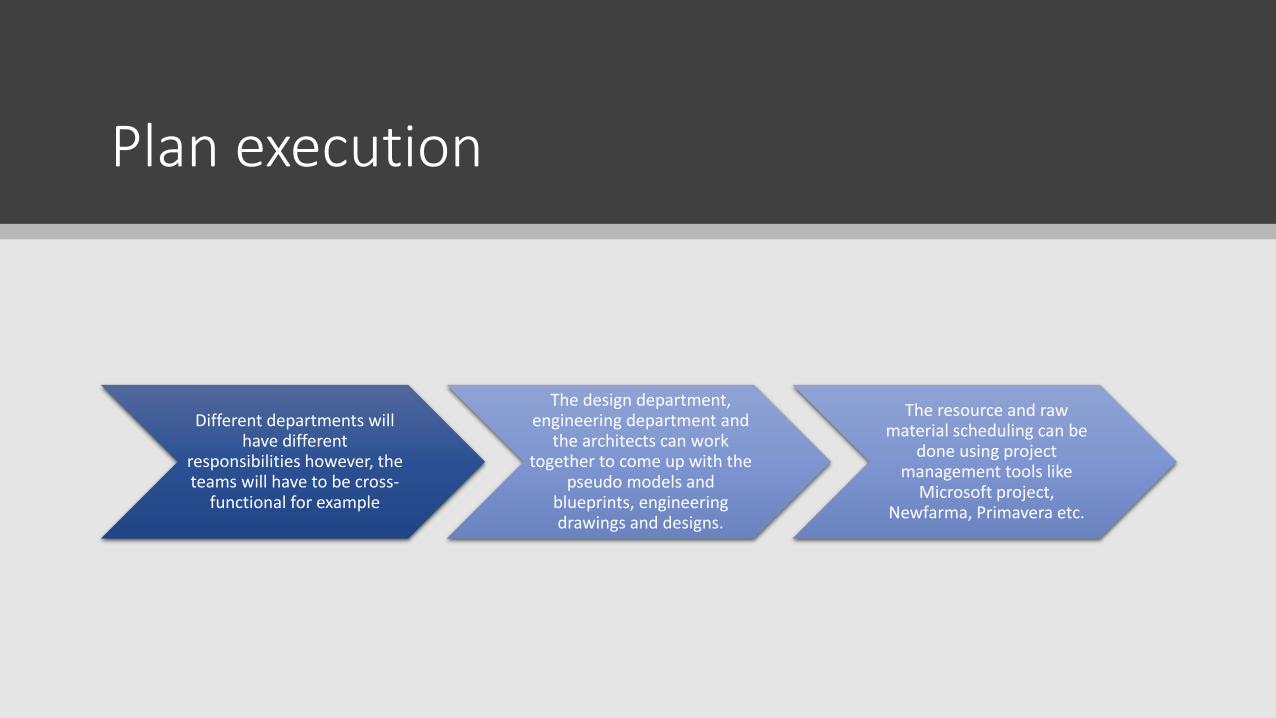
Plan execution
Different departments will have different
responsibilities however, the teams will have to be cross-
functional for example
The design department, engineering department and
the architects can work together to come up with the
pseudo models and blueprints, engineering drawings and designs.
The resource and raw material scheduling can be
done using project management tools like
Microsoft project, Newfarma, Primavera etc.

Identify the Customer
Identify the customers
external
Both unmeet and potential
internal Suppliers as customers
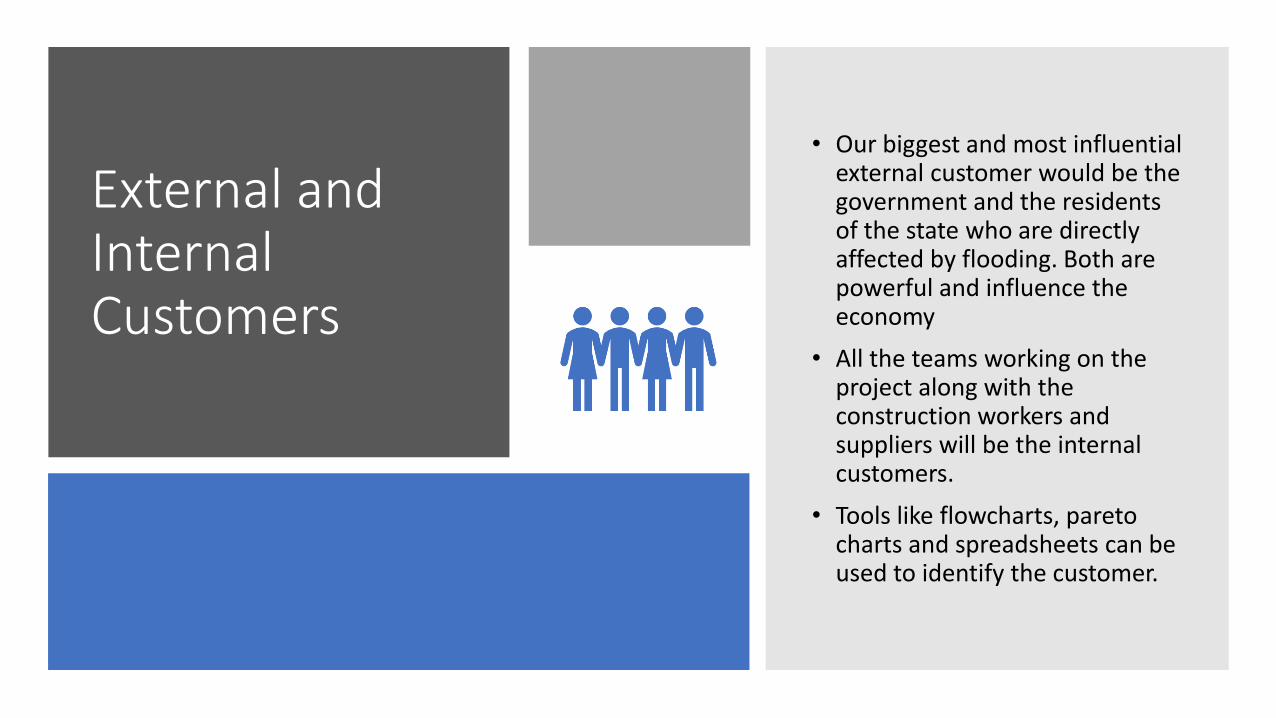
External and Internal Customers
• Our biggest and most influential external customer would be the government and the residents of the state who are directly affected by flooding. Both are powerful and influence the economy
• All the teams working on the project along with the construction workers and suppliers will be the internal customers.
• Tools like flowcharts, pareto charts and spreadsheets can be used to identify the customer.
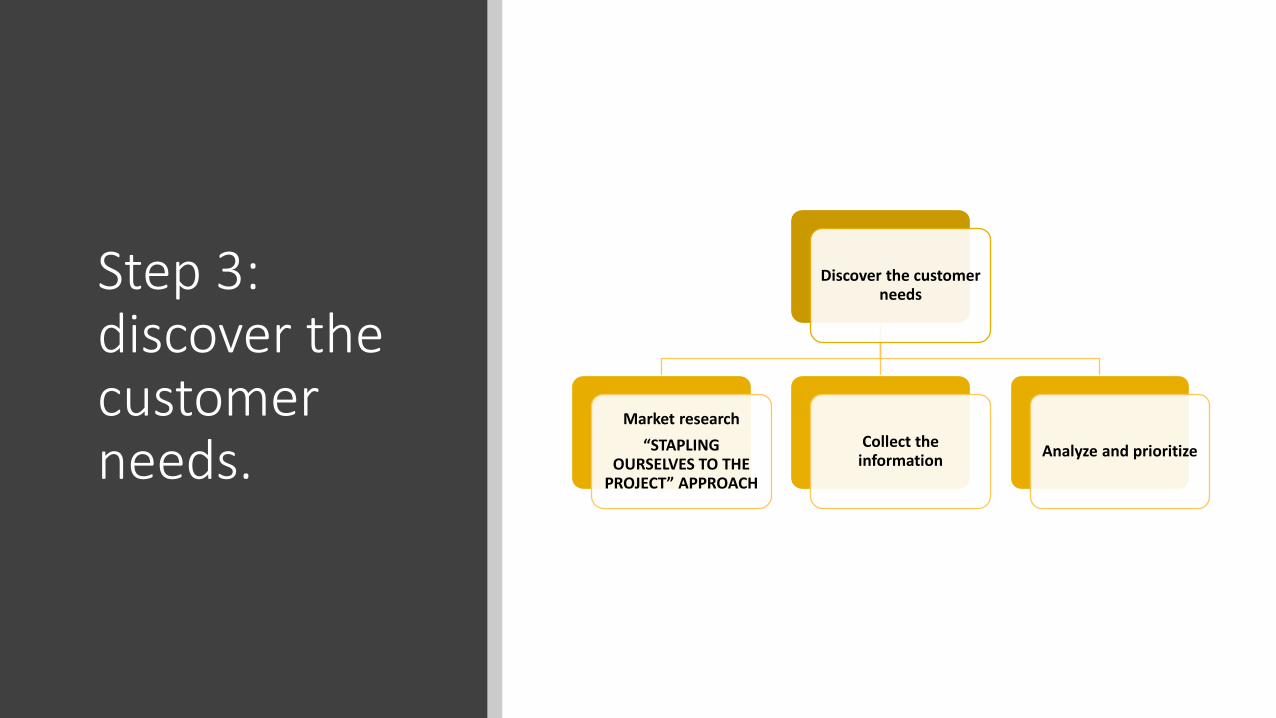
Step 3: discover the customer needs.
Discover the customer needs
Market research
“STAPLING OURSELVES TO THE
PROJECT” APPROACH
Collect the information
Analyze and prioritize
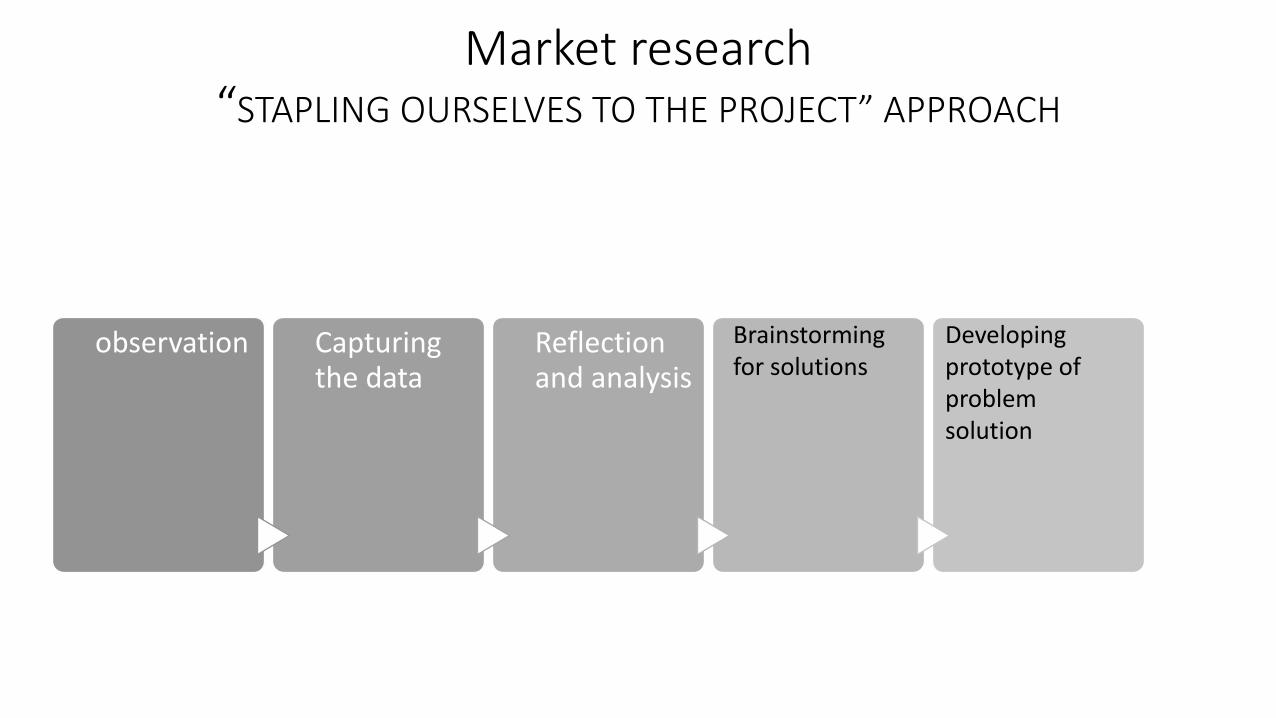
Market research
“STAPLING OURSELVES TO THE PROJECT” APPROACH
observation Capturing the data
Reflection and analysis
Brainstorming for solutions
Developing prototype of problem solution
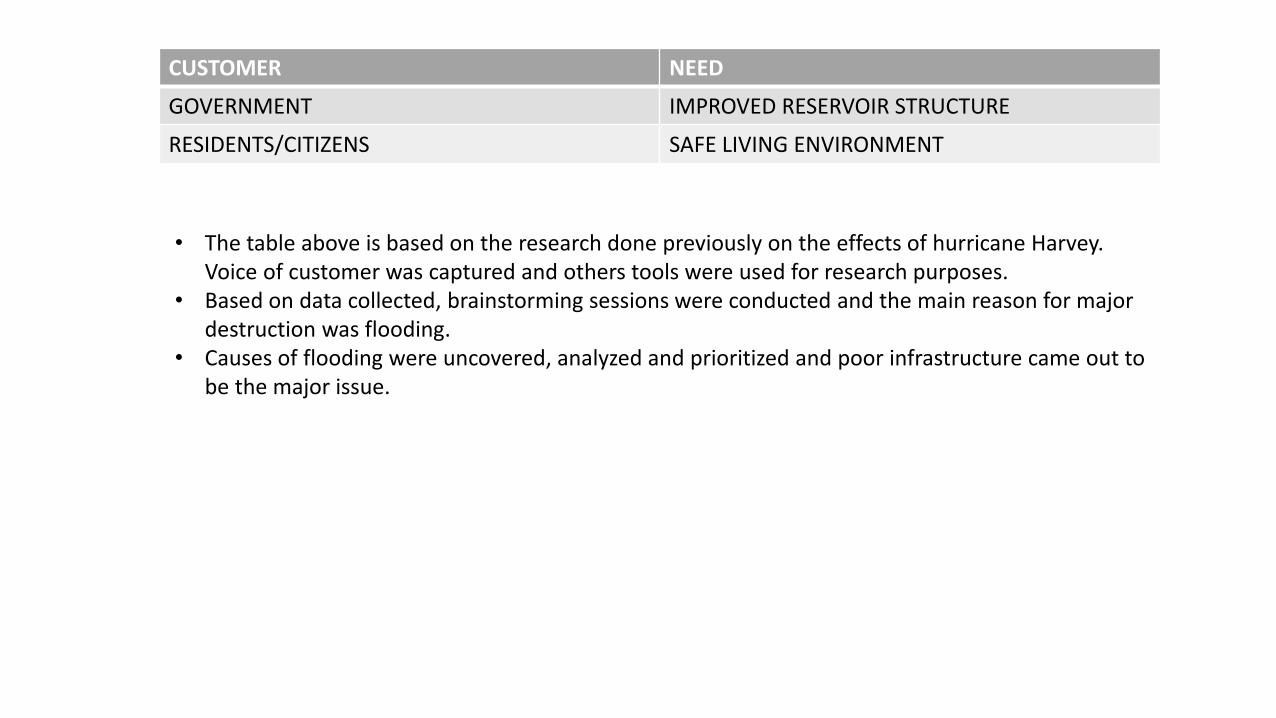
• The table above is based on the research done previously on the effects of hurricane Harvey. Voice of customer was captured and others tools were used for research purposes.
• Based on data collected, brainstorming sessions were conducted and the main reason for major destruction was flooding.
• Causes of flooding were uncovered, analyzed and prioritized and poor infrastructure came out to be the major issue.
CUSTOMER NEED
GOVERNMENT IMPROVED RESERVOIR STRUCTURE
RESIDENTS/CITIZENS SAFE LIVING ENVIRONMENT
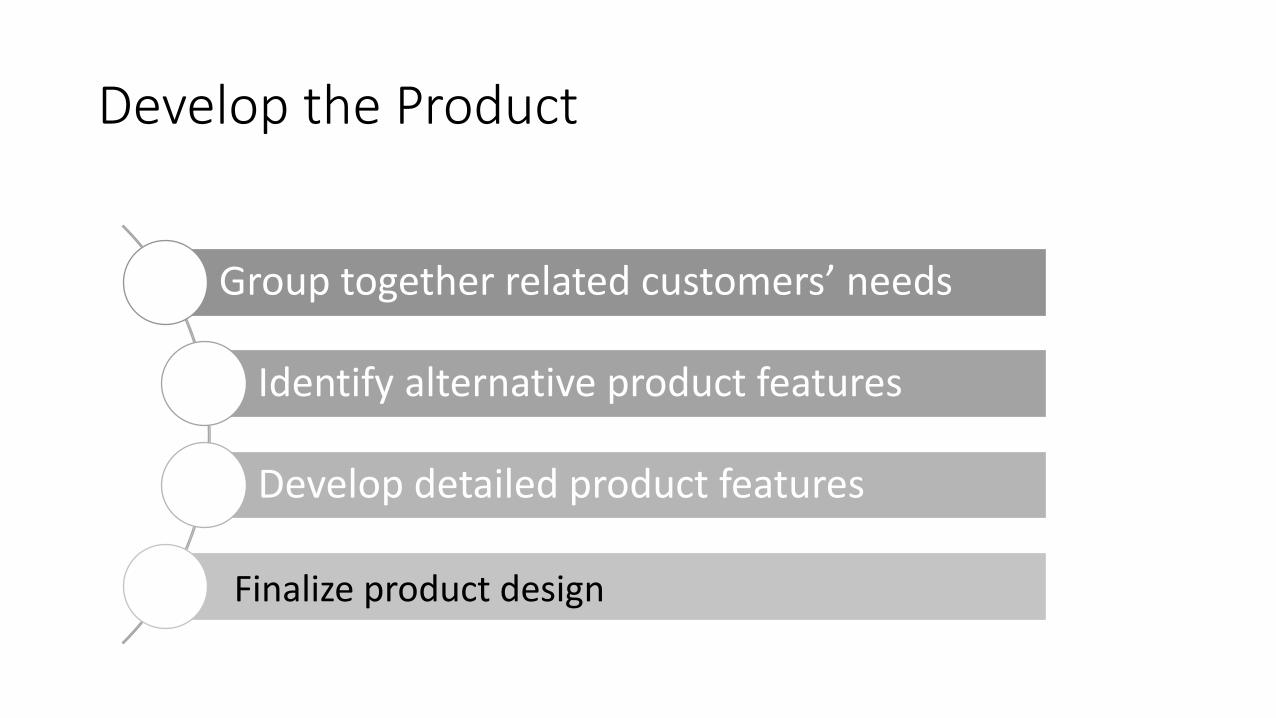
Develop the Product
Group together related customers’ needs
Identify alternative product features
Develop detailed product features
Finalize product design
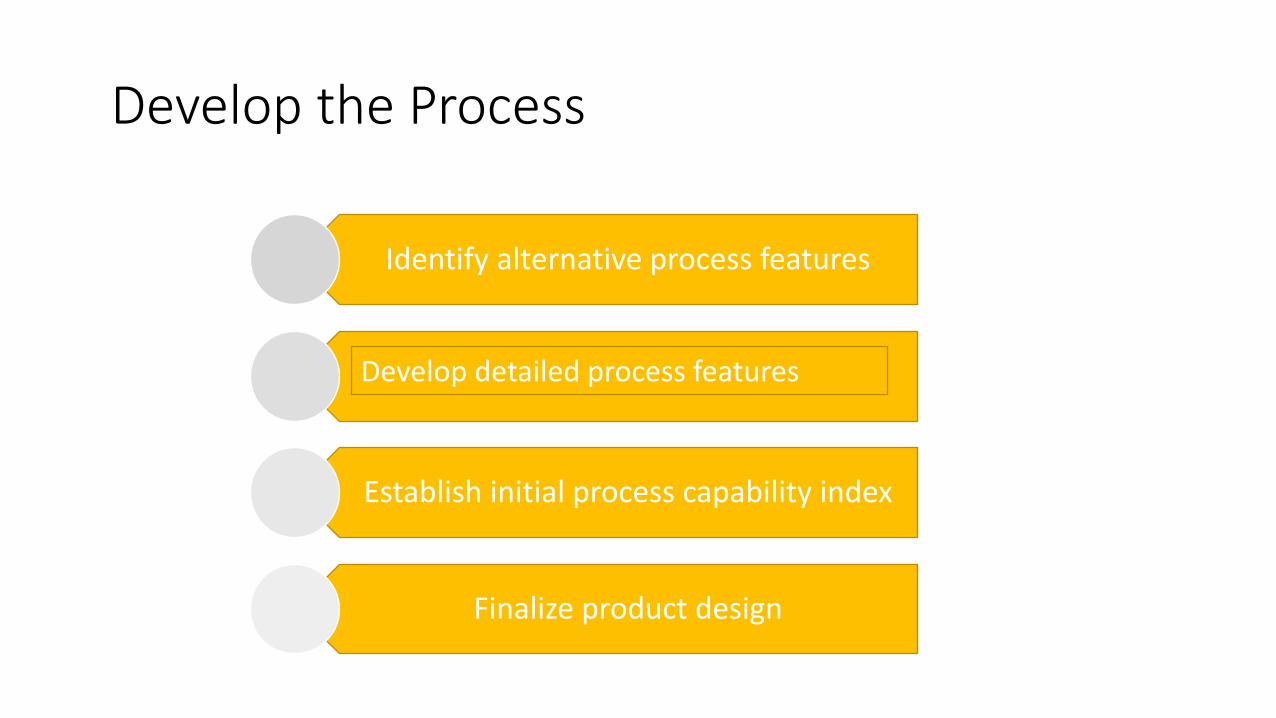
Develop the Process
Identify alternative process features
Establish initial process capability index
Finalize product design
Develop detailed process features
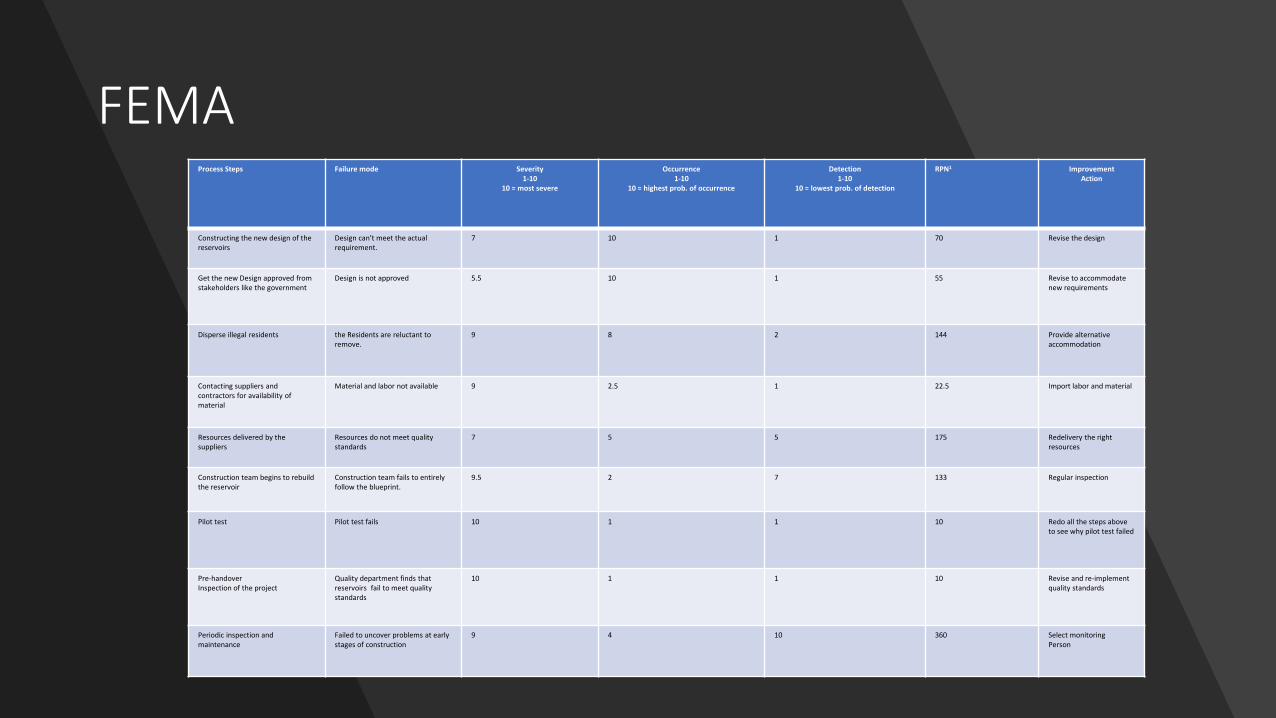
FEMA Process Steps Failure mode Severity
1-10 10 = most severe
Occurrence 1-10
10 = highest prob. of occurrence
Detection 1-10
10 = lowest prob. of detection
RPN1
Improvement
Action
Constructing the new design of the reservoirs
Design can’t meet the actual requirement.
7 10 1 70 Revise the design
Get the new Design approved from stakeholders like the government
Design is not approved 5.5 10 1 55 Revise to accommodate new requirements
Disperse illegal residents the Residents are reluctant to remove.
9 8 2 144 Provide alternative accommodation
Contacting suppliers and contractors for availability of material
Material and labor not available 9 2.5 1 22.5 Import labor and material
Resources delivered by the suppliers
Resources do not meet quality standards
7 5
5 175 Redelivery the right resources
Construction team begins to rebuild the reservoir
Construction team fails to entirely follow the blueprint.
9.5 2 7 133 Regular inspection
Pilot test Pilot test fails 10 1 1 10 Redo all the steps above to see why pilot test failed
Pre-handover Inspection of the project
Quality department finds that reservoirs fail to meet quality standards
10 1 1 10 Revise and re-implement quality standards
Periodic inspection and maintenance
Failed to uncover problems at early stages of construction
9 4 10 360 Select monitoring Person
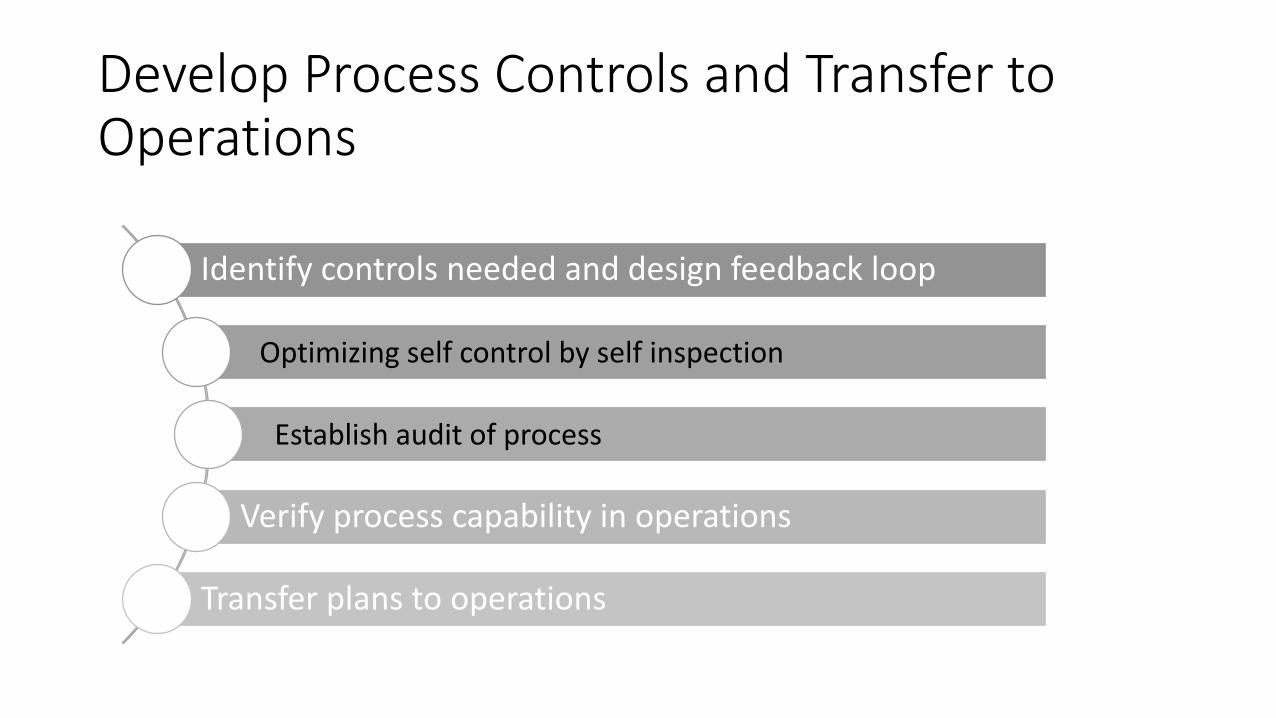
Develop Process Controls and Transfer to Operations
Identify controls needed and design feedback loop
Verify process capability in operations
Transfer plans to operations
Optimizing self control by self inspection
Establish audit of process
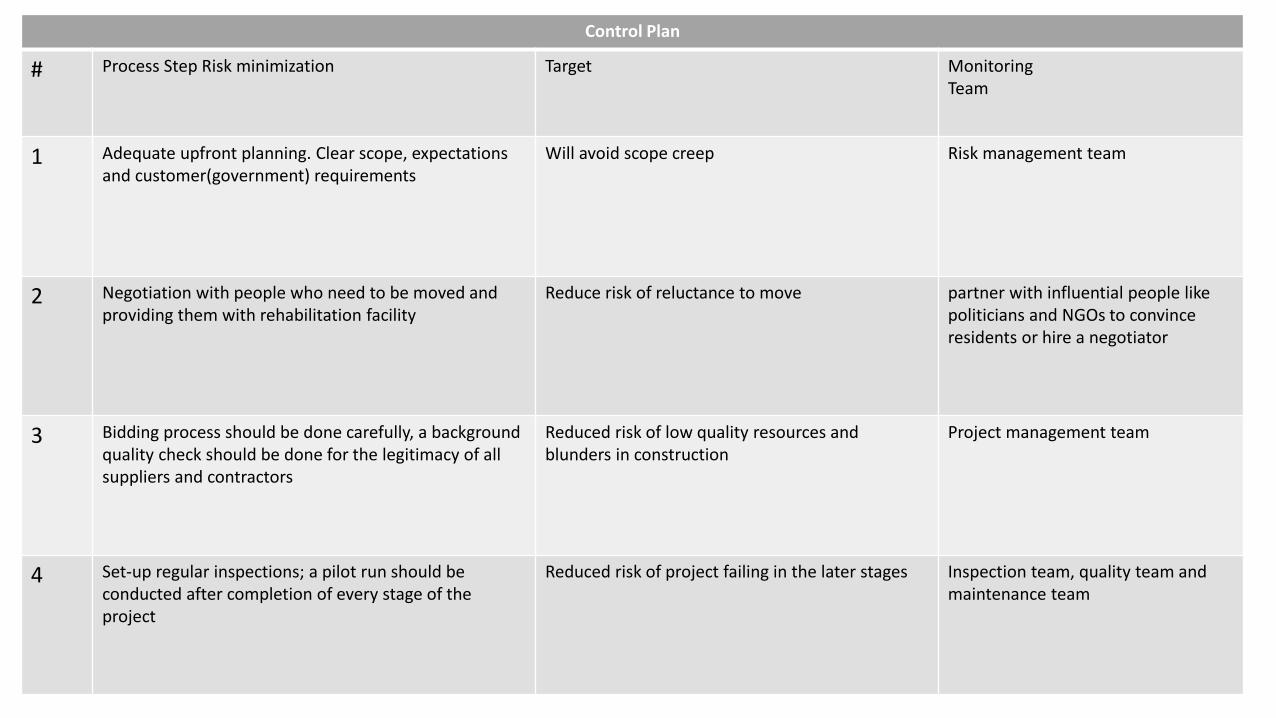
Control Plan
# Process Step Risk minimization Target
Monitoring Team
1 Adequate upfront planning. Clear scope, expectations and customer(government) requirements
Will avoid scope creep Risk management team
2 Negotiation with people who need to be moved and providing them with rehabilitation facility
Reduce risk of reluctance to move partner with influential people like politicians and NGOs to convince residents or hire a negotiator
3 Bidding process should be done carefully, a background quality check should be done for the legitimacy of all suppliers and contractors
Reduced risk of low quality resources and blunders in construction
Project management team
4 Set-up regular inspections; a pilot run should be conducted after completion of every stage of the project
Reduced risk of project failing in the later stages Inspection team, quality team and maintenance team
Improve phase
The purpose of this step is to identify, test and implement a solution to the problem; in part or in whole. This depends on the situation. Identify creative solutions to eliminate the key root causes in order to fix and prevent process problems.
Brainstorm potential Ideas / Solutions to address the defects/causes identified in the Analyze Phase
Evaluate & Select the best solutions Pilot Test selected solutions Implement Solutions

FEMA for rebuild reservoirs Process Steps Failure mode Severity
1-10 10 = most severe
Occurrence 1-10
10 = highest prob. of occurrence
Detection 1-10
10 = lowest prob. of detection
RPN1
Improvement
Action
Constructing the new design of the reservoirs
Design can’t meet the actual requirement.
7 10 1 70 Revise the design
Get the new Design approved from stakeholders like the government
Design is not approved 5.5 10 1 55 Revise to accommodate new requirements
Disperse illegal residents the Residents are reluctant to remove.
9 8 2 144 Provide alternative accommodation
Contacting suppliers and contractors for availability of material
Material and labor not available
9 2.5 1 22.5 Import labor and material
Resources delivered by the suppliers
Resources do not meet quality standards
7 5
5 175 Redelivery the right resources
Construction team begins to rebuild the reservoir
Construction team fails to entirely follow the blueprint.
9.5 2 7 133 Regular inspection
Pilot test Pilot test fails 10 1 1 10
Pre-handover Inspection of the project
Quality department finds that reservoirs fail to meet quality standards
10 1 1 10
Periodic inspection and maintenance
Failed to uncover problems at early stages of construction
9 4 10 360 Select monitoring Person

RELIABILITY ANALYSIS
The ability to measure emergency preparedness—to predict the likely performance of emergency response systems in future events—is very critical to see if the future VSM that we have made will be helpful or not
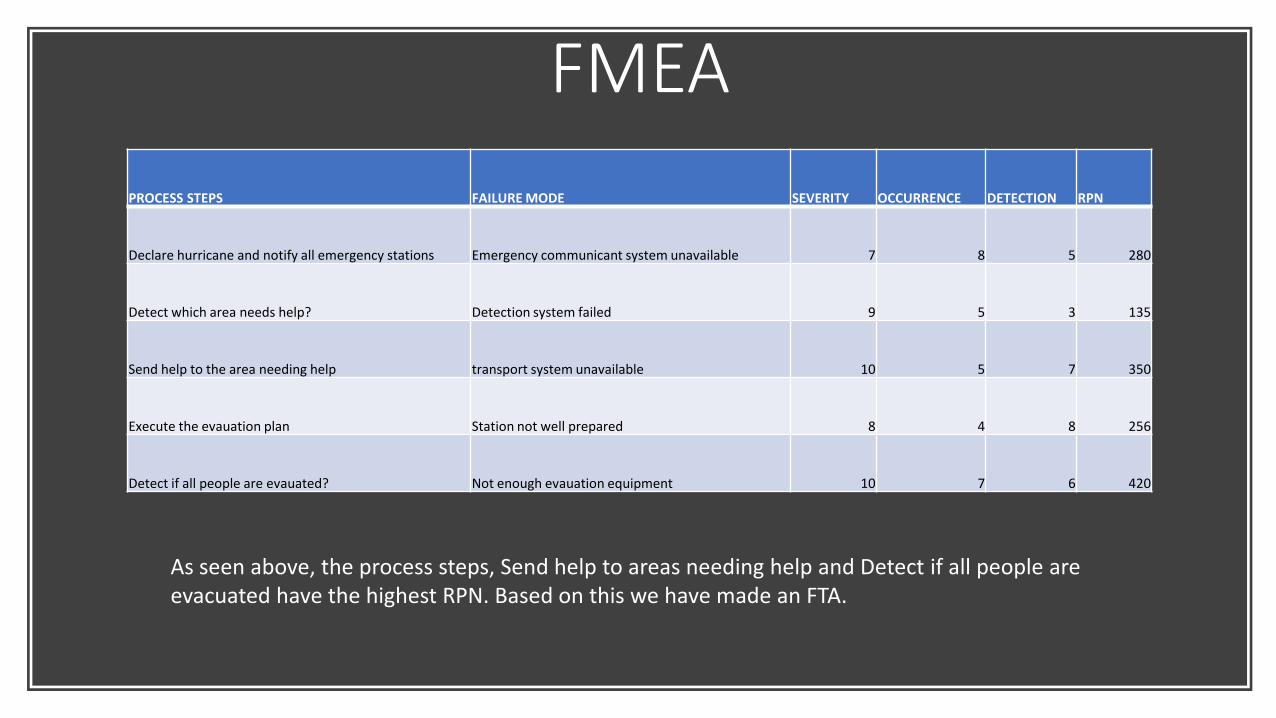
FMEA
PROCESS STEPS FAILURE MODE SEVERITY OCCURRENCE DETECTION RPN
Declare hurricane and notify all emergency stations Emergency communicant system unavailable 7 8 5 280
Detect which area needs help? Detection system failed 9 5 3 135
Send help to the area needing help transport system unavailable 10 5 7 350
Execute the evauation plan Station not well prepared 8 4 8 256
Detect if all people are evauated? Not enough evauation equipment 10 7 6 420
As seen above, the process steps, Send help to areas needing help and Detect if all people are evacuated have the highest RPN. Based on this we have made an FTA.

FAULT TREE ANALYSIS
Control phase
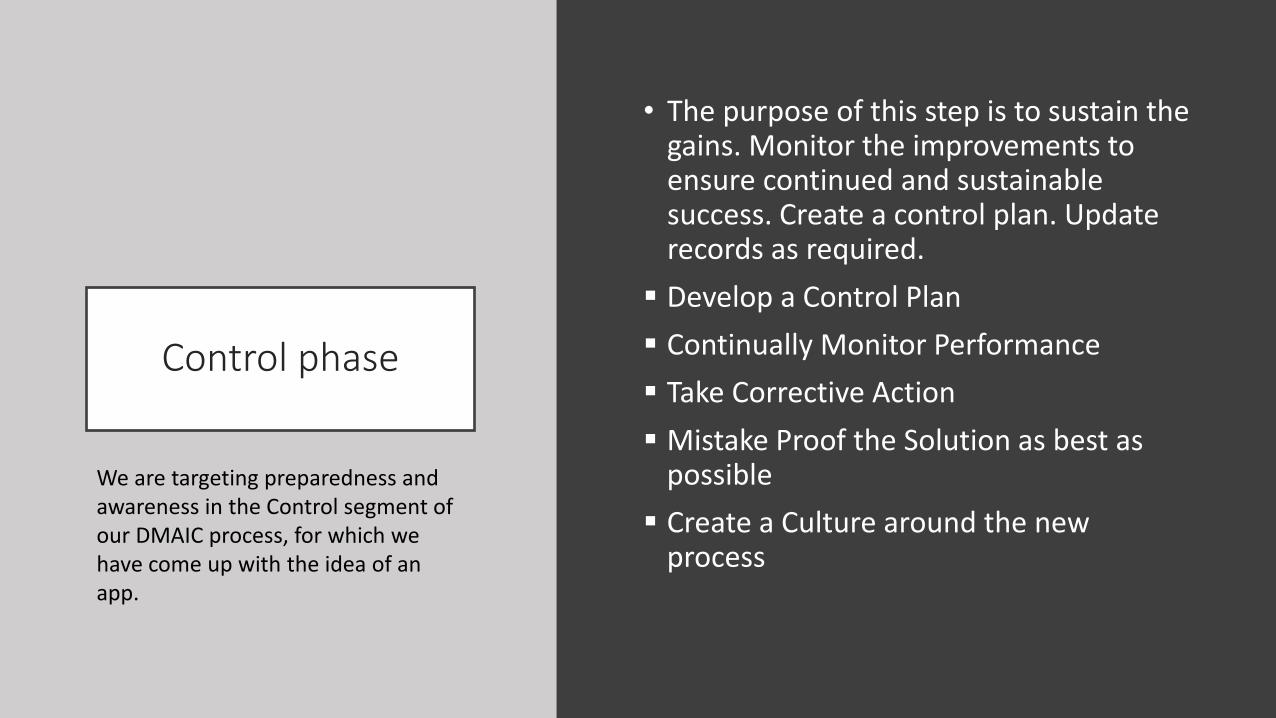
• The purpose of this step is to sustain the gains. Monitor the improvements to ensure continued and sustainable success. Create a control plan. Update records as required.
Develop a Control Plan
Continually Monitor Performance
Take Corrective Action
Mistake Proof the Solution as best as possible
Create a Culture around the new process
We are targeting preparedness and awareness in the Control segment of our DMAIC process, for which we have come up with the idea of an app.
CDOV for application using companion
CDOV- Concept, Design, Optimize, Verify
This is another kind of process used for Six Sigma.
We have performed a CDOV in the application called Quality Companion to develop an smart phone app that will assist people in Hurricanes like The Hrricane Harvey.
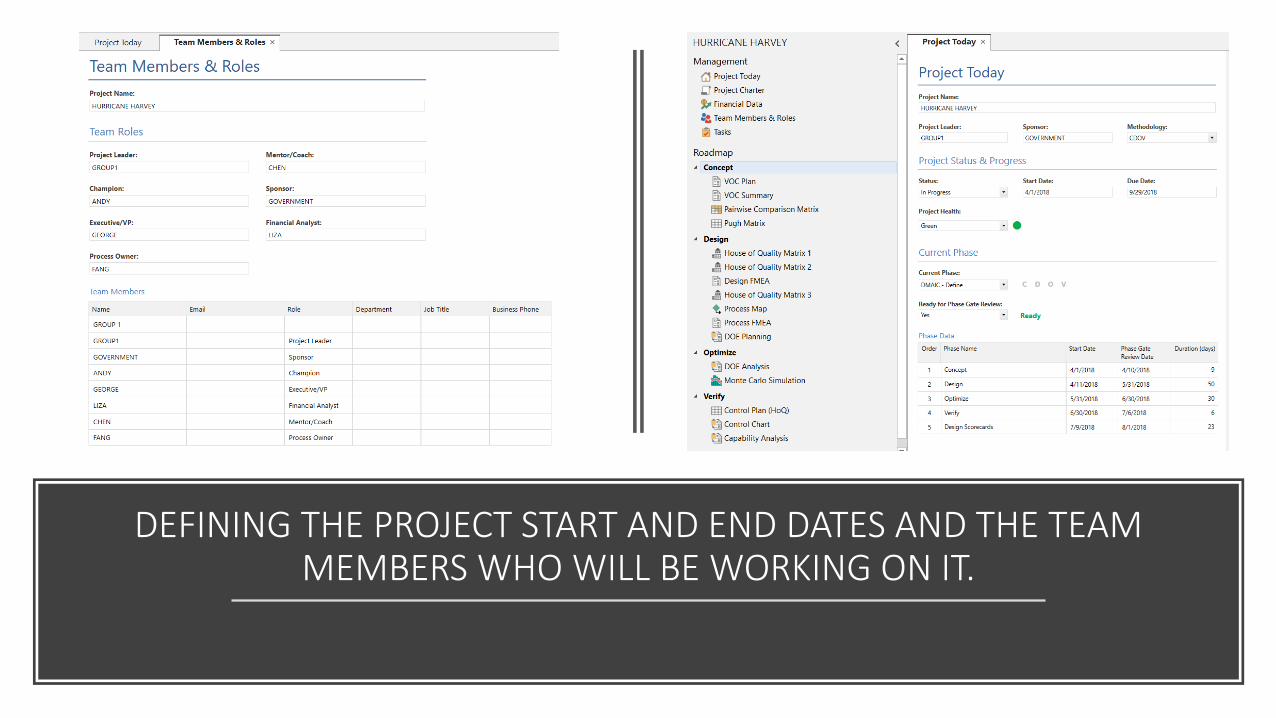
DEFINING THE PROJECT START AND END DATES AND THE TEAM MEMBERS WHO WILL BE WORKING ON IT.
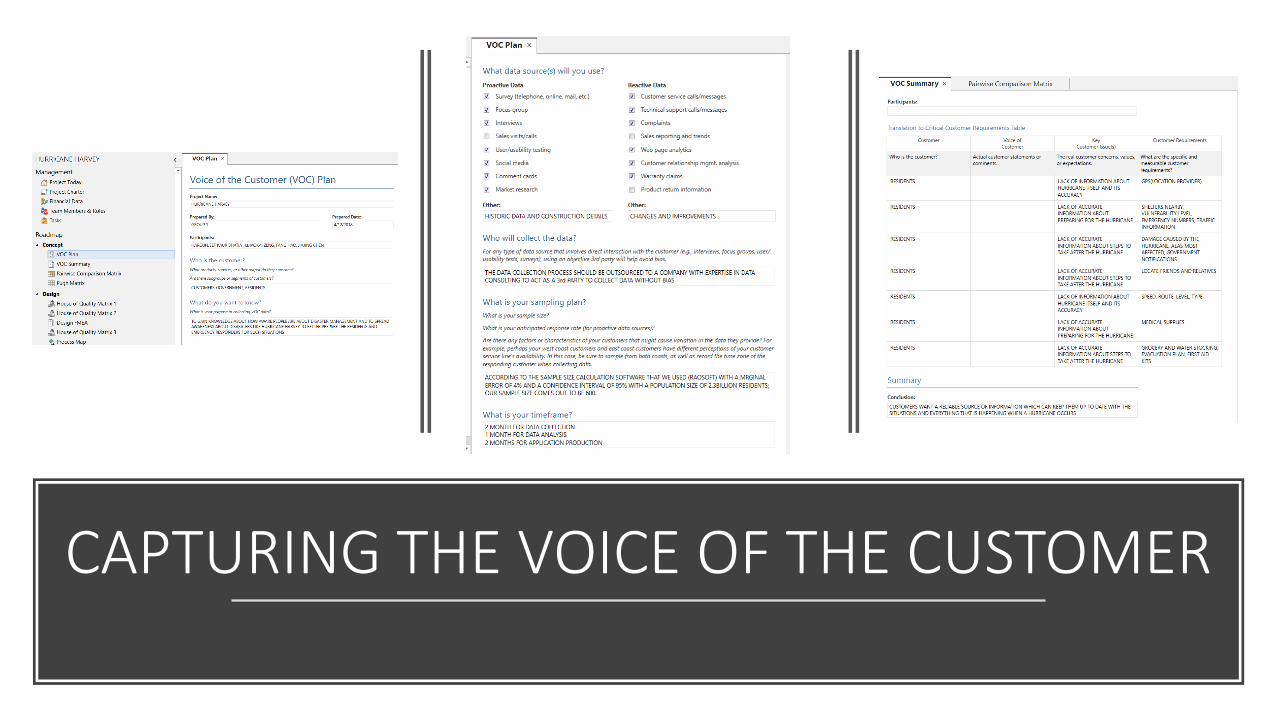
CAPTURING THE VOICE OF THE CUSTOMER

THE PAIRWISE COMPARISON MATRIX

THE HOUSE OF QUALITY MATRIX AND PROCESS FLOW MAP.
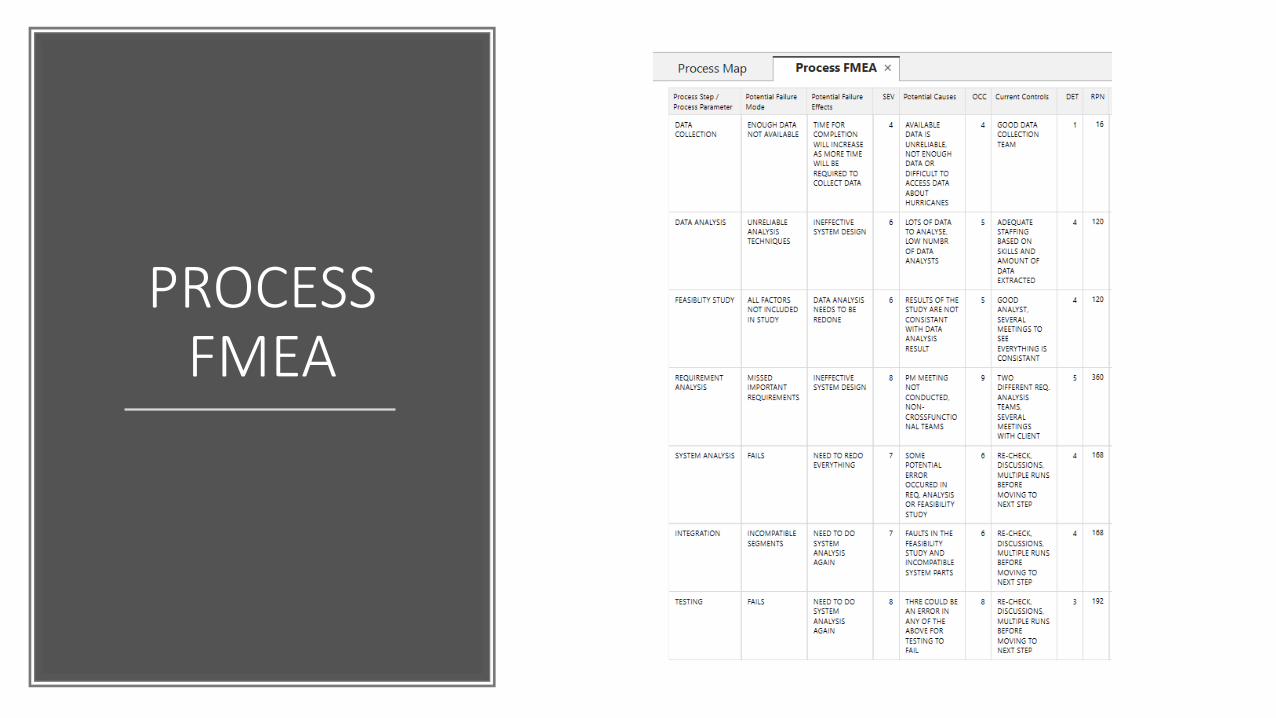
PROCESS FMEA

CONTROL PHASE

Thank you

Question?