hbd meeting 4/25/06 sb and bnl crew. 4/25/06 b. azmoun 2 installation of hbd into phenix transported...
TRANSCRIPT

HBD MeetingHBD Meeting4/25/064/25/06
SB and BNL CrewSB and BNL Crew
4/25/064/25/06 B. AzmounB. Azmoun 22
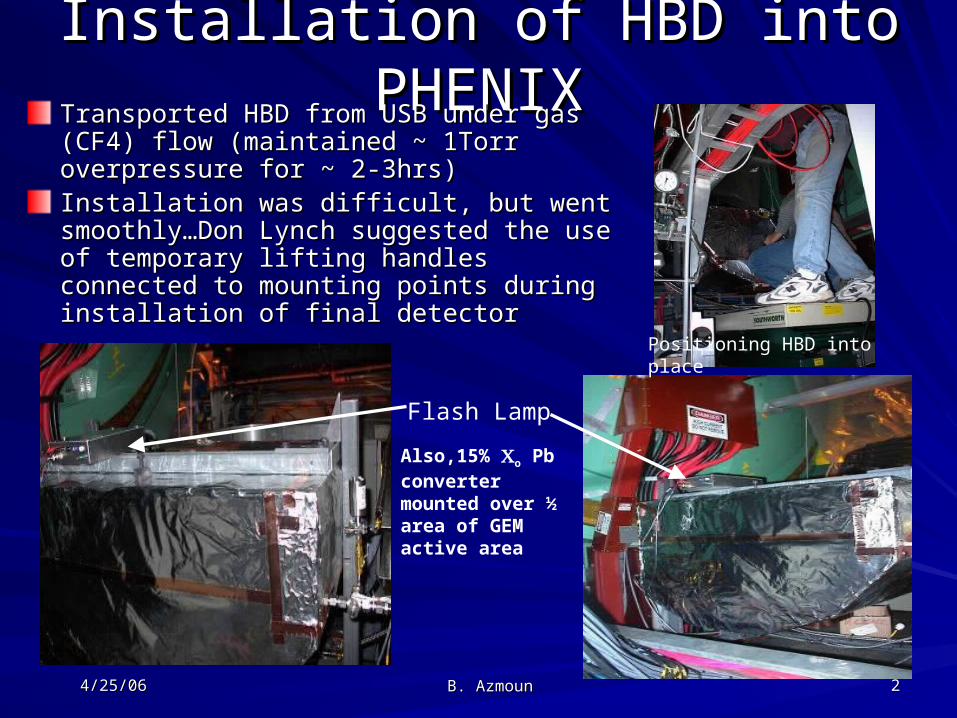
Installation of HBD into PHENIXInstallation of HBD into PHENIXTransported HBD from USB under gas (CF4) Transported HBD from USB under gas (CF4) flow (maintained ~ 1Torr overpressure for ~ 2-flow (maintained ~ 1Torr overpressure for ~ 2-3hrs)3hrs)Installation was difficult, but went smoothly…Installation was difficult, but went smoothly…Don Lynch suggested the use of temporary Don Lynch suggested the use of temporary lifting handles connected to mounting points lifting handles connected to mounting points during installation of final detectorduring installation of final detector
Flash Lamp
Positioning HBD into place
Also,15% o Pb converter mounted over ½ area of GEM active area
4/25/064/25/06 B. AzmounB. Azmoun 33
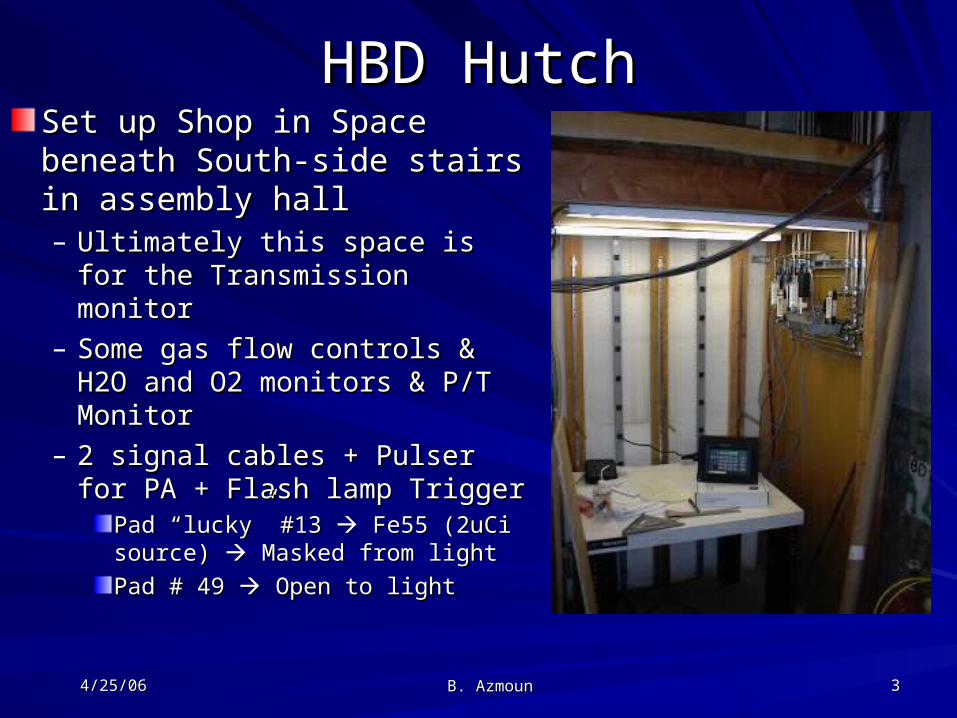
HBD HutchHBD HutchSet up Shop in Space Set up Shop in Space beneath South-side stairs in beneath South-side stairs in assembly hallassembly hall– Ultimately this space is for the Ultimately this space is for the
Transmission monitorTransmission monitor– Some gas flow controls & H2O Some gas flow controls & H2O
and O2 monitors & P/T Monitorand O2 monitors & P/T Monitor– 2 signal cables + Pulser for PA 2 signal cables + Pulser for PA
+ Flash lamp Trigger + Flash lamp Trigger Pad “lucky” #13 Pad “lucky” #13 Fe55 (2uCi Fe55 (2uCi source) source) Masked from light Masked from light
Pad # 49 Pad # 49 Open to light Open to light
4/25/064/25/06 B. AzmounB. Azmoun 44
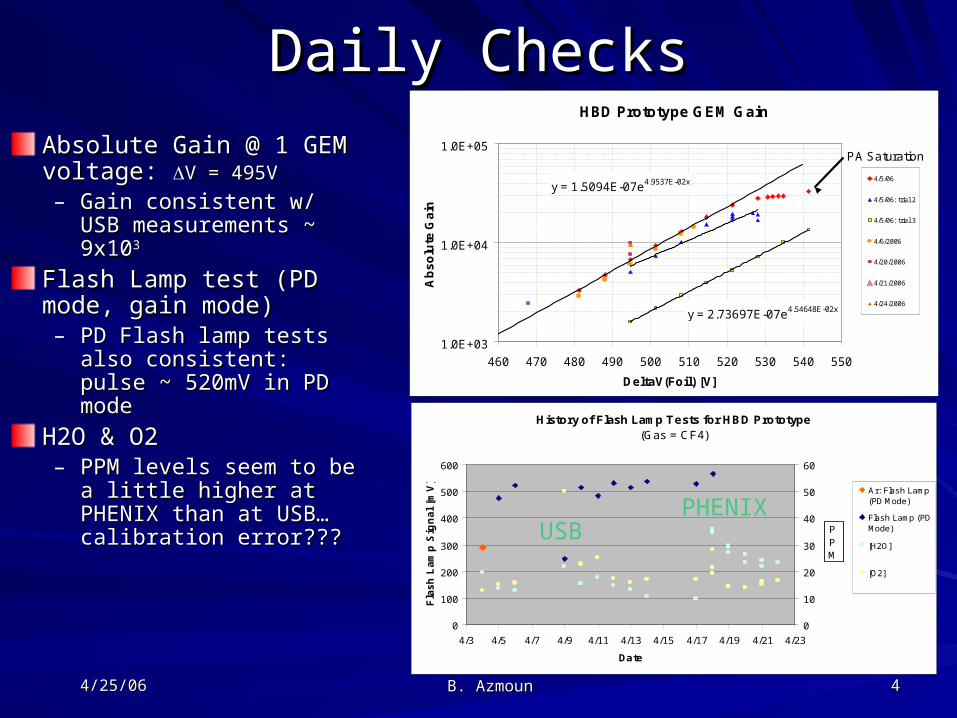
Daily ChecksDaily Checks
Absolute Gain @ 1 GEM Absolute Gain @ 1 GEM voltage: voltage: V = 495VV = 495V
– Gain consistent w/ USB Gain consistent w/ USB measurements ~ 9x10measurements ~ 9x1033
Flash Lamp test (PD Flash Lamp test (PD mode, gain mode)mode, gain mode)– PD Flash lamp tests also PD Flash lamp tests also
consistent: pulse ~ consistent: pulse ~ 520mV in PD mode520mV in PD mode
H2O & O2H2O & O2– PPM levels seem to be a PPM levels seem to be a
little higher at PHENIX little higher at PHENIX than at USB…calibration than at USB…calibration error???error???
HBD Prototype GEM Gain
y = 1.5094E-07e4.9537E-02x
y = 2.73697E-07e4.54648E-02x
1.0E+03
1.0E+04
1.0E+05
460 470 480 490 500 510 520 530 540 550
DeltaV(Foil) [V]
Ab
so
lute
Ga
in
4/5/06
4/5/06: trial 2
4/5/06: trial 3
4/6/2006
4/20/2006
4/21/2006
4/24/2006
PA Saturation
History of Flash Lamp Tests for HBD Prototype(Gas = CF4)
0
100
200
300
400
500
600
4/3 4/5 4/7 4/9 4/11 4/13 4/15 4/17 4/19 4/21 4/23
Date
Fla
sh
La
mp
Sig
na
l [m
V]
0
10
20
30
40
50
60
Ar: Flash Lamp(PD Mode)
Flash Lamp (PDMode)
[H2O]
[O2]
PPM
USBPHENIX

4/25/064/25/06 B. AzmounB. Azmoun 55
HBD Flash-lamp Event DisplayHBD Flash-lamp Event Display(pe signal avalanche through GEMs and map onto hex pads)(pe signal avalanche through GEMs and map onto hex pads)
Pad 13 shadowed by Fe55
2 known dead strips, but there are two others w/ position unknown
Sum along strips Sum perp. to strips
Known dead strips
Known dead strips
Possible position of unknown dead strips
4/25/064/25/06 B. AzmounB. Azmoun 66
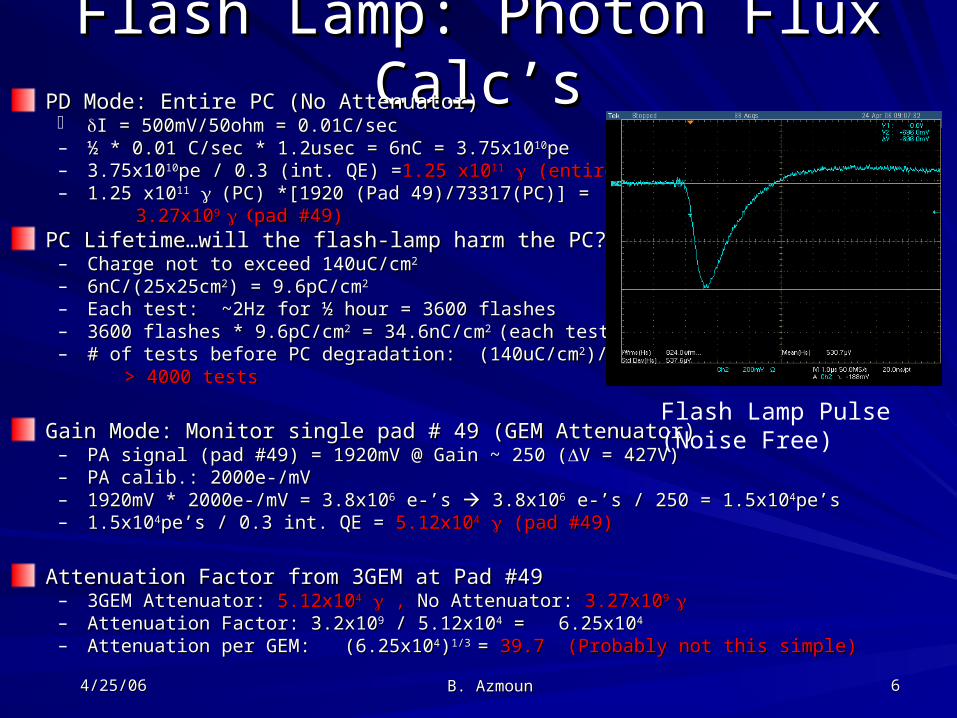
Flash Lamp: Photon Flux Calc’sFlash Lamp: Photon Flux Calc’sPD Mode: Entire PC (No Attenuator)PD Mode: Entire PC (No Attenuator) I = 500mV/50ohm = 0.01C/secI = 500mV/50ohm = 0.01C/sec– ½ * 0.01 C/sec * 1.2usec = 6nC = 3.75x10½ * 0.01 C/sec * 1.2usec = 6nC = 3.75x101010pepe– 3.75x103.75x101010pe / 0.3 (int. QE) =pe / 0.3 (int. QE) =1.25 x101.25 x101111 (entire PC) (entire PC)– 1.25 x101.25 x101111 (PC) *[1920 (Pad 49)/73317(PC)] = (PC) *[1920 (Pad 49)/73317(PC)] = 3.27x103.27x109 9 pad #49)pad #49)
PC Lifetime…will the flash-lamp harm the PC?PC Lifetime…will the flash-lamp harm the PC?– Charge not to exceed 140uC/cmCharge not to exceed 140uC/cm22
– 6nC/(25x25cm6nC/(25x25cm22) = 9.6pC/cm) = 9.6pC/cm22
– Each test: ~2Hz for ½ hour = 3600 flashesEach test: ~2Hz for ½ hour = 3600 flashes– 3600 flashes * 9.6pC/cm3600 flashes * 9.6pC/cm22 = 34.6nC/cm = 34.6nC/cm2 2 (each test)(each test)– # of tests before PC degradation: (140uC/cm# of tests before PC degradation: (140uC/cm22)/(34.6nC/cm)/(34.6nC/cm22) ) > 4000 tests> 4000 tests
Gain Mode: Monitor single pad # 49 (GEM Attenuator)Gain Mode: Monitor single pad # 49 (GEM Attenuator)– PA signal (pad #49) = 1920mV @ Gain ~ 250 (PA signal (pad #49) = 1920mV @ Gain ~ 250 (V = 427V)V = 427V)– PA calib.: 2000e-/mVPA calib.: 2000e-/mV– 1920mV * 2000e-/mV = 3.8x101920mV * 2000e-/mV = 3.8x1066 e-’s e-’s 3.8x10 3.8x1066 e-’s / 250 = 1.5x10 e-’s / 250 = 1.5x1044pe’spe’s– 1.5x101.5x1044pe’s / 0.3 int. QE = pe’s / 0.3 int. QE = 5.12x105.12x1044 (pad #49) (pad #49)
Attenuation Factor from 3GEM at Pad #49Attenuation Factor from 3GEM at Pad #49– 3GEM Attenuator: 3GEM Attenuator: 5.12x105.12x1044 , , No Attenuator: No Attenuator: 3.27x103.27x109 9 – Attenuation Factor: 3.2x10Attenuation Factor: 3.2x1099 / 5.12x10 / 5.12x1044 = 6.25x10 = 6.25x1044
– Attenuation per GEM: (6.25x10Attenuation per GEM: (6.25x1044))1/3 1/3 = = 39.7 (Probably not this simple)39.7 (Probably not this simple)
Flash Lamp Pulse(Noise Free)
4/25/064/25/06 B. AzmounB. Azmoun 77
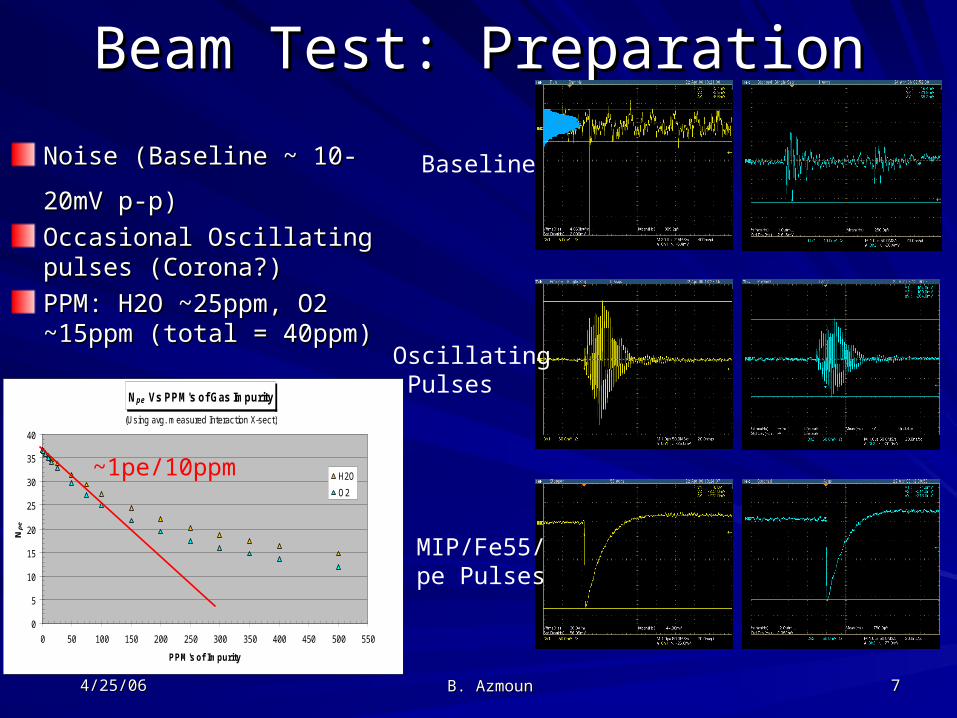
Beam Test: PreparationBeam Test: Preparation
Noise (Baseline ~ 10-20mV Noise (Baseline ~ 10-20mV
p-p)p-p)
Occasional Oscillating Occasional Oscillating pulses (Corona?)pulses (Corona?)
PPM: H2O ~25ppm, O2 PPM: H2O ~25ppm, O2 ~15ppm (total = 40ppm)~15ppm (total = 40ppm)
Baseline
Oscillating Pulses
MIP/Fe55/pe Pulses
Npe Vs PPM's of Gas Impurity
0
5
10
15
20
25
30
35
40
0 50 100 150 200 250 300 350 400 450 500 550
PPM's of Impurity
Npe
H2O
O2
(Using avg. measured Interaction X-sect)
~1pe/10ppm
4/25/064/25/06 B. AzmounB. Azmoun 88
Beam Test: First look at Signals Beam Test: First look at Signals (Qualitative Results)(Qualitative Results)
First Beam this past Saturday (4/22/06)First Beam this past Saturday (4/22/06)Primary charge Primary charge
– MIP: 7kEv/cm * 3mm / (54eV e-ion pair) * (1.2 rel. rise) = 46.6 e- MIP: 7kEv/cm * 3mm / (54eV e-ion pair) * (1.2 rel. rise) = 46.6 e- – Fe55 in CF4: 5.89keV x-ray/(54 eV/e-ion pair) = 109pe (Pad # 13 only)Fe55 in CF4: 5.89keV x-ray/(54 eV/e-ion pair) = 109pe (Pad # 13 only)– Photoelectron yield (Cherenkov spectrum + CsI QE ): 36pe-s totalPhotoelectron yield (Cherenkov spectrum + CsI QE ): 36pe-s total ~15-20 pe per pad max (Pad # 13 masked off) ~15-20 pe per pad max (Pad # 13 masked off)
Rate of electrons Rate of electrons 15% radiation length 15% radiation length
Pulse Height Spectrum: RB Ch13
0
50
100
150
200
250
1 12 23 34 45 56 67 78 89 100 111 122 133 144 155
Prim ary Charge [# e -]
Co
un
ts
Pulse Height Spectrum: RB Ch49
0
50
100
150
200
250
300
350
400
450
500
0 6 11 17 22 28 33 39 44 50 55 61 66 72 77 83 88 94
Prim ary Charge [# e -]
Co
un
ts
Pulse Height Spectrum: FB Ch 13
0
100
200
300
400
500
600
700
800
1 26 50 74 99 123 147 172 196 221 245 269 294 318 342 367 391 415
Prim ary Charge [# e -]
Co
un
ts
Pulse Height Spectrum: FB Ch 49
0
100
200
300
400
500
600
700
800
900
0 6 11 17 22 28 33 38 44 49 55 60 66 71 77 82 87 93
Prim ary Charge [# e-]
Co
un
ts
•MIPS in 100um gap (1.6e-)•Fe55 in 100um gap (109e-)•Other particles
•MIPS in 3mm gap (46.6e-)•Fe55 in DG (109e-)•Other particles
•MIPS in 100um gap (1.6e-)•Cherenkov (1-20max pe/pad)•Other particles
•MIPS in 3mm gap (46.6e-)•Cherenkov (1-20max pe/pad)•Other particles
FB DG=0.8kV/cmLoss of pe coll. Efficiency?
4/25/064/25/06 B. AzmounB. Azmoun 99
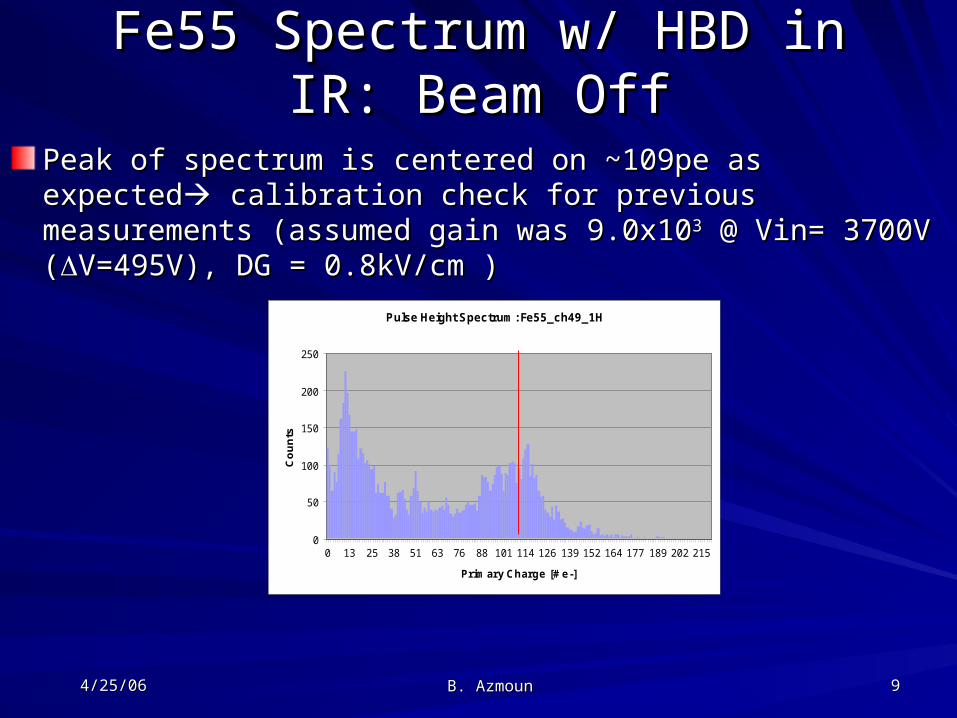
Fe55 Spectrum w/ HBD in IR: Fe55 Spectrum w/ HBD in IR: Beam OffBeam Off
Peak of spectrum is centered on ~109pe as expectedPeak of spectrum is centered on ~109pe as expected calibration check for previous measurements (assumed gain calibration check for previous measurements (assumed gain was 9.0x10was 9.0x1033 @ Vin= 3700V ( @ Vin= 3700V (V=495V), DG = 0.8kV/cm )V=495V), DG = 0.8kV/cm )
Pulse Height Spectrum: Fe55_ch49_1H
0
50
100
150
200
250
0 13 25 38 51 63 76 88 101 114 126 139 152 164 177 189 202 215
Prim ary Charge [# e -]
Co
un
ts
4/25/064/25/06 B. AzmounB. Azmoun 1010
OutlookOutlookQuantitative Beam tests to determine NQuantitative Beam tests to determine Noo (CF4) (CF4)
with HBD in “dead turtle” positionwith HBD in “dead turtle” position– Method of normalizing and subtracting pad 49 Method of normalizing and subtracting pad 49
spectra from pad 13 spectraspectra from pad 13 spectra
Continue to monitor ppm’sContinue to monitor ppm’s will increase flow will increase flow rate if needed in order to improve gas purity.rate if needed in order to improve gas purity.
Looking ahead: if opportunity permits (during Looking ahead: if opportunity permits (during short access), we’ll connect to and check short access), we’ll connect to and check electronics chain, and possibly take data.electronics chain, and possibly take data.