high school - 2.files.edl.io · themselves, others, and their entire community. respect different...
TRANSCRIPT

High SchoolHigh School
WASC WASC FOCUS ON LEARNING FOCUS ON LEARNING
SelfSelf--Study ReportStudy Report MidMid--Term ReviewTerm Review
20132013
WASC WASC FOCUS ON LEARNING FOCUS ON LEARNING
SelfSelf--Study ReportStudy Report MidMid--Term ReviewTerm Review
20132013
Working Together… We Create Something SpecialWorking Together… We Create Something Special

TABLE OF CONTENTS Title Page
Table of Contents
General Information
Visitation Schedule
Saugus High School ESLR’s
I. Student/Community Profile………………….……………………………………………...……….1 General School and Community Description, Student Goals, Staff Demographics, API Rates, CAHSEE, Annual Measurable Objectives, Student Performance Data (including: A-G Rates, CELDT Testing, STAR Testing, Sub Group Data (Hispanic, Special Education, Economically Disadvantaged, White), SAT Data, Advanced Placement Data , and AVID)
II. Significant Developments…………..………………………….………………………………...…63 Freshman Immersion Day, Intervention Opportunities, Planning Wednesdays, Grade Level Counseling, Educationally Related Counseling Services, Professional Development, Study Skills Class, Elementary and Junior High Outreach
III. Ongoing School Improvement………………………………………...…………………………..67
IV. Report on Schoolwide Action Plan Progress Goal #1 - Raise Proficiency Levels in our Special Education and Hispanic subgroups through increased literacy and numeracy on all California Standards tests. Goal #2 - Create, develop, organize, and enhance programs and interventions to assist students that are performing at the below basic levels of the CST’s and who are not passing the CAHSEE. Goal #3 - Improve and increase the school’s curricular, instruction, and support for struggling ninth graders who are not performing up to grade level standards as measured by the CST’s, grades, and credit completion.
Critical Areas for Follow Up……………………………………………………...……………….. 75
Goal #1 - No systemic individualized learning plan appears to be in place to involve all students and parents in secondary and post-secondary planning.
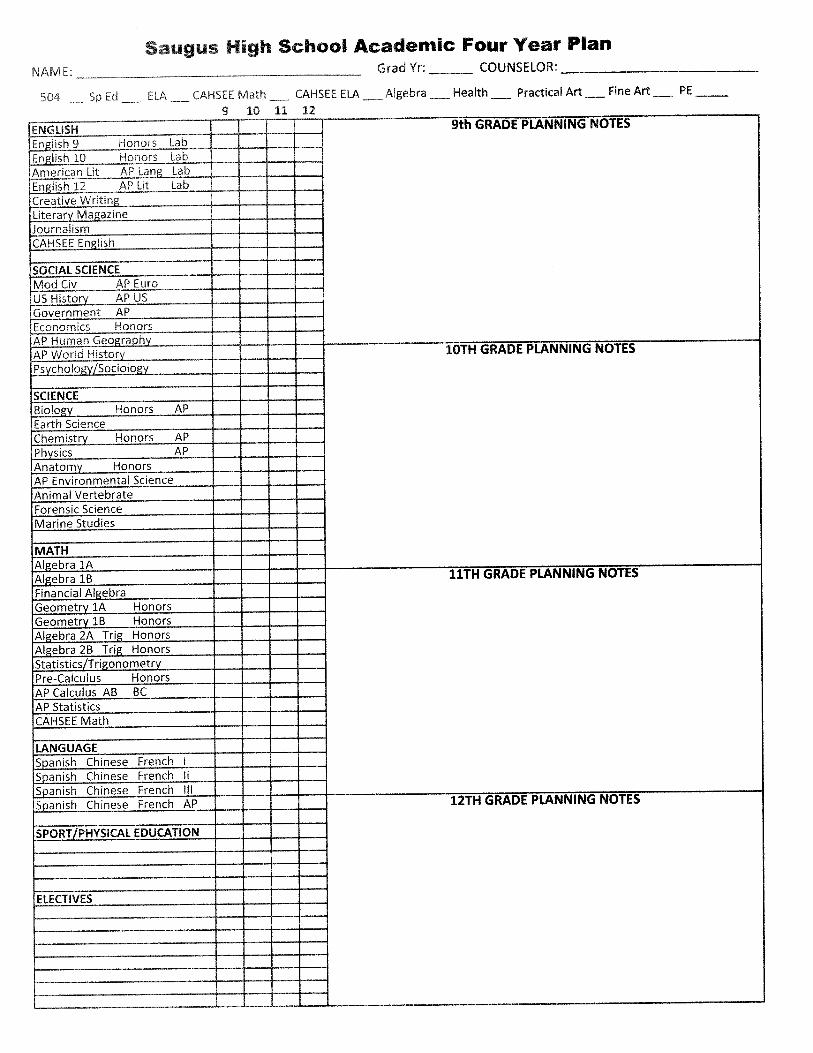
A-G Credit Checks Four Year Plan New Student Registration System Naviance
Goal #2 - Pacing calendars, common assessments, and use of student data to make instructional decisions are not used consistently in all departments.
Higher Levels of Collaboration Looking at CST Data to Improve Instruction Changing Teaching Strategies and Developing Common Assessments Infinite Campus Providing Greater Access to Data for Teachers
Goal #3 - While a culture of high achievement exists for most students, a schoolwide commitment by staff, faculty, and administration is needed to expand that culture to all students, especially those who do not self-advocate or who have not been targeted for intervention.
The Growth of AVID Expanded Intervention Saturday Academy Assisting All Students Developing Study Skills Classes Freshman Immersion Day Helping New Students get Started Well
V. Schoolwide Action Plan Refinements……………………………………………………....82 Infusing the Common Core Standards………………………………………………..…..83
Appendix (Focus Group Rosters, Bell Schedule, Master Schedule, School Calendar, etc.)
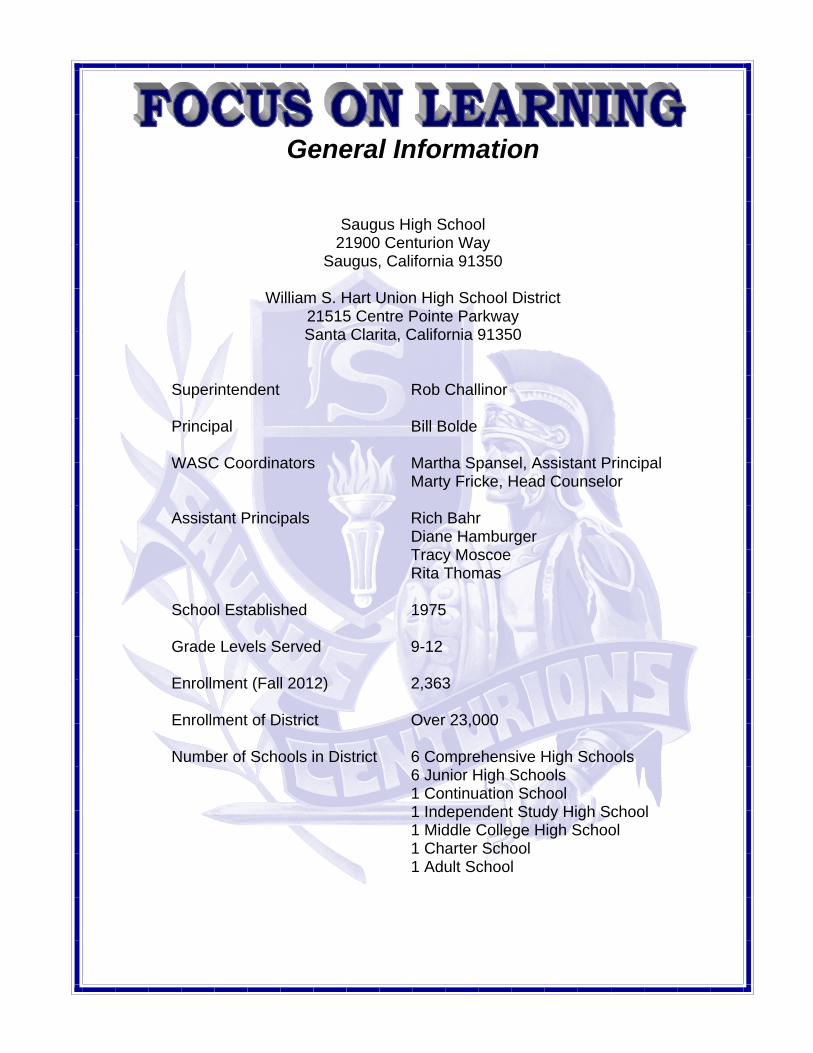
General Information
Saugus High School
21900 Centurion Way Saugus, California 91350
William S. Hart Union High School District
21515 Centre Pointe Parkway Santa Clarita, California 91350
Superintendent Rob Challinor Principal Bill Bolde WASC Coordinators Martha Spansel, Assistant Principal Marty Fricke, Head Counselor Assistant Principals Rich Bahr Diane Hamburger Tracy Moscoe Rita Thomas School Established 1975 Grade Levels Served 9-12 Enrollment (Fall 2012) 2,363 Enrollment of District Over 23,000 Number of Schools in District 6 Comprehensive High Schools 6 Junior High Schools 1 Continuation School 1 Independent Study High School 1 Middle College High School 1 Charter School 1 Adult School
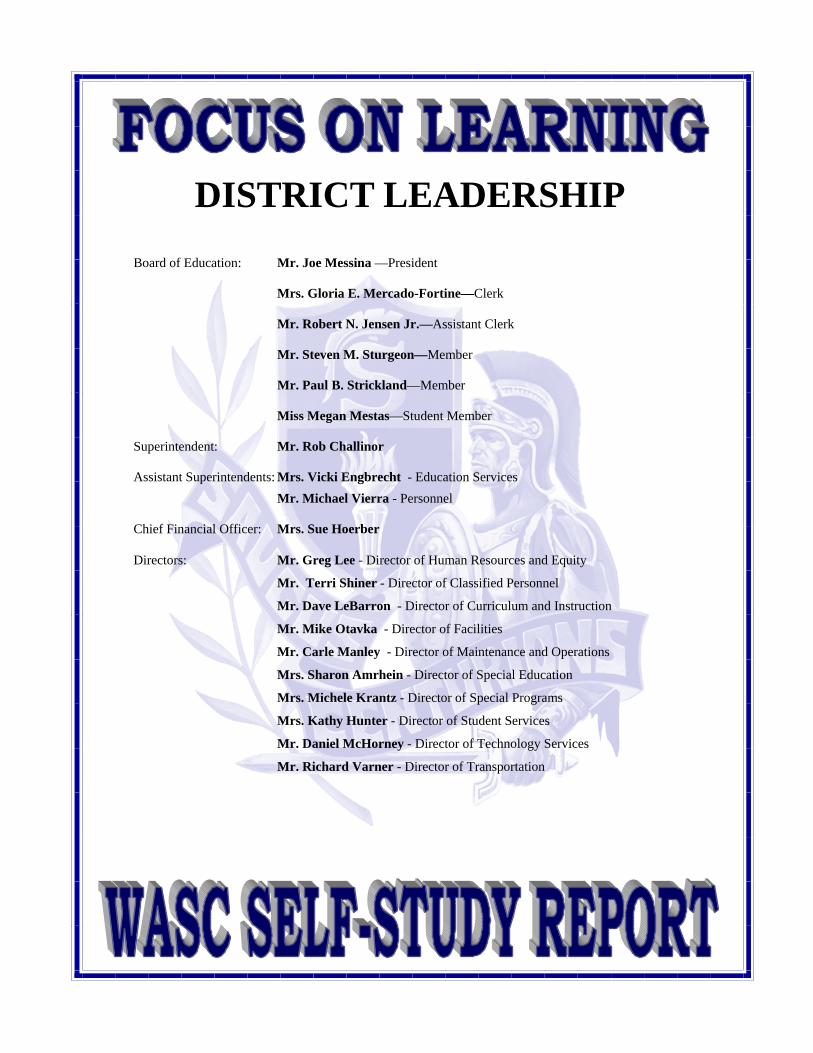
DISTRICT LEADERSHIP
Board of Education: Mr. Joe Messina —President Mrs. Gloria E. Mercado-Fortine—Clerk Mr. Robert N. Jensen Jr.—Assistant Clerk Mr. Steven M. Sturgeon—Member Mr. Paul B. Strickland—Member Miss Megan Mestas—Student Member Superintendent: Mr. Rob Challinor Assistant Superintendents: Mrs. Vicki Engbrecht - Education Services
Mr. Michael Vierra - Personnel Chief Financial Officer: Mrs. Sue Hoerber Directors: Mr. Greg Lee - Director of Human Resources and Equity
Mr. Terri Shiner - Director of Classified Personnel
Mr. Dave LeBarron - Director of Curriculum and Instruction
Mr. Mike Otavka - Director of Facilities
Mr. Carle Manley - Director of Maintenance and Operations
Mrs. Sharon Amrhein - Director of Special Education
Mrs. Michele Krantz - Director of Special Programs
Mrs. Kathy Hunter - Director of Student Services
Mr. Daniel McHorney - Director of Technology Services
Mr. Richard Varner - Director of Transportation

Visitation Schedule
Date of Visit: Tuesday, February 21, 2013
Visiting Committee Chair: Lisa Padilla
7:15—8:00 Meeting with Site Administration
8:15—9:15 Meeting with Leadership and Follow-up Team 9:30—10:15 Meeting with Parents 10:15—12:22 Classroom Visitations 12:22—1:30 Lunch with Students 1:30—3:00 Visiting Team to Complete Report 3:00—3:45 Exit Meeting with Site Leadership
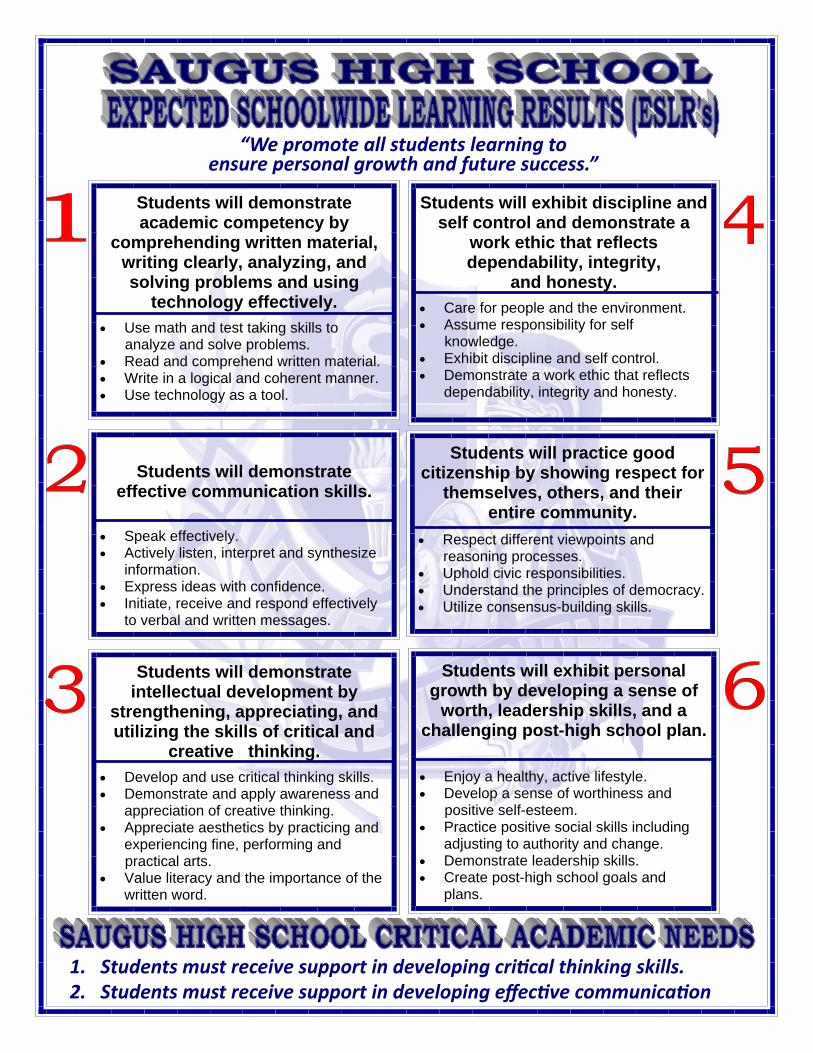
“We promote all students learning to ensure personal growth and future success.”
1. Students must receive support in developing cri cal thinking skills. 2. Students must receive support in developing effec ve communica on
Students will demonstrate academic competency by
comprehending written material, writing clearly, analyzing, and solving problems and using
technology effectively.
Use math and test taking skills to analyze and solve problems. Read and comprehend written material. Write in a logical and coherent manner. Use technology as a tool.
Students will exhibit discipline and self control and demonstrate a
work ethic that reflects dependability, integrity,
and honesty.
Care for people and the environment. Assume responsibility for self knowledge. Exhibit discipline and self control. Demonstrate a work ethic that reflects
dependability, integrity and honesty.
Students will demonstrate
effective communication skills.
Speak effectively. Actively listen, interpret and synthesize
information. Express ideas with confidence. Initiate, receive and respond effectively
to verbal and written messages.
Students will practice good citizenship by showing respect for
themselves, others, and their entire community.
Respect different viewpoints and reasoning processes. Uphold civic responsibilities. Understand the principles of democracy. Utilize consensus-building skills.
Students will demonstrate intellectual development by
strengthening, appreciating, and utilizing the skills of critical and
creative thinking.
Develop and use critical thinking skills. Demonstrate and apply awareness and
appreciation of creative thinking. Appreciate aesthetics by practicing and
experiencing fine, performing and practical arts. Value literacy and the importance of the
written word.
Students will exhibit personal growth by developing a sense of
worth, leadership skills, and a challenging post-high school plan.
Enjoy a healthy, active lifestyle. Develop a sense of worthiness and positive self-esteem. Practice positive social skills including
adjusting to authority and change. Demonstrate leadership skills. Create post-high school goals and
plans.
Section One School-Community Profile
Student Performance Data
1
I. Student/Community Profile
General School and Community Description
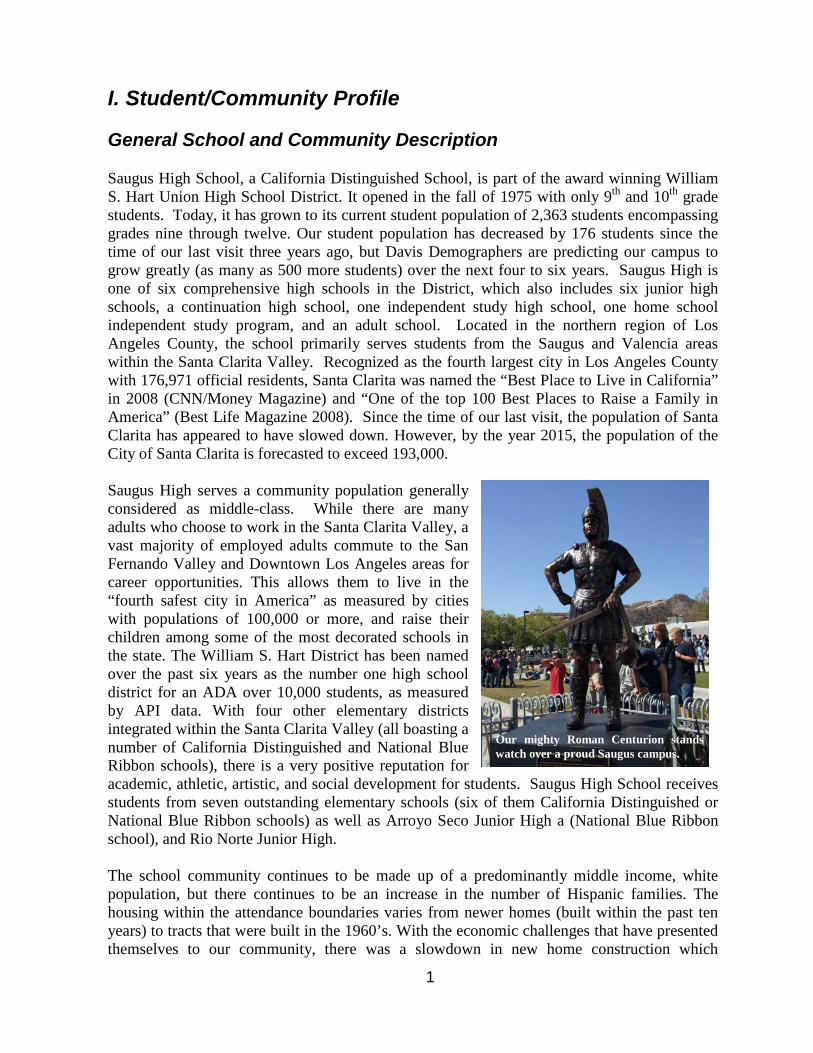
Saugus High School, a California Distinguished School, is part of the award winning William S. Hart Union High School District. It opened in the fall of 1975 with only 9th and 10th grade students. Today, it has grown to its current student population of 2,363 students encompassing grades nine through twelve. Our student population has decreased by 176 students since the time of our last visit three years ago, but Davis Demographers are predicting our campus to grow greatly (as many as 500 more students) over the next four to six years. Saugus High is one of six comprehensive high schools in the District, which also includes six junior high schools, a continuation high school, one independent study high school, one home school independent study program, and an adult school. Located in the northern region of Los Angeles County, the school primarily serves students from the Saugus and Valencia areas within the Santa Clarita Valley. Recognized as the fourth largest city in Los Angeles County with 176,971 official residents, Santa Clarita was named the “Best Place to Live in California” in 2008 (CNN/Money Magazine) and “One of the top 100 Best Places to Raise a Family in America” (Best Life Magazine 2008). Since the time of our last visit, the population of Santa Clarita has appeared to have slowed down. However, by the year 2015, the population of the City of Santa Clarita is forecasted to exceed 193,000. Saugus High serves a community population generally considered as middle-class. While there are many adults who choose to work in the Santa Clarita Valley, a vast majority of employed adults commute to the San Fernando Valley and Downtown Los Angeles areas for career opportunities. This allows them to live in the “fourth safest city in America” as measured by cities with populations of 100,000 or more, and raise their children among some of the most decorated schools in the state. The William S. Hart District has been named over the past six years as the number one high school district for an ADA over 10,000 students, as measured by API data. With four other elementary districts integrated within the Santa Clarita Valley (all boasting a number of California Distinguished and National Blue Ribbon schools), there is a very positive reputation for academic, athletic, artistic, and social development for students. Saugus High School receives students from seven outstanding elementary schools (six of them California Distinguished or National Blue Ribbon schools) as well as Arroyo Seco Junior High a (National Blue Ribbon school), and Rio Norte Junior High.
The school community continues to be made up of a predominantly middle income, white population, but there continues to be an increase in the number of Hispanic families. The housing within the attendance boundaries varies from newer homes (built within the past ten years) to tracts that were built in the 1960’s. With the economic challenges that have presented themselves to our community, there was a slowdown in new home construction which
Our mighty Roman Centurion stands watch over a proud Saugus campus.
2
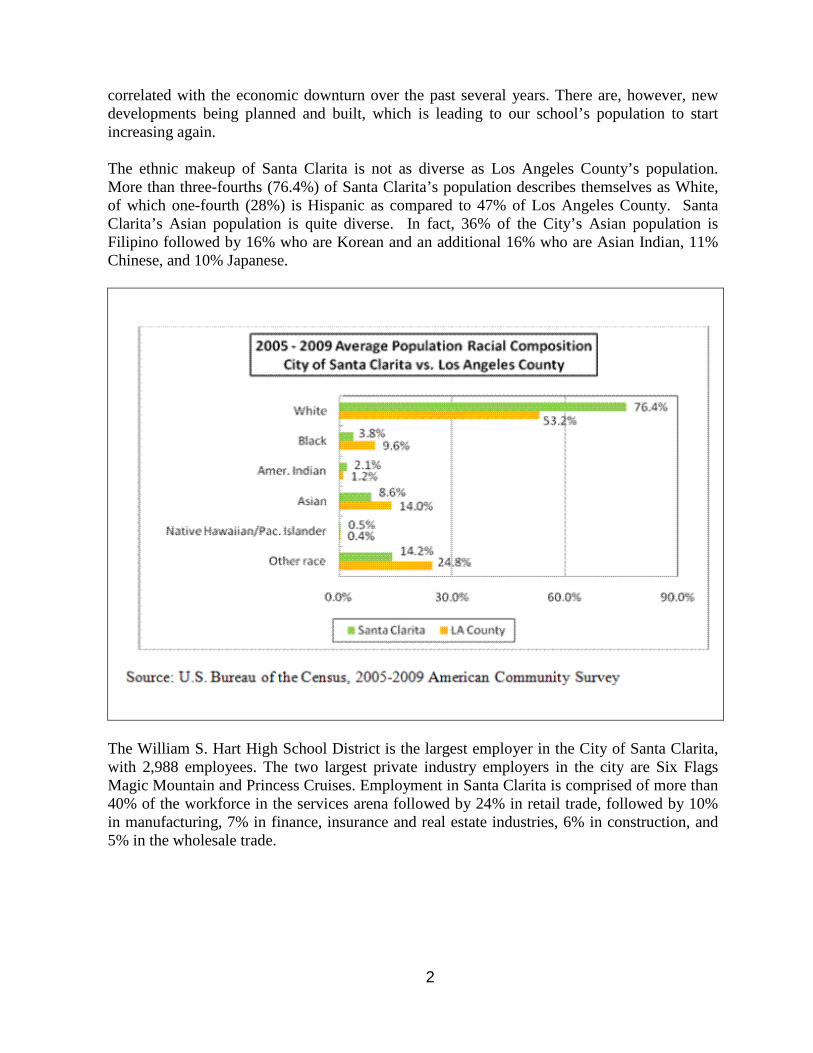
correlated with the economic downturn over the past several years. There are, however, new developments being planned and built, which is leading to our school’s population to start increasing again. The ethnic makeup of Santa Clarita is not as diverse as Los Angeles County’s population. More than three-fourths (76.4%) of Santa Clarita’s population describes themselves as White, of which one-fourth (28%) is Hispanic as compared to 47% of Los Angeles County. Santa Clarita’s Asian population is quite diverse. In fact, 36% of the City’s Asian population is Filipino followed by 16% who are Korean and an additional 16% who are Asian Indian, 11% Chinese, and 10% Japanese.
The William S. Hart High School District is the largest employer in the City of Santa Clarita, with 2,988 employees. The two largest private industry employers in the city are Six Flags Magic Mountain and Princess Cruises. Employment in Santa Clarita is comprised of more than 40% of the workforce in the services arena followed by 24% in retail trade, followed by 10% in manufacturing, 7% in finance, insurance and real estate industries, 6% in construction, and 5% in the wholesale trade.

3
Student Goals
ESLR’s
Saugus High School has maintained our Expected Schoolwide Learning Results (ESLR’s) since they were updated in preparation for the 2010 visit. The ESLR’s are as follows:
1. Students will demonstrate academic competency by comprehending written material, writing clearly, analyzing, and solving problems, and using technology effectively.
2. Students will demonstrate effective communication skills. 3. Students will demonstrate intellectual development by strengthening, appreciating,
and utilizing the skills of critical and creative thinking. 4. Students will exhibit discipline and self-control and demonstrate a work ethic that
reflects dependability, integrity and honesty. 5. Students will practice good citizenship by showing respect for themselves, others and
their entire community. 6. Students will exhibit personal growth by developing a sense of worth, leadership
skills, and a challenging post-high school plan. Critical Academic Needs
Saugus High School has two Critical Academic Needs, which are: 1. Students must receive support in developing critical thinking skills. 2. Students must receive support in developing effective communication skills.
4
Mission Statement The school’s Mission Statement is meaningful and is one that can be embraced by all stakeholders…
“At Saugus High, we promote all students’ learning to ensure personal growth and future success.”
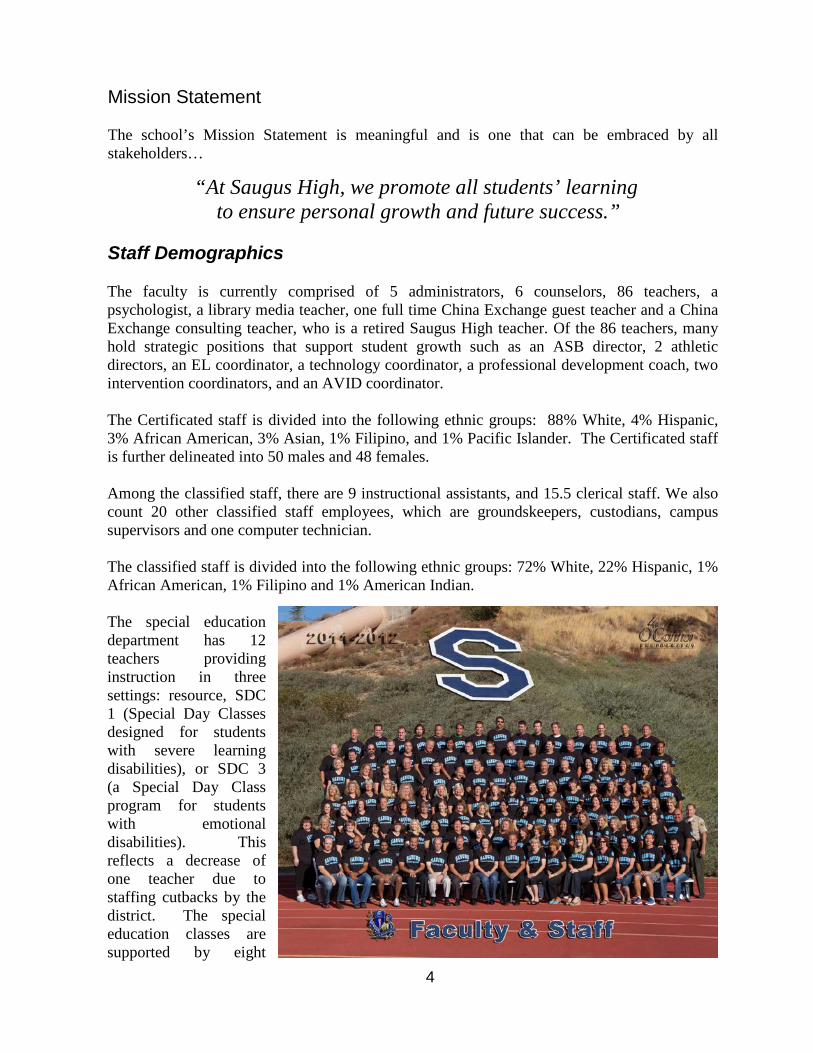
Staff Demographics
The faculty is currently comprised of 5 administrators, 6 counselors, 86 teachers, a psychologist, a library media teacher, one full time China Exchange guest teacher and a China Exchange consulting teacher, who is a retired Saugus High teacher. Of the 86 teachers, many hold strategic positions that support student growth such as an ASB director, 2 athletic directors, an EL coordinator, a technology coordinator, a professional development coach, two intervention coordinators, and an AVID coordinator. The Certificated staff is divided into the following ethnic groups: 88% White, 4% Hispanic, 3% African American, 3% Asian, 1% Filipino, and 1% Pacific Islander. The Certificated staff is further delineated into 50 males and 48 females. Among the classified staff, there are 9 instructional assistants, and 15.5 clerical staff. We also count 20 other classified staff employees, which are groundskeepers, custodians, campus supervisors and one computer technician. The classified staff is divided into the following ethnic groups: 72% White, 22% Hispanic, 1% African American, 1% Filipino and 1% American Indian. The special education department has 12 teachers providing instruction in three settings: resource, SDC 1 (Special Day Classes designed for students with severe learning disabilities), or SDC 3 (a Special Day Class program for students with emotional disabilities). This reflects a decrease of one teacher due to staffing cutbacks by the district. The special education classes are supported by eight

5
paraprofessional assistants. Students’ education plans may include general education courses as well as classes designed to meet their specific academic needs.
Student Demographics
Saugus High School remains a diverse school community. The student body of Saugus High School includes a wide variety of diversity among our students, as evidenced by the Centurion Colonnade, flying flags from over 100 countries representing the heritage of the families of our students and staff. Student demographics show a broad range of cultural backgrounds. The chart below depicts the ethnic breakdown of the Saugus student body. Our student demographics have remained relatively stable, although the enrollment of Hispanic students has increased to almost one quarter of the school population.
Native
American African
American Pacific
Islander Filipino Hispanic White Asian
Multiple Races
2011-12 0.4% 2.2% 0.3% 3.0% 24.0% 63.0% 5.0% .06%
2010-11 0.4% 2.0% 0.4% 4.3% 21.9% 65.0% 5.1% .03%
2009-10 0.4% 2.1% 0.4% 4.5% 21.2% 65.6% 5.1% .02%
2008-09 0.3% 2.5% 0.3% 4.3% 22.1% 64.6% 5.0% .06%
In addition to having an ethnically diverse student population, there is diversity within the parent educational background. The proportion of parent education levels in each category has remained stable over the past decade. One change that we have noticed is that the percentage of parents who attended graduate school has increased from 11 percent in 2007, to 14 percent in 2010 to 16 percent in 2012. The chart below represents the highest levels of education attained by Saugus parents in 2012.
2
9
37
29
16
4
0 5 10 15 20 25 30 35 40
Not a High SchoolGraduate
High SchoolGraduate
Some College
College Graduate
Graduate School
Decline to State
Percentage of Parents
6
Along with the school’s rigorous college and vocational preparation, our school provides the following student programs to foster excellence and promote growth: a Regional Occupation Program (ROP), a Special Education program consisting of Special Day Classes (SDC), the Resource Program (RS), the Emotionally Disturbed Class (ED), and Deaf and Hard of Hearing services facilitated by a speech therapist, an Armed Forces Reserved Officer’s Training Corp (ROTC), and course offerings for gifted and talented students such as Honors and Advanced Placement (AP). The school has also had an English Language Learners (EL) program for the past seven years.
Free and Reduced Lunch Status
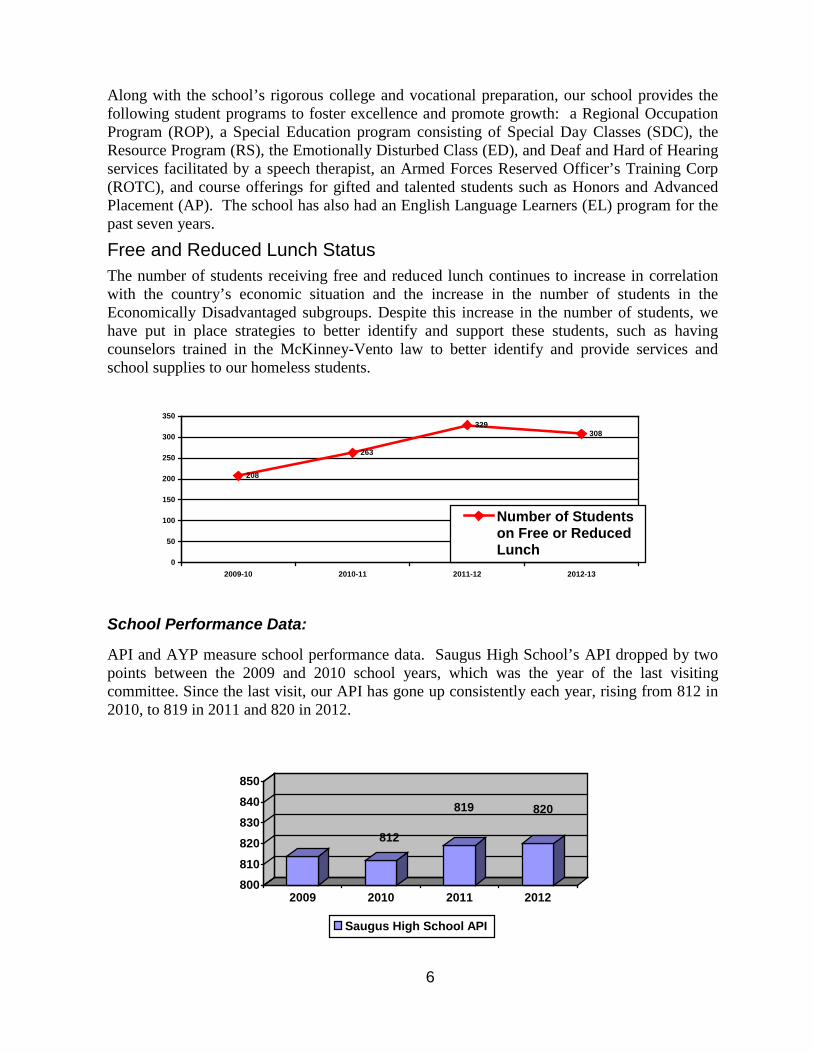
The number of students receiving free and reduced lunch continues to increase in correlation with the country’s economic situation and the increase in the number of students in the Economically Disadvantaged subgroups. Despite this increase in the number of students, we have put in place strategies to better identify and support these students, such as having counselors trained in the McKinney-Vento law to better identify and provide services and school supplies to our homeless students.
208
263
329308
0
50
100
150
200
250
300
350
2009-10 2010-11 2011-12 2012-13
Number of Studentson Free or ReducedLunch
School Performance Data: API and AYP measure school performance data. Saugus High School’s API dropped by two points between the 2009 and 2010 school years, which was the year of the last visiting committee. Since the last visit, our API has gone up consistently each year, rising from 812 in 2010, to 819 in 2011 and 820 in 2012.
812
819 820
800
810
820
830
840
850
2009 2010 2011 2012
Saugus High School API

7
2011 API Rates
Number of Students Included in the 2009 API
2011 API 2011 Statewide Rank
2011 Similar Schools Rank
2011 Growth Target
2011 API Target
1754 819 8 6 Achieved None Assigned
2011 Subgroups
Ethnic Subgroups and Other Subgroups
Number of Students in
2011 API
Statistically Significant
2011 Base 2011 Growth Target
2012 Target
African American 37 No American Indian 10 No Asian 89 No Filipino 78 No Hispanic 397 Yes 760 5 765 Pacific Islander 7 No White 1,128 Yes 832 Achieved None Assigned Socioeconomically Disadvantaged
197 Yes 748 5 753
English Learners 142 Yes 744 5 749 Students with Disabilities
194 Yes 563 12 575
2010 API Rates
Number of Students Included in the 2010 API
2010 API 2010 Statewide Rank
2010 Similar Schools Rank
2010 Growth Target
2010 API Target
1776 812 8 4 Achieved None Assigned
2010 Subgroups
Ethnic Subgroups and Other Subgroups
Number of Students in 2010 API
Statistically Significant
2010 Base 2010 Growth Target
2011 Target
African American 43 No American Indian 8 No Asian 90 No Filipino 78 No Hispanic 375 Yes 770 5 775 Pacific Islander 8 No White 1,167 Yes 821 Achieved None Assigned Socioeconomically Disadvantaged
130 Yes 751 5 756
English Learners 117 Yes 748 5 753 Students with Disabilities
173 Yes 548 13 561

8
The following chart shows Saugus High School’s statewide API Rankings, along with the Similar School Rankings. Schools are ranked in ten categories of equal size, called deciles, from one (lowest) to ten (highest). A school’s statewide rank compares that school to other schools of the same type in the entire state. Each decile contains 10 percent of all schools of that type. Saugus High School’s similar schools rank increased from a four in 2010 to a six in 2011, while our statewide rank stayed consistently at 8.
Testing Year Statewide Rank Similar Schools Rank 2012 Not available at this time Not available at this time 2011 8 6 2010 8 4
California High School Exit Exam
Saugus High School continues to maintain very high CAHSEE passing scores. In 2012 at the last spring testing date, we achieved a 93 percent passing rate on the ELA portion of the exam, and a 94 percent passing rate on the math portion. Even though the overall school passing rates went down by one percent from 2010 on both ELA and math, the rates of the special education population has increased in both ELA from 57 to 65 percent, and in math from 67 to 73 percent (first time test takers). A highlight to this information is that none of these special education students took the CAHSEE with accommodations (common practice for first time takers).
March 2012 CAHSEE passing scores for 10th grade test takers in: English-Language Arts Number
Tested Special Education
English Learners
RFEP (Passed)
Economically Disadvantaged
Not Economically Disadvantaged
Number Tested
561 78 29 36 96 452
Number Passing
523 (93%) 51 (65%) 17 (59%) 32 (89%) 84 (88%) 427 (94%)
March 2012 CAHSEE passing scores for 10th grade test takers in: Mathematics Number
Tested Special Education
English Learners
RFEP (Passed)
Economically Disadvantaged
Not Economically Disadvantaged
Number Tested
559 77 29 36 97 449
Number Passing
528 (94%) 56 (73%) 21 (72%) 34 (94%) 89 (92%) 427 (95%)
March 2011 CAHSEE passing scores for 10th grade test takers in: English-Language Arts Number
Tested Special Education
English Learners
RFEP (Passed)
Economically Disadvantaged
Not Economically Disadvantaged
Number Tested
641 67 23 19 68 557
Number Passing
604 (94%) 44 (66%) 17 (74%) 17 (89%) 56 (82%) 533 (96%)
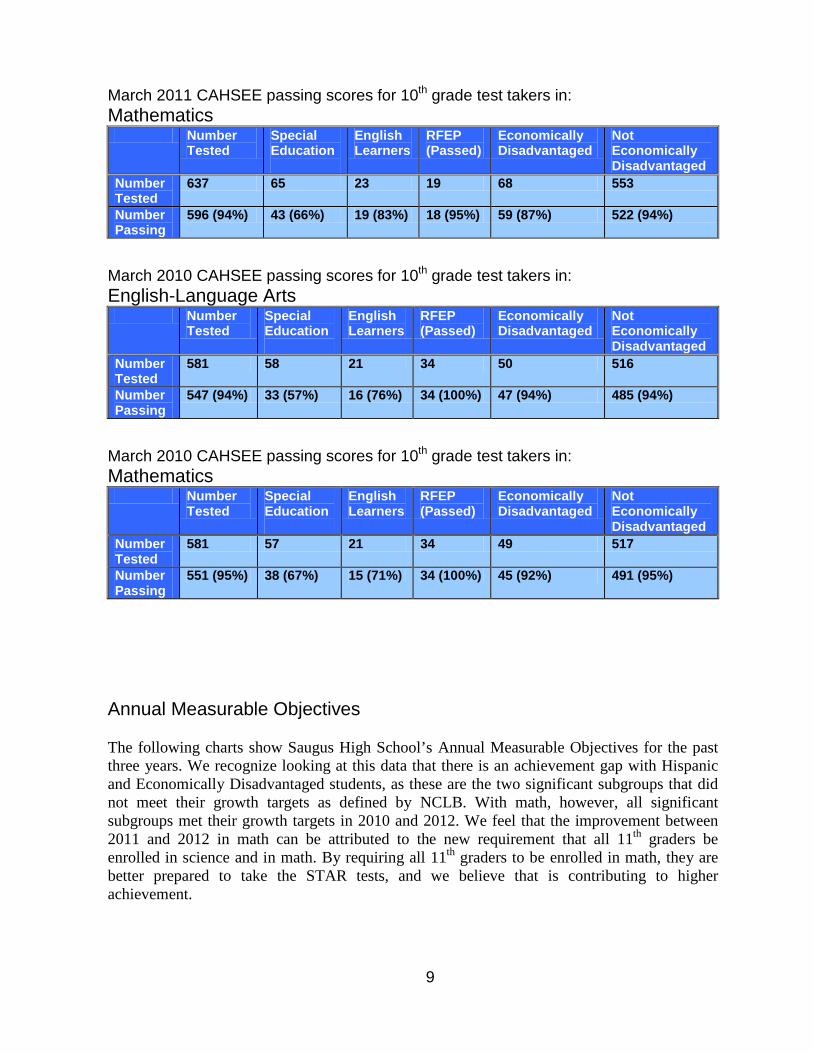
9
March 2011 CAHSEE passing scores for 10th grade test takers in: Mathematics Number
Tested Special Education
English Learners
RFEP (Passed)
Economically Disadvantaged
Not Economically Disadvantaged
Number Tested
637 65 23 19 68 553
Number Passing
596 (94%) 43 (66%) 19 (83%) 18 (95%) 59 (87%) 522 (94%)
March 2010 CAHSEE passing scores for 10th grade test takers in: English-Language Arts Number
Tested Special Education
English Learners
RFEP (Passed)
Economically Disadvantaged
Not Economically Disadvantaged
Number Tested
581 58 21 34 50 516
Number Passing
547 (94%) 33 (57%) 16 (76%) 34 (100%) 47 (94%) 485 (94%)
March 2010 CAHSEE passing scores for 10th grade test takers in: Mathematics Number
Tested Special Education
English Learners
RFEP (Passed)
Economically Disadvantaged
Not Economically Disadvantaged
Number Tested
581 57 21 34 49 517
Number Passing
551 (95%) 38 (67%) 15 (71%) 34 (100%) 45 (92%) 491 (95%)
Annual Measurable Objectives
The following charts show Saugus High School’s Annual Measurable Objectives for the past three years. We recognize looking at this data that there is an achievement gap with Hispanic and Economically Disadvantaged students, as these are the two significant subgroups that did not meet their growth targets as defined by NCLB. With math, however, all significant subgroups met their growth targets in 2010 and 2012. We feel that the improvement between 2011 and 2012 in math can be attributed to the new requirement that all 11th graders be enrolled in science and in math. By requiring all 11th graders to be enrolled in math, they are better prepared to take the STAR tests, and we believe that is contributing to higher achievement.

10
Annual Measurable Objectives 2012: English Language Arts Target 77.8% as defined by NCLB
Group Number Tested
Number at or Above Proficient
% at or Above Proficient
Met AYP? Participation Rate (%)
Schoolwide 547 393 71.8 No
African-American
10
American Indian
3
Asian 24 17 70.8
Filipino 23 20 87.0
Hispanic 133 72 54.1 No
White 350 271 77.4 Yes
Economic ally Disadvantaged
93 54 58.1
No
English Learners
52 15 28.8
Students w/disabilities
77 17 22.1
Annual Measurable Objectives 2012: Math Target 77.4% as defined by NCLB
Group Number Tested
Number at or Above Proficient
% at or Above Proficient
Met AYP? Participation Rate (%)
Schoolwide 548 425 77.6 Yes
African-American
10
American Indian 3
Asian 24 21 87.5
Filipino 23 20 87.0
Hispanic 133 87 65.4 Yes
White 351 284 80.9 Yes
Economic ally Disadvantaged
93 63 58.1
No
English Learners
52 29 55.8
Yes
Students w/disabilities
77 30 39.0
11
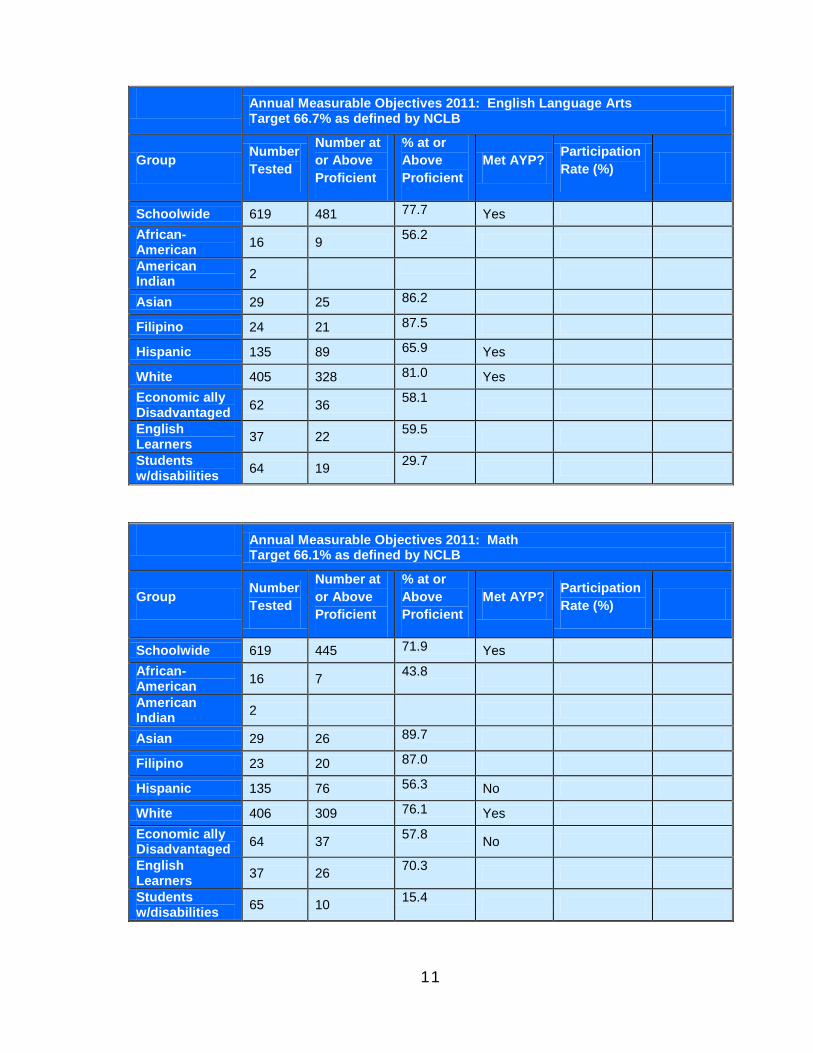
Annual Measurable Objectives 2011: English Language Arts Target 66.7% as defined by NCLB
Group Number Tested
Number at or Above Proficient
% at or Above Proficient
Met AYP? Participation Rate (%)
Schoolwide 619 481 77.7 Yes
African-American
16 9 56.2
American Indian
2
Asian 29 25 86.2
Filipino 24 21 87.5
Hispanic 135 89 65.9 Yes
White 405 328 81.0 Yes
Economic ally Disadvantaged
62 36 58.1
English Learners
37 22 59.5
Students w/disabilities
64 19 29.7
Annual Measurable Objectives 2011: Math Target 66.1% as defined by NCLB
Group Number Tested
Number at or Above Proficient
% at or Above Proficient
Met AYP? Participation Rate (%)
Schoolwide 619 445 71.9 Yes
African-American
16 7 43.8
American Indian 2
Asian 29 26 89.7
Filipino 23 20 87.0
Hispanic 135 76 56.3 No
White 406 309 76.1 Yes
Economic ally Disadvantaged
64 37 57.8
No
English Learners
37 26 70.3
Students w/disabilities
65 10 15.4

12
Annual Measurable Objectives 2010: English Language Arts Target 55.6% as defined by NCLB
Group Number Tested
Number at or Above Proficient
% at or Above Proficient
Met AYP? Participation Rate (%)
Schoolwide 574 425 74.0 Yes
African-American
11 10 90.9
American Indian
4
Asian 35 31 88.6
Filipino 26 16 61.5
Hispanic 130 82 63.1 Yes
White 366 281 76.8 Yes
Economic ally Disadvantaged
46 26 56.5
English Learners
43 20 46.5
Students w/disabilities
58 13 22.4
Annual Measurable Objectives 2010: Math Target 54.8% as defined by NCLB
Group Number Tested
Number at or Above Proficient
% at or Above Proficient
Met AYP? Participation Rate (%)
Schoolwide 575 436 75.8 Yes
African-American
11 9 81.8
American Indian 4
Asian 35 31 88.6
Filipino 26 17 65.4
Hispanic 130 82 63.1 Yes
White 367 292 79.6 Yes
Economic ally Disadvantaged
47 28 59.6
English Learners
43 25 58.1
Students w/disabilities
58 22 37.9
13
Student Performance Data:
Student achievement is measured in a variety of ways. Measurement instruments include assessments required under the state’s Standardized Testing and Reporting (STAR) program, the California High School Exit Exam, and a variety of outside assessments such as the SAT and AP exams. Saugus High School teachers have access to a student’s score on all standards-based assessments, such as state tests (e.g. STAR, CAHSEE, CELDT), district-wide assessments, and the Saugus’ own benchmark tests. Teachers can continue to access this information via the Instructional Data Management System (IDMS). Through the IDMS website, teachers view all of their students’ scores and note what particular standards students have missed. Teachers can evaluate their own teaching practice as well and decide if they need to re-teach a certain standard. Saugus High School teachers can also access data through hartserve.org curriculum pacing guides and instructional resources as a means to increase student achievement.
During Planning Wednesday collaboration time, teachers meet in departments to discuss the previous quarter’s benchmark scores and collaborate which standards they need to review. All departments are continuing to develop pacing calendars and common assessments to ensure that students meet the standards. Homework is assigned primarily as a means for students to improve their skills so they can achieve the targeted standards. Teachers also refer students who need more concentrated assistance to the school’s intervention program.
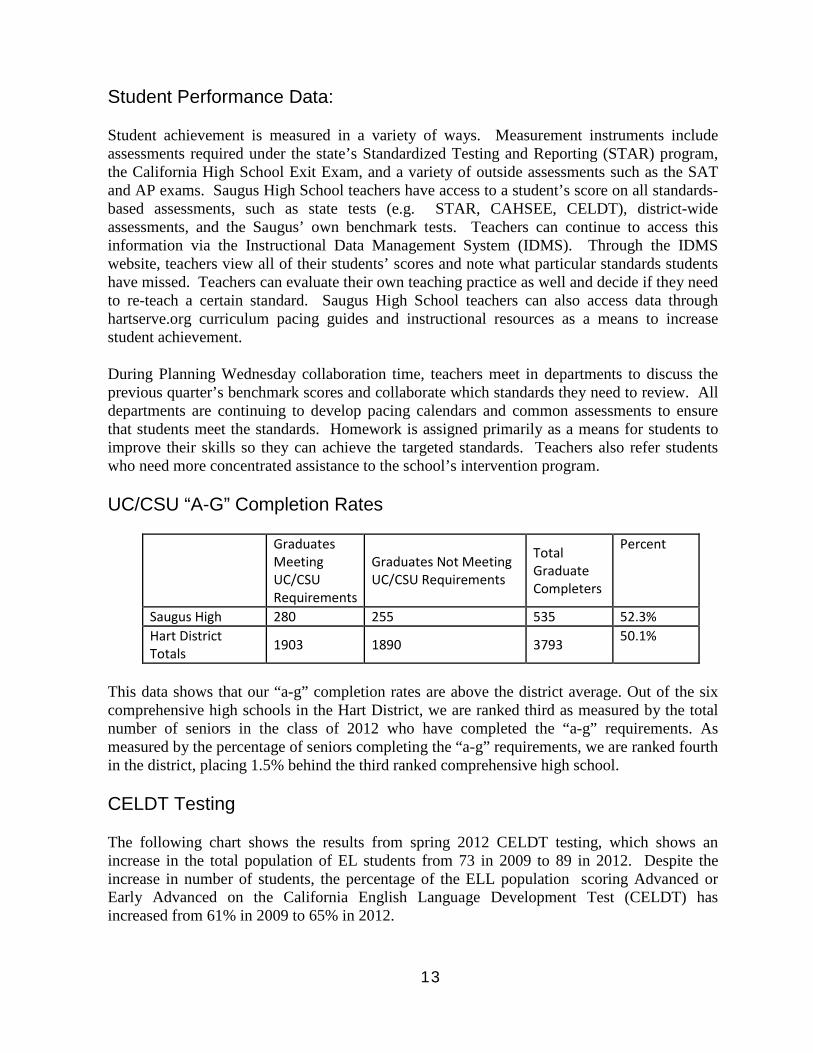
UC/CSU “A-G” Completion Rates
Graduates Meeting UC/CSU Requirements
Graduates Not Meeting UC/CSU Requirements
Total Graduate Completers
Percent
Saugus High 280 255 535 52.3% Hart District Totals 1903 1890 3793 50.1%
This data shows that our “a-g” completion rates are above the district average. Out of the six comprehensive high schools in the Hart District, we are ranked third as measured by the total number of seniors in the class of 2012 who have completed the “a-g” requirements. As measured by the percentage of seniors completing the “a-g” requirements, we are ranked fourth in the district, placing 1.5% behind the third ranked comprehensive high school.
CELDT Testing
The following chart shows the results from spring 2012 CELDT testing, which shows an increase in the total population of EL students from 73 in 2009 to 89 in 2012. Despite the increase in number of students, the percentage of the ELL population scoring Advanced or Early Advanced on the California English Language Development Test (CELDT) has increased from 61% in 2009 to 65% in 2012.

14
2011-2012 CELDT Annual Assessment – All Students
Grades 9 10 11 12 Total Tested
Overall Proficiency Number and Percent of Students at Each Overall Proficiency Level
Advanced 5 17%
6 23%
12 67%
10 62%
33 37%
Early Advanced 12 41%
13 50%
1 6%
6 38%
32 36%
Intermediate 9 31%
7 27%
3 17%
0 0%
19 21%
Early Intermediate 3 10%
0 0%
2 11%
0 0.0%
5 6%
Beginning 0 0%
0 0.0%
0 0.0%
0 0.0%
0 0.0%
Number Tested 29 100%
26 100%
18 100%
16 100%
89 100%
2010-2011 CELDT Annual Assessment – All Students
Grades 9 10 11 12 Total Tested
Overall Proficiency Number and Percent of Students at Each Overall Proficiency Level
Advanced 4 14%
6 30%
3 21%
2 29%
15 22%
Early Advanced 14 50%
11 55%
7 50%
0 0%
32 46%
Intermediate 10 36%
2 10%
4 29%
5 71%
21 30%
Early Intermediate 0 0%
0 0%
0 0%
0 0%
0 0%
Beginning 0 0%
1 5%
0 0.0%
0 0.0%
1 1%
Number Tested 28 100%
20 100%
14 100%
7 100%
69 100%
2009-2010 CELDT Annual Assessment – All Students
Grades 9 10 11 12 Total Tested Overall Proficiency Number and Percent of Students at Each Overall Proficiency Level
Advanced 6 33%
2 9%
10 63%
6 35%
24 33%
Early Advanced 8 44%
17 77%
3 19%
9 53%
37 51%
Intermediate 2 11%
2 9%
2 13%
1 6%
7 10%
Early Intermediate 2 11%
0 0%
1 6%
1 6%
4 5%
Beginning 0 0%
1 5%
0 0%
0 0%
1 1%
Number Tested 18 100%
22 100%
16 100%
17 100%
73 100%
15
To accommodate the needs of our changing student population, we have expanded the number of sections we offer of EL classes. Previously, we scheduled all four levels of EL into three class sections. Now, we have four sections of EL taught by two different teachers. The EL Level I and II students are taught in two hour blocks of instruction, and the Level III and IV students are taught in separate one hour class periods. Students are mainstreamed for the remainder of their academic classes, with the support of a bilingual instructional assistant. The EL classes are taught by highly qualified credentialed English teachers. Some data analysis of the EL program took the grades the EL students were earning in their mainstreamed classes, and found that 71% of the EL students had a D or an F on their 1st quarter report card. Of these students, 21% had a D or an F in an elective class, such as advanced math or science, and 79% were earning a D or an F in a required class. We are providing academic support to these students through the school’s intervention program. We are continuing to look at ways to better meet the academic needs of these students, and recognize this is an area of weakness.
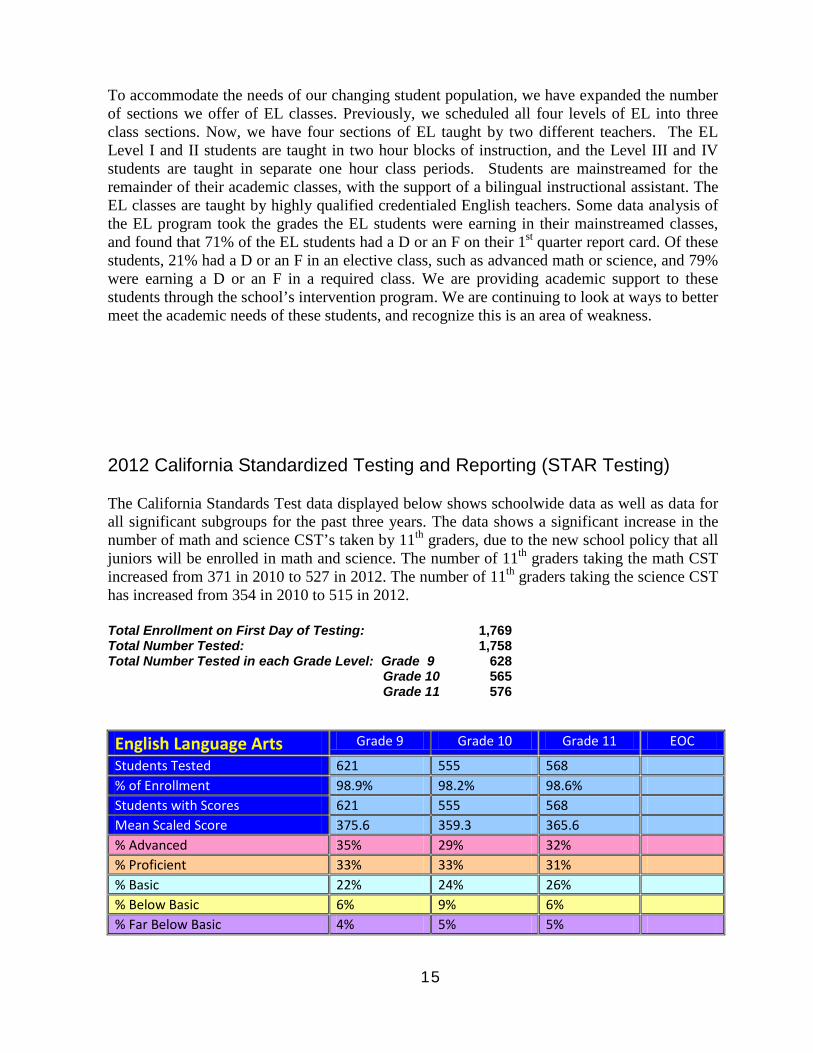
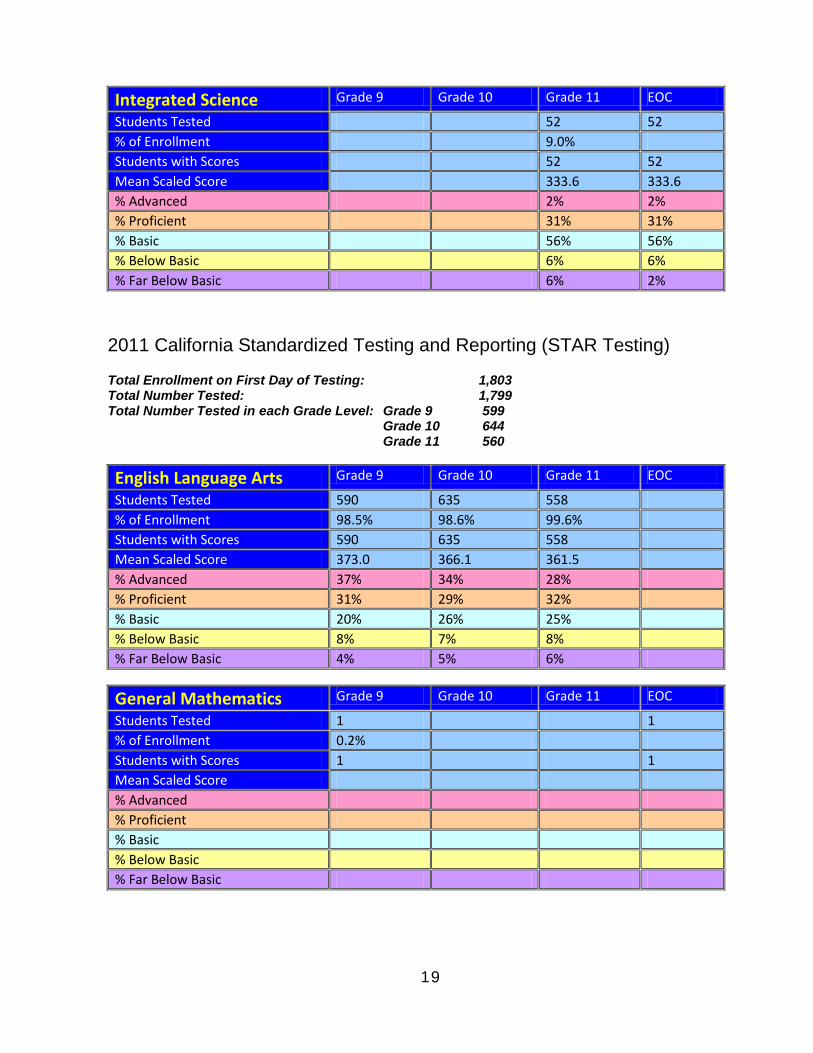
2012 California Standardized Testing and Reporting (STAR Testing)
The California Standards Test data displayed below shows schoolwide data as well as data for all significant subgroups for the past three years. The data shows a significant increase in the number of math and science CST’s taken by 11th graders, due to the new school policy that all juniors will be enrolled in math and science. The number of 11th graders taking the math CST increased from 371 in 2010 to 527 in 2012. The number of 11th graders taking the science CST has increased from 354 in 2010 to 515 in 2012.
Total Enrollment on First Day of Testing: 1,769 Total Number Tested: 1,758 Total Number Tested in each Grade Level: Grade 9 628 Grade 10 565 Grade 11 576
English Language Arts Grade 9 Grade 10 Grade 11 EOC
Students Tested 621 555 568 % of Enrollment 98.9% 98.2% 98.6% Students with Scores 621 555 568 Mean Scaled Score 375.6 359.3 365.6 % Advanced 35% 29% 32% % Proficient 33% 33% 31% % Basic 22% 24% 26% % Below Basic 6% 9% 6% % Far Below Basic 4% 5% 5%
16
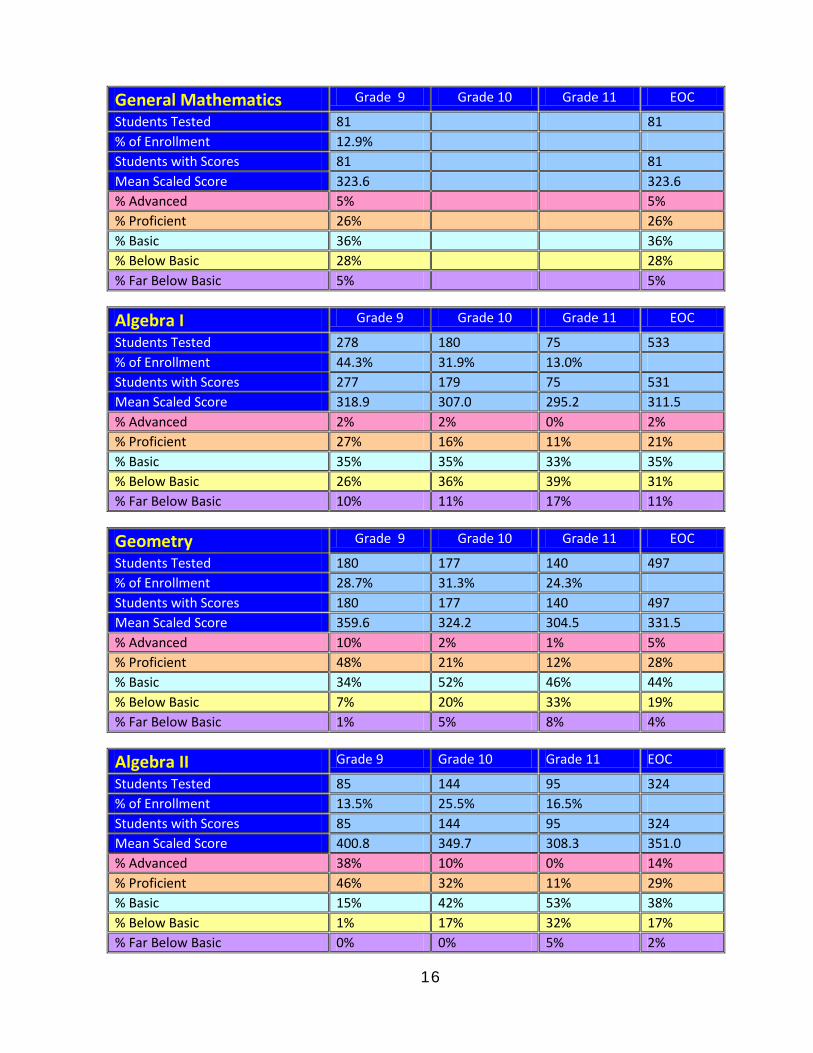
General Mathematics Grade 9 Grade 10 Grade 11 EOC
Students Tested 81 81 % of Enrollment 12.9% Students with Scores 81 81 Mean Scaled Score 323.6 323.6 % Advanced 5% 5% % Proficient 26% 26% % Basic 36% 36% % Below Basic 28% 28% % Far Below Basic 5% 5%
Algebra I Grade 9 Grade 10 Grade 11 EOC
Students Tested 278 180 75 533 % of Enrollment 44.3% 31.9% 13.0% Students with Scores 277 179 75 531 Mean Scaled Score 318.9 307.0 295.2 311.5 % Advanced 2% 2% 0% 2% % Proficient 27% 16% 11% 21% % Basic 35% 35% 33% 35% % Below Basic 26% 36% 39% 31% % Far Below Basic 10% 11% 17% 11%
Geometry Grade 9 Grade 10 Grade 11 EOC
Students Tested 180 177 140 497 % of Enrollment 28.7% 31.3% 24.3% Students with Scores 180 177 140 497 Mean Scaled Score 359.6 324.2 304.5 331.5 % Advanced 10% 2% 1% 5% % Proficient 48% 21% 12% 28% % Basic 34% 52% 46% 44% % Below Basic 7% 20% 33% 19% % Far Below Basic 1% 5% 8% 4%
Algebra II Grade 9 Grade 10 Grade 11 EOC
Students Tested 85 144 95 324 % of Enrollment 13.5% 25.5% 16.5% Students with Scores 85 144 95 324 Mean Scaled Score 400.8 349.7 308.3 351.0 % Advanced 38% 10% 0% 14% % Proficient 46% 32% 11% 29% % Basic 15% 42% 53% 38% % Below Basic 1% 17% 32% 17% % Far Below Basic 0% 0% 5% 2%

17
Summative Mathematics Grade 9 Grade 10 Grade 11 EOC
Students Tested 35 217 252 % of Enrollment 6.2% 37.7% Students with Scores 35 217 252 Mean Scaled Score 397.1 361.6 366.5 % Advanced 31% 18% 19% % Proficient 49% 36% 38% % Basic 11% 28% 26% % Below Basic 9% 17% 16% % Far Below Basic 0% 1% 1%
World History Grade 9 Grade 10 Grade 11 EOC
Students Tested 2 554 5 561 % of Enrollment 0.3% 98.1% 0.9% Students with Scores 553 1 555 Mean Scaled Score 357.1 356.5 % Advanced 26% 26% % Proficient 27% 27% % Basic 26% 26% % Below Basic 8% 8% % Far Below Basic 13% 13%
United States History Grade 9 Grade 10 Grade 11 EOC
Students Tested 562 % of Enrollment 97.6% Students with Scores 562 Mean Scaled Score 372.2 % Advanced 35% % Proficient 29% % Basic 24% % Below Basic 5% % Far Below Basic 7%
Grade 10 Life Science Grade 9 Grade 10 Grade 11 EOC
Students Tested 548 % of Enrollment 97.0% Students with Scores 548 Mean Scaled Score 364.5 % Advanced 32% % Proficient 30% % Basic 20% % Below Basic 9% % Far Below Basic 9%
18
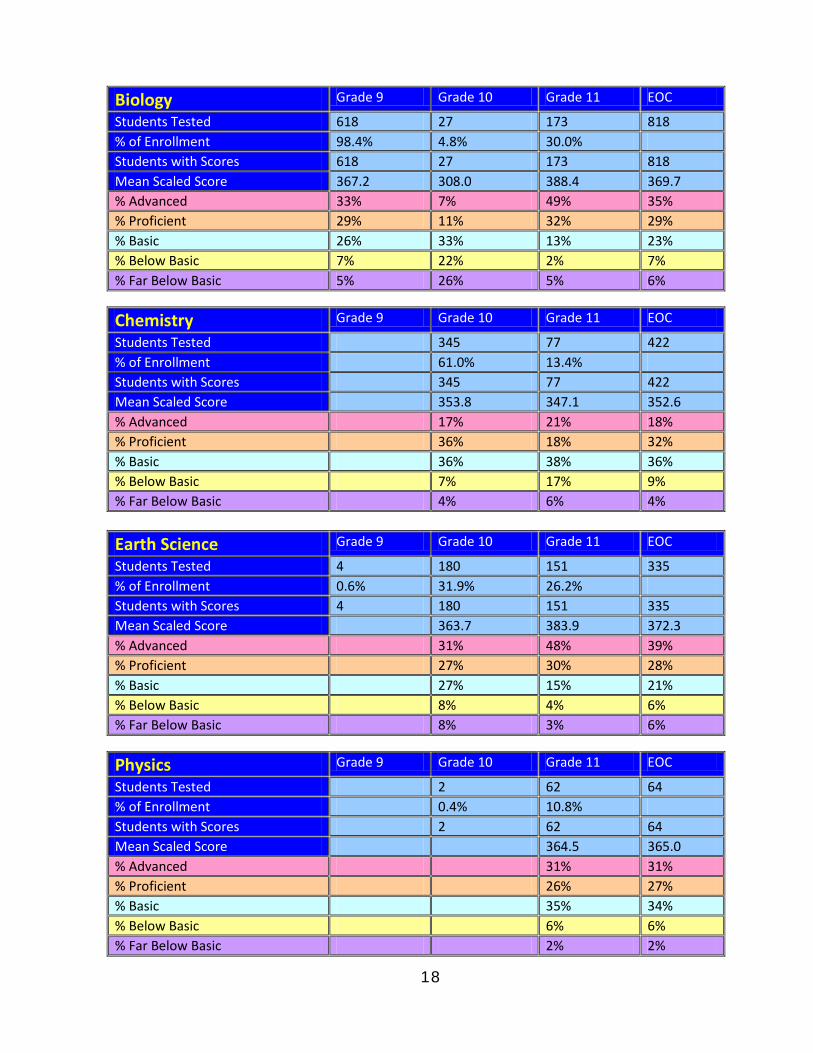
Biology Grade 9 Grade 10 Grade 11 EOC
Students Tested 618 27 173 818 % of Enrollment 98.4% 4.8% 30.0% Students with Scores 618 27 173 818 Mean Scaled Score 367.2 308.0 388.4 369.7 % Advanced 33% 7% 49% 35% % Proficient 29% 11% 32% 29% % Basic 26% 33% 13% 23% % Below Basic 7% 22% 2% 7% % Far Below Basic 5% 26% 5% 6%
Chemistry Grade 9 Grade 10 Grade 11 EOC
Students Tested 345 77 422 % of Enrollment 61.0% 13.4% Students with Scores 345 77 422 Mean Scaled Score 353.8 347.1 352.6 % Advanced 17% 21% 18% % Proficient 36% 18% 32% % Basic 36% 38% 36% % Below Basic 7% 17% 9% % Far Below Basic 4% 6% 4%
Earth Science Grade 9 Grade 10 Grade 11 EOC
Students Tested 4 180 151 335 % of Enrollment 0.6% 31.9% 26.2% Students with Scores 4 180 151 335 Mean Scaled Score 363.7 383.9 372.3 % Advanced 31% 48% 39% % Proficient 27% 30% 28% % Basic 27% 15% 21% % Below Basic 8% 4% 6% % Far Below Basic 8% 3% 6%
Physics Grade 9 Grade 10 Grade 11 EOC
Students Tested 2 62 64 % of Enrollment 0.4% 10.8% Students with Scores 2 62 64 Mean Scaled Score 364.5 365.0 % Advanced 31% 31% % Proficient 26% 27% % Basic 35% 34% % Below Basic 6% 6% % Far Below Basic 2% 2%
19
Integrated Science Grade 9 Grade 10 Grade 11 EOC
Students Tested 52 52 % of Enrollment 9.0% Students with Scores 52 52 Mean Scaled Score 333.6 333.6 % Advanced 2% 2% % Proficient 31% 31% % Basic 56% 56% % Below Basic 6% 6% % Far Below Basic 6% 2%
2011 California Standardized Testing and Reporting (STAR Testing) Total Enrollment on First Day of Testing: 1,803 Total Number Tested: 1,799 Total Number Tested in each Grade Level: Grade 9 599 Grade 10 644 Grade 11 560
English Language Arts Grade 9 Grade 10 Grade 11 EOC
Students Tested 590 635 558 % of Enrollment 98.5% 98.6% 99.6% Students with Scores 590 635 558 Mean Scaled Score 373.0 366.1 361.5 % Advanced 37% 34% 28% % Proficient 31% 29% 32% % Basic 20% 26% 25% % Below Basic 8% 7% 8% % Far Below Basic 4% 5% 6%
General Mathematics Grade 9 Grade 10 Grade 11 EOC
Students Tested 1 1 % of Enrollment 0.2% Students with Scores 1 1 Mean Scaled Score % Advanced % Proficient % Basic % Below Basic % Far Below Basic
20
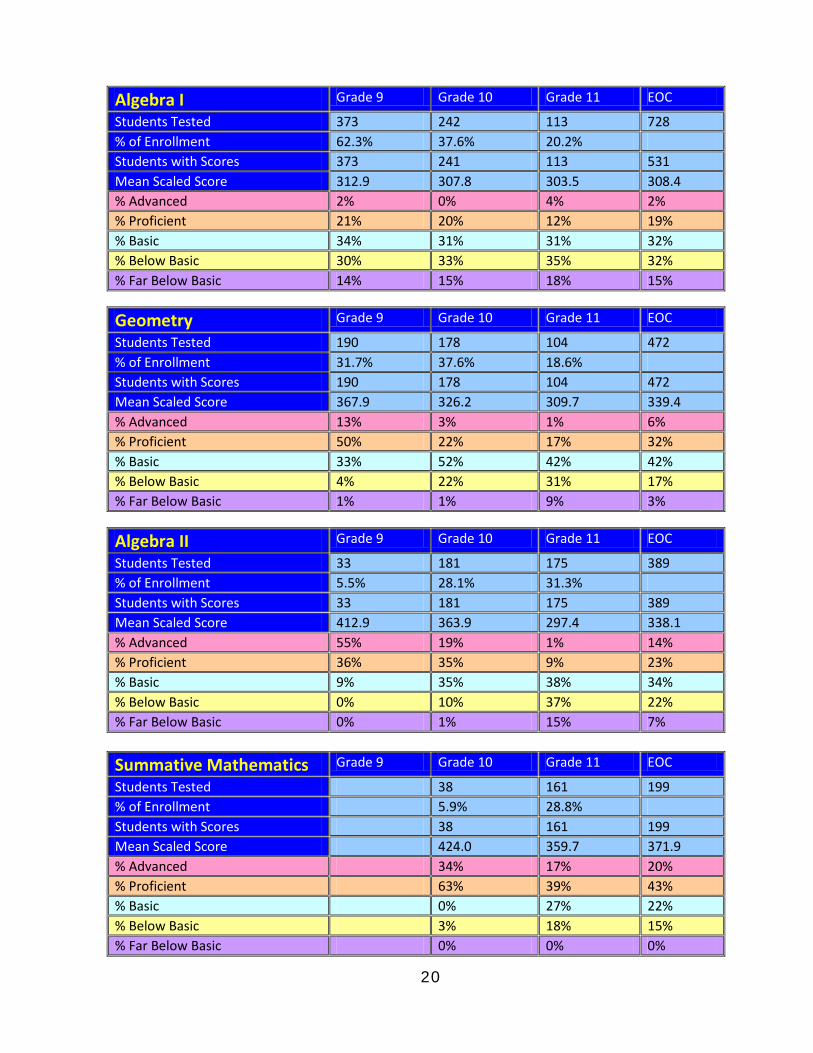
Algebra I Grade 9 Grade 10 Grade 11 EOC
Students Tested 373 242 113 728 % of Enrollment 62.3% 37.6% 20.2% Students with Scores 373 241 113 531 Mean Scaled Score 312.9 307.8 303.5 308.4 % Advanced 2% 0% 4% 2% % Proficient 21% 20% 12% 19% % Basic 34% 31% 31% 32% % Below Basic 30% 33% 35% 32% % Far Below Basic 14% 15% 18% 15%
Geometry Grade 9 Grade 10 Grade 11 EOC
Students Tested 190 178 104 472 % of Enrollment 31.7% 37.6% 18.6% Students with Scores 190 178 104 472 Mean Scaled Score 367.9 326.2 309.7 339.4 % Advanced 13% 3% 1% 6% % Proficient 50% 22% 17% 32% % Basic 33% 52% 42% 42% % Below Basic 4% 22% 31% 17% % Far Below Basic 1% 1% 9% 3%
Algebra II Grade 9 Grade 10 Grade 11 EOC
Students Tested 33 181 175 389 % of Enrollment 5.5% 28.1% 31.3% Students with Scores 33 181 175 389 Mean Scaled Score 412.9 363.9 297.4 338.1 % Advanced 55% 19% 1% 14% % Proficient 36% 35% 9% 23% % Basic 9% 35% 38% 34% % Below Basic 0% 10% 37% 22% % Far Below Basic 0% 1% 15% 7%
Summative Mathematics Grade 9 Grade 10 Grade 11 EOC
Students Tested 38 161 199 % of Enrollment 5.9% 28.8% Students with Scores 38 161 199 Mean Scaled Score 424.0 359.7 371.9 % Advanced 34% 17% 20% % Proficient 63% 39% 43% % Basic 0% 27% 22% % Below Basic 3% 18% 15% % Far Below Basic 0% 0% 0%
21
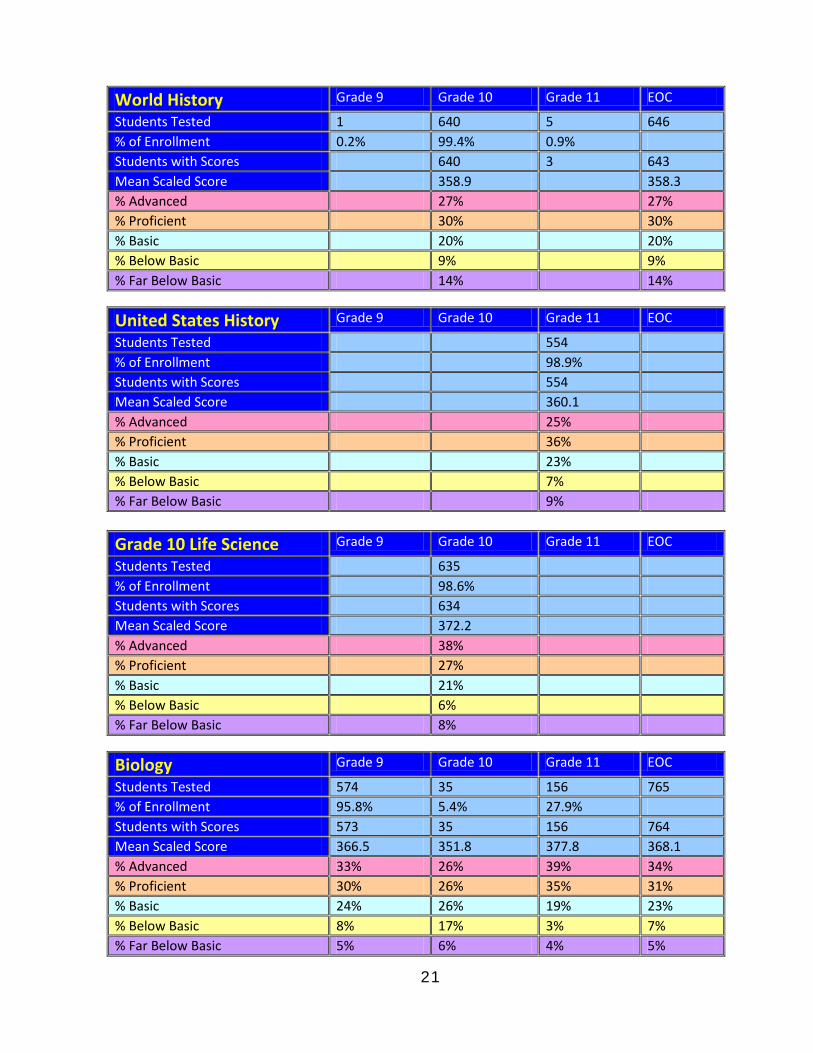
World History Grade 9 Grade 10 Grade 11 EOC
Students Tested 1 640 5 646 % of Enrollment 0.2% 99.4% 0.9% Students with Scores 640 3 643 Mean Scaled Score 358.9 358.3 % Advanced 27% 27% % Proficient 30% 30% % Basic 20% 20% % Below Basic 9% 9% % Far Below Basic 14% 14%
United States History Grade 9 Grade 10 Grade 11 EOC
Students Tested 554 % of Enrollment 98.9% Students with Scores 554 Mean Scaled Score 360.1 % Advanced 25% % Proficient 36% % Basic 23% % Below Basic 7% % Far Below Basic 9%
Grade 10 Life Science Grade 9 Grade 10 Grade 11 EOC
Students Tested 635 % of Enrollment 98.6% Students with Scores 634 Mean Scaled Score 372.2 % Advanced 38% % Proficient 27% % Basic 21% % Below Basic 6% % Far Below Basic 8%
Biology Grade 9 Grade 10 Grade 11 EOC
Students Tested 574 35 156 765 % of Enrollment 95.8% 5.4% 27.9% Students with Scores 573 35 156 764 Mean Scaled Score 366.5 351.8 377.8 368.1 % Advanced 33% 26% 39% 34% % Proficient 30% 26% 35% 31% % Basic 24% 26% 19% 23% % Below Basic 8% 17% 3% 7% % Far Below Basic 5% 6% 4% 5%
22
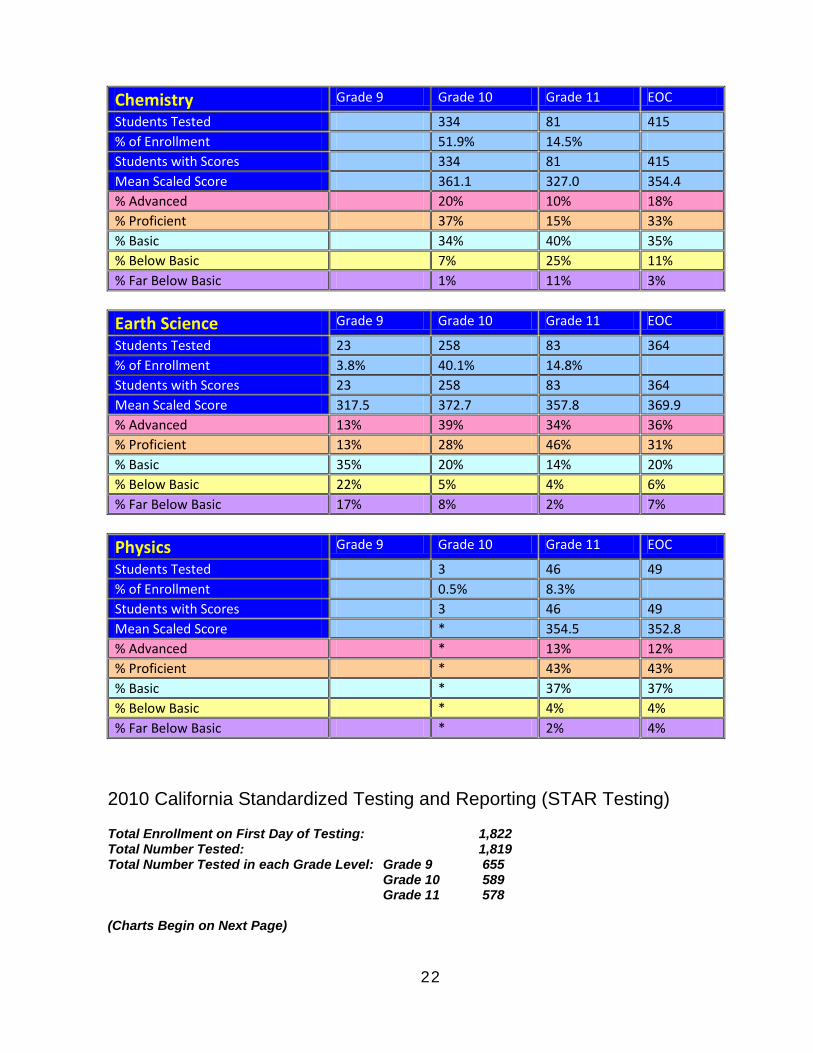
Chemistry Grade 9 Grade 10 Grade 11 EOC
Students Tested 334 81 415 % of Enrollment 51.9% 14.5% Students with Scores 334 81 415 Mean Scaled Score 361.1 327.0 354.4 % Advanced 20% 10% 18% % Proficient 37% 15% 33% % Basic 34% 40% 35% % Below Basic 7% 25% 11% % Far Below Basic 1% 11% 3%
Earth Science Grade 9 Grade 10 Grade 11 EOC
Students Tested 23 258 83 364 % of Enrollment 3.8% 40.1% 14.8% Students with Scores 23 258 83 364 Mean Scaled Score 317.5 372.7 357.8 369.9 % Advanced 13% 39% 34% 36% % Proficient 13% 28% 46% 31% % Basic 35% 20% 14% 20% % Below Basic 22% 5% 4% 6% % Far Below Basic 17% 8% 2% 7%
Physics Grade 9 Grade 10 Grade 11 EOC
Students Tested 3 46 49 % of Enrollment 0.5% 8.3% Students with Scores 3 46 49 Mean Scaled Score * 354.5 352.8 % Advanced * 13% 12% % Proficient * 43% 43% % Basic * 37% 37% % Below Basic * 4% 4% % Far Below Basic * 2% 4%
2010 California Standardized Testing and Reporting (STAR Testing) Total Enrollment on First Day of Testing: 1,822 Total Number Tested: 1,819 Total Number Tested in each Grade Level: Grade 9 655 Grade 10 589 Grade 11 578 (Charts Begin on Next Page)

23
English Language Arts Grade 9 Grade 10 Grade 11 EOC
Students Tested 644 585 577 % of Enrollment 98.3% 99.3% 99.8% Students with Scores 644 585 577 Mean Scaled Score 378.1 361.3 360.2 % Advanced 39% 31% 29% % Proficient 33% 33% 29% % Basic 18% 23% 25% % Below Basic 6% 9% 10% % Far Below Basic 3% 5% 7%
General Mathematics Grade 9 Grade 10 Grade 11
Students Tested 150 150 % of Enrollment 22.9% Students with Scores 149 149 Mean Scaled Score 324.5 324.5 % Advanced 7% 7% % Proficient 21% 21% % Basic 41% 41% % Below Basic 21% 21% % Far Below Basic 11% 11%
Algebra I Grade 9 Grade 10 Grade 11 EOC
Students Tested 281 88 27 396 % of Enrollment 42.9% 14.9% 4.7% Students with Scores 281 88 27 396 Mean Scaled Score 341.9 308.9 391.8 331.2 % Advanced 4% 1% 4% 3% % Proficient 40% 19% 11% 33% % Basic 40% 36% 15% 37% % Below Basic 15% 26% 44% 19% % Far Below Basic 2% 17% 26% 7%
Geometry Grade 9 Grade 10 Grade 11 EOC
Students Tested 177 97 34 308 % of Enrollment 27.0% 16.5% 5.9% Students with Scores 177 97 34 308 Mean Scaled Score 386.1 328.6 330.0 361.8 % Advanced 27% 4% 6% 17% % Proficient 52% 24% 21% 40% % Basic 18% 52% 56% 32% % Below Basic 3% 16% 15% 8% % Far Below Basic 1% 4% 3% 2%
24
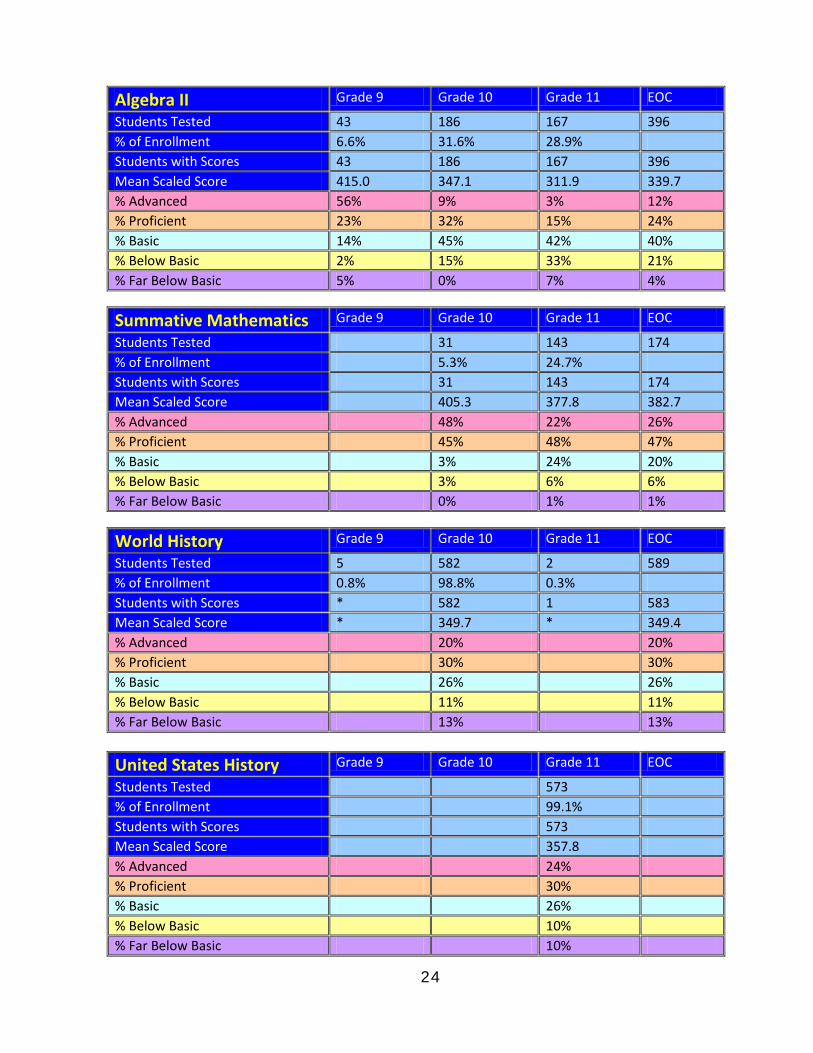
Algebra II Grade 9 Grade 10 Grade 11 EOC
Students Tested 43 186 167 396 % of Enrollment 6.6% 31.6% 28.9% Students with Scores 43 186 167 396 Mean Scaled Score 415.0 347.1 311.9 339.7 % Advanced 56% 9% 3% 12% % Proficient 23% 32% 15% 24% % Basic 14% 45% 42% 40% % Below Basic 2% 15% 33% 21% % Far Below Basic 5% 0% 7% 4%
Summative Mathematics Grade 9 Grade 10 Grade 11 EOC
Students Tested 31 143 174 % of Enrollment 5.3% 24.7% Students with Scores 31 143 174 Mean Scaled Score 405.3 377.8 382.7 % Advanced 48% 22% 26% % Proficient 45% 48% 47% % Basic 3% 24% 20% % Below Basic 3% 6% 6% % Far Below Basic 0% 1% 1%
World History Grade 9 Grade 10 Grade 11 EOC
Students Tested 5 582 2 589 % of Enrollment 0.8% 98.8% 0.3% Students with Scores * 582 1 583 Mean Scaled Score * 349.7 * 349.4 % Advanced 20% 20% % Proficient 30% 30% % Basic 26% 26% % Below Basic 11% 11% % Far Below Basic 13% 13%
United States History Grade 9 Grade 10 Grade 11 EOC
Students Tested 573 % of Enrollment 99.1% Students with Scores 573 Mean Scaled Score 357.8 % Advanced 24% % Proficient 30% % Basic 26% % Below Basic 10% % Far Below Basic 10%
25
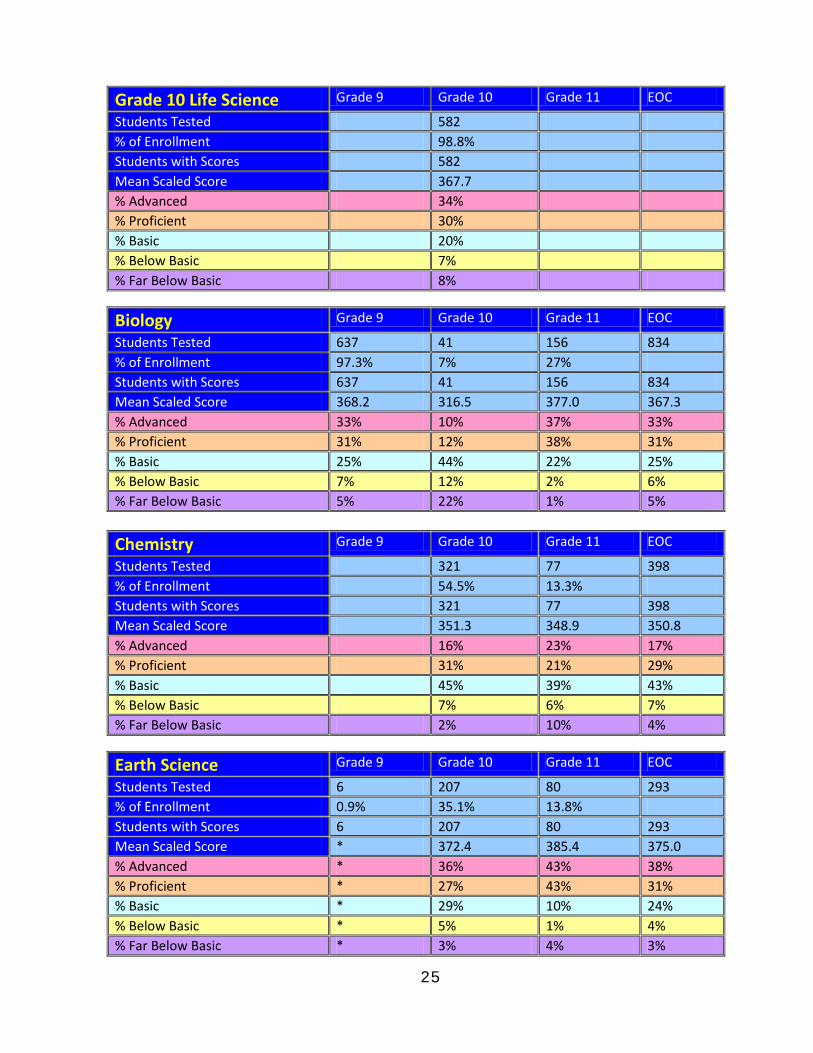
Grade 10 Life Science Grade 9 Grade 10 Grade 11 EOC
Students Tested 582 % of Enrollment 98.8% Students with Scores 582 Mean Scaled Score 367.7 % Advanced 34% % Proficient 30% % Basic 20% % Below Basic 7% % Far Below Basic 8%
Biology Grade 9 Grade 10 Grade 11 EOC
Students Tested 637 41 156 834 % of Enrollment 97.3% 7% 27% Students with Scores 637 41 156 834 Mean Scaled Score 368.2 316.5 377.0 367.3 % Advanced 33% 10% 37% 33% % Proficient 31% 12% 38% 31% % Basic 25% 44% 22% 25% % Below Basic 7% 12% 2% 6% % Far Below Basic 5% 22% 1% 5%
Chemistry Grade 9 Grade 10 Grade 11 EOC
Students Tested 321 77 398 % of Enrollment 54.5% 13.3% Students with Scores 321 77 398 Mean Scaled Score 351.3 348.9 350.8 % Advanced 16% 23% 17% % Proficient 31% 21% 29% % Basic 45% 39% 43% % Below Basic 7% 6% 7% % Far Below Basic 2% 10% 4%
Earth Science Grade 9 Grade 10 Grade 11 EOC
Students Tested 6 207 80 293 % of Enrollment 0.9% 35.1% 13.8% Students with Scores 6 207 80 293 Mean Scaled Score * 372.4 385.4 375.0 % Advanced * 36% 43% 38% % Proficient * 27% 43% 31% % Basic * 29% 10% 24% % Below Basic * 5% 1% 4% % Far Below Basic * 3% 4% 3%

26
Physics Grade 9 Grade 10 Grade 11 EOC
Students Tested 2 41 43 % of Enrollment 0.3% 7.1% Students with Scores 2 41 43 Mean Scaled Score * 376.1 376,0 % Advanced * 32% 30% % Proficient * 41% 44% % Basic * 27% 26% % Below Basic * 0% 0% % Far Below Basic 0% 0%
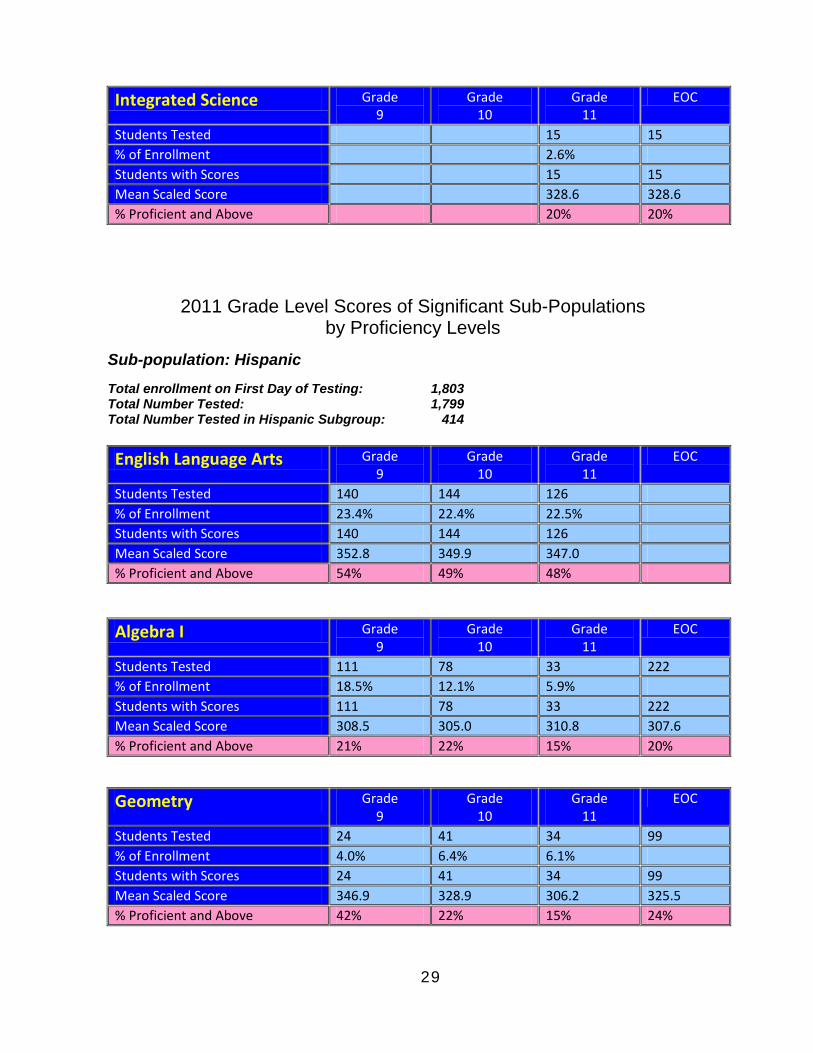
2012 Grade Level Scores of Significant Sub-Populations by Proficiency Levels
Sub-population: Hispanic Total enrollment on First Day of Testing: 1,769 Total Number Tested: 1,758 Total Number Tested in Hispanic Subgroup: 433
English Language Arts Grade 9
Grade 10
Grade 11
EOC
Students Tested 167 138 123 % of Enrollment 26.6% 24.4% 21.4% Students with Scores 167 138 123 Mean Scaled Score 359.9 339.0 344.5 % Proficient and Above 59% 41% 51%
General Mathematics Grade 9
Grade 10
Grade 11
EOC
Students Tested 30 30 % of Enrollment 4.8% Students with Scores 30 30 Mean Scaled Score 317.3 317.3 % Proficient and Above 27% 27%
Algebra I Grade 9
Grade 10
Grade 11
EOC
Students Tested 89 56 27 172 % of Enrollment 14.2% 9.9% 4.7% Students with Scores 89 56 27 172 Mean Scaled Score 312.3 309.9 294.9 307.8 % Proficient and Above 19% 20% 11% 18%

27
Geometry Grade 9
Grade 10
Grade 11
EOC
Students Tested 37 42 39 118 % of Enrollment 5.9% 7.4% 6.8% Students with Scores 37 42 39 118 Mean Scaled Score 369.5 316.3 316.2 333.0 % Proficient and Above 65% 14% 21% 32%
Algebra II Grade 9
Grade 10
Grade 11
EOC
Students Tested 12 19 17 48 % of Enrollment 1.9% 3.4% 3.0% Students with Scores 12 19 17 48 Mean Scaled Score 401.6 322.6 317.9 340.7 % Proficient and Above 83% 11% 18% 31%
Summative Mathematics Grade 9
Grade 10
Grade 11
EOC
Students Tested 8 30 38 % of Enrollment 1.4% 5.2% Students with Scores 8 30 38 Mean Scaled Score * 338.8 350.6 % Proficient and Above * 40% 47%
World History Grade 9
Grade 10
Grade 11
EOC
Students Tested 138 138 % of Enrollment 24.4% Students with Scores 138 138 Mean Scaled Score 330.7 330.7 % Proficient and Above 38% 38%
United States History Grade 9
Grade 10
Grade 11
EOC
Students Tested 122 % of Enrollment 21.2% Students with Scores 122 Mean Scaled Score 350.3 % Proficient and Above 53%

28
Grade 10 Life Science Grade 9
Grade 10
Grade 11
EOC
Students Tested 137 % of Enrollment 24.2% Students with Scores 137 Mean Scaled Score 337.6 % Proficient and Above 47%
Biology Grade 9
Grade 10
Grade 11
EOC
Students Tested 165 17 31 213 % of Enrollment 26.3% 3.0% 5.4% Students with Scores 165 17 31 213 Mean Scaled Score 350.2 298.6 372.5 349.3 % Proficient and Above 48% 18% 68% 49%
Chemistry Grade 9
Grade 10
Grade 11
EOC
Students Tested 62 16 78 % of Enrollment 11.0% 2.8% Students with Scores 62 16 78 Mean Scaled Score 339.1 335.9 338.4 % Proficient and Above 37% 38% 37%
Earth Science Grade 9
Grade 10
Grade 11
EOC
Students Tested 2 61 32 95 % of Enrollment 0.3% 10.8% 5.6% Students with Scores 2 61 32 95 Mean Scaled Score * 350.4 366.1 355.0 % Proficient and Above * 48% 66% 54%
Physics Grade 9
Grade 10
Grade 11
EOC
Students Tested 10 10 % of Enrollment 1.7% Students with Scores 10 10 Mean Scaled Score * * % Proficient and Above * *
29
Integrated Science Grade 9
Grade 10
Grade 11
EOC
Students Tested 15 15 % of Enrollment 2.6% Students with Scores 15 15 Mean Scaled Score 328.6 328.6 % Proficient and Above 20% 20%
2011 Grade Level Scores of Significant Sub-Populations by Proficiency Levels
Sub-population: Hispanic
Total enrollment on First Day of Testing: 1,803 Total Number Tested: 1,799 Total Number Tested in Hispanic Subgroup: 414
English Language Arts Grade 9
Grade 10
Grade 11
EOC
Students Tested 140 144 126 % of Enrollment 23.4% 22.4% 22.5% Students with Scores 140 144 126 Mean Scaled Score 352.8 349.9 347.0 % Proficient and Above 54% 49% 48%
Algebra I Grade 9
Grade 10
Grade 11
EOC
Students Tested 111 78 33 222 % of Enrollment 18.5% 12.1% 5.9% Students with Scores 111 78 33 222 Mean Scaled Score 308.5 305.0 310.8 307.6 % Proficient and Above 21% 22% 15% 20%
Geometry Grade 9
Grade 10
Grade 11
EOC
Students Tested 24 41 34 99 % of Enrollment 4.0% 6.4% 6.1% Students with Scores 24 41 34 99 Mean Scaled Score 346.9 328.9 306.2 325.5 % Proficient and Above 42% 22% 15% 24%
30
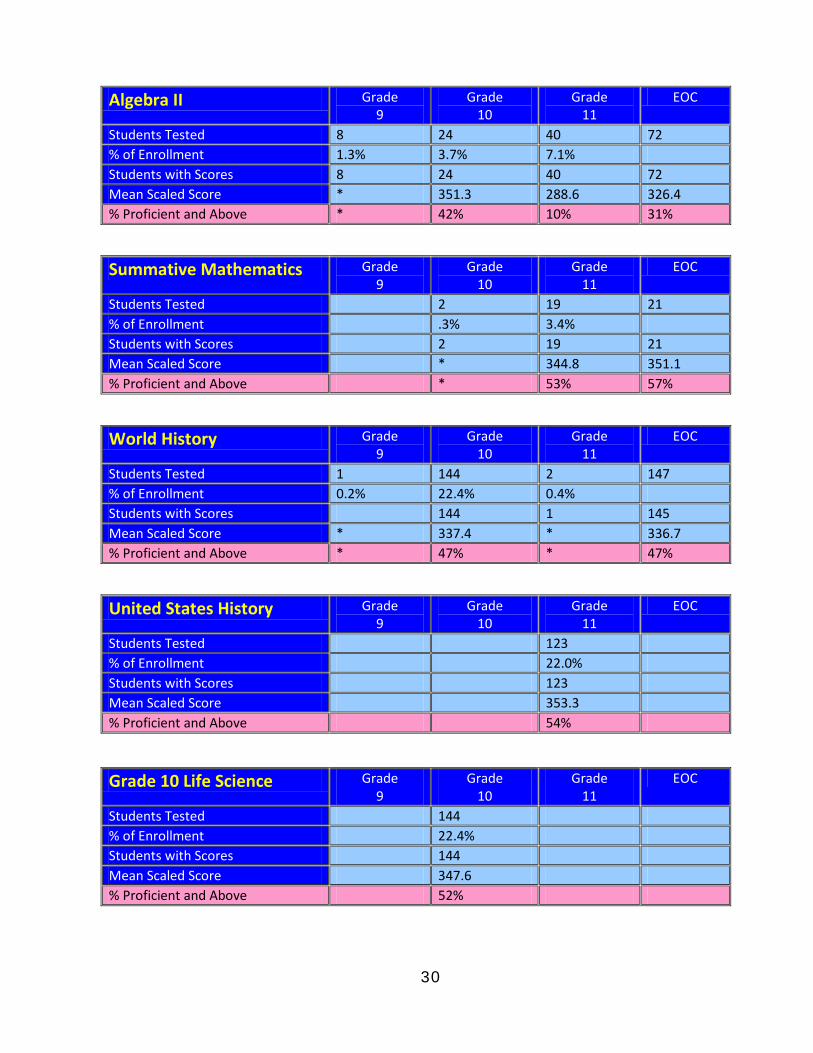
Algebra II Grade 9
Grade 10
Grade 11
EOC
Students Tested 8 24 40 72 % of Enrollment 1.3% 3.7% 7.1% Students with Scores 8 24 40 72 Mean Scaled Score * 351.3 288.6 326.4 % Proficient and Above * 42% 10% 31%
Summative Mathematics Grade 9
Grade 10
Grade 11
EOC
Students Tested 2 19 21 % of Enrollment .3% 3.4% Students with Scores 2 19 21 Mean Scaled Score * 344.8 351.1 % Proficient and Above * 53% 57%
World History Grade 9
Grade 10
Grade 11
EOC
Students Tested 1 144 2 147 % of Enrollment 0.2% 22.4% 0.4% Students with Scores 144 1 145 Mean Scaled Score * 337.4 * 336.7 % Proficient and Above * 47% * 47%
United States History Grade 9
Grade 10
Grade 11
EOC
Students Tested 123 % of Enrollment 22.0% Students with Scores 123 Mean Scaled Score 353.3 % Proficient and Above 54%
Grade 10 Life Science Grade 9
Grade 10
Grade 11
EOC
Students Tested 144 % of Enrollment 22.4% Students with Scores 144 Mean Scaled Score 347.6 % Proficient and Above 52%

31
Biology Grade 9
Grade 10
Grade 11
EOC
Students Tested 130 10 32 172 % of Enrollment 21.7% 1.6% 5.7% Students with Scores 129 10 32 171 Mean Scaled Score 345.1 * 367.9 348.1 % Proficient and Above 47% * 59% 49%
Chemistry Grade 9
Grade 10
Grade 11
EOC
Students Tested 55 25 80 % of Enrollment 8.5% 4.5% Students with Scores 55 25 80 Mean Scaled Score 347.2 312.0 336.2 % Proficient and Above 38% 16% 31%
Earth Science Grade 9
Grade 10
Grade 11
EOC
Students Tested 12 75 22 109 % of Enrollment 2.0% 11.6% 3.9% Students with Scores 12 75 22 109 Mean Scaled Score 308.1 362.3 353.5 354.5 % Proficient and Above 25% 63% 55% 57%
Physics Grade 9
Grade 10
Grade 11
EOC
Students Tested 7 7 % of Enrollment 1.3% Students with Scores 7 7 Mean Scaled Score * * % Proficient and Above * *
2010 Grade Level Scores of Significant Sub-Populations by Proficiency Levels
Sub-population: Hispanic
Total enrollment on First Day of Testing: 1,822 Total Number Tested: 1,819 Total Number Tested in Hispanic Subgroup: 386 (Charts Begin on Next Page)

32
English Language Arts Grade
9 Grade
10 Grade
11 EOC
Students Tested 139 134 109 % of Enrollment 21.2% 22.8% 18.9% Students with Scores 139 134 109 Mean Scaled Score 363.6 344.2 340.1 % Proficient and Above 65% 50% 44% General Mathematics Grade
9 Grade
10 Grade
11 EOC
Students Tested 51 51 % of Enrollment 7.8% Students with Scores 51 51 Mean Scaled Score 319.6 319.6 % Proficient and Above 25% 25%
Algebra I Grade 9
Grade 10
Grade 11
EOC
Students Tested 60 30 9 99 % of Enrollment 9.2% 5.1% 1.6% Students with Scores 60 30 9 99 Mean Scaled Score 341.4 317.9 * 327.8 % Proficient and Above 40% 23% * 32%
Geometry Grade 9
Grade 10
Grade 11
EOC
Students Tested 26 17 3 46 % of Enrollment 4.0% 2.9% 0.5% Students with Scores 26 17 3 46 Mean Scaled Score 360.9 326.5 * 347.5 % Proficient and Above 62% 35% * 52%
Algebra II Grade 9
Grade 10
Grade 11
EOC
Students Tested 5 39 30 74 % of Enrollment 0.8% 6.6% 5.2% Students with Scores 5 39 30 74 Mean Scaled Score * 336.0 317.6 329.2 % Proficient and Above * 31% 20% 27%

33
Summative Mathematics Grade 9
Grade 10
Grade 11
EOC
Students Tested 3 16 19 % of Enrollment 0.5% 2.8% Students with Scores 3 16 19 Mean Scaled Score * 351.4 348.8 % Proficient and Above * 56% 58%
World History Grade 9
Grade 10
Grade 11
EOC
Students Tested 1 135 136 % of Enrollment 0.2% 22.9% Students with Scores 135 135 Mean Scaled Score * 336.7 336.7 % Proficient and Above * 39% 39%
United States History Grade 9
Grade 10
Grade 11
EOC
Students Tested 108 % of Enrollment 18.7% Students with Scores 108 Mean Scaled Score 341.4 % Proficient and Above 47%
Grade 10 Life Science Grade 9
Grade 10
Grade 11
EOC
Students Tested 134 % of Enrollment 22.8% Students with Scores 134 Mean Scaled Score 350.7 % Proficient and Above 54%
Biology Grade 9
Grade 10
Grade 11
EOC
Students Tested 138 13 26 177 % of Enrollment 21.2% 2,2% 4.5% Students with Scores 138 13 26 177 Mean Scaled Score 351.7 306.2 361.3 349.7 % Proficient and Above 54% 23% 65% 53%

34
Chemistry Grade 9
Grade 10
Grade 11
EOC
Students Tested 56 22 78 % of Enrollment 9.5% 3.8% Students with Scores 56 22 78 Mean Scaled Score 344.5 346.4 345.0 % Proficient and Above 39% 41% 40%
Earth Science Grade 9
Grade 10
Grade 11
EOC
Students Tested 2 62 11 75 % of Enrollment 0.3% 10.5% 1.9% Students with Scores 2 62 11 75 Mean Scaled Score * 370.2 356.3 366.8 % Proficient and Above * 65% 64% 63%
Physics Grade 9
Grade 10
Grade 11
EOC
Students Tested 6 6 % of Enrollment 1.0% Students with Scores 6 6 Mean Scaled Score * * % Proficient and Above * *
2012 Grade Level Scores of Significant Sub-Populations by Proficiency Levels
Sub-population: Special Education
Total enrollment on First Day of Testing: 1,769 Total Number Tested: 1,758 Total Number Tested in Special Education Subgroup: 213
English Language Arts Grade 9
Grade 10
Grade 11
EOC
Students Tested 71 72 59 % of Enrollment 11.3% 12.7% 10.2% Students with Scores 71 72 59 Mean Scaled Score 308.2 308.5 292.8 % Proficient and Above 18% 17% 12%

35
General Mathematics Grade 9
Grade 10
Grade 11
EOC
Students Tested 10 10 % of Enrollment 1.6% Students with Scores 10 10 Mean Scaled Score * % Proficient and Above *
Algebra I Grade 9
Grade 10
Grade 11
EOC
Students Tested 59 60 22 141 % of Enrollment 9.4% 10.6% 3.8% Students with Scores 59 60 22 141 Mean Scaled Score 265.2 383.5 277.6 274.9 % Proficient and Above 3% 7% 0% 4%
Geometry Grade 9
Grade 10
Grade 11
EOC
Students Tested 4 8 13 25 % of Enrollment 0.6% 1.4% 2.3% Students with Scores 4 8 13 25 Mean Scaled Score * * 288.5 298.3 % Proficient and Above * * 0% 12%
Algebra II Grade 9
Grade 10
Grade 11
EOC
Students Tested 3 3 6 % of Enrollment 0.5% 0.5% Students with Scores 3 3 6 Mean Scaled Score * * % Proficient and Above * *
World History Grade 9
Grade 10
Grade 11
EOC
Students Tested 76 1 77 % of Enrollment 13.5% 0.2% Students with Scores 76 * 76 Mean Scaled Score 294.0 * 294.0 % Proficient and Above 18% * 18
36
United States History Grade 9
Grade 10
Grade 11
EOC
Students Tested 57 % of Enrollment 9.9% Students with Scores 57 Mean Scaled Score 302.4 % Proficient and Above 18%
Grade 10 Life Science Grade 9
Grade 10
Grade 11
EOC
Students Tested 70 % of Enrollment 12.4% Students with Scores 70 Mean Scaled Score 298.0 % Proficient and Above 16%
Biology Grade 9
Grade 10
Grade 11
EOC
Students Tested 72 17 8 97 % of Enrollment 11.5% 3.0% 1.4% Students with Scores 72 17 8 97 Mean Scaled Score 312.7 288.4 * 307.4 % Proficient and Above 14% 6% * 11%
Chemistry Grade 9
Grade 10
Grade 11
EOC
Students Tested 8 2 10 % of Enrollment 1.4% 0.3% Students with Scores 8 2 10 Mean Scaled Score * * * % Proficient and Above * * *
Earth Science Grade 9
Grade 10
Grade 11
EOC
Students Tested 1 49 21 71 % of Enrollment 0.2% 8.7% 3.6% Students with Scores 1 49 21 71 Mean Scaled Score * 339.2 332.1 336.1 % Proficient and Above * 39% 38% 38%

37
Integrated Science Grade 9
Grade 10
Grade 11
EOC
Students Tested 10 10 % of Enrollment 1.7% 1.7% Students with Scores 10 10 Mean Scaled Score * * % Proficient and Above * *
2011 Grade Level Scores of Significant Sub-Populations by Proficiency Levels
Sub-population: Special Education
Total enrollment on First Day of Testing: 1,803 Total Number Tested: 1,799 Total Number Tested in Special Education Subgroup: 200
English Language Arts Grade 9
Grade 10
Grade 11
EOC
Students Tested 65 65 56 % of Enrollment 10.9% 10.1% 10.0% Students with Scores 65 65 56 Mean Scaled Score 315.7 296.6 286.6 % Proficient and Above 25% 14% 9%
Algebra I Grade 9
Grade 10
Grade 11
EOC
Students Tested 68 66 35 169 % of Enrollment 11.4% 10.2% 6.3% Students with Scores 68 65 35 168 Mean Scaled Score 280.8 282.2 280.6 281.3 % Proficient and Above 6% 8% 11% 8%
Geometry Grade 9
Grade 10
Grade 11
EOC
Students Tested 3 3 12 18 % of Enrollment 0.5% 0.5% 2.1% Students with Scores 3 3 12 18 Mean Scaled Score * * 266.7 288.7 % Proficient and Above * * 8% 11%

38
Algebra II Grade 9
Grade 10
Grade 11
EOC
Students Tested 1 7 8 % of Enrollment 0.2% 1.3% Students with Scores 1 7 8 Mean Scaled Score * * % Proficient and Above * *
World History Grade 9
Grade 10
Grade 11
EOC
Students Tested 1 70 1 72 % of Enrollment 0.2% 10.9% 0.2% Students with Scores 70 1 71 Mean Scaled Score * 290.6 * 289.5 % Proficient and Above * 17% * 17%
United States History Grade 9
Grade 10
Grade 11
EOC
Students Tested 55 % of Enrollment 9.8% Students with Scores 55 Mean Scaled Score 285.7 % Proficient and Above 15%
Grade 10 Life Science Grade 9
Grade 10
Grade 11
EOC
Students Tested 65 % of Enrollment 10.1% Students with Scores 64 Mean Scaled Score 295.9 % Proficient and Above 17%
Biology Grade 9
Grade 10
Grade 11
EOC
Students Tested 56 7 6 69 % of Enrollment 9.3% 1.1% 1.1% Students with Scores 55 7 6 68 Mean Scaled Score 316.7 * * 318.9 % Proficient and Above 2% * * 24%
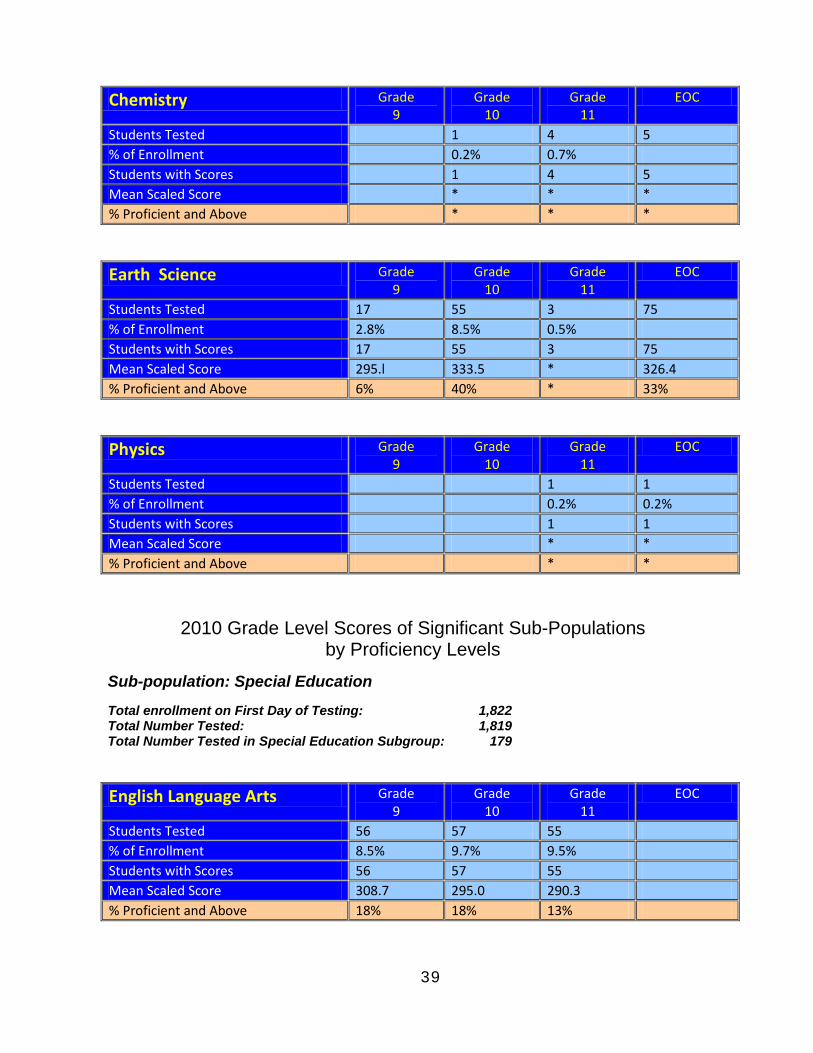
39
Chemistry Grade 9
Grade 10
Grade 11
EOC
Students Tested 1 4 5 % of Enrollment 0.2% 0.7% Students with Scores 1 4 5 Mean Scaled Score * * * % Proficient and Above * * *
Earth Science Grade 9
Grade 10
Grade 11
EOC
Students Tested 17 55 3 75 % of Enrollment 2.8% 8.5% 0.5% Students with Scores 17 55 3 75 Mean Scaled Score 295.l 333.5 * 326.4 % Proficient and Above 6% 40% * 33%
Physics Grade 9
Grade 10
Grade 11
EOC
Students Tested 1 1 % of Enrollment 0.2% 0.2% Students with Scores 1 1 Mean Scaled Score * * % Proficient and Above * *
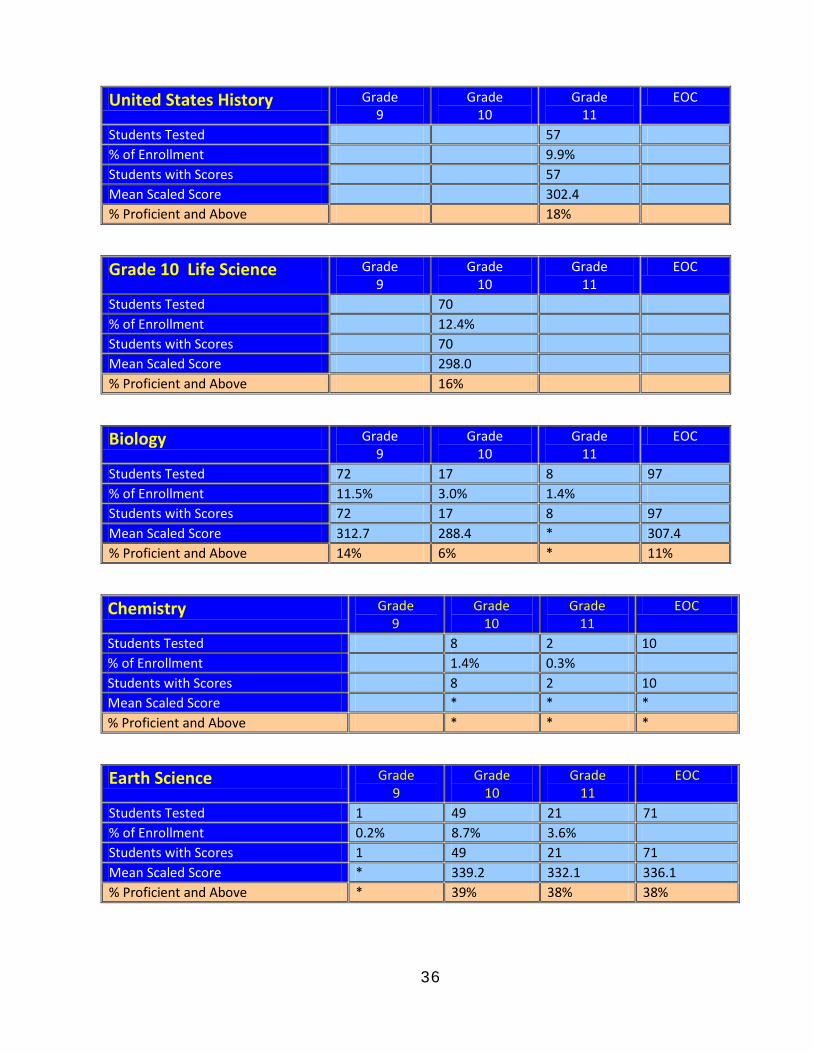
2010 Grade Level Scores of Significant Sub-Populations by Proficiency Levels
Sub-population: Special Education
Total enrollment on First Day of Testing: 1,822 Total Number Tested: 1,819 Total Number Tested in Special Education Subgroup: 179
English Language Arts Grade 9
Grade 10
Grade 11
EOC
Students Tested 56 57 55 % of Enrollment 8.5% 9.7% 9.5% Students with Scores 56 57 55 Mean Scaled Score 308.7 295.0 290.3 % Proficient and Above 18% 18% 13%
40
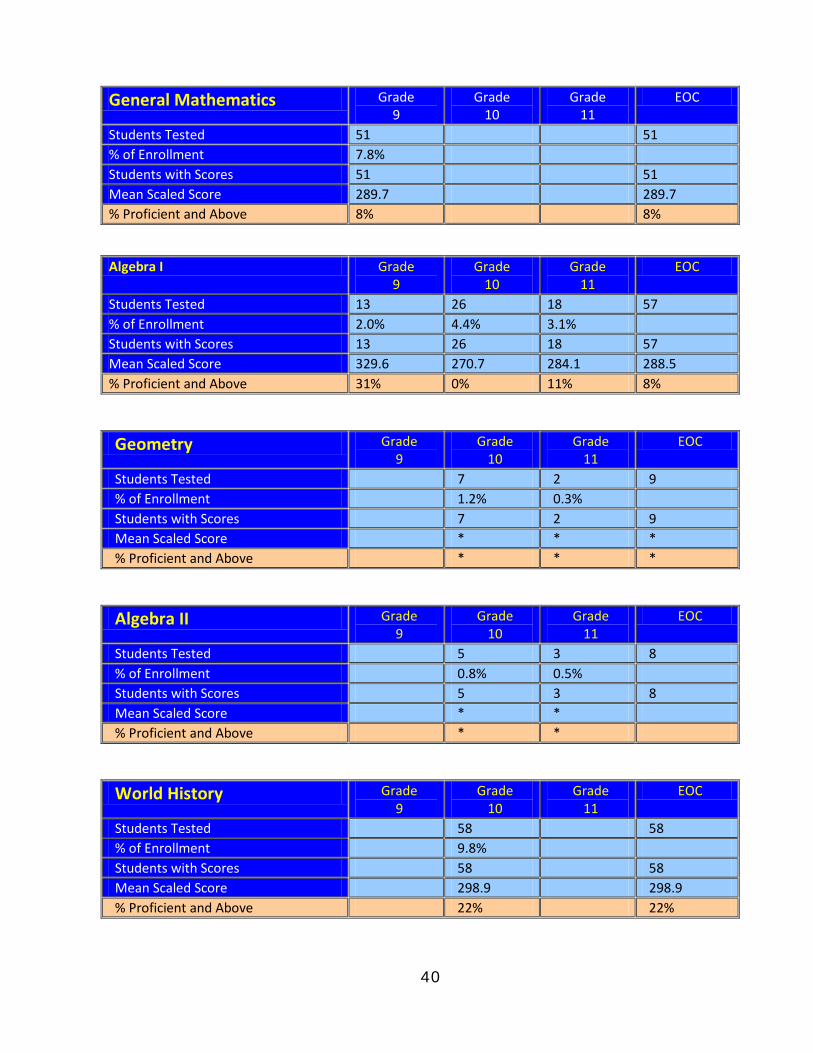
General Mathematics Grade 9
Grade 10
Grade 11
EOC
Students Tested 51 51 % of Enrollment 7.8% Students with Scores 51 51 Mean Scaled Score 289.7 289.7 % Proficient and Above 8% 8%
Algebra I Grade 9
Grade 10
Grade 11
EOC
Students Tested 13 26 18 57 % of Enrollment 2.0% 4.4% 3.1% Students with Scores 13 26 18 57 Mean Scaled Score 329.6 270.7 284.1 288.5 % Proficient and Above 31% 0% 11% 8%
Geometry Grade 9
Grade 10
Grade 11
EOC
Students Tested 7 2 9 % of Enrollment 1.2% 0.3% Students with Scores 7 2 9 Mean Scaled Score * * * % Proficient and Above * * *
Algebra II Grade 9
Grade 10
Grade 11
EOC
Students Tested 5 3 8 % of Enrollment 0.8% 0.5% Students with Scores 5 3 8 Mean Scaled Score * * % Proficient and Above * *
World History Grade 9
Grade 10
Grade 11
EOC
Students Tested 58 58 % of Enrollment 9.8% Students with Scores 58 58 Mean Scaled Score 298.9 298.9 % Proficient and Above 22% 22%
41
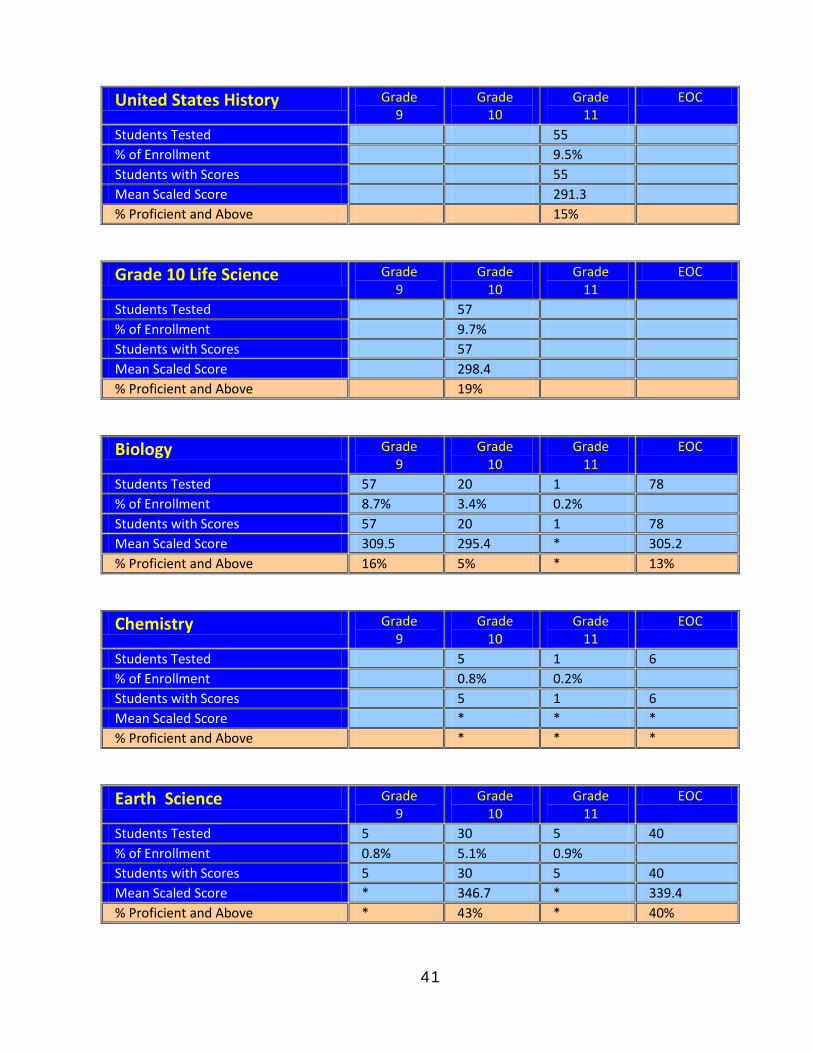
United States History Grade 9
Grade 10
Grade 11
EOC
Students Tested 55 % of Enrollment 9.5% Students with Scores 55 Mean Scaled Score 291.3 % Proficient and Above 15%
Grade 10 Life Science Grade 9
Grade 10
Grade 11
EOC
Students Tested 57 % of Enrollment 9.7% Students with Scores 57 Mean Scaled Score 298.4 % Proficient and Above 19%
Biology Grade 9
Grade 10
Grade 11
EOC
Students Tested 57 20 1 78 % of Enrollment 8.7% 3.4% 0.2% Students with Scores 57 20 1 78 Mean Scaled Score 309.5 295.4 * 305.2 % Proficient and Above 16% 5% * 13%
Chemistry Grade 9
Grade 10
Grade 11
EOC
Students Tested 5 1 6 % of Enrollment 0.8% 0.2% Students with Scores 5 1 6 Mean Scaled Score * * * % Proficient and Above * * *
Earth Science Grade 9
Grade 10
Grade 11
EOC
Students Tested 5 30 5 40 % of Enrollment 0.8% 5.1% 0.9% Students with Scores 5 30 5 40 Mean Scaled Score * 346.7 * 339.4 % Proficient and Above * 43% * 40%

42
Physics Grade 9
Grade 10
Grade 11
EOC
Students Tested 1 1 % of Enrollment 0.2% Students with Scores 1 1 Mean Scaled Score * * % Proficient and Above * *
2012 Grade Level Scores of Significant Sub-Populations by Proficiency Levels
Sub-population: Economically Disadvantaged
Total enrollment on First Day of Testing: 1,769 Total Number Tested: 1,758 Total Number Tested in Economically Disadvantaged Subgroup: 269
English Language Arts Grade 9
Grade 10
Grade 11
EOC
Students Tested 101 95 71 % of Enrollment 16.1% 16.8% 12.3% Students with Scores 101 95 71 Mean Scaled Score 340.5 336.0 338.1 % Proficient and Above 41% 41% 45%
General Mathematics Grade 9
Grade 10
Grade 11
EOC
Students Tested 25 25 % of Enrollment 4.0% Students with Scores 25 25 Mean Scaled Score 318.4 318.4 % Proficient and Above 32% 32%
Algebra I Grade 9
Grade 10
Grade 11
EOC
Students Tested 57 49 16 122 % of Enrollment 9.1% 8.7% 2.8% Students with Scores 56 49 16 121 Mean Scaled Score 305.0 319.0 302.7 310.4 % Proficient and Above 25% 29% 19% 26%

43
Geometry Grade 9
Grade 10
Grade 11
EOC
Students Tested 16 25 17 58 % of Enrollment 1.5% 4.4% 3.0% Students with Scores 16 25 17 58 Mean Scaled Score 357.1 318.8 323.3. 330.7 % Proficient and Above 50% 20% 18% 28%
Algebra II Grade 9
Grade 10
Grade 11
EOC
Students Tested 3 10 13 26 % of Enrollment 0.5% 1.8% 2.3% Students with Scores 3 10 13 26 Mean Scaled Score * * 322.2 336.2 % Proficient and Above * * 15% 27%
Summative Math Grade 9
Grade 10
Grade 11
EOC
Students Tested 3 14 17 % of Enrollment 0.5% 2.4% Students with Scores 3 14 17 Mean Scaled Score * 360.5 362.8 % Proficient and Above * 50% 53%
World History Grade 9
Grade 10
Grade 11
EOC
Students Tested 93 93 % of Enrollment 16.5% Students with Scores 93 93 Mean Scaled Score 328.6 328.6 % Proficient and Above 39% 39%
United States History Grade 9
Grade 10
Grade 11
EOC
Students Tested 69 % of Enrollment 12.0% Students with Scores 69 Mean Scaled Score 353.0 % Proficient and Above 55%

44
Grade 10 Life Science Grade 9
Grade 10
Grade 11
EOC
Students Tested 93 % of Enrollment 16.5% Students with Scores 93 Mean Scaled Score 334.7 % Proficient and Above 45%
Biology Grade 9
Grade 10
Grade 11
EOC
Students Tested 96 6 17 119 % of Enrollment 15.3% 1.1% 3.0% Students with Scores 96 6 17 119 Mean Scaled Score 332.6 * 364.4 335.1 % Proficient and Above 36% * 59% 39%
Chemistry Grade 9
Grade 10
Grade 11
EOC
Students Tested 37 7 44 % of Enrollment 6.5% 1.2% Students with Scores 37 7 44 Mean Scaled Score 336.0 * 336.9 % Proficient and Above 35% * 36%
Earth Science Grade 9
Grade 10
Grade 11
EOC
Students Tested 2 52 20 74 % of Enrollment 0.3% 9.2% 3.5% Students with Scores 3 52 20 74 Mean Scaled Score * 352.6 385.6 360.5 % Proficient and Above * 54% 85% 62%
Integrated Science Grade 9
Grade 10
Grade 11
EOC
Students Tested 7 7 % of Enrollment 1.2% Students with Scores 7 7 Mean Scaled Score * * % Proficient and Above * *

45
Physics Grade 9
Grade 10
Grade 11
EOC
Students Tested 9 9 % of Enrollment 1.6% Students with Scores 9 9 Mean Scaled Score * * % Proficient and Above * *
2011 Grade Level Scores of Significant Sub-Populations by Proficiency Levels
Sub-population: Economically Disadvantaged
Total enrollment on First Day of Testing: 1,803 Total Number Tested: 1,799 Total Number Tested in Economically Disadvantaged Subgroup: 203
English Language Arts Grade 9
Grade 10
Grade 11
EOC
Students Tested 82 68 50 % of Enrollment 13.7% 10.6% 8.9% Students with Scores 82 68 50 Mean Scaled Score 350.0 335.6 349.7 % Proficient and Above 56% 38% 54%
Algebra I Grade 9
Grade 10
Grade 11
EOC
Students Tested 66 49 18 133 % of Enrollment 11.0% 7.6% 3.2% Students with Scores 66 49 18 133 Mean Scaled Score 307.0 316.6 326.2 313.0 % Proficient and Above 18% 31% 28% 24%
Geometry Grade 9
Grade 10
Grade 11
EOC
Students Tested 13 13 11 37 % of Enrollment 2.2% 2.0% 2.0% Students with Scores 13 13 11 37 Mean Scaled Score 364.8 329.8 314.6 337.6 % Proficient and Above 69% 23% 18% 38%

46
Algebra II Grade 9
Grade 10
Grade 11
EOC
Students Tested 3 7 15 25 % of Enrollment 0.5% 1.1% 2.9% Students with Scores 3 7 15 25 Mean Scaled Score * * 291.1 327.3 % Proficient and Above * * 13% 32%
Summative Math Grade 9
Grade 10
Grade 11
EOC
Students Tested 1 6 7 % of Enrollment 0.2% 1.1% Students with Scores 1 6 7 Mean Scaled Score * * * % Proficient and Above * * *
World History Grade 9
Grade 10
Grade 11
EOC
Students Tested 1 70 71 % of Enrollment 0.2% 10.9% Students with Scores 70 70 Mean Scaled Score * 331.9 331.9 % Proficient and Above * 41% 41%
United States History Grade 9
Grade 10
Grade 11
EOC
Students Tested 50 % of Enrollment 8.9% Students with Scores 50 Mean Scaled Score 354.3 % Proficient and Above 60%
Grade 10 Life Science Grade 9
Grade 10
Grade 11
EOC
Students Tested 68 % of Enrollment 10.6% Students with Scores 68 Mean Scaled Score 346.5 % Proficient and Above 44%

47
Biology Grade 9
Grade 10
Grade 11
EOC
Students Tested 80 5 7 92 % of Enrollment 13.4% 0.8% 1.3% Students with Scores 79 5 7 91 Mean Scaled Score 339.8 * * 341.1 % Proficient and Above 43% * * 44%
Chemistry Grade 9
Grade 10
Grade 11
EOC
Students Tested 18 12 30 % of Enrollment 2.8% 2.1% Students with Scores 18 12 30 Mean Scaled Score 345.5 352.8 348.4 % Proficient and Above 50% 50% 50%
Earth Science Grade 9
Grade 10
Grade 11
EOC
Students Tested 3 44 7 54 % of Enrollment 0.5% 6.8% 1.3% Students with Scores 3 44 7 54 Mean Scaled Score * 370.0 * 367.5 % Proficient and Above * 66% * 67%
Physics Grade 9
Grade 10
Grade 11
EOC
Students Tested 3 3 % of Enrollment 0.5% Students with Scores 3 3 Mean Scaled Score * * % Proficient and Above * *
48
2010 Grade Level Scores of Significant Sub-Populations by Proficiency Levels
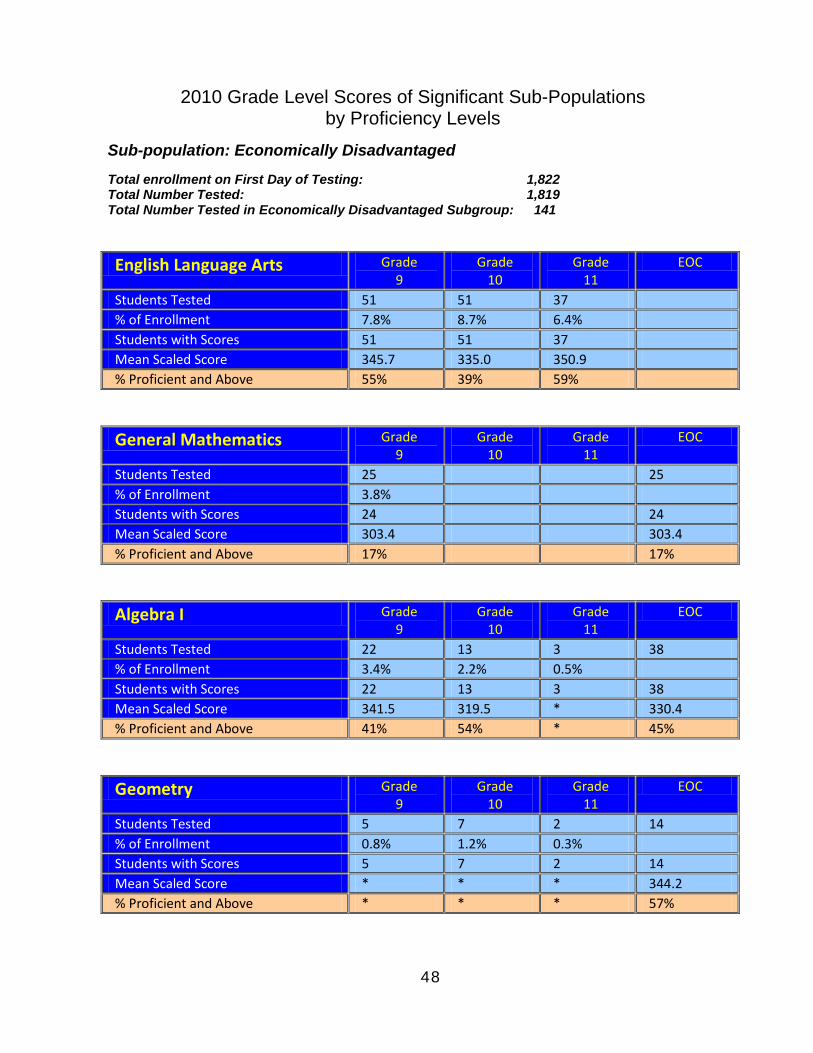
Sub-population: Economically Disadvantaged
Total enrollment on First Day of Testing: 1,822 Total Number Tested: 1,819 Total Number Tested in Economically Disadvantaged Subgroup: 141
English Language Arts Grade 9
Grade 10
Grade 11
EOC
Students Tested 51 51 37 % of Enrollment 7.8% 8.7% 6.4% Students with Scores 51 51 37 Mean Scaled Score 345.7 335.0 350.9 % Proficient and Above 55% 39% 59%
General Mathematics Grade 9
Grade 10
Grade 11
EOC
Students Tested 25 25 % of Enrollment 3.8% Students with Scores 24 24 Mean Scaled Score 303.4 303.4 % Proficient and Above 17% 17%
Algebra I Grade 9
Grade 10
Grade 11
EOC
Students Tested 22 13 3 38 % of Enrollment 3.4% 2.2% 0.5% Students with Scores 22 13 3 38 Mean Scaled Score 341.5 319.5 * 330.4 % Proficient and Above 41% 54% * 45%
Geometry Grade 9
Grade 10
Grade 11
EOC
Students Tested 5 7 2 14 % of Enrollment 0.8% 1.2% 0.3% Students with Scores 5 7 2 14 Mean Scaled Score * * * 344.2 % Proficient and Above * * * 57%
49
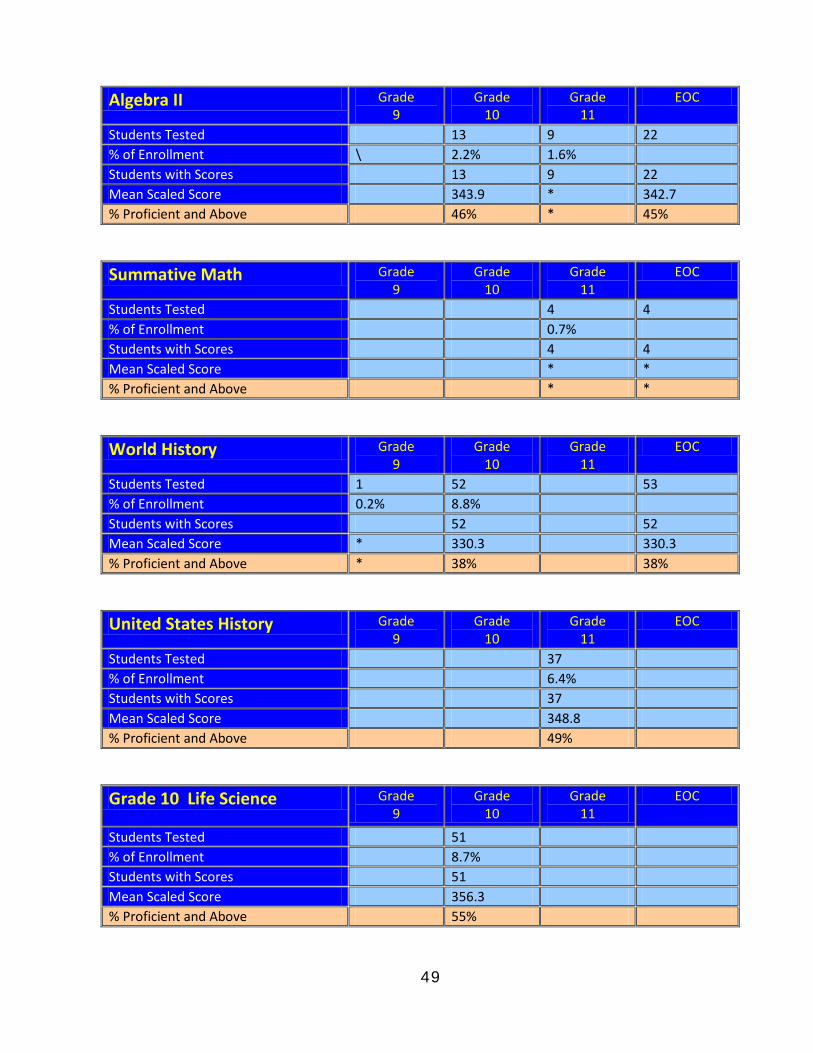
Algebra II Grade 9
Grade 10
Grade 11
EOC
Students Tested 13 9 22 % of Enrollment \ 2.2% 1.6% Students with Scores 13 9 22 Mean Scaled Score 343.9 * 342.7 % Proficient and Above 46% * 45%
Summative Math Grade 9
Grade 10
Grade 11
EOC
Students Tested 4 4 % of Enrollment 0.7% Students with Scores 4 4 Mean Scaled Score * * % Proficient and Above * *
World History Grade 9
Grade 10
Grade 11
EOC
Students Tested 1 52 53 % of Enrollment 0.2% 8.8% Students with Scores 52 52 Mean Scaled Score * 330.3 330.3 % Proficient and Above * 38% 38%
United States History Grade 9
Grade 10
Grade 11
EOC
Students Tested 37 % of Enrollment 6.4% Students with Scores 37 Mean Scaled Score 348.8 % Proficient and Above 49%
Grade 10 Life Science Grade 9
Grade 10
Grade 11
EOC
Students Tested 51 % of Enrollment 8.7% Students with Scores 51 Mean Scaled Score 356.3 % Proficient and Above 55%
50
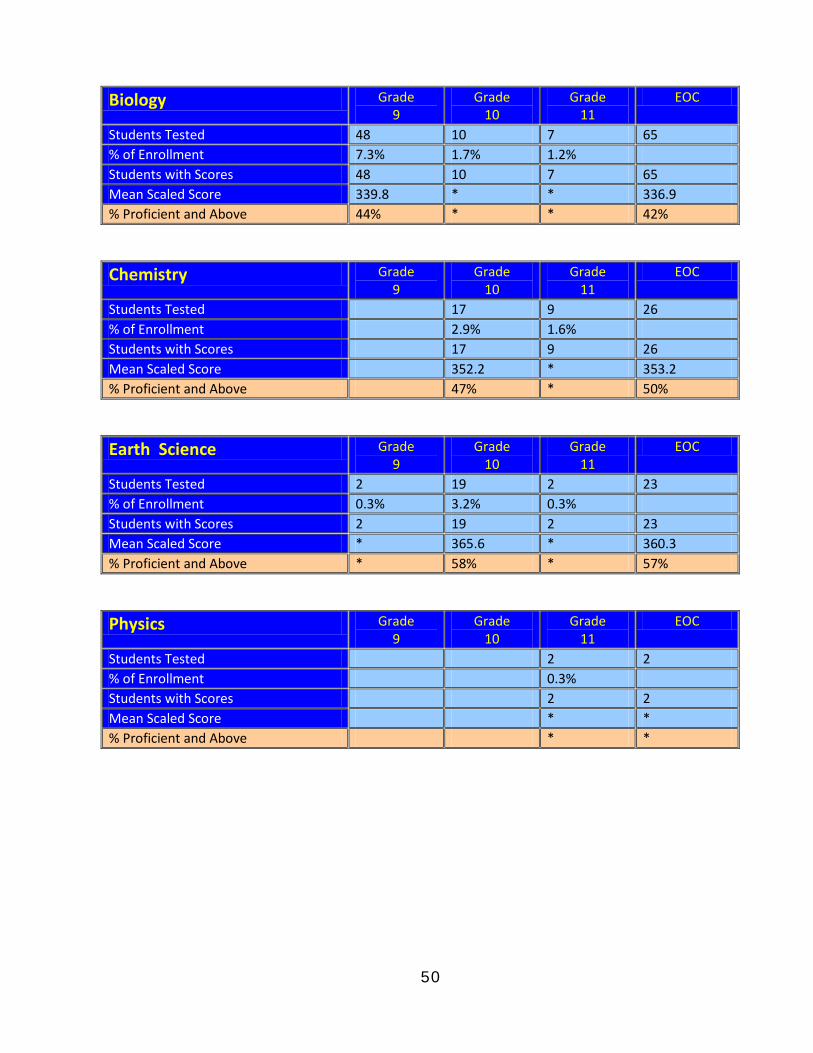
Biology Grade 9
Grade 10
Grade 11
EOC
Students Tested 48 10 7 65 % of Enrollment 7.3% 1.7% 1.2% Students with Scores 48 10 7 65 Mean Scaled Score 339.8 * * 336.9 % Proficient and Above 44% * * 42%
Chemistry Grade 9
Grade 10
Grade 11
EOC
Students Tested 17 9 26 % of Enrollment 2.9% 1.6% Students with Scores 17 9 26 Mean Scaled Score 352.2 * 353.2 % Proficient and Above 47% * 50%
Earth Science Grade 9
Grade 10
Grade 11
EOC
Students Tested 2 19 2 23 % of Enrollment 0.3% 3.2% 0.3% Students with Scores 2 19 2 23 Mean Scaled Score * 365.6 * 360.3 % Proficient and Above * 58% * 57%
Physics Grade 9
Grade 10
Grade 11
EOC
Students Tested 2 2 % of Enrollment 0.3% Students with Scores 2 2 Mean Scaled Score * * % Proficient and Above * *
51
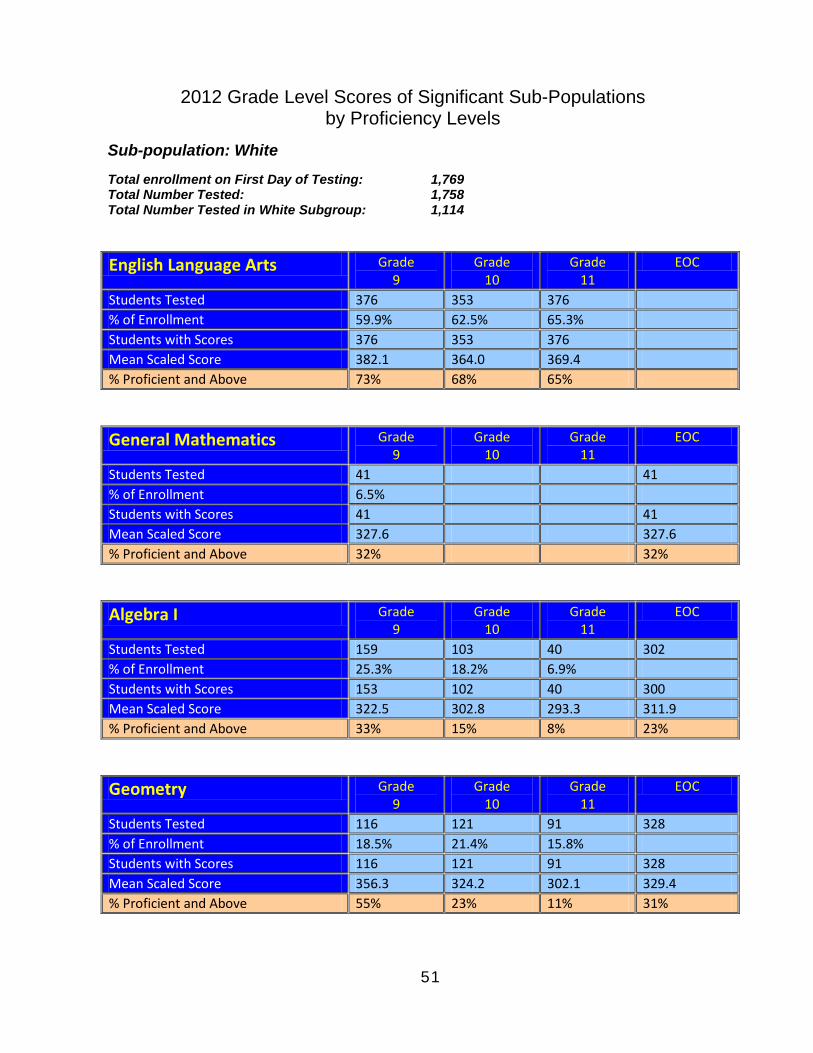
2012 Grade Level Scores of Significant Sub-Populations by Proficiency Levels
Sub-population: White
Total enrollment on First Day of Testing: 1,769 Total Number Tested: 1,758 Total Number Tested in White Subgroup: 1,114
English Language Arts Grade 9
Grade 10
Grade 11
EOC
Students Tested 376 353 376 % of Enrollment 59.9% 62.5% 65.3% Students with Scores 376 353 376 Mean Scaled Score 382.1 364.0 369.4 % Proficient and Above 73% 68% 65%
General Mathematics Grade 9
Grade 10
Grade 11
EOC
Students Tested 41 41 % of Enrollment 6.5% Students with Scores 41 41 Mean Scaled Score 327.6 327.6 % Proficient and Above 32% 32%
Algebra I Grade 9
Grade 10
Grade 11
EOC
Students Tested 159 103 40 302 % of Enrollment 25.3% 18.2% 6.9% Students with Scores 153 102 40 300 Mean Scaled Score 322.5 302.8 293.3 311.9 % Proficient and Above 33% 15% 8% 23%
Geometry Grade 9
Grade 10
Grade 11
EOC
Students Tested 116 121 91 328 % of Enrollment 18.5% 21.4% 15.8% Students with Scores 116 121 91 328 Mean Scaled Score 356.3 324.2 302.1 329.4 % Proficient and Above 55% 23% 11% 31%

52
Algebra II Grade 9
Grade 10
Grade 11
EOC
Students Tested 62 102 67 231 % of Enrollment 9.9% 18.1% 11.6% Students with Scores 62 102 67 231 Mean Scaled Score 399.8 352.3 304.2 351.1 % Proficient and Above 82% 46% 9% 45%
Summative Math Grade 9
Grade 10
Grade 11
EOC
Students Tested 22 150 172 % of Enrollment 3.9% 26% Students with Scores 22 150 172 Mean Scaled Score 402.0 359.6 365.0 % Proficient and Above 86% 54% 58%
World History Grade 9
Grade 10
Grade 11
EOC
Students Tested 2 353 5 360 % of Enrollment 0.3% 62.5% 0.9% Students with Scores 1 352 1 354 Mean Scaled Score * 362.1 * 361.1 % Proficient and Above * 55% * 55%
United States History Grade 9
Grade 10
Grade 11
EOC
Students Tested 373 % of Enrollment 64.8% Students with Scores 373 Mean Scaled Score 377.0 % Proficient and Above 66%
Grade 10 Life Science Grade 9
Grade 10
Grade 11
EOC
Students Tested 347 % of Enrollment 61.4% Students with Scores 347 Mean Scaled Score 371.3 % Proficient and Above 67%
53
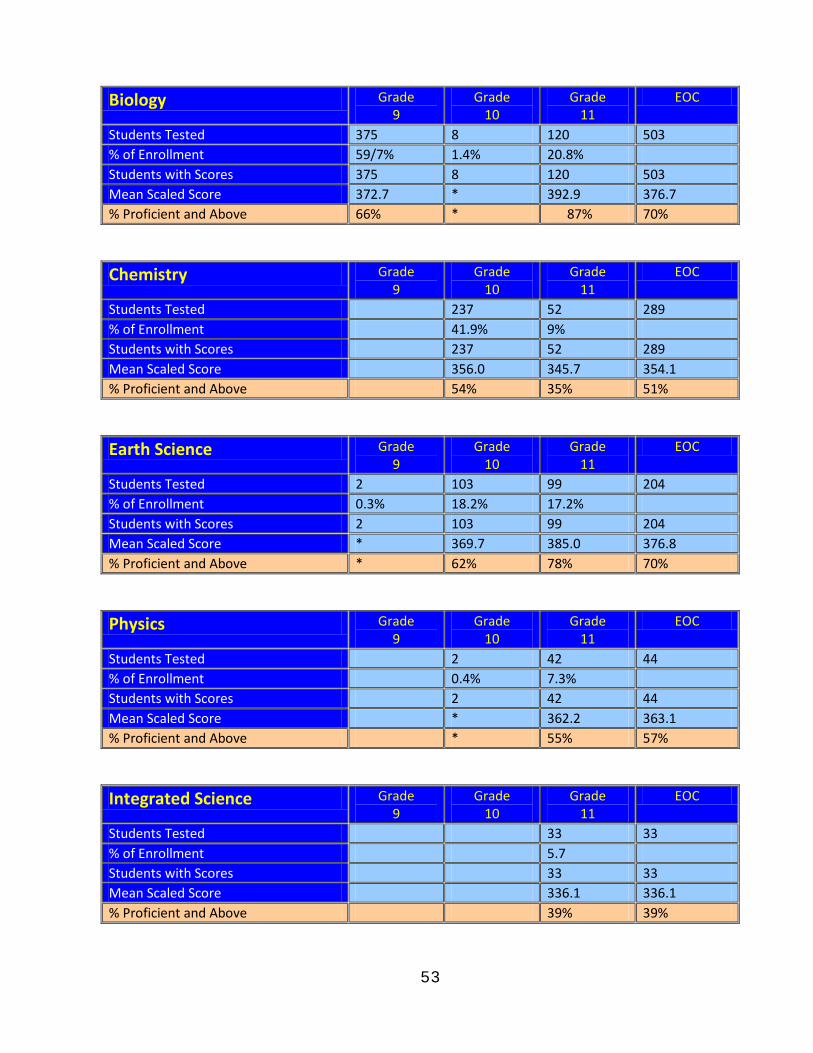
Biology Grade 9
Grade 10
Grade 11
EOC
Students Tested 375 8 120 503 % of Enrollment 59/7% 1.4% 20.8% Students with Scores 375 8 120 503 Mean Scaled Score 372.7 * 392.9 376.7 % Proficient and Above 66% * 87% 70%
Chemistry Grade 9
Grade 10
Grade 11
EOC
Students Tested 237 52 289 % of Enrollment 41.9% 9% Students with Scores 237 52 289 Mean Scaled Score 356.0 345.7 354.1 % Proficient and Above 54% 35% 51%
Earth Science Grade 9
Grade 10
Grade 11
EOC
Students Tested 2 103 99 204 % of Enrollment 0.3% 18.2% 17.2% Students with Scores 2 103 99 204 Mean Scaled Score * 369.7 385.0 376.8 % Proficient and Above * 62% 78% 70%
Physics Grade 9
Grade 10
Grade 11
EOC
Students Tested 2 42 44 % of Enrollment 0.4% 7.3% Students with Scores 2 42 44 Mean Scaled Score * 362.2 363.1 % Proficient and Above * 55% 57%
Integrated Science Grade 9
Grade 10
Grade 11
EOC
Students Tested 33 33 % of Enrollment 5.7 Students with Scores 33 33 Mean Scaled Score 336.1 336.1 % Proficient and Above 39% 39%
54
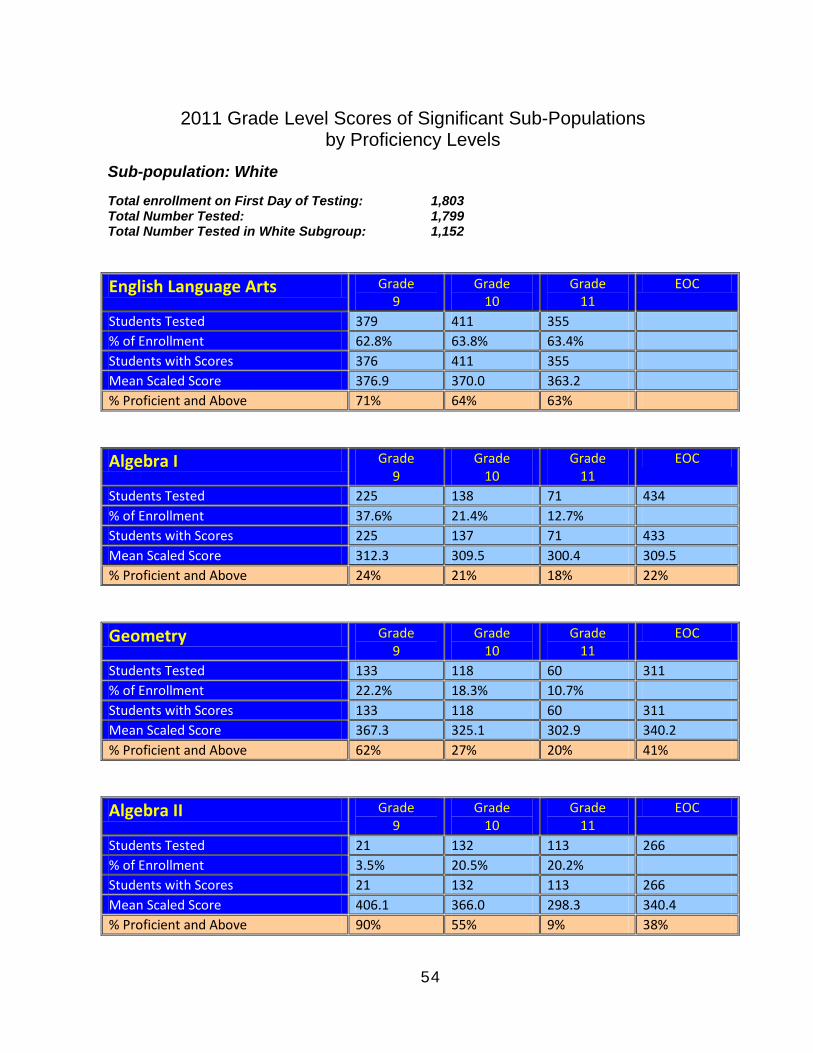
2011 Grade Level Scores of Significant Sub-Populations
by Proficiency Levels
Sub-population: White
Total enrollment on First Day of Testing: 1,803 Total Number Tested: 1,799 Total Number Tested in White Subgroup: 1,152
English Language Arts Grade 9
Grade 10
Grade 11
EOC
Students Tested 379 411 355 % of Enrollment 62.8% 63.8% 63.4% Students with Scores 376 411 355 Mean Scaled Score 376.9 370.0 363.2 % Proficient and Above 71% 64% 63%
Algebra I Grade 9
Grade 10
Grade 11
EOC
Students Tested 225 138 71 434 % of Enrollment 37.6% 21.4% 12.7% Students with Scores 225 137 71 433 Mean Scaled Score 312.3 309.5 300.4 309.5 % Proficient and Above 24% 21% 18% 22%
Geometry Grade 9
Grade 10
Grade 11
EOC
Students Tested 133 118 60 311 % of Enrollment 22.2% 18.3% 10.7% Students with Scores 133 118 60 311 Mean Scaled Score 367.3 325.1 302.9 340.2 % Proficient and Above 62% 27% 20% 41%
Algebra II Grade 9
Grade 10
Grade 11
EOC
Students Tested 21 132 113 266 % of Enrollment 3.5% 20.5% 20.2% Students with Scores 21 132 113 266 Mean Scaled Score 406.1 366.0 298.3 340.4 % Proficient and Above 90% 55% 9% 38%
55
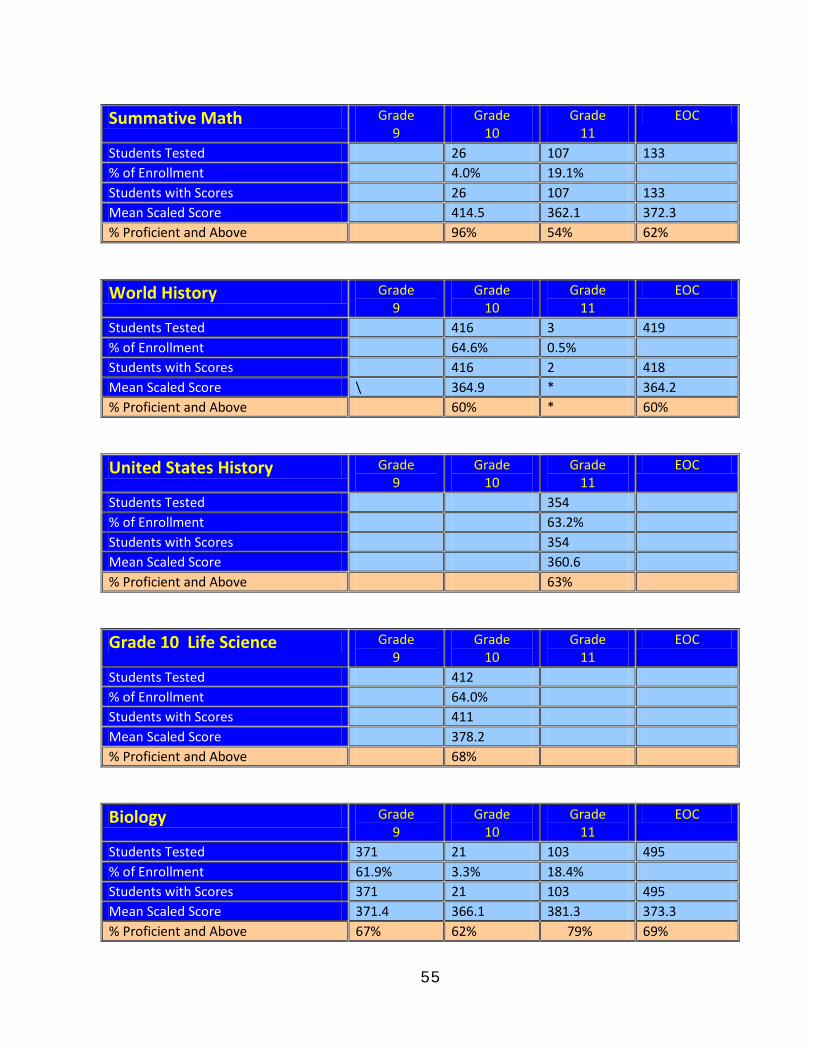
Summative Math Grade 9
Grade 10
Grade 11
EOC
Students Tested 26 107 133 % of Enrollment 4.0% 19.1% Students with Scores 26 107 133 Mean Scaled Score 414.5 362.1 372.3 % Proficient and Above 96% 54% 62%
World History Grade 9
Grade 10
Grade 11
EOC
Students Tested 416 3 419 % of Enrollment 64.6% 0.5% Students with Scores 416 2 418 Mean Scaled Score \ 364.9 * 364.2 % Proficient and Above 60% * 60%
United States History Grade 9
Grade 10
Grade 11
EOC
Students Tested 354 % of Enrollment 63.2% Students with Scores 354 Mean Scaled Score 360.6 % Proficient and Above 63%
Grade 10 Life Science Grade 9
Grade 10
Grade 11
EOC
Students Tested 412 % of Enrollment 64.0% Students with Scores 411 Mean Scaled Score 378.2 % Proficient and Above 68%
Biology Grade 9
Grade 10
Grade 11
EOC
Students Tested 371 21 103 495 % of Enrollment 61.9% 3.3% 18.4% Students with Scores 371 21 103 495 Mean Scaled Score 371.4 366.1 381.3 373.3 % Proficient and Above 67% 62% 79% 69%
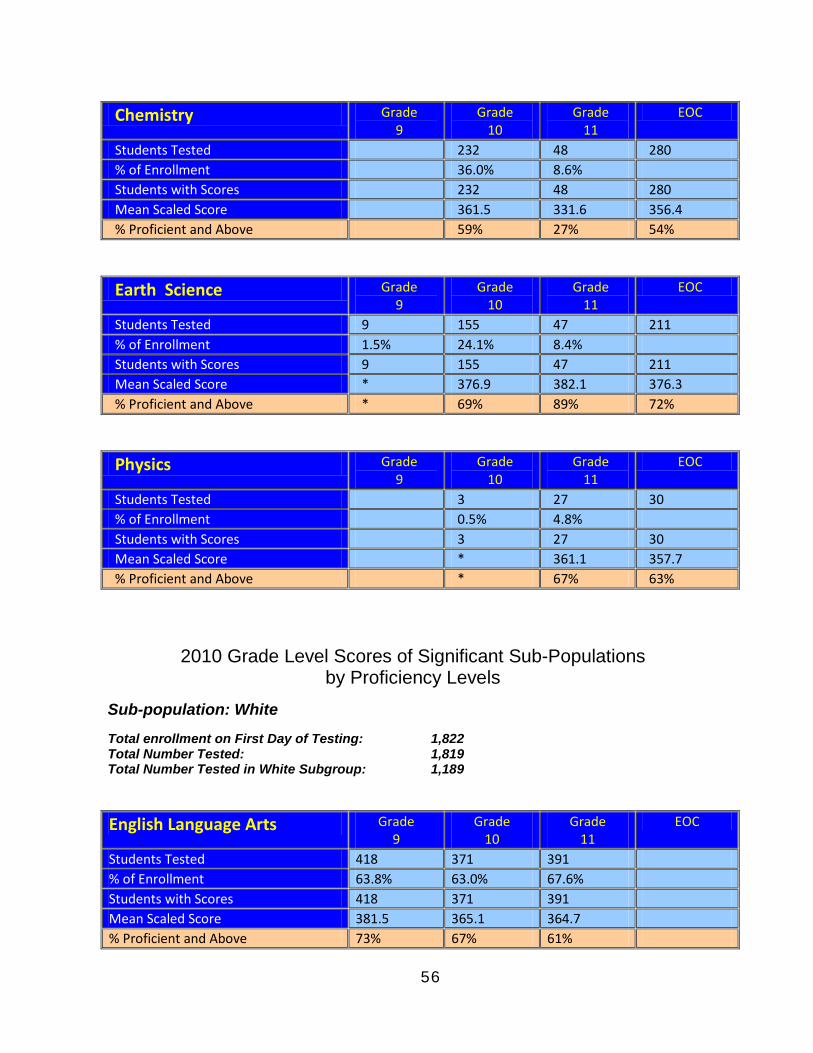
56
Chemistry Grade 9
Grade 10
Grade 11
EOC
Students Tested 232 48 280 % of Enrollment 36.0% 8.6% Students with Scores 232 48 280 Mean Scaled Score 361.5 331.6 356.4 % Proficient and Above 59% 27% 54%
Earth Science Grade 9
Grade 10
Grade 11
EOC
Students Tested 9 155 47 211 % of Enrollment 1.5% 24.1% 8.4% Students with Scores 9 155 47 211 Mean Scaled Score * 376.9 382.1 376.3 % Proficient and Above * 69% 89% 72%
Physics Grade 9
Grade 10
Grade 11
EOC
Students Tested 3 27 30 % of Enrollment 0.5% 4.8% Students with Scores 3 27 30 Mean Scaled Score * 361.1 357.7 % Proficient and Above * 67% 63%
2010 Grade Level Scores of Significant Sub-Populations by Proficiency Levels
Sub-population: White
Total enrollment on First Day of Testing: 1,822 Total Number Tested: 1,819 Total Number Tested in White Subgroup: 1,189
English Language Arts Grade 9
Grade 10
Grade 11
EOC
Students Tested 418 371 391 % of Enrollment 63.8% 63.0% 67.6% Students with Scores 418 371 391 Mean Scaled Score 381.5 365.1 364.7 % Proficient and Above 73% 67% 61%

57
General Mathematics Grade 9
Grade 10
Grade 11
EOC
Students Tested 80 80 % of Enrollment 12.2% Students with Scores 79 79 Mean Scaled Score 325.7 325.7 % Proficient and Above 28% 28%
Algebra I Grade 9
Grade 10
Grade 11
EOC
Students Tested 192 49 15 256 % of Enrollment 29.3% 8.3% 2.6% Students with Scores 192 49 15 256 Mean Scaled Score 341.0 303.9 295.1 331.3 % Proficient and Above 43% 22% 13% 38%
Geometry Grade 9
Grade 10
Grade 11
EOC
Students Tested 1259 69 26 220 % of Enrollment 19.1% 11.7% 4.5% Students with Scores 125 69 26 220 Mean Scaled Score 389.6 328.4 329.4 363.3 % Proficient and Above 82% 28% 23% 58%
Algebra II Grade 9
Grade 10
Grade 11
EOC
Students Tested 27 114 118 256 % of Enrollment 4.1% 19.4% 20.4% Students with Scores 27 114 118 259 Mean Scaled Score 412.4 349.3 310.9 338.4 % Proficient and Above 81% 43% 18% 36%
Summative Math Grade 9
Grade 10
Grade 11
EOC
Students Tested 21 104 125 % of Enrollment 3.6% 18.0% Students with Scores 21 104 125 Mean Scaled Score 407.2 380.8 385.3 % Proficient and Above 100% 70% 75%

58
World History Grade 9
Grade 10
Grade 11
EOC
Students Tested 3 368 2 373 % of Enrollment 0.5% 62.5% 0.3% Students with Scores 368 1 369 Mean Scaled Score \* 351.4 * 350.9 % Proficient and Above * 52% * 51%
United States History Grade 9
Grade 10
Grade 11
EOC
Students Tested 388 % of Enrollment 67.1% Students with Scores 388 Mean Scaled Score 361.9 % Proficient and Above 56%
Grade 10 Life Science Grade 9
Grade 10
Grade 11
EOC
Students Tested 368 % of Enrollment 62.5% Students with Scores 368 Mean Scaled Score 370.7 % Proficient and Above 66%
Biology Grade 9
Grade 10
Grade 11
EOC
Students Tested 415 25 109 549 % of Enrollment 63.4% 4.2% 18.9% Students with Scores 415 25 109 549 Mean Scaled Score 373.2 325.1 382.5 372.8 % Proficient and Above 67% 24% 79% 67%
Chemistry Grade 9
Grade 10
Grade 11
EOC
Students Tested 210 43 253 % of Enrollment 35.7% 7.4% Students with Scores 210 43 253 Mean Scaled Score 351.0 353.2 351.4 % Proficient and Above 46% 49% 47%

59
Earth Science Grade 9
Grade 10
Grade 11
EOC
Students Tested 3 124 56 183 % of Enrollment 0.5% 21.1% 9.7% Students with Scores 3 124 56 183 Mean Scaled Score * 374.8 391.4 378.6 % Proficient and Above * 64% 91% 72%
Physics Grade 9
Grade 10
Grade 11
EOC
Students Tested 2 28 30 % of Enrollment 0.3% 4.8% Students with Scores 2 28 30 Mean Scaled Score * 391.8 390.7 % Proficient and Above * 86% 87%
SAT Testing
The chart below shows Saugus High’s SAT averages for the past three years. The averages in all three areas of the SAT (Critical Reading, Math and Writing), show an increase in the average scores for Saugus High students.
Saugus High
Grade 12 Enrollment
Number Tested
Percent Tested
Reading Average
Math Average
Writing Average
2011-12 2010-11 562 265 47.15% 533 552 531 2009-10 589 234 39.73% 525 544 521 2008-09 625 294 47.04% 531 545 523
The chart below shows the comparative SAT averages for the William S. Hart District, Los Angeles County, and the state for the 2010-11 school year. This data shows that we are higher than our district average, higher than the statewide average by 100 points, and above the county average by 180 points.
School Reading Average Math Average Writing Average Total Average
Saugus 533 552 531 1616
Hart District 527 549 528 1604
LA County 471 490 475 1436
California 495 513 494 1502
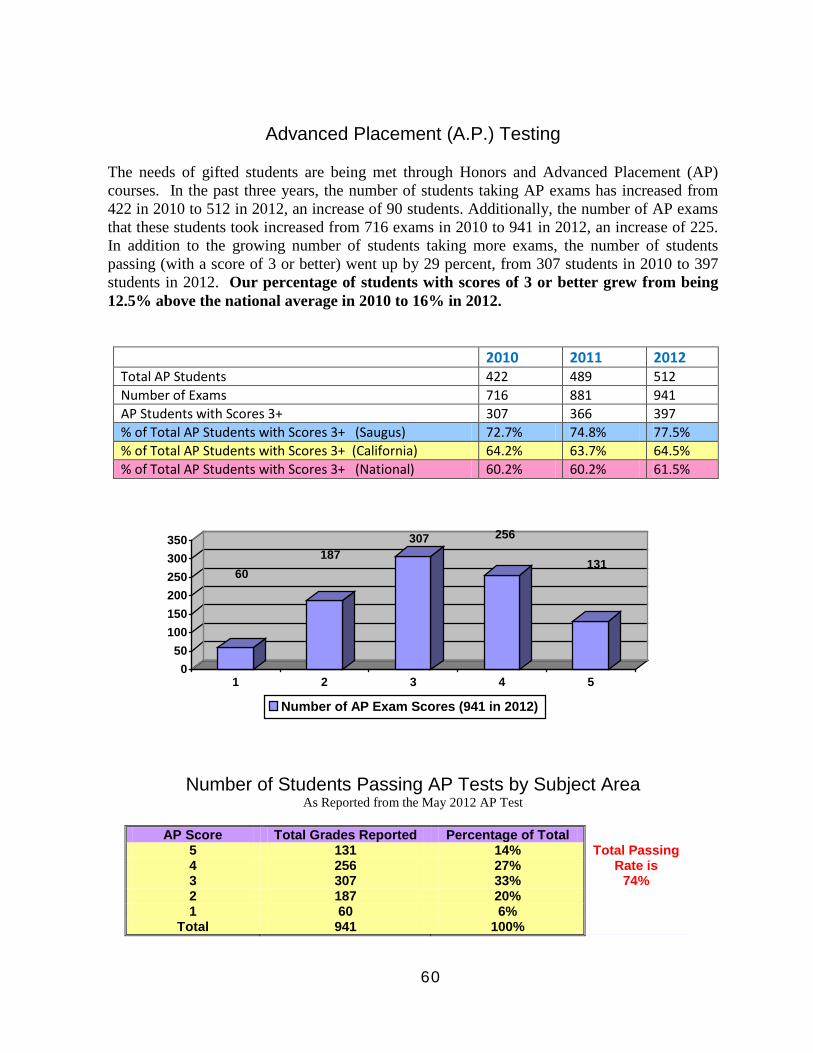
60
Advanced Placement (A.P.) Testing
The needs of gifted students are being met through Honors and Advanced Placement (AP) courses. In the past three years, the number of students taking AP exams has increased from 422 in 2010 to 512 in 2012, an increase of 90 students. Additionally, the number of AP exams that these students took increased from 716 exams in 2010 to 941 in 2012, an increase of 225. In addition to the growing number of students taking more exams, the number of students passing (with a score of 3 or better) went up by 29 percent, from 307 students in 2010 to 397 students in 2012. Our percentage of students with scores of 3 or better grew from being 12.5% above the national average in 2010 to 16% in 2012.
2010 2011 2012 Total AP Students 422 489 512 Number of Exams 716 881 941 AP Students with Scores 3+ 307 366 397 % of Total AP Students with Scores 3+ (Saugus) 72.7% 74.8% 77.5% % of Total AP Students with Scores 3+ (California) 64.2% 63.7% 64.5% % of Total AP Students with Scores 3+ (National) 60.2% 60.2% 61.5%
60
187307 256
131
0
50
100
150
200
250
300
350
1 2 3 4 5
Number of AP Exam Scores (941 in 2012)
Number of Students Passing AP Tests by Subject Area
As Reported from the May 2012 AP Test
AP Score Total Grades Reported Percentage of Total 5 131 14% Total Passing 4 256 27% Rate is 3 307 33% 74% 2 187 20% 1 60 6%
Total 941 100%
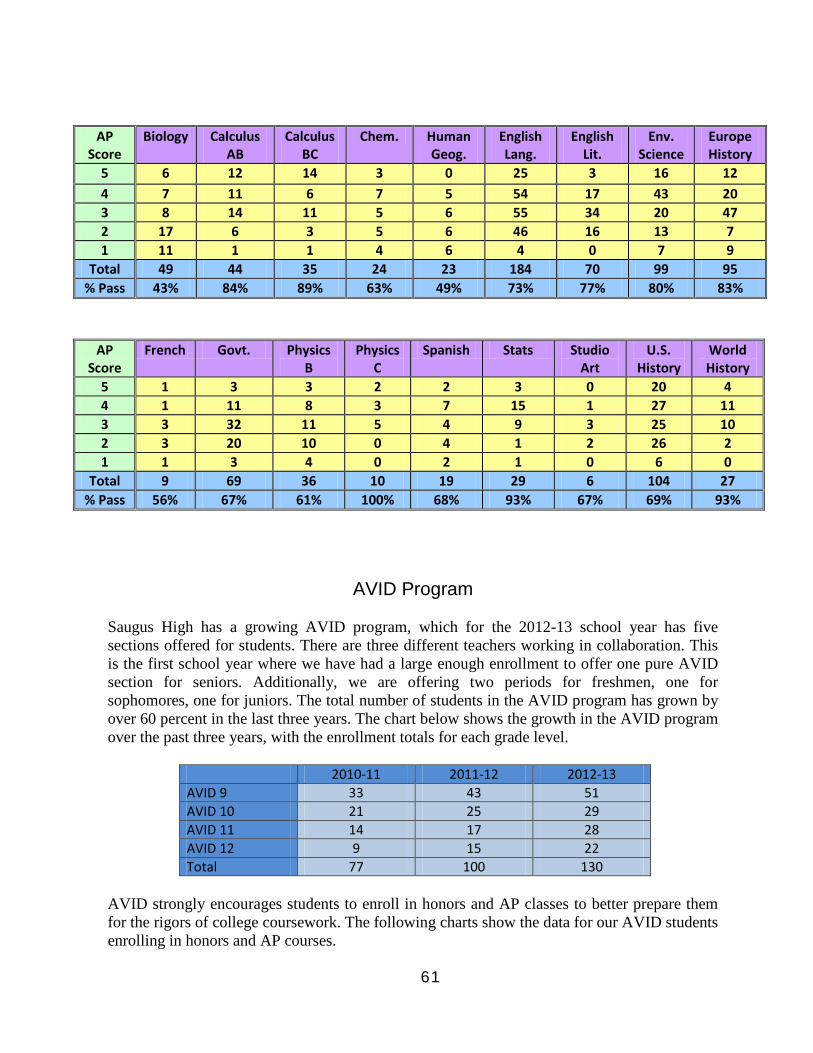
61
AVID Program
Saugus High has a growing AVID program, which for the 2012-13 school year has five sections offered for students. There are three different teachers working in collaboration. This is the first school year where we have had a large enough enrollment to offer one pure AVID section for seniors. Additionally, we are offering two periods for freshmen, one for sophomores, one for juniors. The total number of students in the AVID program has grown by over 60 percent in the last three years. The chart below shows the growth in the AVID program over the past three years, with the enrollment totals for each grade level.
2010-11 2011-12 2012-13 AVID 9 33 43 51 AVID 10 21 25 29 AVID 11 14 17 28 AVID 12 9 15 22 Total 77 100 130
AVID strongly encourages students to enroll in honors and AP classes to better prepare them for the rigors of college coursework. The following charts show the data for our AVID students enrolling in honors and AP courses.
AP Score
Biology Calculus AB
Calculus BC
Chem. Human Geog.
English Lang.
English Lit.
Env. Science
Europe History
5 6 12 14 3 0 25 3 16 12 4 7 11 6 7 5 54 17 43 20 3 8 14 11 5 6 55 34 20 47 2 17 6 3 5 6 46 16 13 7 1 11 1 1 4 6 4 0 7 9
Total 49 44 35 24 23 184 70 99 95 % Pass 43% 84% 89% 63% 49% 73% 77% 80% 83%
AP Score
French Govt. Physics B
Physics C
Spanish Stats Studio Art
U.S. History
World History
5 1 3 3 2 2 3 0 20 4 4 1 11 8 3 7 15 1 27 11 3 3 32 11 5 4 9 3 25 10 2 3 20 10 0 4 1 2 26 2 1 1 3 4 0 2 1 0 6 0
Total 9 69 36 10 19 29 6 104 27 % Pass 56% 67% 61% 100% 68% 93% 67% 69% 93%

62
Students that have completed AP, concurrent enrollment college classes and/or honors courses (9-12 cumulative total) in the 2010-11 school year.
Classes Number of AVID
Students
Number of Enrollments
Honors AP
AVID Class Total
% of AVID Class
12th Grade Cumulative 7 5 13 9 78% 1 or more Honors courses 3 1 AP course only 1 2 or more AP courses 4 4 or more AP courses 1 Concurrent enrollment in a college course
3 (3 courses)
11th Grade Cumulative 7 4 8 14 50% 1 or more Honors courses 2 1 AP course only 4 2 or more AP courses 2 4 or more AP courses 2 Concurrent enrollment in a college course
2 (4 courses)
10th Grade Cumulative 9 22 4 21 43% 1 or more Honors courses 8 1 AP course only 4 Concurrent enrollment in a college course
0
9th Grade Cumulative 13 19 1 33 40% 1 or more Honors courses 12 1 AP course only 1

Section Two Significant Developments

63
II. Significant Developments Saugus High School has seen many exciting changes since the visiting committee’s last tour of our campus in 2010. Many changes are quickly visible to the eye, such as the $6 million modernization of our Career Technical Facility (Industrial Arts). Some are in the planning stages, such as the construction of our $9 million Performing Arts Center (The Saugus Forum). Many of the differences from three years ago are highly concentrated on student success, such as the expansion of our Intervention Program, the implementation of Freshman Immersion Day, the growth of our AVID program, and the establishment of a highly successful outreach to feeder elementary schools (focusing on 5th and 6th grade families). These and many more changes are visible to guests when they visit our campus and discover all the positive programs available for the students at Saugus High School. Freshman Immersion Day
One of the most significant developments for student success has been the creation of our Freshman Immersion Day, which is now in the second year of existence. Freshman Immersion Day gives incoming ninth graders the opportunity to come on campus the day before ninth grade registration (typically the first week of August). Students attend an assembly and break out informational sessions led by students, teachers, counselors and administrators. The culmination of the day is a pep rally and then a lunch provided by a local business partner. Everything about this day id geared toward providing new students the tools for success. On Freshman Immersion Day, students are paired up with older students (junior and seniors) from our Common Cents program. These students serve as mentors not for just a single day, but for the entire school year. The idea is that by inviting our new freshmen to school in a fun, informative, and welcoming environment, they will start their freshman year better prepared for academic and social success. In addition to the Freshman Immersion Day, three years ago the school purchased enough copies of the book The Seven Habits of Highly Effective Teenagers (Covey), and made it a highly recommended summer reading assignment for incoming ninth graders. We have seen a participation rate of well over two-thirds of the freshman class reading the book and coming prepared to discuss its content on Freshman Immersion Day. Teachers report back that they have been creating lessons tied to the Seven Habits book, and feel that by tying it into Freshman Immersion Day it increases our participation rate in reading the book and with attendance at the Freshman Immersion Day.

64
Intervention Opportunities
The Intervention Program has grown over the past three years to include participation from all departments. Teachers in all subject areas are now able to refer students to the Saturday Study Skills Academy, which gives students the opportunity to make up missing work and assignments. Attendance in the academy allows them to turn in this work for partial or full credit. There are after school intervention tutorials taking place weekly in the math, English, science, world language, social studies and special education departments. The intervention program also runs after school preparation classes for the ELA and math sections of the CAHSEE. Counselors meet with and enroll all 11th and 12th graders who have failed one or both parts of the CAHSEE into these after school classes. We have a bilingual instructional assistant who makes phone calls home to parents in order to notify them that their student has been enrolled in the program. This person also calls parents when the students are not attending. Students are able to participate in CAHSEE intervention every semester after they have taken the test and failed, until they pass both parts of the exam. Planning Wednesday and Student Help
Saugus High School has a bell schedule that allows for embedded collaboration and planning time. School starts late on Wednesday mornings, and this “Planning Wednesday” time allows for a rotational schedule of staff meetings, department meetings and inter-departmental collaboration, WASC preparation meetings, professional development activities, and student help opportunities (office hours). The school calendar is planned a year in advance, and each Wednesday throughout the year has a different type of meeting assigned to it. Student help time is normally assigned to take place the Wednesday before the end of a grading period. Teachers open their classrooms to provide additional help for students, such as re-teaching essential standards, teaching enrichment lessons, or preparing for the STAR or an AP exam. Students have the opportunity to choose which teacher they will go to for additional help on the student help days. Grade Level Counseling
In the 2009-10 school year, the Saugus High School counseling office re-aligned how students are assigned to counselors by grade level instead of by alphabetical assignment. The counselors felt that by having students in all four grades assigned to them, they were working much more with their juniors and seniors instead of with their freshmen and sophomores. With budget cuts, one counseling position was lost from the school in 2009, and the number of counselors decreased from seven to six. The counseling department was looking for ways to maximize potential and provide more efficient services to students. They agreed as a department to have students assigned to them by grade level, so that four of the counselors would only have one grade of students assigned to them, and two of the counselors have the last part of two grade levels assigned to them. Counselors follow the students for all four years, moving with them from one year to the next so the students always have the same counselor. The counselors report that they have more time to focus on the activities specific to the grade level, whether it be working with academically struggling ninth graders, or doing college counseling with the seniors. Data to support the effectiveness of this program comes from our number of students who did not graduate in the class of 2012… ZERO! All the seniors in the class, with the focus
65
and support of two dedicated 12th grade counselors, graduated in the May 2012 commencement ceremony, and none had to attend summer school to complete their graduation requirements. Educationally Related Counseling Services
Students are supported with mental health counseling services through a new program called Educationally Related Counseling Services (ERICS) created by the Hart district in 2012. In the past, AB 3632 provided mental health services for our special education population. With the elimination of AB 3632 at the statewide level, the financial responsibility for providing mental health counseling services fell upon school districts. Saugus High now participates in the new district-wide school based mental health services program. We have therapists who are district employees meeting with students in one of the offices in the counseling building. These therapists meet with special education students who have Designated Instructional Service (DIS) counseling or ERICS written into their IEP’s. With the implementation of the new school based mental health program, the district is covering the costs to provide services to special education and general education students. In addition to ERICS, general education students are now able to access similar mental health counseling services that students with an IEP were receiving, through the new school based counseling services. The guidance counselors fill out a referral form for a student in need of these services, and the school liaison for the school based mental health program opens up a case for that student. The student is eligible to meet with a therapist for up to ten sessions, at which point the case is either closed, or is referred on by the therapist to a further resource. Professional Development
Over the past three years, the Professional Development (PD) team has continued to work diligently to help build the capacity of Saugus teachers in various areas. The focus of the team is data driven and re-evaluated each year. A PD plan is created each May for the following school year. The PD team will also survey the staff to help guide presentation decisions for the following year. A major portion of PD focuses on using data to drive practice. It was out of this survey that the PD team decided to put on a best practices staff development, so that teachers could highlight various instructional strategies for the rest of the staff. Topics that have been covered are Google Docs use in the classroom and facilitating collaboration between teachers, Academic Vocabulary, use of technology for Formative assessments, and Reading and Literacy strategies for teachers (among others). Strategies to engage students have also been a focus for the PD team. Teachers have videotaped themselves in their classrooms and we have all viewed it to identify which students are engaged and who are not as a learning tool for teachers. The use of various technologies such as smartphones, texting, tablets, and one-to-one laptops is presented and incorporated into teacher’s practice. The PD team continues to collaborate with other schools at the district level as we develop a transition plan for the California Common Core State Standards. The PD team is currently providing information to the staff to build staff capacity for the change. Study Skills Class
Two years ago, our special education department recognized a need to intervene when it comes to struggling students before a referral for special education testing is made. Traditionally, when a student isn’t exhibiting successful academic outcomes, one of the many possible first steps offered to parents was special education testing. Out of this discussion, the special

66
education department created a new general education study skills class. This course curriculum included: reading strategies, writing strategies, standardized testing strategies, time management and organizational strategies to help struggling students access grade-level content standards. Students are identified by their counselor based upon CST scores (FBB or BB), if the student failed one or more classes the previous semester; if the student has a 504 plan; if the student is not making appropriate progress towards graduation; or if the student was a junior high non-promotee. In the 2011-2012 school year, the program started with two sections for ninth graders and two more for tenth graders. This year, we expanded the program to include three class sections for ninth graders, two class sections for tenth graders, and one class section for eleventh graders.
Elementary and Junior High Outreach
Last year, our principal started making regular visits to Arroyo Seco Junior High and six Saugus feeder elementary schools in order to establish greater ties to the school staffs, the students targeted to come to Saugus High School, and the parents of those children. As a result of this cultivated relationship, many developments and programs have grown that are seen as unique and profitable for building the skills needed when these students arrive on the high school campus. A team consisting of an administrator, counselor, teacher, and students travel to all these feeder schools on various nights in the fall and present an information night in front of parents of “Pre-High School” students. The Saugus Journalism class has printed special editions of the school newspaper directed toward disseminating information to 5th and 6th grade parents. Some of this information includes: skills that students can work on right now as they prepare for high school, how to start preparing for college, what to expect on a high school campus, and much more. Additionally, each spring, Saugus High School plans a night on their campus where these future Centurions can come have a dinner, hear from invited guest speakers, tour the facilities, take in a science dissection or participate in an art activity, receive a special “Future Saugus Centurion” tee shirt, and be special guest at the evening basketball game (where some will join their principal for a halftime competition between schools). One of the most popular activities tied to this outreach is a mini pep rally that is planned in April. We take a busload of cheerleaders, athletes, band members, student leaders, and other representatives of our school and we put on a 30 minute rally to get students excited about becoming a Saugus Centurion. The entire program is about making connections, encouraging dreams, providing support, and celebrating success. Success Despite Challenges
Due to the economic hardships being experienced throughout our state, less funding is being earmarked for education. There have been significant cuts in the past few years that have meant we are now operating on a school year of 175 school days instead of the 180 which we had at the time of our last visit. Additionally, a professional development day has been removed from the school calendar, which traditionally has been held on the Friday before President’s Day weekend. This has now become a district wide furlough day. Since we have an established planning Wednesday schedule, our staff is still receiving the same (and maybe more) professional development time than in 2010. Despite these cuts, our staff still continues to provide effective instruction for all students.
Section Three Ongoing School Improvement

67
III. Ongoing School Improvement
Procedures for Implementing and Monitoring the School-Wide Action Plan
The administration at Saugus High School, consisting of the principal, and four assistant principals, the lead counselor, and the department chairs take on the primary responsibility for ensuring that the 2010 action plan is carried out effectively. The 2010 Schoolwide Action Plan, visiting committee’s report, ESLRs, and growth areas are reviewed annually with the faculty, leadership team, and in department meetings during our Wednesday planning time. Our professional development and WASC/FOL groups are aligned and meet on a regular basis. WASC/FOL group leaders, the principal and assistant principals are assigned to monitor and review the action plan within each group. Growth areas are discussed within these meetings and progress on the action plan is monitored and recorded. The updated Schoolwide Action Plan has been included in the appendix of this report. For the past several years, Saugus’ WASC/FOL Action Plan has been aligned to our Single School Plan for Student Achievement and is presented to the Hart District School Board for approval. The School Accountability Report Card is also aligned with both the WASC/FOL Action Plan and the Single School Plan for Student Achievement. In this way, our goals for student achievement are conveyed clearly and consistently to all stakeholders. Although the Single Plan for Student Achievement list four goals which are district wide, our WASC Action Plan goals help address the district goals. For example, the Single Plan for Student Achievement states that “all students will be proficient in ELA and math”. This is addressed by our Action Plan goals of raising performance levels of student subgroups, narrowing the achievement gap, addressing the achievement levels of low-performing students and improving support for struggling ninth graders. We feel that the four goals in the Single Plan for Student Achievement are therefore well aligned with the three goals in our Action Plan. The mid-term progress report was prepared by the Principal, the leadership team, and by the committee focus group leaders responsible for monitoring the action plan and each of the three critical areas for follow up. The entire faculty and staff will have reviewed the report before being submitted to the WASC/FOL visiting team.

Section Four Report on Schoolwide Action Plan Progress

68
IV. Report on Schoolwide Action Plan Progress
Report on Schoolwide Action Plans
Goal #1: Raise Proficiency Levels of students in our special education and Hispanic subgroups through increased literacy and numeracy on all California Standards Tests.
During the last site visit in 2010, our research of the data showed that there existed a discrepancy between the performance data of our Hispanic and Special Education subgroups and the schoolwide population. When we wrote the Action Plan, we compared our Hispanic and Special Education subgroups, and not to the White subgroup, which we now realize did not give a fully accurate picture of the achievement gap. However, to keep the data consistent with the previous document, we will continue to compare the subgroups for the schoolwide population for this document.
In reviewing the Action Plan, some of the new issues that have come to our attention are as follows. We recognize that we were too ambitious, and that many of our growth targets were too high. In Goal 1 of our Action Plan, we said we would “decrease the achievement gaps between the subgroups and the schoolwide population scoring on the CAHSEE ELA and math subtests by two percent without decreasing the performance level of the schoolwide population.” Between 2009 and 2012, the achievement gap for special education students on the ELA portion of CAHSEE did not change. We had a 94 percent passing rate for general education in 2009, which was 93 percent in 2012. Special education, by comparison, has a 66 percent passing rate in 2009, and 65 percent passing rate in 2012. This data shows that for first time CAHSEE test takers, the achievement gap remained the same. On the math section of the CAHSEE, we were able to close the achievement gap. In 2009, 71 percent of the special education subgroup passed the math CAHSEE, which increased to 73 percent in 2012. The schoolwide percentage dropped from 95 to 94. Because the schoolwide population dropped by one percentage point, even though the special education subgroup increased by two percentage point, we still did not meet our growth targets. In addition, our Hispanic subgroup dropped in ELA from an 87 percent passing rate in 2009, to an 86 percent passing rate for 2012. In math, however our Hispanic subgroup increased from an 88 percent passing rate in 2009 to a 91 percent in 2012. The schoolwide passing rate in 2012 was 94 percent, as opposed to 95 percent in 2009. This means that the achievement gap for Hispanics on the math CAHSEE has decreased from a seven percentage point difference in 2009 to a three percentage point difference in 2012. An additional growth target from Goal 1 was that “we will decrease the achievement gaps between the subgroups and the schoolwide population as measured on the CAHSEE by five percent within three years.” Our data shows that our achievement gap has not decreased for English, and that we have not met this growth target in the Action Plan. However, even though we did not meet the growth target as measured by our Hispanic subgroup in math, we are decreasing the achievement in gap.
In 2012, as measured on the English Language Arts CST, the achievement gap between the schoolwide population and our Hispanic subgroup was 9 points for 9th graders, a reduction from 17 points in 2009. In 2012, the gap was 21 points for 10th graders, an increase from 14

69
points in 2009. For 11 graders, the gap is 12 points in 2012, an increase from 8 points in 2009. This shows that there still exists an achievement gap in English Language Arts between our Hispanic population and the schoolwide population.
Our special education population has been scoring at a relatively consistent level on the ELA CST’s. The proficiency levels between 2009 data and 2012 have been mixed. The ninth graders scoring proficient or above decreased from 20 percent to 18. For 10th graders, the increase was four percentage points from 13 to 17 percent, and for 11th graders, there was a two point increase from 10 to 12 percent. In 2012, as measured on the Algebra I CST, the achievement gap between the schoolwide population and our Hispanic subgroups is closing. In 2009, there was an 11 point gap between our Hispanic and White 9th graders, which reduced to 10 points in 2012. For 10th graders, there was a one point gap between the populations, which increased to a two point achievement gap in 2012. For the 11th graders, there was a five percent gap in 2009, and now there is no difference between the two subgroups in 2012. This shows that there still exists an achievement gap with 9th and 10th graders in Algebra I, but that there is no gap right now for the 11th graders. Our special education population has witnessed a drop in the number of students scoring proficient or above on the Algebra CST. Even though there was a drop in proficiency levels from 42 percent in 2009 to 10 percent for all grade levels of special education on the Algebra I CST’s, we did show an increase in the number of special education students taking the Geometry CST from 9 in 2010 to 25 in 2012. We attribute this increase to the new policy requiring all 11th graders to be enrolled in math and science. Even though student achievement is rising in many CST areas, there are steps being taken to address the needs of the Hispanic and special education subgroups. With the growth of our AVID and Study Skills programs, our Hispanic subgroup is receiving more support to be successful in math and English classes. We are placing all of our at risk EL students into a CAHSEE math and English parallel class second semester, and this is the second year we have been doing so. For our special education subgroup, we are continuing our resource and SDC models for providing instruction, which provides the students a smaller class size, individualized instruction and necessary accommodations to access literacy and numeracy skills. With the new school policy requiring math and science of all 11th graders, including resource and SDC students, these students are gaining access to rigorous college prep curriculum to better prepare them for post high school education. Addressing the goal in the Action Plan to increase enrollment in Career Pathways, with a focus on students in subgroups, we are bringing back the Career Pathways program for the 2013-14 school year. This program had been discontinued for a number of years due to staffing cuts and a reduction in the elective course offerings. With renewed support from the district, Career Pathways will be offered to students once again next year. One of the new classes coming to campus is a Sports Medicine class, which trains students in a vocational manner in athletic training.

70
Saugus High School, in conjunction with College of the Canyons, has received a grant to fund a part time career coach. The career coach works on campus eight hours a week in the counseling office, and meets with 11th and 12th graders to do career interest inventories and to write career plans. One of the action plan tasks was to develop a library night program to open the library on a regular basis outside of school hours. Beginning in the fall of 2012, the library is now open Monday through Thursday after school until 5 PM for the “Technology Center”. This was a request developed out of the professional development team as a way to encourage the use of technology in the classroom. With new technology based instructional strategies being used across the curriculum areas, such as using turnitin.com, Quizzeg, MyAccess, shared documents, and more, teachers recognized the need to give students more access to technology at the school site, especially after school hours. This is an equal access issue for many of our students who do not have adequate access to technology at home. All students, including those in our significant subgroups, now have more access to technology due to the technology center. Another task was to develop a plan to increase attendance from parents from the subgroups in ELAC and PTSA meetings. Our PTSA moved the times for their meetings from evenings, when a handful of 10 to 15 parents would attend, to now meeting during the school lunch period. Now, attendance has increased to 50 or more per meeting. We have not measured the data to show that this increase is specifically due to parents from subgroups attending, but our hope is that with more parents being able to attend, that the subgroups are proportionately represented. For the ELAC meetings, there is a new arrangement in that the junior high and high school ELAC meeting have been combined. The attendance has improved through the joint meetings, with the hope that junior high parents are better able to make connections with the high school, and are more willing to attend since the meetings are combined. The bilingual instructional assistant is paid extra hours to make calls to remind parents about the ELAC meetings, and this has also contributed to better attendance from the parents.
Goal #2: Create, develop, organize and enhance programs and interventions to assist students that are performing at the below basic and far below basic levels of the CST’s and who are not passing the CAHSEE. The schoolwide passing rates for CAHSEE have slightly decreased from 2009 to 2012, from 95 to 94 percent passing rates for first time test takers in math, and from 94 to 93 percent for first time test takers in ELA. We did not meet one of our growth targets to increase the number of students passing the CAHSEE for first time test takers in both math and ELA, rather the percentage dropped by one point in both areas. For our special education population, we had a drop of one point from 66 to 65 percent of first time test takers passing the ELA section of the exam, but in math our passing rates increased from 71 percent in 2009 to 73 percent in 2012.

71
We continue to provide small group CAHSEE intervention classes for all 11th and 12th grade students who need to pass one or both parts of the exam. One of our growth targets was to reduce by five points the number of students scoring BB or FBB on the Algebra II and Earth Science CST’s. Our data shows that the number has actually increased by five points in each of these subject areas. We attribute that increase to the new school policy requiring all 11th grade students to enroll in math and science in their junior year. The number of 11th graders taking the CST in Earth Science has increased from 111 students in 2009 to 151 students in 2012. To address the task that all students will be proficient in first year algebra, we recognize that there is much work left to be done. In 2012, 71 percent of ninth graders scored Basic or below on the Algebra I CST. We are creating a program in spring 2013 where all D and F students in Algebra I in the fall semester will enroll in Strategic Math in the spring, as a way of learning pre-algebra skills, and to better prepare them to the start Algebra 1 again in the fall semester. The English department has identified students who are deficient in specific writing standards, and are referring them to intervention taught by an English teacher. In this intervention, the curriculum is specifically targeting and designed to re-teach writing standards for which students need additional instruction. This is a brand new intervention starting in the fall semester of 2012. Other writing strategies, such as WICR, are being supported by our expanding AVID program. In our Action Plan, we noted many steps towards achieving this goal, which we as a school are actively continuing. Saturday Academy has been established so successfully that the procedures, referral process, and awareness between students and teachers have made it an integral part of our school’s intervention program. We have between 50 to 75 students referred to every Saturday Academy, all of whom are getting the opportunity to make up missing work for credit. One of the steps was to create a culture of all students wanting to do well on standardized tests. A committee of teachers was established in 2011 to discuss and create a system of incentives for students to do well on standardized tests. An example of a department providing specific outreach to students is the social studies teachers inviting students to school during Planning Wednesday time to explain the relevance of the CST’s, to go over test taking strategies, and to give a general encouragement “pep talk” to the students about the importance of the exams.
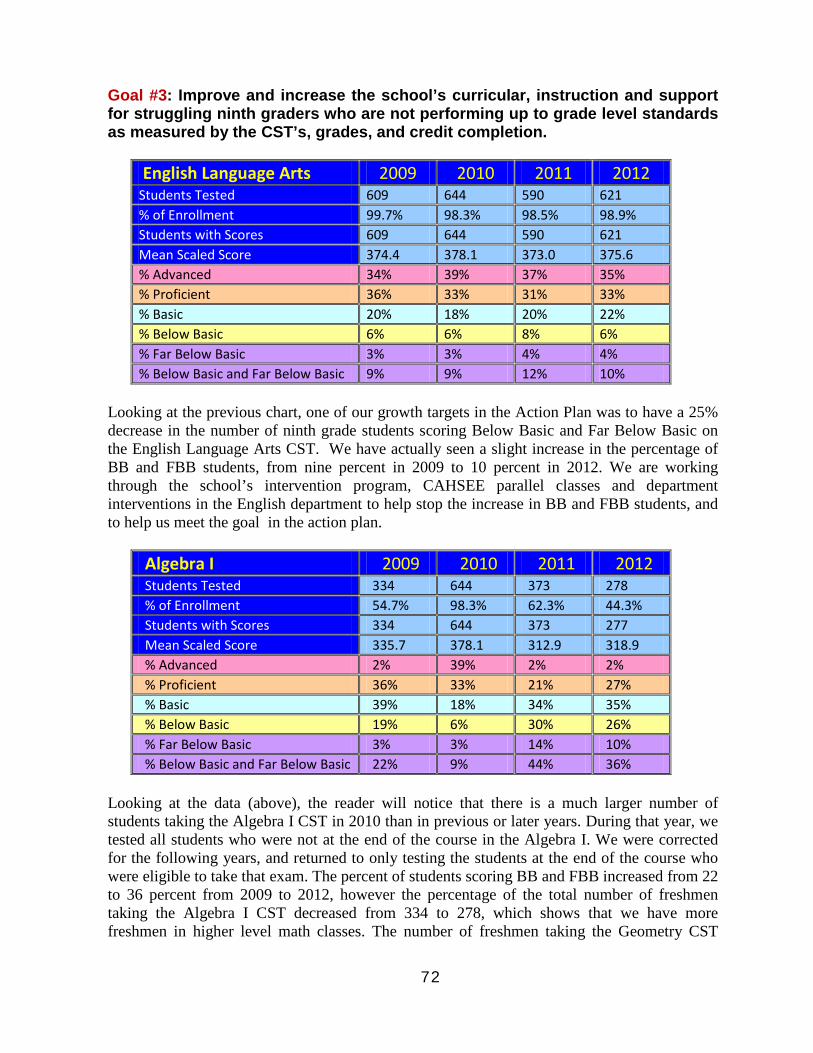
72
Goal #3: Improve and increase the school’s curricular, instruction and support for struggling ninth graders who are not performing up to grade level standards as measured by the CST’s, grades, and credit completion.
English Language Arts 2009 2010 2011 2012 Students Tested 609 644 590 621 % of Enrollment 99.7% 98.3% 98.5% 98.9% Students with Scores 609 644 590 621 Mean Scaled Score 374.4 378.1 373.0 375.6 % Advanced 34% 39% 37% 35% % Proficient 36% 33% 31% 33% % Basic 20% 18% 20% 22% % Below Basic 6% 6% 8% 6% % Far Below Basic 3% 3% 4% 4% % Below Basic and Far Below Basic 9% 9% 12% 10%
Looking at the previous chart, one of our growth targets in the Action Plan was to have a 25% decrease in the number of ninth grade students scoring Below Basic and Far Below Basic on the English Language Arts CST. We have actually seen a slight increase in the percentage of BB and FBB students, from nine percent in 2009 to 10 percent in 2012. We are working through the school’s intervention program, CAHSEE parallel classes and department interventions in the English department to help stop the increase in BB and FBB students, and to help us meet the goal in the action plan.
Algebra I 2009 2010 2011 2012 Students Tested 334 644 373 278 % of Enrollment 54.7% 98.3% 62.3% 44.3% Students with Scores 334 644 373 277 Mean Scaled Score 335.7 378.1 312.9 318.9 % Advanced 2% 39% 2% 2% % Proficient 36% 33% 21% 27% % Basic 39% 18% 34% 35% % Below Basic 19% 6% 30% 26% % Far Below Basic 3% 3% 14% 10% % Below Basic and Far Below Basic 22% 9% 44% 36%
Looking at the data (above), the reader will notice that there is a much larger number of students taking the Algebra I CST in 2010 than in previous or later years. During that year, we tested all students who were not at the end of the course in the Algebra I. We were corrected for the following years, and returned to only testing the students at the end of the course who were eligible to take that exam. The percent of students scoring BB and FBB increased from 22 to 36 percent from 2009 to 2012, however the percentage of the total number of freshmen taking the Algebra I CST decreased from 334 to 278, which shows that we have more freshmen in higher level math classes. The number of freshmen taking the Geometry CST

73
increased from 140 to 180 between 2009 and 2012, meaning that fewer 9th graders would be taking the Algebra I CST.
Another one of our goals in the Action Plan was to have a 20% decrease in the number of ninth grade students taking the General Math California Standards Test. In 2009, we had 98 freshmen take this test. In 2012, the number dropped to 81, which is a 21 percent decrease, showing that we met this goal from the Action Plan.
Biology 2009 2010 2011 2012 Students Tested 572 637 574 618 % of Enrollment 93.6% 97.3% 95.8% 98.4% Students with Scores 572 637 573 618 Mean Scaled Score 360.9 368.2 366.5 367.2 % Advanced 25% 33% 33% 33% % Proficient 32% 31% 30% 29% % Basic 33% 25% 24% 26% % Below Basic 5% 7% 8% 7% % Far Below Basic 4% 5% 5% 5% % Below Basic and Far Below Basic 9% 12% 13% 12%
% Proficient and Above 57% 64% 63% 62%
Our goal in the Action Plan was to increase by 2% each year the number of 9th grade students scoring at or above Proficient on the Biology California Standards Test. We have increased from 57% in 2009 to 62% in 2012. Even though it is not a 2% increase every year, the total number of students scoring proficient or above has raised by five percentage points since 2009.
Some of the tasks in the Action Plan included the creation of the Saturday Study Skills Academy, which has been running at near full seating capacity for each session. The counselors have increased the number of times they articulate with our feeder junior highs through the use of Wednesday Planning Time. In addition, due to grade level counseling, the incoming ninth grade counselors met annually with the eighth grade counselors to discuss the transition of students with 504 Plans from the junior high to the high school. They talk about students with individualized needs, and other issues to be aware of before high school, in addition to the annually scheduled matriculation meetings that take place between the counselors and IEP case managers.
The math “mandatorial” program does not take place anymore. The math department participates actively in the school’s intervention program. Math teachers spend one to two lunches and after school hours each week in their classrooms to provide free and extra intervention to struggling students. A calendar is published and which has the days and times of the extra math help.
The math department is also working to implement a new plan in the spring semester that affects the placement of students receiving D’s and F’s in Algebra I. Previously, D and F students were required to repeat Algebra I in the spring, losing credits and causing them to be off sequence in algebra with summer vacation splitting their taking of 1A and 1B.
74
Additionally, students did not get a chance to receive remediation for pre-algebra skills that they were lacking. This spring, the math department is teaching a class called “Strategic Math” for all students earning a D or an F in Algebra 1A in the fall semester. These students will have the opportunity to earn credit for the class, and also to learn pre-algebra standards that are necessary for algebra success. These students will return to Algebra 1A next year, with a better preparation to be successful.
In reference to the goal of expanding enrollment and promotion of the ninth grade team program, the administration, teachers and counselors are working on a program for the 2013-14 school year which will be a four section team (English, Algebra, math and an elective), targeting junior high non-promotees and other at-risk ninth grade students. This will be the first time in school history that a four section team is established with a goal of helping to support struggling students. Additionally, thanks to grade level counseling assignments, we will have to grade level counselors dedicated specifically to the freshmen class to better serve the needs of the students.
Critical Areas for Follow Up
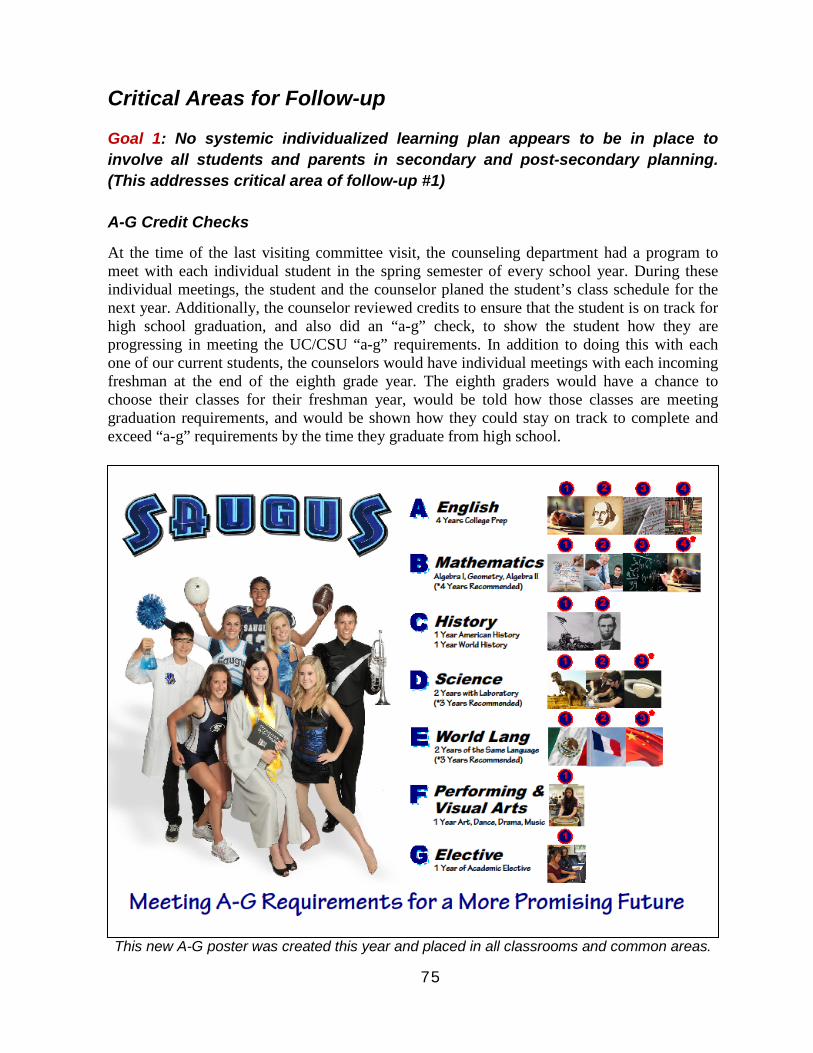
75
Critical Areas for Follow-up
Goal 1: No systemic individualized learning plan appears to be in place to involve all students and parents in secondary and post-secondary planning. (This addresses critical area of follow-up #1) A-G Credit Checks
At the time of the last visiting committee visit, the counseling department had a program to meet with each individual student in the spring semester of every school year. During these individual meetings, the student and the counselor planed the student’s class schedule for the next year. Additionally, the counselor reviewed credits to ensure that the student is on track for high school graduation, and also did an “a-g” check, to show the student how they are progressing in meeting the UC/CSU “a-g” requirements. In addition to doing this with each one of our current students, the counselors would have individual meetings with each incoming freshman at the end of the eighth grade year. The eighth graders would have a chance to choose their classes for their freshman year, would be told how those classes are meeting graduation requirements, and would be shown how they could stay on track to complete and exceed “a-g” requirements by the time they graduate from high school.
This new A-G poster was created this year and placed in all classrooms and common areas.
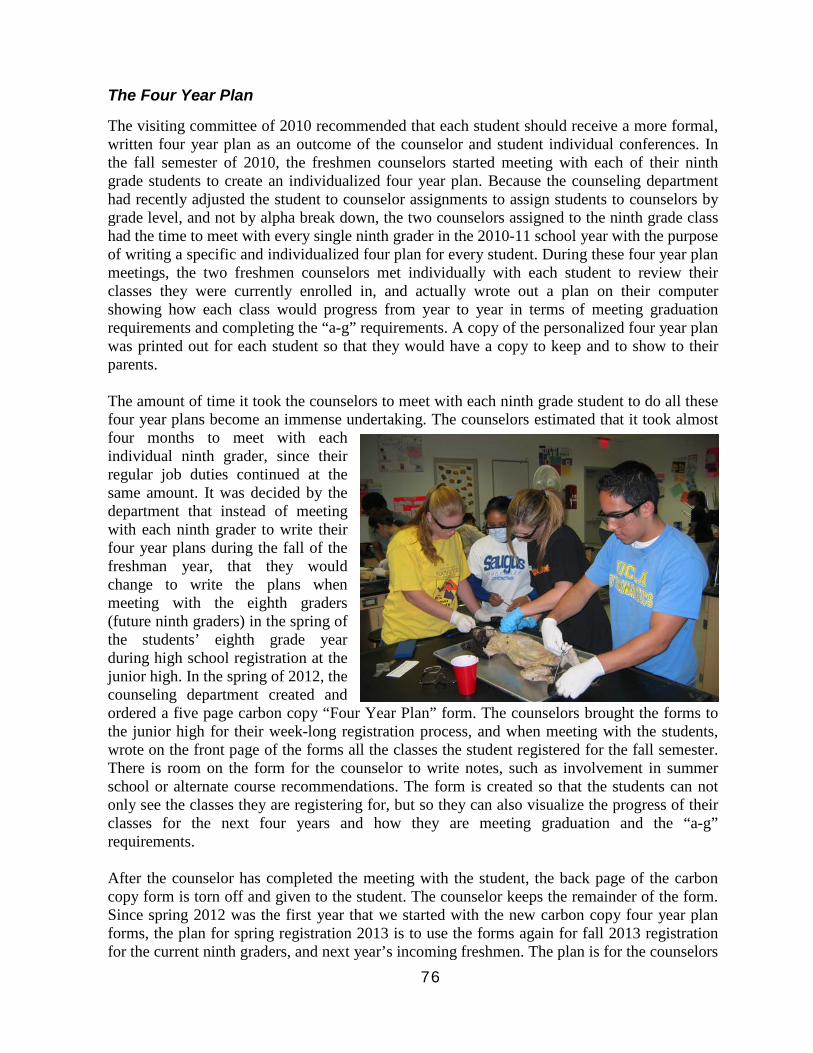
76
The Four Year Plan
The visiting committee of 2010 recommended that each student should receive a more formal, written four year plan as an outcome of the counselor and student individual conferences. In the fall semester of 2010, the freshmen counselors started meeting with each of their ninth grade students to create an individualized four year plan. Because the counseling department had recently adjusted the student to counselor assignments to assign students to counselors by grade level, and not by alpha break down, the two counselors assigned to the ninth grade class had the time to meet with every single ninth grader in the 2010-11 school year with the purpose of writing a specific and individualized four plan for every student. During these four year plan meetings, the two freshmen counselors met individually with each student to review their classes they were currently enrolled in, and actually wrote out a plan on their computer showing how each class would progress from year to year in terms of meeting graduation requirements and completing the “a-g” requirements. A copy of the personalized four year plan was printed out for each student so that they would have a copy to keep and to show to their parents. The amount of time it took the counselors to meet with each ninth grade student to do all these four year plans become an immense undertaking. The counselors estimated that it took almost four months to meet with each individual ninth grader, since their regular job duties continued at the same amount. It was decided by the department that instead of meeting with each ninth grader to write their four year plans during the fall of the freshman year, that they would change to write the plans when meeting with the eighth graders (future ninth graders) in the spring of the students’ eighth grade year during high school registration at the junior high. In the spring of 2012, the counseling department created and ordered a five page carbon copy “Four Year Plan” form. The counselors brought the forms to the junior high for their week-long registration process, and when meeting with the students, wrote on the front page of the forms all the classes the student registered for the fall semester. There is room on the form for the counselor to write notes, such as involvement in summer school or alternate course recommendations. The form is created so that the students can not only see the classes they are registering for, but so they can also visualize the progress of their classes for the next four years and how they are meeting graduation and the “a-g” requirements. After the counselor has completed the meeting with the student, the back page of the carbon copy form is torn off and given to the student. The counselor keeps the remainder of the form. Since spring 2012 was the first year that we started with the new carbon copy four year plan forms, the plan for spring registration 2013 is to use the forms again for fall 2013 registration for the current ninth graders, and next year’s incoming freshmen. The plan is for the counselors

77
to use the same forms, to update the four year plans with the next year’s classes marked, to write updated notes on the side, and then to tear off the next page to give to the student as a receipt of the meeting. This will happen on an annual basis, with a page of the form being given to the student every year until the counselor is left with only one page remaining and the student has received one of the carbon copies every year from their eighth grade year (planning for ninth grade) up until the eleventh grade year (planning for the senior year). New Student Registration System
During this same time period, the counselors made a dramatic change to the way that the registration process is done, one that has vastly improved the procedures. When the counseling department had alpha counseling assignments, teachers would have to bring their entire class into the office for a whole class period, and the counselors would meet with each student in that class assigned to them. With six counselors trying to meet with almost 40 students in less than 55 minutes, it allowed for very little time to discuss and create an individualized learning plan for each student. About all that the counselor had time to do was to do a quick graduation credit check, and then to help the student choose classes for the next school year.
In 2011, the counselors embarked upon a new system of registration that gave them much more time to meet with each student, and also preserved a period of class instructional time that was lost when the teachers had to bring their class to the counseling office for an entire period of class registration. The new system created by the counselors scheduled the two counselors for each grade level to spend three days per class in the core area of a classroom building. Counselors would call students out of the class one at a time to meet with them. During this meeting, much more time was now available to review credits, do an “a-g” completion check, and discuss all the necessary conversation topics between the counselor and the student. With this new system of registration being made possible thanks to the shift to grade level counseling, counselors have much more time to meet and review the individualized learning plans for all of their students. The counselors will continue using the carbon copy four year plan forms for spring 2013 registration for the incoming freshmen and sophomores. They will be meeting with the students in the cores of the classroom buildings once again, freeing up more instructional time for the teachers, and giving the counselors more time to meet with each individual student. The counselors feel very pleased with the progress that has been made towards providing an individualized learning plan to each student. Naviance
One of the most exciting things happening with the counseling department is the new site based license for Naviance, a vocational and college planning software, which all Hart District students have an account for. The counselors are in the beginning stages of learning Naviance and working with the students on Naviance in individual conferences. The counselors are excited about the potential about making four year plans digital with Naviance. We are not at that point in Naviance development yet, but we look forward to maximizing the potential of Naviance to improve and to make digital individualized learning plans for our students.

78
Goal 2: Pacing calendars, common assessments, and use of student data to make instructional decisions are not used consistently in all departments. (This addresses Critical Area of Follow-up #2). Higher Levels of Collaboration
Since the last visiting committee came in 2010, the departments have increased their use of student data in order to better their instructional strategies, to ensure all students are learning, and to make placement decisions. With the continuation of the school’s Planning Wednesday bell schedule, departments are able to meet monthly for department meetings, and another time monthly for department collaboration. In addition to these two types of meetings, there are also Wednesdays used for professional development, faculty meetings, and for focus groups to meet to discuss our school’s action plan and ESLR’s. Looking at CST Data to Improve Instruction
In the science department, the teachers have begun looking closely at student CST scores broken down by strands, and have worked in collaboration time to discuss how to improve areas that are weak and how to improve instruction to strengthen those strands. The science department reports that they have been doing a much more intense analysis of CST scores than they had in the past. Social studies has identified their students scoring Below Basic and Far Below Basic on the CST’s, and has provided them with direct intervention for both the CST’s and the CAHSEE during the Wednesday Planning time. The social studies department reports that they are in the beginning stages of aligning their department assessments with CST data, but they are further along than they were in 2010. Changing Teaching Strategies and Developing Common Assessments
The English department has been using CST scores to help change the way they assess students so that it matches the data they see in standardized tests. For example, English teachers have been preparing and guiding students through writing prompts and using data to re-write department benchmark exams. The English teachers have also been changing the way they teach and assess, based upon data from writing prompts, and other common department assessments. The world language department has been comparing their D and F grades with students earning BB and FBB’s and have been setting department goals to make improvements. By doing a regular analysis of their department’s pass/fail rates, they have been able to set goals for improvement of student achievement. The math department has been analyzing D and F rates to rewrite placement guidelines for pre-requisites for classes. They have also been using CST strand data to rewrite the department’s Algebra I exams. They have also been writing their tests to reflect and align with the format and the look of the CST’s. The algebra teachers have been meeting together to review assessments results, and then reform their teaching. There is an ongoing effort to use data to help implement improvements to curriculum and instruction. Social studies is working towards having summative assessments in their classes. English and science are starting to assign common writing prompts. The ninth grade PE classes have standardized to give the same assignments in all their classes based upon state PE
79
standards. The fine arts department has not only implemented common assessments and is on track to following the common core, but our fine arts department meets quarterly with the other fine arts departments in the district to align their assessments to the standards. Most departments are moving towards the Common Core in anticipation of these new standards. Infinite Campus Providing Greater Access to Data for Teachers
Our teachers report that access to student data has been expanded to help teachers make data-driven instructional decisions. With the new Infinite Campus student information system, teachers now have access to student CST scores, transcripts and credits. The math department has been using CST scores to help guide their placement recommendations for students about which ninth grade classes to enroll in. The science department has begun collaboration with the junior highs to use CST data as one of the primary criteria to look at when deciding how to recommend placement from eighth to ninth grade science classes. The social studies department has been using student CST data to target students for individual and group intervention for CAHSEE and STAR. They have been also using the 10th grade world history and 11th grade US History standards to create common goals, and feel they are in the beginning stages of creating common assessments. In the special education department, the 10th grade resource teachers are focusing on CAHSEE prep, and are also crafting instruction so that it better prepares students for the CST’s. The department feels that is an instructional decision used ahead of the data, but still is relevant for student success. Special education has also been using CST scores to write target goals into student IEP’s.
Goal 3: While a culture of high achievement exists for most students, a schoolwide commitment by staff, faculty, and administration is needed to expand that culture to all students, especially those who do not self-advocate or who have not been targeted for intervention. (This Addresses Critical Area of Follow-up #3) The Growth of AVID
Since the time of our last WASC visit in 2010, we have made some progress in expanding the culture of Saugus High School to focus on all students, including those students who do not self-advocate and those who are not specifically targeted for intervention. Progress has been made both inside and outside of the classroom. Academically, our AVID program has grown from three to five class sections. This year is the first year that we have offered a class only for our seniors and each grade-level has its own class section. The program has grown from two AVID elective teachers to three AVID elective teachers, representing two departments. Expanded Intervention
Our intervention program has also expanded since the time of the last visit. We have teachers in all four tested subject areas plus special education and world language offering tutorials after school on a weekly basis. An intervention calendar is established each semester and published

80
on the school’s website as well as posted in each teacher’s classroom. CAHSEE intervention continues to be offered for all juniors and seniors who still need to pass the exit exam. Counselors meet with each student and enroll them in the class and students are required to attend. As with all afterschool intervention, attendance is an issue, so to address this we hired an instructional assistant to make personal phone calls home each week to students who are not attending. CAHSEE classes continue to be offered second semester within the school day. Since our district is in program improvement for our English Language Learners, we made a concerted effort to make sure all our at-risk 10th grade EL students were placed into a parallel CAHSEE class to better prepare them for the first time they take the CAHSEE in March. Our goal was to ensure that each student not only passed the CAHSEE, but passed it with a score of 380 which is considered proficient according to NCLB. The teachers who were assigned to teach these CAHSEE classes are highly qualified veteran teachers who currently teach advanced or AP courses in their subject areas of math and English. Saturday Academy Assisting All Students
Within in the past three years, our staff has developed Saturday Academy. Saturday Academy is an academic intervention for students who have missing and/or late assignments. Teachers use the referral process to identify students who have one or more missing assignments. Students who attend the Saturday four-hour intervention are allowed to make up missing work for either partial or full credit. Saturday Academy has been instrumental in creating a culture that says “no to the zero” and allows make-up work for full or partial credit. Three years ago, the majority of our teachers did not allow giving credit for late work. Saturday Academy has changed the culture of our school to allow make up late work, even outside of using Saturday Academy. Many teachers are now more willing to allow students to make up late work at home or in their classroom before school or during lunch. We have seen less penalization for late work over the past three years. We believe in the value of all work being turned in on time. Given the option, however, for a student to turn in work late versus not at all, the late work students are still gaining access to the standards and curriculum that we want them to learn. About 75% of our teachers refer students to attend the academy thus allowing students to make up work for full or partial credit, reducing the number of Ds and Fs on our campus. As evidence of the success of our Saturday Academy, spring 2012 was the first time in school history that every senior graduated and participated in the graduation ceremony and we did not have one non-grad. Developing Study Skills Classes
Our special education department saw a need to utilize their resource model more effectively to benefit the general education population. Since the data indicates that our resource model is working effectively, our special education department in conjunction with the district office, developed study skills classes for our general education students. Last year, the district was reviewed by the Office of Civil Rights and found out that the Hart District had a disproportionate number of white male students who qualified for special education services under Other Health Impairment (OHI), specifically ADD or ADHD. As a result of this disproportionality study, the district challenged schools to come up with new ways to intervene for struggling students before being referred for special education testing. In the past, when a
81
student was not being successful, one of the first interventions that we offered to them was a referral for special education testing. Out of this discussion, the special education department created this new general education study skills class. Based on the data, the majority of students in study skills improved their overall grade point averages as a result of learning the strategies needed to become a successful student. In the 2011-12 school year, there were 30 10th grade students enrolled in study skills. Of these 30 students, there was a 53 percent decrease in the number of F’s that these students received on their report cards. The number of students who have decreased the number of F’s from the previous year was 77 percent. Freshman Immersion Day Helping New Students Get Started Well
Two years ago, we developed Freshman Immersion Day to help all incoming 9th graders get acclimated to high school and make it a smooth transition to Saugus High. All incoming ninth graders are invited, and for the past two years, more than 400 of our incoming freshman attended each year. Freshman Immersion Day takes place one day before freshman registration, which is one week before the first day of classes in August. The immersion day starts with an assembly, and then later in the morning there is a rally in the gymnasium, which includes all the student groups that perform in a regular rally; cheerleading, athletics, ASB, dance team, and more. After the rally, students are broken up into smaller groups of 30. The small groups are assigned an 11th or 12th grader to be their guide for the day. These older students are part of a program we started called Common Cents, which pairs up student mentors with younger students. The first contact these “Menturions” have with younger students is on Freshman Immersion Day, when they are assigned to the freshmen when they break apart into the small groups after the assembly. The mentors take the freshman to different 45 minute break-out sessions in classrooms. These sessions have presentations by the ASB on clubs and activities, the counselors on academic guidance, the administrators on school rules and policies, and by teachers on study skills and academic success. At the end of the morning after all students have attended all the break-out sessions, a free lunch is provided to all participants in the freshman day program.

Chapter Five Schoolwide Action Plan
Refinements
82
V. Schoolwide Action Plan Refinements The Leadership team and the entire Saugus High School staff continue to work with the Action Plan that was put into place with the final document from the 2010 visit. The Schoolwide Action Plan and ESLR’s are reviewed at faculty meetings, during collaboration time and in the Focus Group committee format. The Action Plan continues to drive school decisions about leadership, instruction, curriculum, assessment and support for students. Saugus High will continue to use data to drive the decision making process. We are continuing to work on our Action Plan. As stated in Chapter IV of the Schoolwide Report for Action Plan Progress, we have met some of our growth targets in the Action Plan, but still need to raise test scores for all students, because we see a slight trend in the scores decreasing.
We recognize that our growth targets were very ambitious in the 2010 document. In refining the Action Plan, we decided based upon the visiting committee’s recommendation, to narrow down how we are going to measure if we have met that goal or not. We realize that by looking at 2012 student performance data, we have not met many of the growth targets in the 2010 Action Plan. Between now and the next WASC visit, we will be working on making more realistic and attainable growth targets in the Action Plan.
Even though we feel many of the growth targets in the Action Plan were not attained, as written about in the Report on Schoolwide Action Plans and the Critical Areas for Follow Up, most of our tasks as reported on the Action Plan are in the process of being implemented or are now already in place. The revision of the Action Plan shows updates for each task under all relevant columns of the plan. Updates haven been made to show whether a task is currently being implemented, or that the date for implementation is still in the future. We placed a copy of the updated Action Plan in the appendix of this document.
Infusing the Common Core Standards in Future Years
Recognizing that we are committed to the follow-through of our Action Plan, we are also equally dedicated to the implementation of the new Common Core Standards coming our way over the next few years. There will undoubtedly be many challenges as we set sail on these uncharted waters, but our staff and our district are ready to meet each with a strategic plan, confident teachers, and a great deal of energy.
We are poised to establish a concerted focus on the three key shifts in the English Language Arts and Literacy Standards of the Common Core: 1. Building knowledge through content rich nonfiction. 2. Reading and writing that is grounded in evidence from text (both literary and informational). 3. Regular practice with complex texts and its syntax and vocabulary.
We are just as ready to take on the three main shifts in the Mathematics Standards of the Common Core: 1. Focus – Narrowing of topics and an increase in depth. 2. Coherence – Linking concepts across grade levels and topics. 3. Rigor – Pursue with equal intensity:
a. Conceptual understanding b. Procedural Skill and Fluency c. Application

83
We fully recognize that our mindset as educators is to ready students for an awaiting world. That might mean getting many students ready for college, but it surely means preparing them for a workforce that is begging for people who are competent in literacy and numeracy skills as well as the “super skills” (Four C’s): Communication, Collaboration, Critical Thinking, and Creativity.

Chapter V: Saugus High School Schoolwide Action Plan (Revised)
Goal 1 (Raising Proficiency Levels of Subgroups): Raise proficiency levels of students in our special education and Hispanic subgroups through increased literacy and numeracy on all California Standards Tests.
Rationale: Critical Need
Self-Study findings show a need to improve student achievement among the special education population as measured by the state assessment data (CAHSEE and STAR). Reviewing the data below, there is a large discrepancy between the performance levels of students in special education in comparison to the general schoolwide performance level. Reviewing the data shows that there are performance gaps as great as 50 percent in students scoring proficient or above on the 9th grade ELA CST, to gaps ranging from 24 to 28 percent between special education students and the schoolwide population on the CAHSEE. The API for our special education population has been increasing significantly over the past four years. The subgroup API increased from a base API of 572 to 606 between 2006 and 2009, however due to the large increase between 2008 and 2009, the API stayed the same (606) between 2008 and 2009, causing us to not meet our growth target for the special education subgroup in 2009. The achievement gap between the special education subgroup and the schoolwide population has decreased from 257 API points in 2005 to 219 points in 2009. We look to decreasing this achievement gap even more, and expect a focus on literacy and numeracy skills to help us achieve this goal. There is also a discrepancy between the performance data of our Hispanic subgroup and the schoolwide population. The discrepancies ranged from a 17-point discrepancy in three CST’s (9th grade English, Biology and Earth Science) to a one point discrepancy in tenth grade Algebra I. On the CAHSEE, the score discrepancy was seven percentage points on both the ELA and math portion of the exit exam. Even though a seven point discrepancy is much smaller than the achievement gap between the special ed students and the schoolwide population, the achievement gap for Hispanic students as measured by CAHSEE passing percentages has grown to seven points from four points in math and two points in ELA on the March 2005 testing. This shows a critical need to address the growing achievement gap between the Hispanic subgroup and the schoolwide population as measured on the CAHSEE. Additionally, the achievement gap as measured by the API has increased. There was a 51 point gap in 2006, with the Hispanic subgroup having an API of 739 compared to the schoolwide API to 790. In 2009, the Hispanic subgroup had an API of 753 compared to the schoolwide total of 807, a gap of 54, increasing by three points over the past four years. While meeting in Home and Focus Groups to analyze data, the school’s stakeholders found that there existed these large discrepancies between the performance of the special education students compared to the schoolwide population. Conversations began about how best to improve literacy and numeracy skills for these students, acknowledging that there is a need to create effective instructional strategies in order to see greater performance levels on standardized tests. Due to Saugus High’s resource program mainstreaming special education students in the four tested areas of English, math, history and science, the general education teachers spoke in their groups of a need to increase effective teaching strategies in reading comprehension, writing and problem solving skills in order to ensure equitable access to rigorous curriculum for the special education students.
Supporting 2008-2009 Data
Students Scoring Proficient or Above on 2009 California Standards Test
SpEd Hispanic Schoolwide SpEd Hispanic Schoolwide E/LA 9th Grade 20% 53% 70% Algebra I 9th Grade 31% 27% 38% 10th Grade 13% 47% 61% 10th Grade 11% 24% 25% 11th Grade 10% 49% 57% 11th Grade 0% 4% 9%
Modern Civ. 17% 48% 55% US History 10% 45% 56%
Biology 9th Grade 17% 40% 57% Earth Science 10th Grade 25% 40% 57%

California High School Exit Exam (CAHSEE) 2009 Passing Rates Sp Ed Hispanic Schoolwide
10th Grade English/L. Arts 66% 87% 94% 10th Grade Math 71% 88% 95%
Growth Targets 2009-10 -We will decrease the achievement gaps between the subgroups and the schoolwide population scoring on the CAHSEE ELA and math subtests by two
percent, without decreasing the performance levels of the schoolwide population. 2009-11 -We will decrease the achievement gaps between the subgroups and the schoolwide population as measured on the CAHSEE by five percent within three
years. 2009-12 -We will increase by five percent the number of ninth graders in our subgroups scoring proficient or above on the ninth grade CST’s of Biology, Algebra and
English. 2009-12 -We will increase by five percent the number of tenth and eleventh graders in our significant subgroups scoring proficient or above on the CST’s of history
and science. 2009-12 -We will resume and continue to meet API growth targets for both significant subgroups.
ESLR’s Addressed
1: Students will demonstrate academic competency by comprehending written material, writing clearly, analyzing and solving problems and using technology effectively. 3: Students will demonstrate intellectual development by strengthening, appreciating and utilizing the skills of critical and creative thinking.
Impact on student learning of academic standards and ESLR’s
A targeted increase in effective teaching strategies in literacy and numeracy skills will result in a steady progress in closing the achievement gap between the special education subgroup and the schoolwide population.
Tools for Monitoring Progress • California Standards Test data (CST’s) • CAHSEE scores • Common assessments
Reporting of Progress
Data Reporting: • Progress on special education student performance is reported annually to the staff. • Additional detailed information will be provided to Home Groups in order to review the progress made by each department in raising the CST and CAHSEE scores
for special education students. • Administration will lead department chairs in supplemental data analysis of special education performance to bring back to departments to analyze and use as
supporting information in creating new and effective teaching strategies to increase literacy and numeracy skills. • Saugus High’s Professional Development team will continue to instruct the school staff on new and improved methods of collecting and analyzing data (such as
IDMS, SASI, etc.) as a means of monitoring performance of special education students, with an added emphasis of general education teachers being better able to disaggregate data specific to their special education students to compare their performance levels in comparison to the levels of their general ed students.
Action Plan Progress: • Administrators, WASC leadership team, Saugus High’s Professional Development team and Action Plan group leaders will report progress annually to all school
stakeholders, including but not limited to the School Site Council, the Parent Student Advisory Council (PTSA), professional development collaboration meetings, and within the Single Plan for Student Achievement.
• Action Groups will meet annually to monitor and be updated on the progress towards meeting this goal.

Tasks
Action Plan #1 Responsible Stakeholders
Resources Means to Assess Improvement
Timeline Reporting
• Develop a protocol for each department to look at how they are addressing the needs of student subgroups
• Teachers • Administrators • Counselors • Department Chairs
• Collaboration time to work within and between departments
• Regular review of data
• In progress on a semesterly basis
• Department Chair meetings
• Faculty Meetings
• Identify specific student with needs using IDMS and Infinite Campus. Use this data to drive decisions about intervention placement and student schedules
• Teachers • Administrators • Counselors • Department Chairs • Intervention
coordinator
• Continued training in IDMS
• IDMS and Infinite Campus ad-hocs to identify students based upon an identified criteria
• IDMS and IC ad-hoc data
• Number of D and F grades
• Student proficiency levels
• In progress on a semesterly basis
• Faculty and department chair meetings
• Maintain Safe Schools Ambassadors program
• Administrator • Counselor • Safe Schools
Ambassadors coordinator
• Training and recruitment of staff and students
• Year-end evaluation
• Fall 2012 was the most recent SSA training. The group meets on a weekly basis
• Number of reported incidents
• Encourage students in subgroups to participate more in clubs and activities
• ASB Director • Club advisors • Intramural director • Faculty and staff
• Data reports of BB and FBB students to ASB and club advisors
• Report providing information about student participations
• We have a club day every semester. We also now have the Elective Opportunity Day every March.
• Faculty meetings • School media
• Promote AVID participation as an opportunity for students from subgroups
• Administration • AVID Coordinator • Counselors • Teachers
• District Financial and Personnel Support
• Continued training in AVID strategies and techniques
• Attendance at AVID training conferences
• Increased number of students participating in the AVID program
• Increased number of sections of AVID in the master schedule
• We recruit students every spring to interview to be a part of the AVID program.
• Annual AVID certification and data report
• Develop a schoolwide plan for the integration of reading and writing across all departments.
• All departments • Administrators • Professional
development team
• Professional Development team
• District office training
• Collaboration meetings between departments
• This is an ongoing process measured during collaboration time and professional development
• Benchmark exams, CST’s and other tests
• Department Chairs
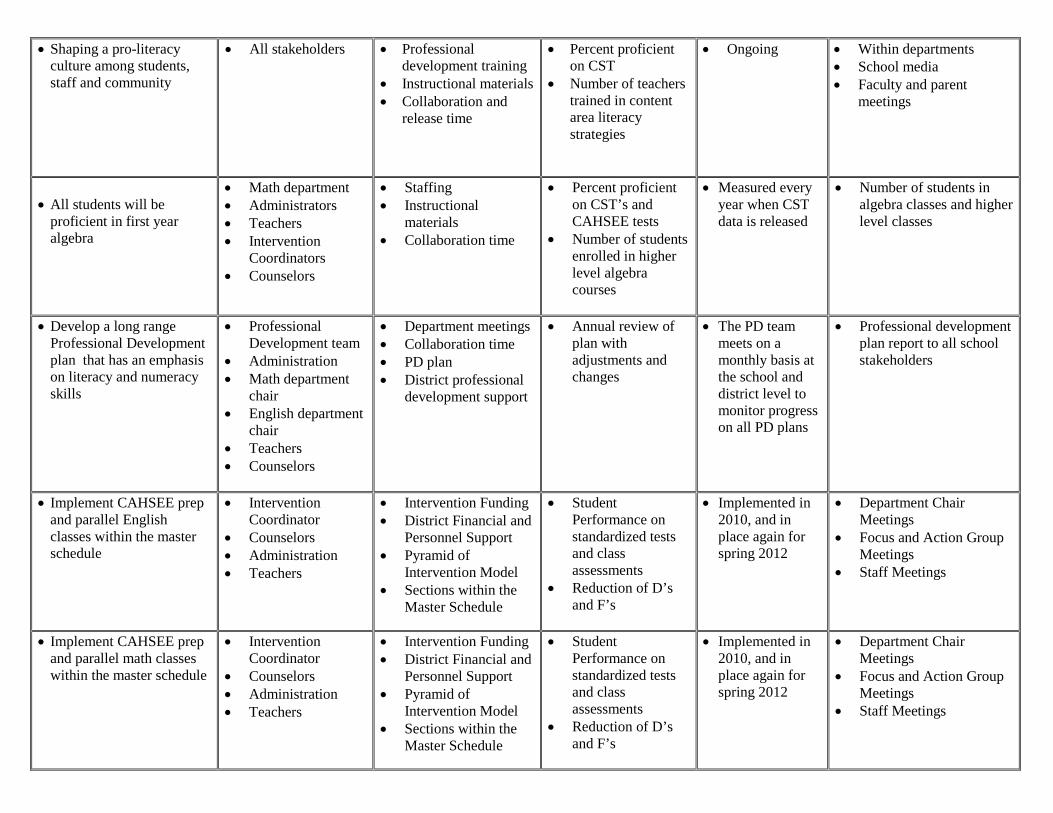
• Shaping a pro-literacy culture among students, staff and community
• All stakeholders • Professional development training
• Instructional materials • Collaboration and
release time
• Percent proficient on CST
• Number of teachers trained in content area literacy strategies
• Ongoing • Within departments • School media • Faculty and parent
meetings
• All students will be
proficient in first year algebra
• Math department • Administrators • Teachers • Intervention
Coordinators • Counselors
• Staffing • Instructional
materials • Collaboration time
• Percent proficient on CST’s and CAHSEE tests
• Number of students enrolled in higher level algebra courses
• Measured every year when CST data is released
• Number of students in algebra classes and higher level classes
• Develop a long range Professional Development plan that has an emphasis on literacy and numeracy skills
• Professional Development team
• Administration • Math department
chair • English department
chair • Teachers • Counselors
• Department meetings • Collaboration time • PD plan • District professional
development support
• Annual review of plan with adjustments and changes
• The PD team meets on a monthly basis at the school and district level to monitor progress on all PD plans
• Professional development plan report to all school stakeholders
• Implement CAHSEE prep and parallel English classes within the master schedule
• Intervention Coordinator
• Counselors • Administration • Teachers
• Intervention Funding • District Financial and
Personnel Support • Pyramid of
Intervention Model • Sections within the
Master Schedule
• Student Performance on standardized tests and class assessments
• Reduction of D’s and F’s
• Implemented in 2010, and in place again for spring 2012
• Department Chair Meetings
• Focus and Action Group Meetings
• Staff Meetings
• Implement CAHSEE prep and parallel math classes within the master schedule
• Intervention Coordinator
• Counselors • Administration • Teachers
• Intervention Funding • District Financial and
Personnel Support • Pyramid of
Intervention Model • Sections within the
Master Schedule
• Student Performance on standardized tests and class assessments
• Reduction of D’s and F’s
• Implemented in 2010, and in place again for spring 2012
• Department Chair Meetings
• Focus and Action Group Meetings
• Staff Meetings
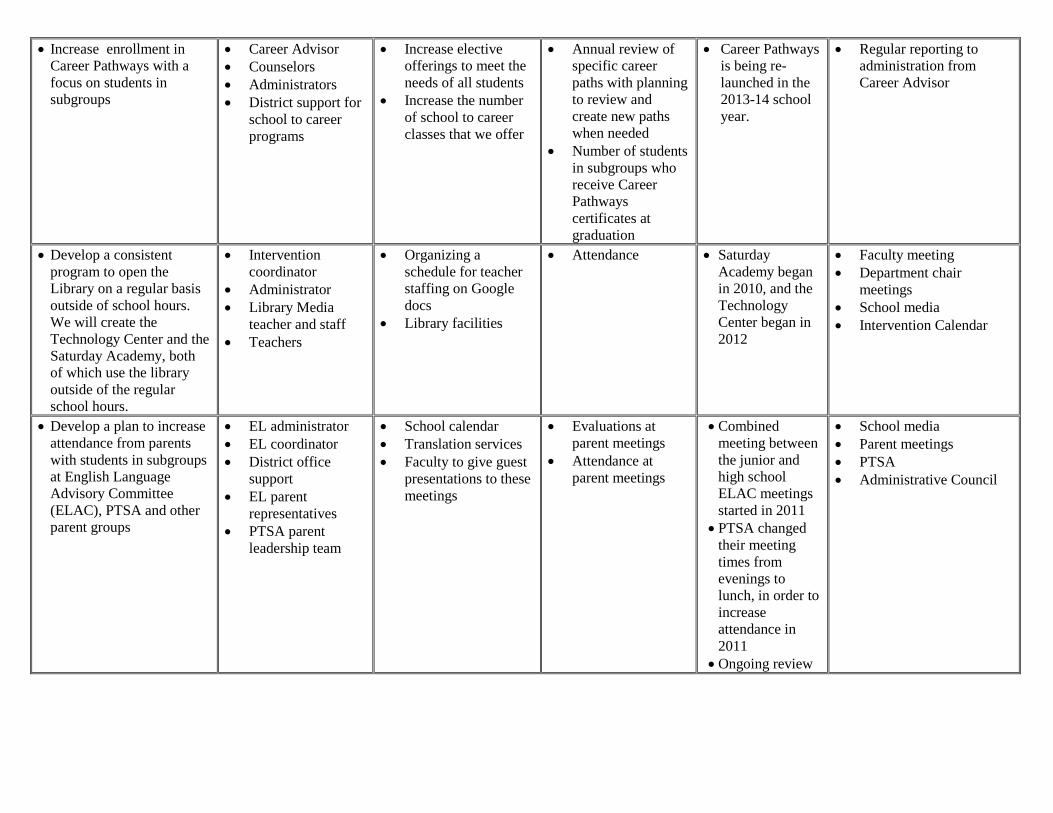
• Increase enrollment in Career Pathways with a focus on students in subgroups
• Career Advisor • Counselors • Administrators • District support for
school to career programs
• Increase elective offerings to meet the needs of all students
• Increase the number of school to career classes that we offer
• Annual review of specific career paths with planning to review and create new paths when needed
• Number of students in subgroups who receive Career Pathways certificates at graduation
• Career Pathways is being re-launched in the 2013-14 school year.
• Regular reporting to administration from Career Advisor
• Develop a consistent program to open the Library on a regular basis outside of school hours. We will create the Technology Center and the Saturday Academy, both of which use the library outside of the regular school hours.
• Intervention coordinator
• Administrator • Library Media
teacher and staff • Teachers
• Organizing a schedule for teacher staffing on Google docs
• Library facilities
• Attendance
• Saturday Academy began in 2010, and the Technology Center began in 2012
• Faculty meeting • Department chair
meetings • School media • Intervention Calendar
• Develop a plan to increase attendance from parents with students in subgroups at English Language Advisory Committee (ELAC), PTSA and other parent groups
• EL administrator • EL coordinator • District office
support • EL parent
representatives • PTSA parent
leadership team
• School calendar • Translation services • Faculty to give guest
presentations to these meetings
• Evaluations at parent meetings
• Attendance at parent meetings
• Combined meeting between the junior and high school ELAC meetings started in 2011
• PTSA changed their meeting times from evenings to lunch, in order to increase attendance in 2011
• Ongoing review
• School media • Parent meetings • PTSA • Administrative Council
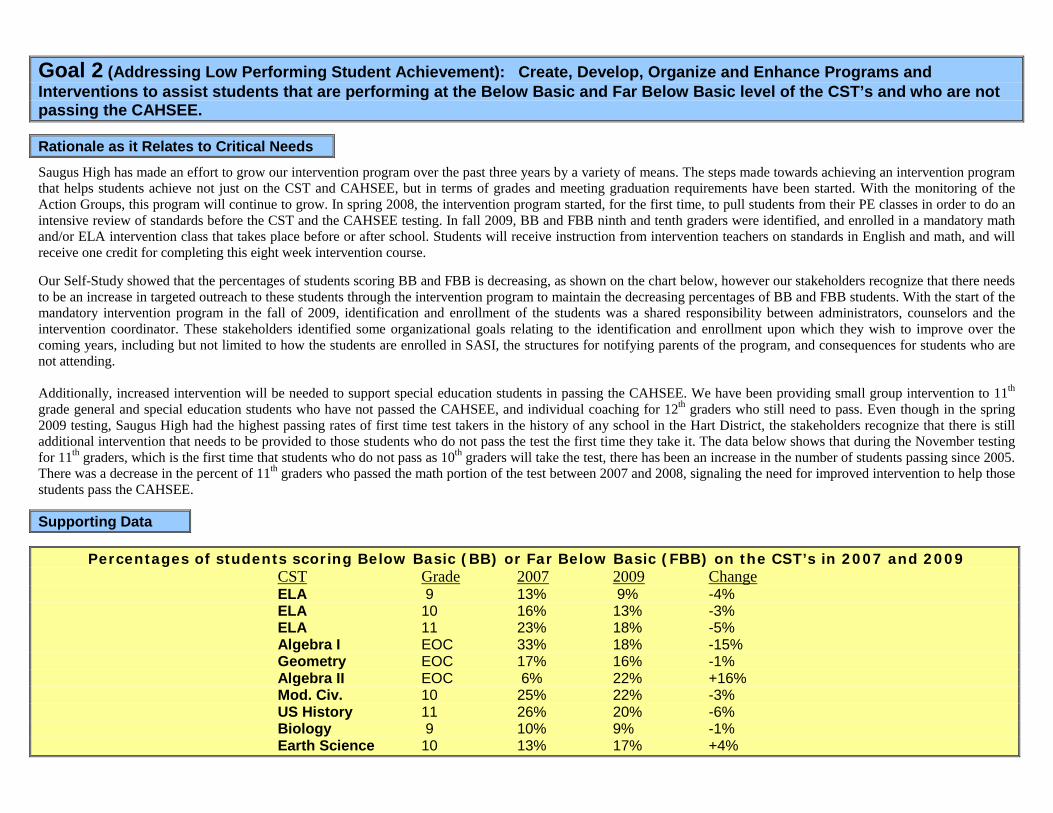
Goal 2 (Addressing Low Performing Student Achievement): Create, Develop, Organize and Enhance Programs and Interventions to assist students that are performing at the Below Basic and Far Below Basic level of the CST’s and who are not passing the CAHSEE.
Rationale as it Relates to Critical Needs
Saugus High has made an effort to grow our intervention program over the past three years by a variety of means. The steps made towards achieving an intervention program that helps students achieve not just on the CST and CAHSEE, but in terms of grades and meeting graduation requirements have been started. With the monitoring of the Action Groups, this program will continue to grow. In spring 2008, the intervention program started, for the first time, to pull students from their PE classes in order to do an intensive review of standards before the CST and the CAHSEE testing. In fall 2009, BB and FBB ninth and tenth graders were identified, and enrolled in a mandatory math and/or ELA intervention class that takes place before or after school. Students will receive instruction from intervention teachers on standards in English and math, and will receive one credit for completing this eight week intervention course.
Our Self-Study showed that the percentages of students scoring BB and FBB is decreasing, as shown on the chart below, however our stakeholders recognize that there needs to be an increase in targeted outreach to these students through the intervention program to maintain the decreasing percentages of BB and FBB students. With the start of the mandatory intervention program in the fall of 2009, identification and enrollment of the students was a shared responsibility between administrators, counselors and the intervention coordinator. These stakeholders identified some organizational goals relating to the identification and enrollment upon which they wish to improve over the coming years, including but not limited to how the students are enrolled in SASI, the structures for notifying parents of the program, and consequences for students who are not attending. Additionally, increased intervention will be needed to support special education students in passing the CAHSEE. We have been providing small group intervention to 11th grade general and special education students who have not passed the CAHSEE, and individual coaching for 12th graders who still need to pass. Even though in the spring 2009 testing, Saugus High had the highest passing rates of first time test takers in the history of any school in the Hart District, the stakeholders recognize that there is still additional intervention that needs to be provided to those students who do not pass the test the first time they take it. The data below shows that during the November testing for 11th graders, which is the first time that students who do not pass as 10th graders will take the test, there has been an increase in the number of students passing since 2005. There was a decrease in the percent of 11th graders who passed the math portion of the test between 2007 and 2008, signaling the need for improved intervention to help those students pass the CAHSEE.
Supporting Data
Percentages of students scoring Below Basic (BB) or Far Below Basic (FBB) on the CST’s in 2007 and 2009 CST Grade 2007 2009 Change ELA 9 13% 9% -4% ELA 10 16% 13% -3% ELA 11 23% 18% -5% Algebra I EOC 33% 18% -15% Geometry EOC 17% 16% -1% Algebra II EOC 6% 22% +16% Mod. Civ. 10 25% 22% -3% US History 11 26% 20% -6% Biology 9 10% 9% -1% Earth Science 10 13% 17% +4%
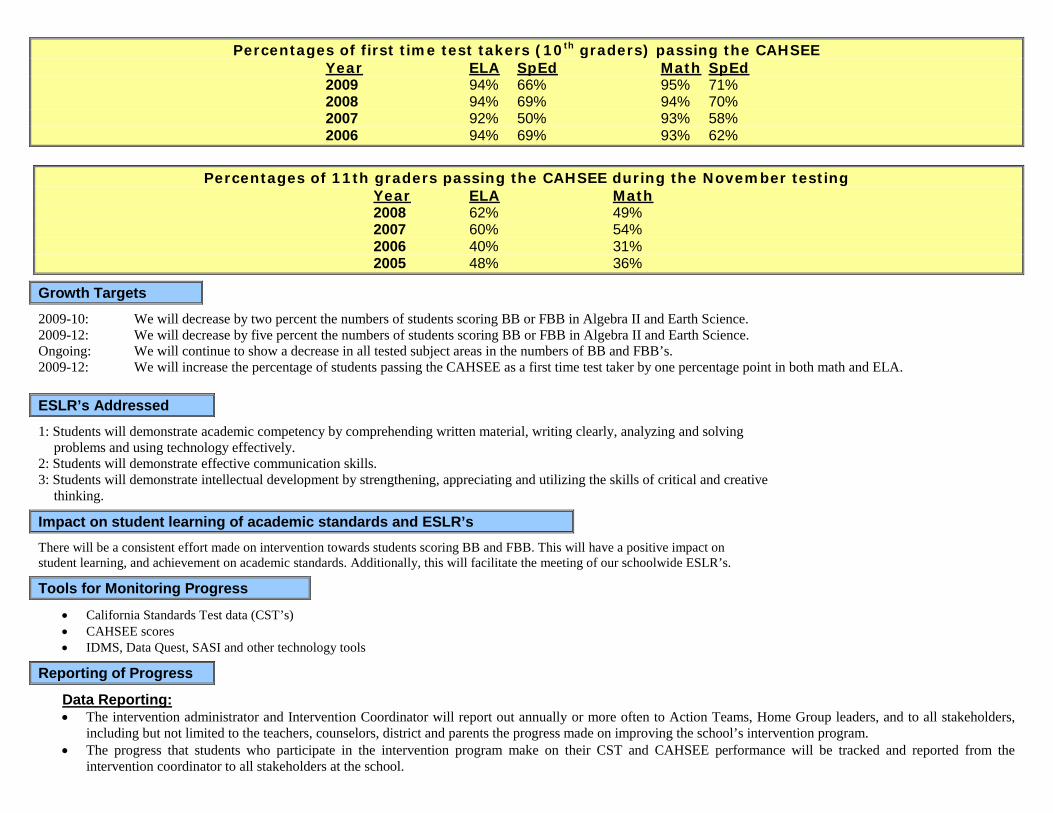
Percentages of first time test takers (10th graders) passing the CAHSEE Year ELA SpEd Math SpEd 2009 94% 66% 95% 71% 2008 94% 69% 94% 70% 2007 92% 50% 93% 58% 2006 94% 69% 93% 62%
Percentages of 11th graders passing the CAHSEE during the November testing
Year ELA Math 2008 62% 49% 2007 60% 54% 2006 40% 31% 2005 48% 36%
Growth Targets
2009-10: We will decrease by two percent the numbers of students scoring BB or FBB in Algebra II and Earth Science. 2009-12: We will decrease by five percent the numbers of students scoring BB or FBB in Algebra II and Earth Science. Ongoing: We will continue to show a decrease in all tested subject areas in the numbers of BB and FBB’s. 2009-12: We will increase the percentage of students passing the CAHSEE as a first time test taker by one percentage point in both math and ELA. ESLR’s Addressed
1: Students will demonstrate academic competency by comprehending written material, writing clearly, analyzing and solving problems and using technology effectively. 2: Students will demonstrate effective communication skills. 3: Students will demonstrate intellectual development by strengthening, appreciating and utilizing the skills of critical and creative thinking.
Impact on student learning of academic standards and ESLR’s
There will be a consistent effort made on intervention towards students scoring BB and FBB. This will have a positive impact on student learning, and achievement on academic standards. Additionally, this will facilitate the meeting of our schoolwide ESLR’s.
Tools for Monitoring Progress
• California Standards Test data (CST’s) • CAHSEE scores • IDMS, Data Quest, SASI and other technology tools
Reporting of Progress
Data Reporting: • The intervention administrator and Intervention Coordinator will report out annually or more often to Action Teams, Home Group leaders, and to all stakeholders,
including but not limited to the teachers, counselors, district and parents the progress made on improving the school’s intervention program. • The progress that students who participate in the intervention program make on their CST and CAHSEE performance will be tracked and reported from the
intervention coordinator to all stakeholders at the school.
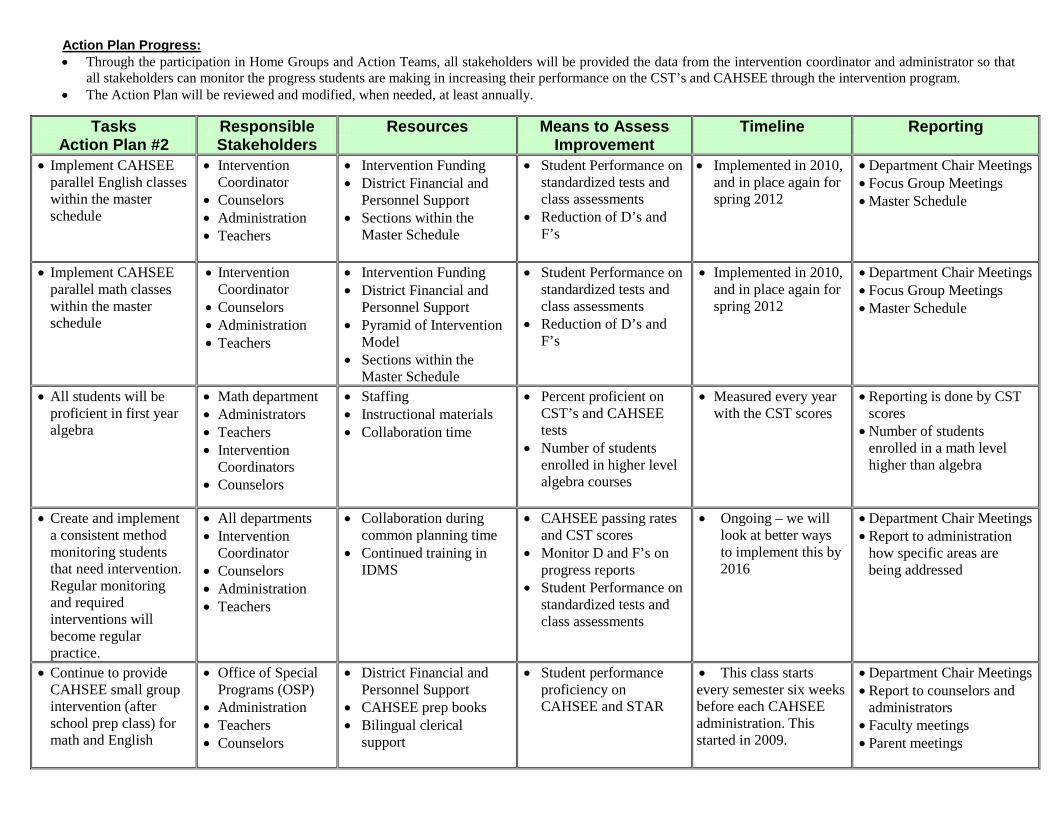
Action Plan Progress: • Through the participation in Home Groups and Action Teams, all stakeholders will be provided the data from the intervention coordinator and administrator so that
all stakeholders can monitor the progress students are making in increasing their performance on the CST’s and CAHSEE through the intervention program. • The Action Plan will be reviewed and modified, when needed, at least annually.
Tasks Action Plan #2
Responsible Stakeholders
Resources Means to Assess Improvement
Timeline Reporting
• Implement CAHSEE parallel English classes within the master schedule
• Intervention Coordinator
• Counselors • Administration • Teachers
• Intervention Funding • District Financial and
Personnel Support • Sections within the
Master Schedule
• Student Performance on standardized tests and class assessments
• Reduction of D’s and F’s
• Implemented in 2010, and in place again for spring 2012
• Department Chair Meetings • Focus Group Meetings • Master Schedule
• Implement CAHSEE parallel math classes within the master schedule
• Intervention Coordinator
• Counselors • Administration • Teachers
• Intervention Funding • District Financial and
Personnel Support • Pyramid of Intervention
Model • Sections within the
Master Schedule
• Student Performance on standardized tests and class assessments
• Reduction of D’s and F’s
• Implemented in 2010, and in place again for spring 2012
• Department Chair Meetings • Focus Group Meetings • Master Schedule
• All students will be proficient in first year algebra
• Math department • Administrators • Teachers • Intervention
Coordinators • Counselors
• Staffing • Instructional materials • Collaboration time
• Percent proficient on CST’s and CAHSEE tests
• Number of students enrolled in higher level algebra courses
• Measured every year with the CST scores
• Reporting is done by CST scores
• Number of students enrolled in a math level higher than algebra
• Create and implement a consistent method monitoring students that need intervention. Regular monitoring and required interventions will become regular practice.
• All departments • Intervention
Coordinator • Counselors • Administration • Teachers
• Collaboration during common planning time
• Continued training in IDMS
• CAHSEE passing rates and CST scores
• Monitor D and F’s on progress reports
• Student Performance on standardized tests and class assessments
• Ongoing – we will look at better ways to implement this by 2016
• Department Chair Meetings • Report to administration
how specific areas are being addressed
• Continue to provide CAHSEE small group intervention (after school prep class) for math and English
• Office of Special Programs (OSP)
• Administration • Teachers • Counselors
• District Financial and Personnel Support
• CAHSEE prep books • Bilingual clerical
support
• Student performance proficiency on CAHSEE and STAR
• This class starts every semester six weeks before each CAHSEE administration. This started in 2009.
• Department Chair Meetings • Report to counselors and
administrators • Faculty meetings • Parent meetings
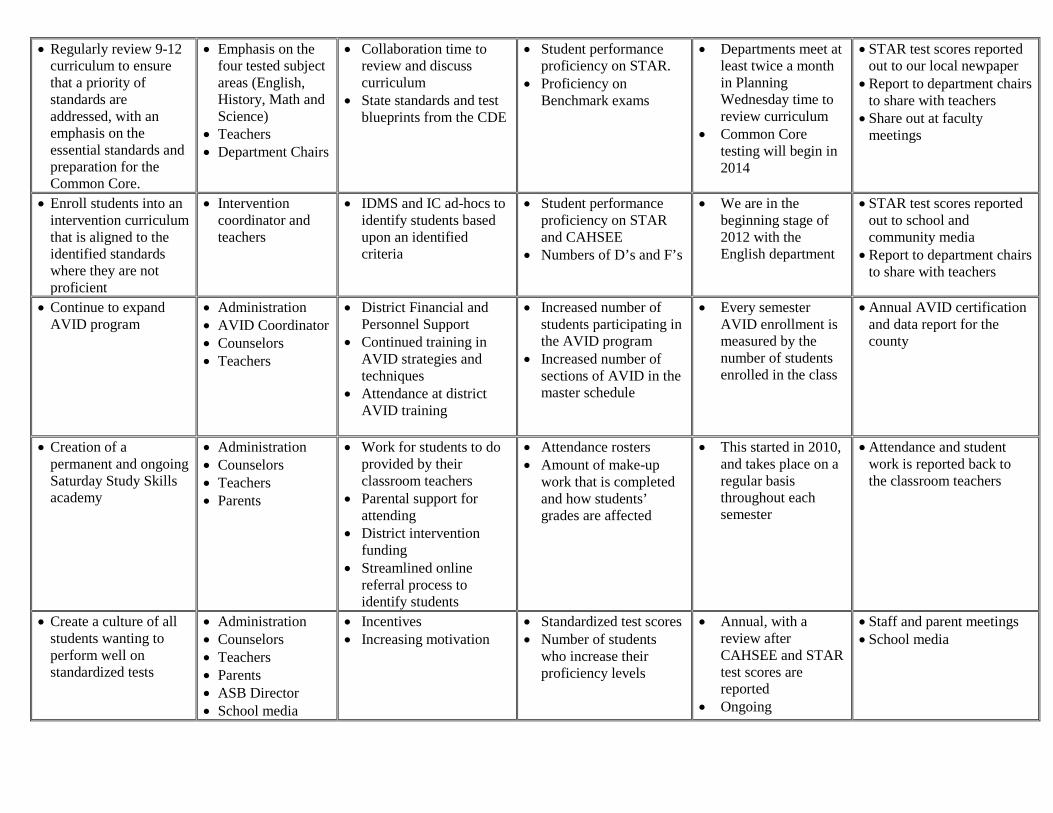
• Regularly review 9-12 curriculum to ensure that a priority of standards are addressed, with an emphasis on the essential standards and preparation for the Common Core.
• Emphasis on the four tested subject areas (English, History, Math and Science)
• Teachers • Department Chairs
• Collaboration time to review and discuss curriculum
• State standards and test blueprints from the CDE
• Student performance proficiency on STAR.
• Proficiency on Benchmark exams
• Departments meet at least twice a month in Planning Wednesday time to review curriculum
• Common Core testing will begin in 2014
• STAR test scores reported out to our local newpaper
• Report to department chairs to share with teachers
• Share out at faculty meetings
• Enroll students into an intervention curriculum that is aligned to the identified standards where they are not proficient
• Intervention coordinator and teachers
• IDMS and IC ad-hocs to identify students based upon an identified criteria
• Student performance proficiency on STAR and CAHSEE
• Numbers of D’s and F’s
• We are in the beginning stage of 2012 with the English department
• STAR test scores reported out to school and community media
• Report to department chairs to share with teachers
• Continue to expand AVID program
• Administration • AVID Coordinator • Counselors • Teachers
• District Financial and Personnel Support
• Continued training in AVID strategies and techniques
• Attendance at district AVID training
• Increased number of students participating in the AVID program
• Increased number of sections of AVID in the master schedule
• Every semester AVID enrollment is measured by the number of students enrolled in the class
• Annual AVID certification and data report for the county
• Creation of a permanent and ongoing Saturday Study Skills academy
• Administration • Counselors • Teachers • Parents
• Work for students to do provided by their classroom teachers
• Parental support for attending
• District intervention funding
• Streamlined online referral process to identify students
• Attendance rosters • Amount of make-up
work that is completed and how students’ grades are affected
• This started in 2010, and takes place on a regular basis throughout each semester
• Attendance and student work is reported back to the classroom teachers
• Create a culture of all students wanting to perform well on standardized tests
• Administration • Counselors • Teachers • Parents • ASB Director • School media
• Incentives • Increasing motivation
• Standardized test scores • Number of students
who increase their proficiency levels
• Annual, with a review after CAHSEE and STAR test scores are reported
• Ongoing
• Staff and parent meetings • School media
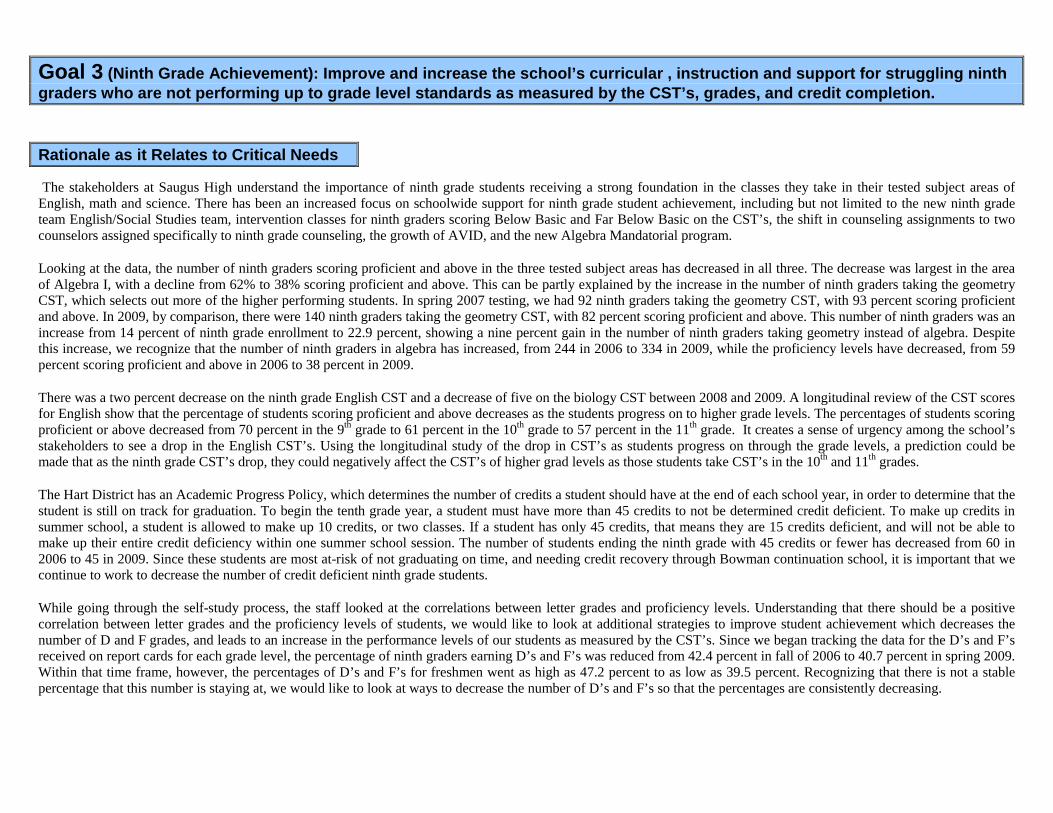
Goal 3 (Ninth Grade Achievement): Improve and increase the school’s curricular , instruction and support for struggling ninth graders who are not performing up to grade level standards as measured by the CST’s, grades, and credit completion.
Rationale as it Relates to Critical Needs
The stakeholders at Saugus High understand the importance of ninth grade students receiving a strong foundation in the classes they take in their tested subject areas of English, math and science. There has been an increased focus on schoolwide support for ninth grade student achievement, including but not limited to the new ninth grade team English/Social Studies team, intervention classes for ninth graders scoring Below Basic and Far Below Basic on the CST’s, the shift in counseling assignments to two counselors assigned specifically to ninth grade counseling, the growth of AVID, and the new Algebra Mandatorial program. Looking at the data, the number of ninth graders scoring proficient and above in the three tested subject areas has decreased in all three. The decrease was largest in the area of Algebra I, with a decline from 62% to 38% scoring proficient and above. This can be partly explained by the increase in the number of ninth graders taking the geometry CST, which selects out more of the higher performing students. In spring 2007 testing, we had 92 ninth graders taking the geometry CST, with 93 percent scoring proficient and above. In 2009, by comparison, there were 140 ninth graders taking the geometry CST, with 82 percent scoring proficient and above. This number of ninth graders was an increase from 14 percent of ninth grade enrollment to 22.9 percent, showing a nine percent gain in the number of ninth graders taking geometry instead of algebra. Despite this increase, we recognize that the number of ninth graders in algebra has increased, from 244 in 2006 to 334 in 2009, while the proficiency levels have decreased, from 59 percent scoring proficient and above in 2006 to 38 percent in 2009. There was a two percent decrease on the ninth grade English CST and a decrease of five on the biology CST between 2008 and 2009. A longitudinal review of the CST scores for English show that the percentage of students scoring proficient and above decreases as the students progress on to higher grade levels. The percentages of students scoring proficient or above decreased from 70 percent in the 9th grade to 61 percent in the 10th grade to 57 percent in the 11th grade. It creates a sense of urgency among the school’s stakeholders to see a drop in the English CST’s. Using the longitudinal study of the drop in CST’s as students progress on through the grade levels, a prediction could be made that as the ninth grade CST’s drop, they could negatively affect the CST’s of higher grad levels as those students take CST’s in the 10th and 11th grades. The Hart District has an Academic Progress Policy, which determines the number of credits a student should have at the end of each school year, in order to determine that the student is still on track for graduation. To begin the tenth grade year, a student must have more than 45 credits to not be determined credit deficient. To make up credits in summer school, a student is allowed to make up 10 credits, or two classes. If a student has only 45 credits, that means they are 15 credits deficient, and will not be able to make up their entire credit deficiency within one summer school session. The number of students ending the ninth grade with 45 credits or fewer has decreased from 60 in 2006 to 45 in 2009. Since these students are most at-risk of not graduating on time, and needing credit recovery through Bowman continuation school, it is important that we continue to work to decrease the number of credit deficient ninth grade students. While going through the self-study process, the staff looked at the correlations between letter grades and proficiency levels. Understanding that there should be a positive correlation between letter grades and the proficiency levels of students, we would like to look at additional strategies to improve student achievement which decreases the number of D and F grades, and leads to an increase in the performance levels of our students as measured by the CST’s. Since we began tracking the data for the D’s and F’s received on report cards for each grade level, the percentage of ninth graders earning D’s and F’s was reduced from 42.4 percent in fall of 2006 to 40.7 percent in spring 2009. Within that time frame, however, the percentages of D’s and F’s for freshmen went as high as 47.2 percent to as low as 39.5 percent. Recognizing that there is not a stable percentage that this number is staying at, we would like to look at ways to decrease the number of D’s and F’s so that the percentages are consistently decreasing.
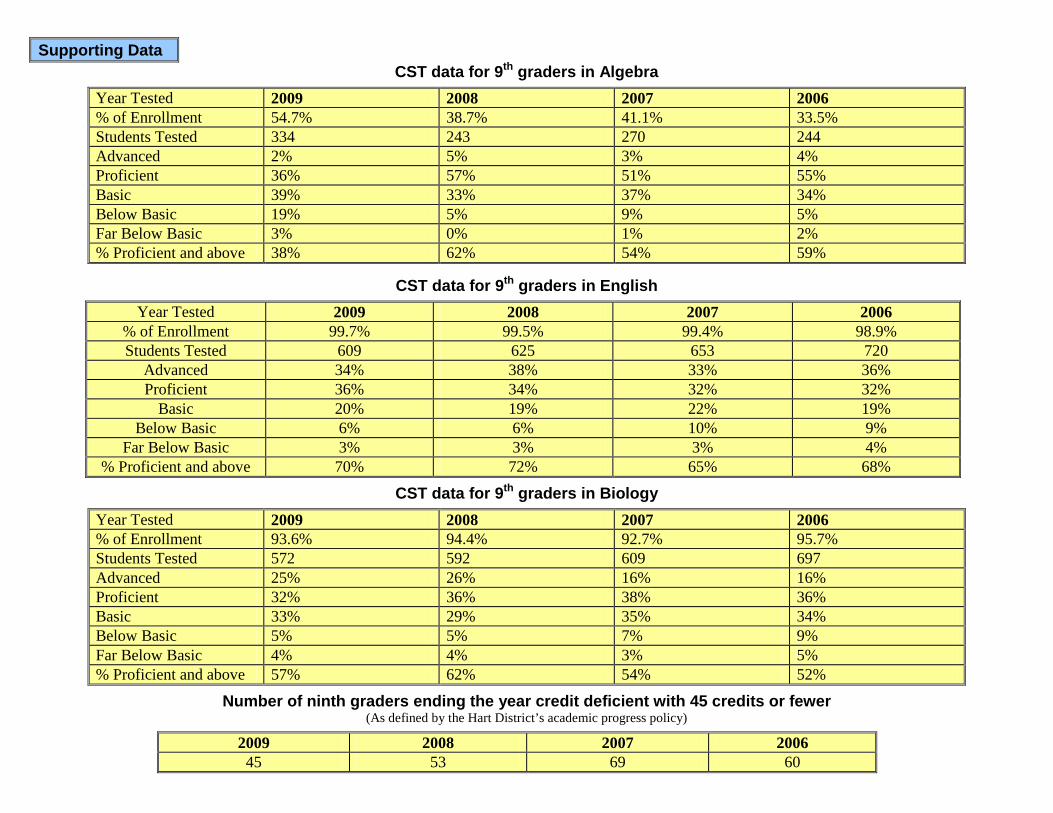
Supporting Data CST data for 9th graders in Algebra
Year Tested 2009 2008 2007 2006 % of Enrollment 54.7% 38.7% 41.1% 33.5% Students Tested 334 243 270 244 Advanced 2% 5% 3% 4% Proficient 36% 57% 51% 55% Basic 39% 33% 37% 34% Below Basic 19% 5% 9% 5% Far Below Basic 3% 0% 1% 2% % Proficient and above 38% 62% 54% 59%
CST data for 9th graders in English
Year Tested 2009 2008 2007 2006 % of Enrollment 99.7% 99.5% 99.4% 98.9% Students Tested 609 625 653 720
Advanced 34% 38% 33% 36% Proficient 36% 34% 32% 32%
Basic 20% 19% 22% 19% Below Basic 6% 6% 10% 9%
Far Below Basic 3% 3% 3% 4% % Proficient and above 70% 72% 65% 68%
CST data for 9th graders in Biology
Year Tested 2009 2008 2007 2006 % of Enrollment 93.6% 94.4% 92.7% 95.7% Students Tested 572 592 609 697 Advanced 25% 26% 16% 16% Proficient 32% 36% 38% 36% Basic 33% 29% 35% 34% Below Basic 5% 5% 7% 9% Far Below Basic 4% 4% 3% 5% % Proficient and above 57% 62% 54% 52%
Number of ninth graders ending the year credit deficient with 45 credits or fewer (As defined by the Hart District’s academic progress policy)
2009 2008 2007 2006 45 53 69 60
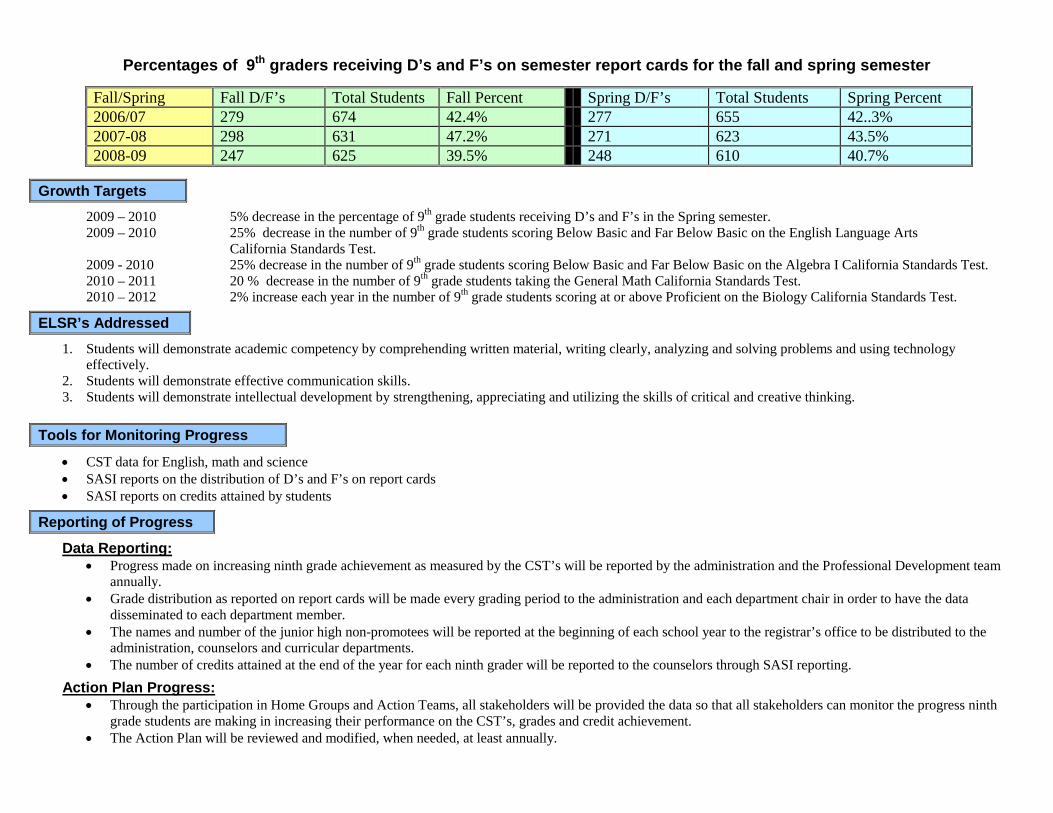
Percentages of 9th graders receiving D’s and F’s on semester report cards for the fall and spring semester
Fall/Spring Fall D/F’s Total Students Fall Percent Spring D/F’s Total Students Spring Percent 2006/07 279 674 42.4% 277 655 42..3% 2007-08 298 631 47.2% 271 623 43.5% 2008-09 247 625 39.5% 248 610 40.7%
Growth Targets
2009 – 2010 5% decrease in the percentage of 9th grade students receiving D’s and F’s in the Spring semester. 2009 – 2010 25% decrease in the number of 9th grade students scoring Below Basic and Far Below Basic on the English Language Arts California Standards Test. 2009 - 2010 25% decrease in the number of 9th grade students scoring Below Basic and Far Below Basic on the Algebra I California Standards Test. 2010 – 2011 20 % decrease in the number of 9th grade students taking the General Math California Standards Test. 2010 – 2012 2% increase each year in the number of 9th grade students scoring at or above Proficient on the Biology California Standards Test.
ELSR’s Addressed
1. Students will demonstrate academic competency by comprehending written material, writing clearly, analyzing and solving problems and using technology effectively.
2. Students will demonstrate effective communication skills. 3. Students will demonstrate intellectual development by strengthening, appreciating and utilizing the skills of critical and creative thinking.
Tools for Monitoring Progress
• CST data for English, math and science • SASI reports on the distribution of D’s and F’s on report cards • SASI reports on credits attained by students
Reporting of Progress
Data Reporting: • Progress made on increasing ninth grade achievement as measured by the CST’s will be reported by the administration and the Professional Development team
annually. • Grade distribution as reported on report cards will be made every grading period to the administration and each department chair in order to have the data
disseminated to each department member. • The names and number of the junior high non-promotees will be reported at the beginning of each school year to the registrar’s office to be distributed to the
administration, counselors and curricular departments. • The number of credits attained at the end of the year for each ninth grader will be reported to the counselors through SASI reporting.
Action Plan Progress: • Through the participation in Home Groups and Action Teams, all stakeholders will be provided the data so that all stakeholders can monitor the progress ninth
grade students are making in increasing their performance on the CST’s, grades and credit achievement. • The Action Plan will be reviewed and modified, when needed, at least annually.

Tasks Action Plan # 3
Responsible Stakeholders
Resources Means to Access Improvement
Timeline Reporting
• Increase articulation with our feeder junior high and elementary schools
• Principals • Assistant
Principals • Counselors
• Office space • Access to IC
• Tracking the grades and behavior incidents of all 9th graders
• HS counselors met with junior high counselors for transition meetings for the first time in 2012
• Outreach meetings at the elementary schools began in 2012
• We are publishing a special edition of our school newspaper for elementary and junior high students in 2012-13
• Eighth grade parent nights take place every year.
• We are starting an elementary night for parents and students in February 2013.
• Creation of a permanent and ongoing Saturday Study Skills academy
• Administration • Counselors • Teachers • Parents
• Work for students to do provided by their classroom teachers
• Parental support for attending
• District intervention funding
• Streamlined online referral process to identify students
• Attendance rosters • Amount of make-up
work that is completed and how students’ grades are affected
• This started in 2010, and takes place on a regular basis throughout each semester
• Attendance and student work is reported back to the classroom teachers
• Expand Freshman Immersion Day to include activities that develop a culture of inclusion and academic success from the beginning of each student’s high school career.
• Administrators • Counselors • ASB Director • ASB Students • Club advisors • Coaches and
performing group advisors
• Support for Freshman Immersion Day activities
• Training of Common Cents “Menturions” to be mentors to future Centurions.
• Number of D’s and F’s • Freshmen enrollment in
clubs and activities
• Freshman Immersion Day began in fall 2011
• Ongoing annually at the beginning of each school year
• Debriefing sessions at the end of the program. Information to be shared with all school stakeholders afterwards.
• Ninth grade attendance at the immersion day
• Creation of a new ninth grade team for struggling students entering high school
• English, math and social studies department chairs
• Administrator who builds the Master Schedule
• Ninth grade counselor
• Sections in the Master Schedule
• Common planning period
• Team classroom • Supplies
• How well those students perform on grades and credits after the ninth grade year
• CST and CAHSEE scores
• Will be implemented in the fall semester 2013
• Parent meetings • Staff meetings • Department chair
meetings • Ninth grade team
teacher/counselor meetings
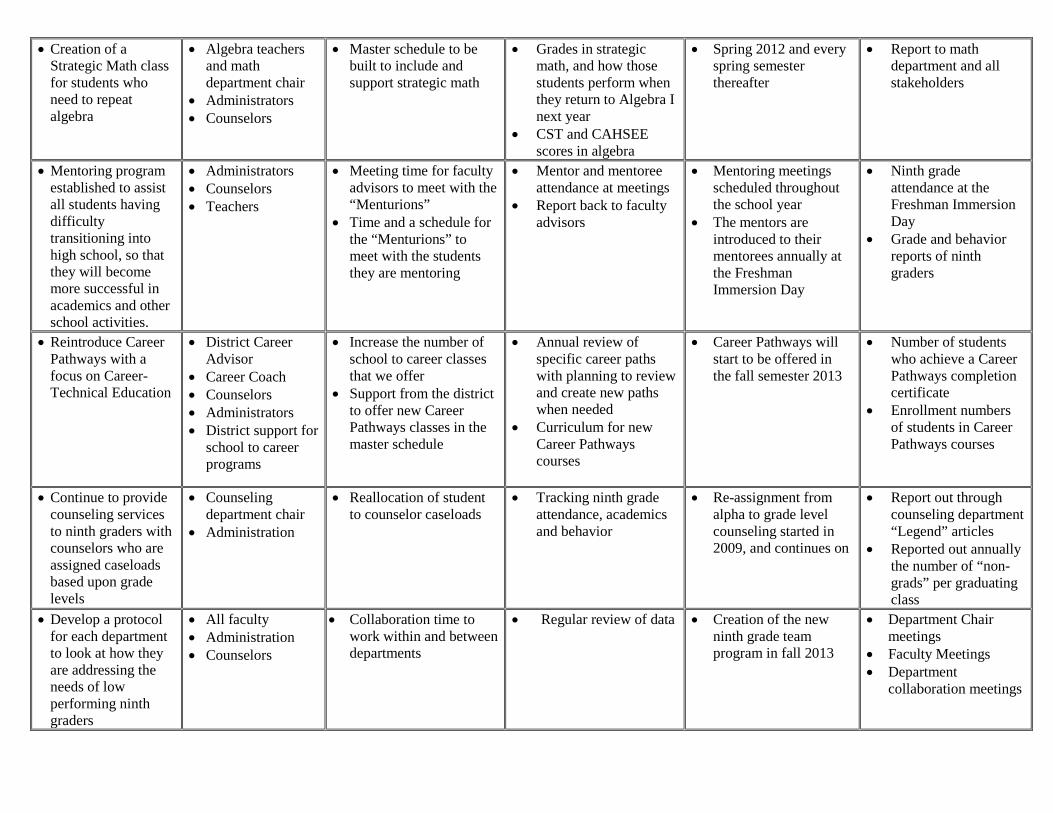
• Creation of a Strategic Math class for students who need to repeat algebra
• Algebra teachers and math department chair
• Administrators • Counselors
• Master schedule to be built to include and support strategic math
• Grades in strategic math, and how those students perform when they return to Algebra I next year
• CST and CAHSEE scores in algebra
• Spring 2012 and every spring semester thereafter
• Report to math department and all stakeholders
• Mentoring program established to assist all students having difficulty transitioning into high school, so that they will become more successful in academics and other school activities.
• Administrators • Counselors • Teachers
• Meeting time for faculty advisors to meet with the “Menturions”
• Time and a schedule for the “Menturions” to meet with the students they are mentoring
• Mentor and mentoree attendance at meetings
• Report back to faculty advisors
• Mentoring meetings scheduled throughout the school year
• The mentors are introduced to their mentorees annually at the Freshman Immersion Day
• Ninth grade attendance at the Freshman Immersion Day
• Grade and behavior reports of ninth graders
• Reintroduce Career Pathways with a focus on Career-Technical Education
• District Career Advisor
• Career Coach • Counselors • Administrators • District support for
school to career programs
• Increase the number of school to career classes that we offer
• Support from the district to offer new Career Pathways classes in the master schedule
• Annual review of specific career paths with planning to review and create new paths when needed
• Curriculum for new Career Pathways courses
• Career Pathways will start to be offered in the fall semester 2013
• Number of students who achieve a Career Pathways completion certificate
• Enrollment numbers of students in Career Pathways courses
• Continue to provide counseling services to ninth graders with counselors who are assigned caseloads based upon grade levels
• Counseling department chair
• Administration
• Reallocation of student to counselor caseloads
• Tracking ninth grade attendance, academics and behavior
• Re-assignment from alpha to grade level counseling started in 2009, and continues on
• Report out through counseling department “Legend” articles
• Reported out annually the number of “non-grads” per graduating class
• Develop a protocol for each department to look at how they are addressing the needs of low performing ninth graders
• All faculty • Administration • Counselors
• Collaboration time to work within and between departments
• Regular review of data • Creation of the new ninth grade team program in fall 2013
• Department Chair meetings
• Faculty Meetings • Department
collaboration meetings
Appendix
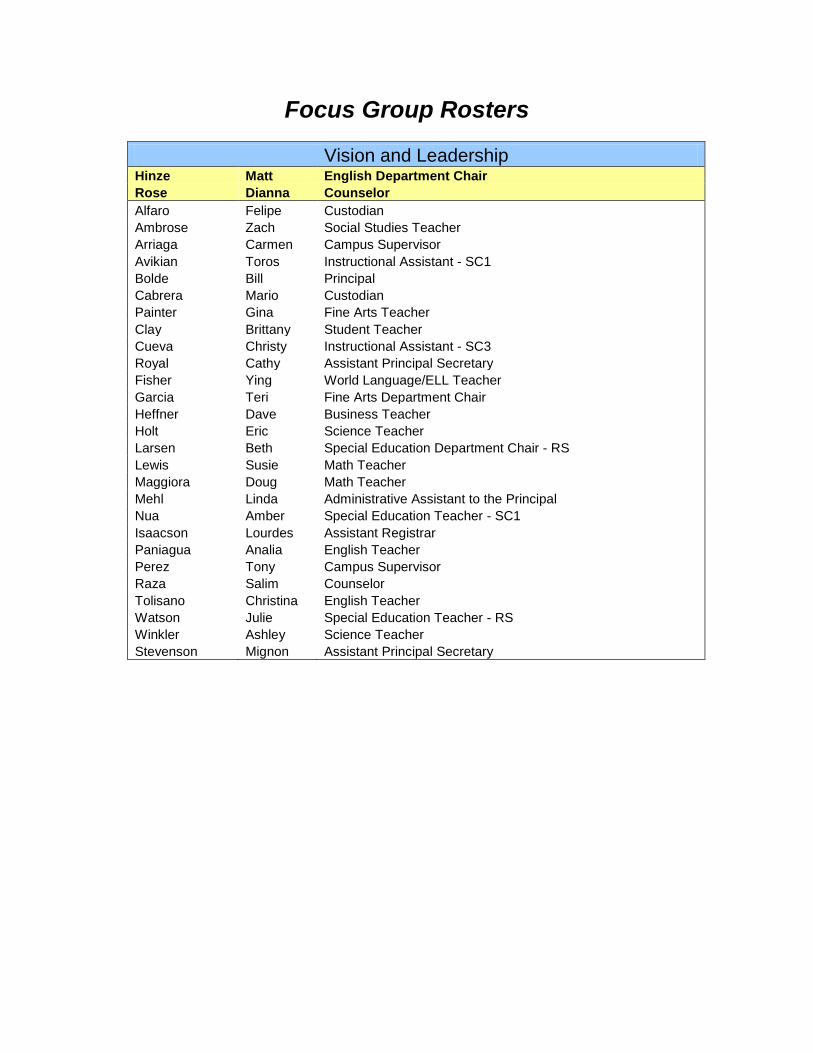
Focus Group Rosters
Vision and Leadership Hinze Matt English Department Chair Rose Dianna Counselor Alfaro Felipe Custodian Ambrose Zach Social Studies Teacher Arriaga Carmen Campus Supervisor Avikian Toros Instructional Assistant - SC1 Bolde Bill Principal Cabrera Mario Custodian Painter Gina Fine Arts Teacher Clay Brittany Student Teacher Cueva Christy Instructional Assistant - SC3 Royal Cathy Assistant Principal Secretary Fisher Ying World Language/ELL Teacher Garcia Teri Fine Arts Department Chair Heffner Dave Business Teacher Holt Eric Science Teacher Larsen Beth Special Education Department Chair - RS Lewis Susie Math Teacher Maggiora Doug Math Teacher Mehl Linda Administrative Assistant to the Principal Nua Amber Special Education Teacher - SC1 Isaacson Lourdes Assistant Registrar Paniagua Analia English Teacher Perez Tony Campus Supervisor Raza Salim Counselor Tolisano Christina English Teacher Watson Julie Special Education Teacher - RS Winkler Ashley Science Teacher Stevenson Mignon Assistant Principal Secretary
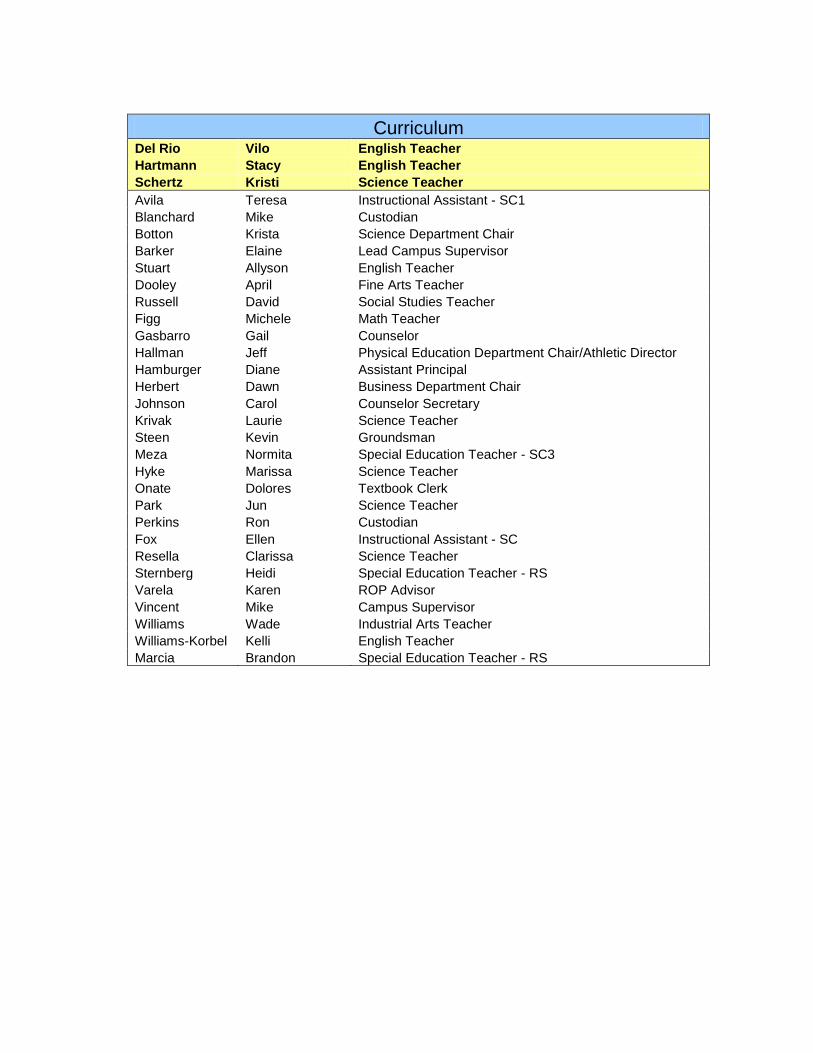
Curriculum Del Rio Vilo English Teacher Hartmann Stacy English Teacher Schertz Kristi Science Teacher Avila Teresa Instructional Assistant - SC1 Blanchard Mike Custodian Botton Krista Science Department Chair Barker Elaine Lead Campus Supervisor Stuart Allyson English Teacher Dooley April Fine Arts Teacher Russell David Social Studies Teacher Figg Michele Math Teacher Gasbarro Gail Counselor Hallman Jeff Physical Education Department Chair/Athletic Director Hamburger Diane Assistant Principal Herbert Dawn Business Department Chair Johnson Carol Counselor Secretary Krivak Laurie Science Teacher Steen Kevin Groundsman Meza Normita Special Education Teacher - SC3 Hyke Marissa Science Teacher Onate Dolores Textbook Clerk Park Jun Science Teacher Perkins Ron Custodian Fox Ellen Instructional Assistant - SC Resella Clarissa Science Teacher Sternberg Heidi Special Education Teacher - RS Varela Karen ROP Advisor Vincent Mike Campus Supervisor Williams Wade Industrial Arts Teacher Williams-Korbel Kelli English Teacher Marcia Brandon Special Education Teacher - RS
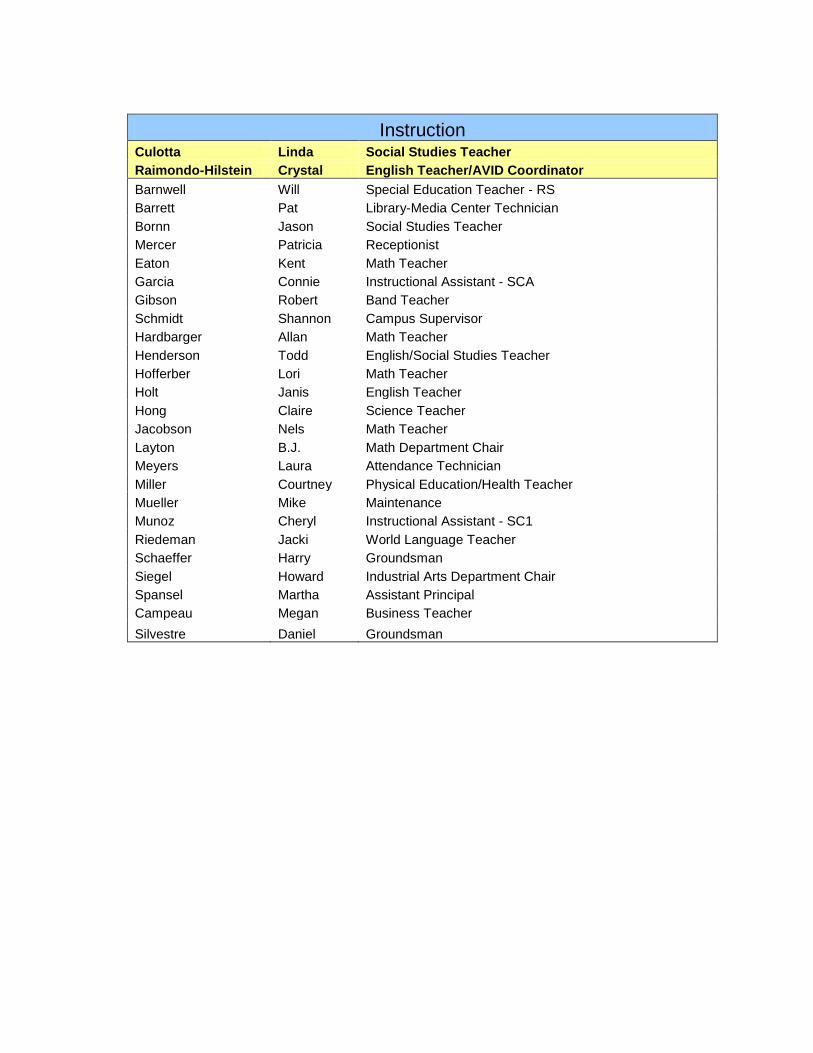
Instruction Culotta Linda Social Studies Teacher Raimondo-Hilstein Crystal English Teacher/AVID Coordinator
Barnwell Will Special Education Teacher - RS Barrett Pat Library-Media Center Technician
Bornn Jason Social Studies Teacher Mercer Patricia Receptionist
Eaton Kent Math Teacher Garcia Connie Instructional Assistant - SCA Gibson Robert Band Teacher
Schmidt Shannon Campus Supervisor Hardbarger Allan Math Teacher
Henderson Todd English/Social Studies Teacher Hofferber Lori Math Teacher Holt Janis English Teacher
Hong Claire Science Teacher Jacobson Nels Math Teacher
Layton B.J. Math Department Chair Meyers Laura Attendance Technician
Miller Courtney Physical Education/Health Teacher Mueller Mike Maintenance Munoz Cheryl Instructional Assistant - SC1
Riedeman Jacki World Language Teacher Schaeffer Harry Groundsman
Siegel Howard Industrial Arts Department Chair Spansel Martha Assistant Principal Campeau Megan Business Teacher
Silvestre Daniel Groundsman

Assessment and Accountability Rees Craig World Language Teacher Minyard Sam Math Teacher Ballard Derek Social Studies Teacher Beckham-Juarez Connie Library-Media Teacher Blanchfield Dan Counselor Botton Brant English Department Chair Botton Megan English Teacher Vanderleek Ana Bilingual Instructional Assistant Carmody Patrick Custodian Peterson Anthony Social Studies Teacher Davis Marcia Instructional Assistant - SC1 Guerrero Jodi English Teacher Klipfel Jim Social Studies Department Chair McAfee Anna Math Teacher Miller Adam Social Studies Teacher Noonan Wendy English Teacher Onufryk Denise Campus Supervisor Pepo Mike Special Education Tecaher - SC1 Downing Kim Registrar Rocha Gus Lead Custodian Saxton Karol Assistant Principal Secretary Schultz Scott Computer Technicial Support Stephenson Marc Science Department Chair Monson Lauren World Language Teacher Thomas Rita Assistant Principal Sayer Bradford Science Teacher Walker Joe Math Teacher

Support for Students Fulkerson Maria World Language Teacher McDonald Josh School Psychologist Spradling Jill Special Education Teacher - RS Bahr Rich Assistant Principal Carufel Robin Instructional Assistant - SC3 Warne Susie ASB Accountant Friedman Leonard Industrial Arts Teacher Garrett Marcus Athletic Director Groller Seth Math Teacher Hamilton Darlene Campus Supervisor Fannon Jeremy ASB Advisor/ English Teacher Jeffris Ken Math Teacher Kaur Harbir Science Teacher La Guisa Tere World Language Linam Cal English Teacher Lopata George Special Education Department Chair Maggiora John Social Studies Teacher Mayo Gary Custodian Mercadante Jim Lead Campus Supervisor Miner Kevin Physical Education Teacher Nickels Dan Fine Arts Teacher Paragas Rene Social Studies Teacher Roland Laurie Physical Education Teacher Sanchez Maria Custodian Standley Christian World Language Department Chair Stehle Joseph Special Education Teacher - SC1 Stradling Dave Science Teacher Ondra Anita Health Assistant Willard Louise Career Transitions Advisor McGovern Michelle Career Coach Hanlin Brenda Student Store Clerk Kunda Sherry Counselor
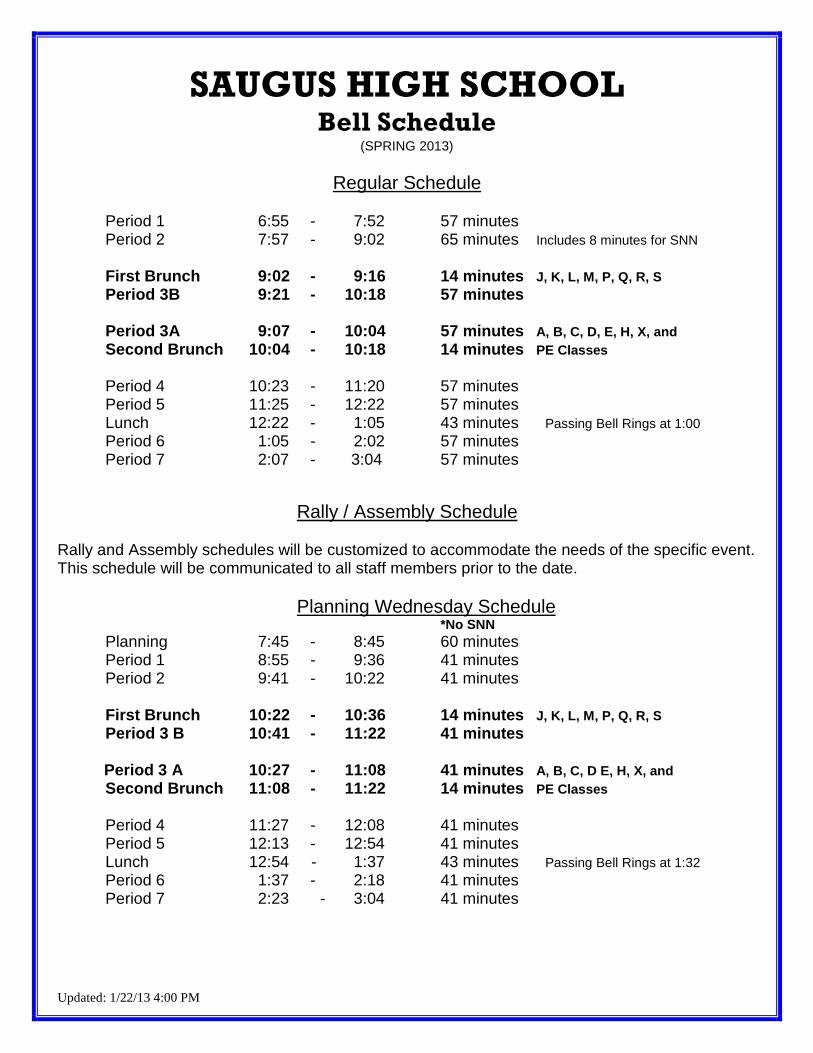
Updated: 1/22/13 4:00 PM
SAUGUS HIGH SCHOOL Bell Schedule
(SPRING 2013)
Regular Schedule
Period 1 6:55 - 7:52 57 minutes Period 2 7:57 - 9:02 65 minutes Includes 8 minutes for SNN First Brunch 9:02 - 9:16 14 minutes J, K, L, M, P, Q, R, S Period 3B 9:21 - 10:18 57 minutes
Period 3A 9:07 - 10:04 57 minutes A, B, C, D, E, H, X, and Second Brunch 10:04 - 10:18 14 minutes PE Classes Period 4 10:23 - 11:20 57 minutes Period 5 11:25 - 12:22 57 minutes Lunch 12:22 - 1:05 43 minutes Passing Bell Rings at 1:00 Period 6 1:05 - 2:02 57 minutes
Period 7 2:07 - 3:04 57 minutes
Rally / Assembly Schedule Rally and Assembly schedules will be customized to accommodate the needs of the specific event. This schedule will be communicated to all staff members prior to the date.
Planning Wednesday Schedule *No SNN Planning 7:45 - 8:45 60 minutes Period 1 8:55 - 9:36 41 minutes Period 2 9:41 - 10:22 41 minutes First Brunch 10:22 - 10:36 14 minutes J, K, L, M, P, Q, R, S Period 3 B 10:41 - 11:22 41 minutes Period 3 A 10:27 - 11:08 41 minutes A, B, C, D E, H, X, and Second Brunch 11:08 - 11:22 14 minutes PE Classes Period 4 11:27 - 12:08 41 minutes Period 5 12:13 - 12:54 41 minutes Lunch 12:54 - 1:37 43 minutes Passing Bell Rings at 1:32 Period 6 1:37 - 2:18 41 minutes Period 7 2:23 - 3:04 41 minutes

Master Schedule Spring 2013
Revised 12/20/2012 1
Last First 1 2 3 4 5 6 7Business
Campeau Megan PDigitial Photo
C302Digital Photo
C302Digital Photo
C302Digital Photo
C302Digital Photo
C302
Heffner DavidDigital Photo
C303 P Digital Photo
C303Web Development
C303Digital Photo
C303Digital Photo
C303
Herbert DawnAlg. Financial B
C301 PAlg. Financial B
C301Game Design/Bus Analysis C301
Alg. Financial A C301
Bus Analysis C301
English 1 2 3 4 5 6 7
Botton BrantCreative Writing
P1606AP Lang & Comp
P1606 AP Lang & Comp
P1606 AP Lang & Comp
P1606 Lit Magazine
P1606 P
Botton MeganAmerican Lit B
Q1709 P Relevancy
Q1709 Relevancy
Q1709American Lit B
Q1709American Lit B
Q1709
Del Rio Vilo PEng Lab 11B
P1604Eng Lab 11B
P1604 CAHSEE
P1604AP Lang&Comp
TM P1604AP Lang&Comp
TM P1604
Fannon JeremyHumanities
Q1707Student Gov.
A112 ASB Time
A112Humanities
Q1707 P ASB Time
A112
Guerrero JodiAP Lit & Comp
Q1710AP Lit & Comp
Q1710 P English 9B
Q1710 English 9B
Q1710 English 9B
Q1710
Hartmann StacyEnglish 10B
Q1711English 10B
Q1711English 10B
Q1711H English 9B
Q1711H English 9B
Q1711 P
Hilstein Crystal AVID 11
Q1715 AVID 12
Q1715American Lit B
Q1715American Lit B
Q1715American Lit B
Q1715 P
Hinze Matt Myth & Folk
Q1703 AVID 10
Q1703 Myth & Folk
Q1703 P English 9B
Q1703 English 9B
Q1703
Holt Janis English 10B
Q1708H English 10B
Q1708H English 10B
Q1708 English 10B
Q1708English 10B
Q1708 P
Linam CalScience Fiction
H801Science Fiction
H801Science Fiction
H801 English 10B
H801 English 10B
H801 P
Noonan WendyAmerican Lit B
Q1702American Lit B
Q1702American Lit B
Q1702English Lab 10B
Q1702 PAmerican Lit B
Q1702
Paniagua AnaliaShakespeare
L1203H English 9B
L1203H English 9B
L1203Shakespeare
L1203Shakespeare
L1203 P
Stuart Allyson English 9B
H805 English 9B
H805 P English 9B
H805 English 10B
H805 English 9B
H805
Tolisano Christina English 9B
H802 English 9B
H802 English 9B
H802 P Yearbook
H802 English 9B
H802
Williams-Korbel KelliH English 10B
H804AP Lit & Comp
H804AP Lit & Comp
H804H English 10B
H804H English 10B
H804 P
Fine Arts 1 2 3 4 5 6 7
Dooley AprilSm Vocal Ensem
E503 Womens Cham
E 503Mixed Chorus B
E503 PShow Choir B
E503Concert Choir B
E503
Garcia Teri Art 1B
B201 PArt 1B B201
AP Studio Art B201
2D Art B B201
Art 1B B201
Gibson RobertJazz Band
E517 Symphonic Band
E517 P Music Appr
E517 Music Appr
E517 Flags & Banners
E517
Painter Gina US History B
H807 US History B
H807 PTheater Arts 1B
E522Theater Arts 1B
E522Th. Arts 2B/3B
E522
Nickels Dan Ceramics 1B
B206 Ceramics 1B
B206 Ceramics 1B
B206 P Art 1B
B207 Ceramics 1B
B206Industrial Arts 1 2 3 4 5 6 7
Friedman Leonard Wood 2B/3B
D-1 Wood 1B
D-1 Wood 1B
D-1 P Wood 1B
D-1 Wood 1B
D-1
Siegel Howard Drafting 1,2,3
D-3Graph Arts 1 & 2
D-3 PGraph Arts 1 & 2
D-3Graph Arts 1 & 2
D-3Graph Arts 1 & 2
D-3
Williams Wade TV Production
D-5 Video 1B
D-5 P Video 1B
D-5 ELA 4
D-5 Video 1B
D-5Other 1 2 3 4 5 6 7
Beckham-Juarez ConnieLibrary Science
LibraryLibrary Science
LibraryLibrary Science
LibraryLibrary Science
LibraryLibrary Science
Library
Groller, B Dance Team
GYM Dance Team
GYM
Caldaronello Lauren Cheer
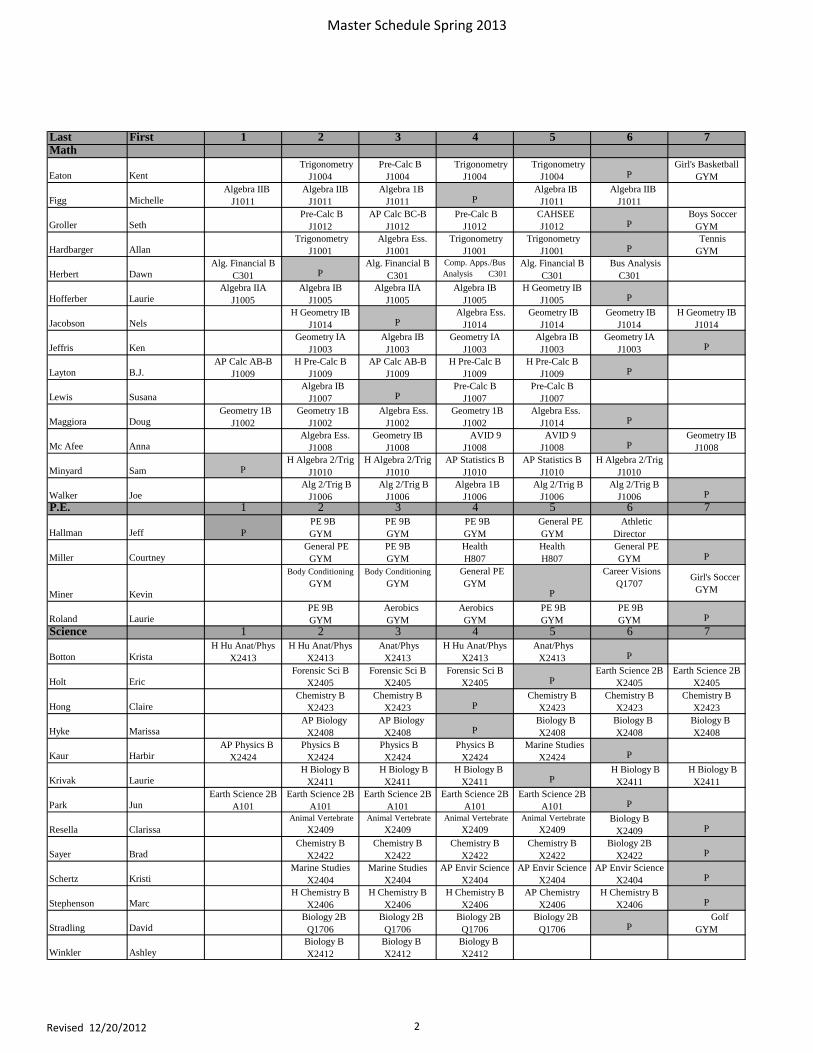
Master Schedule Spring 2013
Revised 12/20/2012 2
Last First 1 2 3 4 5 6 7Math
Eaton Kent Trigonometry
J1004 Pre-Calc B
J1004 Trigonometry
J1004 Trigonometry
J1004 PGirl's Basketball
GYM
Figg Michelle Algebra IIB
J1011 Algebra IIB
J1011 Algebra 1B
J1011 P Algebra IB
J1011 Algebra IIB
J1011
Groller Seth Pre-Calc B
J1012AP Calc BC-B
J1012 Pre-Calc B
J1012 CAHSEE
J1012 P Boys Soccer
GYM
Hardbarger Allan Trigonometry
J1001 Algebra Ess.
J1001 Trigonometry
J1001 Trigonometry
J1001 P Tennis
GYM
Herbert DawnAlg. Financial B
C301 PAlg. Financial B
C301Comp. Apps./Bus Analysis C301
Alg. Financial B C301
Bus Analysis C301
Hofferber LaurieAlgebra IIA
J1005Algebra IB
J1005Algebra IIA
J1005Algebra IB
J1005H Geometry IB
J1005 P
Jacobson NelsH Geometry IB
J1014 P Algebra Ess.
J1014 Geometry IB
J1014 Geometry IB
J1014H Geometry IB
J1014
Jeffris KenGeometry IA
J1003 Algebra IB
J1003Geometry IA
J1003 Algebra IB
J1003Geometry IA
J1003 P
Layton B.J.AP Calc AB-B
J1009H Pre-Calc B
J1009AP Calc AB-B
J1009H Pre-Calc B
J1009H Pre-Calc B
J1009 P
Lewis Susana Algebra IB
J1007 PPre-Calc B
J1007Pre-Calc B
J1007
Maggiora Doug Geometry 1B
J1002 Geometry 1B
J1002 Algebra Ess.
J1002 Geometry 1B
J1002 Algebra Ess.
J1014 P
Mc Afee Anna Algebra Ess.
J1008Geometry IB
J1008 AVID 9
J1008 AVID 9
J1008 P Geometry IB
J1008
Minyard Sam PH Algebra 2/Trig
J1010H Algebra 2/Trig
J1010AP Statistics B
J1010AP Statistics B
J1010H Algebra 2/Trig
J1010
Walker Joe Alg 2/Trig B
J1006 Alg 2/Trig B
J1006 Algebra 1B
J1006 Alg 2/Trig B
J1006 Alg 2/Trig B
J1006 P
P.E. 1 2 3 4 5 6 7
Hallman Jeff P PE 9B GYM
PE 9B GYM
PE 9B GYM
General PE GYM
Athletic Director
Miller Courtney General PE
GYMPE 9B GYM
Health H807
Health H807
General PE GYM P
Miner Kevin
Body Conditioning
GYMBody Conditioning
GYM General PE
GYMP
Career Visions Q1707
Girl's Soccer GYM
Roland LauriePE 9B GYM
Aerobics GYM
Aerobics GYM
PE 9B GYM
PE 9B GYM P
Science 1 2 3 4 5 6 7
Botton KristaH Hu Anat/Phys
X2413H Hu Anat/Phys
X2413 Anat/Phys
X2413H Hu Anat/Phys
X2413 Anat/Phys
X2413 P
Holt EricForensic Sci B
X2405Forensic Sci B
X2405Forensic Sci B
X2405 PEarth Science 2B
X2405Earth Science 2B
X2405
Hong ClaireChemistry B
X2423Chemistry B
X2423 PChemistry B
X2423Chemistry B
X2423Chemistry B
X2423
Hyke Marissa AP Biology
X2408 AP Biology
X2408 P Biology B
X2408 Biology B
X2408 Biology B
X2408
Kaur Harbir AP Physics B
X2424Physics B
X2424 Physics B
X2424Physics B
X2424 Marine Studies
X2424 P
Krivak Laurie H Biology B
X2411 H Biology B
X2411 H Biology B
X2411 P H Biology B
X2411 H Biology B
X2411
Park JunEarth Science 2B
A101Earth Science 2B
A101Earth Science 2B
A101Earth Science 2B
A101Earth Science 2B
A101 P
Resella Clarissa Animal Vertebrate
X2409 Animal Vertebrate
X2409 Animal Vertebrate
X2409 Animal Vertebrate
X2409Biology B
X2409 P
Sayer BradChemistry B
X2422Chemistry B
X2422Chemistry B
X2422Chemistry B
X2422Biology 2B
X2422 P
Schertz KristiMarine Studies
X2404Marine Studies
X2404AP Envir Science
X2404AP Envir Science
X2404AP Envir Science
X2404 P
Stephenson MarcH Chemistry B
X2406H Chemistry B
X2406H Chemistry B
X2406AP Chemistry
X2406H Chemistry B
X2406 P
Stradling David Biology 2B
Q1706 Biology 2B
Q1706 Biology 2B
Q1706 Biology 2B
Q1706 P Golf
GYM
Winkler Ashley Biology B
X2412 Biology B
X2412 Biology B
X2412

Master Schedule Spring 2013
Revised 12/20/2012 3
Last First 1 2 3 4 5 6 7SDC
Garrett Marcus
SC1 Mod Civ A102
SC1 Mod Civ A102
SC1 Mod Civ A102
SC1 Bsc Alg D A102 P Athletic Director
Meza Normita
SC3 Bsc Math L1204
SC3 Bsc Eng L1204
SC3 Bsc Soc Stud L1204
SC3 Psych/Soc L1204 P
SC3 Science L1204
Nua Amber
SC1 Bsc Alg D R1805
SC1 Bsc Alg B R1805 P
SC1 Bsc Alg B R1805
SC1 Bsc Alg D R1805
SC1 Bsc Alg D R1805
Pepo Michael
SC1 Economics A104
SC1 Economics A104
SC1 US History A104
SC1 US History A104 P
Study Skills 9 A104
Spradling Jill PSC1 Eng 11/12
K1107 SC1 BscEng 9/10
K1107 SC1 BscEng 9/10
K1107 SC1 BscEng 9/10
K1107 SC1 BscEng 9/10
K1107
Stehle Joseph
SC1 Eng 11/12 A103
SC1 Earth Sci A103
SC1 Earth Sci A103 P
SC1 Earth Sci A103
SC1 Earth Sci A103
RS 1 2 3 4 5 6 7
Barnwell William
Test Center L1201
Learning Strat 11 R1806
Study Skills 11 R1805 Classroon visits
Learning Strat 11 R1806 P
Marcia Brandon
Learning Strat 9 R1807 Classroom visits
Learning Strat 12 R1807
Test Center L1201
Study Skills 9 R1807 P
Larsen Beth
Learning Strat 12 R1801
Learning Strat 12 R1801
Test Center L1201
Classroom visitsStudy Skills 10
R1801 P
Lopata George
Learning Strat 11 R1806 Classroom visits
Study Skills 9 R1806
Learning Strat 11 R1806
Test Center L1201 P
Sternberg HeidiTest Center
L1201
Study Skills 10 R1801
Learning Strat 10 R1801 Classroom visits
Learning Strat 10 R1801 P
Watson Julie Classroom visits Learning Strat 9
R1807Test Center
L1201
Learning Strat 9 R1807 P Softball
Social Studies 1 2 3 4 5 6 7
Ambrose Zachary
Mod Civ B Q1704
Mod Civ B Q1704
Mod Civ B Q1704
Mod Civ B Q1704 P
Volleyball GYM
Ballard Derek
US History B P1601
US History B P1601
US History B P1601
US History B P1601 P
Boys Basketball GYM
Bornn Jason
US History B K1103
US History B K1103
US History B K1103
US History B K1103 P
Football GYM
Culotta Linda
H Economics Q1701
Economics Q1701 P
H Economics Q1701
H Economics Q1701
Economics Q1701
Henderson Todd
Government H806
English Lab 9B H806
Sociology H806
Government H806
Government H806 P
Klipfel Jim
Journalism P1605
AP US History B
P1605 P US History B
P1605AP US History Tm
P1605AP US History Tm
P1605
Maggiora John
Government L1202
Government L1202
Economics L1202
Economics L1202 P
Baseball GYM
Miller Adam AP European Hist
H803 P AP European Hist
H803
Mod Civ B H803
AP World History H803
AP European Hist H803
Painter Gina
US History B H807
US History B H807 P
Theater Arts 1B E522
Theater Arts 1B E522
Th. Arts 2B/3B E522
Paragas Rene
Mod Civ B H808
Mod Civ B H808
Mod Civ B H808
AP Human Geog
H808 P Cross Country
GYM
Peterson Anthony
Mod Civ B K1101
Mod Civ B K1101 P
Mod Civ B K1101
Mod Civ B K1101
Mod Civ B K1101
Russell David
Economics K1104 P
Economics K1104
Economics K1104
US History K1104
Track GYM
World Language 1 2 3 4 5 6 7
Fisher Ying
ELA 1/2 M1306
ELA 1,2 & 3 M1306
ELA 3 M1306
Chinese 1B M1306
AP Chin/Chin 2/3 M1306 P
Fulkerson Maria
Spanish IB M1307
Spanish IB M1307
Spanish IIB M1307 P
Spanish IB M1307
Spanish IB M1307
LaGiusa Tere
Spanish IIB M1304
Spanish IIIB M1304
Spanish IIIB M1304
Spanish IIB M1304
Spanish IIB M1304
Spanish IIB M1304
Monson Lauren French IB
M1301French IIIB
M1301APFren/FrenIIB
M1301 PFrench IIB
M1301 French IB
M1301
Rees Craig Spanish IIIB
M1303 Spanish IIIB
M1303 PSpanish IB
M1303Spanish IB
M1303 Spanish IB
M1303
Riedeman Jacki Spanish IB
M1308 Spanish IB
M1308 Spanish IB
M1308 Spanish IB
M1308 PSpanish IB
M1308
Standley Christian Spanish IIB
M1302 Spanish IIB
M1302Spanish IIB
M1302 P AP Span Lang B
M1302 Spanish IIB
M1302
Williams Wade
TV Production D-5
Video 1B D-5 P
Video 1B D-5
ELA 4 D-5
Video 1B D-5

July 2012
S M T W T F S 1 2 3 4 5 6 7
8 9 10 11 12 13 14
15 16 17 18 19 20 21
22 23 24 25 26 27 28
29 30 31
Saugus High School 2012 – 2013 Calendar
January 2013 S M T W T F S 1 2 3 4 5
6 7 8 9 10 11 12
13 14 15 16 17 18 19
20 21 22 23 24 25 26
27 28 29 30 31
July 4 Independence Day
August 6 Senior Registration 7 Junior Registration 8 Freshman Orientation Day 8 Freshman Parent Night 6:30 Gym 9 Freshman Registration 10 Sophomore Registration 8 New Teacher Tech Training 9 New Teacher PAR 10 New Teacher Lunch 13 Start Date for Returning Staff 14 Staff Development 15 Work Day – No Meetings 16 Classes Start for All Students 17 Faculty & Family BBQ 17 MORP Dance 28 PTSA Meeting - Lunch
September 3 Labor Day / Holiday 4 Back To School Night (Minimum Day) 5 Planning Wednesday Free Morning 10 Homecoming Week 13 Hall of Fame Dinner 13 Hart District College & Career Fair
@ GVHS 14 Homecoming Game vs. Ventura 15 Homecoming Dance 16 Rosh Hashanah – Begins Sundown
(ends Sundown 18th) 21 First Progress Report 24-25 9th Grade Museum of Tolerance 25 Yom Kippur –Begins Sundown (ends
sundown 26th)
October 1-2 Fall Break 4 Connecting to Success 8 Columbus Day (School Day) 9 CSU Application Workshop #1 9 PTSA Meeting – Lunch 11 Freshman Parent Night (Counselors) 16 UC Application Workshop (Counselors) 18 California Shakeout 19 End of 1st Quarter (Min Day District) 20 PSAT 25 Sophomore Parent Night (Counselors)
November 3-4 PTSA Boutique 4 Daylight Savings Time Ends 6 Election Day 6-7 CAHSEE testing (for non passing) 12 Veteran’s Day / Holiday 15 CSU Application Workshop #2 16 Second Progress Report 21 Faculty Feast- Staff Development 22-23 Thanksgiving Vacation
December 4 PTSA Meeting – Lunch 6 Financial Aid Night (Counselors) 13-19 Book Returns 17-19 Final Exams 19 End Fall Semester 20 Teacher Work Day 21 Winter Vacation (thru 1/11/12)
January 14 Start Spring Semester 21 Martin Luther King Holiday 31 11th Grade College Planning Night
(Counselors) February 2 Winter Formal 12 PTSA Meeting - Lunch 14 Third Progress Report 15 Non Student Day 18 President’s Day / Holiday 21 WASC Visit 20 COC Info Meeting for Seniors 28 COC Info Meeting for Parents March 10 Daylight Savings Time Begins 12-13 CAHSEE (Special Schedule) (all
10th Graders) 19 PTSA Meeting – Lunch 21 Fire Drill 22 End Third Quarter (Min Day District) 25 Passover – Begins at Sundown 27 Planning Wednesday Free Morning 28 Open House and 8th Grade
Orientation (Minimum Day) 29 Good Friday 31 Easter April 1-5 Spring Break 16-18 STAR Testing (Min Days) 22 Nissan Car Give Away (COC) 23 STAR (Special schedule) 23 PTSA Meeting - Lunch 19 Fourth Progress Report 25 PTSA Staff Appreciation Lunch 25 Lit Mag Reading 27 Prom 30 CAPR Awards May 6-17 AP Testing 12 Mother’s Day 13 Senior Luau / Yearbook Distribution 14-15 CAHSEE test (for non passing) 16 Grad Night 16-31 Book Returns 17 Senior Meeting, Panorama Picture,
& Slide Show (8:00 to 9:30) 20-21 Senior Finals (Special Schedule) 21 SAMMY Awards 21 Senior Fail Notices due at 3:00 23 Graduation Practice at COC (7:30) 23 Graduation at COC 7:00 27 Memorial Day / Holiday 29, 30,31 Final Exams (9th, 10th, 11th) 31 End of Spring Semester June 3 Teacher Work Day 16 Father’s Day
Staff Meetings
Professional Development
Depart Collaboration (WASC)
Red Calendar Dates = Hart District Board Meeting Nights (7:00pm)
August 2012
S M T W T F S 1 2 3 4
5 6 7 8 9 10 11
12 13 14 15 16 17 18
19 20 21 22 23 24 25
26 27 28 29 30 31
February 2013 S M T W T F S 1 2
3 4 5 6 7 8 9
10 11 12 13 14 15 16
17 18 19 20 21 22 23
24 25 26 27 28
September 2012
S M T W T F S 1
2 3 4 5 6 7 8
9 10 11 12 13 14 15
16 17 18 19 20 21 22
23 24 25 26 27 28 29
30
March 2013 S M T W T F S 1 2
3 4 5 6 7 8 9
10 11 12 13 14 15 16
17 18 19 20 21 22 23
24 25 26 27 28 29 30
31
October 2012
S M T W T F S
1 2 3 4 5 6
7 8 9 10 11 12 13
14 15 16 17 18 19 20
21 22 23 24 25 26 27
28 29 30 31
April 2013 S M T W T F S 1 2 3 4 5 6
7 8 9 10 11 12 13
14 15 16 17 18 19 20
21 22 23 24 25 26 27
28 29 30
November 2012
S M T W T F S 1 2 3
4 5 6 7 8 9 10
11 12 13 14 15 16 17
18 19 20 21 22 23 24
25 26 27 28 29 30
May 2013 S M T W T F S
1 2 3 4
5 6 7 8 9 10 11
12 13 14 15 16 17 18
19 20 21 22 23 24 25
26 27 28 29 30 31
December 2012
S M T W T F S 1
2 3 4 5 6 7 8
9 10 11 12 13 14 15
16 17 18 19 20 21 22
23 24 25 26 27 28 29
30 31
June 2013 S M T W T F S 1
2 3 4 5 6 7 8
9 10 11 12 13 14 15
16 17 18 19 20 21 22
23 24 25 26 27 28 29
30
Saturday Study Academy
Minimum Days
Student Help
Department Meetings
Special Schedule
WASC Visit
Department Chair Meeting
Holidays (No School)
Grade Reporting End Date
Revised: December 20, 2012