highlights - ces cindex.cesc.com/index/pdf/factsheet_eng_2019q1.pdf · 2019-09-16 · tri -total...
TRANSCRIPT

TRI -Total Return Index
Source: CESC, CSI, as at 31 March 2016
Annualised Return (%) Volatility (%)
Index
Level1M 3M 6M YTD 1Y 3Y 5Y 1Y 3Y 5Y 1Y 3Y 5Y
4,561.92 3.89 17.87 6.69 17.87 1.38 36.52 55.37 1.38 10.93 9.21 18.30 14.33 17.79
6,062.82 3.95 18.14 7.11 18.14 4.31 49.08 80.52 4.31 14.24 12.54 18.29 14.34 17.78
TRI -Total Return Index
Volatility is based on daily returns.
Source: CESC, CSI, as at 31 March 2016
CES SCHK100
CES 300
Dividend Yield (%) Weight of Largest Constituent (%)
Market Value Coverage (%)*
Market Turnover Coverage (%)*
TRI 203.14
Return (%)
Since
Base Date
CES 300 128.10
0.92
CES 120 CES A80
0.99 0.91
CES 280 CES HKMI
0.92 0.93
Average Constituent Market Value (CNY Billion) 74.25
Index Free Float Market Value (CNY Billion) 22,276.36 43.09
Largest Constituent Market Value (CNY Billion) 2,059.82
Smallest Constituent Market Value (CNY Billion) 2.50
2.74 9.25
PE Ratio (Times) 13.34 67.75
Highlights
First Stock Connect-related index to reflect the overall performance of Shanghai, Shenzhen and Hong Kong market
Comprised of the top 100 A shares for Northbound Trading listed in Shanghai and Shenzhen respectively, and the top 100 Hong Kong listed stocks for Southbound Trading in the Stock Connect Programme
Free float-adjusted market value weighted index reflects market movements of stocks available for trading in the market
Semi-annual rebalancing captures market movement while minimising unnecessary churn
-
-
-
-
Historical Performance
Return and Volatility
1-Year Correlation
Index Fundamentals
Index DetailsLaunch Date: 15 December 2014
Base Date: 31 December 2008
Base Index: 2,000
Review: Semi-annually (Jun & Dec)
Dissemination: Real time at 5-second intervals
Constituents: 300
Currency: CNY (real-time) & HKD (available end of day)
Total Return Index: CNY & HKD (both available end of day)
Information Vendor Codes
Bloomberg: CES300
Thomson Reuters: .HKCES300
Hong Kong
MainlandGreat Wisdom : CES300
Wind: CES300
Contact UsEmail: [email protected]
WeChat: ChinaExchanges
* The index universe includes the A shares and HK stocks eligible for the Stock Connect.
0
2,000
4,000
6,000
8,000
10,000
0
2,000
4,000
6,000
8,000
10,000
CES 300 (CNY)
CES 300 TRI (CNY)
TRI-Total Return IndexVolatility is based on daily returns.
TRI-Total Return Index
CESC is a joint venture of HKEX, SSE and SZSE
Weibo:中华证券交易服务有限公司
www.cesc.com
TENCENT ITHSBC HOLDINGS FinancialsPING AN OF CHINA FinancialsAIA Financials
CCB FinancialsPING AN FinancialsKWEICHOW MOUTAI Consumer Stap
ICBC FinancialsCHINA MOBILE Tele ServicesCMB Financials
HKEX Financials
BANK OF CHINA FinancialsGREE Consumer DiscINDUSTRIAL BANK FinancialsMIDEA GROUP Consumer DiscCNOOC Energy
CITIC SECURITIES FinancialsCKH HOLDINGS FinancialsWULIANGYE Consumer Stap
YILI Consumer Stap
TRI -Total Return Index
Source: CESC, CSI, as at 31 March 2016
Source: CESC, CSI, as at 31 Mar 2019
DISCLAIMER
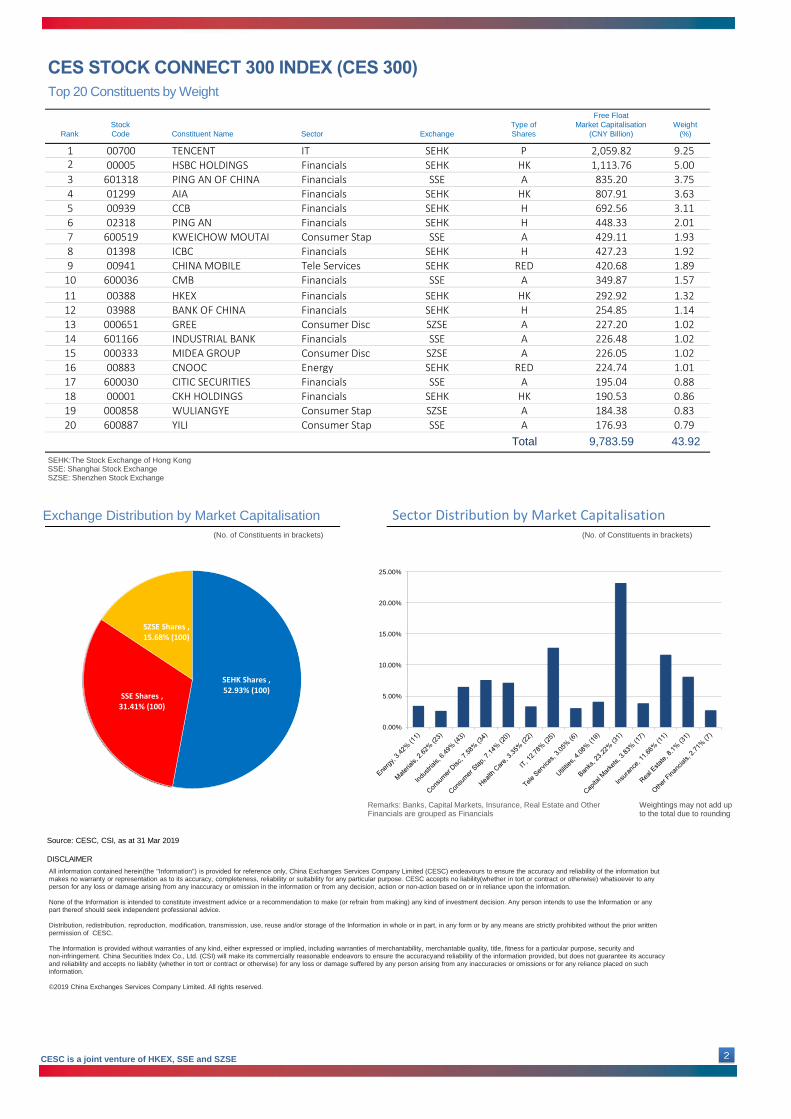
1 00700 SEHK 2,059.82 9.25
Stock
CodeRank Constituent Name Sector Exchange
3 601318 SSE 835.20 3.75
2 00005 SEHK 1,113.76
5 00939 SEHK
4 01299 SEHK 807.91
7 600519 SSE 429.11HA
6 02318 SEHK 448.33
9 00941 SEHK 420.68 1.89H
RED8 01398 SEHK 427.23
11 00388 SEHK 292.92 1.32
A
HK
10 600036 SSE 349.87
13 000651 SZSE 227.20 1.02HA
12 03988 SEHK 254.85
15 000333 SZSE 226.05 1.02AA
14 601166 SSE 226.48
17 600030 SSE 195.04 0.88
RED
A
16 00883 SEHK 224.74
20 600887 SSE 176.93A
0.8619 000858 SZSE 184.38 0.83
HKA
18 00001 SEHK 190.53
Total
0.79
9,783.59 43.92
P
Type of
Shares
HKA
HK
H
1.01
1.02
1.14
1.57
1.92
2.01
3.63
5.00
Free Float
Market Capitalisation
(CNY Billion)
Weight
(%)
3.11
1.93
692.56
SEHK:The Stock Exchange of Hong KongSSE: Shanghai Stock ExchangeSZSE: Shenzhen Stock Exchange
Top 20 Constituents by Weight
(No. of Constituents in brackets)
Weightings may not add up to the total due to rounding
All information contained herein(the ''Information'') is provided for reference only, China Exchanges Services Company Limited (CESC) endeavours to ensure the accuracy and reliability of the information butmakes no warranty or representation as to its accuracy, completeness, reliability or suitability for any particular purpose. CESC accepts no liability(whether in tort or contract or otherwise) whatsoever to anyperson for any loss or damage arising from any inaccuracy or omission in the information or from any decision, action or non-action based on or in reliance upon the information.
None of the Information is intended to constitute investment advice or a recommendation to make (or refrain from making) any kind of investment decision. Any person intends to use the Information or anypart thereof should seek independent professional advice.
Distribution, redistribution, reproduction, modification, transmission, use, reuse and/or storage of the Information in whole or in part, in any form or by any means are strictly prohibited without the prior written
permission of CESC.
The Information is provided without warranties of any kind, either expressed or implied, including warranties of merchantability, merchantable quality, title, fitness for a particular purpose, security andnon-infringement. China Securities Index Co., Ltd. (CSI) will make its commercially reasonable endeavors to ensure the accuracy and reliability of the information provided, but does not guarantee its accuracy and reliability and accepts no liability (whether in tort or contract or otherwise) for any loss or damage suffered by any person arising from any inaccuracies or omissions or for any reliance placed on such information.
©2019 China Exchanges Services Company Limited. All rights reserved.
Exchange Distribution by Market Capitalisation Sector Distribution by Market Capitalisation(No. of Constituents in brackets)
SEHK Shares , 52.93% (100)
SSE Shares , 31.41% (100)
SZSE Shares , 15.68% (100)
CESC is a joint venture of HKEX, SSE and SZSE
Remarks: Banks, Capital Markets, Insurance, Real Estate and Other Financials are grouped as Financials
0.00%
5.00%
10.00%
15.00%
20.00%
25.00%
TRI -Total Return Index
Source: CESC, CSI, as at 31 March 2016
Annualised Return (%) Volatility (%)
Index
Level1M 3M 6M YTD 1Y 3Y 5Y 1Y 3Y 5Y 1Y 3Y 5Y
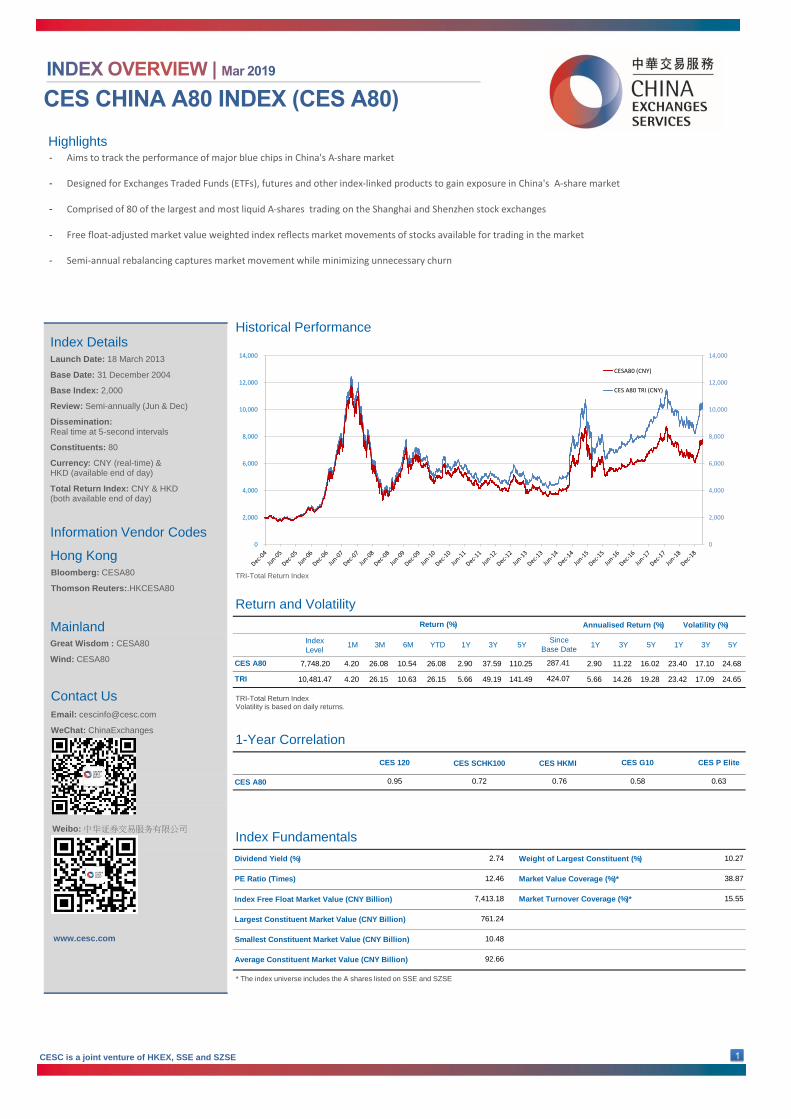
7,748.20 4.20 26.08 10.54 26.08 2.90 37.59 110.25 2.90 11.22 16.02 23.40 17.10 24.68
10,481.47 4.20 26.15 10.63 26.15 5.66 49.19 141.49 5.66 14.26 19.28 23.42 17.09 24.65
TRI -Total Return Index
Volatility is based on daily returns.
Source: CESC, CSI, as at 31 March 2016
CES SCHK100 CES HKMI
CES A80
CES P Elite
0.76 0.630.72
CES 120
0.95
CES G10
0.58
Dividend Yield (%) 2.74 Weight of Largest Constituent (%) 10.27
PE Ratio (Times) 12.46 Market Value Coverage (%)* 38.87
Average Constituent Market Value (CNY Billion) 92.66
Index Free Float Market Value (CNY Billion) 7,413.18 Market Turnover Coverage (%)* 15.55
Largest Constituent Market Value (CNY Billion) 761.24
Smallest Constituent Market Value (CNY Billion) 10.48
TRI 424.07
Return (%)
Since
Base Date
CES A80 287.41
HighlightsAims to track the performance of major blue chips in China's A-share market
Designed for Exchanges Traded Funds (ETFs), futures and other index-linked products to gain exposure in China's A-share market
Comprised of 80 of the largest and most liquid A-shares trading on the Shanghai and Shenzhen stock exchanges
Free float-adjusted market value weighted index reflects market movements of stocks available for trading in the market
Semi-annual rebalancing captures market movement while minimizing unnecessary churn
-
-
-
-
-
Historical Performance
Return and Volatility
1-Year Correlation
Index Fundamentals
Index DetailsLaunch Date: 18 March 2013
Base Date: 31 December 2004
Base Index: 2,000
Review: Semi-annually (Jun & Dec)
Dissemination: Real time at 5-second intervals
Constituents: 80
Currency: CNY (real-time) & HKD (available end of day)
Total Return Index: CNY & HKD (both available end of day)
Information Vendor Codes
Bloomberg: CESA80
Thomson Reuters:.HKCESA80
Hong Kong
MainlandGreat Wisdom : CESA80
Wind: CESA80
Contact Us
Email: [email protected]
WeChat: ChinaExchanges
* The index universe includes the A shares listed on SSE and SZSE
0
2,000
4,000
6,000
8,000
10,000
12,000
14,000
0
2,000
4,000
6,000
8,000
10,000
12,000
14,000
CESA80 (CNY)
CES A80 TRI (CNY)
TRI-Total Return IndexVolatility is based on daily returns.
TRI-Total Return Index
CESC is a joint venture of HKEX, SSE and SZSE 1
Weibo: 中华证券交易服务有限公司
www.cesc.com
PING AN OF CHINA Financials
KWEICHOW MOUTAI Consumer Stap
CMB Financials
GREE Consumer Disc
INDUSTRIAL BANK Financials
MIDEA GROUP Consumer Disc
CITIC SECURITIES Financials
WULIANGYE Consumer Stap
YILI Consumer Stap
HR Health Care
BANKCOMM Financials
CMBC Financials
VANKE-A Financials
ABC Financials
SPD BANK Financials
HIKVISION IT
CSCEC Industrials
ICBC Financials
HAITONG SECURITIES Financials
CYPC Utilities
TRI -Total Return Index
Source: CESC, CSI, as at 31 March 2016
Source: CESC, CSI, as at 31 Mar 2019
DISCLAIMER
Stock
CodeRank Constituent Name Sector Exchange
Type of
Shares
Free Float
Market Capitalisation
(CNY Billion)Weight
(%)
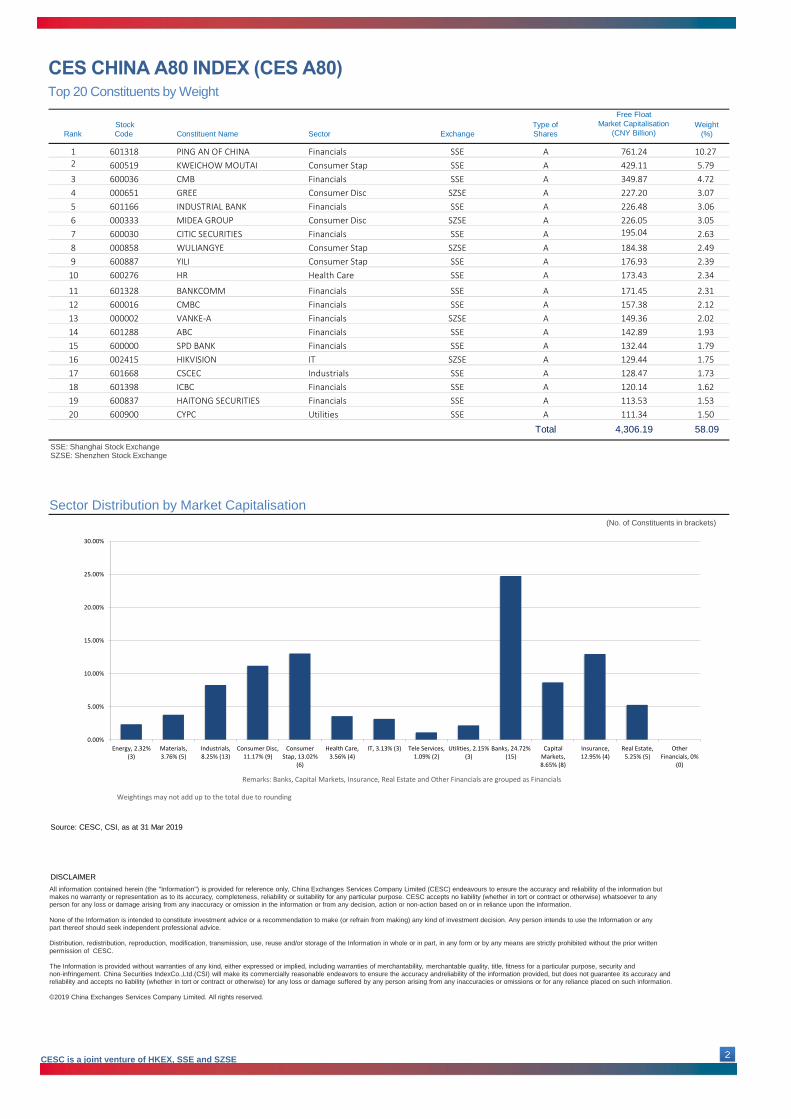
1 601318 SSE A 761.24 10.272 600519 SSE A 429.11 5.79
349.87 4.72
4 000651 SZSE A 227.20 3.07
3 600036 SSE A
226.48 3.06
6 000333 SZSE A 226.05 3.05
5 601166 SSE A
195.04 2.63
8 000858 SZSE A 184.38 2.49
7 600030 SSE A
176.93 2.39
10 600276 SSE A 173.43 2.34
9 600887 SSE A
171.45 2.31
12 600016 SSE A 157.38 2.12
11 601328 SSE A
149.36 2.02
14 601288 SSE A 142.89 1.93
13 000002 SZSE A
132.44 1.79
16 002415 SZSE A 129.44 1.75
15 600000 SSE A
128.47 1.73
18 601398 SSE A 120.14 1.62
17 601668 SSE A
Total 4,306.19 58.09
113.53 1.53
20 600900 SSE A 111.34 1.50
19 600837 SSE A
Sector Distribution by Market Capitalisation
SSE: Shanghai Stock ExchangeSZSE: Shenzhen Stock Exchange
Top 20 Constituents by Weight
(No. of Constituents in brackets)
All information contained herein (the ''Information'') is provided for reference only, China Exchanges Services Company Limited (CESC) endeavours to ensure the accuracy and reliability of the information butmakes no warranty or representation as to its accuracy, completeness, reliability or suitability for any particular purpose. CESC accepts no liability (whether in tort or contract or otherwise) whatsoever to anyperson for any loss or damage arising from any inaccuracy or omission in the information or from any decision, action or non-action based on or in reliance upon the information.
None of the Information is intended to constitute investment advice or a recommendation to make (or refrain from making) any kind of investment decision. Any person intends to use the Information or anypart thereof should seek independent professional advice.
Distribution, redistribution, reproduction, modification, transmission, use, reuse and/or storage of the Information in whole or in part, in any form or by any means are strictly prohibited without the prior writtenpermission of CESC.
The Information is provided without warranties of any kind, either expressed or implied, including warranties of merchantability, merchantable quality, title, fitness for a particular purpose, security andnon-infringement. China Securities IndexCo.,Ltd.(CSI) will make its commercially reasonable endeavors to ensure the accuracy andreliability of the information provided, but does not guarantee its accuracy andreliability and accepts no liability (whether in tort or contract or otherwise) for any loss or damage suffered by any person arising from any inaccuracies or omissions or for any reliance placed on such information.
©2019 China Exchanges Services Company Limited. All rights reserved.
Weightings may not add up to the total due to rounding
CESC is a joint venture of HKEX, SSE and SZSE
Remarks: Banks, Capital Markets, Insurance, Real Estate and Other Financials are grouped as Financials
0.00%
5.00%
10.00%
15.00%
20.00%
25.00%
30.00%
Energy, 2.32%(3)
Materials,3.76% (5)
Industrials,8.25% (13)
Consumer Disc,11.17% (9)
ConsumerStap, 13.02%
(6)
Health Care,3.56% (4)
IT, 3.13% (3) Tele Services,1.09% (2)
Utilities, 2.15%(3)
Banks, 24.72%(15)
CapitalMarkets,8.65% (8)
Insurance,12.95% (4)
Real Estate,5.25% (5)
OtherFinancials, 0%
(0)

TRI -Total Return Index
Source: CESC, CSI, as at 31 March 2016
Annualized Return (%) Volatility (%)
Index
Level1M 3M 6M YTD 1Y 3Y 5Y 1Y 3Y 5Y 1Y 3Y 5Y
6,425.19 17.43 28.73 33.59 28.73 4.81 155.33 157.05 4.81 36.68 20.78 34.83 30.61 30.84
8,709.64 17.43 28.85 34.00 28.85 9.45 190.81 225.54 9.45 42.74 26.63 34.78 30.58 30.81
TRI -Total Return Index
Volatility is based on daily returns.
Source: CESC, CSI, as at 31 March 2016
CES 280
CESCPD 0.74
CES China Cross Border Index Series are reviewed semi-annually.
Constituent changes and float share adjustments are implemented in June and December every year.
Source: CESC, CSI, as at 31 March 2016
3.86 12.18
8.98 85.99
847.47 92.03
103.26
1.99
23.54
*The index universe includes the A shares listed on SSE and SZSE and the Mainland companies listed on HKEx
Source: CESC, CSI, as at 31 March 2016
Dividend Yield (%) Weight of Largest Constituent (%)
PE Ratio (Times)
Real Estate Indusry Market Turnover Coverage (%)*Index Free Float Market Value (HKD Billion)
Largest Constituent Market Value (HKD Billion)
Smallest Constituent Market Value (HKD Billion)
Average Constituent Market Value (HKD Billion)
0.81
Real Estate Industry Market Value Coverage (%)*
CESCPD
TRI
Return (%)
0.71
Since
Base Date
221.26
335.48
CES A80CES 120 CES HKMI
0.83
CES SCHK100
0.81
Highlights
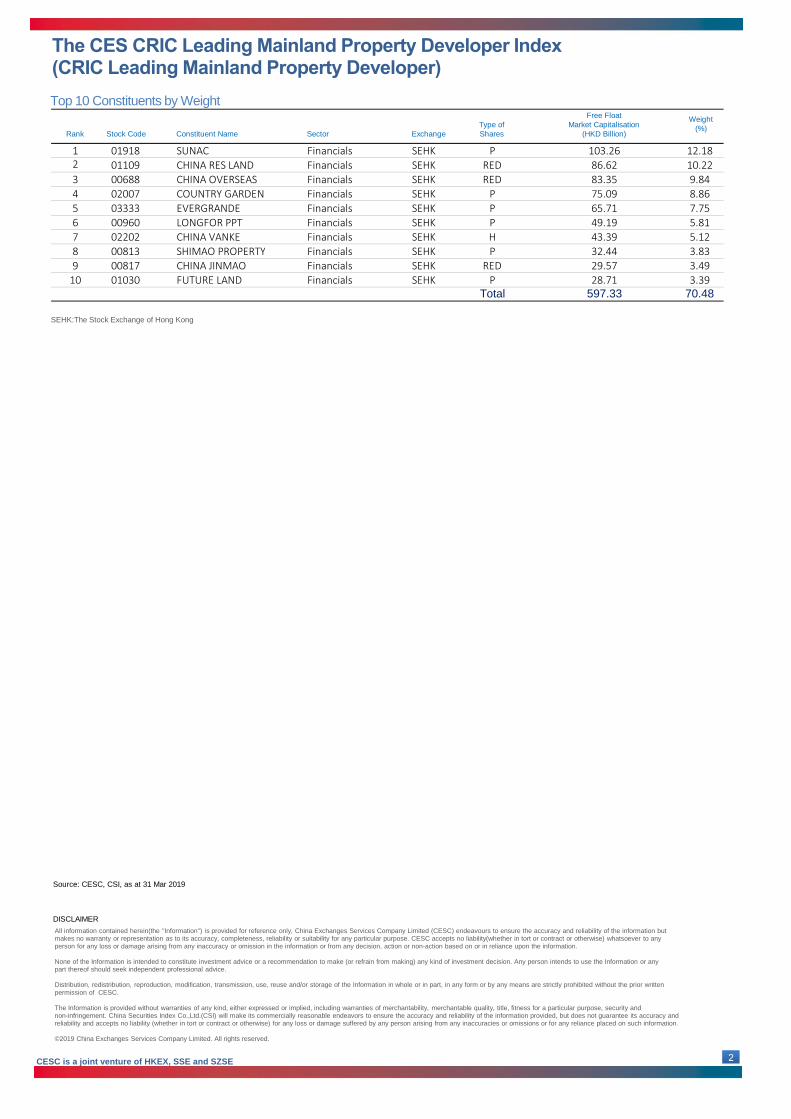
Measure the market performance for mainland Chinese property stocks that included in the list of CRIC’s top 100 mainland property developers
by sales “克而瑞中国房地产企业销售排行榜 TOP100”and listed on the main board of Stock Exchange of Hong Kong Limited (SEHK).
Free float-adjusted market value weighted index reflects market movements of stocks available for trading in the market
Semi-annual rebalancing captures market movement while minimizing unnecessary churn
-
-
-
Historical Performance
Return and Volatility
1-Year Correlation
Index Fundamentals
Index Details
Launch Date: 18 March 2019
Base Date: 30 March 2012
Base Index: 2,000
Review: Semi-annually (Jun & Dec)
Dissemination: Real time at 5-second intervals
Constituents: 40
Currency: HKD (real-time) & HKD &CNY (available end of day)
Total Return Index: HKD & CNY(both available end of day)
Information Vendor Codes
Bloomberg: CESCPD
Thomson Reuters: .CSICESCPD
Hong Kong
MainlandWind: CESCPD
Contact UsEmail: [email protected]
WeChat: ChinaExchanges
TRI-Total Return IndexVolatility is based on daily returns.
* The index universe includes the real estate stocks listed on HKEX
CESC is a joint venture of HKEX, SSE and SZSE 1
Weibo: 中华证券交易服务有限公司
www.cesc.com
0
2,000
4,000
6,000
8,000
10,000
12,000
0
2,000
4,000
6,000
8,000
10,000
12,000CES CPD (HKD)
CES CPD TRI (HKD)
Exchange
Financials SEHKSEHK
Financials SEHKFinancials SEHK
Financials SEHKFinancials SEHKFinancials SEHK
Financials SEHKFinancials SEHKFinancials SEHK
Source: CESC, CSI, as at 31 Mar 2019
DISCLAIMER
Total 597.33 70.48
00817 CHINA JINMAO RED 29.57 3.4910 01030 FUTURE LAND P 28.71 3.39
H
8 00813 SHIMAO PROPERTY P 32.44
5.8165.7149.19
3.839
Weight
(%)
86.6283.35
RED
6 00960 LONGFOR PPT
8.86
5 03333 EVERGRANDE 7.75
4 02007 COUNTRY GARDEN
7 02202 CHINA VANKE 43.39 5.12
10.221
3 00688 CHINA OVERSEAS 9.84
2 01109 CHINA RES LAND01918 SUNAC 12.18P 103.26
FinancialsRED
P
PP
75.09
Rank Stock Code Constituent Name
Type of
Shares
Free Float
Market Capitalisation
(HKD Billion)Sector
Top 10 Constituents by Weight
All information contained herein(the ''Information'') is provided for reference only, China Exchanges Services Company Limited (CESC) endeavours to ensure the accuracy and reliability of the information butmakes no warranty or representation as to its accuracy, completeness, reliability or suitability for any particular purpose. CESC accepts no liability(whether in tort or contract or otherwise) whatsoever to anyperson for any loss or damage arising from any inaccuracy or omission in the information or from any decision, action or non-action based on or in reliance upon the information.
None of the Information is intended to constitute investment advice or a recommendation to make (or refrain from making) any kind of investment decision. Any person intends to use the Information or anypart thereof should seek independent professional advice.
Distribution, redistribution, reproduction, modification, transmission, use, reuse and/or storage of the Information in whole or in part, in any form or by any means are strictly prohibited without the prior writtenpermission of CESC.
The Information is provided without warranties of any kind, either expressed or implied, including warranties of merchantability, merchantable quality, title, fitness for a particular purpose, security andnon-infringement. China Securities Index Co.,Ltd.(CSI) will make its commercially reasonable endeavors to ensure the accuracy and reliability of the information provided, but does not guarantee its accuracy andreliability and accepts no liability (whether in tort or contract or otherwise) for any loss or damage suffered by any person arising from any inaccuracies or omissions or for any reliance placed on such information.
©2019 China Exchanges Services Company Limited. All rights reserved.
SEHK:The Stock Exchange of Hong Kong
CESC is a joint venture of HKEX, SSE and SZSE 2

TRI -Total Return Index
Source: CESC, CSI, as at 31 March 2016
Annualised Return (%) Volatility (%)
Index
Level1M 3M 6M YTD 1Y 3Y 5Y 1Y 3Y 5Y 1Y 3Y 5Y
4,244.04 15.33 49.00 20.36 49.00 -13.34 -4.65 68.05 -13.34 -1.57 10.94 38.30 33.67 39.40
4,376.86 15.33 49.00 20.36 49.00 -13.02 -3.74 70.62 -13.02 -1.26 11.28 38.29 33.67 39.40
TRI -Total Return Index
Volatility is based on daily returns.
Source: CESC, CSI, as at 31 March 2016
CES CHINA SEMICONDUCTOR
0.36 8.61
61.76 Semiconductor Sector Market Value Coverage (%)* 97.84
222.15 Semiconductor Sector Market Turnover Coverage (%)* 93.45
19.13
1.35
5.70
CES 280
0.51 0.660.39
CES 120
0.47
CES A80
0.49
Average Constituent Market Value (CNY Billion)
Index Free Float Market Value (CNY Billion)
Largest Constituent Market Value (CNY Billion)
Smallest Constituent Market Value (CNY Billion)
Return (%)
Since
Base Date
CES CHINA
SEMICONDUCTOR 112.20
Dividend Yield (%)
PE Ratio (Times)
Weight of Largest Constituent (%)
TRI 118.84
CES SCHK100 CES 300
Highlights
Measures the performance of semiconductor stocks listed on China's A -share market
Comprised of the 50 largest semiconductor stocks listed on China's A shares market with business scope ranging from semiconductor materials, equipment, design, manufacture, assembly, packging and testing
Free float-adjusted market value weighted index reflects market movements of stocks available for trading in the market
Semi-annual rebalancing captures market movement while minimizing unnecessary churn
-
-
-
-
Historical Performance
Return and Volatility
1-Year Correlation
Index Fundamentals
Index Details
Launch Date: 26 September 2018
Base Date: 30 December 2011
Base Index: 2,000
Review: Semi-annually (Jun & Dec)
Dissemination: Real time at 5-second intervals
Constituents: 50
Currency: CNY (real-time) & CNY & HKD (available end of day)
Total Return Index: CNY & HKD (both available end of day)
Information Vendor Codes
Bloomberg: CESCSC
Thomson Reuters:.HKCESCSC
Hong Kong
MainlandGreat Wisdom : CESCSC
Wind: CESCSC
Contact Us
Email: [email protected]
WeChat: ChinaExchanges
* The index universe includes the Semiconductor stocks listed on SSE and SZSE
TRI-Total Return IndexVolatility is based on daily returns.
CESC is a joint venture of HKEX, SSE and SZSE 1
Weibo: 中华证券交易服务有限公司
www.cesc.com
0
2,000
4,000
6,000
8,000
10,000
0
2,000
4,000
6,000
8,000
10,000
CES CSC (CNY)
CES CSC TRI (CNY)
Sector Exchange
UGC SZSE
GIGADEVICE SSE
JCET SSE
SILAN SSE
SEVENSTAR SZSE
HUA TIAN SZSE
GOODIX SSE
JINGSHENG SZSE
BELLING SSE
WILLSEMI SSE
DING LONG SZSE
NINESTAR SZSE
WXTJ SSE
TFME SZSE
OBT SZSE
ALLWINNERTECH SZSE
SINO-MICROELECTRONICS SSE
JINGJIA MICRO SZSE
INGENIC SZSE
SHANGHAI SINYANG SZSE
TRI -Total Return Index
Source: CESC, CSI, as at 31 March 2016
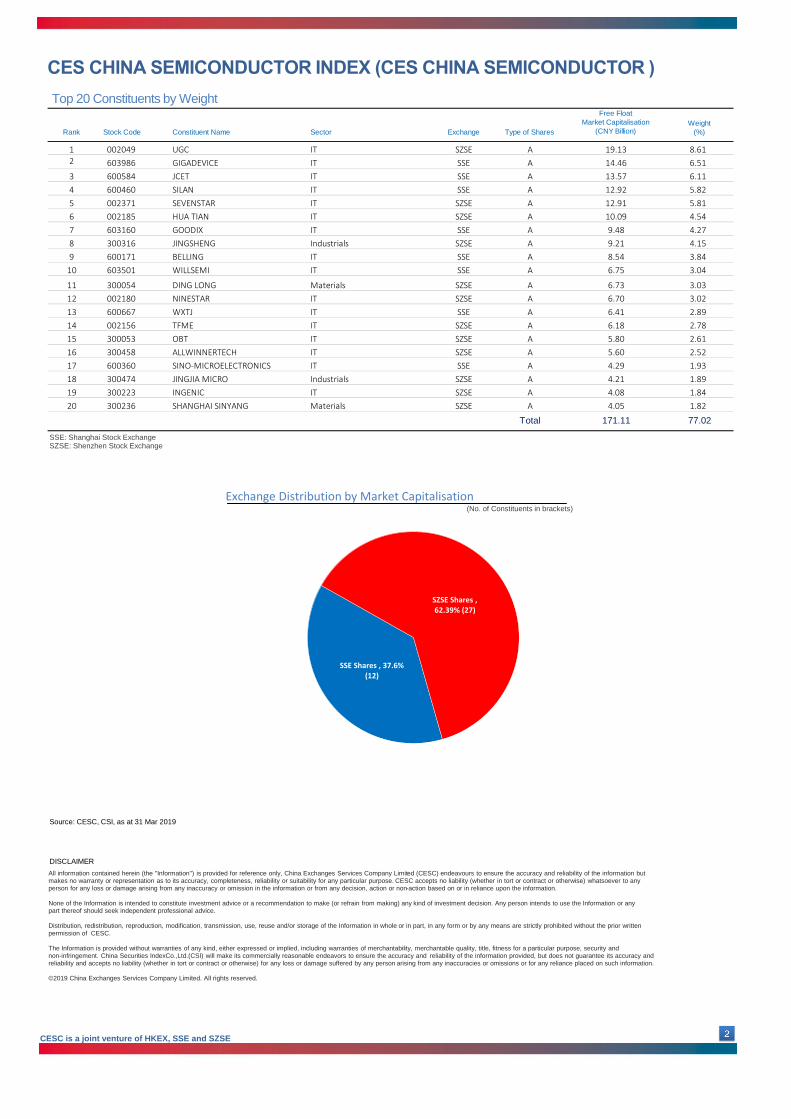
Source: CESC, CSI, as at 31 Mar 2019
DISCLAIMER
Stock CodeRank Constituent Name Type of Shares
Free Float
Market Capitalisation
(CNY Billion)Weight
(%)
1 002049 A 19.13 8.61IT2 603986 A 14.46 6.51
13.57 6.11
4 600460 A 12.92 5.82
3 600584 A
IT
IT
IT
12.91 5.81
6 002185 A 10.09 4.54
5 002371 AIT
IT
9.48 4.27
8 300316 A 9.21 4.15
7 603160 AIT
Industrials
8.54 3.84
10 603501 A 6.75 3.04
9 600171 AIT
IT
6.73 3.03
12 002180 A 6.70 3.02
11 300054 AMaterials
IT
6.41 2.89
14 002156 A 6.18 2.78
13 600667 AIT
IT
5.80 2.61
16 300458 A 5.60 2.52
15 300053 AIT
IT
4.29 1.93
18 300474 A 4.21 1.89
17 600360 AIT
Industrials
Total 171.11 77.02
4.08 1.84
20 300236 A 4.05 1.82
19 300223 AIT
Materials
SSE: Shanghai Stock ExchangeSZSE: Shenzhen Stock Exchange
Top 20 Constituents by Weight
All information contained herein (the ''Information'') is provided for reference only, China Exchanges Services Company Limited (CESC) endeavours to ensure the accuracy and reliability of the information butmakes no warranty or representation as to its accuracy, completeness, reliability or suitability for any particular purpose. CESC accepts no liability (whether in tort or contract or otherwise) whatsoever to anyperson for any loss or damage arising from any inaccuracy or omission in the information or from any decision, action or non-action based on or in reliance upon the information.
None of the Information is intended to constitute investment advice or a recommendation to make (or refrain from making) any kind of investment decision. Any person intends to use the Information or anypart thereof should seek independent professional advice.
Distribution, redistribution, reproduction, modification, transmission, use, reuse and/or storage of the Information in whole or in part, in any form or by any means are strictly prohibited without the prior writtenpermission of CESC.
The Information is provided without warranties of any kind, either expressed or implied, including warranties of merchantability, merchantable quality, title, fitness for a particular purpose, security andnon-infringement. China Securities IndexCo.,Ltd.(CSI) will make its commercially reasonable endeavors to ensure the accuracy and reliability of the information provided, but does not guarantee its accuracy andreliability and accepts no liability (whether in tort or contract or otherwise) for any loss or damage suffered by any person arising from any inaccuracies or omissions or for any reliance placed on such information.
©2019 China Exchanges Services Company Limited. All rights reserved.
CESC is a joint venture of HKEX, SSE and SZSE
Exchange Distribution by Market Capitalisation(No. of Constituents in brackets)
SSE Shares , 37.6% (12)
SZSE Shares , 62.39% (27)
TRI -Total Return Index
Source: CESC, CSI, as at 31 March 2016
Annualized Return (%) Volatility (%)
Index
Level1M 3M 6M YTD 1Y 3Y 5Y 1Y 3Y 5Y 1Y 3Y 5Y
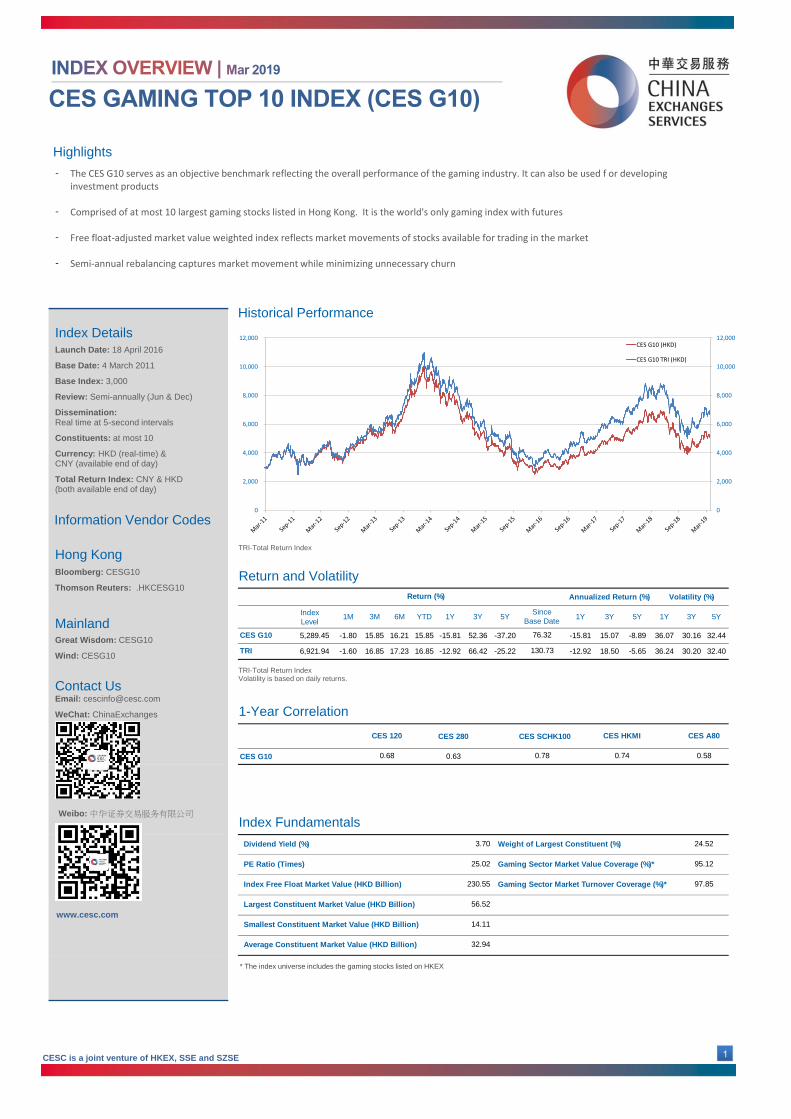
5,289.45 -1.80 15.85 16.21 15.85 -15.81 52.36 -37.20 -15.81 15.07 -8.89 36.07 30.16 32.44
6,921.94 -1.60 16.85 17.23 16.85 -12.92 66.42 -25.22 -12.92 18.50 -5.65 36.24 30.20 32.40
TRI -Total Return Index
Volatility is based on daily returns.
Source: CESC, CSI, as at 31 March 2016
CES 280 CES SCHK100
CES G10 0.63
CES China Cross Border Index Series are reviewed semi-annually.
Constituent changes and float share adjustments are implemented in June and December every year.
Source: CESC, CSI, as at 31 March 2016
*The index universe includes the A shares listed on SSE and SZSE and the Mainland companies listed on HKEx
Source: CESC, CSI, as at 31 March 2016
CES G10
TRI
Return (%)
0.58
Since
Base Date
76.32
130.73
CES A80CES 120 CES HKMI
0.74
95.12
0.68 0.78
24.52
Gaming Sector Market Value Coverage (%)*
Gaming Sector Market Turnover Coverage (%)*Index Free Float Market Value (HKD Billion)
Largest Constituent Market Value (HKD Billion)
Smallest Constituent Market Value (HKD Billion)
Average Constituent Market Value (HKD Billion) 32.94
97.85
25.02
230.55
56.52
14.11
Dividend Yield (%) Weight of Largest Constituent (%)3.70
PE Ratio (Times)
Highlights
The CES G10 serves as an objective benchmark reflecting the overall performance of the gaming industry. It can also be used f or developing investment products
Comprised of at most 10 largest gaming stocks listed in Hong Kong. It is the world's only gaming index with futures
Free float-adjusted market value weighted index reflects market movements of stocks available for trading in the market
Semi-annual rebalancing captures market movement while minimizing unnecessary churn
-
-
-
-
0
2,000
4,000
6,000
8,000
10,000
12,000
0
2,000
4,000
6,000
8,000
10,000
12,000CES G10 (HKD)
CES G10 TRI (HKD)
Historical Performance
Return and Volatility
1-Year Correlation
Index Fundamentals
Index DetailsLaunch Date: 18 April 2016
Base Date: 4 March 2011
Base Index: 3,000
Review: Semi-annually (Jun & Dec)
Dissemination: Real time at 5-second intervals
Constituents: at most 10
Currency: HKD (real-time) & CNY (available end of day)
Total Return Index: CNY & HKD (both available end of day)
Information Vendor Codes
Bloomberg: CESG10
Thomson Reuters: .HKCESG10
Hong Kong
MainlandGreat Wisdom: CESG10
Wind: CESG10
Contact UsEmail: [email protected]
WeChat: ChinaExchanges
TRI-Total Return Index
TRI-Total Return IndexVolatility is based on daily returns.
* The index universe includes the gaming stocks listed on HKEX
CESC is a joint venture of HKEX, SSE and SZSE 1
Weibo: 中华证券交易服务有限公司
www.cesc.com
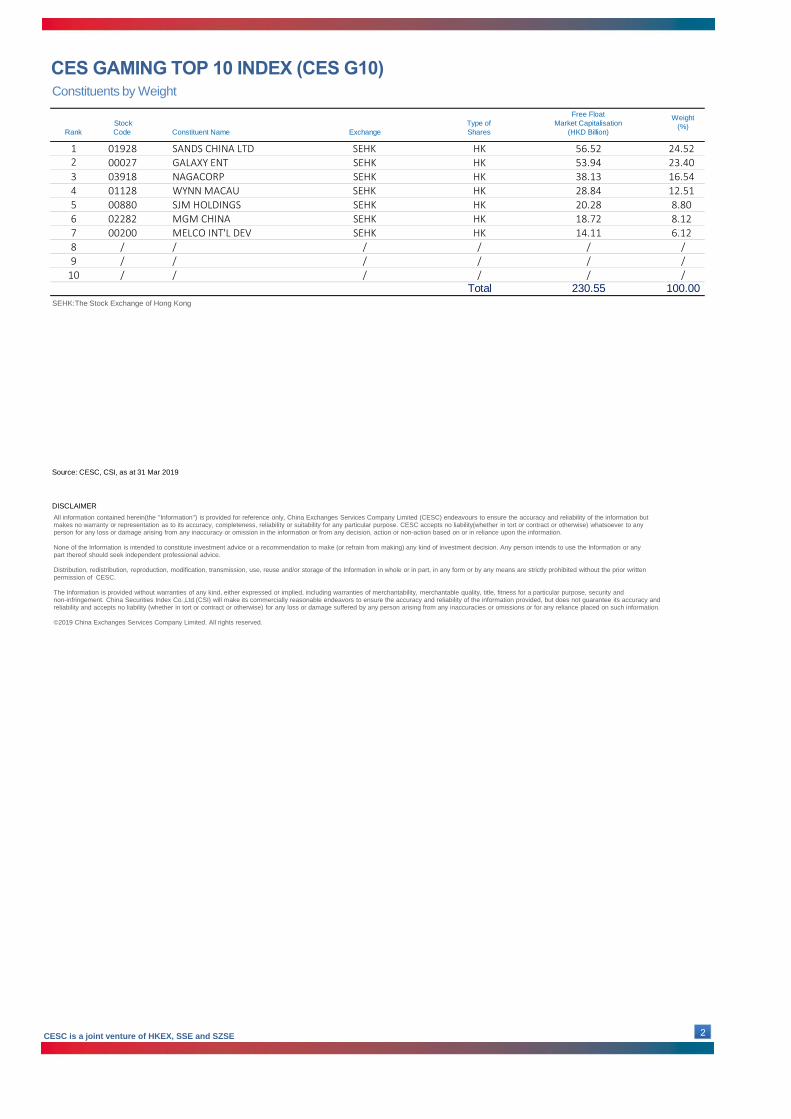
Source: CESC, CSI, as at 31 Mar 2019
DISCLAIMER
TRI -Total Return Index
Source: CESC, CSI, as at 31 March 2016
Weight
(%)
8.12
53.94
38.13
20.28
18.72
HK
HK
HK
HK
HK
28.84
Rank
Stock
Code Constituent Name
23.40
1
3 03918 NAGACORP 16.54
2 00027 GALAXY ENT
01928 SANDS CHINA LTD 24.52
Exchange
Type of
Shares
Free Float
Market Capitalisation
(HKD Billion)
SEHK
SEHK
SEHK
HK 56.52
100.00
6 02282 MGM CHINA
12.51
5 00880 SJM HOLDINGS 8.80
4 01128 WYNN MACAU
Total 230.55
SEHK
SEHK
SEHK
7 00200 MELCO INT'L DEV 14.11 6.12SEHK HK
8 / / / / / /
9 / / / / / /
10 / / / / / /
Constituents by Weight
All information contained herein(the ''Information'') is provided for reference only, China Exchanges Services Company Limited (CESC) endeavours to ensure the accuracy and reliability of the information butmakes no warranty or representation as to its accuracy, completeness, reliability or suitability for any particular purpose. CESC accepts no liability(whether in tort or contract or otherwise) whatsoever to anyperson for any loss or damage arising from any inaccuracy or omission in the information or from any decision, action or non-action based on or in reliance upon the information.
None of the Information is intended to constitute investment advice or a recommendation to make (or refrain from making) any kind of investment decision. Any person intends to use the Information or anypart thereof should seek independent professional advice.
Distribution, redistribution, reproduction, modification, transmission, use, reuse and/or storage of the Information in whole or in part, in any form or by any means are strictly prohibited without the prior writtenpermission of CESC.
The Information is provided without warranties of any kind, either expressed or implied, including warranties of merchantability, merchantable quality, title, fitness for a particular purpose, security andnon-infringement. China Securities Index Co.,Ltd.(CSI) will make its commercially reasonable endeavors to ensure the accuracy and reliability of the information provided, but does not guarantee its accuracy andreliability and accepts no liability (whether in tort or contract or otherwise) for any loss or damage suffered by any person arising from any inaccuracies or omissions or for any reliance placed on such information.
©2019 China Exchanges Services Company Limited. All rights reserved.
SEHK:The Stock Exchange of Hong Kong
CESC is a joint venture of HKEX, SSE and SZSE 2

TRI -Total Return Index
Source: CESC, CSI, as at 31 March 2016
Annualized Return (%) Volatility (%)
Index
Level1M 3M 6M YTD 1Y 3Y 5Y 1Y 3Y 5Y 1Y 3Y 5Y
5,920.50 6.83 28.71 0.70 28.71 -22.12 181.81 196.03 -22.12 41.25 24.24 38.62 34.64 34.63
6,057.93 6.85 28.73 0.76 28.73 -21.90 186.31 202.90 -21.90 42.00 24.81 38.63 34.64 34.62
TRI -Total Return Index
Volatility is based on daily returns.
Source: CESC, CSI, as at 31 March 2016
CES 280
CES HK BIOTECH 0.71
CES China Cross Border Index Series are reviewed semi-annually.
Constituent changes and float share adjustments are implemented in June and December every year.
Source: CESC, CSI, as at 31 March 2016
0.44
39.81
164.21
24.61
1.28
10.26
*The index universe includes the A shares listed on SSE and SZSE and the Mainland companies listed on HKEx
Source: CESC, CSI, as at 31 March 2016
CES HK BIOTECH
TRI
Return (%)
0.62
Since
Base Date
196.03
202.90
CES A80CES 120 CES SCHK50
0.62
CES SCHK100
0.66
Largest Constituent Market Value (HKD Billion)
Smallest Constituent Market Value (HKD Billion)
Average Constituent Market Value (HKD Billion)
99.33
0.67
14.99
Biotech Sector Market Value Coverage (%)*
99.84
Dividend Yield (%) Weight of Largest Constituent (%)
PE Ratio (Times)
Biotech Sector Market Turnover Coverage (%)*Index Free Float Market Value (HKD Billion)
Highlights
The CES HK BIOTECH is the first index that tracks shares of biotech companies, including pre -revenue biotech companies, with a primary or secondary listing on Hong Kong’s Main Board
Free float-adjusted market value weighted index reflects market movements of stocks available for trading in the market
Semi-annual rebalancing captures market movement while minimizing unnecessary churn
-
-
-
Historical Performance
Return and Volatility
1-Year Correlation
Index Fundamentals
Index DetailsLaunch Date: 14 November 2018
Base Date: 12 December 2014
Base Index: 2,000
Review: Semi-annually (Jun & Dec)
Dissemination: Real time at 5-second intervals
Constituents: Variable
Currency: HKD (real-time) & CNY & HKD (both available end of day)
Total Return Index: CNY & HKD (both available end of day)
Information Vendor Codes
Bloomberg: CESHKB
Thomson Reuters: .HKCESHKB
Hong Kong
MainlandGreat Wisdom: CESHKB
Wind: CESHKB
Contact UsEmail: [email protected]
WeChat: ChinaExchanges
TRI-Total Return IndexVolatility is based on daily returns.
CESC is a joint venture of HKEX, SSE and SZSE 1
Weibo: 中华证券交易服务有限公司
www.cesc.com
* The index universe includes the biotech companies listed on HKEX
0
2,000
4,000
6,000
8,000
10,000
12,000
0
2,000
4,000
6,000
8,000
10,000
12,000
CES HKB (HKD)
CES HKB TRI (HKD)
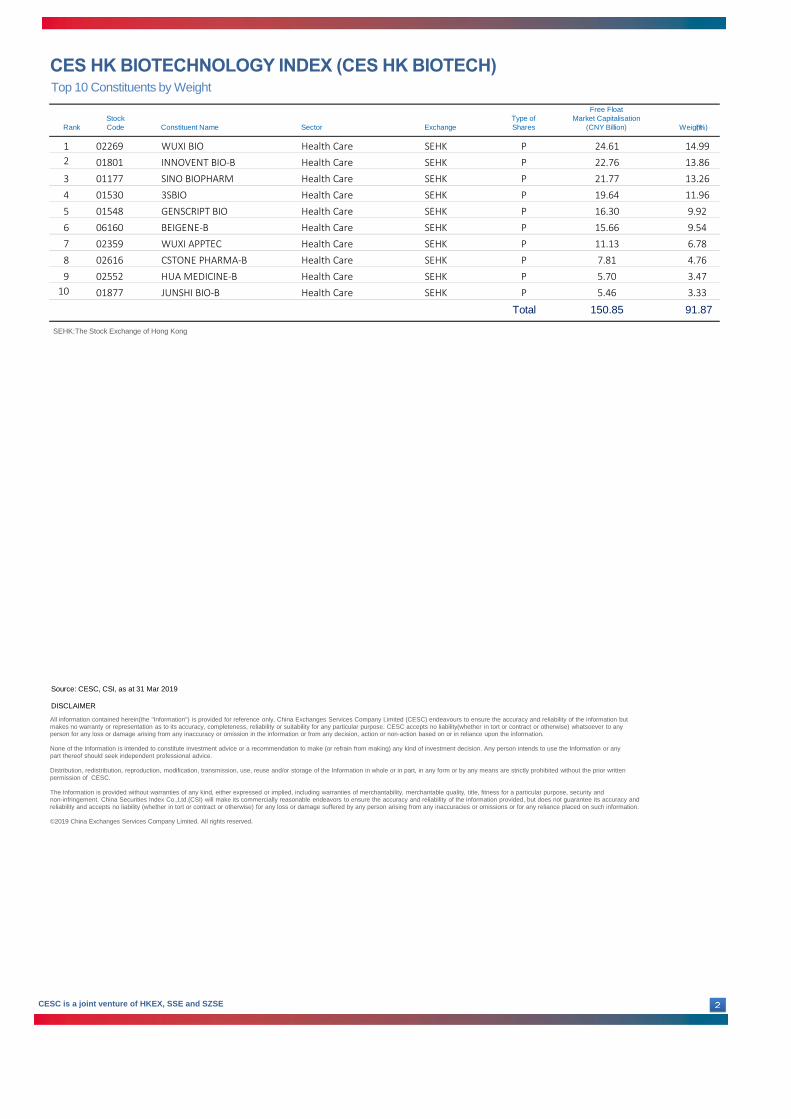
Constituent Name Sector Exchange Weight(%)
1 02269 WUXI BIO Health Care SEHK
2 01801 INNOVENT BIO-B Health Care SEHK
3 01177 SINO BIOPHARM Health Care SEHK
4 01530 3SBIO Health Care SEHK
5 01548 GENSCRIPT BIO Health Care SEHK
6 06160 BEIGENE-B Health Care SEHK
7 02359 WUXI APPTEC Health Care SEHK
8 02616 CSTONE PHARMA-B Health Care SEHK
9 02552 HUA MEDICINE-B Health Care SEHK
10 01877 JUNSHI BIO-B Health Care SEHK
Source: CESC, CSI, as at 31 Mar 2019
DISCLAIMER
TRI -Total Return Index
Source: CESC, CSI, as at 31 March 2016
Free Float
Market Capitalisation
(CNY Billion)
21.77
19.64
16.30
15.66
11.13
7.81
5.70
5.46
150.85
Rank
P
P
P
P
Stock
Code
P
Type of
Shares
3.33
Total
P
91.87
9.54
13.86
13.26
14.99
11.96
9.92
P
P
6.78
P
P
24.61
22.76
4.76
3.47
Top 10 Constituents by Weight
All information contained herein(the ''Information'') is provided for reference only, China Exchanges Services Company Limited (CESC) endeavours to ensure the accuracy and reliability of the information butmakes no warranty or representation as to its accuracy, completeness, reliability or suitability for any particular purpose. CESC accepts no liability(whether in tort or contract or otherwise) whatsoever to anyperson for any loss or damage arising from any inaccuracy or omission in the information or from any decision, action or non-action based on or in reliance upon the information.
None of the Information is intended to constitute investment advice or a recommendation to make (or refrain from making) any kind of investment decision. Any person intends to use the Information or anypart thereof should seek independent professional advice.
Distribution, redistribution, reproduction, modification, transmission, use, reuse and/or storage of the Information in whole or in part, in any form or by any means are strictly prohibited without the prior writtenpermission of CESC.
The Information is provided without warranties of any kind, either expressed or implied, including warranties of merchantability, merchantable quality, title, fitness for a particular purpose, security andnon-infringement. China Securities Index Co.,Ltd.(CSI) will make its commercially reasonable endeavors to ensure the accuracy and reliability of the information provided, but does not guarantee its accuracy andreliability and accepts no liability (whether in tort or contract or otherwise) for any loss or damage suffered by any person arising from any inaccuracies or omissions or for any reliance placed on such information.
©2019 China Exchanges Services Company Limited. All rights reserved.
SEHK:The Stock Exchange of Hong Kong
CESC is a joint venture of HKEX, SSE and SZSE
Annualised Return (%) Volatility (%)
Index
Level1M 3M 6M YTD 1Y 3Y 5Y 1Y 3Y 5Y 1Y 3Y 5Y
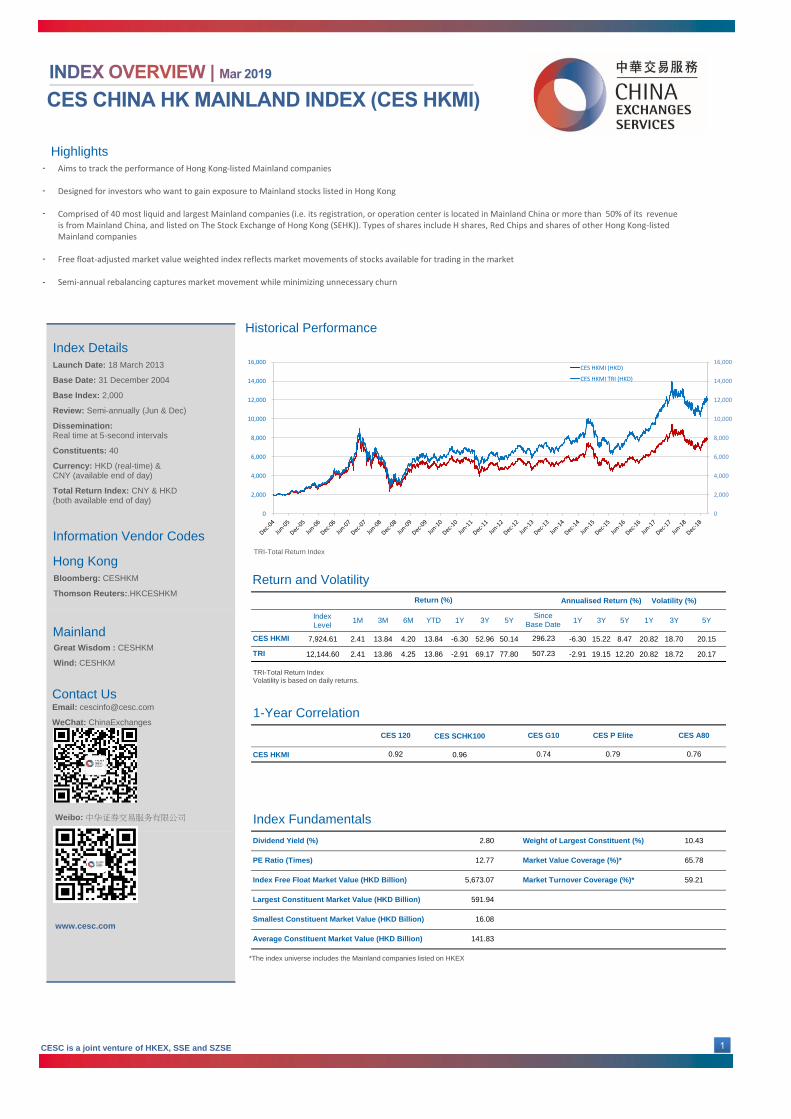
7,924.61 2.41 13.84 4.20 13.84 -6.30 52.96 50.14 -6.30 15.22 8.47 20.82 18.70 20.15
12,144.60 2.41 13.86 4.25 13.86 -2.91 69.17 77.80 -2.91 19.15 12.20 20.82 18.72 20.17
CES SCHK100
CES HKMI 0.96
0.76
CES G10
0.79
CES P EliteCES 120 CES A80
0.92
Smallest Constituent Market Value (HKD Billion) 16.08
Dividend Yield (%) 2.80 10.43
PE Ratio (Times) 12.77 65.78
Weight of Largest Constituent (%)
Market Value Coverage (%)*
0.74
Average Constituent Market Value (HKD Billion) 141.83
Index Free Float Market Value (HKD Billion) 5,673.07 59.21
Largest Constituent Market Value (HKD Billion) 591.94
Market Turnover Coverage (%)*
Return (%)
Since
Base Date
CES HKMI 296.23
TRI 507.23
Highlights
Aims to track the performance of Hong Kong-listed Mainland companies
Designed for investors who want to gain exposure to Mainland stocks listed in Hong Kong
Comprised of 40 most liquid and largest Mainland companies (i.e. its registration, or operation center is located in Mainland China or more than 50% of its revenue is from Mainland China, and listed on The Stock Exchange of Hong Kong (SEHK)). Types of shares include H shares, Red Chips and shares of other Hong Kong-listed Mainland companies
Free float-adjusted market value weighted index reflects market movements of stocks available for trading in the market
Semi-annual rebalancing captures market movement while minimizing unnecessary churn
-
-
-
-
-
Historical Performance
Return and Volatility
1-Year Correlation
Index Fundamentals
Index Details
Launch Date: 18 March 2013
Base Date: 31 December 2004
Base Index: 2,000
Review: Semi-annually (Jun & Dec)
Dissemination: Real time at 5-second intervals
Constituents: 40
Currency: HKD (real-time) & CNY (available end of day)
Total Return Index: CNY & HKD (both available end of day)
Information Vendor Codes
Bloomberg: CESHKM
Thomson Reuters:.HKCESHKM
Hong Kong
MainlandGreat Wisdom : CESHKM
Wind: CESHKM
Contact UsEmail: [email protected]
WeChat: ChinaExchanges
*The index universe includes the Mainland companies listed on HKEX
0
2,000
4,000
6,000
8,000
10,000
12,000
14,000
16,000
0
2,000
4,000
6,000
8,000
10,000
12,000
14,000
16,000CES HKMI (HKD)
CES HKMI TRI (HKD)
CESC is a joint venture of HKEX, SSE and SZSE 1
TRI-Total Return Index
TRI-Total Return IndexVolatility is based on daily returns.
Weibo: 中华证券交易服务有限公司
www.cesc.com

TENCENT IT
CCB Financials
PING AN Financials
ICBC Financials
CHINA MOBILE Tele Services
BANK OF CHINA Financials
CNOOC Energy
CM BANK Financials
SINOPEC CORP Energy
CHINA LIFE Financials
CHINA OVERSEAS Financials
ABC Financials
PETROCHINA Energy
COUNTRY GARDEN Financials
SUNAC Financials
EVERGRANDE Financials
CHINA RES LAND Financials
CPIC Financials
GEELY AUTO Consumer Disc
MENGNIU DAIRY Consumer Stap
TRI -Total Return Index
Source: CESC, CSI, as at 31 March 2016
Source: CESC, CSI, as at 31 Mar 2019
DISCLAIMER
Stock
CodeRank Constituent Name Sector Exchange
Type of
Shares
Free Float
Market Capitalisation
(HKD Billion)
Weight
(%)
1 00700 SEHK P 591.94 10.432 00939 SEHK H 531.91 9.38
523.71 9.23
4 01398 SEHK H 499.07 8.80
3 02318 SEHK H
491.41 8.66
6 03988 SEHK H 297.70 5.25
5 00941 SEHK RED
262.53 4.63
8 03968 SEHK H 175.14 3.09
7 00883 SEHK RED
157.93 2.78
10 02628 SEHK H 157.01 2.77
9 00386 SEHK H
130.60 2.30
12 01288 SEHK H 111.27 1.96
11 00688 SEHK RED
107.39 1.89
14 02007 SEHK P 106.15 1.87
13 00857 SEHK H
103.26 1.82
16 03333 SEHK P 102.08 1.80
15 01918 SEHK P
97.59 1.72
18 02601 SEHK H 85.48 1.51
17 01109 SEHK RED
Total 4,693.10 82.73
80.83 1.43
20 02319 SEHK RED 80.11 1.41
19 00175 SEHK P
Sector Distribution by Market Capitalisation
SEHK:The Stock Exchange of Hong Kong
Top 20 Constituents by Weight
(No. of Constituents in brackets)
All information contained herein(the ''Information'') is provided for reference only, China Exchanges Services Company Limited (CESC) endeavours to ensure the accuracy and reliability of the information butmakes no warranty or representation as to its accuracy, completeness, reliability or suitability for any particular purpose. CESC accepts no liability(whether in tort or contract or otherwise) whatsoever to anyperson for any loss or damage arising from any inaccuracy or omission in the information or from any decision, action or non-action based on or in reliance upon the information.
None of the Information is intended to constitute investment advice or a recommendation to make (or refrain from making) any kind of investment decision. Any person intends to use the Information or anypart thereof should seek independent professional advice.
Distribution, redistribution, reproduction, modification, transmission, use, reuse and/or storage of the Information in whole or in part, in any form or by any means are strictly prohibited without the prior writtenpermission of CESC.
The Information is provided without warranties of any kind, either expressed or implied, including warranties of merchantability, merchantable quality, title, fitness for a particular purpose, security andnon-infringement. China Securities Index Co., Ltd. ( CSI) will make its commercially reasonable endeavors to ensure the accuracy and reliability of the information provided, but does not guarantee its accuracy and reliability and accepts no liability (whether in tort or contract or otherwise) for any loss or damage suffered by any person arising from any inaccuracies or omissions or for any reliance placed on such information.
©2019 China Exchanges Services Company Limited. All rights reserved.
Weightings may not add up to the total due to rounding
CESC is a joint venture of HKEX, SSE and SZSE
Remarks: Banks, Capital Markets, Insurance, Real Estate and Other Financials are grouped as Financials
0.00%
5.00%
10.00%
15.00%
20.00%
25.00%
30.00%
35.00%
Energy, 9.31%(3)
Materials, 0%(0)
Industrials, 0%(0)
Consumer Disc,5.51% (5)
Consumer Stap,4.64% (6)
Health Care,2.24% (2)
IT, 11.03% (2) Tele Services,9.74% (2)
Utilities, 1.86%(2)
Banks, 30.45%(7)
Capital Markets,0% (0)
Insurance,14.25% (4)
Real Estate,10.38% (6)
OtherFinancials, 0.6%
(1)

TRI -Total Return Index
Source: CESC, CSI, as at 31 March 2016
Annualized Return (%) Volatility (%)
Index
Level1M 3M 6M YTD 1Y 3Y 5Y 1Y 3Y 5Y 1Y 3Y 5Y
3,179.19 1.57 12.78 4.17 12.78 -4.55 39.23 33.13 -4.55 11.66 5.89 18.61 16.05 17.21
4,113.38 1.69 13.22 4.81 13.22 -1.09 55.55 59.92 -1.09 15.87 9.84 18.61 16.06 17.22
TRI -Total Return Index
Volatility is based on daily returns.
Source: CESC, CSI, as at 31 March 2016
CES SCHK50
Smallest Constituent Market Value (HKD Billion) 33.95
Dividend Yield (%) 3.12 Weight of Largest Constituent (%) 10.39
PE Ratio (Times) 13.41 Market Value Coverage (%)* 65.84
CES A80
0.89 0.72
Average Constituent Market Value (HKD Billion) 206.90
Index Free Float Market Value (HKD Billion) 10,344.81 Market Turnover Coverage (%)* 61.92
Largest Constituent Market Value (HKD Billion) 1,074.95
CES P Elite
0.77
Return (%)
Since
Base Date
CES SCHK50 58.96
TRI 105.67
CES 120 CES G10CES 300
0.92 0.76
Highlights
A unique Stock Connect-related index that possesses some new blue chips, represents a relativley stable portfolio of stocks with steady growth potential
Comprises of the 50 largest stocks eligible for southbound trading under Stock Connect
Free float-adjusted market value weighted index reflects market movements of stocks available for trading in the market
Semi-annual rebalancing captures market movement while minimising unnecessary churn
-
-
-
-
Historical Performance
Return and Volatility
1-Year Correlation
Index Fundamentals
CESC is a joint venture of HKEX, SSE and SZSE
Index DetailsLaunch Date: 4 January 2018
Base Date: 30 December 2011
Base Index: 2,000
Review: Semi-annually (Jun & Dec)
Dissemination: Real time at 5-second intervals
Constituents: 50
Currency: HKD (real-time) & CNY (available end of day)
Total Return Index: CNY & HKD (both available end of day)
Information Vendor Codes
Thomson Reuters: .CSICESP50
Hong Kong
MainlandWind: CESP50
Contact Us
Email: [email protected]
WeChat: China Exchanges
0
2,000
4,000
6,000
0
2,000
4,000
6,000
CES SCHK50 (HKD)
CES SCHK50 TRI (HKD)
* The index universe includes the HK stocks eligible for Stock Connect .
1
TRI-Total Return IndexVolatility is based on daily returns.
TRI-Total Return Index
Weibo: 中华证券交易服务有限公司
www.cesc.com
Exchange Type of Shares
TENCENT SEHK PAIA SEHK HKHSBC HOLDINGS SEHK HKCCB SEHK H
PING AN SEHK HICBC SEHK HCHINA MOBILE SEHK RED
HKEX SEHK HKBANK OF CHINA SEHK HCNOOC SEHK RED
CKH HOLDINGS SEHK HK
SHK PPT SEHK HKCLP HOLDINGS SEHK HKCK ASSET SEHK HKCM BANK SEHK HHK & CHINA GAS SEHK HK
SINOPEC CORP SEHK HCHINA LIFE SEHK HHANG SENG BANK SEHK HK
GALAXY ENT SEHK HK
TRI -Total Return Index
Source: CESC, CSI, as at 31 March 2016
Source: CESC, CSI, as at 31 Mar 2019
DISCLAIMER
Stock
CodeRank Constituent Name Sector
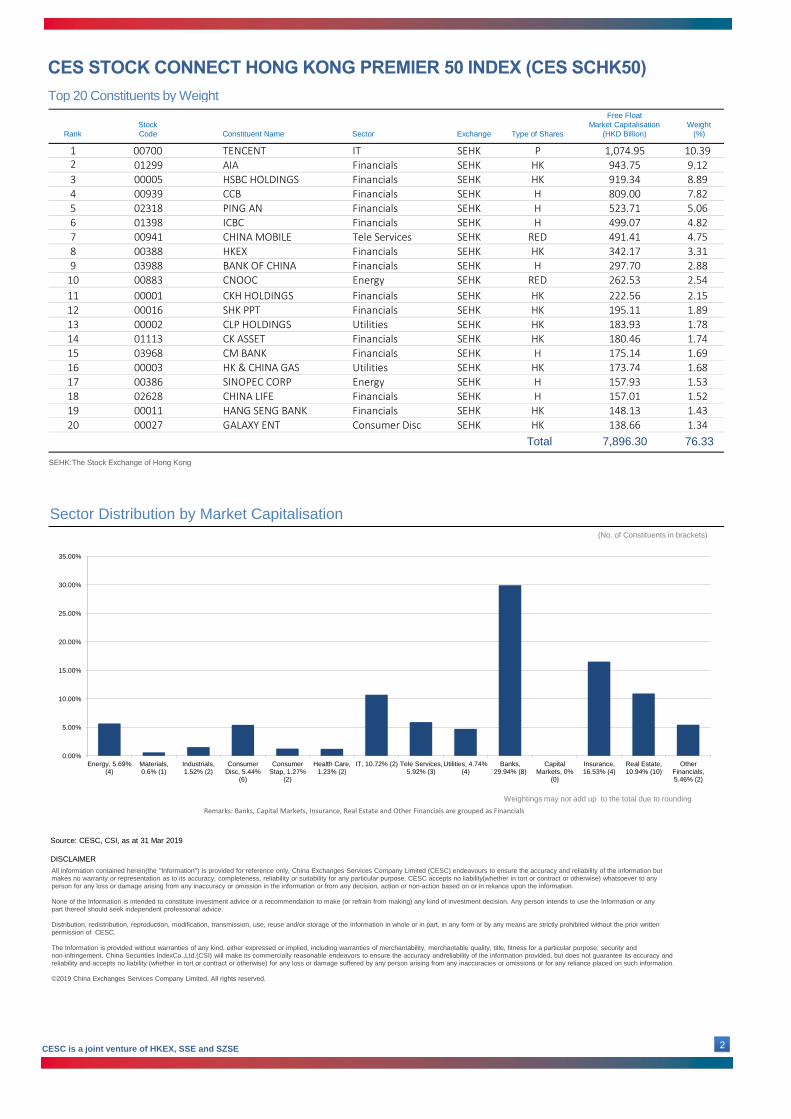
10.392 01299 Financials 943.75 9.12
Free Float
Market Capitalisation
(HKD Billion)
Weight
(%)
1 00700 IT 1,074.95
919.34 8.894 00939 Financials 809.00 7.823 00005 Financials
523.71 5.066 01398 Financials 499.07 4.825 02318 Financials
491.41 4.75
8 00388 Financials 342.17 3.31
7 00941 Tele Services
297.70 2.8810 00883 Energy 262.53 2.549 03988 Financials
222.56 2.15
12 00016 Financials 195.11 1.89
11 00001 Financials
183.93 1.7814 01113 Financials 180.46 1.7413 00002 Utilities
175.14 1.6916 00003 Utilities 173.74 1.6815 03968 Financials
157.93 1.5318 02628 Financials 157.01 1.5217 00386 Energy
7,896.30 76.33
148.13 1.43
20 00027 Consumer Disc 138.66 1.34
19 00011 Financials
Total
Sector Distribution by Market Capitalisation
SEHK:The Stock Exchange of Hong Kong
Top 20 Constituents by Weight
(No. of Constituents in brackets)
Weightings may not add up to the total due to rounding
All information contained herein(the ''Information'') is provided for reference only, China Exchanges Services Company Limited (CESC) endeavours to ensure the accuracy and reliability of the information butmakes no warranty or representation as to its accuracy, completeness, reliability or suitability for any particular purpose. CESC accepts no liability(whether in tort or contract or otherwise) whatsoever to anyperson for any loss or damage arising from any inaccuracy or omission in the information or from any decision, action or non-action based on or in reliance upon the information.
None of the Information is intended to constitute investment advice or a recommendation to make (or refrain from making) any kind of investment decision. Any person intends to use the Information or anypart thereof should seek independent professional advice.
Distribution, redistribution, reproduction, modification, transmission, use, reuse and/or storage of the Information in whole or in part, in any form or by any means are strictly prohibited without the prior writtenpermission of CESC.
The Information is provided without warranties of any kind, either expressed or implied, including warranties of merchantability, merchantable quality, title, fitness for a particular purpose, security andnon-infringement. China Securities IndexCo.,Ltd.(CSI) will make its commercially reasonable endeavors to ensure the accuracy andreliability of the information provided, but does not guarantee its accuracy andreliability and accepts no liability (whether in tort or contract or otherwise) for any loss or damage suffered by any person arising from any inaccuracies or omissions or for any reliance placed on such information.
©2019 China Exchanges Services Company Limited. All rights reserved.
CESC is a joint venture of HKEX, SSE and SZSE 2
Remarks: Banks, Capital Markets, Insurance, Real Estate and Other Financials are grouped as Financials
Energy, 5.69%(4)
Materials,0.6% (1)
Industrials,1.52% (2)
ConsumerDisc, 5.44%
(6)
ConsumerStap, 1.27%
(2)
Health Care,1.23% (2)
IT, 10.72% (2) Tele Services,5.92% (3)
Utilities, 4.74%(4)
Banks,29.94% (8)
CapitalMarkets, 0%
(0)
Insurance,16.53% (4)
Real Estate,10.94% (10)
OtherFinancials,5.46% (2)
0.00%
5.00%
10.00%
15.00%
20.00%
25.00%
30.00%
35.00%

TRI -Total Return Index
Source: CESC, CSI, as at 31 March 2016
Annualised Return (%) Volatility (%)
IndexLevel 1M 3M 6M YTD 1Y 3Y 5Y 1Y 3Y 5Y 1Y 3Y
5,831.84 4.74 20.60 5.04 20.60 -10.57 65.90 80.72 -10.57 18.38 12.56 23.82 19.69
6,495.43 4.77 20.67 5.12 20.67 -9.68 70.48 90.18 -9.68 19.46 13.72 23.81 19.69
TRI -Total Return Index
Volatility is based on daily returns.
Source: CESC, CSI, as at 31 March 2016
CES 280
CES P Elite 0.66
1.99Smallest Constituent Market Value (USD Billion)
0.79 0.63
Market Value Coverage (%)*27.14PE Ratio (Times)
Dividend Yield (%) 0.75 Weight of Largest Constituent (%) 15.58
64.15
20.35CES P Elite
TRI
Index Free Float Market Value (USD Billion) 565.08 Market Turnover Coverage (%)* 66.42
Average Constituent Market Value (USD Billion) 18.84
Largest Constituent Market Value (USD Billion) 88.02
5Y
20.35
0.75
Return (%)
Since
Base Date
483.18
549.54
CES A80CES 120 CES HKMICES SCHK100
0.78
Highlights
The Index’s constituents are generally considered to have remarkable vitality because they have a relatively autonomous ownership structure whilst enjoying strong support from the government
Comprised of the performance of Mainland China’s 30 largest private enterprises listed in Hong Kong or the US
Free float-adjusted market value weighted index reflects market movements of stocks available for trading in the market
Semi-annual rebalancing captures market movement while minimizing unnecessary churn
-
-
-
-
0
1,000
2,000
3,000
4,000
5,000
6,000
7,000
8,000
9,000
0
1,000
2,000
3,000
4,000
5,000
6,000
7,000
8,000
9,000
CES P Elite (USD)
CES P Elite TRI (USD)
Historical Performance
Return and Volatility
Index Fundamentals
Index DetailsLaunch Date: 23 January 2017
Base Date: 31 December 2008
Base Index: 1,000
Review: Semi-annually (Jun & Dec)
Dissemination: Once a day, after the close of trading
Constituents: 30
Currency: USD & HKD
Total Return Index: USD & HKD
Information Vendor Codes
Bloomberg: CESCPE
Thomson Reuters: .CSICESCPE
Hong Kong
Mainland
Great Wisdom : CESPELITE
Wind:CESCPE
Contact Us
Email: [email protected]
WeChat: ChinaExchanges
TRI-Total Return IndexVolatility is based on daily returns.
TRI-Total Return Index
* The index universe includes the Mainland private enterprises listed on HKEX, NYSE, NASDAQ or NYSE MKT.
Weibo: 中华证券交易服务有限公司
www.cesc.com
1-Year Correlation
1CESC is a joint venture of HKEX, SSE and SZSE

ALIBABA GRP
TENCENT
PING AN
BAIDU INC
JD.COM INC
CTRIP.COM
XIAOMI
NETEASE INC
YUM CHINA
COUNTRY GARDEN
SUNAC
EVERGRANDE
NEW ORIENT EDU
PINDUODUO
GEELY AUTO
SHENZHOU INTL
SUNNY OPTICAL
ZTO EXPRESS
ANTA SPORTS
CHINA GAS HOLD
TRI -Total Return Index
Source: CESC, CSI, as at 31 March 2016
Source: CESC, CSI, as at 31 Mar 2019
DISCLAIMER
1.26
91.75
20 00384 Utilities 7.13
Total 518.43
SEHK
1.53
19 02020 Consumer Disc 1.29
18 ZTO Industrials 8.63
7.30
NYSE
SEHK
1.78
17 02382 Consumer Disc 1.62
16 02313 Consumer Disc 10.07
9.17
SEHK
SEHK
1.95
15 00175 Consumer Disc 1.82
14 PDD Consumer Disc 10.99
10.30
NASDAQ
SEHK
2.30
13 EDU Consumer Disc 2.02
12 03333 Financials 13.00
11.44
SEHK
NYSE
2.39
11 01918 Financials 2.33
10 02007 Financials 13.52
13.15
SEHK
SEHK
9 YUMC Consumer Disc 3.01
8 NTES IT
17.02
18.75 3.32NASDAQ
NYSE
7 01810 Tele Services 3.67
6 CTRP Consumer Disc 23.82
20.73
4.22NASDAQ
SEHK
5 JD Consumer Disc 4.59
4 BIDU IT 57.46
25.95
10.17NASDAQ
NASDAQ
3 02318 Financials 11.81
2 00700 IT
66.72SEHK
Rank Sector
Stock
Code Constituent Name
15.09
1 BABA IT 15.58
Exchange
88.02
85.25
Weight
(%)
NYSE
SEHK
Free Float
Market Capitalisation
(USD Billion)
Exchange Distribution by Market Capitalisation Sector Distribution by Market Capitalisation
SEHK: The Stock Exchange of Hong KongNYSE: The New York Stock ExchangeNASDAQ: The NASDAQ Stock MarketNYSE MKT: The NYSE MKT
(No. of Constituents in brackets)
Top 20 Constituents by Weight
(No. of Constituents in brackets)
SEHK , 52.89% (20)
NYSE , 22.14% (4)
NASDAQ , 24.97% (6)
All information contained herein(the ''Information'') is provided for reference only, China Exchanges Services Company Limite d (CESC) endeavours to ensure the accuracy and reliability of the information butmakes no warranty or representation as to its accuracy, completeness, reliability or suitability for any particular purpose. CESC accepts no liability(whether in tort or contract or otherwise) whatsoever to anyperson for any loss or damage arising from any inaccuracy or omission in the information or from any decision, action or non -action based on or in reliance upon the information.
None of the Information is intended to constitute investment advice or a recommendation to make (or refrain from making) any kind of investment decision. Any person intends to use the Information or anypart thereof should seek independent professional advice.
Distribution, redistribution, reproduction, modification, transmission, use, reuse and/or storage of the Information in whole or in part, in any form or by any means are strictly prohibited without the prior writtenpermission of CESC.
The Information is provided without warranties of any kind, either expressed or implied, including warranties of merchantabil ity, merchantable quality, title, fitness for a particular purpose, security andnon-infringement. China Securities Index Co., Ltd. ( CSI) will make its commercially reasonable endeavors to ensure the accuracy and reliability of the information provided, but does not guarantee its accuracy and reliability and accepts no liability (whether in tort or contract or otherwise) for any loss or damage suffered by any pe rson arising from any inaccuracies or omissions or for any reliance placed on such information.
©2019 China Exchanges Services Company Limited. All rights reserved.
Weightings may not add upto the total due to rounding
CESC is a joint venture of HKEX, SSE and SZSE 2
Remarks: Banks, Capital Markets, Insurance, Real Estate and Other Financials are grouped as Financials
0.00%
5.00%
10.00%
15.00%
20.00%
25.00%
30.00%
35.00%
40.00%
45.00%
50.00%
TRI -Total Return Index
Source: CESC, CSI, as at 31 March 2016
Annualized Return (%) Volatility (%)
Index
Level1M 3M 6M YTD 1Y 3Y 5Y 1Y 3Y 5Y 1Y 3Y 5Y
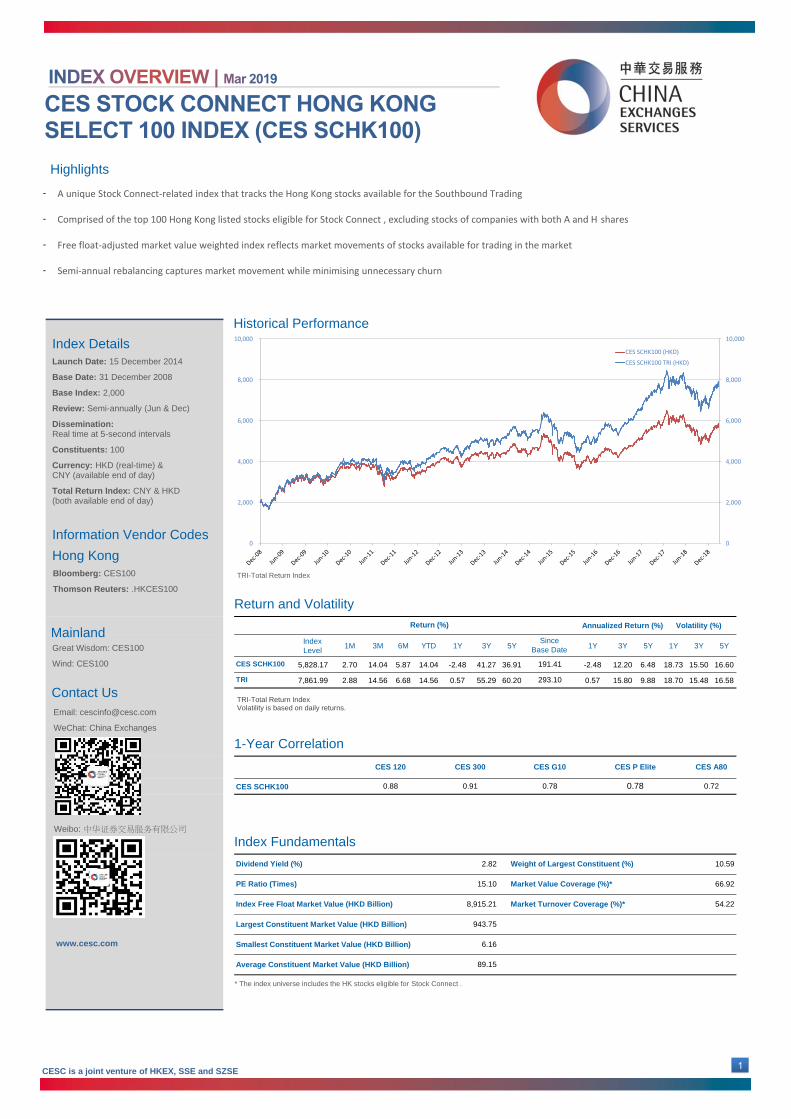
5,828.17 2.70 14.04 5.87 14.04 -2.48 41.27 36.91 -2.48 12.20 6.48 18.73 15.50 16.60
7,861.99 2.88 14.56 6.68 14.56 0.57 55.29 60.20 0.57 15.80 9.88 18.70 15.48 16.58
TRI -Total Return Index
Volatility is based on daily returns.
Source: CESC, CSI, as at 31 March 2016
CES SCHK100
CES P Elite
0.78
Return (%)
Since
Base Date
CES SCHK100 191.41
TRI 293.10
CES 120 CES G10CES 300
0.91 0.78
Average Constituent Market Value (HKD Billion) 89.15
Index Free Float Market Value (HKD Billion) 8,915.21 Market Turnover Coverage (%)* 54.22
Largest Constituent Market Value (HKD Billion) 943.75
Smallest Constituent Market Value (HKD Billion) 6.16
Dividend Yield (%) 2.82 Weight of Largest Constituent (%) 10.59
PE Ratio (Times) 15.10 Market Value Coverage (%)* 66.92
CES A80
0.88 0.72
Highlights
A unique Stock Connect-related index that tracks the Hong Kong stocks available for the Southbound Trading
Comprised of the top 100 Hong Kong listed stocks eligible for Stock Connect , excluding stocks of companies with both A and H shares
Free float-adjusted market value weighted index reflects market movements of stocks available for trading in the market
Semi-annual rebalancing captures market movement while minimising unnecessary churn
-
-
-
-
Historical Performance
Return and Volatility
1-Year Correlation
Index Fundamentals
CESC is a joint venture of HKEX, SSE and SZSE
Index Details
Launch Date: 15 December 2014
Base Date: 31 December 2008
Base Index: 2,000
Review: Semi-annually (Jun & Dec)
Dissemination: Real time at 5-second intervals
Constituents: 100
Currency: HKD (real-time) & CNY (available end of day)
Total Return Index: CNY & HKD (both available end of day)
Information Vendor Codes
Bloomberg: CES100
Thomson Reuters: .HKCES100
Hong Kong
MainlandGreat Wisdom: CES100
Wind: CES100
Contact Us
Email: [email protected]
WeChat: China Exchanges
0
2,000
4,000
6,000
8,000
10,000
0
2,000
4,000
6,000
8,000
10,000
CES SCHK100 (HKD)
CES SCHK100 TRI (HKD)
* The index universe includes the HK stocks eligible for Stock Connect .
1
TRI-Total Return IndexVolatility is based on daily returns.
TRI-Total Return Index
Weibo: 中华证券交易服务有限公司
www.cesc.com
Exchange Type of Shares
AIA SEHK HK
TENCENT SEHK P
HSBC HOLDINGS SEHK HK
CHINA MOBILE SEHK RED
HKEX SEHK HK
CNOOC SEHK RED
CKH HOLDINGS SEHK HK
SHK PPT SEHK HK
CLP HOLDINGS SEHK HK
CK ASSET SEHK HK
HK & CHINA GAS SEHK HK
HANG SENG BANK SEHK HK
GALAXY ENT SEHK HK
BOC HONG KONG SEHK HK
CHINA OVERSEAS SEHK RED
COUNTRY GARDEN SEHK P
SUNAC SEHK P
EVERGRANDE SEHK P
CHINA RES LAND SEHK RED
TECHTRONIC IND SEHK HK
TRI -Total Return Index
Source: CESC, CSI, as at 31 March 2016
Source: CESC, CSI, as at 31 Mar 2019
DISCLAIMER
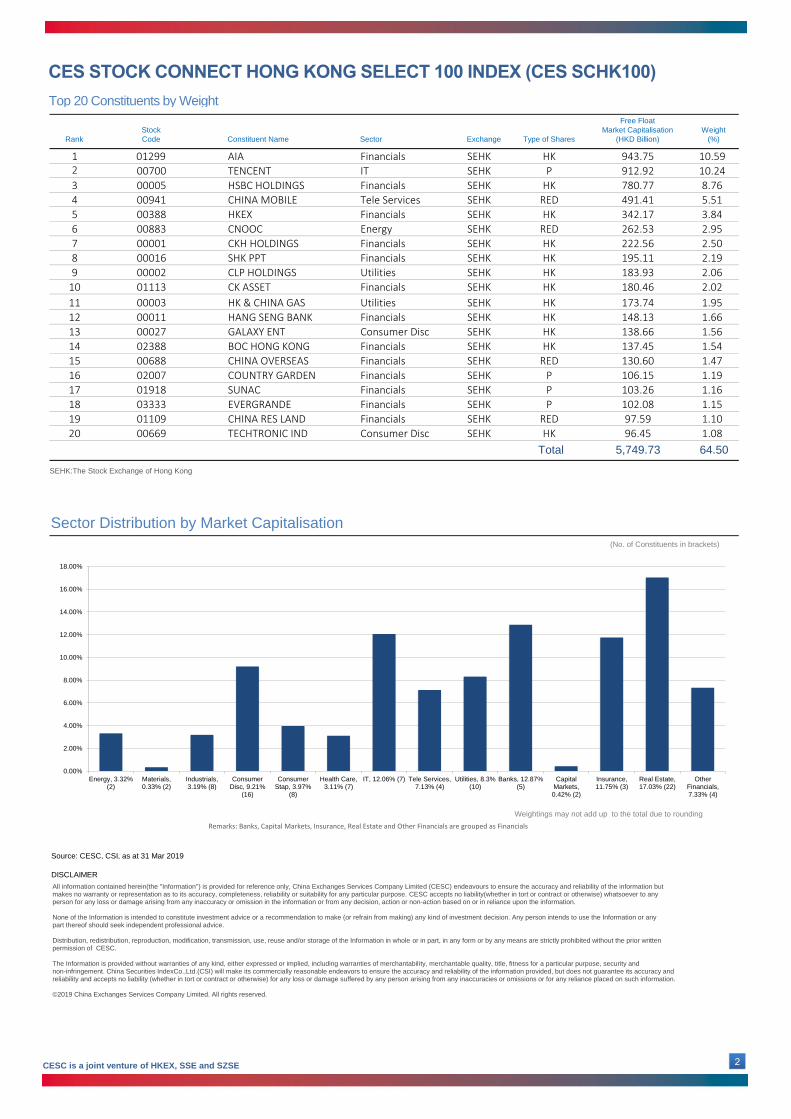
5,749.73 64.50
97.59 1.10
20 00669 Consumer Disc 96.45 1.08
19 01109 Financials
Total
103.26 1.16
18 03333 Financials 102.08 1.15
17 01918 Financials
130.60 1.47
16 02007 Financials 106.15 1.19
15 00688 Financials
138.66 1.56
14 02388 Financials 137.45 1.54
13 00027 Consumer Disc
173.74 1.95
12 00011 Financials 148.13 1.66
11 00003 Utilities
183.93 2.06
10 01113 Financials 180.46 2.02
9 00002 Utilities
222.56 2.50
8 00016 Financials 195.11 2.19
7 00001 Financials
342.17 3.84
6 00883 Energy 262.53 2.95
5 00388 Financials
780.77 8.76
4 00941 Tele Services 491.41 5.51
3 00005 Financials
Stock
CodeRank Constituent Name Sector
10.592 00700 IT 912.92 10.24
Free Float
Market Capitalisation
(HKD Billion)
Weight
(%)
1 01299 Financials 943.75
Sector Distribution by Market Capitalisation
SEHK:The Stock Exchange of Hong Kong
Top 20 Constituents by Weight
(No. of Constituents in brackets)
Weightings may not add up to the total due to rounding
All information contained herein(the ''Information'') is provided for reference only, China Exchanges Services Company Limited (CESC) endeavours to ensure the accuracy and reliability of the information butmakes no warranty or representation as to its accuracy, completeness, reliability or suitability for any particular purpose. CESC accepts no liability(whether in tort or contract or otherwise) whatsoever to anyperson for any loss or damage arising from any inaccuracy or omission in the information or from any decision, action or non-action based on or in reliance upon the information.
None of the Information is intended to constitute investment advice or a recommendation to make (or refrain from making) any kind of investment decision. Any person intends to use the Information or anypart thereof should seek independent professional advice.
Distribution, redistribution, reproduction, modification, transmission, use, reuse and/or storage of the Information in whole or in part, in any form or by any means are strictly prohibited without the prior writtenpermission of CESC.
The Information is provided without warranties of any kind, either expressed or implied, including warranties of merchantability, merchantable quality, title, fitness for a particular purpose, security andnon-infringement. China Securities IndexCo.,Ltd.(CSI) will make its commercially reasonable endeavors to ensure the accuracy and reliability of the information provided, but does not guarantee its accuracy andreliability and accepts no liability (whether in tort or contract or otherwise) for any loss or damage suffered by any person arising from any inaccuracies or omissions or for any reliance placed on such information.
©2019 China Exchanges Services Company Limited. All rights reserved.
CESC is a joint venture of HKEX, SSE and SZSE 2
Remarks: Banks, Capital Markets, Insurance, Real Estate and Other Financials are grouped as Financials
Energy, 3.32%(2)
Materials,0.33% (2)
Industrials,3.19% (8)
ConsumerDisc, 9.21%
(16)
ConsumerStap, 3.97%
(8)
Health Care,3.11% (7)
IT, 12.06% (7) Tele Services,7.13% (4)
Utilities, 8.3%(10)
Banks, 12.87%(5)
CapitalMarkets,0.42% (2)
Insurance,11.75% (3)
Real Estate,17.03% (22)
OtherFinancials,7.33% (4)
0.00%
2.00%
4.00%
6.00%
8.00%
10.00%
12.00%
14.00%
16.00%
18.00%
TRI -Total Return Index
Source: CESC, CSI, as at 31 March 2016
Annualised Return (%) Volatility (%)
IndexLevel 1M 3M 6M YTD 1Y 3Y 5Y 1Y 3Y 5Y 1Y 3Y
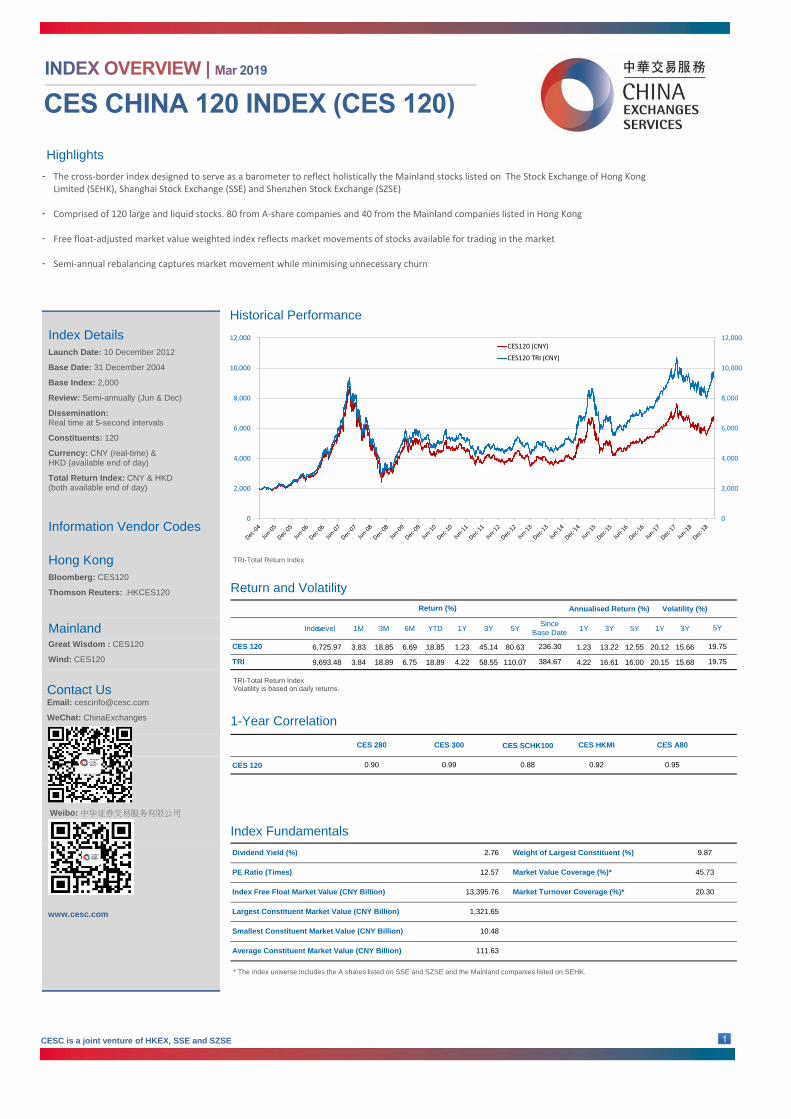
6,725.97 3.83 18.85 6.69 18.85 1.23 45.14 80.63 1.23 13.22 12.55 20.12 15.66
9,693.48 3.84 18.89 6.75 18.89 4.22 58.55 110.07 4.22 16.61 16.00 20.15 15.68
TRI -Total Return Index
Volatility is based on daily returns.
Source: CESC, CSI, as at 31 March 2016
CES SCHK100
CES 120
CES China Cross Border Index Series are reviewed semi-annually.
Constituent changes and float share adjustments are implemented in June and December every year.
Source: CESC, CSI, as at 31 March 2016
*The index universe includes the A shares listed on SSE and SZSE and the Mainland companies listed on HKEx
Source: CESC, CSI, as at 31 March 2016
45.73
Return (%)
Since
Base Date
236.30
384.67
Weight of Largest Constituent (%)2.76
0.95
CES 280
0.90 0.88
CES 300 CES HKMI
0.99 0.92
Smallest Constituent Market Value (CNY Billion)
Average Constituent Market Value (CNY Billion) 111.63
Market Value Coverage (%)*
Market Turnover Coverage (%)*
PE Ratio (Times)
Index Free Float Market Value (CNY Billion)
Largest Constituent Market Value (CNY Billion)
20.30
12.57
13,395.76
1,321.65
10.48
9.87
CES 120
TRI
Dividend Yield (%)
5Y
19.75
19.75
CES A80
0
2,000
4,000
6,000
8,000
10,000
12,000
0
2,000
4,000
6,000
8,000
10,000
12,000CES120 (CNY)
CES120 TRI (CNY)
Highlights
The cross-border index designed to serve as a barometer to reflect holistically the Mainland stocks listed on The Stock Exchange of Hong Kong Limited (SEHK), Shanghai Stock Exchange (SSE) and Shenzhen Stock Exchange (SZSE)
Comprised of 120 large and liquid stocks. 80 from A-share companies and 40 from the Mainland companies listed in Hong Kong
Free float-adjusted market value weighted index reflects market movements of stocks available for trading in the market
Semi-annual rebalancing captures market movement while minimising unnecessary churn
-
-
-
-
Historical Performance
Return and Volatility
1-Year Correlation
Index Fundamentals
Index Details
Launch Date: 10 December 2012
Base Date: 31 December 2004
Base Index: 2,000
Review: Semi-annually (Jun & Dec)
Dissemination: Real time at 5-second intervals
Constituents: 120
Currency: CNY (real-time) & HKD (available end of day)
Total Return Index: CNY & HKD (both available end of day)
Information Vendor Codes
Bloomberg: CES120
Thomson Reuters: .HKCES120
Hong Kong
MainlandGreat Wisdom : CES120
Wind: CES120
Contact UsEmail: [email protected]
WeChat: ChinaExchanges
TRI-Total Return IndexVolatility is based on daily returns.
TRI-Total Return Index
* The index universe includes the A shares listed on SSE and SZSE and the Mainland companies listed on SEHK.
CESC is a joint venture of HKEX, SSE and SZSE 1
Weibo: 中华证券交易服务有限公司
www.cesc.com

TENCENT IT
PING AN OF CHINA Financials
CCB Financials
PING AN Financials
KWEICHOW MOUTAI Consumer Stap
ICBC Financials
CHINA MOBILE Tele Services
CMB Financials
BANK OF CHINA Financials
GREE Consumer Disc
INDUSTRIAL BANK Financials
MIDEA GROUP Consumer Disc
CNOOC Energy
CITIC SECURITIES Financials
WULIANGYE Consumer Stap
YILI Consumer Stap
HR Health Care
BANKCOMM Financials
CMBC Financials
CM BANK Financials
TRI -Total Return Index
Source: CESC, CSI, as at 31 March 2016
Source: CESC, CSI, as at 31 Mar 2019
DISCLAIMER
Weight
(%)Rank Sector Exchange
Type of
Shares
Free Float
Market Capitalisation
(CNY Billion)
Stock
Code Constituent Name
6.24
1
3 00939 SEHK H 692.56 5.17
2 601318 SSE A
00700 SEHK P 1,321.65 9.87
835.20
448.33 3.35
5 600519 SSE A 429.11 3.20
4 02318 SEHK H
427.23 3.19
7 00941 SEHK RED 420.68 3.14
6 01398 SEHK H
349.87 2.61
9 03988 SEHK H 254.85 1.90
8 600036 SSE A
227.20 1.70
11 601166 SSE A 226.48 1.69
10 000651 SZSE A
226.05 1.69
13 00883 SEHK RED 224.74 1.68
12 000333 SZSE A
195.04 1.46
15 000858 SZSE A 184.38 1.38
14 600030 SSE A
176.93 1.32
17 600276 SSE A 173.43 1.30
16 600887 SSE A
171.45 1.28
19 600016 SSE A 157.38 1.18
18 601328 SSE A
149.93 1.12
Total 7,292.49 54.44
20 03968 SEHK H
Exchange Distribution by Market Capitalisation Sector Distribution by Market Capitalisation
SEHK:The Stock Exchange of Hong KongSSE: Shanghai Stock ExchangeSZSE: Shenzhen Stock Exchange
(No. of Constituents in brackets)
Top 20 Constituents by Weight
(No. of Constituents in brackets)
SEHK Mainland Stocks , 44.11%
(40)
SSE Shares , 43.84% (61)
SZSE Shares , 12.05% (19)
All information contained herein(the ''Information'') is provided for reference only, China Exchanges Services Company Limited (CESC) endeavours to ensure the accuracy and reliability of the information butmakes no warranty or representation as to its accuracy, completeness, reliability or suitability for any particular purpose. CESC accepts no liability(whether in tort or contract or otherwise) whatsoever to anyperson for any loss or damage arising from any inaccuracy or omission in the information or from any decision, action or non-action based on or in reliance upon the information.
None of the Information is intended to constitute investment advice or a recommendation to make (or refrain from making) any kind of investment decision. Any person intends to use the Information or anypart thereof should seek independent professional advice.
Distribution, redistribution, reproduction, modification, transmission, use, reuse and/or storage of the Information in whole or in part, in any form or by any means are strictly prohibited without the prior writtenpermission of CESC.
The Information is provided without warranties of any kind, either expressed or implied, including warranties of merchantabil ity, merchantable quality, title, fitness for a particular purpose, security andnon-infringement. China Securities Index Co.,Ltd.(CSI) will make its commercially reasonable endeavors to ensure the accuracy and reliability of the information provided, but does not guarantee its accuracy and reliability and accepts no liability (whether in tort or contract or otherwise) for any loss or damage suffered by any person arising from any inaccuracies or omissions or for any reliance placed on such information.
©2019 China Exchanges Services Company Limited. All rights reserved.
Weightings may not add upto the total due to rounding
CESC is a joint venture of HKEX, SSE and SZSE 2
Remarks: Banks, Capital Markets, Insurance, Real Estate and Other Financials are grouped as Financials
0.00%
5.00%
10.00%
15.00%
20.00%
25.00%
30.00%
TRI -Total Return Index
Source: CESC, CSI, as at 31 March 2016
Annualised Return (%) Volatility (%)
Index
Level1M 3M 6M YTD 1Y 3Y 5Y 1Y 3Y 5Y 1Y 3Y 5Y
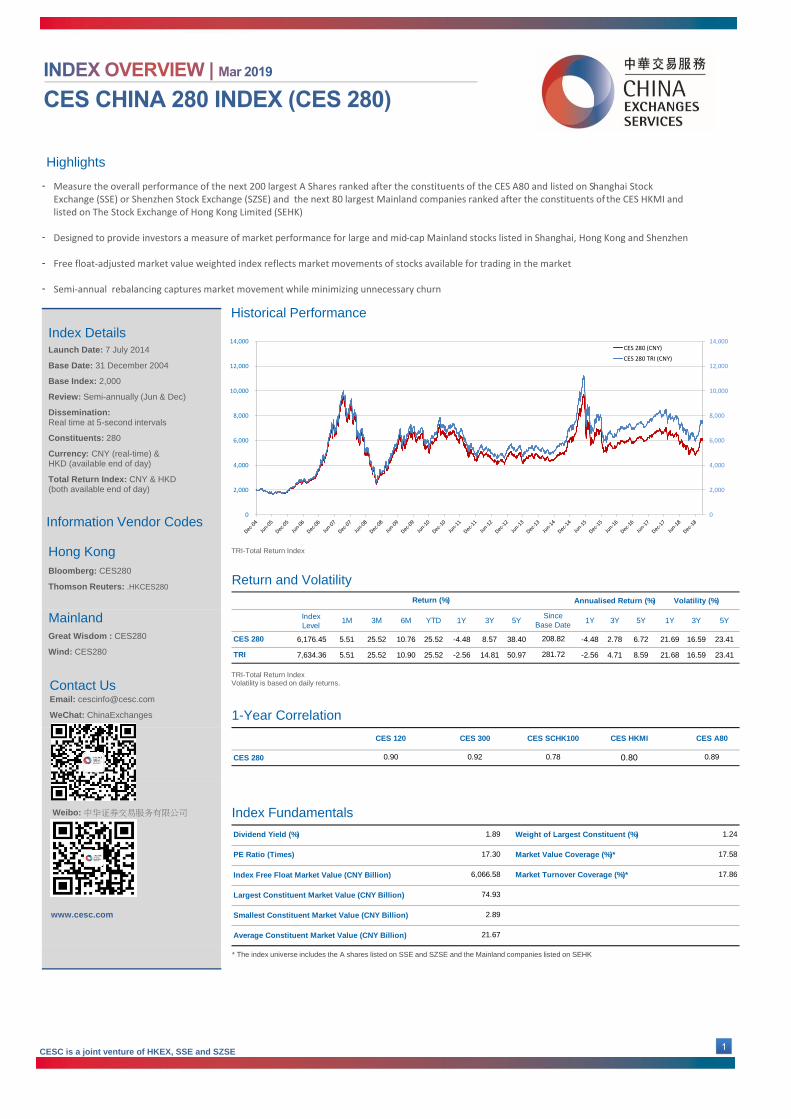
6,176.45 5.51 25.52 10.76 25.52 -4.48 8.57 38.40 -4.48 2.78 6.72 21.69 16.59 23.41
7,634.36 5.51 25.52 10.90 25.52 -2.56 14.81 50.97 -2.56 4.71 8.59 21.68 16.59 23.41
TRI -Total Return Index
Volatility is based on daily returns.
Source: CESC, CSI, as at 31 March 2016
CES 280
17.86
Largest Constituent Market Value (CNY Billion) 74.93
Index Free Float Market Value (CNY Billion) 6,066.58 Market Turnover Coverage (%)*
Average Constituent Market Value (CNY Billion) 21.67
Smallest Constituent Market Value (CNY Billion) 2.89
Market Value Coverage (%)* 17.58
Dividend Yield (%) 1.89 Weight of Largest Constituent (%) 1.24
PE Ratio (Times) 17.30
CES A80
0.89
CES 300
0.92
CES HKMI
0.80
CES SCHK100
0.78
CES 120
0.90
Return (%)
Since
Base Date
CES 280 208.82
TRI 281.72
Highlights
Measure the overall performance of the next 200 largest A Shares ranked after the constituents of the CES A80 and listed on Shanghai Stock Exchange (SSE) or Shenzhen Stock Exchange (SZSE) and the next 80 largest Mainland companies ranked after the constituents of the CES HKMI and listed on The Stock Exchange of Hong Kong Limited (SEHK)
Designed to provide investors a measure of market performance for large and mid-cap Mainland stocks listed in Shanghai, Hong Kong and Shenzhen
Free float-adjusted market value weighted index reflects market movements of stocks available for trading in the market
Semi-annual rebalancing captures market movement while minimizing unnecessary churn
-
-
-
-
Historical Performance
Return and Volatility
1-Year Correlation
Index Fundamentals
Index DetailsLaunch Date: 7 July 2014
Base Date: 31 December 2004
Base Index: 2,000
Review: Semi-annually (Jun & Dec)
Dissemination: Real time at 5-second intervals
Constituents: 280
Currency: CNY (real-time) & HKD (available end of day)
Total Return Index: CNY & HKD (both available end of day)
Information Vendor Codes
Bloomberg: CES280
Thomson Reuters: .HKCES280
Hong Kong
Mainland
Great Wisdom : CES280
Wind: CES280
Contact UsEmail: [email protected]
WeChat: ChinaExchanges
* The index universe includes the A shares listed on SSE and SZSE and the Mainland companies listed on SEHK
0
2,000
4,000
6,000
8,000
10,000
12,000
14,000
0
2,000
4,000
6,000
8,000
10,000
12,000
14,000CES 280 (CNY)
CES 280 TRI (CNY)
TRI-Total Return Index
TRI-Total Return IndexVolatility is based on daily returns.
CESC is a joint venture of HKEX, SSE and SZSE1
Weibo: 中华证券交易服务有限公司
www.cesc.com
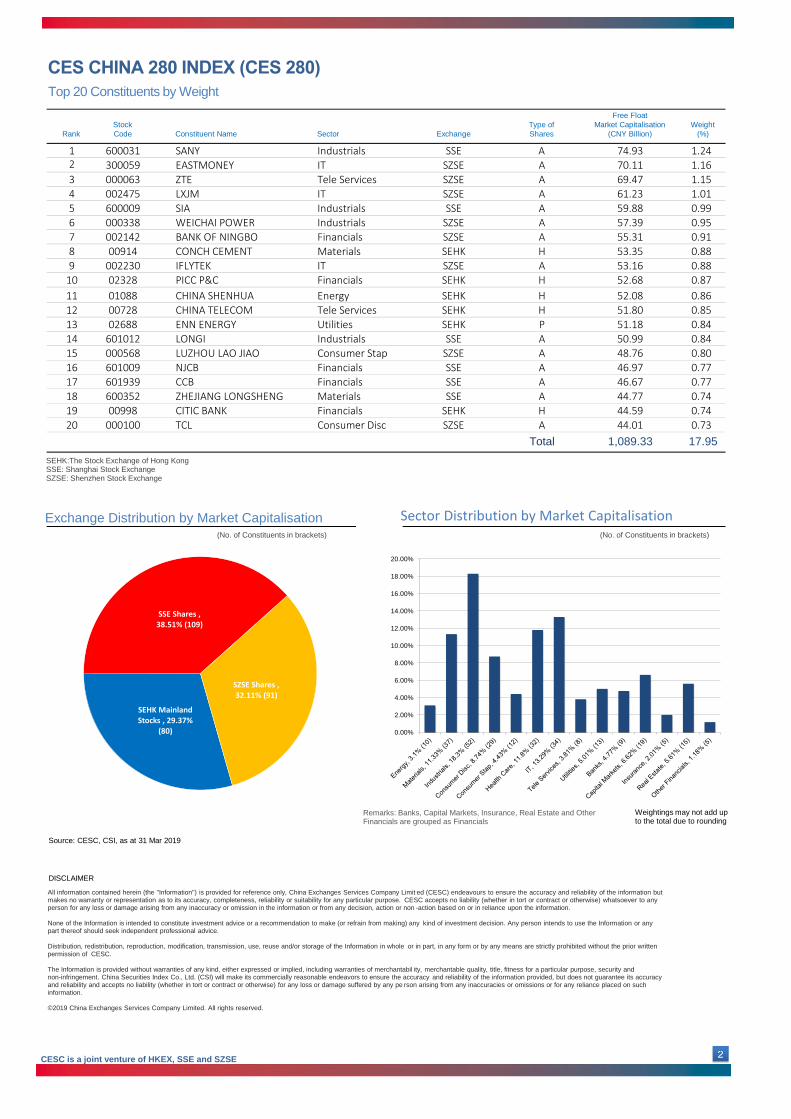
SANY IndustrialsEASTMONEY ITZTE Tele ServicesLXJM IT
SIA IndustrialsWEICHAI POWER IndustrialsBANK OF NINGBO Financials
CONCH CEMENT MaterialsIFLYTEK ITPICC P&C Financials
CHINA SHENHUA Energy
CHINA TELECOM Tele ServicesENN ENERGY UtilitiesLONGI IndustrialsLUZHOU LAO JIAO Consumer StapNJCB Financials
CCB FinancialsZHEJIANG LONGSHENG MaterialsCITIC BANK Financials
TCL Consumer Disc
TRI -Total Return Index
Source: CESC, CSI, as at 31 March 2016
Source: CESC, CSI, as at 31 Mar 2019
DISCLAIMER
Total 1,089.33 17.95
44.59 0.74
20 000100 SZSE A 44.01 0.73
19 00998 SEHK H
46.67 0.7718 600352 SSE A 44.77 0.7417 601939 SSE A
48.76 0.8016 601009 SSE A 46.97 0.7715 000568 SZSE A
51.18 0.8414 601012 SSE A 50.99 0.8413 02688 SEHK P
52.08 0.86
12 00728 SEHK H 51.80 0.85
11 01088 SEHK H
53.16 0.8810 02328 SEHK H 52.68 0.879 002230 SZSE A
55.31 0.91
8 00914 SEHK H 53.35 0.88
7 002142 SZSE A
59.88 0.996 000338 SZSE A 57.39 0.955 600009 SSE A
69.47 1.154 002475 SZSE A 61.23 1.013 000063 SZSE A
1 600031 SSE A 74.93 1.242 300059 SZSE A 70.11 1.16
Stock
CodeRank Constituent Name Sector Exchange
Type of
Shares
Free Float
Market Capitalisation
(CNY Billion)
Weight
(%)
SEHK:The Stock Exchange of Hong KongSSE: Shanghai Stock ExchangeSZSE: Shenzhen Stock Exchange
Top 20 Constituents by Weight
(No. of Constituents in brackets)
Weightings may not add up to the total due to rounding
All information contained herein (the ''Information'') is provided for reference only, China Exchanges Services Company Limit ed (CESC) endeavours to ensure the accuracy and reliability of the information butmakes no warranty or representation as to its accuracy, completeness, reliability or suitability for any particular purpose. CESC accepts no liability (whether in tort or contract or otherwise) whatsoever to anyperson for any loss or damage arising from any inaccuracy or omission in the information or from any decision, action or non -action based on or in reliance upon the information.
None of the Information is intended to constitute investment advice or a recommendation to make (or refrain from making) any kind of investment decision. Any person intends to use the Information or anypart thereof should seek independent professional advice.
Distribution, redistribution, reproduction, modification, transmission, use, reuse and/or storage of the Information in whole or in part, in any form or by any means are strictly prohibited without the prior writtenpermission of CESC.
The Information is provided without warranties of any kind, either expressed or implied, including warranties of merchantabil ity, merchantable quality, title, fitness for a particular purpose, security andnon-infringement. China Securities Index Co., Ltd. (CSI) will make its commercially reasonable endeavors to ensure the accuracy and reliability of the information provided, but does not guarantee its accuracy and reliability and accepts no liability (whether in tort or contract or otherwise) for any loss or damage suffered by any pe rson arising from any inaccuracies or omissions or for any reliance placed on such information.
©2019 China Exchanges Services Company Limited. All rights reserved.
Exchange Distribution by Market Capitalisation Sector Distribution by Market Capitalisation(No. of Constituents in brackets)
SEHK Mainland Stocks , 29.37%
(80)
SSE Shares , 38.51% (109)
SZSE Shares , 32.11% (91)
CESC is a joint venture of HKEX, SSE and SZSE
Remarks: Banks, Capital Markets, Insurance, Real Estate and Other Financials are grouped as Financials
0.00%
2.00%
4.00%
6.00%
8.00%
10.00%
12.00%
14.00%
16.00%
18.00%
20.00%