hsbc chicago investor roadshow
TRANSCRIPT

ChicagoInvestor Roadshow
3 December 2007

Company Logo
2
Disclosure statement
This presentation, including the accompanying slides and additional presentations and subsequent discussion, contains certain forward-looking information with respect to the financial condition, results of operations and business of HSBC Holdings plc, HSBC Finance Corporation, HSBC USA Inc., HSBC Bank Canada and HSBC North America Holdings Inc. This information represents expectations or beliefs concerning future events and is subject to unknown risks and uncertainties. This information speaks only as of the date on which it is provided. Additional detailed information concerning important factors that could cause actual results to differ materially is available in the HSBC Holdings plc Annual Report and the HSBC Finance Corporation and HSBC USA Inc. Annual Reports on Forms 10-K for the year ended December 31, 2006, HSBC Holdings plc Interim Report for the period ended June 30, 2007, and the HSBC Finance Corporation and HSBC USA Inc. Quarterly Reports on Forms 10-Q for the periods ended March 31, 2007, June 30, 2007 and September 30, 2007.
Please further be advised that Regulation FD prohibits HSBC representatives from answering certain, specific questions during the Q&A session. You may get copies of the HSBC Finance Corporation document referred to above free by visiting EDGAR on the SEC Web site at www.sec.gov.
These materials do not constitute an offer to sell, or the solicitation of an offer to buy, any security of HSBC Finance Corporation or any other issuer.
HSBC Holdings plc reports financial results in accordance with International Financial Reporting Standards (“IFRSs”) as endorsed by the EU. EU endorsed IFRSs may differ temporarily from IFRSs, as published by the IASB, if a new or amended IFRS has not been endorsed by the EU by the period end. There were no unendorsed standards affecting this document. As at September 30, 2007, there is no difference between IFRSs as endorsed by the EU and IFRSs as issued by the IASB in terms of their application to HSBC.
IFRSs comprise accounting standards issued by the International Accounting Standards Board and its predecessor body and interpretations issued by the International Financial Reporting Interpretations Committee and its predecessor body.
All amounts, unless otherwise stated, represents IFRS Management Basis of accounting.
IFRS Management Basis assumes that the mortgages and private label customer loans transferred to HSBC’s US banking subsidiary, HSBC Bank USA, N.A. (“HSBC Bank USA”), have not been sold and remain on our balance sheet. Such customer loans continue to be managed and serviced by HSBC Finance Corporation without regard to ownership.

Company Logo
3
Presentations
• HSBC – North America (USA and Canada)
• Operations and Credit
• Consumer Lending and Mortgage Services
• Bank Card, Retail Cards and Group Card
• HSBC Global Technology
Brendan McDonagh and Iain Mackay
Niall Booker and Bruce Fletcher
Tom Detelich
Walter Menezes
Ken Harvey

HSBC North AmericaHSBC NORTH AMERICA
BRENDAN MC DONAGH CHIEF EXECUTIVE OFFICER, HSBC Finance Corporation CHIEF OPERATING OFFICER, HSBC North America Holdings Inc
IAIN MACKAYCHIEF FINANCIAL OFFICER, HSBC North America Holdings Inc
3 December 2007

Company Logo
5
Agenda
• HSBC – North America (USA and Canada)
• HSBC Finance Corporation
• Global Consumer Finance

Company Logo
6
HSBC – North America (USA and Canada) profile
• A top 10 US bank holding company, with assets exceeding USD500 billion(1)
at 30 June 2007 • Over 56,000 employees• Operating in over 46 states and across Canadian provinces• Comprised 17 per cent of Group’s profit before tax in 1H 2007
– HSBC Holdings plc publishes geographic results on a semi-annual basis. North American subsidiaries HSBC Finance Corporation and HSBC USA Inc have published 3Q results indicating a significant decline in profit before tax in 3Q 2007
(1) International Financial Reporting Standards (IFRS) basis

Company Logo
7
HSBC North America Holdings Inc Legal entity structure
HSBC Holdings plc
HSBC North AmericaHoldings Inc
HSBC Bank USA, NA HSBC Securities (USA) Inc
HSBC Finance Corporation HSBC USA Inc HSBC Markets (USA) Inc HSBC Bank Canada
Company Logo
8
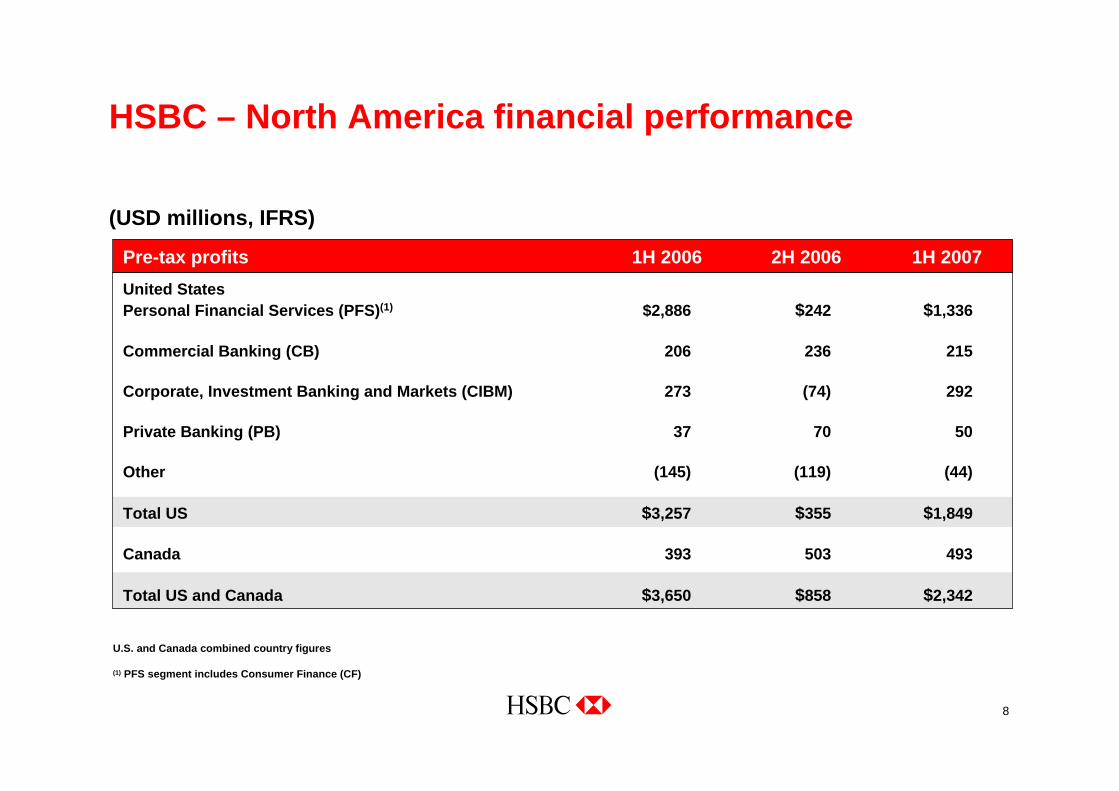
HSBC – North America financial performance
(USD millions, IFRS)
Pre-tax profits 1H 2006 2H 2006 1H 2007United StatesPersonal Financial Services (PFS)(1) $2,886 $242 $1,336
Commercial Banking (CB) 206 236 215
Corporate, Investment Banking and Markets (CIBM) 273 (74) 292
Private Banking (PB) 37 70 50
Other (145) (119) (44)
Total US $3,257 $355 $1,849
Canada 393 503 493
Total US and Canada $3,650 $858 $2,342
U.S. and Canada combined country figures
(1) PFS segment includes Consumer Finance (CF)

Company Logo
9
Agenda
• HSBC – North America (USA and Canada)
• HSBC Finance Corporation
• Global Consumer Finance

Company Logo
10
HSBC Finance Corporation businesses
Consumer and Mortgage Lending• One of the largest consumer lending companies, in 46 states• Real estate secured and unsecured loans to non-prime customers• HFC and Beneficial brand names• Over three million active customer accounts
Auto Finance• Provider of financing for new and used vehicles• Purchases consumer contracts from approximately 9,300 active dealers in 47 states• Approximately 820,000 active customer accounts

Company Logo
11
HSBC Finance Corporation businesses… continued
Card and Retail Services • Fifth largest MasterCard(1) or VISA(1) issuer in the US (based on receivables)• Programs include the GM Card® (GM), the AFL-CIO Union Plus® card, HSBC-branded
and Direct Merchants Bank cards• Offers credit cards to consumers underserved by traditional providers in the US • One of the leading issuers of private label (merchant-branded) credit cards in the US
United Kingdom• Mid-market consumer lender • 148 Beneficial Finance branches• Approximately 1.5 million customer accounts
(1) MasterCard is a registered trademark of MasterCard International, Inc; Visa is a registered trademark of Visa USA, Inc

Company Logo
12
HSBC Financial Corporation (Canada)• Secured and unsecured loans and lines of credit, credit cards, and real estate secured
loans• Branches in 10 provinces with merchant and auto dealer relationships
Taxpayer Financial Services • Provider of tax-related financial products marketed through unaffiliated professional
tax preparer locations and tax preparation software providers• Has serviced nearly 11 million customers annually
Insurance Services• Offers a variety of insurance products (credit life, disability, unemployment, accidental
death, term/whole life, etc) to customers in the US and Canada
HSBC Finance Corporation businesses… continued

Company Logo
13
9%
10%
7%
4%
6%
Consumer Lending
Mortgage Services
Credit Services
Private Label
Auto Finance
WEST
Represents per cent distribution of consumer receivables (US GAAP) as of 31 December 2006
12%
14%
11%
14%
13%
Consumer Lending
Mortgage Services
Credit Services
Private Label
Auto Finance
CALIFORNIA
21%
25%
26%
40%
16%
Consumer Lending
Mortgage Services
Credit Services
Private Label
Auto Finance
MIDWEST
12%
6%
14%
9%
6%
Consumer Lending
Mortgage Services
Credit Services
Private Label
Auto Finance
NORTHEAST
8%
9%
12%
17%
23%
Consumer Lending
Mortgage Services
Credit Services
Private Label
Auto Finance
SOUTHWEST
19%
12%
14%
10%
12%
Consumer Lending
Mortgage Services
Credit Services
Private Label
Auto Finance
MID ATLANTIC
19%
24%
16%
6%
24%
Consumer Lending
Mortgage Services
Credit Services
Private Label
Auto Finance
SOUTHEAST
HSBC Finance CorporationNationwide coverage and well diversified

Company Logo
14
810bps900bps30.6%38.7%39.6%Cost efficiency ratio (3)
310bps380bps35.2%38.3%39.0%Cost efficiency ratio – normalised (4)
n/an/a(1,343)––Goodwill impairment
(838.3%)(323.8%)USD(1,580)USD214USD706Profit (Loss) before tax (2)
versus 2Q 2007
versus 3Q 20063Q 20072Q 20073Q 2006
5.5%3.8%(1,431)(1,515)(1,488)Total operating expenses excludinggoodwill impairment
0.1%0.4%USD178,339USD178,222USD177,610Customer loans and advances (as at period end)
(30.9%)(45.6%)1,1941,7292,194Net operating income
(59.2%)(122.4%)(3,478)(2,185)(1,564)Loan impairment and other related charges
19.4%24.3%USD4,672USD3,914USD3,758Net operating income before loanimpairment charges (1)
% Better/(Worse)USDm
Note: The figures above are presented on an International Financial Reporting Standards (IFRS) Management Basis. See Note 11 Business Segments of Form 10-Q for the period ended 30 September 2007 for a reconciliation of IFRS to US GAAP.
(1) Includes fair value option income/(loss) of USD(53) million, USD(44) million, and USD606 million for 3Q 2006, 2Q 2007, and 3Q 2007, respectively.(2) 3Q 2007 loss before tax excluding goodwill impairment impact (USD1,343 million relating to Mortgage Services, including Decision One business) is USD(237) million. (3) Cost efficiency ratio excluding the impact of the goodwill impairment charge of $1,343 million in 3Q 2007.(4) Cost efficiency ratio excluding the impact of the goodwill impairment charge of $1,343 million in 3Q 2007, also normalised to exclude the impact of fair value option income/(loss)
of USD(53) million, USD(44) million, and USD606 million for 3Q 2006, 2Q 2007, and 3Q 2007, respectively.
HSBC Finance Corporation – quarterly Financial results

Company Logo
15
3Q 2007 results highlights• 3Q 2007 loss before tax of USD1.6 billion was USD1.8
billion below prior quarter due to goodwill impairment of USD1.3 billion and higher loan impairment charges
• Higher net operating income before loan impairment charges primarily driven by income from fair value option of debt issued as the third quarter was impacted by widening of credit spreads (USD606 million) and higher revenues from Credit Card business (USD232 million), partly offset by lower Mortgage Services revenues
• 3Q 2007 loan impairment charges increased USD1.3 billion (or 59 per cent) from prior quarter largely driven by our US Retail Branch business (USD0.8 billion) and Mortgage Services portfolio (USD0.3 billion)
• Operating expenses, excluding the impact of goodwill impairment, decreased USD84 million (or 5.5 per cent) compared with prior quarter primarily as a result of lower marketing expenses, lower compensation expense and the impact of entity-wide initiatives to reduce costs
(USD billions, IFRS Management basis)
Profit before tax
0.7
-0.7
0.9
-0.3
0.2
-1.3
PBT GW impairment
-1.6
3Q 2007
2Q 2007
3Q 2006
4Q 2006
1Q 2007
HSBC Finance Corporation Financial summary

Company Logo
16
• 3Q 2007 loan impairment charges excluding Mortgage Services increased 56 per cent (USD1 billion) over 2Q 2007 to USD2.8 billion – 3Q 2007 market driven deterioration impacted US Retail Branch real estate secured portfolios (USD0.5 billion)– Increase in loan impairment charges related to US Retail Branch unsecured portfolios (USD0.4 billion) due to
seasoning, deterioration of 2006 direct mail vintages in certain geographic regions and increased bankruptcy filings as compared to exceptionally low filings in 2006 following bankruptcy legislation change in October 2005
– Increase in loan impairment charges in Cards and Other portfolios (USD0.1 billion) as a result of growth, mix changes, seasoning and increased bankruptcy filings
• Loan impairment charges in the Mortgage Services portfolio included expected portfolio seasoning and the impact of worsening mortgage industry trends
1.6
3.2
1.92.2
3.5
1.4 1.6 1.51.8
0.2
1.6
2.8
0.70.40.4
0.00.51.01.52.02.53.03.5
3Q 2006 4Q 2006 1Q 2007 2Q 2007 3Q 2007
Total Excluding Mortgage Services Mortgage Services
HSBC Finance CorporationLoan impairment charges
(USD billions, IFRS Management basis)

Company Logo
17
(USD billions, IFRS Management basis)
• Strategic reduction in Mortgage Services loan portfolios has slowed in 3Q 2007 due to marketled factors
• Although growth experienced in all other portfolios during 3Q 2007, changes in product offeringsand business strategies, including reduction in branch offices and tightening in underwriting standards will result in reduced volumes in the Branch Real Estate Secured and Other loanportfolios in future periods
38.941.546.749.651.651.549.344.3
54.352.951.549.746.244.443.141.3
30.229.62828.326.325.724.725.8
20.319.819.520.619.31918.419.7
13.21312.912.812.712.111.9
21.421.421.421.621.521.320.920.8 12.4
0.0
40.0
80.0
120.0
160.0
200.0
3Q 20072Q 20071Q 20074Q 20063Q 20062Q 20061Q 20064Q 2005
163.8 168.5 174.3177.5 182.5
Mortgage Services Branch Real Estate Secured Credit Cards Private Label Cards Motor Vehicle Finance Other
179.9 178.1 178.3
HSBC Finance CorporationCustomer loans and advances

Company Logo
18
• Strategic repositioning of the Mortgage Services business– Closed wholesale broker mortgage
origination business (3Q 2007)– Ceased correspondent originations (1H
2007)• Strengthened structure with Chief
Operating Officer role extended to cover creditrisk organisation
• Discontinuation of pre-season tax products by Taxpayer Financial Services
• Sale of UK Insurance operations• Outreach and assistance to our
mortgage customers
• Right-sizing and recalibrating our businesses– Proactively reducing risk through refined
products in Retail Branch business– Reducing branch network to align with
demand and reduced credit risk appetite• Enhance customer value, service and
experience– Cards changes related to fee and finance
charges• Actions highlight HSBC’s commitment to
our stakeholders and businesses• Strengthening businesses for the future
HSBC Finance Corporation2007 Strategic actions and initiatives

Company Logo
19
In unpredictable, turbulent markets, focused on what we can control:• Continued Mortgage Services portfolio reductions• Tightening of underwriting and intensified risk management • Reducing Retail Branch network • Cost reductions across the organisation• High brand values and strong customer value • Risk management programs – increased within Retail Branch, Cards and Retail
Services • Review of businesses not meeting optimal returns • US Credit Card business development of global cards business
HSBC Finance CorporationOngoing areas of focus

Company Logo
20
Agenda
• HSBC – North America (USA and Canada)
• HSBC Finance Corporation
• Global Consumer Finance

Company Logo
21
Group Consumer Finance
Core consumer lending platforms
US (HSBC Finance Corp)
Brazil (Losango)
Mexico
Leveraging global expertise across
Credit bureau environments
Product offerings
Distribution channels
Regulatory environments
Underwriting processors
Leveraging global expertise across
Argentina
Australia
Central Eastern Europe
China
India
Indonesia
Middle East

Company Logo
22
Global Consumer Finance – update
The Global Consumer Finance (CF) expansion is a benefit of Household acquisition – leveraging expertise by exporting management throughout the Global Network. • Globally, Consumer Finance continues to be a large, growing and profitable market• Acquisition of Banistmo in November 2006 provides access to the Central American
region’s 83 million under-banked population• Four strong PoS retail partnerships have been launched in China with Wal-Mart, Best
Buy, Suning and New World department stores• India operating out of 29 CF branches in 22 cities• Indonesia has opened 52 CF branches in the past 15 months• Preparing existing CF businesses for growth in Czech Republic, Hungary, Poland
and Slovakia

Company Logo
23
• 75 per cent cards on a global platform• Top five global issuer over 120 million cards in force• Issuing in 40 countries, with cutting-edge analytics and
strong marketing• 10 countries with more than one million cards, up from six in 2003• Key partnerships including:
– Marks & Spencer (UK) | General Motors (USA) | Dixons (CEE)– Best Buy (US, Canada, China, Mexico) | Wal-Mart through the BoCom JV
(China)– Accor Hotels, Ricardo Eletro and DMA (Brazil), Delta Airlines
Global distribution
Global scale
Credit cards: A leading global proposition in cards building on our global presence and scale economies

Operations and creditHSBC FINANCE CORPORATION
NIALL BOOKERCHIEF OPERATING OFFICERHSBC FINANCE CORPORATION
BRUCE FLETCHERCHIEF RETAIL CREDIT OFFICERHSBC NORTH AMERICA HOLDINGS INC
3 December 2007

Company Logo
25
Who are we?
B. McDonaghChief Executive Officer
N. BookerChief Operating Officer
J. DavisOperational Risk
B. FletcherCredit Risk
T. MurphyPortfolio
Management
G. MilesDefault Service-Risk Portfolio
K. LampeterInformation
Security and Fraud
M. MelasCorporate
Real Estate
D. Neenan *Canada
S. TaitTaxpayer Financial
Services
J. UphoffHFC UK
T. KimbleGlobal Initiatives
New COO Role• Encompasses risk and business line
responsibilities• Tighten and enhance risk control
environment• Portfolio management
HSBC Finance Corporation*Functional reporting line to L. Gordon

Company Logo
26
Who is the typical HSBC Finance customer?
• Financially unsophisticated
• Payment sensitive versus pricing sensitive
• Limited discretionary income
• Living the ‘American Dream’ of homeownership
• Have tapped equity in the house to improve monthly cash flow or meet need for credit
• Some seasonal workers and some with second jobs
• Average age ranges ~ 40 - 50
• Average annual income ranges ~ USD65-78K
Lifestyle
• Leveraged
• Inconsistent payers
• Minimal savings
• Some with irregular cash flow
• Sensitive to payment shock
• Limited disposable income
• Willing to tolerate payment reminders when late
Credit behavior

Company Logo
27
What has changed for the customer?
• Declining or stagnant home prices
• Reduced credit availability
• Expiration of teaser rate ARM products
• Employment challenges– Unemployment rate has started to rise in
selected MSAs
• Increase in gasoline and heating costs
Event• Inability to use home equity as
income
• Inability to refinance into a lower payment
• Significant payment shock without a way to refinance elsewhere
• Difficult to earn extra income to handle extra expenses; need to change lifestyle
• Increased expenses for other necessities compete for already limited income
Reaction

Company Logo
28
What are we hearing from customers?
HSBC conducted focus groups with both current and delinquent customers to gain insight into the customer mindset
A typical HSBC Finance customer:• Is aware of the ‘mortgage meltdown’• In most areas, sees mortgage payments as a high priority • If they have the money to pay the mortgage, declining home prices in themselves are not a factor driving higher
defaults • Is working hard to make ends meet, eg second job, cutting entertainment expenses• Is willing to work with lenders, but feels that lenders do not care to help, and therefore avoids collection calls• Also uses other types of debt
Some HSBC Finance customers are:• Recent homeowners who are less attached to the property and thus are more likely not to pay • Already delinquent and are more likely to roll forward• Multiple homeowners by circumstances and in some cases de-facto novice investors• Not able to use their home as a ‘piggy bank’ anymore• Facing mortgage debt in excess of their home’s value, especially in areas with significant declines in housing
prices

Company Logo
29
How should we manage our business?
Factors that we can control include the following:• Reduce the risk profile to deal with the tougher environment and portfolio
performance• Enhance default management and focus on loss mitigation
– Proactive account management– Concentrate on keeping people in their homes where reasonable payments can be made– Find pragmatic solutions when reasonable amounts can not be paid
– Strengthen collection strategy and capacity– Create and implement new customer treatments
• Control expenses

Company Logo
30
What is driving our performance?
Market• The unprecedented credit tightening and worsening housing market (both unknown depth and
duration) is affecting both performance and liquidation, as well as the outlook for next year, and is also affecting employment
Vintage• While performance of all vintages deteriorated recently, it is greater in the 2006 vintage
Customer risk profile• Higher risk customers are driving higher delinquency and loss, including low score, some product
types (second lien, stated income, etc) and low disposable income
ARMs• Delinquency rates are rising faster for ARMs
Geography• The markets with higher home price depreciation rates are seeing higher unemployment rates and
higher delinquency

Company Logo
31
Which geographies are impacted most?
• Some metropolitan areas, notably in California and Florida, have rising unemployment as well as falling housing prices and may already be in recession
-6.6%Washington-3.6%New York-9.0%Las Vegas-4.6%San Francisco-7.0%Los Angeles-9.6%San Diego
-10.0%MiamiY/Y % change
S&P/case-Shiller Monthly Home Price Indices September 2007
• States that saw large increase in property values are now seeing large increase in unemployment rates (1)
• HSBC Finance exposure in California is approximately 13 per cent(2), well under the industry’s 22 per cent(1)
(1) Market Data sourced from www.creditforecast.com (based on 5 per cent sample of Equifax Credit Bureau)(2) HSBC Finance data is from 31 December 2006 Form 10-K
01/97 01/98 01/99 01/00 01/01 01/02 01/03 01/04 01/05 01/06 01/07
4
5
6
Unemployment rateUS
Unemployment rate
01/97 01/98 01/99 01/00 01/01 01/02 01/03 01/04 01/05 01/06 01/07
5
6
7
CA
01/97 01/98 01/99 01/00 01/01 01/02 01/03 01/04 01/05 01/06 01/073
6
5
6
Unemployment rateFL
4

Company Logo
32
What can we do?
Reduce risk profile• Discontinue operations of Mortgage Services, Decision One, and the sub-prime mortgage broker
based business in HSBC Financial (Canada)• Tighten product and underwriting
– Loan-to-value, credit score, debt-to-income– Retail Services and Canada originations
• Credit Card Services has slowed credit line increases and balance transfers• Discontinue ARMs, PHL and direct marketing products• Elimination of some Taxpayer Financial Services products• Introduced new card fee practices
Strengthen risk management and controls• Reporting lines• Credit authorities• Minimum standards• Better articulation of risk appetite• Strategic portfolio management

Company Logo
33
How do we mitigate losses through default management? Main goal• To identify customer needs and match them with the right treatment option to prevent foreclosure and build
sustainable customer relationships
What are we doing today?• Increased collection capacity• Proactive ARM contacts
– Write and call customers who have adjustable rate mortgage loans nearing the first reset that we expect will be the most impacted by a rate adjustment
– Assess their ability to make adjusted payments, and modify as appropriate and in accordance with defined policies– Allow time for the customer to seek alternative financing or improve their individual situation– Usually provide a 12-month temporary interest rate relief– Made more than 31,000 outbound contacts and modified more than 8,000 loans (USD1.2 billion) since the start of the programme in
October 2006
• Continue to manage Foreclosure Avoidance Program for delinquent customers, programme designed to provide relief to qualifying homeowners through either loan restructuring or modifications
• Loan Sales in 2Q 2007– Due to adverse market conditions, additional sales have been difficult
• In Mortgage Services, changed and improved risk segmentation to facilitate strategy – Market: market risk varies by location– Product: risk varies by loan product, lien position, and doc type– Customer: risk determined by originating credit score, loan performance, bureau data, economic factors

Company Logo
34
Here’s how we deal with an ARM Reset customer
Process• Customer receives an ‘ARM Awareness Letter’
advising of pending ARM rate increase, and inviting them to call us to discuss
• Letter is followed up with an outbound callout campaign
• Customers that we speak to (either inbound or outbound), are ‘assessed’ on their ability to handle the increased payment
• Customers that cannot handle it are offered a 12-month temporary modification; payment relief varies from ‘leave flat’ up to a percentage just below their reset amount (based on their financials)
• Customers that appear to qualify for a refinance are also transferred to a branch or internal sales group
Screenshot of MS ARM ResetModification tool

Company Logo
35
Treatment enhancements
Illustration of risk segmentation and possible treatment
1. Low value of home limits options2. Loan type creates difficulty for customer3. Behavior of customer defines risk4. Customer and market risk 5. Product and customer risk6. Market and product risk7. Market, product and customer risk
Specialise treatments for first liens, second liens and dual liens (piggy)
Treatments vary based on riskExamples include:
• Restructure• Refinance• Modify terms of the loan• Negotiate short sale• Foreclosure/Liquidate
Customer riskHigh
3Highest risk area
4HH
5HH
HH6
HHH7
Market riskHigh
1 Product riskHigh
2

Company Logo
36
What else are we working on in Default Management?
Current practices are under evaluation to determine level of success and impact to P&L.
As of now, we plan to:• Do more long-term modifications, rewrites, and extensions• Determine the profitability of foreclosure versus modification• Enhance the bid price on foreclosure versus walk process• Improve treatment tools• Implement improved segmentation across customer risk, product risk, and market risk in
Consumer Lending

Company Logo
37
What are we doing to reduce costs?
Right sizing the business to drive lower costs, higher efficiencies and effectiveness.
Consolidation/Integration/Cost-related initiatives• Operations consolidation
– Expanded use of operational support provided by GSCs– Consolidate similar functions– Global best practices (Importer/Exporter)
• Infrastructure integration– HR, Finance, Credit Risk, Analytics, Systems and Collections
• Strategic cost initiatives– Multiple corporate and business unit cost reduction initiatives

Company Logo
38
FTE considerations
Domestic FTE• Branch FTE
– Tied to number of branches = Will decrease pro rata as number ofbranches declines
• Non-branch FTE– Slight decline over last five years while shift to offshore resources occurred over same time
period to support business growth
Offshore FTE• Leverage HSBC Global Servicing Centres (GSC) benefiting from lower costs while
keeping internal operational control• Includes both operational and analytical resources

Company Logo
39
Operating Expense• Savings generated through efficiencies and lower offshore costs allowed for
re-investment in marketing and system spend• Even with the above investments, cost-to-income ratio is 36.8 per cent (1) currently
Operating expenses
(1) From HFC 3Q 2007 Form 8-K, page 5 normalised to exclude goodwill impairment charge and fair value option income

Appendix

Company Logo
41
TFS update and 2007 accomplishments
Strategic review – reducing risk, complexity and volumes• Elimination of high risk products (eg pre-season loans)• Reduction of business partners through non-renewal or early release of contracts• Product availability period shortened

Company Logo
42
Canada update and 2007 accomplishments
Credit quality• Canadian economy is experiencing, strong growth, low unemployment and low levels of delinquency. Non-prime
mortgage business is more conservative (eg no reset arms etc) relative to the US. Delinquency at historical lows and likely to be impacted from US in certain sectors and geographies, eg automotive and Windsor. Seeing higher funding costs that have impacted monoline players
• Overall performance is meeting corporate objectives
Continued focus on costs and efficiency• Largest private label player in Canada, after signing up Best Buy, the largest electronics retailer in Canada
Relaunched Premier MasterCard in line with global launch• Improvements in infrastructure and capabilities
– Risk management, marketing analytics, pricing and product profitability, and vendor management
• Despite benign credit environment have proactively moved to offset future risk and impact of higher funding cost– Implemented credit risk changes to exit the highest risk segments– Exited the broker originated mortgage business– Rationalised Consumer Lending branch network – branch rationalisation and region consolidation – Rationalised Private Label business – focused on larger relationships– Strategic review of other businesses in progress
• Developed and now executing a plan to gain and sustain a competitive advantage by leveraging global synergy– Offshored some operations to Asia and more initiatives planned– Implementing major project to generate further synergy with the US

Company Logo
43
UK update and 2007 accomplishments
Volume growth key in driving improved results:• Branch network: Focus on secured loan growth to decrease credit exposure and build scale• Retail Partnerships: Focused on major retailers
– Launched new B&Q program in February, UK’s largest home improvement retailer– Extended the existing Dixon Store Group contract– Exited relationships with smaller retailers to control costs and improve efficiency
Improvement in credit quality• 2+ delinquency has improved since the start of the year. This is as a result of improved collections performance,
collection strategies and lower than expected bankruptcy/IVA new entrants, which are lower versus the same period last year
• Significant tightening of process in the areas of credit policy and underwriting criteria
Continued focus on costs and efficiency• Completed the sale of the Hamilton insurance companies to Aviva. This outsourced the manufacture of
insurance and removes a key level of complexity while maintaining revenue streams• Continued focus on right sizing of expense base. Actions to date include:
– Consolidating operations processes into the Birmingham operations centre– Streamlining head office departments– Leveraging offshore resource– Implementing building consolidation plan– Continuing branch rationalisation program

Consumer Lending and Mortgage Services
HSBC FINANCE CORPORATION
TOM DETELICHGROUP EXECUTIVE
3 December 2007

Company Logo
45
HSBC Finance CorporationReal estate secured 2+ delinquency
• 2005 and 2006 vintages in Mortgage Services continue to season. Portfolio sales and the cessation of correspondent acquisitions have a marked impact on the delinquency ratio. As the portfolio declines, the delinquency ratio will continue to increase
• Increase in 2+ delinquencies for Retail Branch real estate secured due to industry-wide worsening of credit environment and broad based deterioration of the US residential property market during 3Q 2007
2.91.9 2.23.4
4.83.9
7.5
3.7
5.8
11.2
7.9
3.6
0
2
4
6
8
10
12
1Q 2006 2Q 2006 3Q 2006 4Q 2006 1Q 2007 2Q 2007 3Q 2007
2+ B ranch R E f irst lien 2+ B ranch R E seco nd lien
2+ M S f irst lien 2+ M S seco nd lien
2+ D
elin
quen
cies
(%)
Total MS RE 2+ delinquency percentage increased from 6.2 per cent at June to 8.2
per cent at September
Total CL RE 2+ delinquency percentage increased from 2.3 per cent at June to 3.2
per cent at September

Company Logo
46
This increase is driven by delinquency deterioration in states that were previously rapidly appreciating in home prices and are now depreciating• Factors such as LTV, FICO, and CGS (proprietary credit score) are not
strongly correlated with deterioration in delinquency performance. However, CGS score continues to rank order risk
• Nine formerly high-appreciation states (CA, FL, AZ, VA, WA, MD, NJ, MA, MN) have seen 2+% grow by over 120 per cent from December 2006 to September 2007 versus less than 20 per cent for rest of the country
• Aggregate 2+ performance in these states is now comparable to the rest of the country. Previously, these states outperformed the national average by a considerable margin

Company Logo
47
CL 2+ delinquency levels are below industry fixed-rate sub-prime. MS compares favorably to total sub-prime because of higher proportion of fixed-rate loans
6.9%
6.2%
5.0%
2.3%
0%
1%
2%
3%
4%
5%
6%
7%
8%
Sub-PrimeTotal
MS RE Sub-PrimeFixed
ConsumerLending RE
CML RE portfolios 2+ versus MBA Industry Benchmark
(June 2007)
16.0%
8.2%7.0%
3.2%
0%
2%
4%
6%
8%
10%
12%
14%
16%
18%
Sub-PrimeTotal
MS RE Sub-PrimeFixed
ConsumerLending RE
CML RE portfolios 2+versus Credit Suisse Industry Data
(September 2007)
Note: MBA measures % of accounts overdue. Credit-Suisse is US dollar based. Consumer Lending and HMS 2+ is US dollar based unless otherwise indicated and includes both first and second lien REMBA 3Q results are expected in the second week of December
Source: MBA National Delinquency Survey, Credit Suisse Heat Report October 2007

Company Logo
48
CML has implemented several measures to manage risk
Limit sub-prime originations to
retail
Reduce origination
capacity
• Reduce the number of branches in the network from 1,359 to 1,000
• Reduced centralised retail originations capacity
• Closed correspondent originations (MS)• Exited Decision One wholesale business
Tighten credit policy
• Eliminate higher risk products such as high LTV home equity (PHL) loans, pre-approved prospect mailings
• Significantly tighten credit policy on lower risk scores, higher LTVs, etc

Company Logo
49
The collapse of higher risk products and pricing in the market may be an opportunity to greater share and profitability for thesurviving retailers
160200
310
530
625600
224
112
380
39%
34%
28%
22%
32%
19%
34%
43%
0
100
200
300
400
500
600
700
2001 2002 2003 2004 2005 2006 1Q2007
2Q2007
3Q2007
Sub-
prim
e m
arke
t orig
inat
ions
(U
SD b
illio
ns)
0%
5%
10%
15%
20%
25%
30%
35%
40%
45%
50%
Shar
e of
reta
il ch
anne
l
Industry sub-prime originations and share of retail channel
Note: Quarterly originations are annualised in the chart
Source: Inside Mortgage Finance, Inside B&C Lending
Market projection
• CL and some other retail players did not participate in the rapid market growth from 2002-05– Cheap money in the secondary market was best tapped by the
broker channel and other for-sale originators– CL did not participate in product driven growth (stated income,
IO, option ARM, ARM). Some other retail players also had lower exposure to these products
• In 2007, retail has been gaining share from wholesale as market has undergone severe contraction– Mix shift to retail and GSE as secondary sub-prime market
disappears– Many retail players had less exposure to products that have
contracted the most, eg Stated Income, ARM, IO products which have contracted more.
• Longer-term, surviving retail players may have an opportunity to hold greater share than in the boom years– Return to more normal HPA– Exotic products do not come back– Market prices risk more appropriately

Company Logo
50
This market view and HSBC objectives for the Finance Company are shaping our business model
Sub-prime market view
• Shrinking market near-term
• HPA returning to long-term average driving a recovery in originations
• Greater retail share: Potential to expand CL share
• Risk priced more appropriately (improved price premiums)
Finance Company objectives
• Lower cost/ improve efficiency
• Reduce balance sheet/ decrease capital intensity
• Lower volatility (credit risk) and impact on HSBC
• Deliver acceptable ROE over the business cycle
New business model elements
• Build future around long-term viable retail origination model
• Shrink portfolio and increase origination for sale through GSE, securitisation and dynamic portfolio management
• Migrate business towards lower credit risk products/cells to limit volatility
• Shrink network size to better manage near-term challenges. Achieve future growth through higher productivity, large-branches and central (call centre) channel growth

Company Logo
51
Execution of our strategic initiatives is critical to successfully migrate the business model
Improve collections
• Fully leverage scale in HMS and CL operations through consolidation• Implement planned enhancements in contact management, borrower
eligibility, loan modifications, call quality, staffing and incentives
Lower cost
• Shrink the branch network to 1,000 branches from 1,359• Reduce support costs in line with the smaller network• Rationalise servicing systems across CML and potentially CCS• Closer integration with Mortgage Corp
Expand product and sourcing
• Launch GSE (Fannie/Freddie) originate-for-sale product• Reinvent the unsecured product as a lower risk product• Shift and expand sourcing in response to lower risk appetite, eg alternatives
to pre-approved mailings
Improve risk adjusted margins
• Improve pricing in segments where competitive intensity has decreased• Expand Fee income

Company Logo
52
Several required elements already exist today
• Focus on sub-prime and near-prime customers
• Belief in our Customer Value proposition
• Face-to-face relationship selling as our primary branch sales approach
• Expanded customer relationships through multiple lending and ancillary products
• Competitive advantage through proprietary risk scoring to predict and manage risk
• Quality as a foundation for our business

Managing the Mortgage Services Portfolio

Company Logo
54
31 December 2005 (USD86 billion)
48%52%
Consumer Lending and all other (USD41.3 bn)
Mortgage Services (USD44.3 bn)
(IFRS management basis)
31 December 2006 (USD99 billion)
50%50%
Consumer Lending and all other (USD49.7 bn)
Mortgage Services (USD49.6 bn)
30 September 2007 (USD93 billion)
58%42%
Consumer Lending and all other (USD54.3 bn)
Mortgage Services (USD38.9 bn)
Mortgage services –Real estate secured portfolio overview

Company Logo
55
Mortgage services –Real estate secured portfolio overview
(IFRS management basis)30 September 2007 (USD38.9 billion)
31.4
7.5
First Lien (81%) Second Lien (19%)
31 December 2006 (USD49.6 billion)
39.4
10.2
First Lein (80%) Second Lien (20%)
31 December 2005 (USD44.3 billion)
36.3
8.0
First Lien (82%) Second Lien (18%)
4.3
21.1
13.5
Fixed rate (54%) Adjustable Rate, excluding I/O (35%) I/O (11%)
6.3
22.5
20.8 Fixed rate (45%) Adjustable Rate, excluding I/O (42%) I/O (13%)
5.2
20.1
19.0 Fixed rate (45%) Adjustable Rate, excluding I/O (43%) I/O (12%)

Company Logo
56
HSBC Finance CorporationAdjustable Rate Mortgages – ARM Resets
• Proactively contacting Mortgage Services customers nearing the first interest rate reset that will be most impacted by a rate adjustment– As appropriate and in accordance with defined policy, loans are modified– 8,000 loans totaling USD1.2 billion have been modified to date
USDbn
10.7
5.14.1
3.0
5.8
4.0
9.9
3.83.0 2.8
5.3
2.9
0.8 1.3 1.10.20.5
1.1
0.0
2.0
4.0
6.0
8.0
10.0
12.0
2007 2008 2H 2007 2008 4Q 2007 2008
Total HBIO Mortgage Services Retail Branch RE
3Q 20074Q 2006 2Q 2007
Note: The reset volumes above do not reflect modifications. Unless customers who have benefited from a loan modification are able to obtain other financings, these loans will also be subject to an interest rate reset at the end of the modification period.

Company Logo
57
HSBC Finance CorporationMortgage Services loans – Vintages
• Continued progress in reduction of 2005 and 2006 vintage balances• Decreased market demand for sub-prime mortgages due to unprecedented
turmoil in the industry resulted in a significant reduction in secondary market demand in 3Q 2007, which contributed to slower portfolio attrition
Vintages (USDbn)
38.9
4.0
6.3
14.2
12.9
1.5
September 2007
41.546.749.6
4.34.85.2Pre 2004
6.78.39.32004
15.618.019.92005
13.515.015.22006
1.40.62007
June 2007March 2007December 2006

Company Logo
58
Significant changes are in place for the Mortgage Services servicing operation
Strategies
• Segmented highest risk accounts • Implemented modification programs for upcoming reset and
delinquent customers• Categorise accounts based on market, product and customer risk• Developed customised cure/liquidation programs
People• The senior management team has been significantly upgraded (80 per cent in
role less than 12 months)• Dedicated Managing Director for Ring Fence in place
Analytics• Director of analytics from CL installed over MS• CL analytics best practices installed for MS (ie segmentation and
dialer strategies)
Process
• Optimised schedules to increase prime contact hour penetration• Installed new call model for collections• Changed incentive plan to focus cash collections• Created governance team and process

Bankcard, Retail Cards and Group Card
HSBC FINANCE CORPORATION
WALTER MENEZESGROUP EXECUTIVE
3 December 2007

Company Logo
60
Agenda
• US Bankcard
• US Retail Cards
• Group Cards

Company Logo
61
US Bankcard overview
• Fifth-largest US MasterCard/Visa issuer• USD29.6 billion in managed receivables• 21 million active accounts• Unique capability to issue all four brands: MasterCard, VISA, American
Express and Discover
Note: results reported on an IFRS Management Basis
Receivables(USD billions)
19.628.2 29.626.0
2004 2005 2006 Sep '07

Company Logo
62
GM Program overview
• Fifteen-year relationship with General Motors
• Largest automobile credit card rewards program
• Stable receivable base
• Primarily prime and super-prime customers
• Strong value proposition of three per cent and five per cent of spend drives customer loyalty and volume
• Continued innovation of risk and marketing analytics for both acquisitions and portfolio management
• Card program is very efficient marketing resource for GM

Company Logo
63
UP Program overview
• Eleven-year relationship with AFL-CIO
• Largest affinity card portfolio in the USA
• Relationships with 14 million union members
• Strong endorsement from union leadership and internationals
• Each union marketed under its own brand
• Above industry average portfolio metrics
• Consistent profitability

Company Logo
64
Metris Portfolio update
• Acquired December 2005 (USD5.3 billion in receivables)
• Primarily serves near-prime segment
• Continues to perform above expectations
• Leverages all four networks (MasterCard, VISA, American Express and Discover)
• Fully integrated into HSBC business; leveraging best practices from both organisations

Company Logo
65
Competitive advantages of Card Business
• Full-spectrum lender
• Large customised partnership programs
• Analytically driven decision-making (sales and marketing, risk management, operations and collections)
• Efficient, low-cost operations
• Global strengths of HSBC franchise
• Low cost of funds and capital

Company Logo
66
Bankcard performance
(1) Results are reported on an IFRS Management Basis (2) Excludes HSBC Bank USA portfolio(3) September 2007 Net Interest Margin and Return on Average Assets are annualised
4.9%5.2%
4.1%
2.6%
0%
1%
2%
3%
4%
5%
6%
2004 2005 2006 YTD Sep-07
Receivables (billions)2004-06 CAGR approximately 20%
$521
$813
$1,386
$1,050
$0
$250
$500
$750
$1,000
$1,250
$1,500
2004 2005 2006 YTD Sep-07
$19.6
$26.0 $28.2 $29.6
$0$5
$10$15$20$25$30$35
2004 2005 2006 Sep-07
Return on Average Assets
Net Interest Margin
11.8%11.9%10.4%10.8%
0%2%4%6%8%
10%12%14%
2004 2005 2006 YTD Sep-07
Net Income (millions)2004-06 CAGR approximately 63%

Company Logo
67
Card Credit trends
Net Charge-offs6.9%
6.2%
4.0%
5.8% 5.5%
7.1% 6.9%7.2%8.0%
7.0%6.8%
0.0%
2.0%
4.0%
6.0%
8.0%
Mar-05 Jun-05 Sep-05 Dec-05 Mar-06 Jun-06 Sep-06 Dec-06 Mar-07 Jun-07 Sep-07
2+ Delinquency4.6%
4.1% 4.5%3.7%
4.4% 4.2% 4.5% 4.6% 4.5% 4.5%5.2%
0.0%
2.0%
4.0%
6.0%
Mar-05 Jun-05 Sep-05 Dec-05 Mar-06 Jun-06 Sep-06 Dec-06 Mar-07 Jun-07 Sep-07
Net Charge-offs are as a percent of average receivables; Delinquency is two-months-and-over contractual delinquency as a percent of consumer receivables. Figures include UK and Canadian credit card operations.
(1) Results are reported on a U.S. GAAP basis

Company Logo
68
Actions to mitigate credit risk – Bankcard
• Slowing receivable and account growth, and tightening initial credit line assignment criteria
• Closing inactive accounts• Decreasing credit lines and tightening credit line increase criteria• Holding prime/non-prime mix flat• Reducing balance transfer volume and tightening cash access• Increasing collections capacity and intensity
– Increasing outbound calling – Hiring ahead of forecasted needs– Accelerating calling on holdout population

Company Logo
69
Agenda
• US Bankcard
• US Retail Cards
• Group Cards
Company Logo
70
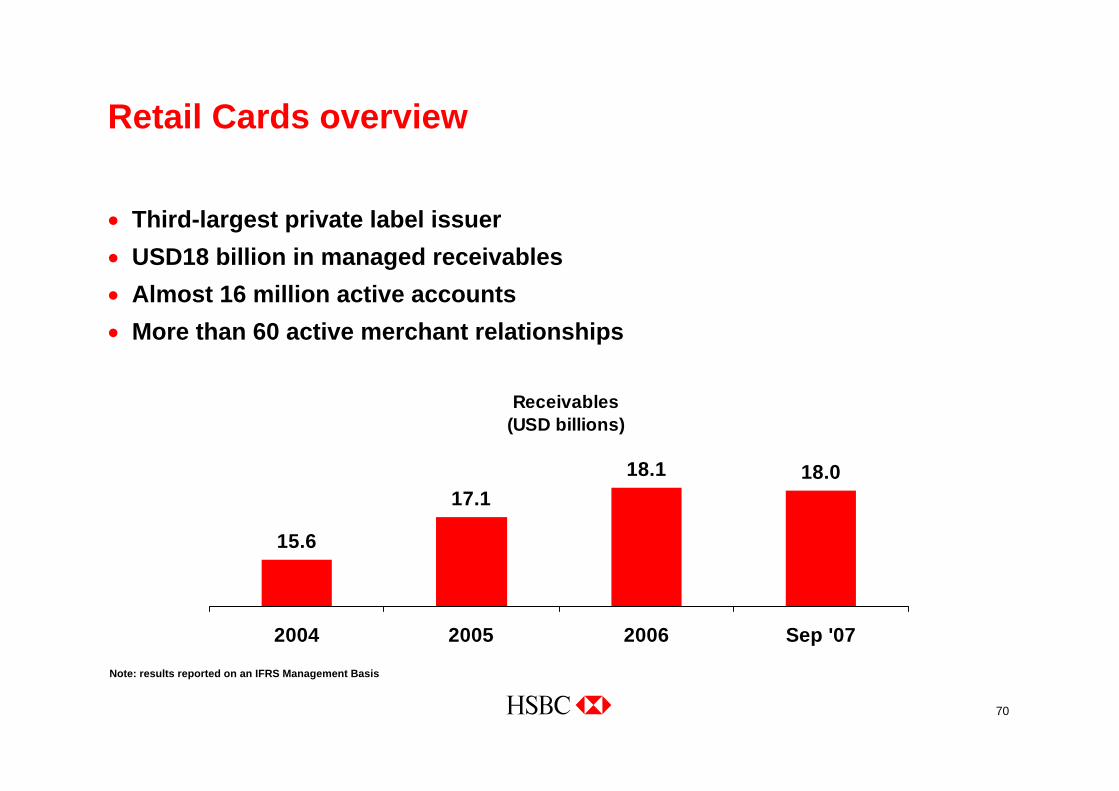
Retail Cards overview
• Third-largest private label issuer• USD18 billion in managed receivables• Almost 16 million active accounts• More than 60 active merchant relationships
Note: results reported on an IFRS Management Basis
Receivables(USD billions)
15.6
18.1 18.017.1
2004 2005 2006 Sep '07

Company Logo
71
Diversified portfolio
Recreationalvehicles
34%
Furniture11%
Consumerelectronics
32%
Generalmerchandise
6% Department
store13%
Home improvement
4%
As of September 2007

Company Logo
72
Partnerships with some of the nation’s largest retailers

Company Logo
73
Competitive advantages
• Strong partnership culture
• Flexible program structure
• Ability to serve multiple origination channels
• Efficient, low-cost operations
• Global strengths of HSBC franchise
• Low cost of funds and capital

Company Logo
74
Retail Cards performance
(1) Results for U.S. Retail Cards are reported on an IFRS Management Basis (2) September 2007 Net Interest Margin and Return on Average Assets are annualised
2.2%2.1%2.3%
1.7%
0%
1%
2%
3%
2004 2005 2006 YTD Sep-07
Receivables (billions)2004-06 CAGR approximately 8%
$255
$361 $350
$286
$0
$100
$200
$300
$400
2004 2005 2006 YTD Sep-07
$15.6$17.1 $18.1 $18.0
$0
$5
$10
$15
$20
$25
2004 2005 2006 Sep-07
Return on Average Assets
Net Interest Margin
7.6%6.9%
8.4%8.9%
0%
2%
4%
6%
8%
10%
2004 2005 2006 YTD Sep-07
Net Income (millions)2004-06 CAGR approximately 17%

Company Logo
75
Retail Cards Credit trends
Net Charge-offs
4.4%3.9% 3.8% 3.5% 3.8%
4.3% 4.1%4.2% 4.2% 4.3%4.0%
0.0%
2.0%
4.0%
6.0%
Mar-05 Jun-05 Sep-05 Dec-05 Mar-06 Jun-06 Sep-06 Dec-06 Mar-07 Jun-07 Sep-07
2+ Delinquency
2.5% 2.4% 2.5% 2.4% 2.5% 2.7% 2.8% 2.8% 2.7% 2.7%3.1%
0.0%
1.0%
2.0%
3.0%
4.0%
Mar-05 Jun-05 Sep-05 Dec-05 Mar-06 Jun-06 Sep-06 Dec-06 Mar-07 Jun-07 Sep-07
Net Charge-offs are as a percent of average receivables; Delinquency is two-months-and-over contractual delinquency as a percent of consumer receivables.
(1) Results for U.S. Retail Cards are reported on an IFRS Management Basis

Company Logo
76
Actions to mitigate risk – Retail Cards
• Implementing numerous credit-tightening efforts across retail merchant base, including power sports industry
• Reducing contingent lines within inactive accounts• Increasing collections capacity and intensity
– Increasing outbound calling – Hiring ahead of forecasted needs– Accelerating calling on holdout population

Company Logo
77
Card and Retail practice change summary
Deliver high brand values and strong customer value proposition in our products and service. Key changes to our practices include:• Eliminating over-limit fees when occurrence is due to finance charges or fee
assessment• Extending time customers have to come back within credit limit before assessing
another over-limit fee• Customers now have 30 days to accept new APR terms (under certain situations) or
they may close account and pay down balance• General purpose cards retain original terms for at least one year• Assessing finance charges on one average billing cycle rather than two in private
label business

Company Logo
78
Agenda
• US Bankcard
• US Retail Cards
• Group Cards

Company Logo
79
Group Cards presence
• HSBC issues cards in approximately 40 countries across five continents, making it one of the few truly global players in the industry
• Over 100 million cards in force

Company Logo
80
Exporting best practices globally
• HSBC has established global cards centres of excellence to implement best practices and deliver low cost in customer care and collections
• In Asia and Latin America, we leveraged underwriting, modelling and consulting expertise from HBIO to enhance capabilities in regional centres of excellence
• We have rolled out our enhancement services model across 10 countries and eight new markets since 2003
• Knowledge transfer and analytic focus have yielded significant results

Company Logo
81
Exporting best practices globally (continued)
• Leveraging our experience in North America, we have formed majorrelationships globally:– Marks & Spencer and John Lewis Partnership in the UK– Dixons in Central and Eastern European countries– Best Buy in Canada, Mexico and China– BR Petrobras, Accor Hotels, Ricardo Eletro and DMA in Brazil– Wal-Mart in China
Company Logo
82
Building global scale
• WHIRL, our global card system, now services 86 million cards (comprising 75 per cent of our business) across 16 countries
• Since 2003, new cards businesses have launched in Australia, Canada, China, the Czech Republic, Iraq, Poland and Uruguay
• Plans are underway to enter Pakistan and Vietnam in 2007
• Ten countries now have more than one million cards, up from six in 2003

Company Logo
83
Update – developing countries
• China – Launched Wal-Mart co-branded card in August 2006
(joint venture with the Bank of Communications)• Mexico
– Leveraging the branch network through bundled products like Tu Cuenta• India
– Growth has been achieved through multiple sales channels including partnership with key retailers, including Star Bazaar

Company Logo
84
Our aspirations
• Leverage our expertise from developed markets to substantially grow our business in developing markets
• We will achieve this by:– Providing successful acquisition tools to gain new customers– Being the first choice for our relationship-banked customers– Growing our share of borrowing customers– Cross-selling to each customer at least one other HSBC service– Reinforcing HSBC’s brand and global positioning

Company Logo
85
HSBC is well-positioned for global growth
• Size and scale, complemented by strong local presence• Strong balance sheet, funding and capital market access• Full-spectrum lending capabilities• Global Resourcing and low-cost structure• Strong position across card spectrum (MasterCard/VISA, private label,
debit etc)• Common platforms and processes• Robust, analytically driven decision-making• Global brand

HSBC Global TechnologyKEN HARVEYCHIEF INFORMATION OFFICER
3 December 2007

Company Logo
87
HSBC Technology and ServicesGlobal systems update
• Converged on a single computing infrastructure that allows global leverage of applications
• Global platform upgrade is ahead of plan and early business success warrants acceleration
• Refined and improved the method of converting countries to the Group platforms, allowing us to accelerate our plans

Company Logo
88
IT spend trendsRun-the-Bank (RTB) versus Change-the-Bank (CTB)
RTB – Infrastructure (including Gold Library ITO)
RTB – Application maintenance
CTB – Application development
200529%
17%
54%
RTB total = 71%
2008 guideline
32%
18%
50%
RTB total = 68%
27%
20%
53%
RTB total = 73%
200629%
19%
52%
RTB total = 71%
2007

Company Logo
89
Technology and servicesHSBC IT continues to provide strong economies of scale
The world’s largest privately operated integrated corporate network• Four global data centre pairs• 80 global ‘Group’ platforms• Over 40 per cent of development in low-cost centres
Reducing unit cost of production 10 per
cent per annum

Company Logo
90
Completed the migration to a single desktop
Common Windows Desktop (CWD) Active directory (AD)
Migration to Group ADMigration to Group CWD
0
50,000
100,000
150,000
200,000
250,000
300,000
350,000
Dec04
Mar05
Jun05
Sep05
Dec05
Mar06
Jun06
Sep06
Dec06
Mar07
Num
ber o
f wor
ksta
tions
Jun07
South America
Europe, Middle East and Africa
North America (including MX)
Asia-Pacific (including GRC)
South America
Europe, Middle East and Africa
North America (including MX)
Asia-Pacific (including GRC)
0
50,000
100,000
150,000
200,000
250,000
300,000
350,000
Dec04
Mar05
Jun05
Sep05
Dec05
Mar06
Jun06
Sep06
Dec06
Mar07
Jun07
Num
ber o
f act
ive
user
s

Company Logo
91
CIBM’s global platform
From 43 systems… …to 26 (including 12 core global trading systems)
Recognition from the 2007 European Banking Technology Awards:• Treats in Europe (TiE), our treasury trading system won Best Treasury/Cash Management
Achievement for its Satellite Site Strategy• The Trade Routing Straight Through Processing (STP) project was recognised as
Best Trading System Achievement

Company Logo
92
R2 Enterprise Application Integration (EAI) Allows any service, in any channel, anywhere
65 per cent of all transactionsTotal monthly volume as of October 2007 – 1,111,490,140
Volu
mes
mig
rate
d
HBAP HBEU HBME HBNA HBBR Global
0
200,000,000
400,000,000
600,000,000
800,000,000
1,000,000,000
1,200,000,000
May-06 Jun-06 Jul-06 Aug-06 Sep-06 Oct-06 Nov-06 Dec-06 Jan-07 Feb-07 Mar-07 Apr-07 May-07 Jun-07 Jul-07 Aug-07 Sep-07 Oct-07

Company Logo
93
HSBC’s multi-channel development‘Build once, deploy many’ is the foundation of new global offerings
Common functions
Global applications
Deploy many
Build once
Balance enquiry Order card Bill paymentCustomer locate
Global CustomerDatabase
One HSBCCards
One HSBCCore
Banking
GlobalMessaging
Global Payments
Messaging and transformation layer (EAI)

Company Logo
94
One HSBC distribution Implementation/Transition model
Customerfacing
Stafffacing
Account information
Bill pay and collections
Credit
Legacy front end
Offers, rewards and points
Disputes and fraud
Search
One H
SBC
Services

Company Logo
95
The benefits of ‘build once, deploy many’
• Transaction volumes will grow exponentially
• Process jobs will continue to decline
• Information management will rule
• Regions run the ‘back office’ for each other
Company Logo
96
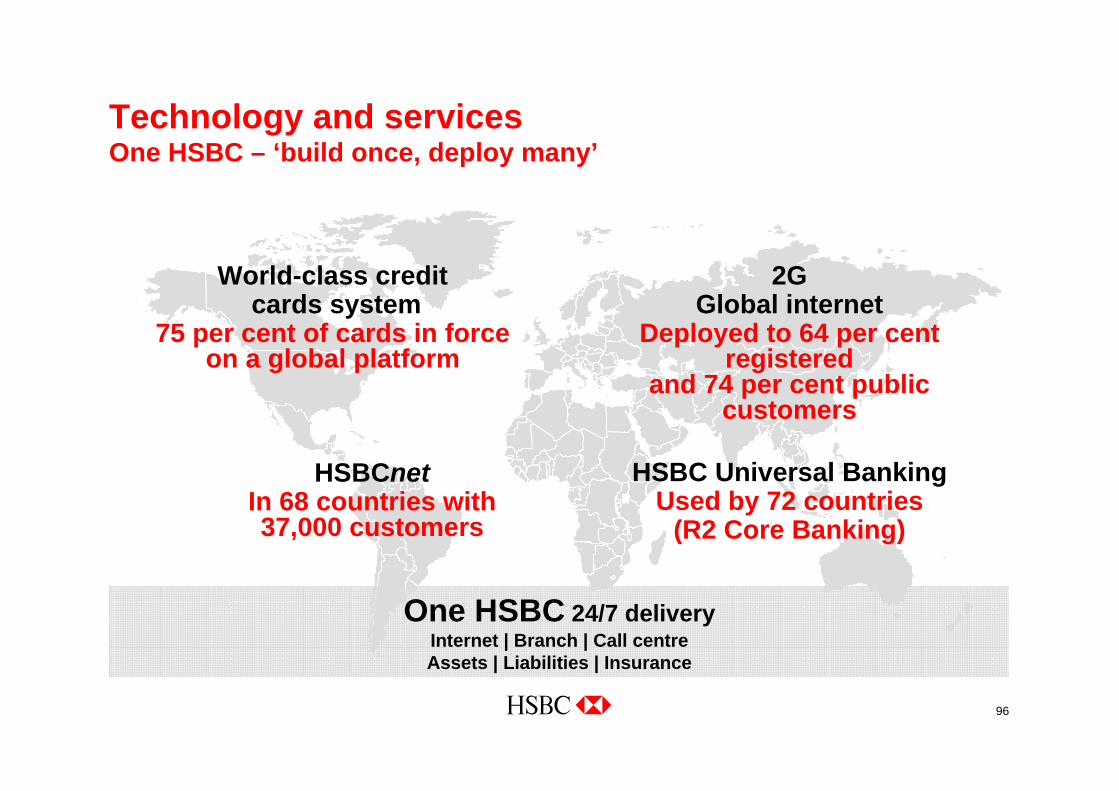
Technology and servicesOne HSBC – ‘build once, deploy many’
World-class creditcards system
75 per cent of cards in force on a global platform
HSBCnetIn 68 countries with 37,000 customers
2G Global internet
Deployed to 64 per cent registered
and 74 per cent public customers
HSBC Universal BankingUsed by 72 countries
(R2 Core Banking)
One HSBC 24/7 deliveryInternet | Branch | Call centreAssets | Liabilities | Insurance