hsbc portfolios unaudited semi-annual report for the ... · expressed are subject to change without...
TRANSCRIPT
Unaudited Semi-Annual Report for the period ended 31 January 2011
HSBC Portfolios

Important Notice for Singapore Shareholders This Semi-Annual Report of HSBC Portfolios (“the Company”) covers the complete range of sub-funds in the Company which are available for distribution in various jurisdictions. Singapore shareholders are advised that the Monetary Authority of Singapore has registered only the following sub-funds of the Company for distribution in Singapore under the Recognised Scheme, pursuant to the Securities and Futures Act: Recognised Schemes 1. HSBC Portfolios – World Selection 1 2. HSBC Portfolios – World Selection 3 3. HSBC Portfolios – World Selection 5
This document is prepared for general information purpose only and the opinions expressed are subject to change without notice. The opinions expressed herein should not be considered to be a recommendation by HSBC Global Asset Management (Singapore) Limited to any reader of this material to buy or sell securities, commodities, currencies or other investments referred to herein. It is published for information only and does not have any regard to the specific investment objectives, financial situation and the particular needs of any specific person who may receive this document. Investors may wish to seek advice from a financial advisor before purchasing units in the fund. In the event that the investor chooses not to seek advice from a financial advisor, he should consider whether the fund in question is suitable for him. The past performance of any fund and the manager and any economic and market trends/forecast are not necessarily indicative of the future or likely performance of the fund. Value of investment and units may go down as well as up, and the investor may not get back the original sum invested. Investors and potential investors should read the Singapore prospectus (including the risk warnings) which is available at http://www.assetmanagement.hsbc.com/sg or our authorised distributors, before investing. Changes in rates of currency exchange may affect significantly the value of the investment.

Société d’Investissement à Capital Variable (SICAV), Luxembourg
R.C.S. B 147 223
No subscription can be received on the basis of financial reports. Subscriptions are only valid if made on the basis of the current Prospectus accompanied by the latest annual and the most recent semi-annual report, if published thereafter.


4
Contents
General Information 5
Director’s Report 7
Investment Adviser’s Report 9
Statement of Net Assets 10
Statement of Operations 11
Statement of Changes In Net Assets 12
Statement of Changes In Shares Issued 13
Statistical Information 14
Notes to the Financial Statements 15
Schedules of Investments and Other Net Assets
• HSBC Portfolios – World Selection 1 22
• HSBC Portfolios – World Selection 2 23
• HSBC Portfolios – World Selection 3 24
• HSBC Portfolios – World Selection 4 25
• HSBC Portfolios – World Selection 5 26
• HSBC Portfolios – GOAL 27
Fund Holiday Calendar for 2011 28

5
General Information
Directors
Thies Clemenz, Chief Executive Officer HSBC Trinkaus Investment Managers SA 8, Rue Lou Hemmer L-1748 Luxembourg-Findel Luxembourg Didier Deleage, Chief Operating Officer HSBC Global Asset Management (France), Immeuble Ile de France 4, Place de la Pyramide, La Défense 9, 92800 Puteaux France David Silvester, Head of Product Management – Global Funds HSBC Global Asset Management Limited 8 Canada Square, London E14 5HQ United Kingdom
Registered Office
16, boulevard d’Avranches L-1160 Luxembourg Grand Duchy of Luxembourg
Administrator, Custodian, Corporate and
Domiciliary Agent
HSBC Securities Services (Luxembourg) S.A. 16, boulevard d’Avranches L-1160 Luxembourg Grand Duchy of Luxembourg
Paying Agent, Registrar and Transfer Agent
RBC Dexia Investor Services Bank S.A. 14, Porte de France L-4360 Esch-sur-Alzette Grand Duchy of Luxembourg
Management Company and Global Distributor
HSBC Investment Funds (Luxembourg) S.A. 16, boulevard d'Avranches
L-1160 Luxembourg
Grand Duchy of Luxembourg
Independent Auditors
KPMG Audit S.à r.l. 9, Allée Scheffer L-2520 Luxembourg Grand Duchy of Luxembourg
Legal Advisers
Elvinger, Hoss & Prussen 2, Place Winston Churchill L-1340 Luxembourg Grand Duchy of Luxembourg
Investment Adviser
HSBC Global Asset Management (UK) Limited 78 St James's Street London SW1A 1EJ United Kingdom

6
General Information (continued)
Distributors Austria and Eastern Europe Distributor HSBC Trinkaus & Burkhardt AG Königsallee 21/23 D-40212 Düsseldorf Germany
Continental Europe Distributor HSBC Global Asset Management (France) Immeuble Ile de France, 4, Place de la Pyramide, La Défense 9 92800 Puteaux France Hong Kong Representative and Distributor HSBC Investment Funds (Hong Kong) Limited HSBC Main Building, 1 Queen's Road Central Hong Kong Jersey Representative and Distributor HSBC Global Asset Management (International) Limited HSBC House, Esplanade, St Helier Jersey JE1 1HS Channel Islands Middle East Distributor HSBC Bank Middle East Limited HSBC House, Esplanade, St Helier Jersey JE1 1HS Channel Islands Singapore Representative and Distributor HSBC Global Asset Management (Singapore) Limited 21 Collyer Quay, #15-02 HSBC Building Singapore 049320 Singapore United Kingdom Representative and Distributor HSBC Global Asset Management (UK) Limited 8 Canada Square London E14 5HQ United Kingdom
7
Director’s Report
Market review
Overview
Overall, traditional asset classes, such as equity and fixed income, as well as non-traditional asset classes delivered positive returns during 2010. However, independent asset returns varied over the course of the year. Concerns about the sustainability of the global economic recovery and elevated sovereign debt levels caused increased nervousness amongst investors. In the second half of 2010, the economic news-flow from developed countries became more positive. However, concerns about levels of inflation in emerging markets were ongoing, and central banks in the major emerging countries introduced monetary tightening measures. Equities displayed strong returns over the last four months of 2010, whereas fixed income returns lagged those of riskier asset classes in the second half of the year. Alternative asset classes were the most successful asset classes during 2010, with particular strong returns provided by commodities, private equity and property.
US Equities
During the six-months to 31 January 2011, the US economic recovery continued to build momentum. For example, manufacturing activity was particularly strong during the fourth quarter of 2010. However, inherent risks to the economic recovery persist, namely elevated unemployment in both the US and other developed markets. The Federal Reserve Bank kept the Federal funds’ rate at 0-0.25% and in early November 2010, announced further quantitative easing measures to underpin the economy, which was supportive for the performance of riskier asset classes in general. In addition, equity valuations relative to cash and especially government debt remained attractive. Against this backdrop, the MSCI US Index delivered a strong performance of 18.5% during the period under review.
Europe ex-UK Equities
During the six-months to 31 January 2011, economic conditions within the European region were mixed. Concerns about sovereign debt levels of some of the eurozone peripheral countries were ongoing in the second half of 2010, of particular focus were Ireland, Spain and Portugal. Consequently, austerity measures are in the process of being rolled out in parts of Europe. However, the economic health of peripheral eurozone countries remains uncertain, whereas the larger economies, such as Germany and France, showed solid economic performance. Furthermore, interest rates and inflation remain generally low in the eurozone and recent corporate earnings news-flow has been encouraging. Against this backdrop, the MSCI EMU Index posted returns of 10.2% during the period under review.
UK Equities
During the six-months to 31 January 2011, while economic indicators continued to suggest that a recovery was underway in the UK, the slowdown in the pace of improvement became more prevalent. During the third quarter of 2010, the UK economy benefited from positive growth though it lagged the economic performance in the second quarter of 2010. Furthermore, levels of inflation in the UK continued to cause concern.
Against this backdrop, the MSCI UK Index returned 12.95% during the period under review.
Japan Equities
During the six-months to 31 January 2011, the Japanese economy continued to recover though deflationary concerns remained. In addition, the Japanese Yen strongly appreciated which could potentially harm export growth, an important driver for the Japanese economy. The performance of Japanese equities lagged other developed equity markets for much of 2010. Hence, there may be positive price momentum. Furthermore, valuations of Japanese equities continue to look attractive relative to history in absolute terms and relative to other developed markets. Against this backdrop, the MSCI Japan Index gained 8.53% during the period under review. Global Emerging Market Equities
During the six-months to 31 January 2011, emerging countries continued to lead the global economic recovery, as China’s fourth quarter 2010 GDP recorded a 9.8% growth compared to 2009 levels. Also for 2011, economists continue to expect solid economic growth in emerging regions. However, risks to the growth scenario remain, particularly inflation levels in emerging markets continue to cause concern, primarily due to increasing food price. During the second half of 2010, central banks in the major emerging markets started to introduce monetary tightening measures to tackle inflation. Further interest rate increases should be expected, which could have a negative impact on growth and hence harm both the economic recovery and market performance. Against this backdrop, the MSCI Emerging Markets Index gained 10.0% during the period under review.

8
Director’s Report (continued)
Global Bonds
During the six-months to 31 January 2011, within fixed income, corporate bonds and in particular global high yield bonds performed well relative to other fixed income assets, particularly relative to government bonds as the Citigroup World Government Bond Index fell by 1.2% during the period. Meanwhile, the Bank of America Merrill Lynch Global High Yield Index returned 8.14% during the same period. Collectively, strong corporate earnings results, the view that major central banks will keep interest rates low and strong demand for yield, have boosted investment grade corporate bonds. With momentum likely to remain positive, we continue to be positive on the asset class. However, despite the rise in yields, developed market government bonds are still offering little value relative to history and downside risks remain. Valuations do not look particularly attractive and offer very limited protection against negative surprises.
Emerging Market Debt
During the six-months to 31 January 2011, on a valuation basis, emerging market debt continues to look less attractive relative to other riskier fixed income markets, in particular global high yield corporate debt. Furthermore, inflation in emerging markets remains of concern and central banks in the major emerging market countries have introduced monetary tightening measures, which have started to weigh on the performance of the asset class. Against this backdrop, the Bank of America Merrill Lynch USD Emerging Sovereign Bond Plus returned 1.6% during the period under review.
Commodities
During the six-months to 31 January 2011, commodities performed strongly. Gold continued to show a strong performance returning 12.85% during the period, supported by high liquidity in markets, combined with ongoing macroeconomic uncertainty. Looking ahead, we expect the oil price to fluctuate in the US$70-US$90 range, as improved demand is balanced out by a forecast rise in OPEC production. Fluctuation in risk-appetite is likely to contribute to oil price volatility.

9
Investment Adviser’s Report
Since inception of the Portfolios on October 19, 2009, until the end of the reporting period the Funds provided the following returns (Class AC, net of fees in USD):
HSBC Portfolios - World Selection 1: 7.50%
HSBC Portfolios - World Selection 2: 8.89%
HSBC Portfolios - World Selection 3: 10.38%
HSBC Portfolios - World Selection 4: 11.90%
HSBC Portfolios - World Selection 5: 12.56%
After a strong performance in July 2010, when all major developed equity markets and the main emerging markets finished the month in positive territory, August was a more challenging month for investors. The increase in risk-aversion was sparked by a number of worse-than-expected economic figures. Against this backdrop, the diversification across various different asset classes was beneficial for the HSBC World Selection Portfolios. For example, gold performed strongly in August, benefiting from its safe haven status, which helped compensate some of the losses the Portfolios’ more risky assets had experienced. In September, all HSBC World Selection Portfolios delivered strong returns. The market rebound after a rather challenging August was mainly driven by investors’ expectations of further quantitative easing measures. In early September, the Portfolios’ tactical allocation towards government bonds and emerging markets debt was reduced to the benefit of global high yield. In addition to the strong performance of riskier asset classes like equities, this increased allocation towards global high yield was beneficial to the performance in September, as global high yield outperformed both government bonds and emerging markets debt. October proved to be a reasonably good month for financial market performance, in particular for riskier asset classes. All major equity markets finished the month in positive territory. The gains in global equity markets generally reflected a good earnings season globally and expectations of a further injection of liquidity by the US Federal Reserve. In global bond markets, corporate credit generally outperformed sovereign debt. Hence, the Portfolio’s overweight positions in corporate debt and underweight in government bonds made a strong contribution towards performance in October. Furthermore, the diversification across various different asset classes, such as commodities and private equity, was again beneficial to the Portfolios. November was a rather volatile month for financial markets. Investor sentiment was positive at the beginning of the month and riskier asset classes performed well during the first week. This positive performance was largely driven by confirmation of the US Federal Reserve’s plan to inject further liquidity into financial markets. Furthermore, companies’ third quarter results continued to be positive. Nevertheless, as the month progressed, the developments surrounding the fiscal situation of several eurozone countries started to dominate the news-flow. During November, several tactical asset allocation changes were implemented in the HSBC World Selection Portfolios. For example, the exposure towards equities in both developed and emerging markets was increased to a neutral position at the broad asset class level. In the last month of 2010, the HSBC World Selection Portfolios provided strong returns, largely driven by the performance of riskier asset classes. The major global equity markets performed well in December, supported by positive economic news-flow. The HSBC World Selection Portfolios’ tactical positions within the asset class equities further enhanced performance, particularly , the recently increased exposure towards Japanese equities - a tactical position within developed market equities opened in early December, which made a strong contribution towards performance, and the regional preference for the Russian equity market over the wider emerging market universe. The broad diversification, including alternative asset classes, remained a key driver of the strong risk-adjusted returns of the HSBC World Selection Portfolios. In December, in particular, the allocations towards commodities and private equity made a strong contribution to overall performance. Global equity markets made a good start in 2011, with the MSCI World Index returning 1.96% during January 2011. However, equity performance varied among regions. Within developed markets, eurozone equities provided particularly strong returns, largely driven by positive economic news-flow, whereas emerging market equities had a difficult month, as ongoing concerns about levels of inflation had a negative impact on markets. Furthermore, the political tensions in the Middle East and North Africa impacted investor sentiment in the second half of January 2011. Within the HSBC World Selection Portfolios, the exposure towards equities was increased at the broad asset class level in January 2011. Generally, the backdrop for equities improved over the last few months, with lower risk of negative corporate earnings surprises in 2011 and still attractive valuation levels. In addition, liquidity in markets and corporate cash balances remain high relative to history, which should be supportive for riskier asset classes, and the improvements in the macroeconomic environment have been beneficial for investor sentiment. Within equities, there was an ongoing tactical preference for the Japanese equity market within developed markets. This tactical position made a positive contribution to the overall Portfolio performance in January 2011, and so did the increased exposure towards global high yield bonds within the fixed income segment of the Portfolios. Looking ahead, we believe the HSBC World Selection Portfolios’ highly diversified investment approach are in our belief well positioned and to aim to continue to deliver optimal risk-adjusted returns in 2011.
HSBC Global Asset Management (UK) Limited
March 2011
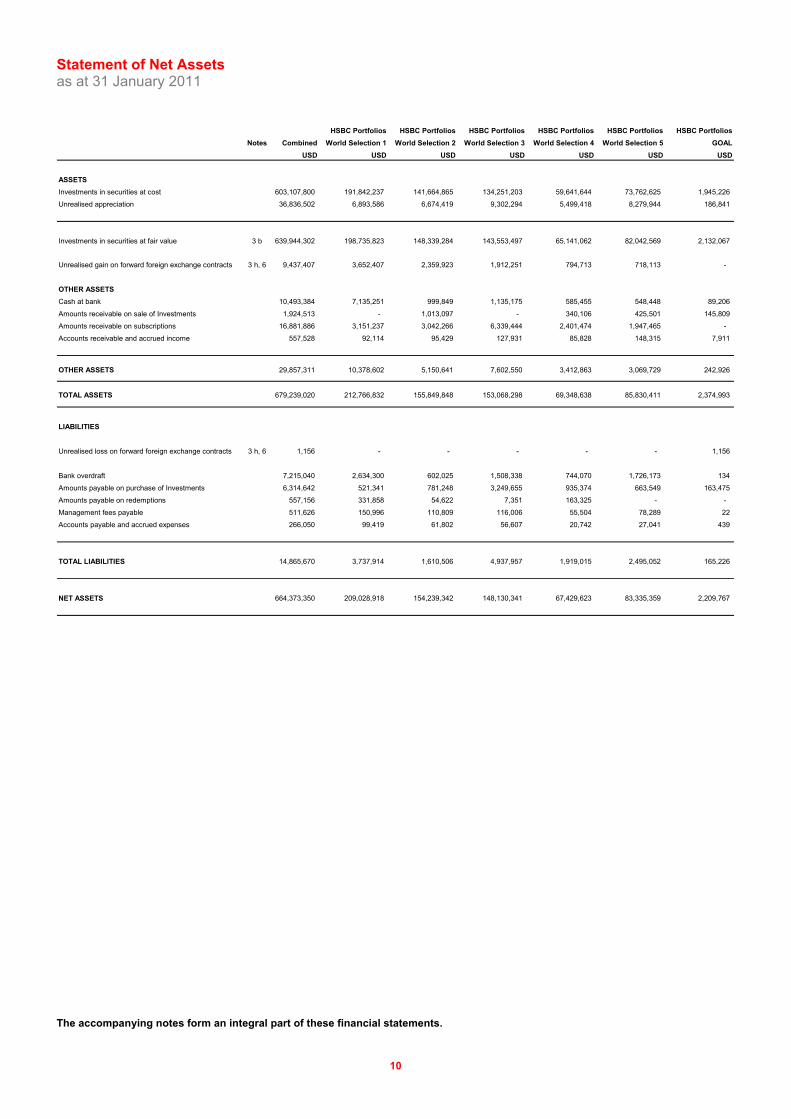
Statement of Net Assets as at 31 January 2011
HSBC Portfolios HSBC Portfolios HSBC Portfolios HSBC Portfolios HSBC Portfolios HSBC Portfolios
Notes Combined World Selection 1 World Selection 2 World Selection 3 World Selection 4 World Selection 5 GOAL
USD USD USD USD USD USD USD
ASSETS
Investments in securities at cost 603,107,800 191,842,237 141,664,865 134,251,203 59,641,644 73,762,625 1,945,226
Unrealised appreciation 36,836,502 6,893,586 6,674,419 9,302,294 5,499,418 8,279,944 186,841
Investments in securities at fair value 3 b 639,944,302 198,735,823 148,339,284 143,553,497 65,141,062 82,042,569 2,132,067
Unrealised gain on forward foreign exchange contracts 3 h, 6 9,437,407 3,652,407 2,359,923 1,912,251 794,713 718,113 -
OTHER ASSETS
Cash at bank 10,493,384 7,135,251 999,849 1,135,175 585,455 548,448 89,206
Amounts receivable on sale of Investments 1,924,513 - 1,013,097 - 340,106 425,501 145,809
Amounts receivable on subscriptions 16,881,886 3,151,237 3,042,266 6,339,444 2,401,474 1,947,465 -
Accounts receivable and accrued income 557,528 92,114 95,429 127,931 85,828 148,315 7,911
OTHER ASSETS 29,857,311 10,378,602 5,150,641 7,602,550 3,412,863 3,069,729 242,926
TOTAL ASSETS 679,239,020 212,766,832 155,849,848 153,068,298 69,348,638 85,830,411 2,374,993
LIABILITIES
Unrealised loss on forward foreign exchange contracts 3 h, 6 1,156 - - - - - 1,156
Bank overdraft 7,215,040 2,634,300 602,025 1,508,338 744,070 1,726,173 134
Amounts payable on purchase of Investments 6,314,642 521,341 781,248 3,249,655 935,374 663,549 163,475
Amounts payable on redemptions 557,156 331,858 54,622 7,351 163,325 - -
Management fees payable 511,626 150,996 110,809 116,006 55,504 78,289 22
Accounts payable and accrued expenses 266,050 99,419 61,802 56,607 20,742 27,041 439
TOTAL LIABILITIES 14,865,670 3,737,914 1,610,506 4,937,957 1,919,015 2,495,052 165,226
NET ASSETS 664,373,350 209,028,918 154,239,342 148,130,341 67,429,623 83,335,359 2,209,767
The accompanying notes form an integral part of these financial statements.
10

Statement of Operations for the period ended 31 January 2011
HSBC Portfolios HSBC Portfolios HSBC Portfolios HSBC Portfolios HSBC Portfolios HSBC Portfolios
Notes Combined World Selection 1 World Selection 2 World Selection 3 World Selection 4 World Selection 5 GOAL
USD USD USD USD USD USD USD
INCOME
Income from investments 3 c 931,562 611,365 217,075 93,436 - - 9,686
Deposit interest 13,597 13,597 - - - - -
Management fees rebate 314,768 58,413 57,479 80,876 46,941 70,805 254
Other Income 53,246 7,821 8,201 8,189 8,222 20,724 89
TOTAL INCOME 1,313,173 691,196 282,755 182,501 55,163 91,529 10,029
EXPENSES
Management fees 4 a 2,775,612 806,639 559,922 604,787 309,945 494,180 139
Operating, administrative and servicing expenses 4 b 890,305 293,952 195,547 187,597 88,499 122,007 2,703
Bank interest and charges 10,547 1,527 1,297 2,027 1,717 3,977 2
TOTAL EXPENSES 3,676,464 1,102,118 756,766 794,411 400,161 620,164 2,844
NET OPERATING (LOSS) / GAIN FOR THE PERIOD (2,363,291) (410,922) (474,011) (611,910) (344,998) (528,635) 7,185
The accompanying notes form an integral part of these financial statements.
11

Statement of Changes in Net Assets for the period ended 31 January 2011
HSBC Portfolios HSBC Portfolios HSBC Portfolios HSBC Portfolios HSBC Portfolios HSBC Portfolios
Notes Combined World Selection 1 World Selection 2 World Selection 3 World Selection 4 World Selection 5 GOAL
USD USD USD USD USD USD USD
Net operating (loss)/gain for the period (2,363,291) (410,922) (474,011) (611,910) (344,998) (528,635) 7,185
Net realised gains/(losses) on:
Investments in securities 3 b, 3 e 6,497,996 869,945 1,136,024 1,264,349 938,956 2,288,722 -
Forward foreign exchange contracts 3 h 10,230,361 4,436,120 2,897,235 2,105,195 676,477 142,886 (27,552)
Foreign exchange transactions 3 d 257,903 17,128 26,810 49,728 43,126 68,398 52,713
NET REALISED GAIN 14,622,969 4,912,271 3,586,058 2,807,362 1,313,561 1,971,371 32,346
Net change in unrealised appreciation/(depreciation) on:
- Investments in securities 32,128,077 4,076,824 5,156,974 8,500,121 5,255,110 9,013,111 125,937
- Forward foreign exchange contracts 3 h, 6 2,166,291 984,095 583,579 390,585 176,777 29,035 2,220
INCREASE IN NET ASSETS FROM OPERATIONS 48,917,337 9,973,190 9,326,611 11,698,068 6,745,448 11,013,517 160,503
CAPITAL TRANSACTIONS
Received on issue of shares 274,053,613 94,733,568 69,717,968 61,239,617 25,521,012 22,841,448 -
Paid on redemptions of shares (61,126,342) (6,647,942) (2,108,232) (6,847,389) (14,190,815) (31,331,964) -
TOTAL INCREASE IN NET ASSETS FOR THE PERIOD 261,844,608 98,058,816 76,936,347 66,090,296 18,075,645 2,523,001 160,503
NET ASSETS
Beginning of period 402,528,742 110,970,102 77,302,995 82,040,045 49,353,978 80,812,358 2,049,264
End of period 664,373,350 209,028,918 154,239,342 148,130,341 67,429,623 83,335,359 2,209,767
The accompanying notes form an integral part of these financial statements.
12
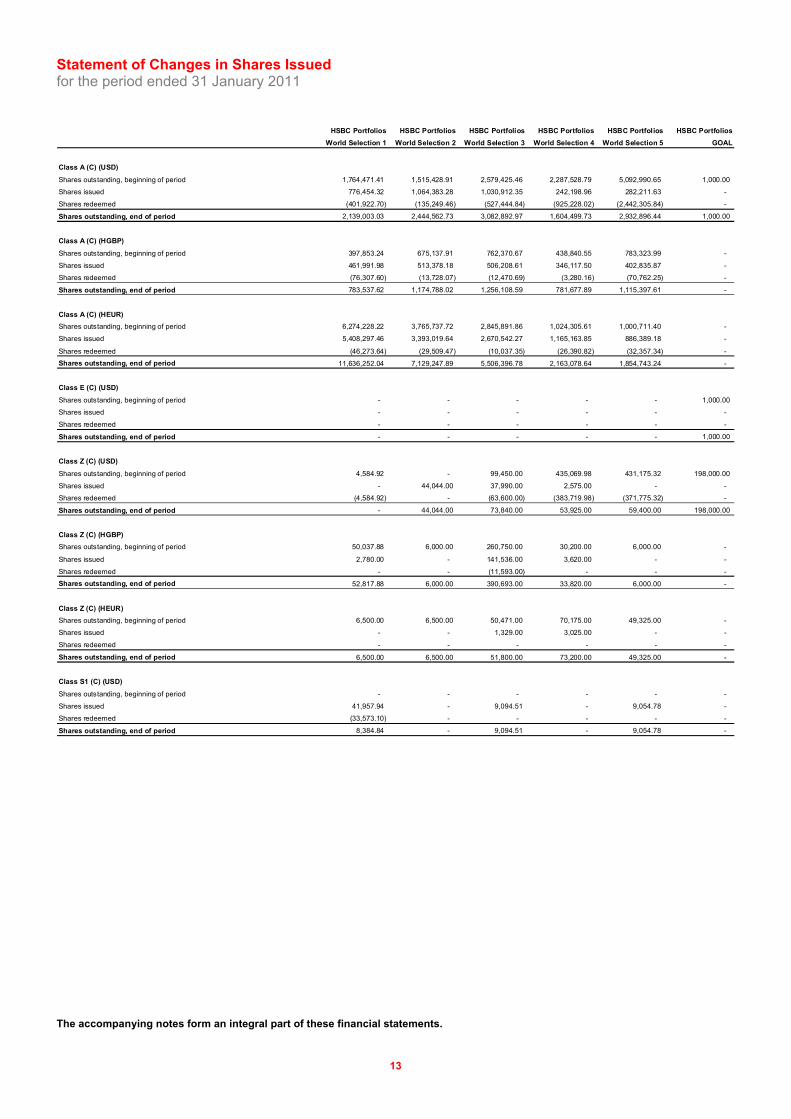
Statement of Changes in Shares Issued for the period ended 31 January 2011
HSBC Portfolios HSBC Portfolios HSBC Portfolios HSBC Portfolios HSBC Portfolios HSBC Portfolios
World Selection 1 World Selection 2 World Selection 3 World Selection 4 World Selection 5 GOAL
Class A (C) (USD)
Shares outstanding, beginning of period 1,764,471.41 1,515,428.91 2,579,425.46 2,287,528.79 5,092,990.65 1,000.00
Shares issued 776,454.32 1,064,383.28 1,030,912.35 242,198.96 282,211.63 -
Shares redeemed (401,922.70) (135,249.46) (527,444.84) (925,228.02) (2,442,305.84) -
Shares outstanding, end of period 2,139,003.03 2,444,562.73 3,082,892.97 1,604,499.73 2,932,896.44 1,000.00
Class A (C) (HGBP)
Shares outstanding, beginning of period 397,853.24 675,137.91 762,370.67 438,840.55 783,323.99 -
Shares issued 461,991.98 513,378.18 506,208.61 346,117.50 402,835.87 -
Shares redeemed (76,307.60) (13,728.07) (12,470.69) (3,280.16) (70,762.25) -
Shares outstanding, end of period 783,537.62 1,174,788.02 1,256,108.59 781,677.89 1,115,397.61 -
Class A (C) (HEUR)
Shares outstanding, beginning of period 6,274,228.22 3,765,737.72 2,845,891.86 1,024,305.61 1,000,711.40 -
Shares issued 5,408,297.46 3,393,019.64 2,670,542.27 1,165,163.85 886,389.18 -
Shares redeemed (46,273.64) (29,509.47) (10,037.35) (26,390.82) (32,357.34) -
Shares outstanding, end of period 11,636,252.04 7,129,247.89 5,506,396.78 2,163,078.64 1,854,743.24 -
Class E (C) (USD)
Shares outstanding, beginning of period - - - - - 1,000.00
Shares issued - - - - - -
Shares redeemed - - - - - -
Shares outstanding, end of period - - - - - 1,000.00
Class Z (C) (USD)
Shares outstanding, beginning of period 4,584.92 - 99,450.00 435,069.98 431,175.32 198,000.00
Shares issued - 44,044.00 37,990.00 2,575.00 - -
Shares redeemed (4,584.92) - (63,600.00) (383,719.98) (371,775.32) -
Shares outstanding, end of period - 44,044.00 73,840.00 53,925.00 59,400.00 198,000.00
Class Z (C) (HGBP)
Shares outstanding, beginning of period 50,037.88 6,000.00 260,750.00 30,200.00 6,000.00 -
Shares issued 2,780.00 - 141,536.00 3,620.00 - -
Shares redeemed - - (11,593.00) - - -
Shares outstanding, end of period 52,817.88 6,000.00 390,693.00 33,820.00 6,000.00 -
Class Z (C) (HEUR)
Shares outstanding, beginning of period 6,500.00 6,500.00 50,471.00 70,175.00 49,325.00 -
Shares issued - - 1,329.00 3,025.00 - -
Shares redeemed - - - - - -
Shares outstanding, end of period 6,500.00 6,500.00 51,800.00 73,200.00 49,325.00 -
Class S1 (C) (USD)
Shares outstanding, beginning of period - - - - - -
Shares issued 41,957.94 - 9,094.51 - 9,054.78 -
Shares redeemed (33,573.10) - - - - -
Shares outstanding, end of period 8,384.84 - 9,094.51 - 9,054.78 -
The accompanying notes form an integral part of these financial statements.
13

Statistical Information as at 31 January 2011
HSBC Portfolios HSBC Portfolios HSBC Portfolios HSBC Portfolios HSBC Portfolios HSBC Portfolios
World Selection 1 World Selection 2 World Selection 3 World Selection 4 World Selection 5 GOAL
NUMBER OF SHARES OUTSTANDING:
as at 31 January 2011
Class A (C) (USD) 2,139,003.03 2,444,562.73 3,082,892.97 1,604,499.73 2,932,896.44 1,000.00
Class A (C) (HGBP) 783,537.62 1,174,788.02 1,256,108.59 781,677.89 1,115,397.61 -
Class A (C) (HEUR) 11,636,252.04 7,129,247.89 5,506,396.78 2,163,078.64 1,854,743.24 -
Class E (C) (USD) - - - - - 1,000.00
Class Z (C) (USD) - 44,044.00 73,840.00 53,925.00 59,400.00 198,000.00
Class Z (C) (HGBP) 52,817.88 6,000.00 390,693.00 33,820.00 6,000.00 -
Class Z (C) (HEUR) 6,500.00 6,500.00 51,800.00 73,200.00 49,325.00 -
Class S1 (C) (USD) 8,384.84 - 9,094.51 - 9,054.78 -
NET ASSET VALUE PER SHARE:
as at 31 January 2011
Class A (C) (USD) USD 10.7504 USD 10.8982 USD 11.0376 USD 11.1898 USD 11.2555 USD 10.9781
Class A (C) (HGBP) GBP 10.7756 GBP 10.9110 GBP 11.0398 GBP 11.1934 GBP 11.2511 -
Class A (C) (HEUR) EUR 10.7450 EUR 10.8887 EUR 11.0158 EUR 11.1611 EUR 11.2322 -
Class E (C) (USD) - - - - - USD 10.9592
Class Z (C) (USD) - USD 10.1335 USD 11.2067 USD 11.3649 USD 11.4450 USD 11.0496
Class Z (C) (HGBP) GBP 10.9052 GBP 11.0434 GBP 11.2118 GBP 11.3606 GBP 11.4433 -
Class Z (C) (HEUR) EUR 10.8767 EUR 11.0229 EUR 11.1978 EUR 11.3375 EUR 11.4334 -
Class S1 (C) (USD) USD 10.7721 - USD 11.0673 - USD 11.2896 -
NUMBER OF SHARES OUTSTANDING:
as at 31 July 2010
Class A (C) (USD) 1,764,471.41 1,515,428.91 2,579,425.46 2,287,528.79 5,092,990.65 1,000.00
Class A (C) (HGBP) 397,853.24 675,137.91 762,370.67 438,840.55 783,323.99 -
Class A (C) (HEUR) 6,274,228.22 3,765,737.72 2,845,891.86 1,024,305.61 1,000,711.40 -
Class E (C) (USD) - - - - - 1,000.00
Class Z (C) (USD) 4,584.92 - 99,450.00 435,069.98 431,175.32 198,000.00
Class Z (C) (HGBP) 50,037.88 6,000.00 260,750.00 30,200.00 6,000.00 -
Class Z (C) (HEUR) 6,500.00 6,500.00 50,471.00 70,175.00 49,325.00 -
NET ASSET VALUE PER SHARE:
as at 31 July 2010
Class A (C) (USD) USD 10.4124 USD 10.3108 USD 10.1780 USD 10.0960 USD 9.9349 USD 10.2402
Class A (C) (HGBP) GBP 10.4326 GBP 10.3258 GBP 10.1822 GBP 10.1014 GBP 9.9374 -
Class A (C) (HEUR) EUR 10.4143 EUR 10.3073 EUR 10.1763 EUR 10.0929 EUR 9.9371 -
Class E (C) (USD) - - - - - USD 10.2383
Class Z (C) (USD) USD 10.4919 - USD 10.2710 USD 10.1884 USD 10.0337 USD 10.2463
Class Z (C) (HGBP) GBP 10.5015 GBP 10.3963 GBP 10.2791 GBP 10.1932 GBP 10.0406 -
Class Z (C) (HEUR) EUR 10.4808 EUR 10.3814 EUR 10.2712 EUR 10.1853 EUR 10.0381 -
14

15
Notes to the Financial Statements for the period ended 31 January 2011
1. General Information
HSBC Portfolios (the “Company”) was incorporated under the laws of the Grand Duchy of Luxembourg as an investment company (Société d'Investissement à Capital Variable or "SICAV") on 21 July 2009. The capital comprises various classes of shares each relating to a separate sub-fund (hereafter called a "Portfolio") consisting of securities, cash and other sundry assets and liabilities. The accompanying Financial Statements present the assets and liabilities of the individual Portfolios and of the Company taken as a whole. The Financial Statements of each individual Portfolio are expressed in the currency designated in the prospectus for that particular Portfolio and the Financial Statements of the Company are expressed in US Dollar (“USD”). The financial statements have been prepared in accordance with the format prescribed by the Luxembourg authorities for Luxembourg investment companies.
The Company is an officially registered investment fund under part I of the law of 20 December 2002 and has been certified as a UCITS fund under the directive 85/611/CEE of the Council of Europe.
The Company seeks to provide a comprehensive range of Portfolios with the purpose of spreading investment risk and satisfying the requirements of investors seeking to emphasise income, capital conservation and/or capital growth.
The Company offers investors, within the same vehicle, a choice of investments in one or more Portfolios. The Company may issue different classes of shares in one or several Portfolios. Details of the characteristics of such share classes, if and when offered, by one or several Portfolios will be determined by the Directors.
As at 31 January 2011, the Company was comprised of the following Portfolios:
HSBC Portfolios – World Selection 1
HSBC Portfolios – World Selection 2
HSBC Portfolios – World Selection 3
HSBC Portfolios – World Selection 4
HSBC Portfolios – World Selection 5
HSBC Portfolios – GOAL
2. Share Capital
The Company currently offers the following classes of shares:
Class Description
Class A A shares are available to all investors.
Class E E Shares are available in certain countries, subject to the relevant regulatory approval, through specific distributors selected by the Distributor.
Class S* S Shares are available in certain jurisdictions or through certain distributors selected by the Distributor provided
that the investors qualify as institutional investors within the meaning of article 129 of the 2002 Law.
Class Z Z shares are available to investors having entered into a discretionary management agreement with an HSBC Group entity and to investors subscribing via distributors selected by the distributor provided that such investors qualify as institutional investors within the meaning of article 129 of the 2002 Law.
* Successive issue of Classes S Shares are numbered 1, 2, 3, etc. and respectively referred to as S1, S2, S3, etc. A series of Class S Shares may be issued in one or more Portfolios and each series may or may not be available in all Porftolios.
Within each share class of a Portfolio, the Company is entitled to create different sub-classes, distinguished by their distribution policy (Capital-Accumulation (“C”) and Distribution (“D”) shares), their hedging activity (“H”) and/or by any other criterion to be stipulated by the Board of Directors.
Within each share class of a Portfolio, separate currency hedged classes may be issued (suffixed by "H" and the currency into which the Base Currency is hedged e.g. "HEUR" or "HGBP"). Any fees of the Administration Agent relating to the execution of the currency hedging policy will be borne by the relevant currency hedged class.
Investment Minima:
Class of Shares A and E S1, S2 and Z
Dealing Currency USD EUR GBP USD EUR GBP
Minimum initial investment and minimum holding 5,000 5,000 5,000 1,000,000 1,000,000 1,000,000
Minimum subsequent investment 1,000 1,000 1,000 100,000 100,000 100,000
16
Notes to the Financial Statements for the period ended 31 January 2011 (continued)
3. Accounting Policies
The following accounting policies have been used consistently in dealing with items which are considered material in relation to the Company’s financial statements.
a) Accounting convention
The financial statements have been prepared under the historical cost convention modified by the revaluation of investments.
b) Assets and Portfolio securities valuation
Securities are initially recognised at cost, being the fair value of the consideration given.
Shares or units in open-ended undertakings for collective investment, which do not have a price quotation on a regulated market, will be valued at the actual net asset value for such shares or units as of the relevant dealing day, failing which they shall be valued at the last available net asset value which is calculated prior to such dealing day. In the case where events have occurred which have resulted in a material change in the net asset value of such shares or units since the last net asset value was calculated, the value of such shares or units may be adjusted at their fair value in order to reflect, in the reasonable opinion of the Board of Directors, such change. The value of securities (including a share or unit in a closed-ended undertaking for collective investment) and/or financial derivative instruments which are listed and with a price quoted on any official stock exchange or traded on any other organised market is the last available stock price. Where such securities or other assets are quoted or dealt in or on more than one stock exchange or other organised markets, the Board of Directors shall select the principal of such stock exchanges or markets for such purposes.
All purchases and sales of securities are recognised on the trade date, i.e. the date the Company commits to purchase or sell the security.
c) Income and Expenses
Interest is accrued on a day-to-day basis. Dividends are accounted for on an ex-dividend basis.
Expenses are recognised on an accrual basis.
d) Foreign Exchange
The cost of investments, income and expenses in currencies other than the fund relevant reporting currency have been recorded at the rate of exchange ruling at the time of the transaction. The market value of the investments and other assets and liabilities in currencies other than the relevant reporting currency have been converted at the rates of exchange ruling at the date of these financial statements.
e) Realised Profit/(Loss) on Sale of Investments
Realised profit/(loss) on sale of investments is the difference between the historical average cost of the investment and the sale proceeds.
f) Segregated Liability
The Company has segregated liability between its Portfolios; meaning, the assets of a Portfolio are exclusively available to satisfy the rights of shareholders in relation to that Portfolio and the rights of creditors whose claims have arisen in connection with the creation, operation and liquidation of that Portfolio.
g) Dividends payable
Dividends payable by the Company are recorded on the ex-date.
h) Forward Foreign Exchange Contracts
Outstanding forward currency contracts are valued at the closing date by reference to the forward rate of exchange applicable to the outstanding life of the contract. The realised and unrealised gain or loss is shown in the Statement of Net Assets.
i) Net Asset Value per Share
The Net Asset Value per Share is calculated by dividing the net assets of the relevant Class of Shares in a Portfolio included in the Statement of Net Assets by the number of Shares of the relevant class in that Portfolio in issue at the period end.
j) Formation Expenses
The costs and expenses for the formation of the Company and the initial issue of its shares will be borne by the Portfolios and amortized over a period not exceeding 5 years. Any additional Portfolios which may be created in the future shall bear their own formation expenses to be amortized over a period not exceeding 5 years.
4. Charges and Expenses
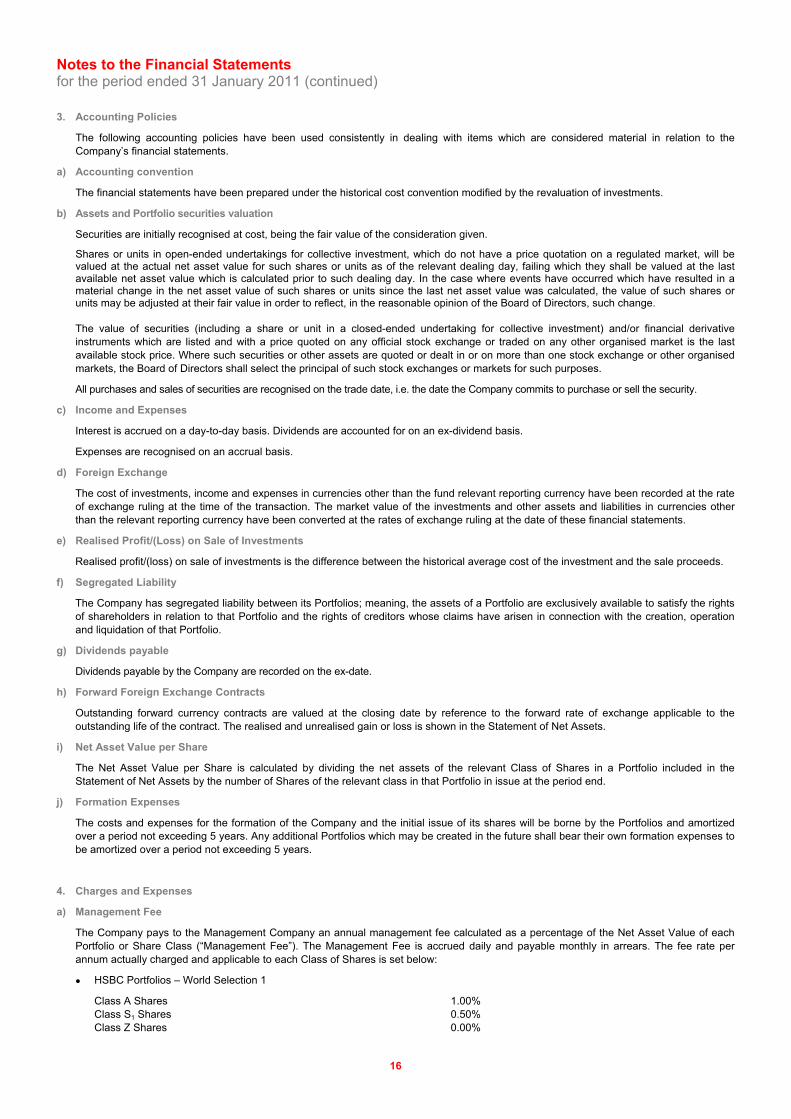
a) Management Fee
The Company pays to the Management Company an annual management fee calculated as a percentage of the Net Asset Value of each Portfolio or Share Class (“Management Fee”). The Management Fee is accrued daily and payable monthly in arrears. The fee rate per annum actually charged and applicable to each Class of Shares is set below:
• HSBC Portfolios – World Selection 1
Class A Shares 1.00% Class S1 Shares 0.50% Class Z Shares 0.00%

17
Notes to the Financial Statements for the period ended 31 January 2011 (continued)
4. Charges and Expenses (continued)
a) Management Fee (continued)
• HSBC Portfolios – World Selection 2
Class A Shares 1.00% Class S1 Shares 0.50% Class Z Shares 0.00%
• HSBC Portfolios – World Selection 3
Class A Shares 1.20% Class S1 Shares 0.60% Class Z Shares 0.00%
• HSBC Portfolios – World Selection 4
Class A Shares 1.20% Class S1 Shares 0.60% Class Z Shares 0.00%
• HSBC Portfolios – World Selection 5
Class A Shares 1.30% Class S1 Shares 0.65% Class Z Shares 0.00%
• HSBC Portfolios – GOAL
Class A Shares 1.15% Class E Shares 1.45% Class S2 Shares 0.35% Class Z Shares 0.00%
The Management Fee covers management and distribution services provided in relation to the relevant Portfolio of the Company by the Management Company, the Investment Advisers and the Share Distributors. The Management Company is responsible for discharging, out of such fee, the fees of the Investment Advisers and the Share Distributors and may pay part of such fee to recognised intermediaries or such other person as the Management Company may determine, at its discretion.
The Management Company may instruct the Company to pay a portion of the Management Fee directly out of the assets of the Company to any of such service providers. In such case the Management Fee due to Management Company is reduced accordingly.
The Management Company is also acting as a management company for other investment funds, namely HSBC Global Investment Funds, HSBC International Select Fund, HSBC Amanah Funds and Sinopia Multi Index Fund.
Management Fees Rebate
The Directors endeavor to reduce duplication of management charges by negotiating rebates where applicable in favour of the Company with the collective investment schemes or their managers. These rebates amount to USD 314,768 for the period ended 31 January 2011.
b) Operating, Administrative and Servicing Expenses
The Company pays to the Management Company a fee to cover certain Operating, Administrative and Servicing Expenses. The Management Company is responsible for discharging out of this fee, the expenses described below, inter alia, payable to the Custodian, the Administration Agent and the Transfer Agent.
This fee is set, for each Portfolio or Share Class, at a fixed percentage of the Net Asset Value of the relevant Portfolio or Share Class specified in the Company’s prospectus. Such fee is accrued daily and payable monthly in arrears.
The rate for class A, E, Z, S1 and S2 Shares is 0.25%. However, the Board of Directors reserves the right to amend the fixed level of the Operating, Administrative and Servicing Expenses applicable to each Portfolio or Class of Shares.
Operating, Administrative and Servicing Expenses cover the ongoing custody fees and safekeeping charges payable to the Custodian and its correspondent banks, fees for fund accounting and administration services (including domiciliary services) payable to the Administrative Agent and transfer agency fees for registrar and transfer agency services payable to the Transfer Agent.
Operating, Administrative and Servicing Expenses also cover expenses relating to the creation of new Portfolio; the Luxembourg asset-based taxe d’abonnement; attendance fees and reasonable out-of-pocket expenses incurred by the Board of Directors; legal, auditing fees and expenses; ongoing registration and listing fees, including translation expenses; the costs and expenses of preparing, printing, and distributing the Company’s Prospectus, simplified prospectuses, financial reports, statements and other documents made available directly or through intermediaries to its shareholders.

18
Notes to the Financial Statements for the period ended 31 January 2011 (continued)
4. Charges and Expenses (continued)
c) Directors’ Fees, Expenses and Interests
None of the Directors are an executive of the Company. A Director may be a party to, or otherwise interested in, any transaction or arrangement with the Company or in which the Company is interested, provided that he has disclosed to the other Directors, prior to the conclusion of any such transaction or arrangement, the nature and extent of any interest of his therein. A Director may vote in respect of any contract or arrangement or any proposal whatsoever in which he has an interest, having first disclosed such interest. He shall not be disqualified by his office from contracting with the Company. If a Director declares his interest in any contract which the Company is considering entering into, he may be counted in the quorum of any meeting to consider the contract and may vote on any resolution to enter into such contract.
5. Taxation
The Company is liable in Luxembourg to a tax (taxe d’abonnement) of 0.05% per annum of its net assets, such tax being payable quarterly and calculated on the Net Asset Value of the Company at the end of the relevant calendar quarter. The taxe d’abonnement is levied at a rate of 0.01% per annum on Portfolios or Classes reserved to Institutional Investors. Under current law and practice, the Company is not liable to Luxembourg taxes on income or capital gains, nor are dividends paid by the Company liable to any Luxembourg withholding tax.
Interest, dividends and capital gains on securities may be subject to withholding or capital gains taxes in certain countries.
The Taxe d’abonnement is paid out of the operating, administrative and servicing expenses fees.
6. Forward Foreign Exchange Contracts
Maturity Date Currency Bought Currency Sold Unrealised
Bought Amount Sold Amount Gain / (Loss)
USD
HSBC Portfolios - World Selection 1
2 February 2011 EUR 121,079,253 USD 162,423,944 3,552,922
2 February 2011 GBP 8,064,551 USD 12,780,580 135,749
2 February 2011 EUR 70,898 USD 95,107 2,081
2 February 2011 GBP 577,603 USD 915,377 9,723
2 February 2011 USD 1,482 GBP 927 (3)
2 February 2011 USD 2,272 GBP 1,420 (3)
2 February 2011 EUR 2,998,611 USD 4,100,757 9,809
2 February 2011 GBP 340,400 USD 538,467 6,724
2 February 2011 USD 13,400,888 GBP 8,404,951 (60,632)
2 February 2011 USD 170,422,808 EUR 124,077,865 333,992
2 February 2011 USD 97,379 EUR 70,898 191
2 February 2011 USD 917,191 GBP 575,256 (4,150)
9 February 2011 GBP 576,415 USD 918,992 4,159
9 February 2011 EUR 124,828,194 USD 171,438,043 (335,981)
9 February 2011 GBP 8,450,569 USD 13,472,946 60,980
9 February 2011 EUR 70,747 USD 97,164 (190)
15 February 2011 USD 3,304,990 GBP 2,074,320 (16,979)
15 February 2011 USD 6,744,512 EUR 4,914,221 9,105
15 February 2011 USD 4,747,364 JPY 393,406,947 (55,090)
3,652,407

19
Notes to the Financial Statements for the period ended 31 January 2011 (continued)
6. Forward Foreign Exchange Contracts Maturity Date Currency Bought Currency Sold Unrealised
Bought Amount Sold Amount Gain / (Loss)
USD
HSBC Portfolios - World Selection 2
2 February 2011 EUR 75,686,017 USD 101,530,369 2,220,902
2 February 2011 GBP 12,834,452 USD 20,339,846 216,040
2 February 2011 EUR 72,149 USD 96,786 2,118
2 February 2011 GBP 66,727 USD 105,748 1,123
2 February 2011 USD 142,973 GBP 89,440 (276)
2 February 2011 USD 84,695 GBP 52,943 (100)
2 February 2011 USD 750 GBP 469 (1)
2 February 2011 USD 691 EUR 505 (2)
2 February 2011 USD 105,643 GBP 66,258 (478)
2 February 2011 USD 103,955,879 EUR 75,686,017 203,731
2 February 2011 USD 98,404 EUR 71,644 193
2 February 2011 USD 20,236,285 GBP 12,692,068 (91,559)
9 February 2011 EUR 77,632,450 USD 106,619,786 (208,951)
9 February 2011 GBP 66,378 USD 105,829 479
9 February 2011 GBP 12,795,130 USD 20,399,582 92,330
9 February 2011 EUR 71,774 USD 98,574 (193)
15 February 2011 USD 3,327,786 GBP 2,088,628 (17,096)
15 February 2011 USD 5,892,033 JPY 488,263,951 (68,373)
15 February 2011 USD 7,434,186 EUR 5,416,734 10,036
2,359,923
HSBC Portfolios - World Selection 3
2 February 2011 EUR 57,751,570 USD 77,471,883 1,694,652
2 February 2011 GBP 13,472,552 USD 21,351,098 226,781
2 February 2011 EUR 586,962 USD 787,391 17,230
2 February 2011 GBP 4,432,566 USD 7,024,664 74,613
2 February 2011 USD 3,997 EUR 2,944 (38)
2 February 2011 USD 35,309 GBP 22,088 (68)
2 February 2011 USD 37,556 GBP 23,476 (44)
2 February 2011 USD 4,204 EUR 3,076 (12)
2 February 2011 EUR 1,716,499 USD 2,350,754 2,263
2 February 2011 GBP 397,598 USD 631,732 5,068
2 February 2011 USD 797,934 EUR 580,943 1,564
2 February 2011 USD 22,114,622 GBP 13,870,150 (100,057)
2 February 2011 USD 6,994,653 GBP 4,387,002 (31,647)
2 February 2011 USD 81,680,284 EUR 59,468,069 160,076
9 February 2011 EUR 581,709 USD 798,914 (1,566)
9 February 2011 EUR 60,106,950 USD 82,550,404 (161,781)
9 February 2011 GBP 13,861,817 USD 22,100,228 100,027
9 February 2011 GBP 4,393,086 USD 7,004,002 31,701
15 February 2011 USD 5,152,210 GBP 3,233,697 (26,469)
15 February 2011 USD 12,501,672 EUR 9,109,032 16,877
15 February 2011 USD 8,351,986 JPY 692,116,565 (96,919)
1,912,251

20
Notes to the Financial Statements for the period ended 31 January 2011 (continued)
6. Forward Foreign Exchange Contracts (continued)
Maturity Date Currency Bought Currency Sold Unrealised
Bought Amount Sold Amount Gain / (Loss)
USD
HSBC Portfolios - World Selection 4
2 February 2011 EUR 22,823,627 USD 30,617,166 669,729
2 February 2011 GBP 8,572,693 USD 13,585,875 144,303
2 February 2011 EUR 843,160 USD 1,131,072 24,751
2 February 2011 GBP 390,371 USD 618,654 6,571
2 February 2011 USD 26,127 EUR 19,241 (249)
2 February 2011 USD 7,031 EUR 5,178 (67)
2 February 2011 USD 3,809 GBP 2,383 (7)
2 February 2011 USD 8,262 EUR 6,044 (23)
2 February 2011 USD 4,519 GBP 2,825 (5)
2 February 2011 EUR 718,281 USD 983,689 947
2 February 2011 USD 32,308,736 EUR 23,522,667 63,318
2 February 2011 USD 1,142,679 EUR 831,938 2,239
2 February 2011 USD 13,668,336 GBP 8,572,693 (61,842)
2 February 2011 USD 614,105 GBP 385,163 (2,779)
9 February 2011 EUR 23,636,425 USD 32,462,077 (63,619)
9 February 2011 EUR 833,267 USD 1,144,403 (2,243)
9 February 2011 GBP 385,785 USD 615,066 2,784
9 February 2011 GBP 8,641,667 USD 13,777,617 62,359
9 February 2011 EUR 711,073 USD 968,436 6,232
9 February 2011 GBP 182,851 USD 289,604 3,239
15 February 2011 USD 2,858,133 GBP 1,793,858 (14,683)
15 February 2011 USD 6,899,480 EUR 5,027,134 9,314
15 February 2011 USD 4,787,568 JPY 396,738,574 (55,556)
794,713
HSBC Portfolios - World Selection 5
2 February 2011 GBP 12,329,057 USD 19,538,905 207,533
2 February 2011 EUR 577,126 USD 774,196 16,942
2 February 2011 GBP 70,269 USD 111,361 1,183
2 February 2011 EUR 19,956,208 USD 26,770,614 585,638
2 February 2011 USD 6,261 EUR 4,611 (60)
2 February 2011 USD 893 GBP 559 (2)
2 February 2011 USD 1,209 GBP 756 (1)
2 February 2011 USD 8,415 EUR 6,156 (24)
2 February 2011 EUR 556,374 USD 760,871 1,820
2 February 2011 GBP 254,450 USD 404,289 3,243
2 February 2011 USD 109,942 GBP 68,955 (497)
2 February 2011 USD 777,903 EUR 566,360 1,525
2 February 2011 USD 20,063,195 GBP 12,583,508 (90,775)
2 February 2011 USD 28,174,339 EUR 20,512,582 55,216
9 February 2011 GBP 12,583,262 USD 20,061,797 90,801
9 February 2011 EUR 567,515 USD 779,420 (1,528)
9 February 2011 EUR 20,812,879 USD 28,584,242 (56,019)
9 February 2011 GBP 69,096 USD 110,161 499
15 February 2011 USD 3,755,666 GBP 2,357,179 (19,294)
15 February 2011 USD 12,797,216 EUR 9,324,372 17,276
15 February 2011 USD 8,217,925 JPY 681,007,108 (95,363)
718,113

21
Notes to the Financial Statements for the period ended 31 January 2011 (continued)
6. Forward Foreign Exchange Contracts (continued)
Maturity Date Currency Bought Currency Sold Unrealised
Bought Amount Sold Amount (Loss) / Gain
USD
HSBC Portfolios - GOAL
15 February 2011 USD 281,206 JPY 23,290,460 (2,658)
15 February 2011 EUR 1,283 USD 1,763 (4)
15 February 2011 USD 401,745 EUR 292,387 909
15 February 2011 GBP 472 USD 753 (2)
15 February 2011 USD 122,027 GBP 76,409 393
15 February 2011 JPY 1,709,085 USD 20,635 195
15 February 2011 GBP 2,075 USD 3,300 4
15 February 2011 EUR 5,624 USD 7,704 7
(1,156)
7. Soft Commission Arrangements
The Investment Adviser of the Portfolios may from time to time receive goods and services which are paid for out of broker commissions provided that they relate to execution and research services which meet the criteria laid down by United Kingdom’s Financial Services Authority Rules.
There were no soft commissions paid or accrued during the period.
8. Transactions with connected persons
Transaction costs such as brokerage fees have no impact on the Company as these fees are paid out of Operating, Administrative and Servicing Expenses, which is set, for each Portfolio or Share Class, at a fixed percentage of the Net Asset Value of the relevant Portfolio or Share Class. No additional transaction costs have been paid out of the assets of the Company.
9. Publication of TER (Total Expense Ratio) - Information concerning the Swiss Investors
Total Expense Ratio (%) for the period ended 31 January 2011:
HSBC
Portfolios
World Selection 1
HSBC
Portfolios
World Selection 2
HSBC
Portfolios
World Selection 3
HSBC
Portfolios
World Selection 4
HSBC
Portfolios
World Selection 5
HSBC
Portfolios
GOAL
Class A (C) (USD) 1.91 1.97 2.23 2.28 2.47 1.68
Class A (C) (HGBP) 1.90 1.97 2.23 2.27 2.46 -
Class A (C) (HEUR) 1.90 - 2.23 2.27 2.46 -
Class E (C) (USD) - - - - - 1.99
Class Z (C) (USD) 0.90 - 1.03 1.08 1.16 0.53
Class Z (C) (HGBP) 0.90 0.97 1.03 1.07 1.16 -
Class Z (C) (HEUR) 0.90 0.97 1.03 1.07 1.16 -
Class S1 (C) (USD) 0.90 - 1.02 - 1.15 -
10. Subsequent events
There were no subsequent events.

Schedule of Investments and Other Net Assets as at 31 January 2011
HSBC Portfolios - World Selection 1
Fair Value as a
Description Fair PercentageUnits of eligible UCITS and UCI's within the meaning of article 41 (1) e Value of Net Assets
Quantity of the Luxembourg Law of 20 December 2002 USD %
Channel Islands 4,422,476 2.12 257,645 ETFS All Commodities 4,422,476 2.12
Ireland 45,925,171 21.97 27,867 HSBC Ucits AdvantEdge Fund "WS" 2,809,560 1.34
208,424 Majedie Tortoise Fund "G" 441,988 0.21 1,820,633 Pimco Global Bond Fund 38,706,658 18.52 325,695 Wellington - Opportunistic Emerging Markets Debt Portfolio 3,966,965 1.90
Japan 1,940,316 0.93 1,775,807 HSBC Japan Index Inst 1,940,316 0.93
Luxembourg 145,216,535 69.47 4,003,983 AllianceBernstein Global Bond 37,957,758 18.16 270 Amundi Volatility Euro Equities "IC" 566,487 0.27 81 Exane Archimedes Fund 1,625,339 0.78 366,608 Goldman Sachs Emerging Markets "I" 3,640,417 1.74 1,484,937 Goldman Sachs Global Fixed Income Plus 17,076,776 8.17 100,554 HSBC International Select Fund - Global Real Estate Equity "X" 1,145,411 0.55 198,111 HSBC International Select Fund - MultiAlpha Asia Pacific Ex Japan Equity "X" 2,657,738 1.27 493,611 HSBC International Select Fund - MultiAlpha Europe Equity "X" 7,381,192 3.53 3,543,921 HSBC International Select Fund - MultiAlpha Global Aggregate Bond "X" 38,709,894 18.52 58,425 HSBC International Select Fund - MultiAlpha Global Emerging Markets Equity "X" 655,587 0.31 1,512,322 HSBC International Select Fund - MultiAlpha Global High Yield Bond "X" 16,743,975 8.01 300,493 HSBC International Select Fund - MultiAlpha Japan Equity "X" 3,083,539 1.48 910,677 HSBC International Select Fund - MultiAlpha North America Equity "X" 9,102,126 4.35 6,955 JP Morgan Highbridge Statistical Market Neutral Fund "C" 903,594 0.43 5,888 Partners Group Private Listed Equities Fund 769,951 0.37 21,472 Schroder Alternative Solutions Commodity "C" 3,196,751 1.53
United Kingdom 1,231,325 0.59 449,722 BlackRock UK Absolute Alpha 907,209 0.44 5,886 Electra Private Equity 151,920 0.07 1,029 HgCapital Trust "Sub" 1,640 - 11,081 HgCapital Trust 170,556 0.08
Total units of eligible UCITS and UCI's within the meaning of article 41 (1) e of the Luxembourg Law of 20 December 2002 198,735,823 95.08
Other Net Assets 10,293,095 4.92
Net Assets 209,028,918 100.00
22

Schedule of Investments and Other Net Assets as at 31 January 2011
HSBC Portfolios - World Selection 2
Fair Value as a
Description Fair PercentageUnits of eligible UCITS and UCI's within the meaning of article 41 (1) e Value of Net Assets
Quantity of the Luxembourg Law of 20 December 2002 USD %
Channel Islands 4,491,909 2.91 261,690 ETFS All Commodities 4,491,909 2.91
Ireland 18,699,872 12.13 31,012 HSBC Ucits AdvantEdge Fund "WS" 3,126,580 2.03 142,421 Majedie Tortoise Fund "G" 302,021 0.20 569,266 Pimco Global Bond Fund 12,102,595 7.85 260,154 Wellington - Opportunistic Emerging Markets Debt Portfolio 3,168,676 2.05
Japan 2,403,088 1.56 2,199,343 HSBC Japan Index Inst Acc 2,403,088 1.56
Luxembourg 121,681,290 78.89 2,938,681 AllianceBernstein Global Bond 27,858,696 18.06 181 Amundi Volatility Euro Equities "IC" 379,756 0.25 5,469 East Capital (Lux) Russian Fund 556,908 0.36 60 Exane Archimedes Fund 1,203,955 0.78 324,989 Goldman Sachs Emerging Markets "I" 3,227,141 2.09 373,181 HSBC International Select Fund - Global Real Estate Equity "X" 4,250,905 2.76 207,735 HSBC International Select Fund - MultiAlpha Asia Pacific Ex Japan Equity "X" 2,786,848 1.81 626,485 HSBC International Select Fund - MultiAlpha Europe Equity "X" 9,368,118 6.07 2,575,897 HSBC International Select Fund - MultiAlpha Global Aggregate Bond "X" 28,136,265 18.24 810,854 HSBC International Select Fund - MultiAlpha Global Emerging Markets Equity 9,098,593 5.90 1,284,874 HSBC International Select Fund - MultiAlpha Global High Yield Bond "X" 14,225,738 9.22 369,949 HSBC International Select Fund - MultiAlpha Japan Equity "X" 3,796,268 2.46 1,287,949 HSBC International Select Fund - MultiAlpha North America Equity "X" 12,872,921 8.35 4,398 JP Morgan Highbridge Statistical Market Neutral Fund "C" 571,388 0.37 5,626 Partners Group Private Listed Equities Fund 735,690 0.48 17,545 Schroder Alternative Solutions Commodity "C" 2,612,100 1.69
United Kingdom 1,063,125 0.68 255,619 BlackRock UK Absolute Alpha 515,651 0.33 10,971 Electra Private Equity 283,166 0.18 1,787 HgCapital Trust "Sub" 2,848 - 16,987 HgCapital Trust 261,460 0.17
Total units of eligible UCITS and UCI's within the meaning of article 41 (1) e of the Luxembourg Law of 20 December 2002 148,339,284 96.17
Other Net Assets 5,900,058 3.83
Net Assets 154,239,342 100.00
23

Schedule of Investments and Other Net Assets as at 31 January 2011
HSBC Portfolios - World Selection 3
FairValue as a
Description Fair PercentageUnits of eligible UCITS and UCI's within the meaning of article 41 (1) e Value of Net Assets
Quantity of the Luxembourg Law of 20 December 2002 USD %
Channel Islands 4,643,665 3.13 270,531 ETFS All Commodities 4,643,665 3.13
Ireland 6,556,505 4.43 23,847 HSBC Ucits AdvantEdge Fund "WS" 2,404,287 1.63 148,338 Majedie Tortoise Fund "G" 314,568 0.21 315,078 Wellington - Opportunistic Emerging Markets Debt Portfolio 3,837,650 2.59
Japan 2,885,011 1.95 2,640,407 HSBC Japan Index Inst 2,885,011 1.95
Luxembourg 127,162,923 85.85 737,910 AllianceBernstein Global Bond 6,995,387 4.72 197 Amundi Volatility Euro Equities "IC" 413,325 0.28 6,329 East Capital (Lux) Russian Fund 644,482 0.44 66 Exane Archimedes Fund 1,324,350 0.89 354,033 Goldman Sachs Emerging Markets "I" 3,515,548 2.37 360,673 HSBC International Select Fund - Global Real Estate Equity "X" 4,108,426 2.77 333,491 HSBC International Select Fund - MultiAlpha Asia Pacific Ex Japan Equity "X" 4,473,915 3.02 1,051,982 HSBC International Select Fund - MultiAlpha Europe Equity "X" 15,730,770 10.62 2,482,220 HSBC International Select Fund - MultiAlpha Global Aggregate Bond "X" 27,113,042 18.31 1,255,449 HSBC International Select Fund - MultiAlpha Global Emerging Markets Equity 14,087,393 9.51 1,460,957 HSBC International Select Fund - MultiAlpha Global High Yield Bond "X" 16,175,278 10.92 572,925 HSBC International Select Fund - MultiAlpha Japan Equity "X" 5,879,127 3.97 2,142,628 HSBC International Select Fund - MultiAlpha North America Equity "X" 21,415,353 14.46 5,330 JP Morgan Highbridge Statistical Market Neutral Fund "C" 692,474 0.47 14,717 Partners Group Private Listed Equities Fund 1,924,486 1.30 17,931 Schroder Alternative Solutions Commodity "C" 2,669,567 1.80
United Kingdom 2,305,393 1.55 316,329 BlackRock UK Absolute Alpha 638,120 0.43 37,973 Electra Private Equity 980,099 0.66 4,362 HgCapital Trust "Sub" 6,951 - 44,194 HgCapital Trust 680,223 0.46
Total units of eligible UCITS and UCI's within the meaning of article 41 (1) e of the Luxembourg Law of 20 December 2002 143,553,497 96.91Other Net Assets 4,576,844 3.09Net Assets 148,130,341 100.00
24

Schedule of Investments and Other Net Assets as at 31 January 2011
HSBC Portfolios - World Selection 4
FairValue as a
Description Fair PercentageUnits of eligible UCITS and UCI's within the meaning of article 41 (1) e Value of Net Assets
Quantity of the Luxembourg Law of 20 December 2002 USD %
Channel Islands 1,331,420 1.9777,566 ETFS All Commodities 1,331,420 1.97
Ireland 1,575,231 2.34 4,041 HSBC Ucits AdvantEdge Fund "WS" 407,397 0.60
57,547 Majedie Tortoise Fund "G" 122,035 0.1885,862 Wellington - Opportunistic Emerging Markets Debt Portfolio 1,045,799 1.56
Japan 1,644,713 2.441,505,267 HSBC Japan Index Inst 1,644,713 2.44
Luxembourg 59,387,321 88.0790 Amundi Volatility Euro Equities "IC" 188,829 0.28
4,933 East Capital (Lux) Russian Fund 502,327 0.7424 Exane Archimedes Fund 481,582 0.71
100,060 Goldman Sachs Emerging Markets "I" 993,596 1.47188,565 HSBC International Select Fund - Global Real Estate Equity "X" 2,147,944 3.19196,275 HSBC International Select Fund - MultiAlpha Asia Pacific Ex Japan Equity "X" 2,633,108 3.90623,838 HSBC International Select Fund - MultiAlpha Europe Equity "X" 9,328,536 13.84733,831 HSBC International Select Fund - MultiAlpha Global Aggregate Bond "X" 8,015,563 11.90865,054 HSBC International Select Fund - MultiAlpha Global Emerging Markets Equity 9,706,771 14.40566,696 HSBC International Select Fund - MultiAlpha Global High Yield Bond "X" 6,274,288 9.30345,095 HSBC International Select Fund - MultiAlpha Japan Equity "X" 3,541,227 5.25
1,238,826 HSBC International Select Fund - MultiAlpha North America Equity "X" 12,381,942 18.36760 JP Morgan Highbridge Statistical Market Neutral Fund "C" 98,739 0.15
8,324 Partners Group Private Listed Equities Fund 1,088,498 1.6113,463 Schroder Alternative Solutions Commodity "C" 2,004,371 2.97
United Kingdom 1,202,377 1.7946,394 BlackRock UK Absolute Alpha 93,589 0.1425,224 Electra Private Equity 651,042 0.97
3,841 HgCapital Trust "Sub" 6,121 0.01 29,342 HgCapital Trust 451,625 0.67
Total units of eligible UCITS and UCI's within the meaning of article 41 (1) e of the Luxembourg Law of 20 December 2002 65,141,062 96.61Other Net Assets 2,288,561 3.39Net Assets 67,429,623 100.00
25
Schedule of Investments and Other Net Assets as at 31 January 2011
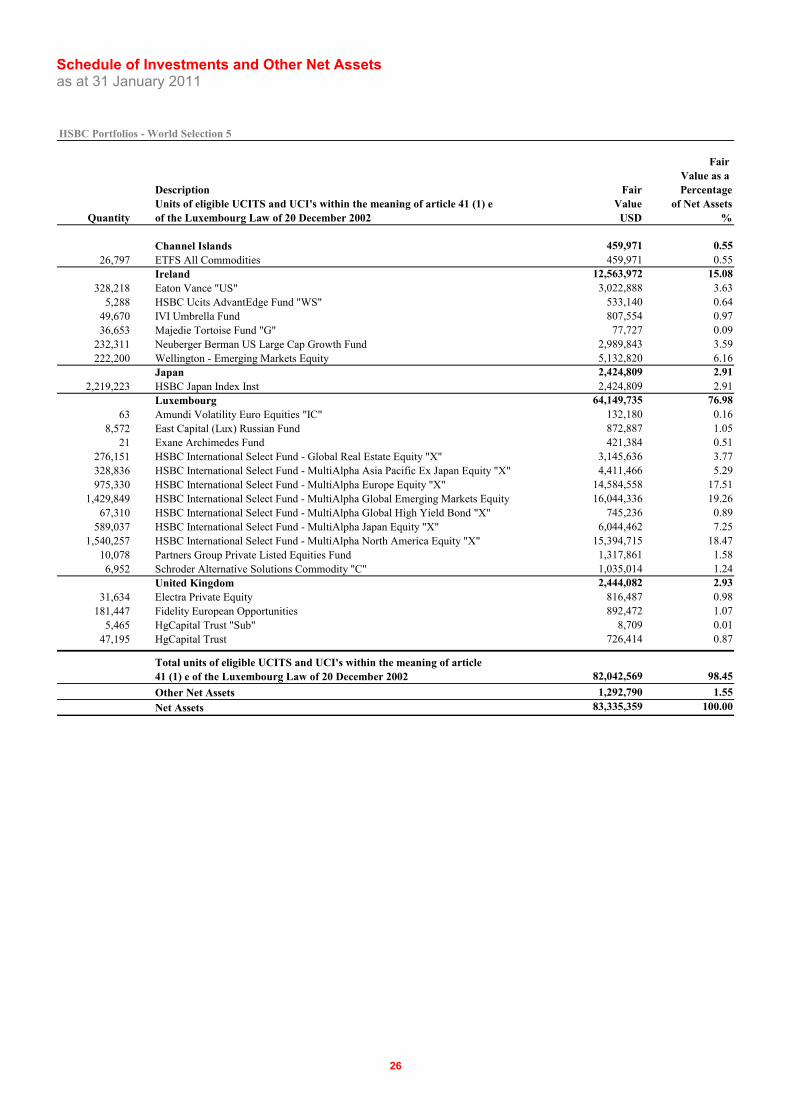
HSBC Portfolios - World Selection 5
Fair Value as a
Description Fair PercentageUnits of eligible UCITS and UCI's within the meaning of article 41 (1) e Value of Net Assets
Quantity of the Luxembourg Law of 20 December 2002 USD %
Channel Islands 459,971 0.5526,797 ETFS All Commodities 459,971 0.55
Ireland 12,563,972 15.08328,218 Eaton Vance "US" 3,022,888 3.63
5,288 HSBC Ucits AdvantEdge Fund "WS" 533,140 0.6449,670 IVI Umbrella Fund 807,554 0.9736,653 Majedie Tortoise Fund "G" 77,727 0.09
232,311 Neuberger Berman US Large Cap Growth Fund 2,989,843 3.59222,200 Wellington - Emerging Markets Equity 5,132,820 6.16
Japan 2,424,809 2.912,219,223 HSBC Japan Index Inst 2,424,809 2.91
Luxembourg 64,149,735 76.9863 Amundi Volatility Euro Equities "IC" 132,180 0.16
8,572 East Capital (Lux) Russian Fund 872,887 1.0521 Exane Archimedes Fund 421,384 0.51
276,151 HSBC International Select Fund - Global Real Estate Equity "X" 3,145,636 3.77328,836 HSBC International Select Fund - MultiAlpha Asia Pacific Ex Japan Equity "X" 4,411,466 5.29975,330 HSBC International Select Fund - MultiAlpha Europe Equity "X" 14,584,558 17.51
1,429,849 HSBC International Select Fund - MultiAlpha Global Emerging Markets Equity 16,044,336 19.2667,310 HSBC International Select Fund - MultiAlpha Global High Yield Bond "X" 745,236 0.89
589,037 HSBC International Select Fund - MultiAlpha Japan Equity "X" 6,044,462 7.251,540,257 HSBC International Select Fund - MultiAlpha North America Equity "X" 15,394,715 18.47
10,078 Partners Group Private Listed Equities Fund 1,317,861 1.586,952 Schroder Alternative Solutions Commodity "C" 1,035,014 1.24
United Kingdom 2,444,082 2.9331,634 Electra Private Equity 816,487 0.98
181,447 Fidelity European Opportunities 892,472 1.075,465 HgCapital Trust "Sub" 8,709 0.01
47,195 HgCapital Trust 726,414 0.87
Total units of eligible UCITS and UCI's within the meaning of article 41 (1) e of the Luxembourg Law of 20 December 2002 82,042,569 98.45
Other Net Assets 1,292,790 1.55
Net Assets 83,335,359 100.00
26
Schedule of Investments and Other Net Assets as at 31 January 2011
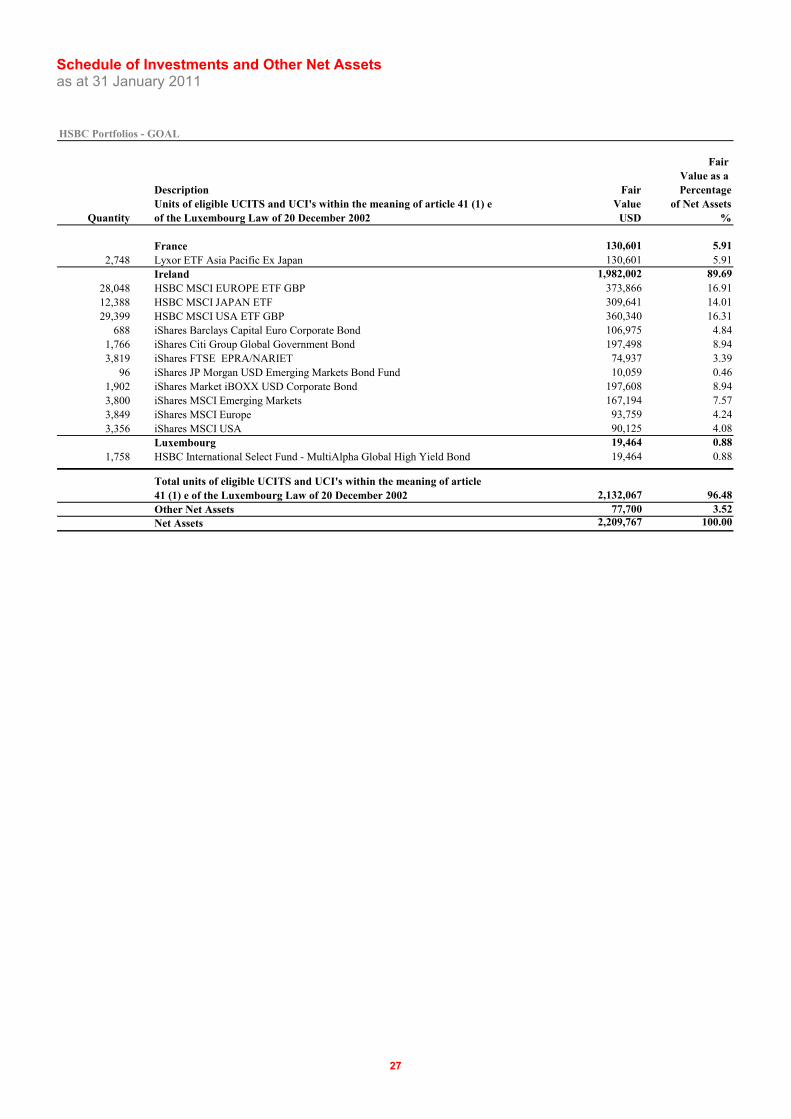
HSBC Portfolios - GOAL
Fair Value as a
Description Fair PercentageUnits of eligible UCITS and UCI's within the meaning of article 41 (1) e Value of Net Assets
Quantity of the Luxembourg Law of 20 December 2002 USD %
France 130,601 5.912,748 Lyxor ETF Asia Pacific Ex Japan 130,601 5.91
Ireland 1,982,002 89.6928,048 HSBC MSCI EUROPE ETF GBP 373,866 16.9112,388 HSBC MSCI JAPAN ETF 309,641 14.0129,399 HSBC MSCI USA ETF GBP 360,340 16.31
688 iShares Barclays Capital Euro Corporate Bond 106,975 4.841,766 iShares Citi Group Global Government Bond 197,498 8.943,819 iShares FTSE EPRA/NARIET 74,937 3.39
96 iShares JP Morgan USD Emerging Markets Bond Fund 10,059 0.461,902 iShares Market iBOXX USD Corporate Bond 197,608 8.943,800 iShares MSCI Emerging Markets 167,194 7.573,849 iShares MSCI Europe 93,759 4.243,356 iShares MSCI USA 90,125 4.08
Luxembourg 19,464 0.881,758 HSBC International Select Fund - MultiAlpha Global High Yield Bond 19,464 0.88
Total units of eligible UCITS and UCI's within the meaning of article 41 (1) e of the Luxembourg Law of 20 December 2002 2,132,067 96.48Other Net Assets 77,700 3.52 Net Assets 2,209,767 100.00
27

28
Fund Holiday Calendar for 2011
All HSBC Portfolios sub-funds will have holidays on:
all Saturdays and Sundays
and on the following dates :
22nd April
25th April
2nd June
13th June
23rd June
15th August
1st November
26th December
Shareholders who deal through the Company's local distributor or representative should note that there will be no dealing for the Shares of the Company in the jurisdiction in which such distributor or representative operates on a day which is not a business day in such jurisdiction.
The Company will determine the fund holiday calendar according to the latest market information obtained by the Company from time to time. Shareholders can obtain the latest fund holiday calendar of the Company from the registered office of the Company or from the Company's local distributor or representative.

Issued by HSBC Global Asset Management (Singapore) Limited Company registration no.: 198602036R