hyperspectral infrared imaging of flames · pdf file1 hyperspectral infrared imaging of flames...
TRANSCRIPT
HYPERSPECTRAL INFRARED IMAGING OF FLAMES USING A SPECTRALLY SCANNING FABRY-PEROT FILTER
W.T. Rawlins, W.G. Lawrence, W.J. Marinelli, and M.G. Allen
Physical Sciences Inc.
20 New England Business Center Andover, MA 01810
Prepared for:
2nd Joint Meeting of the U.S. Sections of the Combustion Institute
March 2001
Copyright © 2001. All rights reserved.
1
HYPERSPECTRAL INFRARED IMAGING OF FLAMES USING A SPECTRALLY SCANNING FABRY-PEROT FILTER
W.T. Rawlins, W.G. Lawrence, W.J. Marinelli, and M.G. Allen Physical Sciences Inc. 20 New England Business Center Andover, MA 01810 Abstract The temperatures and compositions of gases in and around flames can be diagnosed using infrared emission spectroscopy to observe molecular band shapes and intensities. We have combined this approach with a low-order scanning Fabry-Perot filter and an infrared camera to obtain spectrally scanned infrared emission images of a laboratory flame and exhaust plume from 3.7 to 5.0 µm, at a spectral resolution of 0.043 µm and a spatial resolution of 1 mm. The scanning filter or AIRIS (Adaptive Infrared Imaging Spectroradiometer) is a Fabry-Perot etalon operating in low order (mirror spacing ~ wavelength) such that the central spot, containing a monochromatic image of the scene, is viewed by the detector array. The detection system is a 128 x 128 liquid-nitrogen-cooled InSb focal plane array. The field of view is controlled by a 50 mm focal length multielement lens and an f/4.8 aperture, resulting in an image 6.4 x 6.4 cm in extent at the flame and a depth of field of ~4 cm. Hyperspectral images above a laboratory CH4/air flame show primarily the strong emission from CO2 at 4.3 µm, and weaker emissions from CO and H2O. We discuss techniques to analyze the spectra, and plans to use this instrument in microgravity flame spread experiments. Introduction Investigations of the dynamics of flame spread over combustible surfaces in microgravity are critical to spacecraft fire safety, as well as to the understanding of fundamental fire phenomena. In the absence of gravity-induced buoyancy and forced convection, heat transfer between the flame and the fuel surface is dominated by conductive and radiative mechanisms.1 The detailed understanding of these mechanisms requires direct observations of the spatial propagation and radiative fluxes of key flame product species such as CO2 and H2O. We are developing a method to perform such measurements non-intrusively by observing spatially and spectrally resolved infrared emission from flame-produced molecular species including CO2, H2O, and CO. The species-specific rovibrational band structures of the spectra enable discrimination between gas phase, particulate, and hot surface contributions to the observed emission, as well as determinations of path-integrated species concentrations and temperatures. We are developing a hyperspectral infrared imaging instrument to be used in flame spread and other combustion experiments in space and/or low-gravity conditions. This instrument is based on a hyperspectral infrared imaging device previously developed at Physical Sciences Inc. (PSI) and used in several laboratory and ground based applications.2,3 We are using this instrument, named AIRIS (Adaptive Infrared Imaging Spectroradiometer), in laboratory flame measurements to characterize its performance and to develop the necessary data
2
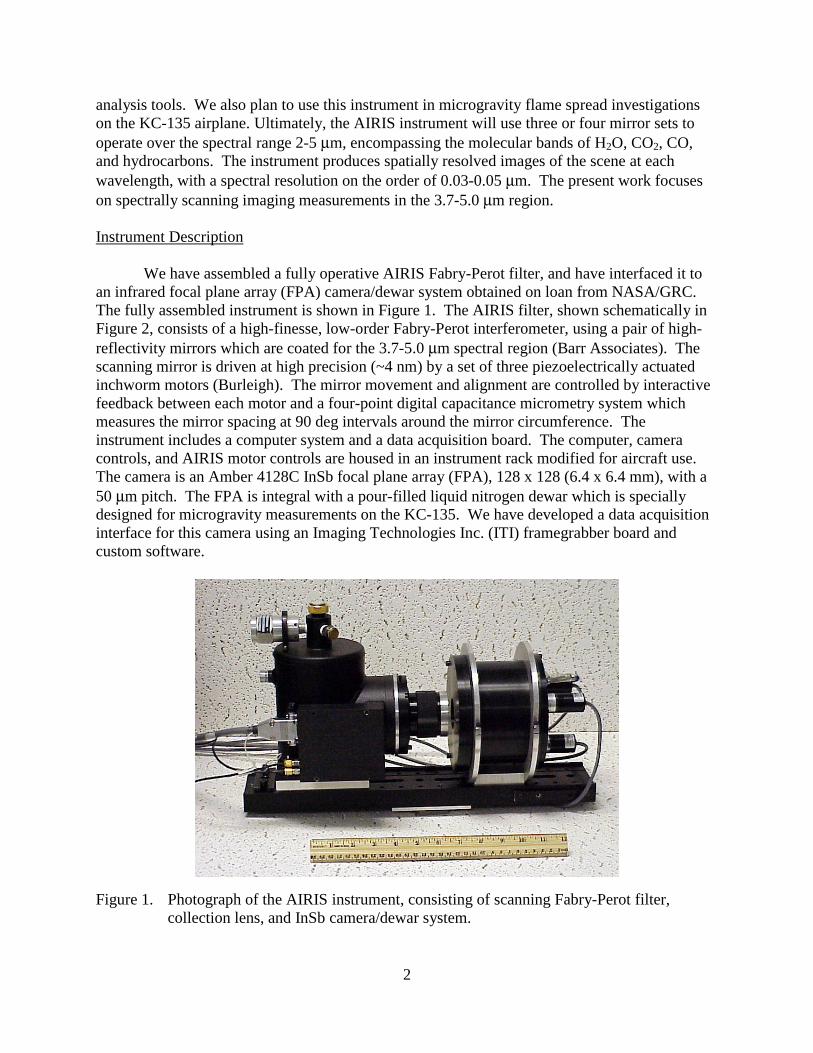
analysis tools. We also plan to use this instrument in microgravity flame spread investigations on the KC-135 airplane. Ultimately, the AIRIS instrument will use three or four mirror sets to operate over the spectral range 2-5 µm, encompassing the molecular bands of H2O, CO2, CO, and hydrocarbons. The instrument produces spatially resolved images of the scene at each wavelength, with a spectral resolution on the order of 0.03-0.05 µm. The present work focuses on spectrally scanning imaging measurements in the 3.7-5.0 µm region. Instrument Description We have assembled a fully operative AIRIS Fabry-Perot filter, and have interfaced it to an infrared focal plane array (FPA) camera/dewar system obtained on loan from NASA/GRC. The fully assembled instrument is shown in Figure 1. The AIRIS filter, shown schematically in Figure 2, consists of a high-finesse, low-order Fabry-Perot interferometer, using a pair of high-reflectivity mirrors which are coated for the 3.7-5.0 µm spectral region (Barr Associates). The scanning mirror is driven at high precision (~4 nm) by a set of three piezoelectrically actuated inchworm motors (Burleigh). The mirror movement and alignment are controlled by interactive feedback between each motor and a four-point digital capacitance micrometry system which measures the mirror spacing at 90 deg intervals around the mirror circumference. The instrument includes a computer system and a data acquisition board. The computer, camera controls, and AIRIS motor controls are housed in an instrument rack modified for aircraft use. The camera is an Amber 4128C InSb focal plane array (FPA), 128 x 128 (6.4 x 6.4 mm), with a 50 µm pitch. The FPA is integral with a pour-filled liquid nitrogen dewar which is specially designed for microgravity measurements on the KC-135. We have developed a data acquisition interface for this camera using an Imaging Technologies Inc. (ITI) framegrabber board and custom software.
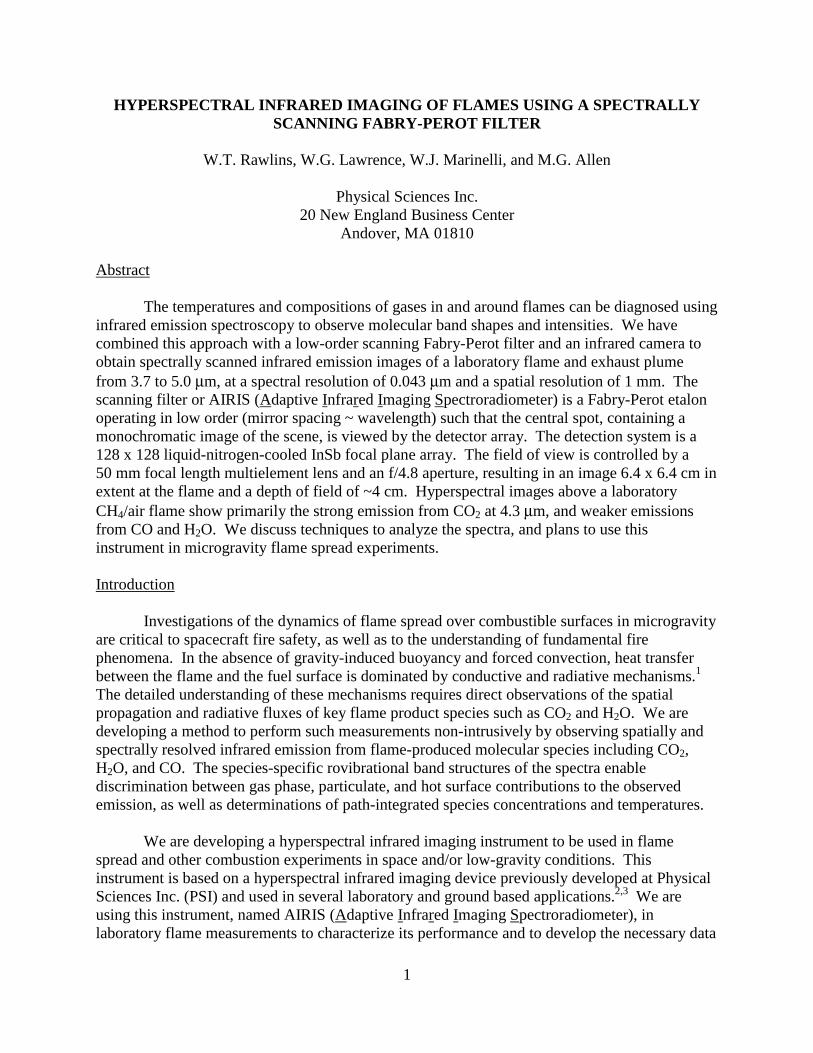
Figure 1. Photograph of the AIRIS instrument, consisting of scanning Fabry-Perot filter, collection lens, and InSb camera/dewar system.
3
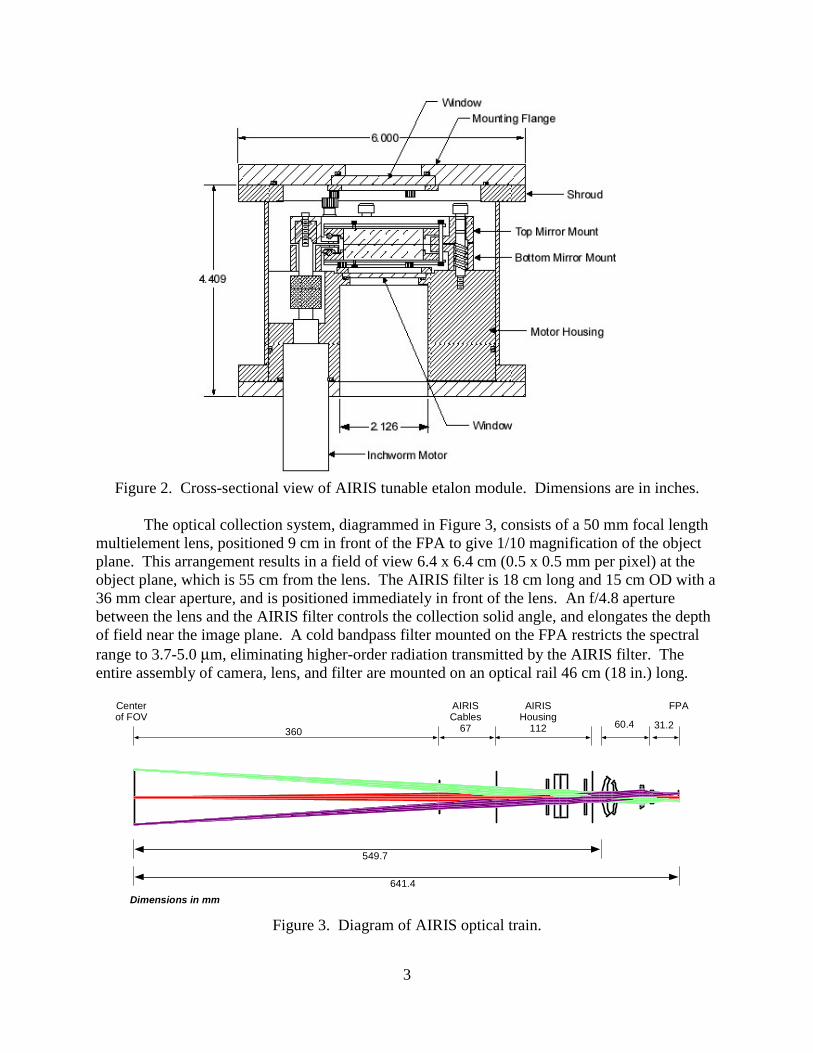
Figure 2. Cross-sectional view of AIRIS tunable etalon module. Dimensions are in inches.
The optical collection system, diagrammed in Figure 3, consists of a 50 mm focal length multielement lens, positioned 9 cm in front of the FPA to give 1/10 magnification of the object plane. This arrangement results in a field of view 6.4 x 6.4 cm (0.5 x 0.5 mm per pixel) at the object plane, which is 55 cm from the lens. The AIRIS filter is 18 cm long and 15 cm OD with a 36 mm clear aperture, and is positioned immediately in front of the lens. An f/4.8 aperture between the lens and the AIRIS filter controls the collection solid angle, and elongates the depth of field near the image plane. A cold bandpass filter mounted on the FPA restricts the spectral range to 3.7-5.0 µm, eliminating higher-order radiation transmitted by the AIRIS filter. The entire assembly of camera, lens, and filter are mounted on an optical rail 46 cm (18 in.) long.
360
Centerof FOV
AIRISCables
67
AIRISHousing
112 60.4 31.2
FPA
549.7
641.4
Dimensions in mm E-6548
Figure 3. Diagram of AIRIS optical train.
4
Quantitative testing of the imaging system using screens of known dimensions and a modulation transfer function analysis has confirmed ray-tracing computations of the field of view. The observed spatial resolution near 4 µm is limited by diffraction, and is intermediate between 0.5 and 1 mm. The observed depth of field for the f/4.8 system is ~4 cm. As described in detail elsewhere,2,3 our approach to hyperspectral imaging takes advantage of the characteristics of low-order Fabry-Perot interferometry. The transmission of a Fabry-Perot etalon is given by an Airy function of the form4
,
2sin
21
1)(
22
2
δ
π+
−=λF
R
T
I
I
o (1)
where
.)(2cos4 λε−θλπ=δ �
(2)
F is the total finesse of the etalon (due to limitations in mirror reflectance, mirror flatness, mirror
parallelism, and aperture), T and R are the mirror transmittance and reflectance, respectively, � is
the mirror spacing, λ is the wavelength of interest, θ is the angle of incidence of the light with respect to the mirror surface, and ε(λ) is the phase shift upon reflection from the mirror coatings. The wavelengths of the transmission peaks satisfy the resonance condition:
,)(
cos2
πλε
+
θ=λ
mm
� (3)
where m is the order of the interference. The wavelength tuning range between adjacent orders is the free spectral range, which is approximately given (neglecting reflected phase dispersion) by
.1
max
+λ
=λ∆mFSR (4)
The spectral resolution, or full width at half maximum of the transmission peak, is
.2/1 FFSRλ∆
=λ∆ (5)
5
For conventional operation of a Fabry-Perot interferometer (e.g., at wavelengths in the visible spectrum), the mirror spacing is much larger than the wavelength, and the phase shift
ε(λ)/π is negligible. Thus, for a fixed value of �, there are many values of (cos θ)/m that satisfy
the resonance condition of Eq. (3). The image of a monochromatic source viewed through the
interferometer is a central spot, corresponding to mmax = 2�/λ, and a series of concentric rings
corresponding to the values of (cos θ)/m = 1/mmax. By operating the interferometer in low order, i.e., � ≅ λ, the Airy rings corresponding to m < mmax lie far off the optical axis, and the central
Airy spot can fill the FOV of the detector. This spot contains a spatially continuous image of the scene, viewed at peak wavelengths given by the mirror spacing and at spectral resolutions determined by the mirror alignment and reflectance. This condition can be achieved in the infrared for mirror spacings of a few µm, with high angular acceptance,
2/12
≤θ∆
m (6)
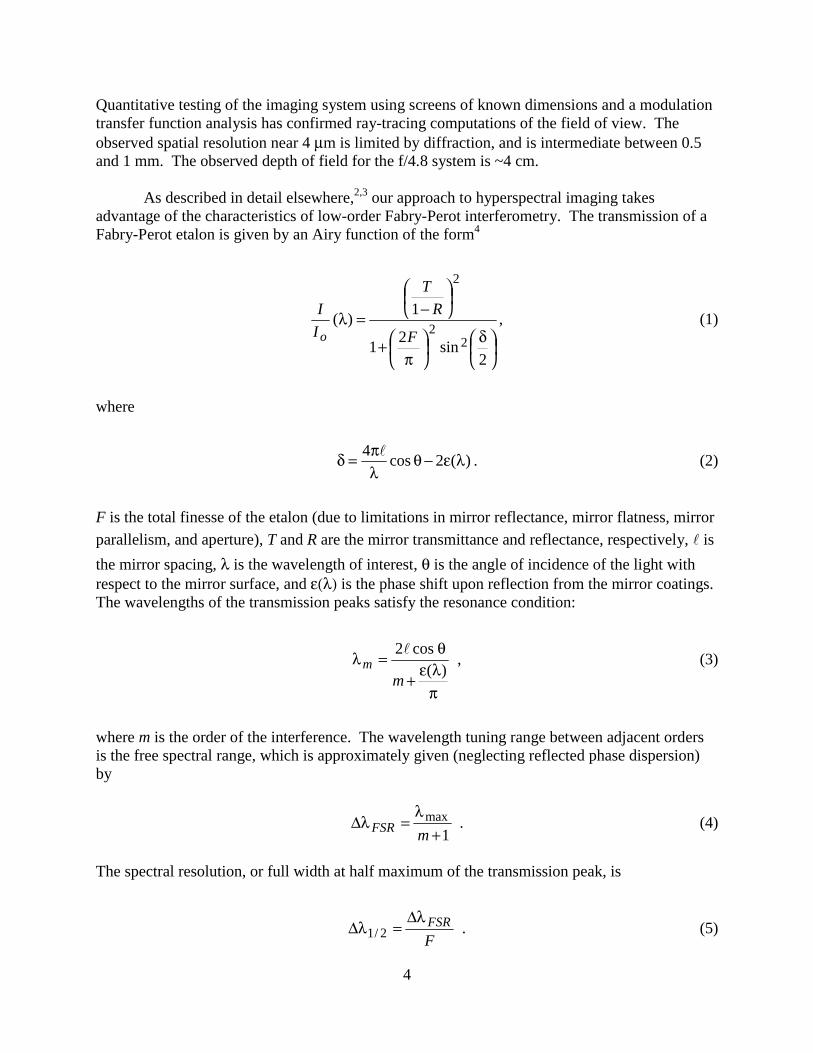
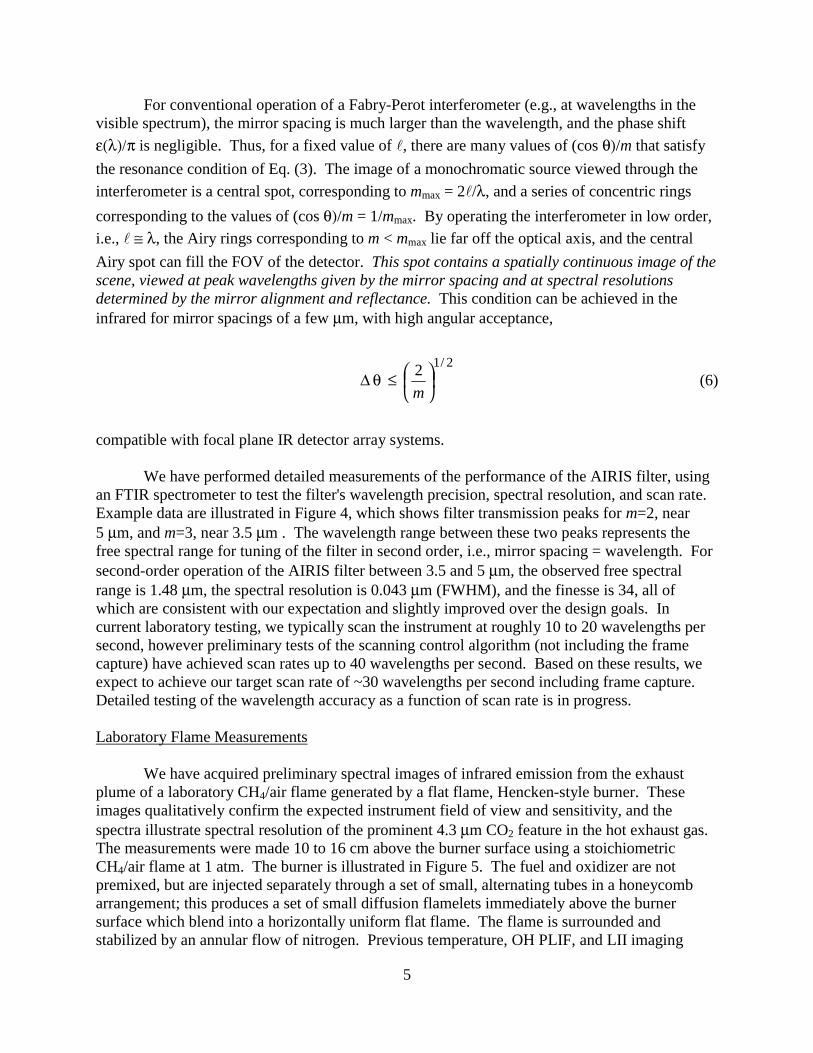
compatible with focal plane IR detector array systems. We have performed detailed measurements of the performance of the AIRIS filter, using an FTIR spectrometer to test the filter's wavelength precision, spectral resolution, and scan rate. Example data are illustrated in Figure 4, which shows filter transmission peaks for m=2, near 5 µm, and m=3, near 3.5 µm . The wavelength range between these two peaks represents the free spectral range for tuning of the filter in second order, i.e., mirror spacing = wavelength. For second-order operation of the AIRIS filter between 3.5 and 5 µm, the observed free spectral range is 1.48 µm, the spectral resolution is 0.043 µm (FWHM), and the finesse is 34, all of which are consistent with our expectation and slightly improved over the design goals. In current laboratory testing, we typically scan the instrument at roughly 10 to 20 wavelengths per second, however preliminary tests of the scanning control algorithm (not including the frame capture) have achieved scan rates up to 40 wavelengths per second. Based on these results, we expect to achieve our target scan rate of ~30 wavelengths per second including frame capture. Detailed testing of the wavelength accuracy as a function of scan rate is in progress. Laboratory Flame Measurements We have acquired preliminary spectral images of infrared emission from the exhaust plume of a laboratory CH4/air flame generated by a flat flame, Hencken-style burner. These images qualitatively confirm the expected instrument field of view and sensitivity, and the spectra illustrate spectral resolution of the prominent 4.3 µm CO2 feature in the hot exhaust gas. The measurements were made 10 to 16 cm above the burner surface using a stoichiometric CH4/air flame at 1 atm. The burner is illustrated in Figure 5. The fuel and oxidizer are not premixed, but are injected separately through a set of small, alternating tubes in a honeycomb arrangement; this produces a set of small diffusion flamelets immediately above the burner surface which blend into a horizontally uniform flat flame. The flame is surrounded and stabilized by an annular flow of nitrogen. Previous temperature, OH PLIF, and LII imaging
6
-5
5
10
15
20
25
30
35
40
45
50
55
60
65
3.4 3.5 3.6 3.7 3.8 3.9 4 4.1 4.2 4.3 4.4 4.5 4.6 4.7 4.8 4.9 5 5.1Wavelength, µm
Tra
nsm
issi
on,%
0
m = 3
m = 2
Figure 4. AIRIS transmission functions for m=2 and m=3, defining the free spectral range of the instrument.
Figure 5. Schematic of flat-flame burner.
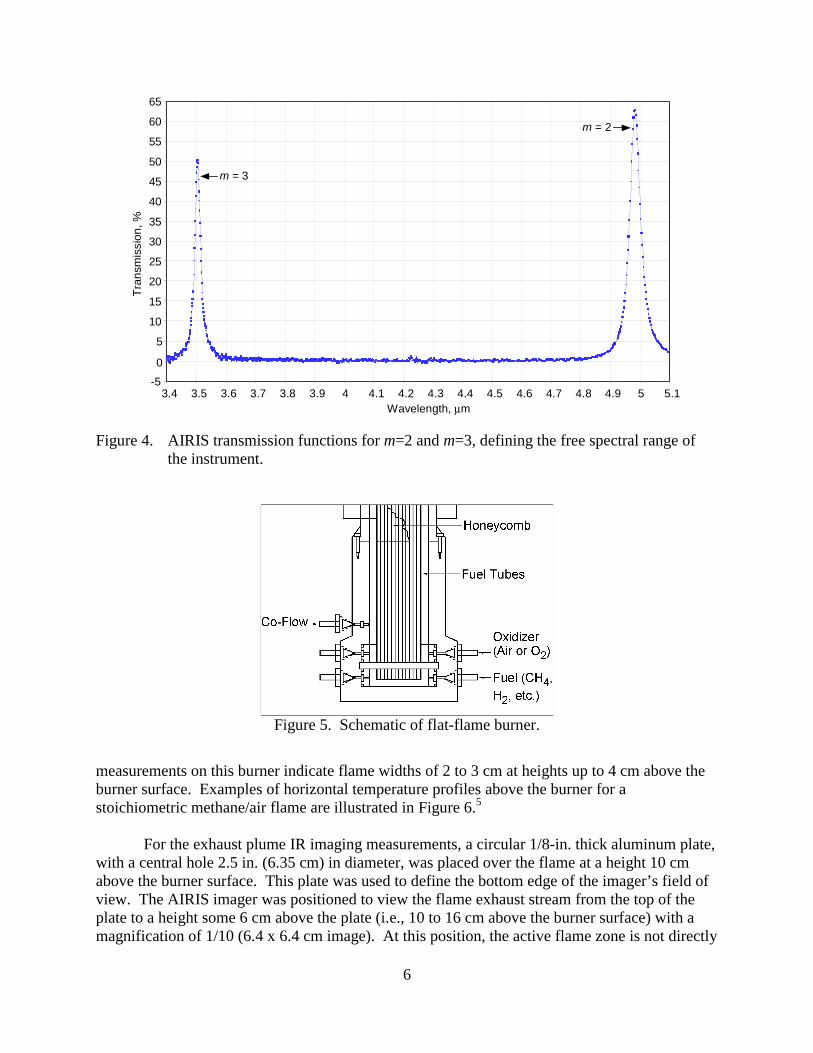
measurements on this burner indicate flame widths of 2 to 3 cm at heights up to 4 cm above the burner surface. Examples of horizontal temperature profiles above the burner for a stoichiometric methane/air flame are illustrated in Figure 6.5 For the exhaust plume IR imaging measurements, a circular 1/8-in. thick aluminum plate, with a central hole 2.5 in. (6.35 cm) in diameter, was placed over the flame at a height 10 cm above the burner surface. This plate was used to define the bottom edge of the imager’s field of view. The AIRIS imager was positioned to view the flame exhaust stream from the top of the plate to a height some 6 cm above the plate (i.e., 10 to 16 cm above the burner surface) with a magnification of 1/10 (6.4 x 6.4 cm image). At this position, the active flame zone is not directly
7
2200
1800
1400
1000
600
200-17 -13 -9 -5 -1 3 7 11 15
Position From Center (mm)
Tem
pera
ture
(K)
0.11 cm0.47 cm0.95 cm1.99 cm2.46 cm
B-9094
Figure 6. Temperature profiles above the flat-flame burner, stoichiometric methane/air flame.
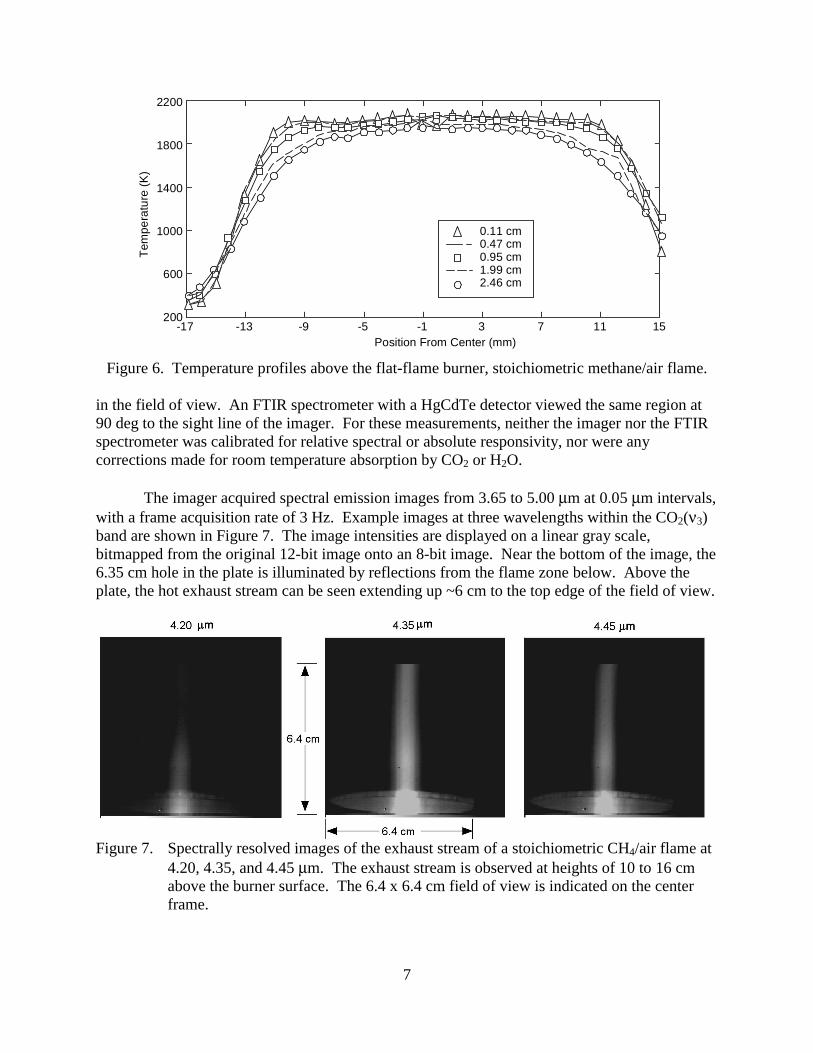
in the field of view. An FTIR spectrometer with a HgCdTe detector viewed the same region at 90 deg to the sight line of the imager. For these measurements, neither the imager nor the FTIR spectrometer was calibrated for relative spectral or absolute responsivity, nor were any corrections made for room temperature absorption by CO2 or H2O. The imager acquired spectral emission images from 3.65 to 5.00 µm at 0.05 µm intervals, with a frame acquisition rate of 3 Hz. Example images at three wavelengths within the CO2(ν3) band are shown in Figure 7. The image intensities are displayed on a linear gray scale, bitmapped from the original 12-bit image onto an 8-bit image. Near the bottom of the image, the 6.35 cm hole in the plate is illuminated by reflections from the flame zone below. Above the plate, the hot exhaust stream can be seen extending up ~6 cm to the top edge of the field of view.
Figure 7. Spectrally resolved images of the exhaust stream of a stoichiometric CH4/air flame at 4.20, 4.35, and 4.45 µm. The exhaust stream is observed at heights of 10 to 16 cm above the burner surface. The 6.4 x 6.4 cm field of view is indicated on the center frame.
8
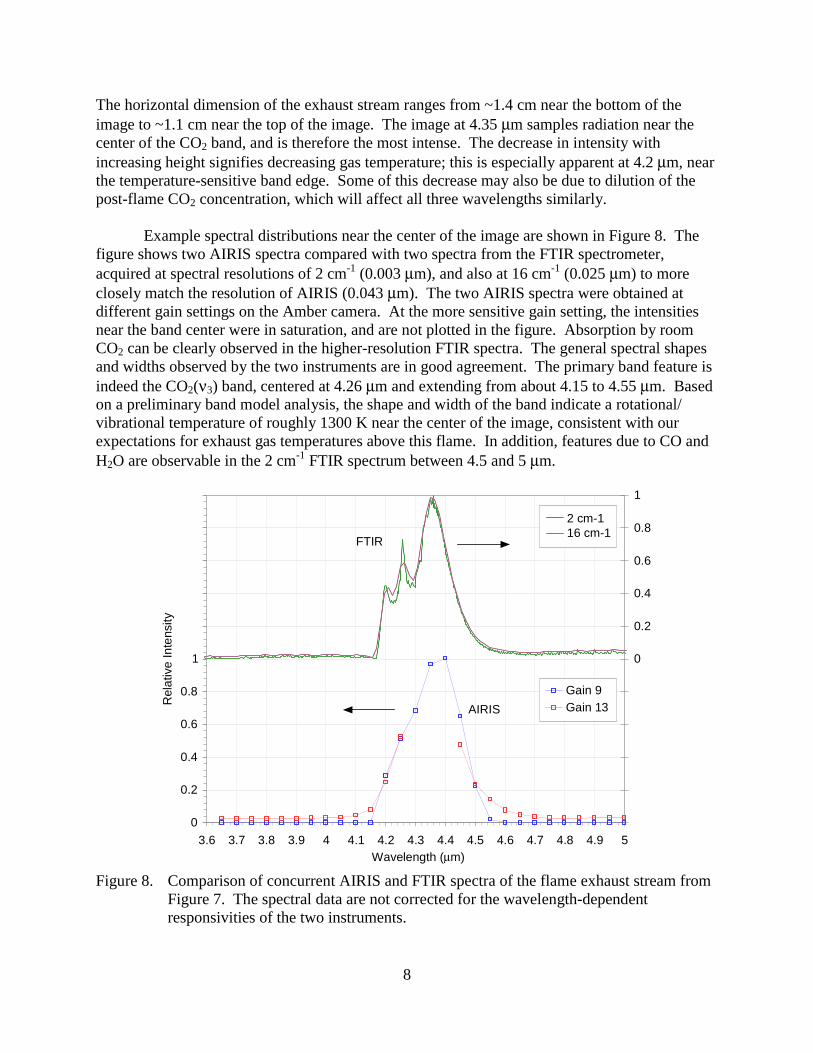
The horizontal dimension of the exhaust stream ranges from ~1.4 cm near the bottom of the image to ~1.1 cm near the top of the image. The image at 4.35 µm samples radiation near the center of the CO2 band, and is therefore the most intense. The decrease in intensity with increasing height signifies decreasing gas temperature; this is especially apparent at 4.2 µm, near the temperature-sensitive band edge. Some of this decrease may also be due to dilution of the post-flame CO2 concentration, which will affect all three wavelengths similarly. Example spectral distributions near the center of the image are shown in Figure 8. The figure shows two AIRIS spectra compared with two spectra from the FTIR spectrometer, acquired at spectral resolutions of 2 cm-1 (0.003 µm), and also at 16 cm-1 (0.025 µm) to more closely match the resolution of AIRIS (0.043 µm). The two AIRIS spectra were obtained at different gain settings on the Amber camera. At the more sensitive gain setting, the intensities near the band center were in saturation, and are not plotted in the figure. Absorption by room CO2 can be clearly observed in the higher-resolution FTIR spectra. The general spectral shapes and widths observed by the two instruments are in good agreement. The primary band feature is indeed the CO2(ν3) band, centered at 4.26 µm and extending from about 4.15 to 4.55 µm. Based on a preliminary band model analysis, the shape and width of the band indicate a rotational/ vibrational temperature of roughly 1300 K near the center of the image, consistent with our expectations for exhaust gas temperatures above this flame. In addition, features due to CO and H2O are observable in the 2 cm-1 FTIR spectrum between 4.5 and 5 µm.
0
0.2
0.4
0.6
0.8
1
3.6 3.7 3.8 3.9 4 4.1 4.2 4.3 4.4 4.5 4.6 4.7 4.8 4.9 5Wavelength (µm)
Rel
ativ
eIn
tens
ity
0
0.2
0.4
0.6
0.8
1
Gain 9Gain 13
FTIR
AIRIS
E-7597
2 cm-116 cm-1
Figure 8. Comparison of concurrent AIRIS and FTIR spectra of the flame exhaust stream from Figure 7. The spectral data are not corrected for the wavelength-dependent responsivities of the two instruments.
9
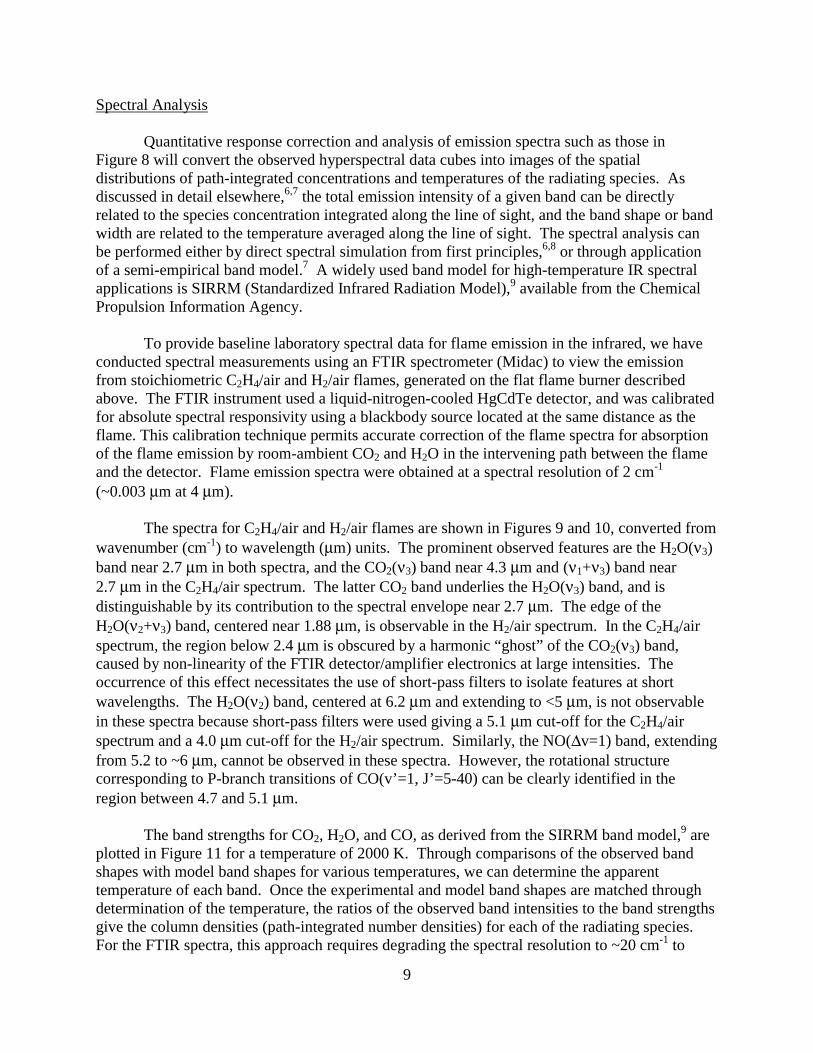
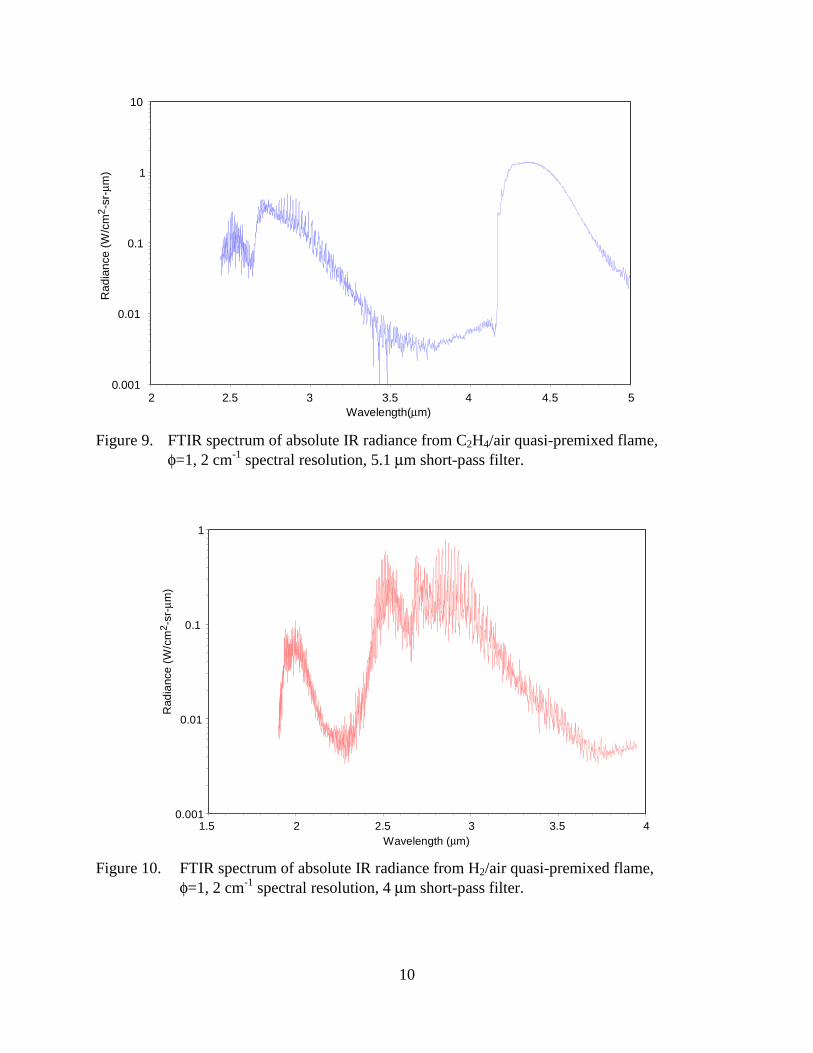
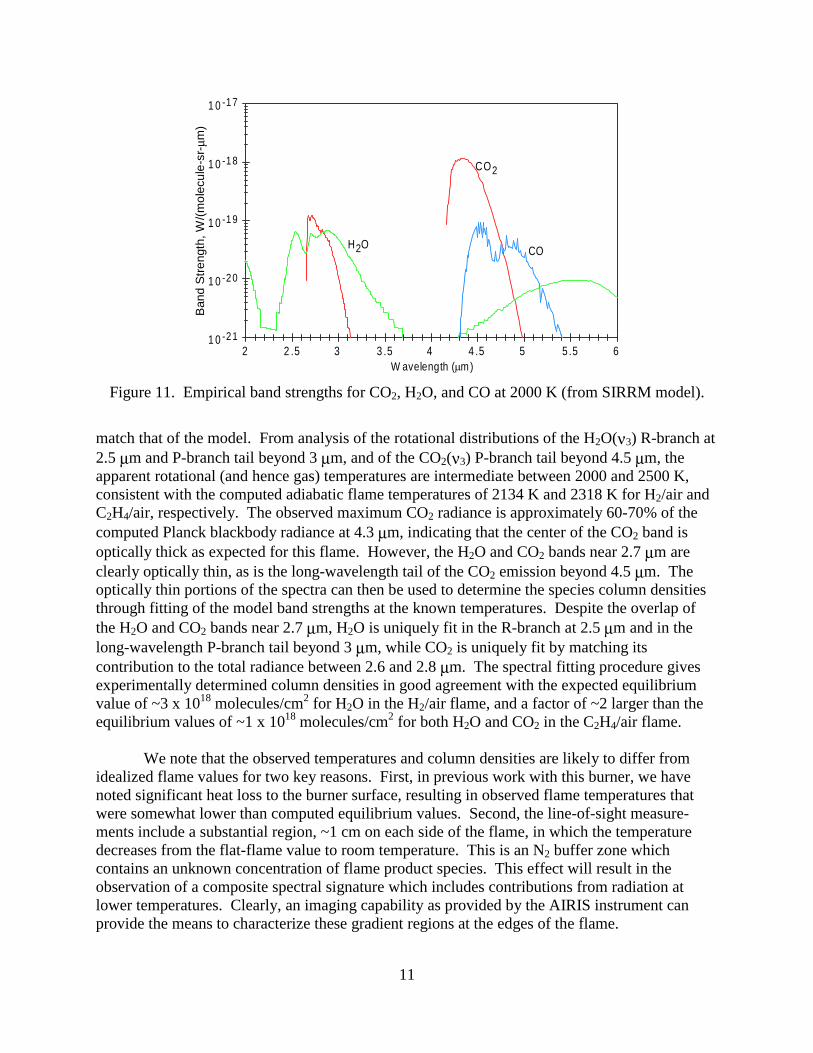
Spectral Analysis Quantitative response correction and analysis of emission spectra such as those in Figure 8 will convert the observed hyperspectral data cubes into images of the spatial distributions of path-integrated concentrations and temperatures of the radiating species. As discussed in detail elsewhere,6,7 the total emission intensity of a given band can be directly related to the species concentration integrated along the line of sight, and the band shape or band width are related to the temperature averaged along the line of sight. The spectral analysis can be performed either by direct spectral simulation from first principles,6,8 or through application of a semi-empirical band model.7 A widely used band model for high-temperature IR spectral applications is SIRRM (Standardized Infrared Radiation Model),9 available from the Chemical Propulsion Information Agency. To provide baseline laboratory spectral data for flame emission in the infrared, we have conducted spectral measurements using an FTIR spectrometer (Midac) to view the emission from stoichiometric C2H4/air and H2/air flames, generated on the flat flame burner described above. The FTIR instrument used a liquid-nitrogen-cooled HgCdTe detector, and was calibrated for absolute spectral responsivity using a blackbody source located at the same distance as the flame. This calibration technique permits accurate correction of the flame spectra for absorption of the flame emission by room-ambient CO2 and H2O in the intervening path between the flame and the detector. Flame emission spectra were obtained at a spectral resolution of 2 cm-1 (~0.003 µm at 4 µm). The spectra for C2H4/air and H2/air flames are shown in Figures 9 and 10, converted from wavenumber (cm-1) to wavelength (µm) units. The prominent observed features are the H2O(ν3) band near 2.7 µm in both spectra, and the CO2(ν3) band near 4.3 µm and (ν1+ν3) band near 2.7 µm in the C2H4/air spectrum. The latter CO2 band underlies the H2O(ν3) band, and is distinguishable by its contribution to the spectral envelope near 2.7 µm. The edge of the H2O(ν2+ν3) band, centered near 1.88 µm, is observable in the H2/air spectrum. In the C2H4/air spectrum, the region below 2.4 µm is obscured by a harmonic “ghost” of the CO2(ν3) band, caused by non-linearity of the FTIR detector/amplifier electronics at large intensities. The occurrence of this effect necessitates the use of short-pass filters to isolate features at short wavelengths. The H2O(ν2) band, centered at 6.2 µm and extending to <5 µm, is not observable in these spectra because short-pass filters were used giving a 5.1 µm cut-off for the C2H4/air spectrum and a 4.0 µm cut-off for the H2/air spectrum. Similarly, the NO(∆v=1) band, extending from 5.2 to ~6 µm, cannot be observed in these spectra. However, the rotational structure corresponding to P-branch transitions of CO(v’=1, J’=5-40) can be clearly identified in the region between 4.7 and 5.1 µm. The band strengths for CO2, H2O, and CO, as derived from the SIRRM band model,9 are plotted in Figure 11 for a temperature of 2000 K. Through comparisons of the observed band shapes with model band shapes for various temperatures, we can determine the apparent temperature of each band. Once the experimental and model band shapes are matched through determination of the temperature, the ratios of the observed band intensities to the band strengths give the column densities (path-integrated number densities) for each of the radiating species. For the FTIR spectra, this approach requires degrading the spectral resolution to ~20 cm-1 to
10
0.001
0.01
0.1
1
10
2 2.5 3 3.5 4 4.5 5Wavelength(µm)
Rad
ianc
e(W
/cm
2 -sr
-µm
)
E-6688
Figure 9. FTIR spectrum of absolute IR radiance from C2H4/air quasi-premixed flame, φ=1, 2 cm-1 spectral resolution, 5.1 µm short-pass filter.
0.001
0.01
0.1
1
1.5 2 2.5 3 3.5 4Wavelength (µm)
Rad
ianc
e(W
/cm
2 -sr
-µm
)
E-6689
Figure 10. FTIR spectrum of absolute IR radiance from H2/air quasi-premixed flame, φ=1, 2 cm-1 spectral resolution, 4 µm short-pass filter.
11
1 0 -21
1 0 -20
1 0 -19
1 0 -18
1 0 -17
2 2 .5 3 3 .5 4 4 .5 5 5 .5 6W avelength (µm)
Ban
dS
tren
gth,
W/(
mol
ecul
e-sr
- µm
)
E-2392a
H2O
CO2
CO
Figure 11. Empirical band strengths for CO2, H2O, and CO at 2000 K (from SIRRM model).
match that of the model. From analysis of the rotational distributions of the H2O(ν3) R-branch at 2.5 µm and P-branch tail beyond 3 µm, and of the CO2(ν3) P-branch tail beyond 4.5 µm, the apparent rotational (and hence gas) temperatures are intermediate between 2000 and 2500 K, consistent with the computed adiabatic flame temperatures of 2134 K and 2318 K for H2/air and C2H4/air, respectively. The observed maximum CO2 radiance is approximately 60-70% of the computed Planck blackbody radiance at 4.3 µm, indicating that the center of the CO2 band is optically thick as expected for this flame. However, the H2O and CO2 bands near 2.7 µm are clearly optically thin, as is the long-wavelength tail of the CO2 emission beyond 4.5 µm. The optically thin portions of the spectra can then be used to determine the species column densities through fitting of the model band strengths at the known temperatures. Despite the overlap of the H2O and CO2 bands near 2.7 µm, H2O is uniquely fit in the R-branch at 2.5 µm and in the long-wavelength P-branch tail beyond 3 µm, while CO2 is uniquely fit by matching its contribution to the total radiance between 2.6 and 2.8 µm. The spectral fitting procedure gives experimentally determined column densities in good agreement with the expected equilibrium value of ~3 x 10¹⁸ molecules/cm2 for H2O in the H2/air flame, and a factor of ~2 larger than the equilibrium values of ~1 x 10¹⁸ molecules/cm2 for both H2O and CO2 in the C2H4/air flame. We note that the observed temperatures and column densities are likely to differ from idealized flame values for two key reasons. First, in previous work with this burner, we have noted significant heat loss to the burner surface, resulting in observed flame temperatures that were somewhat lower than computed equilibrium values. Second, the line-of-sight measure-ments include a substantial region, ~1 cm on each side of the flame, in which the temperature decreases from the flat-flame value to room temperature. This is an N2 buffer zone which contains an unknown concentration of flame product species. This effect will result in the observation of a composite spectral signature which includes contributions from radiation at lower temperatures. Clearly, an imaging capability as provided by the AIRIS instrument can provide the means to characterize these gradient regions at the edges of the flame.
12
Summary This paper describes a hyperspectral Fabry-Perot infrared imager for quantitative infrared emission spectroscopy and imaging of flames. Example images and IR emission spectra are presented for a laboratory quasi-premixed flat flame, and spectral analysis methods are discussed. We plan to apply this non-intrusive measurement method to investigations of flame spread in microgravity and reduced gravity environments. Although specifically focussed toward implementation in a solid fuel flame spread experiment, the IR imaging spectrometer will be widely applicable to other microgravity combustion experiments, such as diffusion and premixed flame structure, soot formation, and droplet combustion investigations. Acknowledgements We are grateful for helpful discussions with C.M. Gittins and B.D. Green on AIRIS performance characteristics. M. Boies and M.F. Miller assisted with the optical system design. D.C. Rossi, R. Sadm, and H.C. Murphy contributed to the instrument assembly. B.L. Upschulte assisted with the FTIR flame spectral measurements. This research is supported by NASA Glenn Research Center, Contract NAS3-99141, Dr. Nancy Piltch, Technical Monitor. References 1. C.K. Law and G.M. Faeth, “Opportunities and Challenges of Combustion in
Microgravity,” Prog. Energy Combust. Sci. 20, 65-113 (1994). 2. C.M. Gittins, W.G. Lawrence, and W.J. Marinelli, “Frequency-Agile Bandpass Filter for
Direct Detection Lidar Receivers,” Appl. Opt. 37, 8327-8335 (1998). 3. W.J. Marinelli, C.M. Gittins, A.H. Gelb, and B.D. Green, “Tunable Fabry-Perot Etalon-
Based Long-Wavelength Infrared Imaging Spectroradiometer,” Appl. Opt. 38, 2594-2604 (1999).
4. G. Hernandez, Fabry Perot Interferometers, Cambridge U. Press, New York, 1988. 5. M.G. Allen, S.J. Davis, W.J. Kessler, H.H. Legner, K.R. McManus, P.A. Mulhall,
T.E. Parker, and D.M. Sonnenfroh, “Instantaneous Velocity Field Imaging Instrument for Supersonic Reacting Flows,” NASA Contractor Report 191162, NASA Lewis Research Center, September 1993.
6. W.T. Rawlins, R.R. Foutter, and T.E. Parker, “Vibrational Band Strengths and
Temperatures of Nitric Oxide by Time-Resolved Emission Spectroscopy in a Shock Tube,” J. Quant. Spectrosc. Radiat. Transfer 49, 423 (1993).
7. T.E. Parker, M.F. Miller, K.R. McManus, M.G. Allen, and W.T. Rawlins, “Infrared
Emission from High-Temperature H2O(ν2): A Diagnostic for Concentration and Temperature,” AIAA J. 34, 500 (1996).
13
8. W.T. Rawlins, M.E. Fraser, and S.M. Miller, “Rovibrational Excitation of Nitric Oxide in the Reaction of O2 with Metastable Atomic Nitrogen,” J. Phys. Chem. 93, 1097 (1989).
9. C.B. Ludwig, W. Malkmus, J.E. Reardon, and J.A.L. Thompson, “Standard Infrared
Radiation Model (SIRRM), Volume 1: Development and Validation,” U.S. Air Force Rocket Propulsion Laboratory, AFRPL-TR-81-54, Edwards Air Force Base, California, August 1981.