identifying optimization opportunities within kernel ... · pdf filewe demonstrate the...
TRANSCRIPT

Identifying Optimization OpportunitiesWithin Kernel Execution in GPU Codes
Robert Lim(B), Allen Malony, Boyana Norris, and Nick Chaimov
Performance Research Laboratory, High-Performance Computing Laboratory,University of Oregon, Eugene, OR, USA
{roblim1,malony,norris,nchaimov}@cs.uoregon.eduhttp://tau.uoregon.edu
Abstract. Tuning codes for GPGPU architectures is challenging becausefew performance tools can pinpoint the exact causes of execution bottle-necks. While profiling applications can reveal execution behavior with aparticular architecture, the abundance of collected information can alsooverwhelm the user. Moreover, performance counters provide cumulativevalues but does not attribute events to code regions, which makes identify-ing performance hot spots difficult. This research focuses on characterizingthe behavior of GPU application kernels and its performance at the nodelevel by providing a visualization and metrics display that indicates thebehavior of the application with respect to the underlying architecture.We demonstrate the effectiveness of our techniques with LAMMPS andLULESH application case studies on a variety of GPU architectures. Bysampling instruction mixes for kernel execution runs, we reveal a varietyof intrinsic program characteristics relating to computation, memory andcontrol flow.
1 Introduction
Scientific computing has been accelerated in part due to heterogeneous archi-tectures, such as GPUs and integrated manycore devices. Parallelizing appli-cations for heterogeneous architectures can lead to potential speedups, basedon dense processor cores, large memories and improved power efficiency. Theincreasing use of such GPU-accelerated systems has motivated researchers todevelop new techniques to analyze the performance of these systems. Character-izing the behavior of kernels executed on the GPU hardware can provide feed-back for further code enhancements and support informed decisions for compileroptimizations.
Tuning a workload for a particular architecture requires in-depth knowl-edge of the characteristics of the application [19]. Workload characterization forgeneral-purpose architectures usually entails profiling benchmarks with hard-ware performance counters and deriving performance metrics such as instruc-tions per cycle, cache miss rates, and branch misprediction rates. This approachis limited because hardware constraints such as memory sizes and multiproces-sor cores are not accounted for and can strongly impact the workload charac-terization. Moreover, the current profiling methods provide an overview of thec© Springer International Publishing Switzerland 2015S. Hunold et al. (Eds.): Euro-Par 2015 Workshops, LNCS 9523, pp. 185–196, 2015.DOI: 10.1007/978-3-319-27308-2 16

186 R. Lim et al.
behaviors of the application in a summarized manner without exposing sufficientlow-level details.
Performance tools that monitor GPU kernel execution are complicated by thelimited hardware support of fine-grained kernel measurement and the asynchro-nous concurrency that exists between the CPU and GPU. With so many GPUsavailable, identifying which applications will run best on which architectures isnot straightforward. Applications that run on GPU accelerators are treated likea black box, where measurements can only be read at the start and stop pointsof kernel launches. Moreover, the difficulty of tracking and distinguishing whichtasks are associated with the CPU versus the GPU makes debugging heteroge-neous parallel applications a very complicated task. Thus, analyzing static anddynamic instruction mixes can help identify potential performance bottlenecksin heterogeneous architectures.
1.1 Motivation
Heterogeneous computing presents many challenges in managing the diversearchitectures, high-speed networks, interfaces, operating systems, communica-tion protocols and programming environments. For GPUs, more computationalunits exist over memory, and PCI bus transfers are limited in latency and capac-ity (fixed GB/sec). Thus, applications that provide parallelism opportunitieswill benefit most on GPUs. Algorithms with efficient partitioning or mappingstrategies are needed to exploit heterogeneity, while syntax directives such asOpenMP and OpenACC facilitate in program productivity. Tools need to beable to measure the individual heterogeneous components to assess the applica-tion’s performance behavior.
Performance measurements for GPUs are typically collected using the eventqueue method [14], where an event is injected into the stream immediately beforeand after the computation kernel. Performance frameworks such as TAU, PAPI,Intel VTune and NVIDIA nvprof provide this capability [1–3,17], where regionsof code are annotated with start/stop calls surrounding kernel execution.
Hardware performance counters are often used to monitor application per-formance, where measurements can be collected through either instrumentationor sampling. Drawbacks of using hardware performance counters include over-counts of results, lack of support across architecture vendors, incompatibilitiesof events and counters, limited number of hardware counters, and inability topinpoint transient behavior in program runs [13,18].
In Fig. 1, we show a time series of hardware counters sampled in the GPU, acapability we’ve added in TAU, and kernels that were executed for the LULESHapplication. The plot reveals spikes in the hardware samples for the application.However, one cannot correlate those spikes to the dense regions of activities insource code. If timestamps were used to merge GPU events with CPU events forpurposes of performance tracing, the times will need to be synchronized betweenhost and device [5], as the GPU device has a different internal clock frequencythan the host. Using timestamps to merge profiles may not be sufficient, or evencorrect. Thus, optimizing and tuning the code would require a best guess effort

Identifying Optimization Opportunities Within Kernel Execution 187
Fig. 1. Sampled hardware counters of instructions executed and active cycles (left) andindividual kernel executions (right), both for LULESH (Color figure online).
of where to begin. This motivates our exploration of the use of instruction typemixes in aiding the analysis of potential performance bottlenecks.
1.2 Contributions
In our work, we perform static analysis on CUDA binaries to map source textregions and generate instruction mixes based on the CUDA binaries. We defineinstruction mix as the types of operation codes in GPU programming [12]. Thisfeature is integrated with TAU to sample region runs on the GPU. We alsoprovide visualization and analysis to identify GPU hotspots and optimizationopportunities. This helps the user better understand the application’s runtimebehavior. In addition, we repeatedly sample instructions as the application exe-cutes. To the knowledge of the authors, this work is the first attempt at gaininginsight on the behavior of kernel applications on GPUs in real time. With ourmethodology, we can also identify whether an application is compute-bound,memory-bound, or relatively balanced.
2 Background
The TAU Parallel Performance Framework [17] provides scalable profile andtrace measurement and analysis for high-performance parallel applications. TAUprovides tools for source instrumentation, compiler instrumentation, and librarywrapping that allows CPU events to be observed. TAU also offers parallel profil-ing for GPU-based heterogeneous programs, by providing library wrappings ofthe CUDA runtime/driver API and preloading of the wrapped library prior toexecution. Each call made to a runtime or driver routine is intercepted by TAUfor measurement before and after calling the actual CUDA routine.
TAU CUPTI Measurements. TAU collects performance events for CUDAGPU codes asynchronously by tracing an application’s CPU and GPU activity[14]. An activity record is created, which logs CPU and GPU activities. Eachevent kind (e.g. CUpti ActivityMemcpy) represents a particular activity.

188 R. Lim et al.
Fig. 2. Overview of our proposed methodology.
CUDA Performance Tool Interface (CUPTI) provides two APIs, the CallbackAPI and the Event API, which enables the creation of profiling and tracing toolsthat target CUDA applications. The CUPTI Callback API registers a callbackin TAU and is invoked whenever an application being profiled calls a CUDAruntime or driver function, or when certain events occur in the CUDA driver.CUPTI fills activity buffers with activity records as corresponding activitiesoccur on the CPU and GPU. The CUPTI Event API allows the tool to query,configure, start, stop, and read the event counters on a CUDA enabled device.
3 Methodology
Our approach to enabling new types of insight into the performance characteris-tics of GPU kernels includes both static and dynamic measurement and analysis.
3.1 Static Analysis
Each CUDA code is compiled with CUDA 7.0 v.7.0.17, and the “-g -lineinfo”flags, which enables tracking of source code location activity within TAU. Eachof the generated code from nvcc is fed into cuobjdump and nvdisasm to staticallyanalyze the code for instruction mixes and source line information. The generatedcode is then monitored with TAU, which collects performance measurements anddynamically analyzes the code variants.
Binary Utilities. CUDA binaries are disassembled with the binary utilitiesprovided by the NVIDIA SDK. A CUDA binary (cubin) file is an ELF-formattedfile, or executable and linkable format, which is a common standard file formatfor representing executables, object code, shared libraries and core dumps. Bydefault, the CUDA compiler driver nvcc embeds cubin files into the host exe-cutable file.
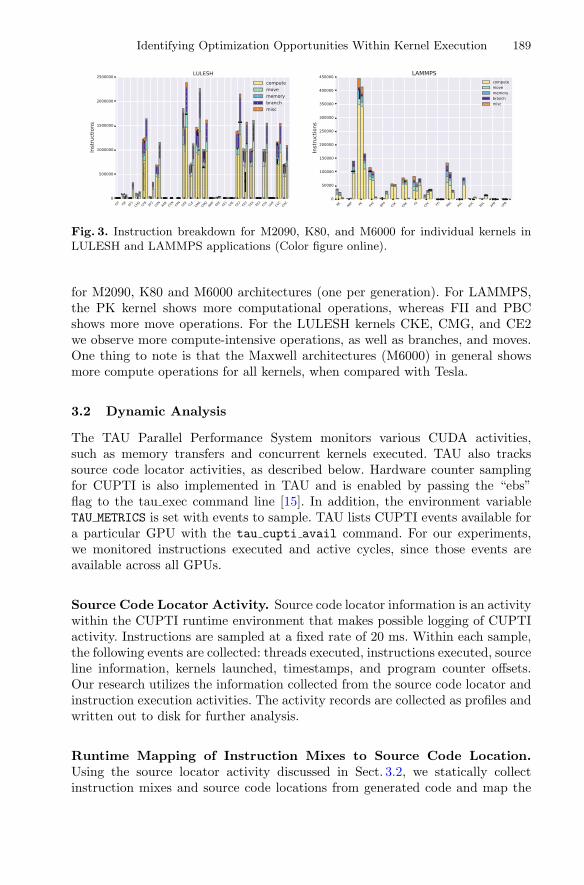
Instruction Breakdown. We start the analysis by categorizing the executedinstructions from the disassembled binary output. Figure 3 displays the instruc-tion breakdown for individual kernels in LULESH and LAMMPS applications
Identifying Optimization Opportunities Within Kernel Execution 189
Fig. 3. Instruction breakdown for M2090, K80, and M6000 for individual kernels inLULESH and LAMMPS applications (Color figure online).
for M2090, K80 and M6000 architectures (one per generation). For LAMMPS,the PK kernel shows more computational operations, whereas FII and PBCshows more move operations. For the LULESH kernels CKE, CMG, and CE2we observe more compute-intensive operations, as well as branches, and moves.One thing to note is that the Maxwell architectures (M6000) in general showsmore compute operations for all kernels, when compared with Tesla.
3.2 Dynamic Analysis
The TAU Parallel Performance System monitors various CUDA activities,such as memory transfers and concurrent kernels executed. TAU also trackssource code locator activities, as described below. Hardware counter samplingfor CUPTI is also implemented in TAU and is enabled by passing the “ebs”flag to the tau exec command line [15]. In addition, the environment variableTAU METRICS is set with events to sample. TAU lists CUPTI events available fora particular GPU with the tau cupti avail command. For our experiments,we monitored instructions executed and active cycles, since those events areavailable across all GPUs.
Source Code Locator Activity. Source code locator information is an activitywithin the CUPTI runtime environment that makes possible logging of CUPTIactivity. Instructions are sampled at a fixed rate of 20 ms. Within each sample,the following events are collected: threads executed, instructions executed, sourceline information, kernels launched, timestamps, and program counter offsets.Our research utilizes the information collected from the source code locator andinstruction execution activities. The activity records are collected as profiles andwritten out to disk for further analysis.
Runtime Mapping of Instruction Mixes to Source Code Location.Using the source locator activity discussed in Sect. 3.2, we statically collectinstruction mixes and source code locations from generated code and map the

190 R. Lim et al.
instruction mixes to the source locator activity as the program is being run.The static analysis of CUDA binaries produce an objdump file, which providesassembly information, including instruction operations, program counter offsets,and line information. We attribute the static analysis from the objdump file tothe profiles collected from the source code activity to provide runtime charac-terization of the GPU as it is being executed on the architecture. This mappingof static and dynamic profiles provides a rich understanding of the behavior ofthe kernel application with respect to the underlying architecture.
3.3 Instruction Operation Metrics
We define several instruction operation metrics derived from our methodology asfollows. These are examples of metrics that can be used to relate the instructionmix of a kernel with a potential performance bottleneck. Let opj represent thedifferent types of operations as listed in [12], timeexec equal the time durationfor one kernel execution (ms), and callsn represent the number of unique kernellaunches for that particular kernel.
Efficiency metric describes flops per second, or how well the floating pointunits are effectively utilized:
efficiency =opfp + opint + opsimd + opconv
timeexec· callsn (1)
Impact metric describes the performance contribution (operations executed)for a particular kernel j with respect to the overall application:
impact =
∑j∈J opj
∑i∈I
∑j∈J opi,j
· callsn (2)
Individual metrics for computational intensity, memory intensity and controlintensity can be calculated as follows:
FLOPS =opfp + opint + opsimd + opconv∑
j∈J opj· callsn (3)
MemOPS =opldst + optex + opsurf∑
j∈J opj· callsn (4)
CtrlOPS =opctrl + opmove + oppred∑
j∈J opj· callsn (5)
4 Analysis
4.1 Applications
LAMMPS. The Large-scale Atomic/Molecular Massively Parallel Simula-tor [16] is a molecular dynamics application that integrates Newton’s equa-tions of motion for collections of atoms, molecules, and macroscopic particles.
Identifying Optimization Opportunities Within Kernel Execution 191
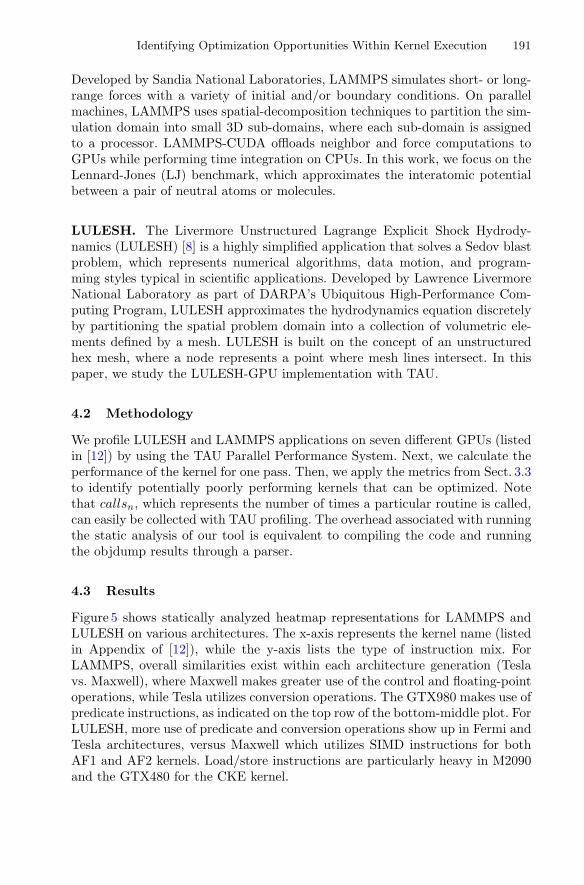
Developed by Sandia National Laboratories, LAMMPS simulates short- or long-range forces with a variety of initial and/or boundary conditions. On parallelmachines, LAMMPS uses spatial-decomposition techniques to partition the sim-ulation domain into small 3D sub-domains, where each sub-domain is assignedto a processor. LAMMPS-CUDA offloads neighbor and force computations toGPUs while performing time integration on CPUs. In this work, we focus on theLennard-Jones (LJ) benchmark, which approximates the interatomic potentialbetween a pair of neutral atoms or molecules.
LULESH. The Livermore Unstructured Lagrange Explicit Shock Hydrody-namics (LULESH) [8] is a highly simplified application that solves a Sedov blastproblem, which represents numerical algorithms, data motion, and program-ming styles typical in scientific applications. Developed by Lawrence LivermoreNational Laboratory as part of DARPA’s Ubiquitous High-Performance Com-puting Program, LULESH approximates the hydrodynamics equation discretelyby partitioning the spatial problem domain into a collection of volumetric ele-ments defined by a mesh. LULESH is built on the concept of an unstructuredhex mesh, where a node represents a point where mesh lines intersect. In thispaper, we study the LULESH-GPU implementation with TAU.
4.2 Methodology
We profile LULESH and LAMMPS applications on seven different GPUs (listedin [12]) by using the TAU Parallel Performance System. Next, we calculate theperformance of the kernel for one pass. Then, we apply the metrics from Sect. 3.3to identify potentially poorly performing kernels that can be optimized. Notethat callsn, which represents the number of times a particular routine is called,can easily be collected with TAU profiling. The overhead associated with runningthe static analysis of our tool is equivalent to compiling the code and runningthe objdump results through a parser.
4.3 Results
Figure 5 shows statically analyzed heatmap representations for LAMMPS andLULESH on various architectures. The x-axis represents the kernel name (listedin Appendix of [12]), while the y-axis lists the type of instruction mix. ForLAMMPS, overall similarities exist within each architecture generation (Teslavs. Maxwell), where Maxwell makes greater use of the control and floating-pointoperations, while Tesla utilizes conversion operations. The GTX980 makes use ofpredicate instructions, as indicated on the top row of the bottom-middle plot. ForLULESH, more use of predicate and conversion operations show up in Fermi andTesla architectures, versus Maxwell which utilizes SIMD instructions for bothAF1 and AF2 kernels. Load/store instructions are particularly heavy in M2090and the GTX480 for the CKE kernel.

192 R. Lim et al.
Fig. 4. Metrics for individual kernel execution in LULESH and LAMMPS applications(Color figure online).
Figure 4 displays normalized metrics for FLOPS, control operations andmemory operations for the top five poor performing kernels, determined bythe impact metric (Eq. 2, Fig. 6b). Generally speaking, ideal kernel performanceoccurs in balanced FLOPS and memory operations, and low branch operations.FLOPS and branches were higher in general for LULESH on the Maxwell archi-tectures, when compared to Tesla. The M2090 architecture showed higher mem-ory operations for the CKE kernel and for all LAMMPS kernels. The M2090 hasa smaller global memory compared to Tesla (5 GB vs 11.5 GB), and a smallerL2 cache compared to Maxwell (0.8 MB vs. 3.1 MB), which explains its poormemory performance.
Figure 6a compares divergent branches over total instructions in GPU codesusing hardware counters and instruction mix sampling for the top twelve kernelsin LULESH, calculated with the CtrlOPS metric. The kernels that are closestto the y-axis represent divergent paths that weren’t detected with hardwarecounters (about 33 %), which further affirms the counter’s inconsistencies inproviding accurate measurements. Our methodology was able to precisely detectdivergent branches for kernels that exhibited that behavior.
Figure 7 shows the correlation of computation intensity with memory inten-sity (normalized) for all seven architectures for the LAMMPS application. Forstatic input size independent analysis (left), differences in code generated aredisplayed for different architectures. However, the figure in the right shows theinstruction mixes for runtime data and reflects that there isn’t much of a dif-ference in terms of performance across architectures. The differences betweendynamic and static results are primarily due to the lack of control flow infor-mation in the static analysis, which will be added in future. While this additionwill likely improve the match between the static and dynamic instruction counts,there will always be some discrepancies because not all dynamic behavior canbe inferred from the static code for most codes. Nevertheless, by using our sta-tic analysis tool, we were able to identify four of the top five time-consumingkernels based only on instruction mix data. The static instruction mixes providequalitatively comparable information, which can be used to guide optimizations.

Identifying Optimization Opportunities Within Kernel Execution 193
Fig. 5. Heatmap for micro operations for LULESH and LAMMPS benchmarks onvarious GPU architectures (Color figure online).
Fig. 6. Two approaches to measuring divergent branches in LULESH: instruction mixsampling, and hardware counters. Kernel impact on overall application in LAMMPS.

194 R. Lim et al.
Fig. 7. Static (left) and dynamic (right) analyses for various architectures showingperformance of individual kernels in LAMMPS (Color figure online).
5 Related Work
There have been attempts to assess the kernel-level performance of GPUs. How-ever, not much has been done to provide an in-depth analysis of activities thatoccur inside the GPU.
Distributed with CUDA SDK releases, NVIDIA’s Visual Profiler (NVP) [2]has a suite of performance monitoring tools that focuses on CUDA codes. NVPtraces the execution of each GPU task, recording method name, start and endtimes, launch parameters, and GPU hardware counter values, among other infor-mation. NVP also makes use of the source code locator activity by displayingsource code alongside PTX assembly code. However, NVP doesn’t quantify theuse of instruction mixes which differs from our work.
G-HPCToolkit [4] characterizes kernel behavior by looking at idleness analy-sis via blame-shifting and stall analysis for performance degradation. In thiswork, the authors quantify CPU code regions that execute when a GPU is idle,or GPU tasks that execute when a CPU thread is idle, and accumulate blameto the executing task proportional to the idling task. Vampir [11] also does per-formance measurements for GPUs. They look at the trace execution at the startand stop times and provide a detailed execution of timing of kernel execution,but do not provide activities that behave inside the kernel. The authors [9] havecharacterized PTX kernels by creating an internal representation of a programand running it on an emulator, which determines the memory, control flow andparallelism of the application. This work closely resembles ours, but differs inthat we perform workload characterization on actual hardware during execution.
Other attempts at modeling performance execution on GPUs can be seen in[7] and [10]. These analytical models provide a tractable solution to calculateGPU performance when given input sizes and hardware constraints. Our workis complementary to those efforts, in that we identify performance execution ofkernels using instruction mixes.
Identifying Optimization Opportunities Within Kernel Execution 195
6 Conclusion and Future Work
Monitoring performance on accelerators is difficult because of the lack of visi-bility in GPU execution and the asynchronous behavior between the CPU andGPU. Sampling instruction mixes in real time can help characterize the appli-cation behavior with respect to the underlying architecture, as well as identifythe best tuning parameters for kernel execution.
In this research, we provide insight on activities that occur as the kernelexecutes on the GPU. In particular, we characterize the performance of executionat the kernel level based on sampled instruction mixes. In future work, we wantto address the divergent branch problem, a known performance bottleneck onaccelerators, by building control flow graphs that model execution behavior. Inaddition, we plan to use the sampled instruction mixes to predict performanceparameters and execution time for the Orio code generation framework [6]. Thegoal is to substantially reduce the number of empirical tests for kernels, whichwill result in rapid identification of best performance tuning configurations.
Acknowledgements. We would like to thank Duncan Poole and J-C Vasnier ofNVIDIA for providing early access to CUDA 7.0 and to the PSG Clusters. We alsowant to thank the anonymous reviewers in providing constructive feedback. This workis supported by the Department of Energy (Award #DE-SC0005360) for the project“Vancouver 2: Improving Programmability of Contemporary Heterogeneous Architec-tures.”
References
1. Intel VTune Amplifier. https://software.intel.com/en-us/intel-vtune-amplifier-xe2. NVIDIA Visual Profiler. https://developer.nvidia.com/nvidia-visual-profiler3. Browne, S., Dongarra, J., Garner, N., Ho, G., Mucci, P.: A portable programming
interface for performance evaluation on modern processors. Int. J. High Perform.Comput. Appl. 14, 189–204 (2000)
4. Chabbi, M., Murthy, K., Fagan, M., Mellor-Crummey, J.: Effective sampling-drivenperformance tools for GPU-accelerated supercomputers. In: International Confer-ence for High Performance Computing, Networking, Storage and Analysis (SC).IEEE (2013)
5. Dietrich, R., Ilsche, T., Juckeland, G.: Non-intrusive performance analysis of par-allel hardware accelerated applications on hybrid architectures. In: First Interna-tional Workshop on Parallel Software Tools and Tool Infrastructures (PSTI). IEEEComputer Society (2010)
6. Hartono, A., Norris, B., Sadayappan, P.: Annotation-based empirical performancetuning using Orio. In: International Symposium on Parallel & Distributed Process-ing (IPDPS). IEEE (2009)
7. Hong, S., Kim, H.: An analytical model for a GPU architecture with memory-leveland thread-level parallelism awareness. In: ACM SIGARCH Computer Architec-ture News. ACM (2009)
8. Karlin, I., Bhatele, A., Chamberlain, B., Cohen, J., Devito, Z., Gokhale, M., et al.,R.H.: Lulesh programming model and performance ports overview. In: Technicalreport, Lawrence Livermore National Laboratory (LLNL) Technical Report (2012)

196 R. Lim et al.
9. Kerr, A., Andrew, G., Yalamanchili, S.: A characterization and analysis of PTXkernels. In: International Symposium on Workload Characterization (IISWC).IEEE (2009)
10. Kim, H., Vuduc, R., Baghsorkhi, S., Choi, J., Hwu, W.: Performance Analysisand Tuning for General Purpose Graphics Processing Units (GPGPU). Morgan &Claypool Publishers (2012)
11. Knpfer, A., Brunst, H., Doleschal, J., Jurenz, M., Lieber, M., Mickler, H., Mller,M., Nagel, W.: The VAMPIR performance analysis tool-set. In: Resch, M., Keller,R., Himmler, V., Krammer, B., Schulz, A. (eds.) Tools for High Performance Com-puting. Springer, Heidelberg (2008)
12. Lim, R.: Identifying optimization opportunities within kernel launches in GPUarchitectures, Technical report. University of Oregon, CIS Department (2015)
13. Lim, R., Carrillo-Cisneros, D., Alkowaileet, W., Scherson, I.: Computationally effi-cient multiplexing of events on hardware counters. In: Linux Symposium (2014)
14. Malony, A., Biersdorff, S., Shende, S., Jagode, H., Tomov, S., Juckeland, G., Diet-rich, R., Poole, D., Lamb, C.: Parallel performance measurement of heteroge-neous parallel systems with GPUs. In: IEEE International Conference on ParallelProcessing (ICPP) (2011)
15. Morris, A., Malony, A., Shende, S., Huck, K.: Design and implementation of ahybrid parallel performance measurement system. In: International Conference onParallel Processing (ICPP) (2010)
16. Plimpton, S.: Fast parallel algorithms for short-range molecular dynamics. J. Com-put. Phys. 117(1), 1–19 (1995)
17. Shende, S., Malony, A.: The TAU parallel performance system. Int. J. High Per-form. Comput. Appl. 20(2), 287–311 (2006)
18. Weaver, V., Terpstra, D., Moore, S.: Non-determinism and overcount on modernhardware performance counter implementations. In: International Symposium onPerformance Analysis of Systems and Software (ISPASS). IEEE (2013)
19. Shao, Y., Brooks, D.: ISA-independent workload characterization and its implica-tions for specialized architectures. In: IEEE International Symposium PerformanceAnalysis of Systems and Software (ISPASS) (2013)