ie2010-298 manuscript
TRANSCRIPT
1
IE2010-298 1
Combining coagulation, softening and flocculation to dispose reverse osmosis 2
retentates 3
4
Ruth Ordóñez, Ana Moral1, Daphne Hermosilla, Ángeles Blanco* 5
6
Department of Chemical Engineering, Complutense University of Madrid, Avda. 7
Complutense, s/n, 28040 Madrid (Spain). E-mail addresses (in order of appearance): 8
[email protected], [email protected], [email protected] 9
10
1Present address: Department of Molecular Biology and Biochemical Engineering, 11
Pablo de Olavide University, Carretera de Utrera, km 1, 41013 Sevilla (Spain). E-mail 12
address: [email protected] 13
14
*To whom correspondence should be addressed: 15
Tel.: +34 91 394 4247. Fax: +34 91 394 4243. E-mail: [email protected] 16
17

2
ABSTRACT 1
The concentrated stream of a reverse osmosis unit was treated by coagulation, 2
softening and flocculation to reduce conductivity and refractory organic matter 3
content. Different polyaluminium chlorides and one ferric salt were used as 4
coagulants, lime was added as softener, and two polymers (anionic and cationic 5
polyacrylamides) were tested as flocculants. Coagulants reduced significantly 6
the presence of refractory compounds by themselves, although conductivity 7
increased. Lime addition decreased conductivity forming precipitates of CaCO3 8
and Mg(OH)2. When coagulation was combined with flocculation without 9
adding lime, the anionic flocculant was more effective than the cationic one 10
because the specific high hardness of water supplied enough Ca2+ and Mg2+ to 11
promote the formation of bigger flocs, bridging the slightly negative coagula 12
and anionic groups of the polymer; although they also reduced the efficiency of 13
the cationic polyacrylamide. None of the tested flocculants showed any effect 14
on conductivity and refractory organic matter reduction when lime was added. 15
16
Keywords: reverse osmosis retentate; coagulation; flocculation; softening; 17
refractory organic matter. 18
19

3
1. Introduction 1
Recovered paper industry is one of the most sustainable industries worldwide. Beyond 2
re-using paper to produce recycled paper, this sector is also working hard to reduce fresh 3
water consumption recycling its own effluent [1,2]. The closure of the water circuits 4
depends on the type of paper product and process [3]. While water circuits are mostly 5
closed for brown grades, which production does not require the high quality of water 6
imposed by pulp bleaching processes; a total closure is difficult to achieve for white 7
ones without the application of advanced treatments. 8
Pressure-driven membrane processes, i.e. microfiltration (MF), ultrafiltration 9
(UF), nanofiltration (NF) and reverse osmosis (RO), are taking advantage as polishing 10
stages to reclaim industrial effluent aiming to return it back into the process. Two 11
interconnected factors are however the main drawbacks for their implementation: (i) the 12
risk of membrane fouling [4], which may require extensive water pretreatment or 13
intensive chemical cleaning of the membranes, shortening its lifetime and increasing the 14
maintenance cost; and (ii) the need for further treatment of the concentrated fraction. 15
Although forcing NF and RO membranes to work at very high recoveries to yield the 16
minimal retentate current would be highly recommended, this would cause a lot of 17
trouble in terms of fighting against fouling and treating concentrates. 18
There are mainly two options for a further treatment of rejected streams: (1) 19
water removal from the concentrate; and (2) removal of specific components by a 20
selective treatment. In both cases, water can be reused again into the process, or 21
discharged (directly or indirectly via sewage systems) whenever water quality 22
parameters fulfil the requirements established by the corresponding environmental 23
authority [5-7]. Discharge into the sewer system can adversely affect subsequent 24
biological sewage treatment, as microbial growth may be limited by the inhibitory effect 25
4
of high salinity, or by the refractory character and biotoxicity of typical organic 1
constituents of membrane retentate [8,9]. 2
Water removal from concentrated streams comprises zero liquid discharge (ZLD) 3
systems [10], like thermal evaporators [11,12] or crystallizers [13]. These systems drive 4
the recovery to approach the 100% and, if they are combined with a high recovery 5
brackish-water RO system, they can produce permeate with only 10 mg/L of total 6
dissolved solids (TDS). However, the cost of these thermal systems is typically much 7
higher than the cost for implementing a desalination membrane facility, both considered 8
in economic and energetic (operative) terms. Therefore, this option for the treatment of 9
retentated streams is only feasible for very small flows of concentrates [14]. 10
The selective treatment of specific components of rejected streams may be 11
achieved by the application and combination of different available technologies (e.g. 12
advanced oxidation, ionic exchange, chemical precipitation or activated carbon 13
adsorption). Particularly, much of the research conducted on the management of 14
concentrates has been reported within the dying industry sector because their effluents 15
are highly loaded with organic compounds and mineral salts. For example, Balanoski et 16
al. [15] reported the degradation by the Fenton reaction of dyeing NF membrane 17
concentrates from biologically treated secondary effluent. A reduction in total organic 18
carbon (TOC) of around 50% was achieved, and the optical absorbance was reduced 19
between 20-50% after 3 hours of Fenton treatment. In the same line, van Hege et al. [16] 20
applied electrochemical oxidation for the treatment of recalcitrant organic constituents 21
and ammonia nitrogen contained in RO retentate produced in the textile industry, 22
achieving the following removal efficiencies: >80% of the colour, 50% of the 23
absorbance at 254 nm, 25% of the chemical oxygen demand (COD) and 10% of the total 24
ammonia nitrogen. 25
5
On the other hand, Allegre et al. [17] proposed a coagulation-flocculation-1
decantation train to treat these concentrated streams, paying special attention to the 2
selection of chemicals because the settling velocity and supernatant absorbances were 3
very sensible to the added products. Finally, Dyalinas et al. [18] compared the efficiency 4
of coagulation and activated carbon adsorption with three different advanced oxidation 5
processes (electrochemical treatment, photocatalysis and sonolysis) as alternative 6
treatments to the rejected stream coming from a RO system placed after a membrane 7
biological reactor (MBR), located in a municipal wastewater treatment plant (Chania, 8
Western Crete, Greece). The best results were achieved by activated carbon adsorption, 9
which was able to reach a 91.3% reduction of the dissolved organic carbon (DOC). All 10
the three advanced oxidation methods showed similar results, removing 36%, 34% and 11
50% of the DOC, respectively. Coagulation with FeCl3 removed 52% of the DOC. 12
Therefore, since the efficiency of the treatment depends on each specific case, nowadays 13
there is not a universal solution to treat these retentates. 14
The main scope of the present study is the assessment of coagulation, combined 15
with flocculation and lime softening, as an alternative for the treatment of RO 16
concentrates characterized by a high content of refractory organic matter (>2000 mg/L 17
of COD) and a high conductivity (>9 mS/cm). Although previous studies have reported 18
the evolution of particles size distribution when treating synthetic water by each one of 19
these processes separately [19-21], the combination of these three processes in the 20
treatment of a real wastewater has not been reported to date. In addition to the removal 21
of COD and conductivity, the efficiency of this combined system, where different 22
mechanisms can interact together, will be assessed in terms of the achieved reductions of 23
absorbance at different wave lengths, which are related to the nature of the refractory 24
compounds that are affected by the treatment [22,23]. 25
6
1
2. Experimental 2
The following nomenclature has been adopted in order to avoid misunderstandings when 3
reading the manuscript: (1) coagulation is the destabilization phenomenon of dissolved 4
and colloidal matter (DCM) produced by the addition of coagulation products 5
(coagulants); (2) coagula are the little aggregates (>1 µm) formed after coagulation; (3) 6
flocculation refers to the aggregation phenomenon of coagula to form bigger particles by 7
both the effect of shear stress or the addition of flocculation agents (flocculants); (4) 8
flocs are the big particles resulting from this aggregation. 9
10
2.1. Characterization of the reverse osmosis retentate 11
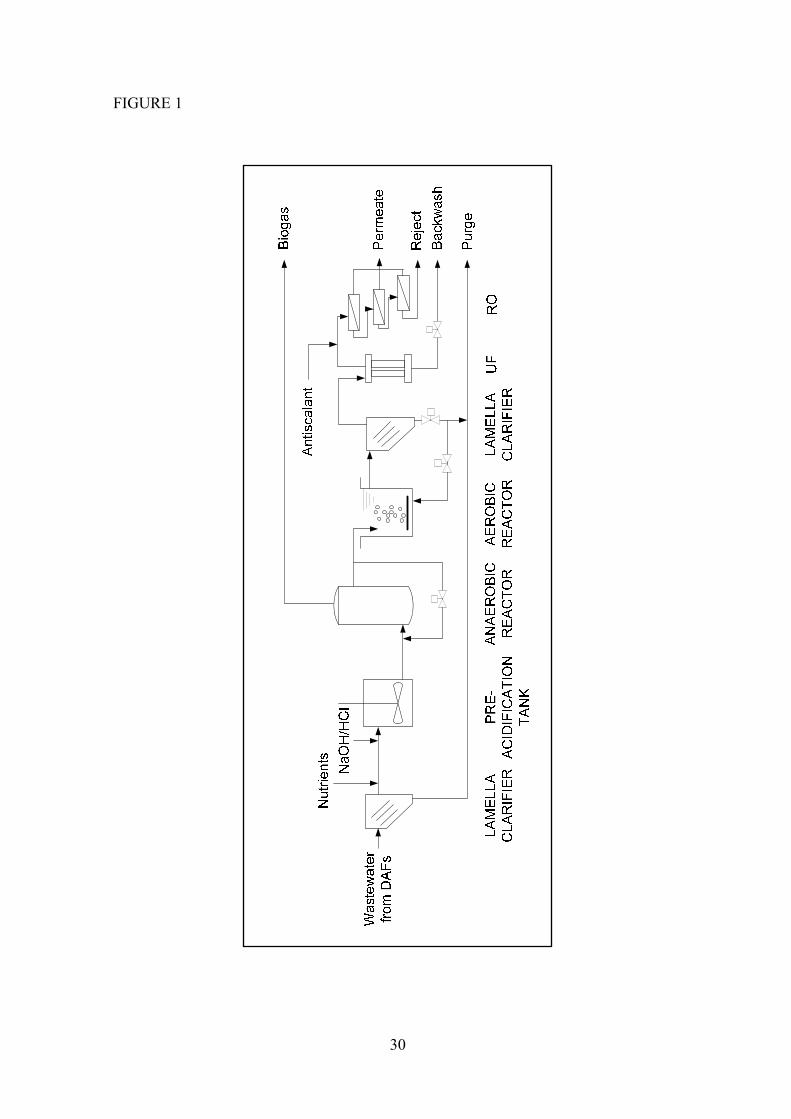
The RO retentate to be treated was sampled at a pilot plant placed inside a 100% 12
recovered-paper mill located in Madrid (Spain). The objective of these pilot trials was to 13
evaluate the feasibility of reclaiming the current paper mill effluent to up-grade its water 14
quality allowing its reuse within the process, and thus reduce fresh water consumption. 15
The pilot plant (Figure 1) treated water flowing out from a dissolved air flotation unit 16
(DAF) placed in the first water loop of the deinking plant, which is the most 17
contaminated water in the mill. 18
The pilot plant consisted of an initial biological double step (anaerobic + aerobic) 19
in which an important part of the organic material was removed (> 80% dissolved COD 20
and 90% BOD5). Most of the remaining dissolved COD (dCOD) present in the treated 21
wastewater after the biological stages can be considered non-biodegradable; thus it will 22
be referred as refractory COD (rCOD) hereafter. The refractory organic load of 23
wastewater from recovered-paper mills includes high and low molecular weight organic 24

7
compounds, natural and synthetic polymers, adhesives, coating binders, ink residues, 1
deinking chemicals and wood derivatives [24]. 2
A pressurized UF unit, running in dead-end mode with hollow fibre membranes, 3
was fed with the biologically treated water. UF-filtrated water finally entered the RO 4
plant, which was configured in 1 pass and 3 steps, obtaining a retentate with the quality 5
shown in Table 1. Its main characteristics were the high levels of non-biodegradable 6
matter content (dCOD = 2121 mg/L), conductivity (9.1 mS/cm) and buffer capacity 7
(3224 mgCaCO3/L). 8
All water analyses were performed according to the Standard Methods for 9
Examination of Water and Wastewater [25]. 10
11
2.2. Focused Beam Reflectance Measurement equipment 12
Flocculation studies were performed with a M500L focused beam reflectance 13
measurement (FBRM) probe manufactured by Lasentec, Mettler Toledo, Seattle, WA. 14
The FBRM instrument operates by scanning a highly focused laser beam at a fixed speed 15
(2000 rpm) across particles in suspension, measuring the time duration of the 16
backscattered light from these particles. The temporal duration of the reflection from 17
each particle multiplied by the velocity of the scanning laser results in a characteristic 18
measurement of the particle geometry, namely chord length. Thousands of chord length 19
measurements are collected per second, producing a histogram in which the number of 20
observed counts is sorted in several chord length bins over the range 0.5 to 1000, or 21
2000 μm [26]. All the experiments with the FBRM device were programmed to obtain a 22
chord length distribution every 5 seconds. In this way, enough particles are detected to 23
have a good representative distribution of the size population. 24
25
8
2.3. Coagulation 1
Seven different coagulants were tested: one ferric salt (FeCl3), five polyaluminium 2
chlorides (PACl1, PACl2, PACl3, PACl4, PACl5), supplied by Kemira Ibérica S.A 3
(Spain), and a polyaluminium nitrate sulphate salt (PNSS), supplied by Sachtleben 4
Chemie GmbH (Germany). All of them were supplied pure, as a liquid suspension, and 5
were diluted to the desired concentration with tap water the same day they were used. 6
Their properties are shown in Table 2 and Table 3, respectively. 7
PACl1, PACl2 and PNSS have the lowest basicity values (42, 43 and 45%, 8
respectively). The grade of basicity is related to the quantity of Al-polymeric species 9
formed in the water during coagulation, and it is calculated by equation 1, where [OH-] 10
and [AlT] are the amounts of base and aluminium, respectively, present in the chemical 11
formulation of the coagulant [27]. 12
][
][·
3
1·100(%)
TAl
OHBasicity (1) 13
To determine the optimum dosage of each coagulant, 0.15L of RO retentate was 14
stirred during one minute at 200 rpm before starting to add 600 mg of coagulant per litre 15
of water each 10 seconds. The maximum number of counts yielded after adding the 16
coagulant determined the optimum value of coagulant dosage. 17
Coagula resistance was evaluated by monitoring the evolution of the number of 18
counts versus the applied stirring intensity. The optimal dosage of coagulant was added 19
to the water sample and stirred at 200 rpm for 4 minutes. The stirring speed was then 20
increased up to 400 rpm for 4 additional minutes; and a final 4-minute step was run at 21
600 rpm. This experiment allowed to simulate the shear stress that coagulated water 22
could suffer when it is pumped. 23
After finishing the coagulation trials, the water sample was allowed to settle and 24
9
clear water was sampled and filtered by 0.45 µm before measuring conductivity, dCOD 1
and absorbances at 254, 284, 310, 350 and 500 nm. Conductivity was measured with a 2
GLP3 conductivity meter from Crison (Barcelona, Spain), and dCOD and absorbances 3
were determined with an UV-Visible Spectrometer (Aquamate AQA091801 Model from 4
Thermo Fisher Scientific, Waltham, MA, USA). The absorbance at 254 nm has been 5
related to the degree of aromaticity and unsaturation of the compounds present in water 6
[22]; while absorbances at 284, 310, 350 and 500 nm reflect the amount of: aromatic 7
compounds (i.e. phenols), restrained conjugated aromatic rings, conjugated aromatic 8
rings with certain level of resonance, and colored substances presenting a high level of 9
resonance, respectively [23]. 10
11
2.4. Softening 12
Lime was added to soften the solution because conductivity increased after using 13
coagulants alone. The lime-softening step began two minutes after the addition of the 14
coagulant, stirring at 200 rpm. As a consequence of lime addition, pH increases and 15
calcium and magnesium are removed from water as precipitates of CaCO3 (pH>9.5) and 16
Mg(OH)2 (pH>10.0), respectively [28], reducing water hardness [29]. The addition of 17
lime was therefore studied at pH values of 9.5 and 10.5. Lime was prepared as a 18
supersaturated solution of Ca(OH)2 from Panreac Química S.A.U., Spain. 19
20
2.5. Flocculation 21
Finally, the use of flocculants was included in the treatment train [30,31]. Water was 22
flocculated with organic polymers two minutes after lime addition. Two flocculants were 23
evaluated, a 60%-charged medium molecular weight (MMW) cationic polymer (cPAM), 24
and a 15%-charged MMW anionic flocculant (aPAM). Both products were supplied by 25
10
Nalco Company (Spain) in powder form, and they were prepared at a concentration of 1
0.5 g/L by dilution of the corresponding powder in tap water, stirring the solution at 400 2
rpm during 1h. The chemicals were prepared the same day they were used. 3
After the coagulation-softening-flocculation treatment, water was led to settle for 4
30 minutes and the supernatant was filtered through 0.45 µm before measuring 5
conductivity, dCOD and absorbances at 254 (A254), 284 (A284), 310 (A310), 350 (A350) 6
and 500 (A500) nm. 7
8
2.6. Experimental design 9
A faced centered-central composite experimental design with one central point was run 10
to assess the influence of the independent variables controlling the studied process at lab 11
scale, namely coagulant and flocculant dosages (Xcoag and Xfloc), and pH (XpH), together 12
with their interaction. The removal percentages of rCOD, conductivity and absorbances 13
(A254, A284, A310, A350 and A500) were considered as dependent variables; and 14
experimental results are fitted to a second-order polynomial model. The total number of 15
experiments required to perform the designed experimental protocol is 15, considering 16
three levels for every independent variable, namely: XpH = without lime (8.0), 9.5 and 17
10.5, according to hardness removal by CaCO3 and Mg(OH)2 precipitation, respectively; 18
Xcoag = 2000, 2500 and 3000 mg/L; and Xfloc = 3, 5 and 7 mg/L. 19
The type and doses of coagulant were chosen according to the results of 20
preliminary coagulation trials run to test several products (see section 3.1), as described 21
previously (see section 2.3); and considering a reasonable treatment cost (personal 22
communication from paper mill managers). Ahmad et al. [31] tested 1-6 mg/L doses of 23
PAMs to improve PACl coagulation treatment of pulp and paper mill wastewater, 24
reporting no effect on COD removal. As only a 10% of the COD is associated to TSS in 25
11
the RO retentate, in contrast to the 90% in the wastewater treated in Ahmad et al. [31], 1
we have initially selected cost-reasonable higher values for the flocculant dosage to be 2
introduced in the experimental design. 3
The levels of the independent variables were normalized according to equation 2, 4
adopting values from -1 to +1 (centre = 0). 5
minmax
·2XX
XXX n
(2) 6
Where Xn is the normalized value of Xcoag, XpH or Xfloc; X is the absolute 7
experimental value of the variable concerned; X is the mean between the extreme 8
values of X; and Xmax and Xmin are the maximum and minimum values for X, respectively. 9
This normalization also results in more accurate estimates of the regression coefficients, 10
as it reduces inter-relationships between linear and quadratic terms [32]. 11
12
3. Results and Discussion 13
3.1. Coagulation trials 14
The total number of counts per second registered by the FBRM probe versus the added 15
quantity of coagulant determines the optimal dosage of each one (Figure 2). Only FeCl3, 16
PACl1, PACl2 and PNSS produced any significant effect on the treated wastewater. As 17
a greater amount of these coagulants were added, DCM destabilized and began to 18
aggregate, resulting in an increase of the number of counts. The other PACl’s 19
destabilized DCM, but their effect was comparatively minimal. FeCl3 began to coagulate 20
quicker than PACl1 and PACl2; and all of them achieved, for the same dosage, a higher 21
number of counts per second than PNSS (Figure 2). A similar behaviour was previously 22
observed by Kim et al. [33]. While FeCl3 required just 5 min to complete the full 23
coagulation treatment, PACl products took 15 min to achieve the same results. 24
12
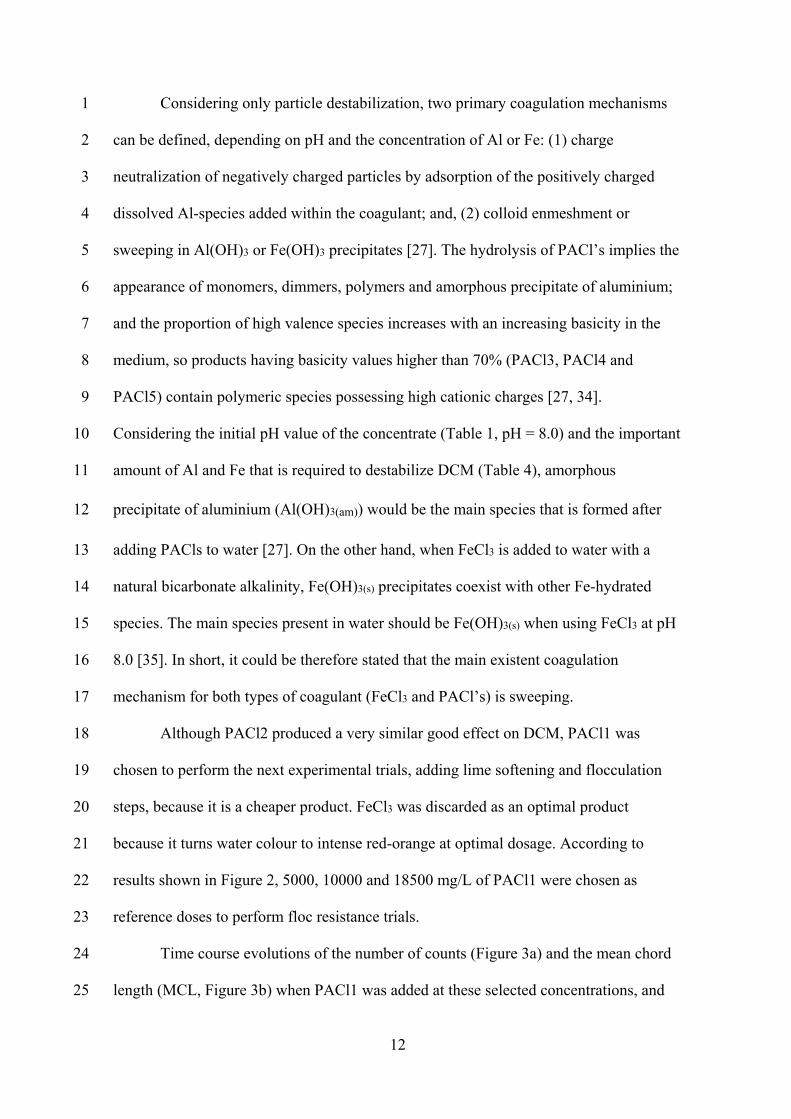
Considering only particle destabilization, two primary coagulation mechanisms 1
can be defined, depending on pH and the concentration of Al or Fe: (1) charge 2
neutralization of negatively charged particles by adsorption of the positively charged 3
dissolved Al-species added within the coagulant; and, (2) colloid enmeshment or 4
sweeping in Al(OH)3 or Fe(OH)3 precipitates [27]. The hydrolysis of PACl’s implies the 5
appearance of monomers, dimmers, polymers and amorphous precipitate of aluminium; 6
and the proportion of high valence species increases with an increasing basicity in the 7
medium, so products having basicity values higher than 70% (PACl3, PACl4 and 8
PACl5) contain polymeric species possessing high cationic charges [27, 34]. 9
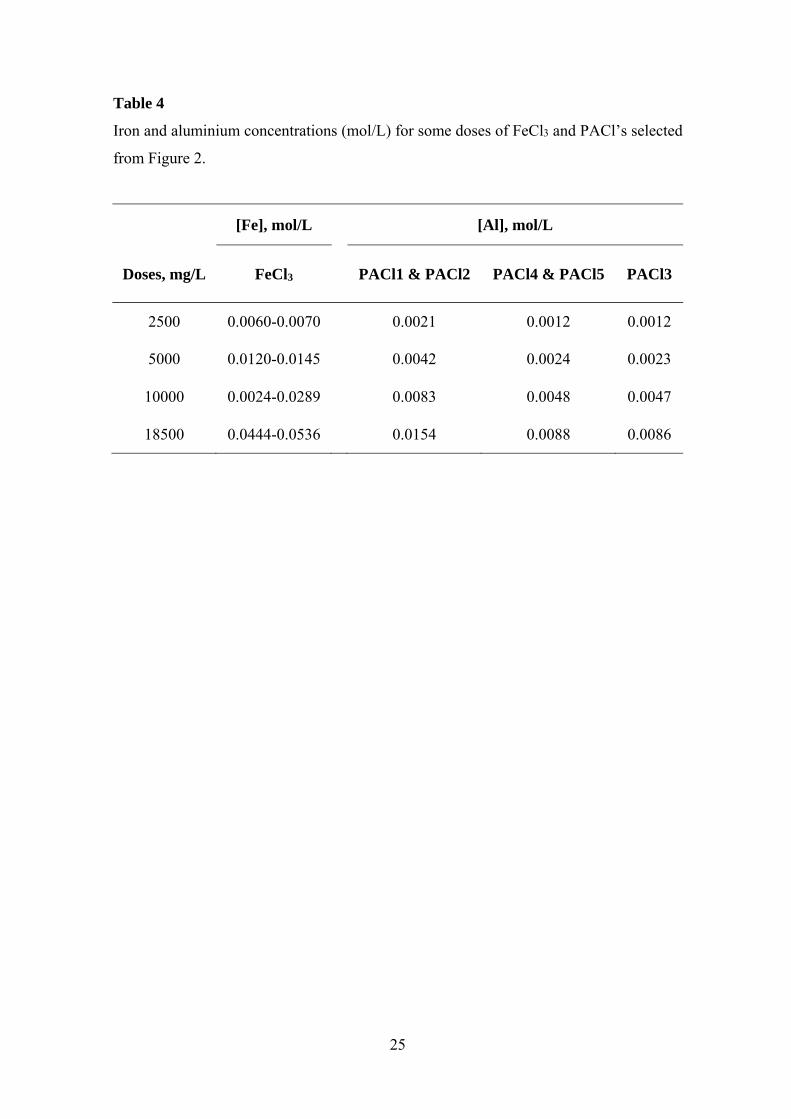
Considering the initial pH value of the concentrate (Table 1, pH = 8.0) and the important 10
amount of Al and Fe that is required to destabilize DCM (Table 4), amorphous 11
precipitate of aluminium (Al(OH)3(am)) would be the main species that is formed after 12
adding PACls to water [27]. On the other hand, when FeCl3 is added to water with a 13
natural bicarbonate alkalinity, Fe(OH)3(s) precipitates coexist with other Fe-hydrated 14
species. The main species present in water should be Fe(OH)3(s) when using FeCl3 at pH 15
8.0 [35]. In short, it could be therefore stated that the main existent coagulation 16
mechanism for both types of coagulant (FeCl3 and PACl’s) is sweeping. 17
Although PACl2 produced a very similar good effect on DCM, PACl1 was 18
chosen to perform the next experimental trials, adding lime softening and flocculation 19
steps, because it is a cheaper product. FeCl3 was discarded as an optimal product 20
because it turns water colour to intense red-orange at optimal dosage. According to 21
results shown in Figure 2, 5000, 10000 and 18500 mg/L of PACl1 were chosen as 22
reference doses to perform floc resistance trials. 23
Time course evolutions of the number of counts (Figure 3a) and the mean chord 24
length (MCL, Figure 3b) when PACl1 was added at these selected concentrations, and 25

13
the water sample was stirred at increasing speeds (200, 400 and 600 rpm), showed that, 1
while the number of counts per second increased during the first minute, the size of the 2
particles decreased. Although big particles (20-25 µm) attached each other forming 3
bigger flocs as the coagulant was added, DCM of <1 m was also destabilized, and 4
small particles got in touch forming small coagula greater than 1 µm. As these particles 5
are now detected by FBRM, the proportion of small particles led to an overall decrease 6
in the MCL distribution (Figure 3b). In addition, the number of counts per second was 7
higher as the coagulant dosage was increased from 5000 mg/L to 10000 mg/L; but 8
significantly decreased when 18500 mg/L were added. The water solution got saturated 9
of coagulant when such an amount was used, having a negative effect on the treatment 10
efficiency [36]. The number of counts was particularly high when 10000 mg/L of PACl1 11
were used. 12
After increasing the stirring velocity from 200 to 400 and 600 rpm when PACl1 13
was added at 5000 and 10000 mg/L, fewer particles were detected by FBRM, but MCL 14
kept more or less constant compared to the values achieved after adding the coagulant at 15
400 rpm. Finally, when 18500 mg/L were added, the number of FBRM-detected 16
particles did not decrease up to reaching 600 rpm; and MCL kept a similar performance 17
as for 5000 and 10000 mg/L (Figure 3b). 18
This behaviour may be explained by the fact that a higher stirring speed yields a 19
higher number of particle-particle collisions, reducing the number of small particles as 20
they attach each other after colliding. This phenomenon was reflected by FBRM by a 21
reduction of the number of counts per second when speeding up from 200 to 400 rpm 22
(Figure 3a). On the other hand, this phenomenon also decreases the rate of formation of 23
very large flocs as they break up after been collided. Therefore, rather than provoking 24
big particles to break, increasing the stirring speed favored particle-particle collisions, 25

14
and its further attachment forming bigger particles, at lower doses of coagulant (i.e. 5000 1
mg/L), resulting in the observed increase of MCL at 600 rpm (Figure 3b). At higher 2
coagulant doses, large particles formation was still prevailing over big particles 3
breakage, as fewer particles are detected in the water sample (Figure 3a); while MCL 4
decreased slowly as the stirring velocity was increased (Figure 3b). Although there were 5
fewer particles in the water, big flocs broke up into smaller particles (but bigger than 6
1µm) that are bigger than the aggregates formed by small particles, which collision was 7
enhanced by faster stirring rates. 8
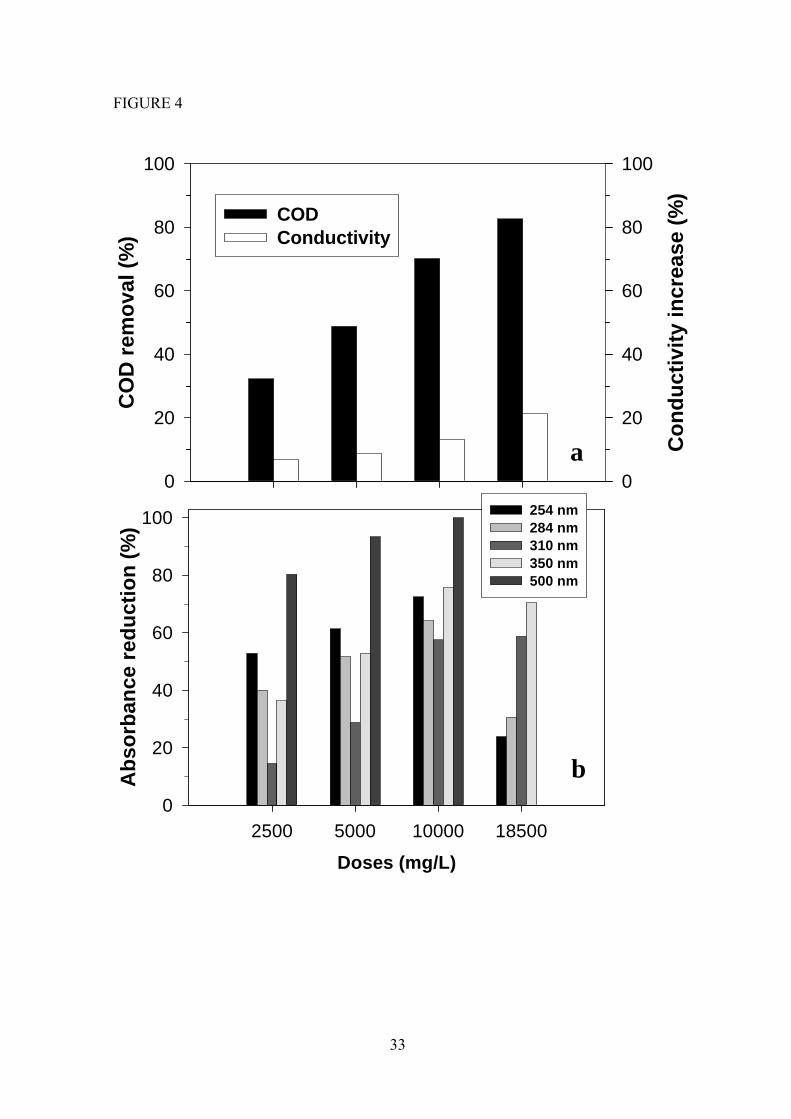
A higher coagulant dosage produced a higher reduction in rCOD, reaching ≈80% 9
when 18500 mg/L were added; but it increased conductivity as well (Figure 4a), as more 10
Al is added to the medium. The mechanisms to remove this kind of organic compounds 11
are similar to DCM ones [36]: (1) binding metal species to anionic sites neutralizing 12
charges; and (2) adsorption on amorphous metal hydroxide precipitate. Although many 13
studies have reported flocculation experiences, it is however very difficult to distinguish 14
between both mechanisms, which depend mainly on pH and coagulant concentration 15
[37]. 16
On the other hand, better absorbance removals at all the measured wavelengths 17
were achieved when 10000 mg/L of PACl1 were added, while lower reductions were 18
yielded at lower and higher dosages (Figure 4b); denoting a selective removal of 19
refractory organic matter. Particularly, coloured compounds with a high level of 20
resonance (A500) were not removed at all when 18500 mg/L of coagulant were used. Yan 21
et al. [38] detected a similar trend for A254, which is related to the presence of 22
hydrophobic and high molecular weight natural organic matter, such as humic 23
substances. 24
25

15
3.2. Coagulation, softening and flocculation. Treatment modelling from experimental 1
design 2
The final aim of the experimental design was to study the influence of the three 3
independent variables (Xcoag, Xfloc., XpH) controlling the combined treatment process in 4
terms of conductivity and recalcitrant organic matter content in water. 2500 mg/L of 5
PACl1 were set as the reference level (Xn=0) of the experimental design as it produced a 6
significant treatment effect (COD removal >30%; conductivity increase >5%) at a 7
reasonable industrial cost. In fact, lime was added to soften the solution; while a 8
flocculation step was thought to reduce the quantity of coagulant to be added. Two 9
experimental designs, one per each tested flocculant (aPAM and cPAM), were 10
performed. Results in terms of the achieved reductions of dCOD, conductivity and 11
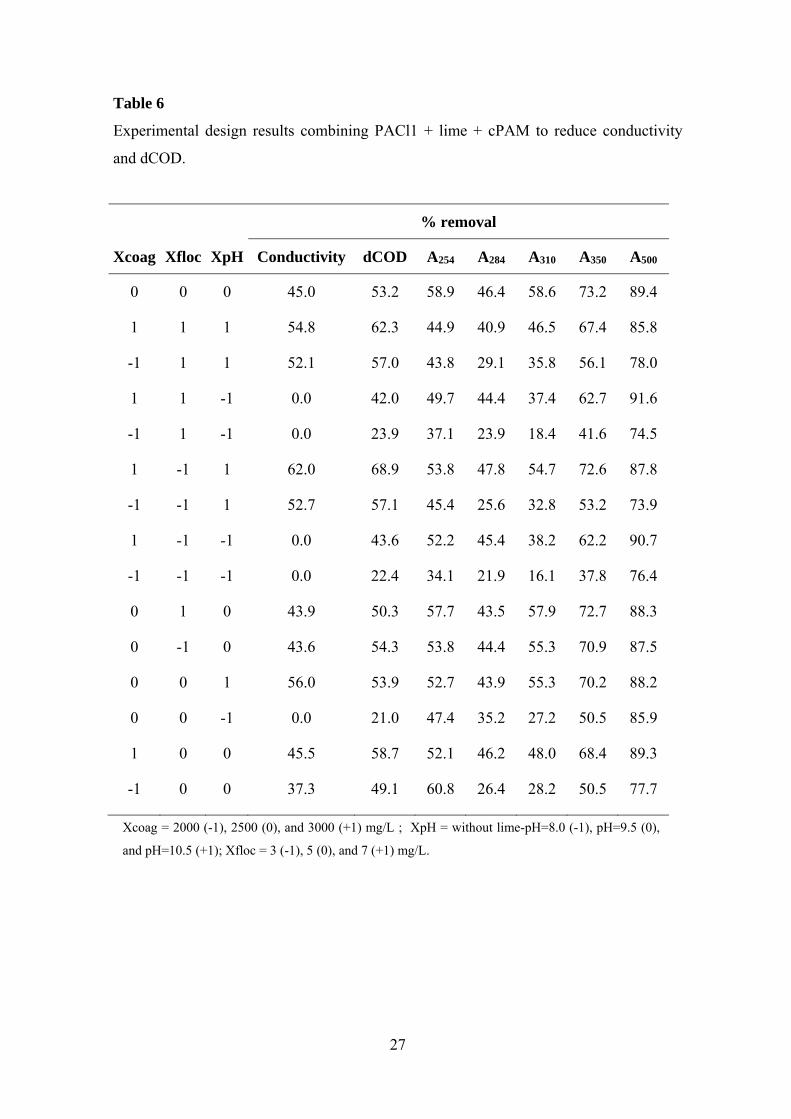
absorbances are shown in Table 5 (aPAM) and Table 6 (cPAM). 12
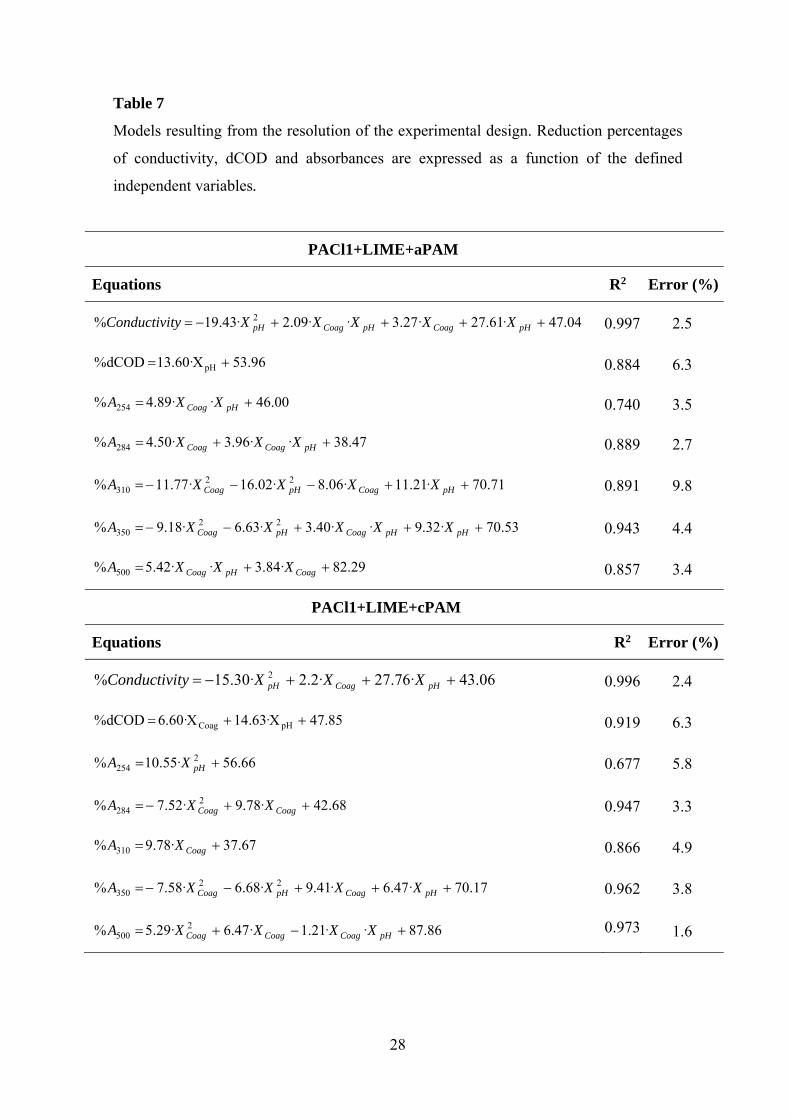
Second-order polynomial models fitted from experimental results for every 13
considered dependant variable (removal percentages of dCOD, conductivity and 14
absorbances) as a function of the defined independent ones (Xcoag, XpH, Xfloc) show that 15
only Xcoag and XpH are explaining the results of the defined treatment; that is, the 16
variation of both variables and the interaction between them ( pHcoag XX · ) are really 17
determining the reductions of dCOD, conductivity and absorbances (Table 7). Despite 18
the regressions for the removal of A254, which showed poorer R2 values (0.740 for 19
aPAM; and 0.677 for cPAM), the variation of the results was explained over the 85% for 20
all the second-order polynomial equations (R2=0.857-0.997). The estimations provided 21
by these modelled equations reproduced the experimental values with errors lower than 22
10% and 6.5% when adding aPAM and cPAM, respectively. 23
Particularly, the addition of lime (XpH) was the main factor affecting the 24
reduction of conductivity for both flocculants (Table 7). As a greater amount of lime is 25

16
added, Mg(OH)2 precipitates (pH ≥ 10) in addition to CaCO3 (pH ≥ 9.5), thus more Ca2+ 1
and Mg2+ ions are removed from the water, decreasing conductivity. Softening also 2
affected very positively the reduction of A350 for both flocculants, A310 for the aPAM, 3
and A254, A350, and A500 for the cPAM. On the other hand, PAM dosage (Xfloc) did not 4
produce any significant variation in the properties of the treated wastewater. 5
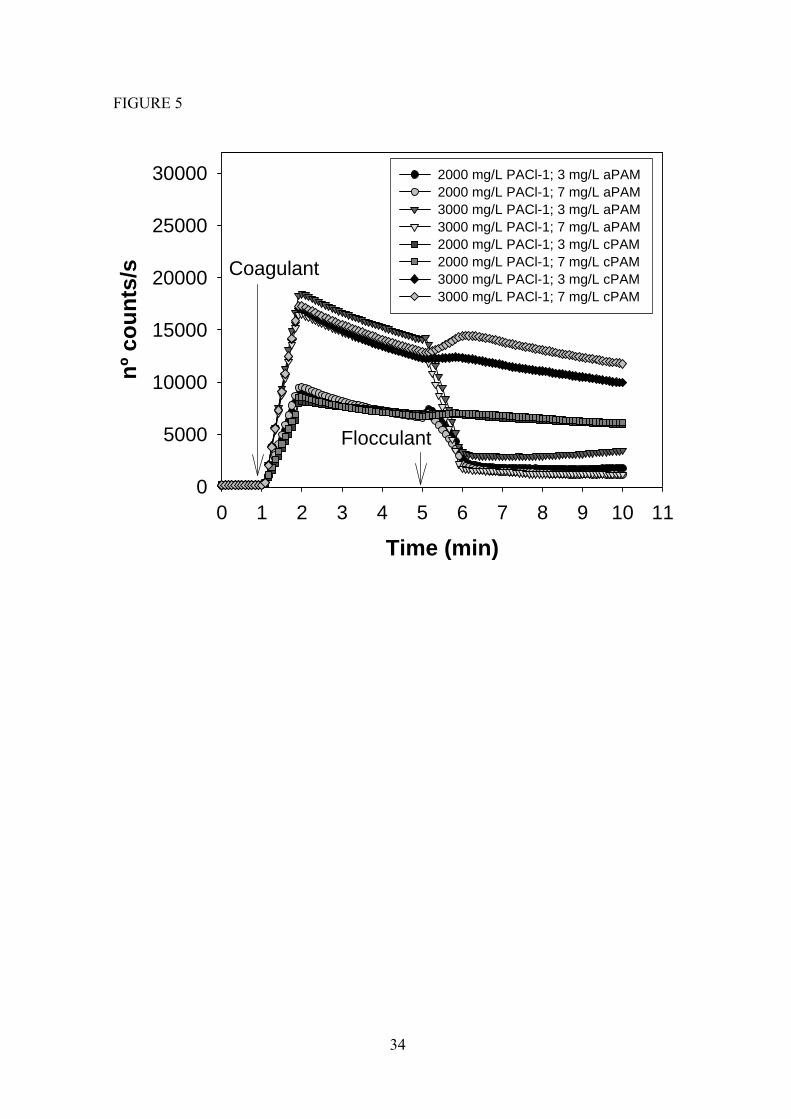
When flocculant was added without lime, the FBRM probe detected significant 6
differences in the number of counts from when a previous soften step is performed 7
(Figures 5 and 6). While the number of particles decreased as aPAM was added; no 8
effect was observed in the distribution of particles when cPAM was used (Figure 5). 9
Two possible mechanisms may explain this performance: (1) aggregates formed by 10
PACl1 and lime have a slightly positive surface charge, so cPAM would repeal them 11
[39]; and (2) negatively-charged surfaces may be adsorbed on aPAM despite 12
electrostatic repulsion whenever there is enough concentration of divalent metal ions in 13
the solution [40]. 14
Due to the pH value of the concentrated stream (8.0), and the amount of 15
coagulant added, it is more reasonable to think that the surface of the aggregates formed 16
from PACl1 and lime are slightly negatively charged; so the second explanation maybe 17
most suitable to what it is really happening. As hardness of the retentate was really high 18
(1100 mgCaCO3/L; Table 1), important amounts of Ca2+ and Mg2+ should be present, 19
enhancing flocculation processes bridging anionic groups of the aPAM to negative sites 20
on the surface of particles. On the other hand, these cations would interfere with the 21
positively charged groups of the cPAM, repealing each other, and making the polymer 22
lose its extended structure. Therefore, the efficiency of this polymer is limited [39]. 23
When lime was added, more particles were detected in the solution (Figure 6), as 24
CaCO3 and Mg(OH)2 precipitates are formed. When a constant number of particles was 25
17
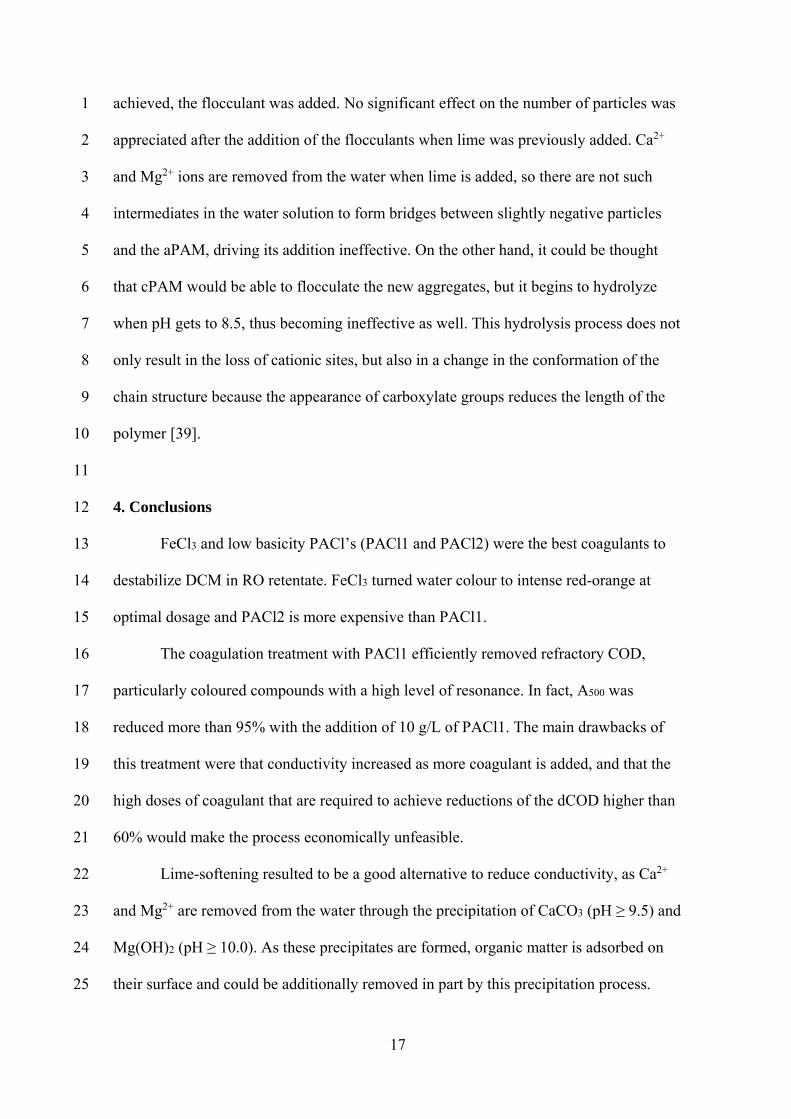
achieved, the flocculant was added. No significant effect on the number of particles was 1
appreciated after the addition of the flocculants when lime was previously added. Ca2+ 2
and Mg2+ ions are removed from the water when lime is added, so there are not such 3
intermediates in the water solution to form bridges between slightly negative particles 4
and the aPAM, driving its addition ineffective. On the other hand, it could be thought 5
that cPAM would be able to flocculate the new aggregates, but it begins to hydrolyze 6
when pH gets to 8.5, thus becoming ineffective as well. This hydrolysis process does not 7
only result in the loss of cationic sites, but also in a change in the conformation of the 8
chain structure because the appearance of carboxylate groups reduces the length of the 9
polymer [39]. 10
11
4. Conclusions 12
FeCl3 and low basicity PACl’s (PACl1 and PACl2) were the best coagulants to 13
destabilize DCM in RO retentate. FeCl3 turned water colour to intense red-orange at 14
optimal dosage and PACl2 is more expensive than PACl1. 15
The coagulation treatment with PACl1 efficiently removed refractory COD, 16
particularly coloured compounds with a high level of resonance. In fact, A500 was 17
reduced more than 95% with the addition of 10 g/L of PACl1. The main drawbacks of 18
this treatment were that conductivity increased as more coagulant is added, and that the 19
high doses of coagulant that are required to achieve reductions of the dCOD higher than 20
60% would make the process economically unfeasible. 21
Lime-softening resulted to be a good alternative to reduce conductivity, as Ca2+ 22
and Mg2+ are removed from the water through the precipitation of CaCO3 (pH ≥ 9.5) and 23
Mg(OH)2 (pH ≥ 10.0). As these precipitates are formed, organic matter is adsorbed on 24
their surface and could be additionally removed in part by this precipitation process. 25

18
Anionic PAM resulted to be the best option to aid coagulation with PACl1 when 1
no lime was added because Ca2+ and Mg2+ ions, which are present in the medium 2
yielding high water hardness, bridge slightly negative aggregates that PACl1 formed 3
previously. On the other hand, these cations affected cPAM performance driving its 4
addition inefficient when no lime was used. 5
When flocculants were combined with previous coagulation and lime-softening 6
steps, no additional effect was observed on the reduction of dCOD, conductivity and 7
absorbances at different wave lengths; which is explained by the efficient removal of 8
Ca2+ and Mg2+ from the solution, and the high pH value at which the treatment was 9
performed. 10
11
Acknowledgements 12
This research was developed in the framework of projects “PROLIPAPEL I and 13
II” (S-0505/AMB-0100; P-2009/AMB-1480), funded by the Regional Government of 14
Madrid (Comunidad Autónoma de Madrid), Spain; “AGUA Y ENERGÍA” (CTM2008-15
06886-C02-01), funded by the Ministry of Science and Innovation of Spain (Ministerio 16
de Ciencia e Innovación); and “AquaFit4Use” (211534), funded by the European Union. 17
We would like to thank HOLMEN Paper staff for technical advice and discussion of the 18
results; and Kemira Ibérica (Spain), Sachtleben Chemie GmbH (Germany) and Nalco 19
Company (Spain) for supplying the chemicals used in this study. 20
21
References 22
[1] A. Blanco, C. Negro, C. Monte, E. Fuente, J. Tijero, Environ. Sci. Technol. 38 23
(2004) 414A-420A. 24

19
[2] R. Ordóñez, D. Hermosilla, E. Fuente, A. Blanco, Ind. Eng. Chem. Res. 48 (2009) 1
10247-10252. 2
[3] Integrated Pollution Prevention and Control (IPPC): Reference Document on Best 3
Available Techniques in the Pulp and Paper Industry, European Commission, 4
Brussels, 2001. 5
[4] R.Y. Ning, T.L. Troyer, Desalination 208 (2007) 232-237. 6
[5] D. Squire, J. Murrer, P. Holden, C. Fitzpatrick, Desalination 108 (1996) 143-147. 7
[6] M. Mickley, Membrane Concentrate Disposal: Practices and Regulations, U.S. 8
Department of the Interior, Bureau of Reclamation, Technical Service Center, Water 9
Treatment Engineering and Research Group, 2004. 10
[7] S. Sethi, S. Walker, J. Drewes, P. Xu, Florida Water Res. J. June (2006) 38-48. 11
[8] D. Squire, Desalination 132 (2000) 47-54. 12
[9] M. Ahmed, W.H. Shayya, D. Hoey, J. Al-Handaly, Desalination 133 (2001) 135-13
147. 14
[10] R.Y Ning, T.L. Troyer, Desalination 237 (2009) 238-242. 15
[11] T. Nandy, P. Manekar, R. Dhodapkar, G. Pophali, S. Devotta, Resour. Conserv. 16
Recycl. 51 (2007) 64-77. 17
[12] K. Ranganathan, K. Karunagaran, D.C. Sharma, Resour. Conserv. Recycl. 50 (2007) 18
306-318. 19
[13] R. Rautenbach, T. Linn, Desalination 105 (1996) 63-70. 20
[14] L.F. Greenlee, D.F. Lawler, B.D. Freeman, B. Marrot, P. Moulin, Water Res. 43 21
(2009) 2317-2348. 22
[15] E. Balanosky, J. Fernández, J. Kiwi, A. López, Water Sci. Technol. 40 (1999) 417-23
424. 24
[16] K. van Hege, M. Verhaege, W. Verstraete, Electrochem. Comm. 4 (2002) 296-300. 25

20
[17] C. Allegre, M. Maisseu, F. Charbit, P. Moulin, J. Hazard. Mat. B116 (2004) 57-64. 1
[18] E. Dialynas, D. Mantzavinos, E. Diamadopoulos, Water Res. 42 (2008) 4603-4608. 2
[19] E. Barbot, S. Moustier, J.Y. Botterob, P. Moulin, J. Memb. Sci. 325 (2008) 520-527. 3
[20] W. Yu, L. Guibai, Y. Xu, X. Yang, Powder Technol. 189 (2009) 439-443. 4
[21] J.A. Nason, D.F. Lawler, J. Environ. Eng. 136 (2010) 12-21. 5
[22] M.F. Sevimli, C. Kinaci, Water Sci. Technol. 45 (2002) 279-286. 6
[23] M. Boroski, A.C. Rodrigues, J.C. Garcia, A.P. Gerola, J. Nozaki, N. Hioka, J. 7
Hazard. Mat. 160 (2008) 135-141. 8
[24] R. Miranda, A. Balea, E. Sanchez de la Blanca, I. Carrillo, A. Blanco, Ind. Eng. 9
Chem. Res. 47 (2008) 6239-6250. 10
[25] Standard Methods for the Examination of Water and Wastewater, 21st Edition, 11
APHA, AWWA and WEF, Washington DC, 2005. 12
[26] A. Blanco, E. Fuente, C. Negro, J. Tijero, Can. J. Chem. Eng. 80 (2002) 1-7. 13
[27] D.J. Pernitsky, J.K. Edzwald, J. Water Supply: Res. Technol. - AQUA 55 (2006) 14
121-141. 15
[28] M. Scholz, in: M.Scholz (Eds.), Wetland Systems to Control Urban Runoff, 1st 16
Edition, Elsevier, The Netherlands, 2006, pp. 135-139. 17
[29] E. Yildiz, A. Nuhoglu, B. Keskinlerb, A. Akay, B. Farizoglu, Desalination 159 18
(2003) 139-152. 19
[30] M.I. Aguilar, J. Sáez, M. Lloréns, A. Soler, J.F. Ortuño, V. Meseguer, A. Fuentes, 20
Chemosphere 58 (2005) 47-56. 21
[31] A.L. Ahmad, S.S. Wong, T.T. Teng, A. Zuhairi, Chem. Eng. J. 137 (2008) 510-517. 22
[32] D.C. Montgomery, Diseño y análisis de experimentos, Grupo Editorial 23
Iberoamericana, Mexico, 1991. 24
[33] S.-H. Kim, J.-S. Yoon, S. Lee, Desalination Water Treat. 10 (2009) 95-100. 25
21
[34] A. Torra, F. Valero, J.L. Bisbal, J.F. Tous, Tecnol. Agua 177 (1998) 58-67. 1
[35] C.J. Gabelich, T.I. Yuna, B.M. Coffey, I.H. Suffet, Desalination 150 (2002) 15-30. 2
[36] J. Duan, J. Gregory, Adv. Colloid Interface 100 (2003) 475-502. 3
[37] X.C. Wang, P.K. Jin, J. Gregory, Water Sci. Technol.: Water Supply 2 (2002) 99-4
106. 5
[38] M. Yan, D. Wang, J. Nia, J. Qu, C.W.C. Chow, H. Liu, Water Res. 42 (2008) 3361-6
3370. 7
[39] B. Bolto, J. Gregory, Water Res. 41 (2007) 2301-2324. 8
[40] C. Negro, L.M. Sánchez, E. Fuente, A. Blanco, J. Tijero, Chem. Eng. Sci. 61 (2006) 9
2522-2532. 10
11
12
13
14
15
16
17
18
19
20
21
22
23
24

22
Table 1
Chemical characterization of the retentated flow from the RO system.
PARAMETER UNITS RO
RETENTATE
pH - 8.0
Conductivity mS/cm 9.1
tCOD mg/L 2365
dCOD mg/L 2121
Alkalinity mg CaCO3/L 3224
Turbidity NTU 8.21
Hardness mg CaCO3/L 1100

23
Table 2
Chemical specifications of the ferric salt and polyaluminium chlorides coagulants.
Coagulant Concentration (w/w)
(%) Al2O3
(%) Basicity
(%) Other
FeCl3 39-47 - - -
PACl1 - 17.0 ± 0.5 42 ± 2 -
PACl2 - 17.0 ± 0.5 43 ± 5 High molecular weight
PACl3 - 9.5 ± 1.0 70 ± 5 Contains
micropolymers
PACl4 - 9.7 ± 0.3 85 ± 10 -
PACl5 - 9.7 ± 0.3 85 ± 10 Contains
micropolymers

24
Table 3
Properties of the polyaluminium nitrate sulphate salt (PNSS).
Composition (%) Contents (%)
Al NO3 SO4 Monomeric Oligomeric Polymeric pH Basicity
5.2 15 3 22 35 43 2.5 46
25
Table 4
Iron and aluminium concentrations (mol/L) for some doses of FeCl3 and PACl’s selected
from Figure 2.
[Fe], mol/L [Al], mol/L
Doses, mg/L FeCl3 PACl1 & PACl2 PACl4 & PACl5 PACl3
2500 0.0060-0.0070 0.0021 0.0012 0.0012
5000 0.0120-0.0145 0.0042 0.0024 0.0023
10000 0.0024-0.0289 0.0083 0.0048 0.0047
18500 0.0444-0.0536 0.0154 0.0088 0.0086

26
Table 5
Experimental design results combining PACl1 + lime + aPAM to reduce conductivity
and dCOD.
% removal
Xcoag Xfloc XpH Conductivity dCOD A254 A284 A310 A350 A500
0 0 0 48.1 60.4 43.8 37.6 65.8 68.7 79.4
1 1 1 59.8 70.3 51.1 44.8 44.5 66.6 89.2
-1 1 1 52.0 61.8 41.6 31.2 64.8 65.0 74.1
1 1 -1 0.0 34.8 41.2 41.3 15.6 41.6 84.8
-1 1 -1 0.0 40.0 47.4 38.2 41.7 48.4 84.7
1 -1 1 59.6 69.2 51.6 45.9 44.0 66.5 90.8
-1 -1 1 50.7 58.6 41.2 29.9 62.3 61.9 72.1
1 -1 -1 0.0 31.9 37.4 34.5 13.6 34.8 77.7
-1 -1 -1 0.0 38.5 50.4 39.7 42.7 49.0 87.4
0 1 0 48.0 61.6 47.3 40.8 66.4 70.2 80.9
0 -1 0 45.9 60.0 50.4 40.1 65.8 68.7 84.9
0 0 1 54.0 62.8 47.1 38.1 66.8 69.4 79.6
0 0 -1 0.0 41.5 49.6 40.3 56.7 62.4 88.4
1 0 0 54.6 65.2 51.6 46.1 72.6 67.1 87.3
-1 0 0 38.6 52.8 38.3 28.6 59.4 59.6 73.1
Xcoag = 2000 (-1), 2500 (0), and 3000 (+1) mg/L ; XpH = without lime-pH=8.0 (-1), pH=9.5 (0), and
pH=10.5 (+1); Xfloc = 3 (-1), 5 (0), and 7 (+1) mg/L.
27
Table 6
Experimental design results combining PACl1 + lime + cPAM to reduce conductivity
and dCOD.
% removal
Xcoag Xfloc XpH Conductivity dCOD A254 A284 A310 A350 A500
0 0 0 45.0 53.2 58.9 46.4 58.6 73.2 89.4
1 1 1 54.8 62.3 44.9 40.9 46.5 67.4 85.8
-1 1 1 52.1 57.0 43.8 29.1 35.8 56.1 78.0
1 1 -1 0.0 42.0 49.7 44.4 37.4 62.7 91.6
-1 1 -1 0.0 23.9 37.1 23.9 18.4 41.6 74.5
1 -1 1 62.0 68.9 53.8 47.8 54.7 72.6 87.8
-1 -1 1 52.7 57.1 45.4 25.6 32.8 53.2 73.9
1 -1 -1 0.0 43.6 52.2 45.4 38.2 62.2 90.7
-1 -1 -1 0.0 22.4 34.1 21.9 16.1 37.8 76.4
0 1 0 43.9 50.3 57.7 43.5 57.9 72.7 88.3
0 -1 0 43.6 54.3 53.8 44.4 55.3 70.9 87.5
0 0 1 56.0 53.9 52.7 43.9 55.3 70.2 88.2
0 0 -1 0.0 21.0 47.4 35.2 27.2 50.5 85.9
1 0 0 45.5 58.7 52.1 46.2 48.0 68.4 89.3
-1 0 0 37.3 49.1 60.8 26.4 28.2 50.5 77.7
Xcoag = 2000 (-1), 2500 (0), and 3000 (+1) mg/L ; XpH = without lime-pH=8.0 (-1), pH=9.5 (0),
and pH=10.5 (+1); Xfloc = 3 (-1), 5 (0), and 7 (+1) mg/L.
28
Table 7
Models resulting from the resolution of the experimental design. Reduction percentages
of conductivity, dCOD and absorbances are expressed as a function of the defined
independent variables.
PACl1+LIME+aPAM
Equations R2 Error (%)
04.47·61.27·27.3··09.2·43.19% 2 pHCoagpHCoagpH XXXXXtyConductivi 0.997 2.5
96.53X·60.13dCOD% pH 0.884 6.3
00.46··89.4% 254 pHCoag XXA 0.740 3.5
47.38··96.3·50.4% 284 pHCoagCoag XXXA 0.889 2.7
71.70·21.11·06.8·02.16·77.11% 22310 pHCoagpHCoag XXXXA
0.891 9.8
53.70·32.9··40.3·63.6·18.9% 22350 pHpHCoagpHCoag XXXXXA
0.943 4.4
29.82·84.3··42.5% 500 CoagpHCoag XXXA 0.857 3.4
PACl1+LIME+cPAM
Equations R2 Error (%)
06.43·76.27·2.2·30.15% 2 pHCoagpH XXXtyConductivi 0.996 2.4
85.47X·63.14X·60.6dCOD% pHCoag 0.919 6.3
66.56·55.10% 2254 pHXA
0.677 5.8
68.42·78.9·52.7% 2284 CoagCoag XXA
0.947 3.3
67.37·78.9% 310 CoagXA 0.866 4.9
17.70·47.6·41.9·68.6·58.7% 22350 pHCoagpHCoag XXXXA
0.962 3.8
86.87··21.1·47.6·29.5% 2500 pHCoagCoagCoag XXXXA
0.973 1.6
29
Figure 1. Diagram of the pilot plant used to reclaim the effluent of the paper mill.
Figure 2. Evolution of the number of counts versus coagulant dose.
Figure 3. Evolution in time of the number of counts per second (a), and mean chord
length (b) after adding different doses of PACl1.
Figure 4. Effect of PACl1 dosage on dCOD removal and conductivity increase (a), and
the reduction of the absorbance of refractory compounds (b).
Figure 5. Evolution in time of the number of counts per second when PACl1 (2000 and
3000 mg/L) and PAMs (anionic or cationic, 3 and 7 mg/L) are added without lime.
Figure 6. Evolution in time of the number of counts per second when 3000 mg/L PACl1
and PAMs (anionic or cationic, 3 and 7 mg/L) are added after the lime at pH = 10.5.
30
FIGURE 1

31
FIGURE 2
Dose (mg/L)
0 5000 10000 15000 20000 25000 30000
nº
cou
nts
/s
0
5000
10000
15000
20000
25000
30000
35000
FeCl3
PACl2PACl1
PACl5
PACl3PACl4
PNSS

32
FIGURE 3
n
º co
un
ts/s
0
5000
10000
15000
20000
25000
30000
35000
5000 mg/L
10000 mg/L
18500 mg/L
200 rpm 400 rpm 600 rpm
Time (min)
0 1 2 3 4 5 6 7 8 9 10 11
Mea
n c
ho
rd le
ng
th (m
)
0
5
10
15
20
25
30
5000 mg/L
10000 mg/L
18500 mg/L
200 rpm 400 rpm 600 rpm
b
a
33
FIGURE 4
CO
D r
emo
val (
%)
0
20
40
60
80
100
Co
nd
uct
ivit
y in
crea
se (
%)
0
20
40
60
80
100
CODConductivity
Doses (mg/L)
2500 5000 10000 18500
Ab
sorb
ance
red
uct
ion
(%
)
0
20
40
60
80
100 254 nm284 nm310 nm350 nm500 nm
b
a
34
FIGURE 5
Time (min)
0 1 2 3 4 5 6 7 8 9 10 11
nº
cou
nts
/s
0
5000
10000
15000
20000
25000
30000 2000 mg/L PACl-1; 3 mg/L aPAM2000 mg/L PACl-1; 7 mg/L aPAM3000 mg/L PACl-1; 3 mg/L aPAM3000 mg/L PACl-1; 7 mg/L aPAM2000 mg/L PACl-1; 3 mg/L cPAM 2000 mg/L PACl-1; 7 mg/L cPAM 3000 mg/L PACl-1; 3 mg/L cPAM 3000 mg/L PACl-1; 7 mg/L cPAM
Coagulant
Flocculant

35
FIGURE 6
Time (min)
0 1 2 3 4 5 6 7 8 9 10 11
nº
cou
nts
/s
0
5000
10000
15000
20000
25000
30000
3 mg/L aPAM 7 mg/L aPAM 3 mg/L cPAM 7 mg/L cPAM
Coagulant
Lime
Flocculant