ill i no s - connecting repositories · ill i no s university of illinois at urbana-champaign...
TRANSCRIPT

ILL I NO SUNIVERSITY OF ILLINOIS AT URBANA-CHAMPAIGN
PRODUCTION NOTE
University of Illinois atUrbana-Champaign Library
Large-scale Digitization Project, 2007.


UNIVERSITY OF ILLINOIS BULLETIN
ISSUED WEEKLY
Vol. XIII January 25, 1926 No. 21[Entered as second-class matter December 11, 1912, at the post office at Urbana, Illinois, under the
Act of August 24, 1912. Acceptance for mailing at the special rate of postage providedfor in section 1103, Act of October 3, 1917, authorized July 31, 1918.]
THE EFFECT OF TEMPERATURE ON THEREGISTRATION OF SINGLE PHASE
INDUCTION WATTHOUR METERS
3iY
ABNER R. KNIGHTAND
MAX A. FAUCETT
BULLETIN No. 153
ENGINEERING EXPERIMENT STATIONPUBLISHED AT THE UNIVERBITY OF ILLINOIS, URBANA
SPnCE: FIFTBEN CENTS

HE Engineering Experiment Station was established by
act of the Board of Trustees of the University of Illinois
on December 8, 1903. It is the purpose of the Station to
conduct investigations and make studies of importance to the
engineering, manufacturing, railway, mining, and other industrial
interests of the State.
The management of the Engineering Experiment Station is
vested in an Executive Staff composed of the Director and his
Assistant, the Heads of the several Departments in the College of
Engineering, and the Professor of Industrial Chemistry. This
Staff is responsible for the establishment of general policies govern-
ing the work of the Station, including the approval of material for
publication. All members of the teaching staff of the College are
encouraged to engage in scientific research, either directly or inco6peration with the Research Corps composed of full-time research
assistants, research graduate assistants, and special investigators.
To render the results of its scientific investigations available
to the public, the Engineering Experiment Station publishes and
distributes a series of bulletins. Occasionally it publishes circulars
of timely interest, presenting information of importance, compiled
from various sources which may not readily be accessible to the
clientele of the Station.
The volume and number at the top of the front cover page aremerely arbitrary numbers and refer to the general publications ofthe University. Either above the title or below the seal is given the
number of the Engineering Experiment Station bulletin or circular
which should be used in referring to these publications.For copies of bulletins or circulars or for other information
address
THE ENGINEERING EXPERIMENT STATION,
UNIVERSITY OF ILLINOIS,
URBANA, ILLINOIS

UNIVERSITY OF ILLINOIS
ENGINEERING EXPERIMENT STATION
JANUARY, 1926BULLETIN No. 153
THE EFFECT OF TEMPERATURE ON
THE REGISTRATION OF SINGLE PHASE
INDUCTION WATTHOUR METERS
BY
ABNER R. KNIGHT
ASSISTANt PROFESSOR OF ELECTRICAL ENGINEERING
AND
MAX A. FAUCETT
INSTRUCTOR IN ELECTRICAL ENGINEERING
ENGINEERING EXPERIMENT STATION
PUBLISHED AT THE UNIVERSITY OF ILLINOIS, URBANA


CONTENTS PAGE
I. INTRODUCTION . . . . . . . . . . . . . . 5
1. Purpose and Scope of Investigation . . . . . . 5
II. THEORY OF INDUCTION WATTHOUR METER . . . . . 5
2. Production of Driving Torque . . . . . . . 5
3. Relation between Driving Torque and Speed . . . 6
III. INHERENT VARIATIONS OF PRACTICAL METER FROM IDEAL
CONDITIONS . . . . . . . . . . . . . . . 7
4. Sources of Error . . . . . . . . . . . 7
5. Correction of Inherent Errors . . . . . . . 8
IV. DESCRIPTION OF APPARATUS . . . . . . . . . . 9
6. Description of Cabinet . . . . . . . . . . 9
7. Temperature Control . . . . . . . . . . 10
V. METHOD OF MAKING REGISTRATION TESTS . . . . . . 11
8. Method of Making Registration Tests . . . . . 11
VI. TESTS TO DETERMINE EFFECTS OF VARIOUS FACTORS . . . 12
9. General Procedure . . . . . . . . . .. 12
10. Heating Permanent Magnets . . . . . . ..12
11. Heating Disk . . . . . . . . . . . . 1212. Heating Potential Coil, Lag Coil, and Friction Com-
pensating Coil . . . . . . . . . . . 13
VII. RESULTS OF TESTS . . . . . . . . . . . . 13
13. Variation in Registration of Meter as a Whole . . . 13
14. Definition of Temperature Coefficient . . . . . 13
15. Effect of Heating Permanent Magnets . . . .. 13
16. Effect of Heating Disk . . . . . . . .. 16
VIII. ANALYSIS OF EFFECT OF TEMPERATURE ON VARIOUS PARTS
OF M ETER . . . . . . . . . . . .. . . . 16
17. Classification of Causes . . . . . . .. . 16
18. Causes Dependent on Power Factor of Load . . 19
19. Causes Independent of Power Factor of Load . .. 20
20. Mechanical Causes .. . . . . . . . . 22
IX. SUMMARY AND CONCLUSIONS . . . . . . . . . . 22
21. Summary and Conclusions . . . . . . . .22
APPENDIX A. BIBLIOGRAPHY . . . . . . . . . .. 24
LIST OF FIGURES
No. PAGE
1. Electric and Magnetic Circuits of a Single Phase Induction Meter . . . 6
2. Vector Diagram for Ideal Meter ..... . . . . . . .. . 7
3. Lag Coil Circuit . . . . . . . . . . . . . . . . ... 8
4. Vector Diagram for Commercial Meter .... . . . . . . . 9
5. Interior View of Testing Cabinet ..... . . . . . . . . 10
6. Diagram of Meter Connections ..... . . . . . .... .11
7. Variation in Registration with Temperature for Meters Nos. 1 and 2 . . . 14
8. Variation in Registration with Temperature for Meters Nos. 3 and 4 . . . 15
9. Variation in Registration with Temperature for Meter No. 5 . . . . . 16
10. Variation of Temperature Coefficient with Load . . . . . . . . 17
11. Vector Diagram showing Change in Potential Coil, Lag Coil, and Disk . . 20
12. Vector Diagram showing Effect of Load Power Factor on Registration of aM eter . . . . . . . . . . . . . . . .. . . . 21
LIST OF TABLES
No. PAGE
1. Average Temperature Coefficients of Registration . . . . . . .. 18

THE EFFECT OF TEMPERATURE ON THE REGISTRATIONOF SINGLE PHASE INDUCTION WATTHOUR METERS
I. INTRODUCTION
1. Purpose and Scope of Investigation.-The investigation of theeffect of temperature upon the registration of two-wire, single-phasewatthour meters was undertaken at the suggestion of the Meter Com-mittee of the Great Lakes Section of the National Electric Light Asso-ciation. Such meters are often located in places subject to wide changesof temperature, and it'is therefore important to ascertain how the regis-tration is affected thereby.
The greatest field of application of single phase meters is residencemetering, and for this class of service 5-ampere, 110-volt, 2-wire metersare more generally used than meters of any other capacity. The samesize of meter, with suitable transformers, is also used for metering largesingle phase loads. For these reasons, 5-ampere, 110-volt, 2-wire meterswere used in this investigation.
Self-contained meters of other capacities operate on the same prin-ciple and therefore would be affected in the same way by variation oftemperature.
II. THEORY OF INDUCTION WATTHOUR METER
2. Production of Driving Torque.-It was found that variations intemperature affect a meter in several ways, both electrically and me-chanically, so that a brief outline of the construction and operating prin-ciples of the induction meter and of the possible sources of error seemsdesirable. The magnetic and electric circuits of this type of meter areshown in Fig. 1. The potential coil P, consisting of many turns of finewire, is connected across the line and, if the frequency is constant, willcarry a current proportional to the line voltage. The current coils CC'are connected in series with the load and carry the load current. Sincethe coil P is connected across the line, a current which is independent ofthe current taken by the load will flow in it and will establish a magneticflux in the laminated iron circuit linked with the coil. At the air gaps theflux spreads and part of it will pass through the disk D and, because italternates, will cause an e.m.f. to be induced in the disk. Looking atFig. la, it is seen that the induced e.m.f. will be toward the reader underone air gap and away from the reader under the other, or looking at the

ILLINOIS ENGINEERING EXPERIMENT STATION
(a) /b)FIG. 1. ELECTRIC AND MAGNETIC CIRCUITS OF A
SINGLE PHASE INDUCTION METER
disk from above, as in Fig. Ib, one e.m.f. will be directed toward thecenter and the other toward the edge. These two e.m.fs. are in the samedirection with respect to a path shown by the dash line and consequentlya current will flow in this path, and this current will be proportional tothe line voltage E and in phase with it. Figure 2 shows the vector re-lations of the ideal case, where E is the line voltage, Ip the potential coilcurrent, , the flux established by the current I,, Ed the e.m.f. inducedin the disk, and Id the current flowing in the disk.
Referring to Fig. 1, it will be seen that the coils CC' are so locatedthat the current Id will lie in the field produced by them, and there willbe, as a consequence, a torque produced tending to rotate the disk. Ifthe field produced by coils CC' is in phase with Id the average torqueproduced will be proportional to the product of Id and the field, or sincethe field is produced by the load current IL, to the product of Id and IL.If It is not in phase with Id the average torque will be proportional tothe product of Id and the component of IL which is in phase with Id.Since Id is proportional to E, the torque is proportional to the productof E and the component of IL in phase with E or to the power in theload circuit.
3. Relation Between Driving Torque and Speed.-Since the torquehas been found to be proportional to the power, the movement of thedisk can be utilized to indicate this power. If the disk were restrained
" '

EFFECT OF TEMPERATURE ON INDUCTION WATTHOUR METERS
4 E f
1.FIG. 2. VECTOR DIAGRAM FOR IDEAL METER
by means of a spring, such that the restoring force of the spring wereproportional to the movement of the disk, the disk would take up, at alltimes, a position which is proportional to the average power, and itsposition would therefore be an indication of the amount of power to bemeasured. If the disk were free to turn but were damped in such a man-ner that the damping torque would be proportional to the speed, then fora given power the disk would rotate at a given speed. Assuming that thedisk is running at a given speed, proportional to the power, the numberof revolutions made in a given time will be proportional to the power andto the time, or to the energy; and if the meter is provided with a revolu-tion counter, the total number of revolutions recorded in a given timewill indicate the energy consumed during this time. A damping device,which will produce a damping torque proportional to the speed, mayconsist of a permanent magnet so placed that the disk cuts through thefield of the magnet. Under these conditions the e.m.f. generated in thedisk, and therefore the current which flows as a result, will be directlyproportional to the speed. For constant speed conditions, the drivingtorque produced by the interaction of the alternating fields of thepotential and current coils will be equal to the damping torque producedby the permanent magnet.
III. INHERENT VARIATIONS OF PRACTICAL METER FROM
IDEAL CONDITIONS
4. Sources of Error.-In the practical meter it is not possible torealize the ideal conditions. The variations are due to the followingcauses:
(a) Since the coil P has resistance, the current in this coil will notbe exactly 90 deg. out of phase with the voltage; and therefore the e.m.f.

ILLINOIS ENGINEERING EXPERIMENT STATION
Poteln't/al/ Co/ Q9l QSQ ljuof e ' ete,-
ZL'g Coi/
FIG. 3. LAG COIL CIRCUIT
induced in the disk due to the field of the coil will not be exactly in phasewith the line voltage.
(b) The current in the disk produced by the alternating field willnot be exactly in phase with the induced voltage in the disk, due to thefact that the eddy current path will have inductance as well as resistance.
(c) The torque opposing rotation will not consist wholly of thetorque generated by the movement of the disk in the field of the perma-nent magnet but will be made up in part of the friction of the bearings ofthe various moving members.
5. Correction of Inherent Errors.-The inherent errors can be com-pensated for as follows: The first and second neutralize each other tosome extent, and their resultant error may be corrected by the use of acircuit such as shown in Fig. 3. In this circuit the potential coil of themeter acts as the primary of a transformer and a second coil as thesecondary. The secondary coil may consist of several turns of wirewound on the potential coil core and connected to an adjustable resist-ance, or it may consist of a sheet metal stamping. In either case thissecondary is spoken of as the lag coil.
Figure 4 shows the vector diagram of the currents and voltages.E is the voltage across the potential coil and across the load; F, is them.m.f. produced by the current in the potential coil, FL is the m.m.f.produced by the current in the lag coil, Fd is the m.m.f. produced by thecurrent in the disk, and F is the resultant of these three; EL is the e.m.f.induced in the lag coil, and Ed is the e.m.f. induced in the disk. By prop-erly adjusting the resistance, or the position, of the lag coil, these quan-tities may be made of such magnitude and phase position as to make Id,the current in the disk, in phase with E, and thus make the drivingtorque proportional to E and the component of the load current whichis in phase with E.
The third inherent error may be partially overcome by the use of ashading coil on the potential coil magnetic circuit. The size and position

EFFECT OF TEMPERATURE ON INDUCTION WATTHOUR METERS
of E
- -- 3a/F
~-irc~on of
Direcf/t<of
FIG. 4. VECTOR DIAGRAM FOR COMMERCIAL METER
of this shading coil can be made such as to create a driving torque justsufficient to compensate the resisting torque of friction, and if the torquedue to friction were constant at all speeds, the friction compensationcould be made perfect at all speeds.
IV. DESCRIPTION OF APPARATUS
6. Description of Cabinet.-Figure 5 shows the construction ofthe cabinet finally used and the method of insulating it. This cabinetwas so constructed that a large temperature range could be obtained.The inner box was large enough to contain five different makes of meters.It was lined inside with two layers of asbestos paper. The outer boxprovided a dead air space around the inner box when the meters werebeing heated and a space for the circulation of cold air when the meterswere being cooled. This box was lined with three layers of asbestospaper and covered with two one-inch layers of Flaxlinum. Observationsof the meters under test were made through suitable windows in theinner and outer boxes. The window of the inner box was of double glasswith a dead air space between the plates. The refrigerating unit wasinstalled in a compartment on the side of the outer box and was pro-tected against the higher temperatures by the insertion of a heat insulat-

ILLINOIS ENGINEERING EXPERIMENT STATION
FIG. 5. INTERIOR VIEW OF TESTING CABINET
ing door in the side of the outer box. The box surrounding the refriger-
ating unit had three one-inch layers of Flaxlinum on the sides and top
and four one-inch layers on the bottom. All joints of the outside cover-
ing were lapped to reduce to a minimum the heat loss by convection.
7. Temperature Control.-Carbon lamps controlled by a thermostat
were used for heating the meters. Definite temperatures lower than
room temperature were maintained by permitting the refrigerator to
operate at maximum capacity and adding heat at different rates by the
use of the lamps. The temperature of the meters was measured by
copper-constantan thermocouples. One junction was placed on the
potential coil yoke of each meter and the other junction was maintained

EFFECT OF TEMPERATURE ON INDUCTION WATTHOUR METERS
FIG. 6. DIAGRAM OF METER CONNECTIONS
For unity power factor close switch S at 2.For 50 per cent power factor close switch S at 1.Leading or lagging power factor depends upon phase rotation.
at 0 deg. C. (melting ice). Thus the temperature of each meter couldbe determined by measurement of the thermal electromotive forcegenerated between the two junctions of each thermocouple. The electro-motive force was measured by the balanced electromotive force or zerocurrent method with the use of a Leeds and Northrup potentiometer.
The rotating standard meter used during the tests was placed in anasbestos-lined box to prevent temperature changes. The temperatureof this standard was maintained constant by means of carbon lamps andthermostatic control.
V. METHOD OF MAKING REGISTRATION TESTS
8.7Method of Making Registration Tests.-The meters were con-nected as shown in Fig. 6 and adjusted to correct registration at lightload and three-quarter load, at normal temperature.* Then the tem-perature was varied through several heat cycles and registration of themeters recorded for the various temperatures and at various loads. Thesame volt-ampere load values were used for each set of conditions andat the three power factors studied. The voltage and frequency of thecircuit were maintained at 110 volts and 60 cycles, respectively. Thetemperature of the rotating standard was held constant at 25 deg. C.,and the potential coils of the standard and other meters were excited at
*See Rule 9, General Order 65, Illinois Commerce Commission.
ILLINOIS ENGINEERING EXPERIMENT STATION
all times so as to eliminate any error caused by the changes in the tem-perature of the coils due to the exciting current.*
In order to reduce the errors due to personal equation as much aspossible, three observations were made under each condition and theaverage value was recorded. The number of disk revolutions used at thevarious loads was such that the time required for each reading variedbetween 30 and 45 seconds. The purpose of this was to reduce to a mini-mum any error that might occur in stopping and starting the rotatingstandard and at the same time to eliminate as much as possible the effectof any fluctuations that might occur in the frequency and voltage ofthe system.
VI. TESTS TO DETERMINE EFFECTS OF VARIOUS FACTORS
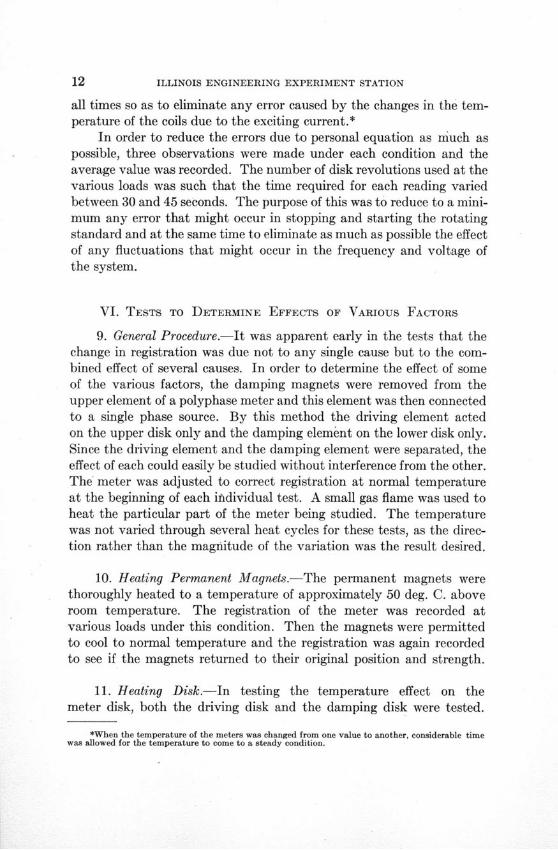
9. General Procedure.-It was apparent early in the tests that thechange in registration was due not to any single cause but to the com-bined effect of several causes. In order to determine the effect of someof the various factors, the damping magnets were removed from theupper element of a polyphase meter and this element was then connectedto a single phase source. By this method the driving element actedon the upper disk only and the damping element on the lower disk only.Since the driving element and the damping element were separated, theeffect of each could easily be studied without interference from the other.The meter was adjusted to correct registration at normal temperatureat the beginning of each individual test. A small gas flame was used toheat the particular part of the meter being studied. The temperaturewas not varied through several heat cycles for these tests, as the direc-tion rather than the magnitude of the variation was the result desired.
10. Heating Permanent Magnets.-The permanent magnets werethoroughly heated to a temperature of approximately 50 deg. C. aboveroom temperature. The registration of the meter was recorded atvarious loads under this condition. Then the magnets were permittedto cool to normal temperature and the registration was again recordedto see if the magnets returned to their original position and strength.
11. Heating Disk.-In testing the temperature effect on themeter disk, both the driving disk and the damping disk were tested.
*When the temperature of the meters was changed from one value to another, considerable timewas allowed for the temperature to come to a steady condition.

EFFECT OF TEMPERATURE ON INDUCTION WATTHOUR METERS
When the upper disk was heated the effect on the driving torquewas indicated and when the lower disk was heated the effect on the
damping torque was indicated. The combined effect on the two torqueswas shown by testing one disk on which both the driving torque and thedamping torque acted.
12. Heating Potential Coil, Lag Coil, and Friction CompensatingCoil.-The coils were heated, but as they are so placed that considerableradiation occurs, satisfactory conditions could not be obtained.Consequently, the results obtained for these tests were not considereda reliable indication of the temperature effect on these parts alone.
VII. RESULTS OF TESTS
13. Variation in Registration of Meter as a Whole.-The totalvariation of registration with temperature for each meter at four differentloads is shown by Figs. 7, 8, and 9. It will be noted that the registrationfor 50 per cent power factor, current lagging, decreases with increasein temperature for meters Nos. 1 and 2, and remains nearly constant formeters Nos. 3 and 5. In all other cases recorded the registration in-creases with increase of temperature.
These curves also indicate that the relation between temperatureand meter registration is a linear one, and therefore the effect of tem-perature can be expressed in terms of change of registration per degreechange in temperature.
14. Definition of Temperature Coefficient.-The term "TemperatureCoefficient" is used to express the change in per cent registration perdegree centigrade. Figure 10 shows the relation between load andtemperature coefficient. The shape of these curves depends upon therelative magnitudes of the effects of the various factors, upon the typeof lag coil circuit used, and upon the magnitude of the friction com-pensation.
15. Effect of Heating Permanent Magnets.-The results of heatingonly the permanent magnet of a meter showed an increase of 4 to 5 percent in the registration of the meter. It was noted that the meter re-turned to its original registration after the magnet cooled, showing thatthe magnet did not undergo any permanent change in strength.

ILLINOIS ENGINEERING EXPERIMENT STATION
Tempera//ure in deg. C
FIG. 7. VARIATION IN REGISTRATION WITH TEMPERATUREFOR METERS Nos. 1 AND 2

EFFECT OF TEMPERATURE ON INDUCTION WATTHOUR METERS
I - - l -.. ...- ..7 - -
FIG. 8. VARIATION IN REGISTRATION WITH TEMPERATURE
FOR METERS NOS. 3 AND 4

ILLINOIS ENGINEERING EXPERIMENT STATION
Temperafure /i deg Co-oo0% RF *-50Mr , rCurren LaOging Q -50-PsoX , Curren Leao'dg.
FIG. 9. VARIATION IN REGISTRATION WITH TEMPERATUREFOR METER NO. 5
16. Effect of Heating Disk.-When the disk was acted upon bythe driving element only, heating the disk caused a decrease in theregistration of the meter; but when the disk was acted upon by thedamping element only, heating the disk caused an increase in the regis-tration. When the disk was acted upon by both the driving element andthe damping element, heating the disk caused an increase in the regis-tration, showing that the effect of increased temperature is greater onthe damping than on the driving side.
VIII. ANALYSIS OF EFFECT OF TEMPERATURE ON VARIOUS
PARTS OF METER
17. Classification of Causes.-The tests show that the registrationof the meter is changed when the temperature at which it is working isincreased. This change can be attributed to the following causes, someof which tend to increase the speed while others tend to decrease it:

EFFECT OF TEMPERATURE ON INDUCTION WATTHOUR METERS
Load /i Volt-Amperes
FIG. 10. VARIATION OF TEMPERATURE COEFFICIENT WITH LOAD

ILLINOIS ENGINEERING EXPERIMENT STATION
0*0
ooo'- 00ddddd00030
00000
ON N - l OV0000000030
ddddd
"Cq--rý
00000
ddddd
BN NOt00030
00000
000N0
ddddd
0 l 0'M 0
ooddd
00000
Lo 0ý0
00000
0ddd0
000V'"
00000=1voo m -4ddddd
N V 000
00000
ot-CO "
00000
ddddd
00 a 0
ddddd o ý
ýnt_(=CO-O
ddddd
N 00000000
St-hcom222Mi
6666C;
ddddd
N0100
V0006 V
00 ; 00
00000
ddddd
0 0 0t-- '00 c 00
00000
slw-'-oiO
00000
00000
dddd0
ddddd
~crcui-lfCo
00000
ddddd
90 Wj 00
eqco Low
0000d
00. 00
00 m 00
oommo0ddd0d
00000
00000
00000
II I I00000
ddddd
00000
ddddd
00:::
ddddd
III-^tO
0
V
0
0m
I
E4
z
a
P4a6-
^5
wM
t
EFFECT OF TEMPERATURE ON INDUCTION WATTHOUR METERS
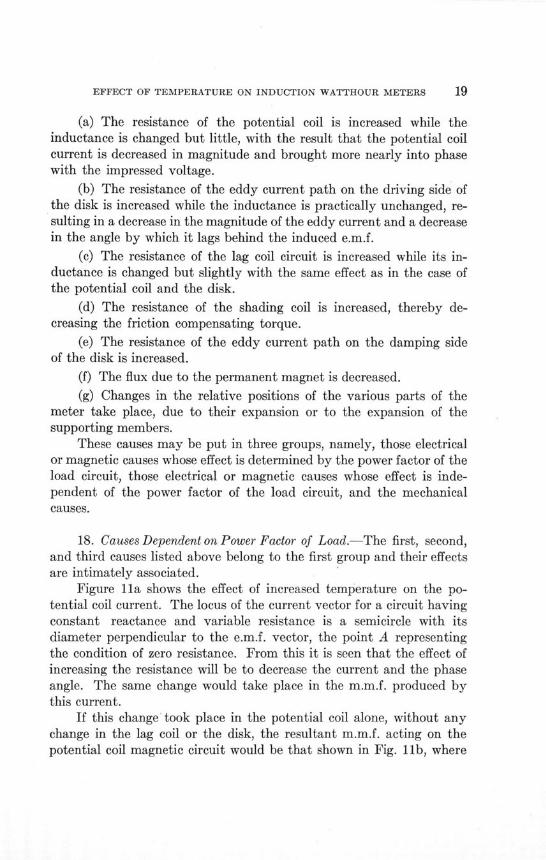
(a) The resistance of the potential coil is increased while theinductance is changed but little, with the result that the potential coilcurrent is decreased in magnitude and brought more nearly into phasewith the impressed voltage.
(b) The resistance of the eddy current path on the driving side ofthe disk is increased while the inductance is practically unchanged, re-sulting in a decrease in the magnitude of the eddy current and a decreasein the angle by which it lags behind the induced e.m.f.
(c) The resistance of the lag coil circuit is increased while its in-ductance is changed but slightly with the same effect as in the case ofthe potential coil and the disk.
(d) The resistance of the shading coil is increased, thereby de-creasing the friction compensating torque.
(e) The resistance of the eddy current path on the damping sideof the disk is increased.
(f) The flux due to the permanent magnet is decreased.
(g) Changes in the relative positions of the various parts of themeter take place, due to their expansion or to the expansion of thesupporting members.
These causes may be put in three groups, namely, those electricalor magnetic causes whose effect is determined by the power factor of theload circuit, those electrical or magnetic causes whose effect is inde-pendent of the power factor of the load circuit, and the mechanicalcauses.
18. Causes Dependent on Power Factor of Load.-The first, second,and third causes listed above belong to the first group and their effectsare intimately associated.
Figure 1la shows the effect of increased temperature on the po-tential coil current. The locus of the current vector for a circuit havingconstant reactance and variable resistance is a semicircle with itsdiameter perpendicular to the e.m.f. vector, the point A representingthe condition of zero resistance. From this it is seen that the effect ofincreasing the resistance will be to decrease the current and the phaseangle. The same change would take place in the m.m.f. produced bythis current.
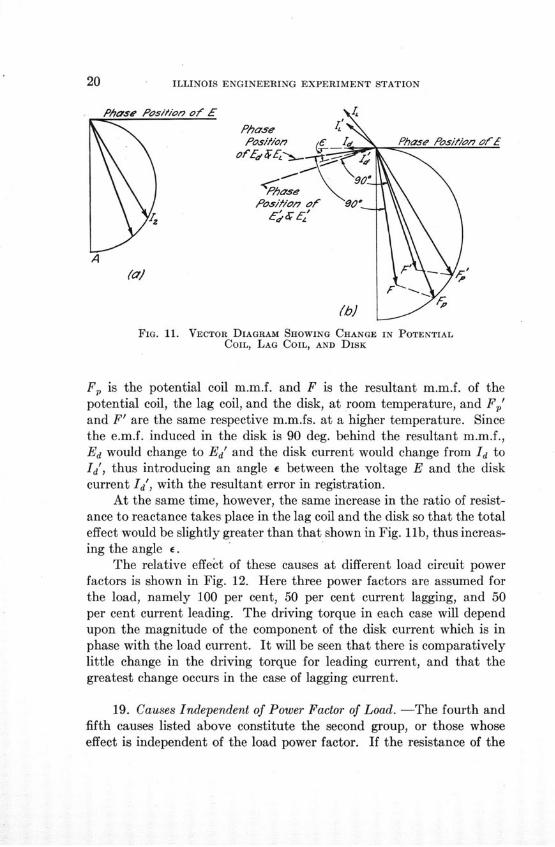
If this change took place in the potential coil alone, without anychange in the lag coil or the disk, the resultant m.m.f. acting on thepotential coil magnetic circuit would be that shown in Fig. 11b, where
ILLINOIS ENGINEERING EXPERIMENT STATION
PhasePosi/ion
PhasePosY/ion of
FIG. 11. VECTOR DIAGRAM SHOWING CHANGE IN POTENTIALCOIL, LAG COIL, AND DISK
F, is the potential coil m.m.f. and F is the resultant m.m.f. of thepotential coil, the lag coil, and the disk, at room temperature, and F,and F' are the same respective m.m.fs. at a higher temperature. Sincethe e.m.f. induced in the disk is 90 deg. behind the resultant m.m.f.,Ed would change to Ed' and the disk current would change from Id toId', thus introducing an angle e between the voltage E and the diskcurrent Id', with the resultant error in registration.
At the same time, however, the same increase in the ratio of resist-ance to reactance takes place in the lag coil and the disk so that the totaleffect would be slightly greater than that shown in Fig. 1lb, thus increas-ing the angle e.
The relative effect of these causes at different load circuit powerfactors is shown in Fig. 12. Here three power factors are assumed forthe load, namely 100 per cent, 50 per cent current lagging, and 50per cent current leading. The driving torque in each case will dependupon the magnitude of the component of the disk current which is inphase with the load current. It will be seen that there is comparativelylittle change in the driving torque for leading current, and that thegreatest change occurs in the case of lagging current.
19. Causes Independent of Power Factor of Load. -The fourth andfifth causes listed above constitute the second group, or those whoseeffect is independent of the load power factor. If the resistance of the

EFFECT OF TEMPERATURE ON INDUCTION WATTHOUR METERS
Loadc urrent o Cr
LL eaa:ing
Ii , Loaed mf 4 Loud h .' Lo< Currv,,t
sa% \Current
FIG. 12. VECTOR DIAGRAM SHOWING EFFECT OF LOADPOWER FACTOR ON REGISTRATION OF A METER
shading coil is increased, the short circuit current in it is decreased, andthe shifting of the flux is thereby decreased. This produces a decreaseof the friction-compensating torque and the result of this causealone would be a decrease in the speed of the meter.
If the resistance of the eddy current path on the damping side ofthe disk were increased, the current in this path would decrease and thedamping for a given speed would be decreased. In order, then, to pro-duce a given damping torque the speed of the meter would have toincrease.
The change in the damping flux can be attributed (a) to changes inthe magnetic strength or magnetic moment of the magnet and (b) tochanges in flux distribution caused by expansion.
It is difficult to prove that change in magnetic strength occurs withchange in temperature, especially under the conditions of these tests.An article written by Professor S. P. Thompson* discusses thoroughlythe heating of permanent magnets. Professor Thompson says, "Rise oftemperature was found by Canton and other observers to produce atemporary fall of the remanence and a fall of temperature to producea rise.
M1= Mo [1 + a (ti - to)]Mo = magnetic moment at toM1 = magnetic moment at tj
The results varied from -0.000044 to -0.00112."Wiedemann found that if a bar was strongly magnetized, and then
partially demagnetized (by opposite force) it would, on being heated,lose some magnetism if the previous reduction had been small, but wouldgain if the reduction had been large. Also, that if a newly made magnet
*"The Magnetism of Permanent Magnets," Proc. Inst. Elee. Eng., Vol. 50, 1913, p. 123.

ILLINOIS ENGINEERING EXPERIMENT STATION
is repeatedly heated and cooled, the loss of magnetism at each heatingis only partially recovered on cooling, causing the progressive loss,until finally a constant state is reached in which the magnetization losson being heated is restored on cooling."
20. Mechanical Causes.-The mechanical design of the meter con-trols to a large extent the variation in registration due to mechanicalexpansion of parts and it is difficult to state exactly what the effect ofthe temperature change will be. Heating the yoke of. a meter did notmake any appreciable change in the registration. The meter showed anincrease in registration of only 0.3 per cent for about 50 deg. C. rise intemperature.
Expansion of the frame and supporting lugs may or may not causea change in registration. It is evident that the different metals used willnot give a uniform expansion and the relative positions of the magneticfluxes (driving and damping) will be changed.
During one of the preliminary tests, the heating of a meter causedthe magnet support to expand to such a position that the magnet touchedthe disk and stopped it. This occurred at a temperature of about 80deg. C. The expansion of the shaft supporting the disk may be enoughto cause excessive friction or to even stop the meter. This was actuallythe case in a preliminary run with meter No. 4. The top bearing wasset too low, and as the temperature was increased the meter showed adecrease in registration until it finally stopped at 73 deg. C. The fric-tion of the gears is very small normally, but in general will increase asthe temperature increases.
IX. SUMMARY AND CONCLUSIONS
21. Summary and Conclusions.-The effect of increasing the tem-perature of the various parts of the meter may be summarized as follows:
(a) Increasing the temperature of the potential coil, the lagcoil, or the disk tends in general to decrease the speed, the magni-tude of the effect depending upon the power factor, being least forleading current and greatest for lagging current.
(b) Increasing the temperature of the friction compensatingcoil tends to decrease the speed.
(c) Increasing the temperature of the damping side of the disktends to increase the speed.

EFFECT OF TEMPERATURE ON INDUCTION WATTHOUR METERS 23
(d) Increasing the temperature of the damping magnets tendsto increase the speed.
(e) Mechanical expansion of the various parts due to increaseof temperature may tend to either increase or decrease the speed.
The total effect will be the algebraic sum of the individual ef-fects, and will therefore depend upon the load power factor. With theload current leading the decrease in speed due to (a) will be smalland will not offset much of the increase due to (c) and (d). With theload current in phase, the decrease due to (a) will be larger and willoffset more of the effect of (c) and (d); with the load current laggingthe decrease due to (a) is still larger and will offset still more theeffect of (c) and (d). Thus the temperature coefficients will begreater for leading current than for in-phase current and greaterfor in-phase current than for lagging current. An inspection of thecurves shows that this conclusion is supported by the test data.
ILLINOIS ENGINEERING EXPERIMENT STATION
APPENDIX A
BIBLIOGRAPHY
BOOKS
SHEPARD, WILLIAM M. and JONES, ALLEN G. "The Watthour Meter." 1910.GERHARDI, C. H. W. "Electricity Meters-Their Construction and Management."
1917.JANSKY, C. M. "Electrical Meters." 1917."Electrical Metermen's Handbook."
ARTICLES AND PAPERS
TOMLINSON, HERBERT. "Theories Concerning the Sudden Loss of Magnetic Prop-erties of Iron and Nickel at Certain Temperatures." Philosophical Magazine,Vol. 26, July, 1888, p. 18.
KUNz, JAKOB. "Theories of Magnetism," Bulletin of the National Research Council,Vol. 3, part 3.
KUNZ, JAKOB. "Ueber die Induktion der in Drehfeldern Rotierenden Kugeln,"published in Stuttgart, 1906.

RECENT PUBLICATIONS OFTHE ENGINEERING EXPERIMENT STATIONt
*Bulletin No. 118. Dissolved Gases in Glass, by E. W. Washburn, F. F. Footitt,and E. N. Bunting. 1920. Twenty cents.
*Bulletin No. 119. Some Conditions Affecting the Usefulness of Iron Oxidefor City Gas Purification, by W. A. Dunkley. 1921. Thirty-five cents.
*Circular No. 9. The Functions of the Engineering Experiment Station ofthe University of Illinois, by C. R. Richards. 1921.
Bulletin No. 120. Investigation of Warm-Air Furnaces and Heating Systems,by A. C. Willard, A. P. Kratz, and V. S. Day. 1921. Seventy-five cents.
*Bulletin No. 121. The Volute in Architecture and Architectural Decoration,by Rexford Newcomb. 1921. Forty-five cents.
*Bulletin No. 122. The Thermal Conductivity and Diffusivity of Concrete, byA. P. Carman and R. A. Nelson. 1921. Twenty cents.
*Bulletin No. 123. Studies on Cooling of Fresh Concrete in Freezing Weather,by Tokujiro Yoshida. 1921. Thirty cents.
*Bulletin No. 124. An Investigation of the Fatigue of Metals, by H. F. Mooreand J. B. Kommers. 1921. Ninety-five cents.
*Bulletin No. 125. The Distribution of the Forms of Sulphur in the Coal Bed,by H. F. Yancey and Thomas Fraser. 1921. .Fifty cents.
Bulletin No. 126. A Study of the Effect of Moisture Content upon the Ex-pansion and Contraction of Plain and Reinforced Concrete, by T. Matsumoto.1921. Twenty cents.
Bulletin No. 127. Sound-Proof Partitions, by F. R. Watson. 1922. Forty-five cents.
*Bulletin No. 128. The Ignition Temperature of Coal, by R. W. Arms. 1922.Thirty-five cents.
*Bulletin No. 129. An Investigation of the Properties of Chilled Iron CarWheels. Part I. Wheel Fit and Static Load Strains, by J. M. Snodgrass andF. H. Guldner. 1922. Fifty-five cents.
*Bulletin No. 130. The Reheating of Compressed Air, by C. R. Richards andJ. N. Vedder. 1922. Fifty cents.
*Bulletin No. 131. A Study of Air-Steam Mixtures, by L. A. Wilson withC. R. Richards. 1922. Seventy-five cents.
*Bulletin No. 132. A Study of Coal Mine Haulage in Illinois, by H. H. Stoek,J. R. Fleming, and A. J. Hoskin. 1922.
*Bulletin No. 133. A Study of Explosions of Gaseous Mixtures, by A. P.Kratz and C. Z. Rosecrans. 1922. Fifty-five cents.
*Bulletin No. 134. An Investigation of the Properties of Chilled Iron CarWheels. Part II. Wheel Fit, Static Load, and Flange Pressure Strains. UltimateStrength of Flange, by J. M. Snodgrass and F. H. Guldner. 1922. Forty cents.
*Circular No. 10. The Grading of Earth Roads, by Wilbur M. Wilson. 1923.Fifteen cents.
*A limited number of copies of bulletins starred are available for free distribution.tOnly a partial list of the publications of the Engineering Experiment Station is published in this
bulletin. For a complete list of the publications as far as Bulletin No. 134, see that bulletin or the pub-lications previous to it. Copies of the complete list of publications can be obtained without chargeby addressing the Engineering Experiment Station, Urbana, Ill.

ILLINOIS ENGINEERING EXPERIMENT STATION
*Bulletin No. 135. An Investigation of the Properties of Chilled Iron CarWheels. Part III. Strains Due to Brake Application. Coefficient of Friction andBrake-Shoe Wear, by J. M. Snodgrass and F. H. Guldner. 1923. Fifty cents.
*Bulletin No. 136. An Investigation of the Fatigue of Metals. Series of 1922,by H. F. Moore and T. M. Jasper. 1923. Fifty cents.
Bulletin No. 137. The Strength of Concrete; its Relation to the Cement,Aggregates, and Water, by A. N. Talbot and F. E. Richart. 1923. Sixty cents.
*Bulletin No. 138. Alkali-Vapor Detector Tubes, by Hugh A. Brown andChas. T. Knipp. 1923. Twenty cents.
Bulletin No. 139. An Investigation of the Maximum Temperatures and Pres-sures Attainable in the Combustion of Gaseous and Liquid Fuels, by G. A. Good-enough and G. T. Felbeck. 1923. Eighty cents.
Bulletin No. 140. Viscosities and Surface Tensions of the Soda-Lime-SilicaGlasses at High Temperatures, by E. W. Washburn, G. R. Shelton, and E. E. Lib-man. 1924. Forty-five cents.
*Bulletin No. 141. Investigation of Warm-Air Furnaces and Heating Sys-tems, Part II, by A. C. Willard, A. P. Kratz, and V. S. Day. 1924. Eighty-fivecents.
*Bulletin No. 142. Investigation of the Fatigue of Metals. Series of 1923, byH. F. Moore and T. M. Jasper. 1924. Forty-five cents.
*Circular No. 11. The Oiling of Earth Roads, by W. M. Wilson. 1924.Fifteen cents.
*Bulletin No. 143. Tests on the Hydraulics and Pneumatics of House Plumb-ing, by H. E. Babbitt. 1924. Forty cents.
Bulletin No. 144. Power Studies in Illinois Coal Mining, by A. J. Hoskinand Thomas Fraser. 1924. Forty-five cents.
*Circular No. 12. The Analysis of Fuel Gas, by S. W. Parr and F. E. Van-daveer. 1925. Twenty cents.
Bulletin No. 145. Non-Carrier Radio Telephone Transmission, by H. A.Brown and C. A. Keener. 1925. Fifteen cents.
*Bulletin No. 146. The Total and Partial Vapor Pressures of Aqueous Am-monia Solutions, by Thomas A. Wilson, 1925. Twenty-five cents.
*Bulletin No. 147. Investigation of Antennae by Means of Models, by J. T.Tykociner. 1925. Thirty-five cents.
*Bulletin No. 148. Radio Telephone Modulation, by H. A. Brown and C. A.Keener. 1925. Thirty cents.
*Bulletin No. 149. An Investigation of the Efficiency and Durability of SpurGears, by C. W. Ham and J. W. Huckert, 1925. Fifty cents.
*Bulletin No. 150. A Thermodynamic Analysis of Gas Engine Tests, byC. Z. Rosecrans and G. T. Felbeck, 1925. Fifty cents.
*Bulletin No. 151. A Study of Skip Hoisting at Illinois Coal Mines, by A. J.Hoskin, 1925. Thirty-five cents.
*Bulletin No. 152. Investigation of the Fatigue of Metals; Series of 1925,by H. F. Moore and T. M. Jasper. 1925. Fifty cents.
*Bulletin No. 153. The Effect of Temperature on the Registration of SinglePhase Induction Watthour Meters, by A. R. Knight and M. A. Faucett, 1926.
*A limited number of copies of bulletins starred are available for free distribution.


THE UNIVERSITY OF ILLINOISTHE STATE UNIVERSITY
Urbana
DAVID KINLEY, Ph.D., LL.D., President
THE UNIVERSITY INCLUDES THE FOLLOWING DEPARTMENTS:
The Graduate SchoolThe College of Liberal Arts and Sciences (Ancient and Modern Languages and
Literatures; History, Economics, Political Science, Sociology; Philosophy,Psychology, Education; Mathematics; Astronomy; Geology; Physics; Chem-istry; Botany, Zoology, Entomology; Physiology; Art and Design)
The College of Commerce and Business Administration (General Business, Bank-ing, Insurance, Accountancy, Railway Administration, Foreign Commerce;Courses for Commercial Teachers and Commercial and Civic Secretaries)
The College of Engineering (Architecture; Architectural, Ceramic, Civil, Electri-cal, Mechanical, Mining, Municipal and Sanitary, and Railway Engineering;General Engineering Physics)
The College of Agriculture (Agronomy; Animal Husbandry; Dairy Husbandry;Horticulture and Landscape Gardening; Agricultural Extension; Teachers'Course; Home Economics)
The College of Law (Three-year and four-year curriculums based on two years andone year of college work respectively)
The College of Education (including the Bureau of Educational Research)The Curriculum in JournalismThe Curriculums in Chemistry and Chemical EngineeringThe School of Railway Engineering and AdministrationThe School of Music (four-year curriculum)The Library School (two-year curriculum for college graduates)The College of Medicine (in Chicago)The College of Dentistry (in Chicago)The School of Pharmacy (in Chicago); Ph.G. and Ph.C. curriculumsThe Summer Session (eight weeks)Experiment Stations and Scientific Bureaus: U. S. Agricultural Experiment Sta-
tion; Engineering Experiment Station; State Laboratory of Natural History;State Entomologist's Office; Biological Experiment Station on Illinois River;State Water Survey; State Geological Survey; U. S. Bureau of Mines Experi-ment Station.
The Library collections contain (March 1, 1925) 659,296 volumes and 127,788pamphlets.For catalogs and information address
THE REGISTRARUrbana, Illinois
