image processing lab report
DESCRIPTION
Lab report on Image processingTRANSCRIPT

School of electrical engineering and computer science
Digital Image Processing
Lab 9 Report
Ahmed Abbas 2009-NUST-BE-EL-09
Muhammad Aitzaz Hussain 2009-NUST-BE-EL-51

Digital Image Processing Lab-09 Report
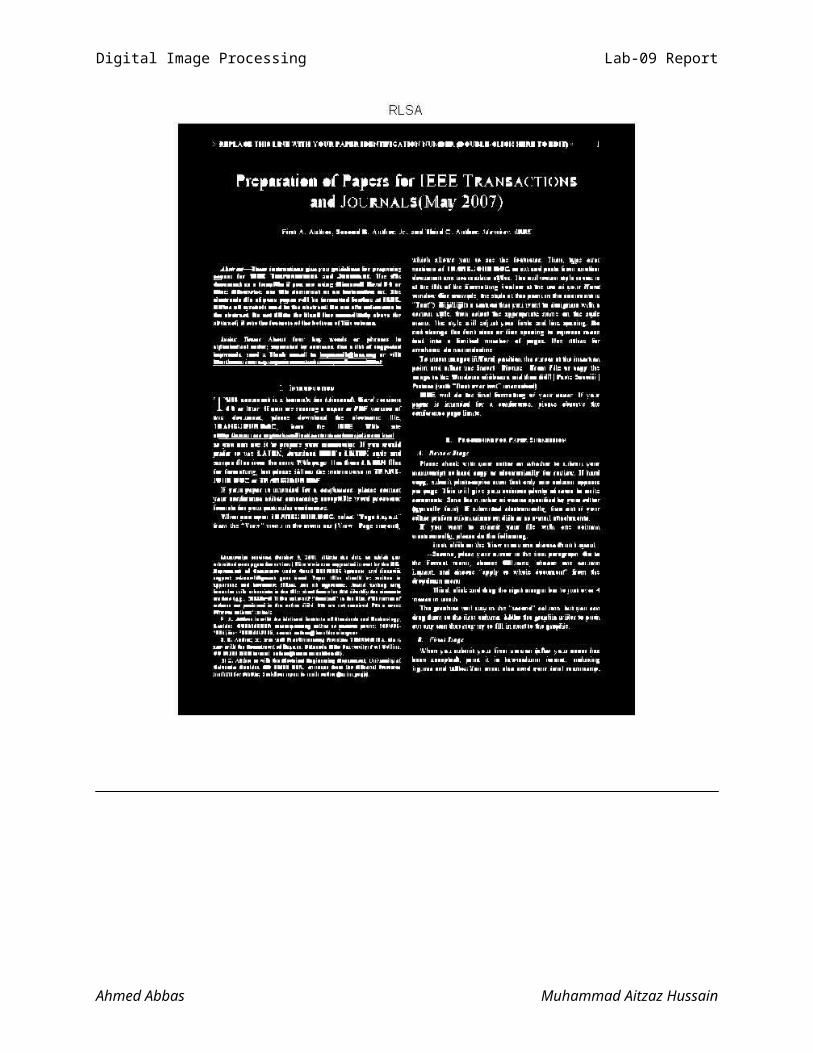
Run Length Smoothing Algorithm (RLSA) based Text Segmentation.
Open the image files provided on LMS. Read into Matlab, remove any noise, and convert to binary. Apply Horizontal RLSA. Apply Vertical RLSA. Combine vertical and horizontal outputs to segment the text regions.
Now, change the parameters to extract the words from the title of the paper only (the two largest font lines on the first image).
Code:image=rgb2gray(imread('Page (2).tif'));image=imcomplement(im2bw(image,0.5));%imshow(image);[m,n]=size(image); hor_thresh=20;zeros_count=0;one_flag=0;hor_image=image;for i=1:m for j=1:n if(image(i,j)==1) if(one_flag==1) if(zeros_count<=hor_thresh) hor_image(i,j-zeros_count:j-1)=1; else one_flag=0; end zeros_count=0; end one_flag=1; else if(one_flag==1) zeros_count=zeros_count+1;
Ahmed Abbas Muhammad Aitzaz Hussain

Digital Image Processing Lab-09 Report
end end endendfigure(1);imshow(hor_image);title('Horizontal RLSA');zeros_count=0;one_flag=0;vert_thresh=30;vert_image=image;for j=1:n for i=1:m if(image(i,j)==1) if(one_flag==1) if(zeros_count<=vert_thresh) vert_image(i-zeros_count:i-1,j)=1; else one_flag=0; end zeros_count=0; end one_flag=1; else if(one_flag==1) zeros_count=zeros_count+1; end end endendfigure(2);imshow(vert_image);title('Vertical RLSA'); figure(3);rlsa=bitand(hor_image,vert_image);imshow(rlsa);title('RLSA');
Ahmed Abbas Muhammad Aitzaz Hussain

Digital Image Processing Lab-09 Report
Ahmed Abbas Muhammad Aitzaz Hussain

Digital Image Processing Lab-09 Report
Ahmed Abbas Muhammad Aitzaz Hussain
Digital Image Processing Lab-09 Report
Lab 09 b
K-mean and C-mean.
Read Image 1 into Matlab, remove any noise, and convert to binary, and invert colors.
Apply K mean clustering for the four objects. Then apply C mean clustering.
Set any parameter that is not mentioned here on your own. Write the number of iterations for the algorithms to converge.
K-Means Clustering
Number of Clusters is a variable and we can set any value of number of clusters (K).
Main Code:image=imcomplement((im2bw(imread('2.bmp'))));clusters=4; % <- Variablefigure(1);[pixels_x,pixels_y]=find(image==1);[m]=length(pixels_x);centroid_indices=randi([1 m], clusters,1);centroid_x=pixels_x(centroid_indices);centroid_y=pixels_y(centroid_indices);all_centroids_x=[];all_centroids_y=[];dist=zeros(length(pixels_x),clusters);imshow(imcomplement(image));hold on;while(1)
Ahmed Abbas Muhammad Aitzaz Hussain

Digital Image Processing Lab-09 Report
[new_centroid_x,new_centroid_y]=kmeans_calc( centroid_x,centroid_y,pixels_x,pixels_y,dist,clusters); all_centroids_x=[all_centroids_x centroid_x]; all_centroids_y=[all_centroids_y centroid_y]; if(isequal(new_centroid_x,centroid_x) && isequal(new_centroid_y,centroid_y)) break; end centroid_x=new_centroid_x; centroid_y=new_centroid_y;end for i=1:size(all_centroids_x,2)-1 for j=1:clusters plot([all_centroids_y(j,i) all_centroids_y(j,i+1)],[all_centroids_x(j,i) all_centroids_x(j,i+1)],'-k','linewidth',1.5); plot(all_centroids_y(j,:),all_centroids_x(j,:),'x','linewidth',3,'color',[rand rand rand]); endendplot(all_centroids_y(:,1),all_centroids_x(:,1),'o','Linewidth',3,'color',[1 1 1]);
Function Code: function [ new_centroid_x,new_centroid_y] = kmeans_calc( centroid_x,centroid_y,pixels_x,pixels_y,dist,clusters )new_centroid_x=zeros(clusters,1);new_centroid_y=zeros(clusters,1);for i=1:clusters dist(:,i)=(pixels_x-centroid_x(i)).^2 + (pixels_y -centroid_y(i)).^2;end[~,centroid_assign]=min(dist,[],2); % index, value of min distfor j=1:clusters indices=find(centroid_assign==j); new_centroid_x(j)=mean(pixels_x(indices)); new_centroid_y(j)=mean(pixels_y(indices));
Ahmed Abbas Muhammad Aitzaz Hussain

Digital Image Processing Lab-09 Report
plot(pixels_y(indices),pixels_x(indices),'.','color',[rand rand rand]);endend
Results:
Ahmed Abbas Muhammad Aitzaz Hussain

Digital Image Processing Lab-09 Report
Note: The points labeled as ‘o’ are the initial random values of clusters. The points labeled as ‘x’ are the calculated values of clusters during all
the iterations. The lines indicate the path travelled by the centroids.
C-Means Clustering
Number of Clusters is a variable and we can set any value of number of clusters (K).
Main Code:image=imcomplement((im2bw(imread('2.bmp'))));clcclose allclusters=4;epsilon=0.1;figure(1);[pixels_row,pixels_col]=find(image==1);[m]=length(pixels_row);centroid_indices=randi([1 m], clusters,1);centroid_row=pixels_row(centroid_indices);centroid_col=pixels_col(centroid_indices);old_crow=centroid_row;old_ccol=centroid_col; dist=zeros(m,clusters);imshow((image));hold on;
Ahmed Abbas Muhammad Aitzaz Hussain

Digital Image Processing Lab-09 Report
while(1)[new_centroid_row,new_centroid_col]=cmeans_calc( centroid_row,centroid_col,pixels_row,pixels_col,dist,clusters); plot(centroid_col,centroid_row,'*','color',[.3 .7 .2]); if(max(abs(centroid_row-new_centroid_row))<epsilon && max(abs(centroid_col-new_centroid_col))<epsilon) break; end centroid_row=new_centroid_row; centroid_col=new_centroid_col;endplot(new_centroid_col,new_centroid_row,'x','Linewidth',10,'color',[1 0 0]);plot(old_ccol,old_crow,'o','Linewidth',2);
Function Code:function [new_centroid_row,new_centroid_col]=cmeans_calc( centroid_row,centroid_col,pixels_row,pixels_col,dist,clusters)for i=1:clusters dist(:,i)=sqrt((pixels_row-centroid_row(i)).^2 + (pixels_col -centroid_col(i)).^2);endsum_dist=repmat(sum(dist,2),1,clusters);prob_dist=dist./sum_dist;weights_dist=(1-(prob_dist)); weights_dist=weights_dist./repmat(sum(weights_dist),length(pixels_row),1); % division to ensure sum(weights)=1pixels_row=repmat(pixels_row,1,clusters);pixels_col=repmat(pixels_col,1,clusters);new_centroid_row=((sum(pixels_row.*weights_dist)))';new_centroid_col=((sum(pixels_col.*weights_dist)))';
Ahmed Abbas Muhammad Aitzaz Hussain
Digital Image Processing Lab-09 Report
end
Results:
Analysis:
The fuzzy c-mean algorithm taught in class causes the centroids to converge to same point that is, the mean of all the foreground pixels of the image, irrespective of the initial positions of the centroids. As evident, we are not getting satisfactory results.
The actual fuzzy c-mean algorithm is somewhat more complex than the way we learned and implemented.
Ahmed Abbas Muhammad Aitzaz Hussain

Digital Image Processing Lab-09 Report
The code presented here is strictly built upon the algorithm from the lecture and was debugged through calculations by pen and paper many a times for checking presence of any error.
Ahmed Abbas Muhammad Aitzaz Hussain