impact of group collaboration on the improvement of
TRANSCRIPT
Brigham Young University Brigham Young University
BYU ScholarsArchive BYU ScholarsArchive
Theses and Dissertations
2011-07-13
Impact of Group Collaboration on the Improvement of Individual Impact of Group Collaboration on the Improvement of Individual
Creative Thinking Ability Creative Thinking Ability
Isaku Tateishi Brigham Young University - Provo
Follow this and additional works at: https://scholarsarchive.byu.edu/etd
Part of the Educational Psychology Commons
BYU ScholarsArchive Citation BYU ScholarsArchive Citation Tateishi, Isaku, "Impact of Group Collaboration on the Improvement of Individual Creative Thinking Ability" (2011). Theses and Dissertations. 3059. https://scholarsarchive.byu.edu/etd/3059
This Dissertation is brought to you for free and open access by BYU ScholarsArchive. It has been accepted for inclusion in Theses and Dissertations by an authorized administrator of BYU ScholarsArchive. For more information, please contact [email protected], [email protected].
Impact of Group Collaboration on the Improvement of Individual Creative Thinking Ability
Isaku Tateishi
A dissertation submitted to the faculty of Brigham Young University
In partial fulfillment of the requirements for the degree of
Doctor of Philosophy
Dr. Richard E. West Dr. Geoffrey A. Wright Dr. Randall S. Davies
Dr. Peter J. Rich Dr. Andrew S. Gibbons
Department of Instructional Psychology and Technology
Brigham Young University
August 2011
Copyright © 2011 Isaku Tateishi
All Rights Reserved
ABSTRACT Impact of Group Collaboration on the Improvement of Individual Creative Thinking Ability
Isaku Tateishi Department of Instructional Psychology and Technology
Doctor of Philosophy
Creativity plays a crucial role in innovation, and innovation is essential for any organization’s continuous success and survival. Past creativity research focused on the studies of individual creativity (West, 2009); however, in recent years there has been an increased emphasis on understanding how a group of people work together to produce creative ideas and products (Paulus & Nijstad, 2003). This collaborative creativity process is often referred to as group creativity. Despite the increased interest in group creativity, there is still a lack of empirical studies (Taggar, 2002). This study explored the impact of group collaboration on the improvement of individual creative thinking ability. During the 2009–2010 school year, approximately 120 undergraduate technology and engineering students participated in the Innovation Boot Camp (IBC), a creativity training program. The participants were teamed up with people from different majors and asked to work together to design an innovative solution to a problem. Their individual creativity was also measured before and after the IBC using the Torrance Test of Creative Thinking (TTCT). Interestingly, a significant TTCT score improvement was found only in a few groups, but not in all groups. This study qualitatively analyzed video-recorded team interactions of three groups that significantly increased their creativity scores (improved groups) and three groups who did not (non-improved groups). The findings of this analysis revealed six major differences between the improved and non-improved groups. These differences were (1) idea and information exchange, (2) critique, (3) idea improvement, (4) prototype design, (5) challenging solution, and (6) engagement level. Based on these differences, this report presents a theory that could explain how group collaboration can improve individual creative thinking ability. The implications of the study findings for future research were also discussed. Keywords: group creativity, individual creativity, collaborative innovation, community of innovation
ACKNOWLEDGMENTS
I would like to express my sincere gratitude to my graduate committee chair, Dr. Richard
E. West. His guidance and support were indispensable for completing this project. I would also
like to give my thanks to other members of my committee—Dr. Geoffrey A. Wright, Dr. Randall
S. Davies, Dr. Peter J. Rich, and Dr. Andrew S. Gibbons. They were always willing to help and
provide their expert knowledge to help me improve the quality of the study. A special thanks
should also be given to other graduate researchers who participated in this project. Finally, I
would like to give thanks to my wife for her constant prayer, encouragement, and support.
iv
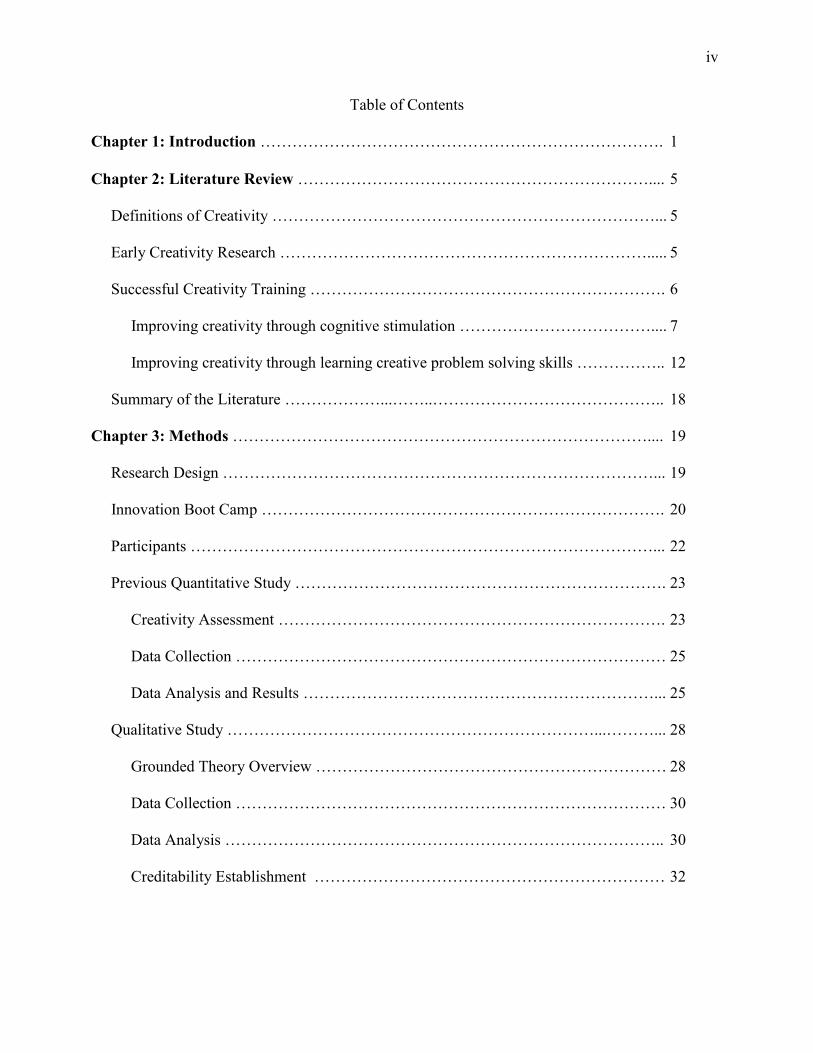
Table of Contents
Chapter 1: Introduction …………………………………………………………………. 1
Chapter 2: Literature Review …………………………………………………………....
5
Definitions of Creativity ………………………………………………………………... 5
Early Creativity Research ……………………………………………………………..... 5
Successful Creativity Training …………………………………………………………. 6
Improving creativity through cognitive stimulation ……………………………….... 7
Improving creativity through learning creative problem solving skills …………….. 12
Summary of the Literature ………………...……..…………………………………….. 18
Chapter 3: Methods …………………………………………………………………….... 19
Research Design ………………………………………………………………………... 19
Innovation Boot Camp …………………………………………………………………. 20
Participants ……………………………………………………………………………... 22
Previous Quantitative Study ……………………………………………………………. 23
Creativity Assessment ………………………………………………………………. 23
Data Collection ……………………………………………………………………… 25
Data Analysis and Results …………………………………………………………... 25
Qualitative Study ……………………………………………………………...………... 28
Grounded Theory Overview ………………………………………………………… 28
Data Collection ……………………………………………………………………… 30
Data Analysis ……………………………………………………………………….. 30
Creditability Establishment ………………………………………………………… 32
v
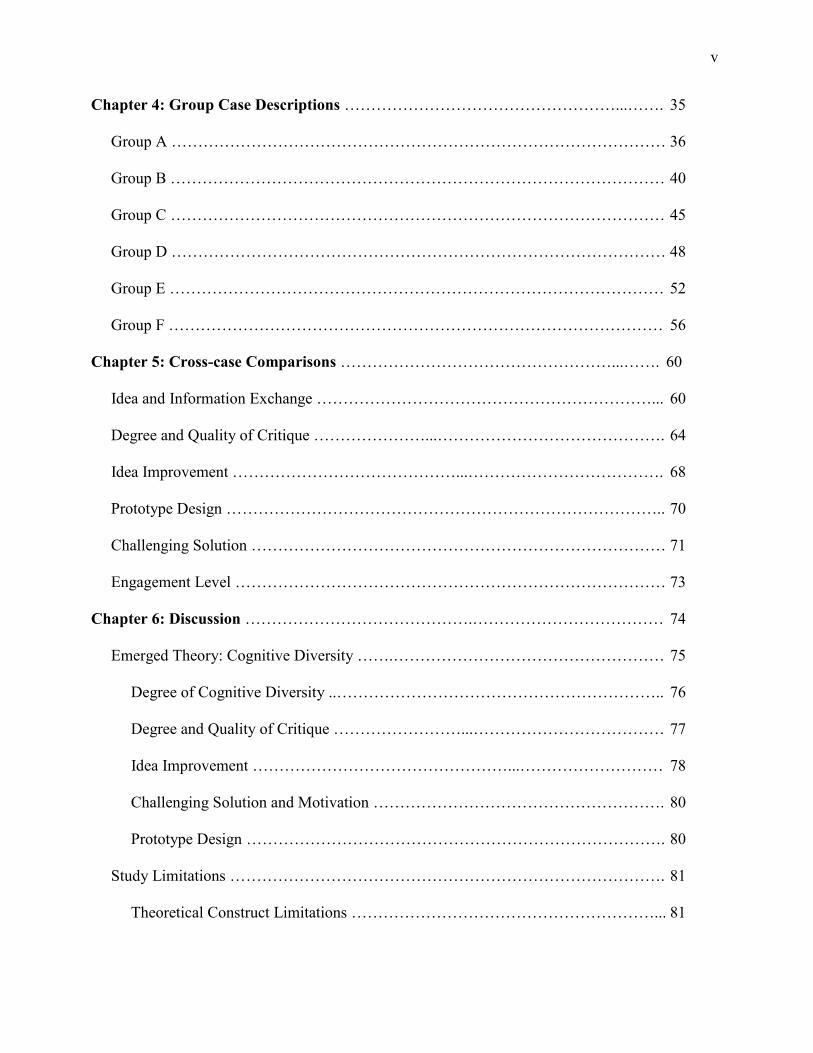
Chapter 4: Group Case Descriptions ……………………………………………...……. 35
Group A ………………………………………………………………………………… 36
Group B ………………………………………………………………………………… 40
Group C ………………………………………………………………………………… 45
Group D ………………………………………………………………………………… 48
Group E ………………………………………………………………………………… 52
Group F ………………………………………………………………………………… 56
Chapter 5: Cross-case Comparisons ……………………………………………...……. 60
Idea and Information Exchange ………………………………………………………... 60
Degree and Quality of Critique …………………...……………………………………. 64
Idea Improvement ……………………………………...………………………………. 68
Prototype Design ……………………………………………………………………….. 70
Challenging Solution …………………………………………………………………… 71
Engagement Level ……………………………………………………………………… 73
Chapter 6: Discussion …………………………………….……………………………… 74
Emerged Theory: Cognitive Diversity …….…………………………………………… 75
Degree of Cognitive Diversity ..…………………………………………………….. 76
Degree and Quality of Critique ……………………...……………………………… 77
Idea Improvement …………………………………………...……………………… 78
Challenging Solution and Motivation ………………………………………………. 80
Prototype Design ……………………………………………………………………. 80
Study Limitations ………………………………………………………………………. 81
Theoretical Construct Limitations …………………………………………………... 81
vi
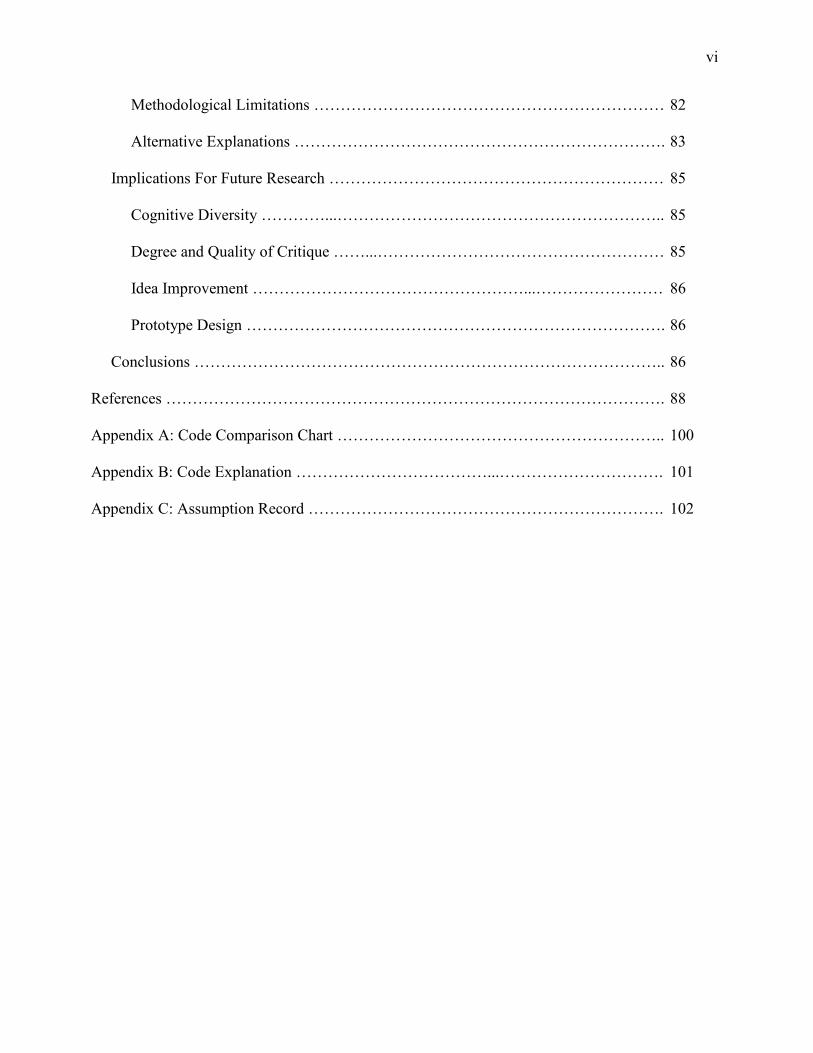
Methodological Limitations ………………………………………………………… 82
Alternative Explanations ……………………………………………………………. 83
Implications For Future Research ……………………………………………………… 85
Cognitive Diversity …………...…………………………………………………….. 85
Degree and Quality of Critique ……...……………………………………………… 85
Idea Improvement ……………………………………………...…………………… 86
Prototype Design ……………………………………………………………………. 86
Conclusions …………………………………………………………………………….. 86
References …………………………………………………………………………………. 88
Appendix A: Code Comparison Chart …………………………………………………….. 100
Appendix B: Code Explanation ………………………………...…………………………. 101
Appendix C: Assumption Record …………………………………………………………. 102
vii
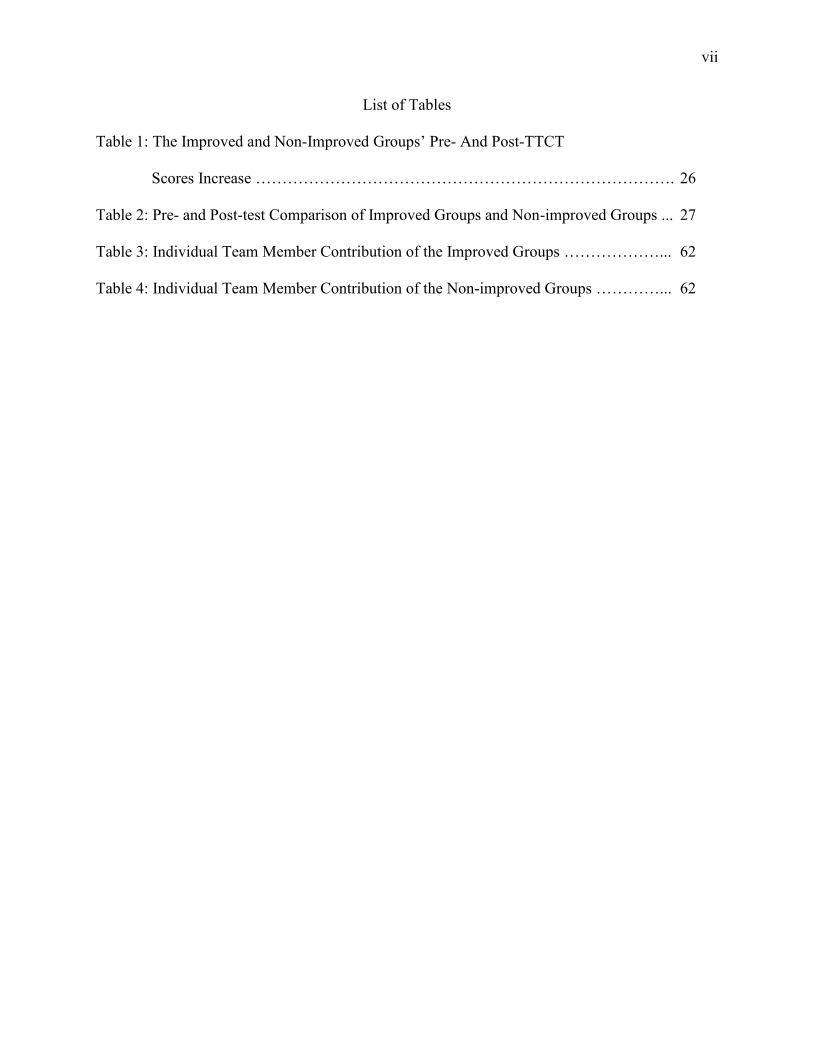
List of Tables Table 1: The Improved and Non-Improved Groups’ Pre- And Post-TTCT
Scores Increase …………………………………………………………………….
26
Table 2: Pre- and Post-test Comparison of Improved Groups and Non-improved Groups ... 27
Table 3: Individual Team Member Contribution of the Improved Groups ………………... 62
Table 4: Individual Team Member Contribution of the Non-improved Groups …………... 62
viii
List of Figures
Figure 1: The frequency of shared ideas, shared input, and discussion in the analyzed groups ….. 61
Figure 2: The frequency of critiques in the analyzed groups ……………………………………… 64
Figure 3: The frequency of disagreements, critiques, and defending in the analyzed groups …….. 67
Figure 4: The frequency of shared ideas and idea improvement in the analyzed groups …………. 69
Figure 5: Minutes spent for discussing prototype design by the analyzed groups ………………… 71
1
Chapter 1: Introduction
Radical changes have occurred in many industries including information distribution,
customer services, and manufacturing. These changes make it critical that organizations adapt
and innovate. Employee creativity has become a crucial factor for any company to thrive
(Amabile, 1996; Zhou, 2003). For this reason, many organizations are seeking to employ
creative individuals (Oldham, 2003; Ramocki, 1994) and are developing training programs
designed to foster employee creativity (Ford & Harris, 1992).
Traditionally, creativity training has emphasized teaching individuals, and previous
studies of creativity have also focused on individual perspectives above group effects (Paulus &
Nijstad, 2003; Sawyer, 2007). In reviewing creativity studies during the 19th century, Becker
(1995) outlined five major study themes: definitions of creativity, characteristics of creative
people, hereditary patterns, application of individual creativity into real life situations, and
creativity training. In the 20th century, researchers also investigated topics such as individual
creativity processes and models, assessing individual creativity, and environmental or contextual
factors that influence individual creativity (Amabile, 1996; Baer & Kaufman, 2006; Mumford,
2003). Henry (2004) summarized that “until recently much of Western psychological thinking
about creativity has assumed that creativity is a quality that emanates from an individual, and
most creativity research has been framed in line with this assumption” (p. 158).
In contrast, recent creativity studies have given increased attention to group creativity—
the ability of a group to produce creative products (Paulus & Nijstad 2003; Pirola-Merlo &
Mann, 2004; Ramocki, 1994). This shift can be partially attributed to the reality that tasks
assigned to employees are increasingly becoming complex, group-oriented, and often require
problem solving and creativity (Hirst, Knippenberg, & Zhou, 2009). In addition, more people
2
now accept that groups can potentially be more creative than individuals (Paulus, Larey, &
Ortega, 1995) because of the collective knowledge, skills, and abilities within the group.
Nijistad and Paulus (2003) stated,
In principle, the knowledge of a collection of individuals is larger than the
knowledge of one individual, and the set of skills and abilities possessed by the
group is larger than the set of skills and abilities possessed by an individual group
member. One could therefore argue that groups have creative potential: because
individual knowledge, skills, and abilities are combined, the group has the
potential to be more creative than its separate members. (p. 327)
Other scholars have documented how breakthrough innovations have in the past resulted
from group collaboration (Sawyer, 2007; Warren & Biederman, 1997) and how prominent
scientists, such as Albert Einstein and Marie Curie, and artists, such as Pablo Picasso and Claude
Monet, were consistently exchanging ideas and working with others (John-Steiner, 2000).
Looking at 40 global companies in five industries, Linder, Jarvenpaa, & Davenport (2003)
reported that most of those companies’ innovations resulted from working extensively with
external sources (i.e., customers, research companies, business partners, and universities etc.).
Such collaboration took place in all phases of their innovation process, from problem
identification to product maintenance.
Despite the recent emphasis on group creativity, there is a shortage of scholarship in this
area (Montuori & Purser, 1999; Pirola-Merlo & Mann, 2004; Taggar, 2002). Nijstad and Paulus
(2003) outlined several future research topics including research into the relationship between
group and individual creativity. This knowledge is critical to understanding the mechanism of
group creativity built on the knowledge, skills, and abilities of the group members. Without such
3
collective knowledge and abilities, “the group task cannot be accomplished and group creativity
would not be possible” (Nijstad & Paulus, 2003, p. 326–327).
Regarding this relationship between group and individual creativity, some researchers
have proposed that group collaboration may improve the individual creativity of its members.
For example, exposing group members to the diverse knowledge, values, and perspectives that
other group members bring to a group could have positive impacts on individual creativity
(Hinsz, Tindale, & Vollrath, 1997; Milliken, Bartel, & Kurtzberg, 2003). Also, having more
knowledge and problem solving skills in a group may provide opportunities for group members
to learn from others, thus acquiring new knowledge and skills to improve their own creative
performance (Zuckerman, 1977; Bloom & Sosniak, 1981). However, there is a lack of empirical
studies to support these theories (West, 2009).
In order to further understand the impact of group interactions on individual creativity, I
conducted a study previous to this dissertation project. This previous study investigated the
impact of group collaboration on the improvement of individual creative thinking abilities of
university students who participated in a one-week group innovation/creativity-training program
called the Innovation Boot Camp (IBC). In the 2009–2010 school year, approximately 120
students (30 groups) participated in the IBC. The IBC required participants to team up with 3 to
5 students from various majors, and each team was asked to work together to design an
innovative product. To assess the changes in creative thinking ability during engagement in the
IBC, the Torrance Tests of Creative Thinking, figural version (TTCT), was given to the
participants before and after the IBC. A little over 70 percent of participants completed both the
pre- and post-TTCT. One of the interesting patterns from the results was that a creativity test
score improvement occurred on a group basis. In other words, after reviewing the average TTCT
4
score increase of all the IBC teams, I found six teams that increased their scores by more than 16
points (approximately one standard deviation). I also found six teams that increased their score
by 5 points or less. A statistical significant difference was found in the mean difference between
those two groups (p < .001). These findings are further discussed in Chapter 3, as they enlighten
the methodologies used in the study in this report.
Built on the results of my previous study (or of my pilot sutdy), this dissertation
investigated why group collaboration only improved individual creativity of some groups but not
others (or of certain groups). The dissertation addressed the following questions:
1. What are the unique characteristics, qualities, and processes of the groups that provide
collective influence upon improving the individual creativity of the group members?
2. Based on the factors identified in the previous question, what theories could describe the
relationship between group interactions and improved individual creativity?
To answer these two questions, I utilized qualitative video analysis to investigate the
characteristics, qualities, and processes (and subsequent theory) that can be used to explain why
some groups provide significantly more impacts on individual creativity than other groups.
5
Chapter 2: Literature Review
The main purpose of this study is to investigate the impact of group collaboration on
improving the creative thinking ability of group members. In this chapter, I propose a
framework for explaining how groups can influence the individual creativity of the group
members. I first define creative thinking ability by differentiating it from creative products and
innovation. I then provide theoretical arguments to explain how group collaboration could
improve individual creative thinking ability. The main argument is based on the different
impacts that group diversity or dynamics can bring to individual team members. First, it could
be argued that different types of diversity within a group, such as ideas, values, and perspectives,
can stimulate creative thinking ability. Second, one’s creative thinking ability could be
improved by acquiring different creative problem solving skills via social modeling. Previous
creativity studies provide some empirical evidence to support these arguments.
Definitions of Creativity
Different researchers have different definitions for creativity, and no one definition will
be accepted by everyone (Ford & Harris, 1992). In addition, creativity is often interchangeably
used with other words, such as innovation. In this research I refer to creativity as creative
thinking ability, which is defined as the cognitive ability to generate novel and unique ideas
(Torrance, 1974).
Early Creativity Research
Earlier creativity researchers emphasized creative abilities and processes when they
defined creativity. Guilford (1950) stated, “Creativity refers to the abilities that are most
characteristic of creative people” (p. 444). Some of these abilities include an ability to connect
different concepts to form a new pattern (Koestler, 1964; Watson, 1928) and to formulate novel
6
solutions to a problem by identifying fundamental features of the problem (Wertheimer, 1945).
One of the most influential models of creative thinking ability is Guilford’s model of divergent
thinking that he used to explain human intelligence (Baer & Kaufman, 2006; Mumford, 2003).
Guilford (1967) proposed the Structure of Intellect theory and identified over 120 specific
testable mental and cognitive abilities (Guilford 1956; Guilford & Hoepfner, 1971). For
Guilford, creativity was a part of the cognitive ability that specializes in producing many unique
and original ideas by investigating and connecting different ideas from multiple information
sources. During the 1960s and 1970s, this conceptualization became so popular that most of the
creativity studies used this or a similar definition of creativity in their studies (Baer, 1993).
Of course, creative thought generation and the ability to effectively develop creative
products are interrelated. In an attempt to explain the factors that influence the production of
creative products, Amabile (1983, 1996) proposed the componential theory of creativity.
According to her theory, creative products are the result of three psychological components: task
motivation, domain-relevant skills, and creativity-relevant skills. Task motivation is an
individual’s intrinsic motivation to do well in specific creativity-required activities. Domain-
relevant skills are the knowledge and technical skills required for a specific domain. Creativity-
relevant skills refer to the cognitive abilities enabling an individual to generate novel and useful
ideas. There are a number of empirical studies providing evidence that individuals who exhibit
high levels of these components produce more creative products than those with low levels.
(Conti, Coon, & Amabile, 1996; Ruscio, Whiteny, & Amabile, 1998).
Successful Creativity Training
Amabile’s model provided a broad framework for understanding factors that influence
the development of a creative product; however, it does not explain what factors influence
7
creativity-relevant skills (creative thinking ability). Creative thinking ability is an essential
component of a creative product, and it is important to understand how to improve this ability.
Most creativity researchers believe that creative thinking ability can be enhanced through some
kind of intervention (Amabile & Tighe, 1993; Stein, 1974; Sternberg & Lubart, 1996). There
have been a number of creativity training programs developed, and studies have been conducted
to determine their effectiveness (Nickerson, 1999). These programs typically focus on how to
improve individual creativity, but these findings can also apply to group creativity. There are
two major approaches typically used to enhance individual creative thinking ability. The first
approach attempts to enhance creativity through stimulation, and the second approach teaches
effective problem solving skills in order to help students generate creative solutions. I will now
describe each of these approaches and how they can be adapted to emphasize the effect groups
can have on individual creativity.
Improving creativity through cognitive stimulation. A number of studies have been
conducted to determine if creative thinking ability can be enhanced through increased cognitive
stimulation. For example, McCoy and Evans (2002) reported that the complex physical
environment could be used to increase creative thinking scores. In the study, 20 high school
students were randomly divided into two groups. One group was placed in a highly decorated,
artistically pleasing environment, and the other group was situated in a simple, low-stimulating
environment. Both groups were then asked to take two different creativity tests, the Torrance
Tests of Creative Thinking (TTCT) and the Making Collages test. The participants who took the
creativity tests in the highly stimulating environment scored significantly higher than the other
group in both tests (p < .001).
8
Ziv (1976) studied the impact of humor in increasing 10th graders’ scores on their TTCT
scores. After completing the pre-TTCT test, the subjects from the experiment group were asked
to watch a funny video, but the control group did not. All participants were asked to take the
alternative post-TTCT test. The researcher found that there were significant differences between
the score increases of the experiment group and control group, possibly indicating that increasing
exposure to humor can improve one’s creativity.
There were other researchers who proposed different ways of stimulating creativity, such
as the use of music (Burns, 1988), hypnosis (Raikov, 1992), and exercise programs (Gondola,
1986). Due to the small sample size of these studies, I cannot say whether these findings are
conclusive; however, they do suggest that creative thinking ability can be enhanced by
stimulation.
Enhancing stimulation through group diversity. Perhaps the most obvious way to
improve stimulation within a group is to increase the diversity of perspectives among group
members (Milliken, Bartel, & Kurtzberg, 2003). Although the exact mechanism is not
explained, there are some researchers who have suggested that having group diversity may
enhance group members’ abilities to perform creative thinking tasks (Austin, 1997; Guzzo &
Dickson 1996; Jackson, May, & Whitney, 1995; McLeod, Lobel, & Cox, 1996).
For example, Watson, Kumar, and Michaelsen (1993) reported that culturally
heterogeneous teams outperformed culturally homogeneous teams on tasks that require the
generation of creative solutions. In the study, 173 upper-level undergraduates (103 men and 70
women) who were enrolled in a business management course at a large university in the
southwestern United States were divided into 36 groups. Seventeen groups consisted of only
white Americans (homogenous groups), and the other 19 groups included ethnically diverse
9
members, including foreign international students (heterogeneous group). These teams worked
together for 17 weeks to complete tasks that required problem solving and creativity. Their
performance was judged by external raters on the range of perspectives shown in evaluating the
number, diversity, and quality of suggestions generated. The heterogeneous groups in this study
were found to be better at using multiple perspectives in evaluating solutions and generating
multiple alternative solutions than homogenous groups.
Similarly, McLeod, Lobel, and Cox (1996) reported that ideas produced by ethnically
heterogeneous experiment groups (composed of Asian, African, and Hispanic) were rated
significantly higher by judges than the homogeneous control groups. Hoffman and Maiser
(1961) found that heterogeneous groups with both males and females of diverse personalities
generated higher quality problem solutions than homogenous groups. In another study, Bantel
and Jackson (1989) showed that financial institutions that introduced innovative products and
services benefited from diverse expertise.
Creativity training based on group diversity. Previous creativity training programs, such
as Osborne’s brainstorming guidelines and synectics, have also utilized group diversity to
stimulate creative ability to the group members. Osborn popularized the term brainstorming in
the 1950s, and his program has become one of the most-used creativity training programs today
(Sawyer, 2007). In his training, he utilized a group to provide diverse ideas and perspectives in
order to stimulate participants’ creativity. Osborn (1963) established four principles of effective
group brainstorming. First, critical evaluation is not allowed until all ideas are generated.
Second, participants are to think of wide and eclectic ideas. Third, participants are to generate as
many ideas as possible. Fourth, combination and improvement of previous ideas often result in
creative ideas.
10
In a typical brainstorming training session, a leader is chosen and he or she presents a
problem that a group is asked to solve. The leader also ensures that the four principles of
brainstorming are followed. Finally, a person is assigned to record all of the ideas. This
approach to brainstorming is still a common practice today with some popular product design
firms, such as IDEO, who have adapted the approach to improve their brainstorming processes
(Sawyer, 2007).
Another creativity training program utilizing groups is synectics. Synectics (a name
meaning the joining of the familiar and unfamiliar) is a program of creativity training developed
by Gordon (1961) to stimulate creative idea generation in a way similar to brainstorming, but
instead through the use of metaphor and analogy. A key characteristic of synectics is the use of a
group so that more analogies can be made by different group members, exposing each participant
to diverse metaphors. Synectics participants are presented with a problem and are taught to use
four different analogy types to evaluate the problem and think of a creative solution. For
example, personal analogy asks participants to use their own experience to describe the problem.
Direct analogy requires participants to use facts of one domain to describe information from
another domain. Symbolic analogy involves visual images used to describe the problem. And
fantasy analogy is the use of fantasy or mythical thinking to conceptualize the problem.
Synectics training takes more time than Osborn’s brainstorming training since it requires
participants to learn how to use analogies to conceptualize a problem and generate solutions.
Synectics also teaches participants how to evaluate and develop ideas into an actual product.
Due to the time demand of synectics, considerably more follow-up studies have been
conducted regarding the effectiveness of Osborn’s brainstorming training programs (Amabile,
1996), and these studies have produced interesting results. Empirical studies of brainstorming
11
training showed that nominal groups (individuals working alone who received the same
brainstorming training) produced more creative ideas than brainstorming groups in quantity and
quality (Diehl & Stroebe, 1987; Stroebe, 1994). For example, Taylor, Berry, and Block (1958)
conducted the first empirical studies to test Osborn’s brainstorming techniques. In a study, after
participants were taught the Osborn’s brainstorming techniques, they were asked to brainstorm
for a period of 12 minutes individually or with a group of four individuals. All individuals who
were asked to generate ideas alone had also participated in group brainstorming. This allowed
for a statistical comparison between individuals and groups. Contrary to Osborn’s belief on the
effectiveness of his brainstorming techniques, the researchers found that individuals produced
almost twice as many different ideas than the groups. The quality of the ideas generated by
individuals was also rated higher than groups. Similar findings have been found in many
subsequent studies (e.g., Jablin, 1981; Milton, 1965; Mullen, Johnson, & Salas, 1991; Street,
1974; Torrance, 1970; Vroom, Grant,& Cotton, 1969;).
However, there are a few limitations to this research, leaving the overall message unclear.
First, group performance is affected by complex social and environmental factors. For example,
studies have shown that group performance is influenced by factors such as team trust,
communication, reaction to conflict, and task processes (Milliken, Bartel, & Kurtzberg, 2003;
Tagger, 2002), and these factors are rarely represented in research studies on group diversity and
creativity. If a group is successfully managing these diverse ideas, perspectives, and work styles,
there may still be conflict, but without limiting creativity. In fact, some studies showed that
groups with a trained discussion facilitator who were in charge of task and decision-making
process performed better than groups without a facilitator. Offner, Kramer, and Winter (1996)
studied the impact of trained facilitator in groups that consisted of 180 undergraduate students
12
who enrolled in psychology classes. Each group had four members. The experiment groups had
trained graduate students that worked as a discussion facilitator, and the control groups were
without a facilitator. The results showed that the groups with the trained facilitators produced
significantly more ideas than the control group (p < .004). Oxley, Dzindolet, and Paulus (1996)
also conducted a very similar study using 200 undergraduate students. The result showed that
the degree of the facilitator’s competency was significantly correlated to the number of ideas
produced by groups. Moreover, groups with highly trained facilitators generated significantly
more ideas than individuals who worked alone (p < .01).
Another aspect that one needs to consider when evaluating the follow-up studies of
Osborn’s brainstorming training is the fact that it emphasized deferring judgment during idea
generation. Some researchers have argued that deferring judgment might not always be effective
since it takes away constructive disagreement and feedback that encourages participants to listen
to others and improve their ideas (Gruenfeld, 1995; Jehn, Chadwick, & Thatcher, 1997). For
example, “If you talk to film directors, you hear that the collision of ideas happens all the time in
the filmmaking. . . . [These ideas] start to collide and in that collision radically new things start to
happen” (Stefik & Stefik, 2004, p. 169-171). Although these collisions are often hard to
manage, they are often necessary for creative thinking. Thus, it is still unclear under what
conditions group diversity can best be utilized to facilitate and improve group creativity.
Improving creativity through learning creative problem solving skills. For many
creativity researchers, creative thinking skills and problem solving skills are closely related
(Feldhusen & Treffinger, 1986; Guilford, 1964; Mumford, Connelly, Baughman, & Marks,
1994;). Newell, Shaw, and Simon (1962) have conceptualized creativity as “a special class of
problem-solving activity characterized by novelty, unconventionality, persistence, and difficulty
13
in problem formulation” (p. 66). There are various models of creative problem solving, and
generally these models include steps or phases related to finding a problem, defining a problem,
producing possible solutions to the problem, and evaluating the solution (Nickerson, 1999).
Most of these training programs have shown to increase creativity test scores (Rose & Lin,
1984). Also, there have been a number of studies that have found social modeling to be
correlated with successful individual creative performance (Bloom & Sosniak, 1981; Samuelson,
1972; Simonton, 1975; Zuckerman, 1977). Although the exact mechanism of social modeling in
improving creativity is not known, it could be possible that creative problem solving skills could
be learned from group interactions through social modeling. In the following section, I will
present the research findings regarding creative problem solving skills and the possible impact of
social modeling of these skills on improving creativity.
Creative problem solving skills. Perhaps the most famous training program of creative
problem solving skills is Creative Problem Solving (CPS) (Baer & Kaufman, 2006), developed
by Osborn and Parnes in 1967. The CPS includes several individual and group techniques used
in Osborn’s brainstorming training to encourage participants to follow specific actions to develop
creative solutions. There are three general steps in the CPS: (1) understand the problem, (2)
generate ideas for solution, and (3) plan for the action (Nickerson, 1999). In the first steps,
participants are taught how to explore problems, gather data, and define the problem. In the
second step, participants use the obtained data to generate different solutions for the problem.
Then in the final step, participants develop their final solutions and evaluate if the solution can
be accepted by the target audience. The CPS encourages participants to adapt, magnify,
substitute, or combine different ideas to come up with creative ideas.
14
There are other problem solving training programs designed to improve creativity, such
as the Productive Thinking Program (PTP) (Covington et al., 1974) and the Purdue Creativity
Training Program (PCTP) (Feldhusen, Treffinger, & Bahlke, 1970). Similar to the CPS, the PTP
and the PCTP present problems, and participants use outlined techniques or steps to produce
unique solutions.
A number of studies have been conducted investigating the effectiveness of these creative
problem solving programs (Scott, Leritz, & Mumford, 2004). For example, Reese, Parnes,
Treffinger, and Kaltsounis (1976) conducted a two-year study with 627 college students to
investigate the effectiveness of the CPS program in improving the creative ability of college
students. The researchers administered their own creativity test at the beginning and end of a
semester where half of the participants enrolled in a creativity training course for 17 weeks.
They found that the creativity training did not impact the participants’ memories and evaluation
abilities, but it did have a statistically significant impact on improving their divergent and
convergent thinking abilities.
In another study, Fontenot (1993) gave an 8-hour creativity training similar to the CPS to
34 employees whose jobs particularly required creativity. Participants completed the same
barrage of tasks such as analyzing a case study, finding a problem, evaluating the problem, and
generating solutions both before and after their training. When compared to a control group,
Fontenot found the participants significantly increased their scores on how many and the variety
of the solutions they generated.
Finally, Rose and Lin (1984) meta-analyzed nearly 100 studies of creativity training on
problem solving skills and reported that most creative problem solving training programs were
moderately effective in improving creative thinking test scores, and the CPS program showed the
15
highest percentage of variance accounting for score improvement (approximately 40 percent).
The variance of other training programs ranged between 11 percent and 28 percent.
Social modeling. Although group members might not explicitly teach creative problem
solving skills to each other, they could demonstrate different problem solving skills to other
group members through social modeling. Social modeling is closely associated with social
learning theory, which emphasizes that learning occurs within a social context (Bandura, 1977;
Vygotsky, 1978). Bandura (1977, 1986) proposed the model of reciprocal determinism to show
how behavior is influenced by personal as well as environmental factors. From this point of
view, learning is the result of interactions between the person and the environment. Observation,
imitation, and modeling are specific kinds of interactions that take place between a person and
the environment. Children learn how to play a certain game by observing their parents or peers.
Athletes can improve their abilities by incorporating skills from other successful athletes. Even
behavior, such as aggression, can be learned through social modeling (Bandura, Ross, & Ross,
1961).
Bandura (1977) proposed four necessary conditions for successful social modeling: (1)
Attention—the observer needs to pay attention to the modeled behavior, (2) Retention—the
observer must remember the modeled behavior, (3) Motor Reproduction—the observer needs to
be able to replicate the modeled behavior, (4) Motivation—the observer must be motivated to
learn the modeled behavior. These four conditions would also conceivably apply to individual
members learning new creative solving skills from other members. Simply being in a group does
not result in successful social modeling. Rather, members of the group must be motivated to
learn new skills, pay attention to how others conceptualize and solve the problem using different
16
approaches, and remember and incorporate new creative problem solving skills into their own
cognitive activities.
There have been several studies demonstrating how social modeling could impact
creativity. Bloom and Sosniak (1981) interviewed more than 120 individuals who achieved
international success in several professional fields such as piano performance, sculpting,
mathematics, neurology, and Olympic athletic competition. The researchers first asked the
experts in each field to nominate exceptionally accomplished individuals who were awarded
international awards or won international competitions, which produced 120 nominated
individuals. All of the nominees were younger than 35 at the time of the interview. Their
parents and mentors were interviewed as well. The researchers concluded that there was
evidence that those individuals with exceptional professional success had close associations with
people who had similar success in their respective fields and who had provided a model for
them.
In another study, Zuckerman (1977) studied 92 recipients of the Nobel Prize between
1901 and 1972. She interviewed 41 of the Nobel laureates and analyzed others through archival
records and interviews with their close associates. She found that social modeling of mentors
who had also achieved high-level success was greatly influential. For example, more than half
of the Nobel laureates were trained by or had a close association with other Nobel laureates when
they were graduate students or young post-doctorate researchers. According to one of
Zuckerman’s study participants, modeling of his mentor helped him see “how they operate, how
they think, and how they go about things” (p. 122).
There are also several empirical studies that have examined the positive impact of
modeling on creativity tests (Amabile, 1996). Mueller (1978) used one figural and one verbal
17
task from the Torrance Tests of Creative Thinking to assess the creative thinking ability of 120
female undergraduate students. They were first asked to complete the verbal task form of the
TTCT test and then the experiment group watched a live model of highly creative test responses
of the figural TTCT form while the control group watched a model of uncreative responses.
Both groups then took the figural form of the TTCT. The results showed that the experimental
group significantly improved their scores, but the control group decreased their scores.
In another study, 84 fourth and fifth graders were used to measure the impact of modeling
on the Unusual Uses for Cardboard Boxes Test from the Torrance Tests of Creative Thinking
(Belcher, 1975). The participants were divided into four groups: Group 1 watched a film of a
model demonstrating highly creative responses; group 2 watched a film of a model
demonstrating non-creative responses; group 3 watched a film providing instruction on how to
make creative responses; and group 4 did not watch any film. When pre- and post-test scores of
all groups were analyzed, both groups 1 and 3 improved their scores significantly more than the
other groups; however, the difference was the greatest between groups 1 and 2, indicating that
observing the creative responses had a large impact on the participants’ performance on the
creative thinking test.
There are other empirical studies that have produced similar results (e.g., Gary & Glover,
1975; Harris & Evans, 1973). These studies only measured how modeling of creative test
responses influenced how participants performed on the same test. However, this could also
simply be a reflection of “gaming the test” as participants observe desirable answers for the
assessment, without necessarily improving their creative thinking overall. Therefore, these
findings cannot confirm that real-life social modeling in specific disciplines can increase creative
potential; however, it does suggest that it is possible, pending further research.
18
Summary of the Literature
In this chapter I have reviewed the research on the development of individual creativity,
focusing on the importance of two key characteristics often present in effective creativity
training programs: (1) increased cognitive stimulation and (2) training or modeling of effective
creative problem solving skills. I then presented suggestions for how these principles could be
applied to creative groups, positing that (1) increasing the diversity of a group can provide
increased stimulation for creative thinking and (2) social modeling and mentoring of effective
creative problem solving can mentor other group members into adopting these positive traits.
However, these studies rarely have been conducted in group settings, where the complex group
dynamics can be taken into account. In addition, it is easy to find alternative examples where
group collaborations have not improved creative thinking ability. Thus, it appears that individual
creative thinking ability might best be improved by effective group collaboration in which a wide
range of values, ideas, perspectives are shared and understood in a group, and different problem
solving skills are demonstrated and modeled by group members. Future research is needed to
describe what aspects of an effective group might impact individual creative thinking abilities,
and provide examples and case studies of this relationship between group processes and
creativity in practice.
19
Chapter 3: Methods
The purpose of this research was to investigate the potential impact of group
collaboration on individual creative thinking ability and to generate theories that can explain the
positive impact. I have selected the Innovation Boot Camp (IBC) taught by the college of
technology at Brigham Young University as the study site. As stated previously, the research
questions encapsulated in this research are
1. What are the unique characteristics, qualities, and processes of the groups that provide
collective influence upon improving the individual creativity of the group members?
2. Based on the factors identified in question two, what theories could describe the
relationship between group interactions and improved individual creativity?
Research Design
As mentioned previously, a study was conducted previous to this project that revealed
some groups improved their average creativity test scores, but not all groups that participated in
the IBC improved. In this study, I employed a qualitative case study design to compare the
experiences of groups that improved their test scores dramatically and those that did not. To
identify my case studies, I selected three groups that significantly improved their creativity test
scores after the IBC and three groups that did not. I analyzed video recordings of these groups’
interactions following principles and techniques borrowed from grounded theory analysis (Glaser
and Strauss, 1967). In the following sections, I first describe the design and context of the
Innovation Boot Camp, including the instructional strategies employed, and provide a
description of the participants. I then describe the two studies conducted as part of this
overarching research process. First, the quantitative analysis conducted prior to this dissertation
that identified three groups that had dramatic creativity score increases and three groups which
20
did not; and second, the qualitative case study analysis that is the subject of this dissertation. I
conclude this chapter with a discussion of the qualitative data collection and analysis
methodologies employed, in addition to the strategies used to strengthen the trustworthiness of
the results.
Innovation Boot Camp
BYU’s College of Technology designed and implemented the Innovation Boot Camp
(IBC) in 2008 to help technology and engineering undergraduate students improve their ability to
be innovative. The IBC has existed in various forms, but during this study it was a concentrated
one-week training session that taught innovation principles based on ideas from major design
firms like IDEO and the Institute of Design at Stanford University. The IBC required students to
team up with students from various majors. Each group had 3-5 members working together to
develop innovative solutions to common problems found on a university campus (e.g. cluttered
spaces, congested areas, inconveniences, and common annoyances). The effort was made to
place students with others from a variety of majors in a team in order to increase team diversity
within a team.
Each team was encouraged to come up with highly useful and novel product ideas, and
not to worry about technological or economical restrictions. Also, throughout the IBC, the
instructor and TA frequently visited each team to provide feedback on their group activity and to
help them improve their creative ideas. In some sessions of the IBC, there were more than one
TA, but generally there was one instructor and one TA. There was no instruction given to TAs
regarding what they should do and should not do while helping the IBC teams, and they
frequently interacted with groups as an additional member of the team, suggesting ideas and
potential solutions.
21
At the beginning of a training session, participants were shown an inspirational video
about the collaborative design process of a famous product design firm, IDEO. Then each team
was asked to come up with their team name using only the letters in the names of the team
members. They were also asked to create a physical object representing the team. The whole
class evaluated the names and objects created by each team to determine the team with the most
unique and memorable name.
The IBC instructor then taught the five stages of an innovation process: inspiration,
synthesis, ideation, experimentation, and communication. In the inspiration stage, participants
were taught the importance of observing, experiencing, and inquiring what people do in their
daily lives, and paying attention to what could be improved. During this stage, participants were
asked to go out on the BYU campus to explore and observe people’s compensatory behavior, or
those actions that people do to compensate for the lack of a desired functionality. Using a
trashcan to keep a door open is a good example of a compensatory behavior.
In the synthesis stage, participants were taught how to organize, simplify, and clarify the
findings from their observation. They were asked to look for patterns in the collected
compensatory behavior and categorize them based on the patterns. They were also asked to
generate the problem statements of their three favorite compensatory behaviors.
In the ideation stage, they were taught four techniques for generating ideas to solve the
problems. Attribute listing was the first technique. This technique required participants to list
physical attributes of their favorite problem. Analyzing and listing attributes was supposed to
help them understand the nature of the problem better and identify possible solutions. The
second technique was called SCAMPER. SCAMPER stands for substitute, combine, adapt/alter,
magnify/minify, put to another use, eliminate, and rearrange/reverse. This technique is a part of
22
Creative Problem Solving training (Nickerson, 1999). Participants were asked to use this
acronym to modify certain attributes and functions of the compensatory behavior. The third
technique was random association, where participants were asked to make connections between
their problem and four random occupations (i.e., bakers, riot officers, pilots and mechanics). The
main purpose of random association was to provide opportunities for the participants to look at
the problem from four radically different perspectives and to generate solutions using these
perspectives. The last technique that participants learned was direct association. Using this
technique, participants were asked to think about various existing objects that could be used to
solve their problem. They were then encouraged to extract the best features from those objects
and use those features to generate solutions.
In the experimentation stage, they were asked to create a prototype of their selected
solution. Finally, in the communication stage, they were taught principles of effective product
presentations, and participants presented and described their prototype to the class, where they
were judged by their peers.
At the end of the first day in the boot camp, each team was asked to use the process
learned during the IBC with the same team to produce another prototype of their innovative
solution during the upcoming six days. At the end of sixth day, each team presented their work
with their prototype to be judged again by their instructors and peers.
Participants
In the 2009–2010 school year, approximately 120 students (30 groups) participated in the
IBC. Participants were from one of the following majors: manufacturing mechanical
engineering, industrial design, technology engineering education, and information technology.
They were all in their junior or senior year as undergraduate students. Ages of the participants
23
ranged from 19–35; however, most of them were between 22–28 years old. Approximately 13
percent of the participants were female, and 87 percent were male. Also, approximately 29
percent of the participants majored in information technology, 54 percent majored in
manufacturing engineering technology, 11 percent majored in technology engineering education,
and 2 percent major in some other majors such as business management and chemical
engineering.
Previous Quantitative Study
As stated previously, the quantitative portion of the study was conducted prior to this
dissertation project. I will now explain the instrument used to measure creativity, data collection
methods, and finding from the statistical analysis.
Creativity assessment. To assess the changes in creative thinking ability during
engagement in the IBC, I used the Torrance Tests of Creative Thinking, figural version (TTCT).
The TTCT is the most influential test of creativity (Amabile, 1996; Baer & Kaufman, 2006).
Torrance and Presbury (1984) reported that the TTCT were used in approximately 75 percent of
all published creativity studies with K–12 students, and 40 percent of all studies with college
students and adults.
In the TTCT figural test, participants are asked to sketch and explain different objects in
response to visual stimuli presented in the test (e.g., circles, lines, abstract drawings) within
restricted time limits. Developed from Torrance’s research on creativity and previous theoretical
work by Guilford (1967), the TTCT measures the following components of creativity: (1)
fluency, the ability to generate large numbers of meaningful ideas, (2) originality, the ability to
produce ideas that are statistically infrequent in the normative population (used less than 5
percent of the time), (3) elaboration, the ability to add details to one’s ideas, (4) resistance to
24
premature closure, the ability to maintain an open and flexible mindset, and (5) abstractness of
titles, the ability to think abstractly about concepts. The TTCT also assesses other minor aspects
of creativity, such as unusual visualization, storytelling articulateness, and fantastical imagery.
These minor aspects are called creative strengths. A human scorer scores the five components of
creativity and creative strengths in a participant’s test according to detailed instructions and after
receiving proper training.
Past studies have shown reasonable validity and reliability of the TTCT. Kim (2006)
summarized Torrance’s 7-, 12-, 22-, and 40-year longitudinal studies that showed significant
correlation between the TTCT scores and individual creative achievement. The 7-year follow-up
study of 46 subjects who took the TTCT during high school indicated that the TTCT scores were
significantly correlated with their creative performance later in life at the .01 level (Torrance,
1972). The significant correlation ranged from r = .39 to .48. The follow-up study of 236 high
school students after 12 years generated the similar results (Torrance, 1972). The 22-year
follow-up study of 211 subjects who took the TTCT during elementary school produced multiple
correlation coefficient of .63 and it was significant at the .001 level (Torrance, 1981). Finally,
the follow-up study of 99 elementary school students after 40 years also indicated significant
correlation between the five components of creative thinking identified by Torrance and their
creative achievements in life. The significant correlation ranged from r = .29 to .90 at either the
.05 or .01 level. Yamada and Tam (1996) and Plucker (1999) have reanalyzed the Torrance’s
data and concluded that the TTCT score is a reliable predictor for adult creative achievement.
Gonzales and Campos (1997) reported that the TTCT was significantly correlated to two other
creativity tests, the “Spatial Test of Primary Mental Abilities” and the “Gordon Test of Visual
Imagery Control.” These results provide some evidence for predictive and concurrent validity.
25
According to the TTCT instructor manual (1998), internal consistency of the TTCT using
a KR-21 calculation ranged from .89 and .94. Kim (2006) reported that inner-rater reliability
was consistently greater than .90. Trentham (1975) and Kim (2006) reviewed several studies
regarding the test-retest reliability of the TTCT and indicated that the test-retest reliability
coefficient ranged from .50 to .93, but the most common range was between .60 and .80.
Additionally, several studies have shown that the TTCT scores can be significantly increased
shortly after the introduction of independent variables, such as an 8-hour creativity training
(Fontenot, 1993) and comedy videos (Ziv, 1976). However, because of the lack of the TTCT’s
consistency in producing high test-retest reliability, Treffinger (1985) indicated that the TTCT
should not be used to determine the absolute creativity level of individuals, but is appropriate for
academic research purposes. Despite some criticism, the TTCT appears to be the best available
test for measuring individual creative thinking ability.
Data collection. In the IBC, each participant was asked to complete two alternative, but
equivalent, forms of the Torrance Tests of Creative Thinking (TTCT). They were asked to take
one form of the TTCT before the IBC, and they took another form after the IBC. Although all
participants were invited to take the tests, only 86 participants (72%) completed both tests. Two
graduate students were trained to score the tests. The inter-rater reliability coefficient of the two
students was acceptable at .893 (p < .001).
Data analysis and results. As stated in the introduction, it is highly unlikely that all team
interactions will have a positive impact on individual creativity; however, some groups will
interact and collaborate better than others. This positive team interaction was the main factor
investigated in this study. Therefore, a quantitative analysis was conducted to determine whether
some boot camp groups provided significantly more collective influence on individual creativity
26
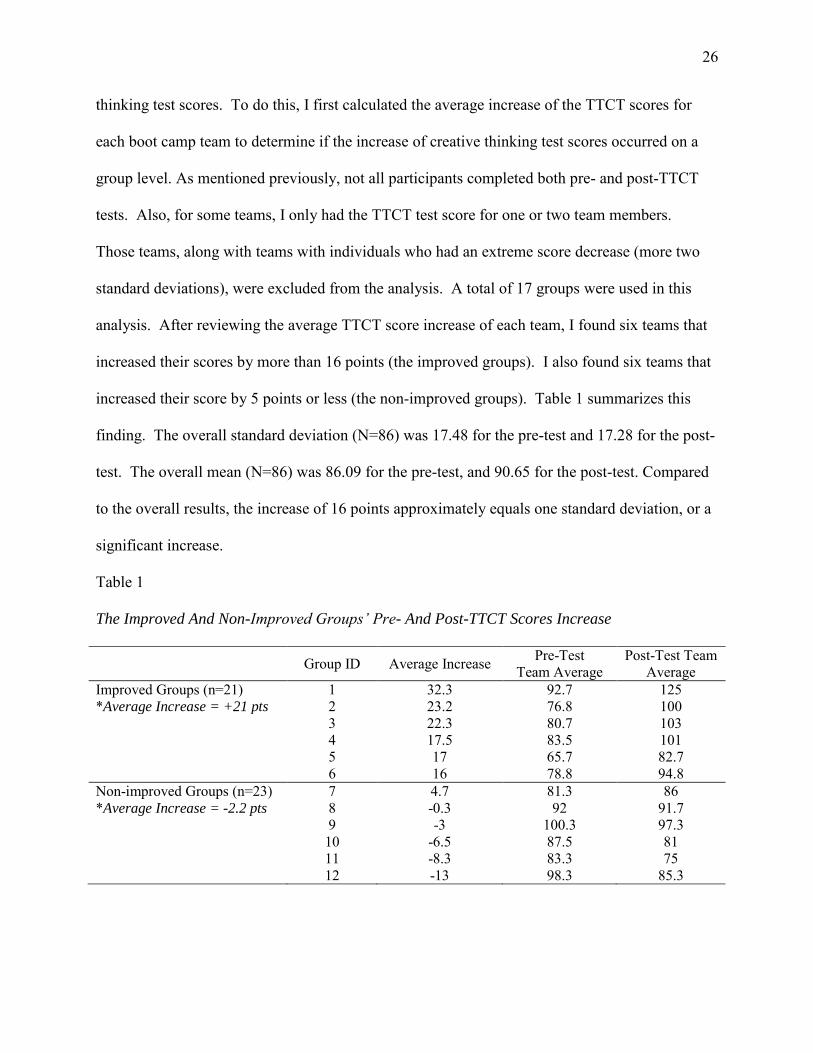
thinking test scores. To do this, I first calculated the average increase of the TTCT scores for
each boot camp team to determine if the increase of creative thinking test scores occurred on a
group level. As mentioned previously, not all participants completed both pre- and post-TTCT
tests. Also, for some teams, I only had the TTCT test score for one or two team members.
Those teams, along with teams with individuals who had an extreme score decrease (more two
standard deviations), were excluded from the analysis. A total of 17 groups were used in this
analysis. After reviewing the average TTCT score increase of each team, I found six teams that
increased their scores by more than 16 points (the improved groups). I also found six teams that
increased their score by 5 points or less (the non-improved groups). Table 1 summarizes this
finding. The overall standard deviation (N=86) was 17.48 for the pre-test and 17.28 for the post-
test. The overall mean (N=86) was 86.09 for the pre-test, and 90.65 for the post-test. Compared
to the overall results, the increase of 16 points approximately equals one standard deviation, or a
significant increase.
Table 1 The Improved And Non-Improved Groups’ Pre- And Post-TTCT Scores Increase
Group ID Average Increase Pre-Test Team Average
Post-Test Team Average
Improved Groups (n=21) 1 32.3 92.7 125 *Average Increase = +21 pts 2 23.2 76.8 100 3 22.3 80.7 103 4 17.5 83.5 101 5 17 65.7 82.7 6 16 78.8 94.8 Non-improved Groups (n=23) 7 4.7 81.3 86 *Average Increase = -2.2 pts 8 -0.3 92 91.7 9 -3 100.3 97.3 10 -6.5 87.5 81 11 -8.3 83.3 75 12 -13 98.3 85.3
27
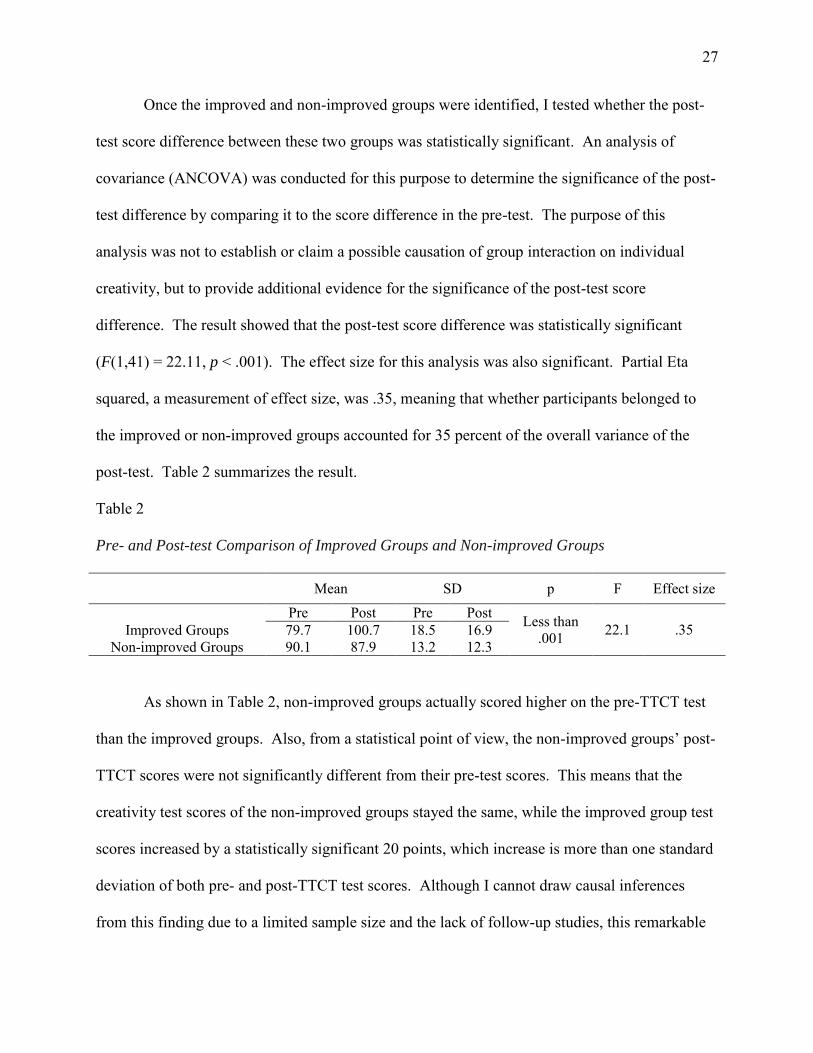
Once the improved and non-improved groups were identified, I tested whether the post-
test score difference between these two groups was statistically significant. An analysis of
covariance (ANCOVA) was conducted for this purpose to determine the significance of the post-
test difference by comparing it to the score difference in the pre-test. The purpose of this
analysis was not to establish or claim a possible causation of group interaction on individual
creativity, but to provide additional evidence for the significance of the post-test score
difference. The result showed that the post-test score difference was statistically significant
(F(1,41) = 22.11, p < .001). The effect size for this analysis was also significant. Partial Eta
squared, a measurement of effect size, was .35, meaning that whether participants belonged to
the improved or non-improved groups accounted for 35 percent of the overall variance of the
post-test. Table 2 summarizes the result.
Table 2
Pre- and Post-test Comparison of Improved Groups and Non-improved Groups
Mean SD p F Effect size Pre Post Pre Post Less than
.001 22.1 .35 Improved Groups 79.7 100.7 18.5 16.9 Non-improved Groups 90.1 87.9 13.2 12.3
As shown in Table 2, non-improved groups actually scored higher on the pre-TTCT test
than the improved groups. Also, from a statistical point of view, the non-improved groups’ post-
TTCT scores were not significantly different from their pre-test scores. This means that the
creativity test scores of the non-improved groups stayed the same, while the improved group test
scores increased by a statistically significant 20 points, which increase is more than one standard
deviation of both pre- and post-TTCT test scores. Although I cannot draw causal inferences
from this finding due to a limited sample size and the lack of follow-up studies, this remarkable
28
improvement for the groups scoring the lowest on the TTCT warrants further investigation.
Understanding the interactions and processes within these improved groups can inform us
regarding what aspects of group collaboration might potentially improve individual creativity,
particularly for the least creative teams.
Qualitative Study
The quantitative analysis of the TTCT scores revealed that there were certain groups who
increased their average TTCT scores significantly more than the other groups. From this result, I
hypothesize that those groups who improved their TTCT scores experienced positive group
interactions than the groups who did not increase the scores. To further investigate this
hypothesis and to generate theories to explain why group collaboration might help individuals
improve their creativity scores, I conducted qualitative analysis of their group interactions which
were video recorded during the IBC. Grounded theory methods are accepted qualitative methods
for generating theories (Strauss & Corbin, 1997). I will now briefly provide an overview of
grounded theory methodology and explain the data collection and data analysis methods used in
the study.
Grounded theory overview. In 1967, Glaser and Strauss published The Discovery of
Grounded Theory (Glaser & Strauss, 1967). According to the authors, studies in social science
had been solely focused on testing theory, but largely neglected the importance of discovering
theory from research data. Thus the main purpose of grounded theory was to provide a
systematic research methodology to help researchers discover theories from their data.
Grounded theory methodology differs from conventional scientific research methods. In
grounded theory, the researcher is encouraged to avoid preconceived ideas. This means that
extensive literature reviews of related studies and formation of hypotheses is usually discouraged
29
at the beginning of the study (Dey, 1999). This is because most grounded theorists believe that
researchers do not know exactly what they are looking for, and their views are often biased by
their preconceived notions (Charmaz, 2002). The grounded theory methodology encourages
researchers to start a study with a general topic, and as the study moves along and theories start
to emerge, they can narrow the study’s focus.
Sampling procedures are also different in grounded theory. In conventional scientific
studies, a sampling decision usually comes before data analysis. In grounded theory, the
researcher first selects a study site for the study based on a general, broad study direction. The
researcher then begins collecting data without identifying specific research questions and
sampling procedures. As data is gathered, the researcher analyzes the data using grounded
theory methodology. Based on emerging themes of the study, the researcher further defines
research questions and sampling population, and purposefully selects participants. Glaser and
Strauss (1967) called this sampling method “theoretical sampling” as oppose to random sampling
generally used in typical scientific research. Dey (1999) explains that theoretical sampling has to
be flexible and should adapt to emergent theories.
In grounded theory, data analysis starts as soon as the first data becomes available. The
purpose of data analysis in grounded theory is to identify concepts or categories that inform the
nature and structures of the phenomenon under study. As more data are acquired, old and new
categories are constantly compared and emerging theories are continuously modified. This
constant comparison allows researchers to further understand their data and shape their theory.
A theory emerging from grounded theory is called a middle-range theory (MRT). Robert
Merton (1957), the respected American sociologist, advocated MRT in his famous book Social
Theory and Social Structure (1957). He argued that social scientists should not obsesses with the
30
formulation and validation of a universal, all-encompassing, grand theory, but they should focus
on testing theories that are useful and practical even without universal generalizability. Glaser
and Strauss (1967) also suggested that theory must “fit the situation being researched, and work
when put into use” (p. 3). Thus, a middle-range theory needs to useful, but it does not need to be
applicable to all situations.
Data Collection. As mentioned previously, approximately 30 groups participated in the
boot camp. In each IBC session, three teams were randomly selected and their team interactions
were video-recorded. A total of 19 teams were video-recorded, but the recordings of two teams
had audio problems. Therefore, there are 17 video recordings available for video analysis. Each
recording is about three hours long, focusing on the moments during their experience that were
most associated with group innovative activity. Typically, the videos were of the first day IBC,
as it was difficult to record the teams interacting during the week.
Data Analysis. In the previous section, I stated that there were six groups that
significantly increased the TTCT scores, and six other groups that did not have a significant
increase. Using theoretical sampling (Glaser & Strauss, 1967), I decided to analyze the top three
teams from the improved groups and the bottom three teams from the non-improved groups. I
had the video recordings of the bottom three teams, but due to various recording problems, I
could not use the video recordings of the best and the third best team from the improved groups.
However, the three teams I analyzed in this study all had a significant increase in the TTCT test.
In the following section, I will explain how grounded theory was used in the analysis in this
study.
31
Analysis process. The following grounded theory methodology was used to analyze the
group collaboration in this study: (1) identify categories, (2) identify properties of categories, (3)
conduct selective coding, and (4) identify category relationships.
Step 1: Identify categories. The process used to identify categories—characteristics or
events from research data that might be important for the phenomenon under study—is called
“coding.” In the analysis, I first watched and coded the video recordings of the six teams I
described earlier. Each team’s video recordings were approximately three hours long, but I only
coded team events that involved group collaboration. Therefore, approximately 12 hours of
recordings were analyzed. As I watch these videos, I described and recorded team interactions in
detail. Any thoughts, ideas, and categories emerging from the video observations were also
recorded.
Step 2: Identify properties of categories. Once the categories were identified, I defined
category properties. A property of a category provides a conceptual explanation of the category
(Dey, 1999). For example, in the analysis, I identified a category that I call “shared idea.” The
property or explanation of this category was “sharing of product or solution idea with other team
members.”
Step 3: Conduct selective coding. After category properties were defined, I conducted
“selective coding.” Initial coding for this study is called “open coding,” and its main purpose is
to search for new categories. The purpose of selective coding is to validate the categories
identified in open coding (Glaser, 1978). I watched all of the video recordings the second time
to solidify the validity and reliability of the categories. When I identified new categories during
this step, I recorded and included these categories in the category list.
32
Step 4: Identify relationships between categories. After the main categories were listed
and their properties were defined, I identified the patterns (or relationships) between the
categories. Category patterns clarify the relationship or interplay between the categories (Strauss
& Corbin, 1990). In this study, I utilized memo writing and code frequency comparison to do
the pattern or relationship identification. Memo writing is the act of taking and keeping notes or
memos during analysis. Charmaz (2002) stated that memo writing is “the crucial intermediate
step that moves the analysis forward” (p. 687), and it helps researchers identify categories, define
properties, and investigate the category relationship. The code frequency comparison helped
determine what categories were common among the improved groups and non-improved teams.
To do this, I created the code comparison table (see Appendix A). This table summarized how
many categories were coded for each group. Once the differences between these two types of
groups were identified, I asked the following question, “What does this difference inform us
about the impact of group collaboration on individual creative thinking ability?” I generated
theories regarding the relationship between group collaboration and individual creativity while
conducting the category relationship examination. Once a theory was identified, I watched
portions of video recordings that provide information to support the theory in order to validate
the finding.
Credibility establishment. Establishing credibility, or trustworthiness, is a crucial step
in any qualitative research. Regardless of the research types, credibility should be established
“through careful attention to a study’s conceptualization and the way in which the data were
collected, analyzed, and interpreted, and the way in which the findings are presented (Merriam,
1997, pp. 199-200). To make this process easier, Merriam (1997) suggested several methods
33
qualitative researchers could use to establish credibility. Four of her suggestions were relevant
to the study.
1. Peer examination. Colleagues can review and evaluate the quality and truthfulness of
the findings. In this study, 16 percent of the coded segments were reviewed by two other
graduate researchers. These researchers were first asked to independently watch the segments of
the video corresponding to the codes, and code team interactions using the codes provided by the
author. They were also encouraged to find their own themes. The two graduate researchers and
the author then met together to review the author’s codes used in the same segments.
Disagreements in coding were discussed until accordance was reached.
2. Audit trail. Researchers kept track of all of their analysis notes, and an external auditor
can authenticate or audit the record. Dey (1993) stated that, “if we cannot expect others to
replicate our account, the best we can do is explain how we arrived at our results” (p. 251). In
this study, all analysis notes, codes, properties, and relationships were recorded in detail, and I
made those records available for anyone who might have a question about how I reached certain
conclusions (This document is available at https://spreadsheets.google.com/spreadsheet/pub?hl=
en_US&hl=en_US&key=0Arof-RaixS23dEpjdHZyeXpmb2REbWllWmFNSTBUdEE&output
=html).
3. Rich Description. While explaining the findings of the analysis, a researcher can
provide “enough description so that readers will be able to determine how closely their situations
match the [actual] research situation (Merriam, 1997, pp. 211). In this final report, I provided as
much detail as possible so that readers can make this determination.
4. Assumption record. As the researcher conducts analysis, one develops many
assumptions. Those assumptions are not necessarily negative biases; however, being sensitive to

34
those assumptions, and keeping track of them and clarifying them certainly helps researchers not
to be influenced by false assumptions. In this study, I kept track of an assumption record and
provided a description of this effort in an appendix to my report (See Appendix C).
35
Chapter 4: Group Case Descriptions
In this chapter, I will describe how each of the six boot camp groups worked together to
design their products in their first day of the Innovation Boot Camp (IBC). I will explain how
these groups were organized, how they chose a specific problem to work on, how they
collaborated to design their final solution, and other unique characteristics of each team. These
descriptions should provide a context for the readers to better understand the cross-case
comparison of the six groups described in the next chapter.
Each team had a unique team name in the IBC, but here they are referred as Group A, B,
C, D, E, and F. Groups A, B, and C are the groups that improved their TTCT scores (the
improved groups), and groups D, E, and F are the groups that did not improve their TTCT scores
(the non-improved groups). The names of all group members have been changed to aliases. As
stated previously, the morning of the first day of the IBC, participants were taught a series of
general lectures on innovation. The morning session concluded with participant groups going
out to the campus to observe and collect compensatory behaviors. The afternoon of the first day,
the IBC participants were taught how to use various creativity techniques to transform their
compensatory behaviors into innovative products. Such techniques included (1) compensatory
behavior categorization, (2) problem statement generation, (3) attribute listing, (4) the
SCAMPER, (5) random association, and (6) direct association. At the end of the first day of the
IBC, all groups were required to present their product ideas by creating and showing the
prototype of their products. In this report, I will describe the group activities of the afternoon
session of the IBC because most of the group collaboration occurred in the afternoon session. I
will explore the major differences between the improved and non-improved groups in the next
chapter.
36
Group A
Group A consisted of four members: Courtney, Chuck, Jack, and David. For nearly all
the activities, Courtney took a leadership role, providing direction to the team. In general, the
group collaborated without having major conflicts, except for a few occasions where Courtney
and Jack disagreed. For example, in the compensatory behavior categorization activity, Courtney
suggested a few problem categories based on the physical objects used in the compensatory
behaviors they observed (e.g., cars, bikes etc). However, Jack suggested that they could
categorize the behaviors by the locations where they found the behaviors (e.g., a parking lot, bike
rack area). Courtney seemed unhappy about what Jack suggested and she said, “Whatever
organization we use, it doesn’t matter which way to do it,” and she ignored his suggestion. Jack
and Courtney’s disagreements could have created a negative team environment, but because Jack
did not argue back to Courtney’s opinions, the team was able to maintain a positive team
environment where team creativity was not hindered by conflicts between team members.
During the problem statement activity, the team had to select three problems they would
like to work on and define as problem statements. The team talked about different problems, but
they focused mainly on two problems. The first problem was that people were not properly
using a parking rack to park their bikes, so the bike-parking place looked messy or disorganized
(bike parking problem). The second problem was that people were using cup holders in a car to
hold trash, not a drinking bottle (car trash problem). While deciding which problem to choose,
the instructor came and provided his input on the bike parking and car trash problems. He tried
to help the team understand that the compensatory behaviors they chose contained multiple
problems. For example, he told the team that the bike parking problem contained an issue
regarding how to store a helmet, safely lock a bike, and protect a bike seat from getting wet.
37
After this advice, the team further discussed different problems they could choose, but they had
not chosen their problem at the end of the problem statement activity.
At the beginning of the attribute listing activity, Courtney realized that they needed to
select one problem to do the attribute listing. She said, “I think strong problems are maybe bikes
or car. What do you guys think?” But the other team members were still unsure about their final
decision. Then the instructor stopped by and asked the team if they had chosen their problem.
Courtney asked, “Should we pick one?” Noticing that the team was having hard time making a
decision, the instructor said, “You should probably pick one.” He suggested that the team could
pick the bike parking problem. Then he started to list some of the attributes of the bike parking
problem to help the team move forward. Throughout the IBC activities, the instructor helped
Group A in two ways. First, he encouraged the group to make a decision. Second, he helped the
team understand how to use the techniques taught in the IBC. After the instructor left, they
started the attribute listing activity on the bike parking problem.
At the very beginning of the SCAMPER activity, the team did not understand what they
were supposed to do. Courtney started sharing an idea for solution without using the
SCAMPER. First she shared an idea for designing a solution that prevents a bike seat from
getting wet. She said, “What if we had a bike seat that [can] flip [upside down so that] the
surface [of a bike seat] won’t get wet?” David responded, “[It’s] like an umbrella.” Expanding
David’s comment, Jack said, “Actually, it’s kind of a funny idea . . . [but] a little pop-up
umbrella [can be] built on a [bike] seat.” Courtney then expanded Jack’s idea, and said, “What if
we had [an umbrella] that pops up and covers a whole bike?” David and Jack then started to talk
about designing a system similar to a hood of a “winter parka” that could cover an entire bike
when it is raining. It seemed that when one person in the group got an idea, it helped the same
38
person or other persons to generate other ideas by elaborating the original idea. Such incidences
were found at least 13 times during their team collaboration.
As the team continued discussing the ideas, the instructor stopped by and asked the team
if they were doing the SCAMPER activity. Michael said “Yeah . . . I think . . . sort of.”
Realizing that the team was not doing the SCAMPER activity, the instructor started to help the
team come up with different solutions for a bike security problem by using one of the
SCAMPER techniques. This seemed to help Courtney understand how to use the SCAMPER,
and she shared multiple product ideas using the SCAMPER. She shared ideas of taking off
handlebars, collapsing or folding down handlebars into the bike frame, and reconfiguring
handlebars so that it is hard for someone to steal the bike. Understanding what they was
expected, Courtney led the team through the rest of the SCAMPER activity. At the end of the
SCAMPER, Courtney said, “What if the bike rack had a bike lock in it so that you don’t need to
bring [your own] bike lock.” This idea of a bike lock built into something became the
foundation of their final product, but they had not explicitly made their decision on their final
product at this point.
In the next activity (random association), one-on-one help from the instructor was again
key for the team to understand how they could use this technique. At the beginning of the
activity, the instructor demonstrated how the random association could be used; however, these
techniques did not help the team further develop their ideas.
In the direct association activity, the team discussed different personal transportation
products. The team specifically discussed advantages and disadvantages of existing products
such as the Segway, unicycles, roller skates, and scooters. However, both the random and direct
association activities were not helping the team generate ideas, and team members appeared
39
bored. Then David shared an idea by saying, “You just need a button, like the Batmobile, on
your bike to push . . . [and] armors [come up] everywhere [and] no one can steal it.” Although
this idea seemed unrealistic, other team members laughed and started to share other wild ideas.
Chuck said that they could design some mechanism that “if anyone touches [the bike], it will
shock [the person].” After hearing what Chuck said, David said they could have a bike that
“goes invisible.” These wild ideas did not become their final product, but they re-energized the
team.
When the prototype activity started, the team had not decided on the exact product they
wanted to prototype. However, David said, “I like [the idea of] handlebars splitting apart and
locking onto the rest of the bike.” Jack responded, “That’s a cool idea, isn’t it?” Courtney also
liked the idea, and started to draw what she was envisioning on a piece of paper. Having a
physical drawing of their product helped the team further discuss the design of their prototype.
Courtney, Jack, Chuck, and David were all participating in the discussion, and they seemed to
enjoy the process. At one point, Jack excitedly said, “I would say we just got a billion dollar
idea. We should do business together.” In the end, they decided to build a wire lock into the
handlebars.
During the prototyping process, David played the crucial role of providing the
constructive feedback that helped the team design a more realistic product. He pointed out the
problem of the weight and length of the wire lock and how the lock could realistically be stored
inside the handlebars. The team was not exactly sure about the specifications of the actual
handlebars, so they went outside to measure a bike so their prototype would be more realistic.
David’s attitude of being precise and realistic pushed the team to think hard about what they
were designing and encouraged the team to have additional discussions about their product.
40
Besides occasional disagreements between Courtney and Jack over how to conduct their
tasks, Group A worked well as a team. There were a few times when team members seemed
tired and discussion waned. However, someone sharing a creative or exciting idea always
energized the team and other members elaborated on the ideas. Finally, David’s desire to make a
realistic prototype helped the team challenge itself in creating a prototype. Because of David,
other team members noticed various design problems and they were able to think about possible
solutions. As a result, their product was much more creative and realistic.
Group B
Group B consisted of Brian, Sarah, Brad, Wally, and Kyle. During the compensatory
behavior categorization activity, only Brad, Kyle, and Sarah were working together to print
pictures of the collected compensatory behaviors and categorize them into categories. Brian and
Wally were sitting by the table, occasionally talking off topic.
Brad took the leadership role in Group B as the problem statement activity started.
During this activity, Kyle pointed out that the wheelchair problem—how a disabled person was
carrying a backpack—was an interesting problem. Sarah expressed her interest in working on the
headphone problem they found at the university library’s media center. The main problem with
the headphones in the library media center was that they had a cheap cover to protect the
headphone pads from wearing out. The covers were also there for sanitation reasons, but the
team thought it was a poor solution because of the cost and effort involved in replacing the
covers on a regular basis. The team also talked about the magazine rack problem where smaller
magazines were falling out out of the rack. For the rest of the problem statement activity, the
team discussed the problem associated with a wheelchair, a magazine rack, and the headphones.
41
While working with their problem statements, Brad realized the team was focusing on the
problem at a surface level, and they should go deeper into the problem in order to understand the
root of it. For example, Brad said, regarding the magazine rack problem, “So, the problem is
really from two directions. It is either that a container that is designed poorly or what’s put in the
container that is designed poorly.” In other words, Brad was trying to say that in order to solve
the magazine rack problem, they could design a better magazine holder. However, at another
level, they could change how information was distributed through printed magazines. He
realized that if they could design a new way to distribute information, they eliminated the need
for a magazine rack. Brad also said that the same principle applies to the wheelchair problem:
“So, actually we are supposed to get at the root of [the problems] right? If we go deeper on the
wheelchair [problem], it ends up being, in general, people would like being able to bring things
in a convenient way.”
In Group B, Brad sometimes dominated the group activities, but he seemed to understand
the IBC techniques the most and enjoy the IBC the most as he helped the team to do almost all
the IBC activities. His enthusiasm and leadership was one of the major characteristics of the
group. As the team continued working on the problem statements, Brad had an idea and
excitedly said, “Have you guys ever been to the library where they have those speakers that
come down [from the ceiling], and you can only really hear them when you are underneath
them?” After Brad posed this question, Kyle said, “I was actually thinking [a similar idea] as a
solution.” This idea about a unidirectional speaker, a speaker that emits sound only in one
direction, became one of the major features of the final product.
After the problem statement activity, the team began the attribute listing activity. Up to
this point Wally was not fully participating in the discussion, but he had an idea and said, “I
42
don’t get why [the librarians] don’t digitize [media files] and stick them on the network.”
According to Wally, instead of focusing on headphones, they could find a way to digitize movie
and audio files and let students watch or listen to media files using their own computers and
headphones. This idea energized Wally and he participated in the rest of the group activities.
It was common that having a new idea energized the members of this group. As
mentioned earlier, Brad became really excited about the IBC when he realized how he could look
at problems on a deeper level. Also, during the SCAMPER activity, which came after the
attribute listing activity, Kyle had a similar experience. He thought of designing a new media
station system that included a unidirectional speaker. Kyle said, “[The library could have]
cubicles and [they could put] all the equipment right there. So we could combine
[unidirectional] speakers with videos and everything they need in one cubicle and have multiple
units of those.”
Another of Group B’s characteristics was how sensitive team members were when
providing feedback about other team members’ ideas. Despite how excited Kyle was about his
media center/cubicle idea, Brad and Sarah did not see Kyle’s idea as a creative solution. After
Kyle shared his idea, Brad asked him to explain his idea again. After Kyle’s re-explanation,
Sarah asked, “[The library] already does [have similar computer cubicles], right?” But Kyle
said, “Yeah, but [this cubicle] would have [unidirectional] speakers built in, and everything is
self-contained in the cubicle.” From the video, Brad appeared unconvinced that Kyle’s idea was
creative. Brad could have expressed his concerns, but instead he withheld his feedback. This
helped Kyle feel his idea was valued or at least acknowledged, and he felt safe enough to
continue participating. During the SCAMPER activity, Kyle continued to share other ideas, such
as how the library could rent out MP3 players and let students use their own headphones.
43
After the SCAMPER activity, the team struggled to understand how to do the random
association activity. However, while they were talking about how a pilot could offer perspective
to their problem, they realized that pilots have to work with noises all the time. After listening to
this conversation, the TA shared how passengers of an airplane have their own media station,
and noise management is a critical issue for them as well. Sarah said, “I think [some airplane
companies] tested [the unidirectional] speakers thing that we are talking about on [an airplane].”
Brad was excited and said, “It would be great to investigate how [their speaker system] works on
a plane, and [find out] how we can project [their system to ours].” At the end of this random
association activity, he said, “I never would have thought about [how] a passenger media system
[on a plane] is so similar to [what we are discussing].” From my observation, the random
association was the hardest technique for participants to understand; however, receiving an
interesting insight about the unidirectional speaker system seemed to help the team stay engaged.
When the direct association activity started next, Brad asked the team to list anything that
distributes information to a lot of people. However, the discussion quickly shifted to a noise
management system when Brad shared his idea of how the unidirectional speaker idea can be
applied to electronic stores such as BestBuy. Wally explained that the principle of noise
management also applies to a car audio system. After listening to Wally’s input, Brad got an
idea that when a family goes on a road trip, different children might be watching different
movies, and noise management is an issue. They also discussed places where there is a lot of
noise and how they could manage noise in places such as video game centers and restaurants.
Although the team had not decided which idea they would work on yet, it seemed that the noise
or audio management system was their major candidate.
44
As the prototype activity started, Sarah asked, “Which idea are we gonna go with?” Brad
answered, “I kind of like the speaker [idea]. We’ve done a lot of development on that idea.”
However, Kyle said, “I think we should . . . just kind of . . . each figure out a solution.” Brad did
not like what Kyle suggested and said, “Well, that would mean each spending a half hour
building different prototypes. Should we do that?” Kyle responded by saying, “True, but . . . I
like my kiosk [cubicle] idea . . .” Noticing there were disagreement between Kyle and Brad,
Wally suggested, “I think you can do both.” This comment relieved Kyle and he accepted the
suggestion of working on both ideas. This was another example of how the team valued each
team member’s idea. The team decided to design a media center/cubicle that had a
unidirectional speaker, then left their table to get materials to make a prototype.
After they returned with the materials, Brad suggested that they should first design what
exactly they were going to make. They spent the next 19 minutes discussing and drawing their
designs on a whiteboard. In the process, Brad, Kyle, Wally, and Sarah all shared their ideas, and
they were consistently discussing, building, and incorporating their ideas. For example, during
the discussion, Wally brought up his idea of digitizing media files and renting them out to
students online. In his perspective, this solution was more portable and elegant. Brad asked,
“What about security issues?” Kyle said, “[If the library rents out] iPods and stuff like that [to
students] in the library, they don’t have to worry about copyright.” Brian also said, “Like the
iPod rental thing, [media files could] be automatically erased.” Although the team did not
incorporate this MP3 player rental idea into the final prototype, this example shows how this
team discussed each person’s idea and tried to incorporate it into their product. This team
attitude seemed to foster more idea generation, which continued throughout the prototyping
stage. For example, after they completed their prototype, Wally, Kyle and Sarah talked about
45
how they could implement a touch panel keyboard in the media cubicle and how to store the
keyboard in the cubicle.
From what I observed in the video, the majority of the team members seemed to enjoy
the prototype activity, but Brian was not as involved. At the end, Brian said, “Oh, man, the
whole thing in one day is tiring.” Brad responded, “Yeah, [but] I had a lot of fun, I really
enjoyed it.” Other team members also seemed to enjoy the process and were proud of their
product. Wally and Kyle together named their product “MiniGlue.”
Except for Brian, Group B’s team members seemed focused and enjoyed the IBC. Wally
was not as excited at first, but having an idea about digitizing media files helped engage him for
the rest of the IBC. A similar trend was found in other team members, especially Kyle and Brad,
but not Brian, as he only shared a few ideas and participated least in the IBC activities. Not
surprisingly, Brian had the worst post-TTCT score improvement among the team. Brad seemed
to dominate the team activities sometimes, but he never put other people’s ideas down, and he
listened to them. In fact all of the members of this group respected other’s ideas and tried their
best to incorporate them into their final product.
Group C
Group C had an interesting group structure compared to the other groups. Initially, the
group consisted of Jay, Collin, Luke, Matt, and John. In the morning portion of the IBC, John
participated in the group activities, but he completely withdrew himself from the group in the
afternoon. He did not leave the IBC, but he sat away from the group table and did not participate
in any activities. No one knew why. Also, Matt had to leave the IBC for work after their
SCAMPER activity. Therefore, Jay, Collin, and Luke were the only members who designed
their final prototype. Although it is impossible to fully understand the impact of this changing
46
team structure, I did not detect negative effects when I looked at how those three team members
interacted with each other.
Until the time he left the IBC for work, Matt was the most outspoken person in the group,
although the team seemed to work effectively together and leadership was shared among all the
team members. During the compensatory behavior categorization activity, Matt and Jay worked
together to produce categories for their pictures. Luke mainly provided feedback. Collin did not
join the categorization activity until the end of the activity. During this activity, John did help
the team by printing the compensatory behavior pictures they had taken earlier, but this was his
last involvement with the group.
During the problem statement activity, the group used a slightly different approach for
selecting problems and producing problem statements when compared to the other groups.
Instead of selecting a specific problem and creating a problem statement, they focused on general
problem categories. For example, when they were discussing an organizational problem with
bicycle parking, they found other problems related to organizational chaos and they attempted to
produce a problem statement for those problems. It is hard to say if their approach was better or
worse than what other teams did, but it was a unique feature of this team.
When the attribute listing activity started, the team needed to pick a specific problem
quickly, so Jay asked everyone to post a sticky note next to the picture of a problem they would
like to work on. The majority of the votes went to the waffle maker problem they observed at
one of the university’s food court restaurants where they noticed excess waffle batter dripping
from the side of a waffle maker. The team soon realized that they had not adequately defined the
problem statement for the waffle maker so the instructor helped the team understand how they
could look at the problem from different perspectives. For example, the instructor explained the
47
real problem might be putting too much batter into the waffle maker. This advice seemed to help
the team view the problem from a fresh perspective. After this instructor’s comment, Matt said,
“We . . . have to decide what the problem is. Is it the problem with the [waffle maker] or a lack
of tray [to catch the drip] . . . ?” Collin then asked the team if the problem is found in “an
operator [who uses a waffle maker] or the design [of the waffle maker].” As the team realized
how the problems could be viewed from different perspectives, they grew excited. Jay
suggested, “We can write down . . . all those options.”
After the attribute listing activity, they started the SCAMPER activity. In this activity
several solutions were generated including designing a waffle maker that requires no turning,
distributing pre-measured waffle batter, turning a kitchen table into a waffle maker, and making
a hole in a kitchen table so drips can be quickly wiped into the hole. Collin even thought about
making mini waffles using spilled waffle batter.
The random association activity came after SCAMPER, but it did not help the team
produce any ideas, despite assistance from the instructor and TA. However, direct association
was more helpful. At the beginning of this activity, Collin mentioned that “microwaves or ovens
or deep fry [cooking machines] or engines” are some of the things that have a similar liquid leak
problem. After hearing what Collin said, Luke said that they could design a special waffle mold,
and “pour some batter and throw it into the microwave” to make waffles. Collin said, “That’s a
good idea.” Collin seemed to like the idea because he thought that a microwave might be faster.
Then Collin asked, “How do these things [microwaves, ovens, or engines] keep from leaking?”
As the team considered this, Collin suggested that they could solve the waffle batter spilling
problem by designing a better sealing system for the waffle maker. The idea of making waffles

48
in the microwave and designing a better sealing mechanism became the foundation of their final
product.
As the prototype activity started, Collin said that the “microwavable waffle mold” idea
was his “favorite” idea. However, Luke said, “Let’s come up with more [ideas].” The team
started to list possible solutions discussed previously, but after listing five, Collin wanted to pick
a project from that pool. Jay, and later Luke, pushed the team further by saying, “Let’s do two
more [ideas],” and “Anything else, even if [it’s] crazy.” After a few more minutes, Jay realized
that the team only had 15 minutes to build their prototype. They voted for their favorite solution,
which was unanimously the microwaveable waffle idea. Considering the time, they simply drew
their prototype on a whiteboard with Jay acting as lead. The team’s final solution was a
Tupperware-like container that consisted of two pieces. Each piece was waffle-shaped and could
be snapped onto each other. Once the two pieces were sealed, the batter could be poured into the
container from a hole.
Despite losing two of their team members, Jay, Collin, and Luke collaborated well by
sharing ideas, listening to other perspectives, and incorporating those ideas into the final product.
It was apparent that these three members were focused and wanted to design a good, creative
product.
Group D
Among the six groups studied in this report, this group (Mary, Steve, John, and Mike)
produced the most ideas (32 coded ideas), shared the most inputs (coded 85 times), and had the
largest number of coded team interactions (345) (See Appendix A). However, they also had the
highest number of critiques (coded 38 times), disagreements (8), and idea defending (20). From
the compensatory behavior categorization activity, their critical team attitude was apparent. For
49
example, Mike suggested, “I was thinking . . . maybe . . . [we can categorize the compensatory
behavior by] something that we can invent and something that we can’t invent.” Mary disliked
the category and pointed out the behaviors that did not fit Mike’s category. Later Mike proposed
another category. He said, “What about electronics versus non-electronics?” But Mary, once
again, critiqued this category by asking, “How many electronics do we actually have?”
Members of this team often talked with a loud and strong voice when sharing ideas and opinions
and they interrupted each other frequently. This critical and assertive team environment appeared
to have a negative impact on individual creativity, as this team struggled to develop an
innovative solution despite a multitude of shared ideas.
During the problem statement activity, the team discussed various compensatory
behavior and its associated problems, such as a computer screen glare problem, magazine rack
problem, wet bike seat problem, and projector screen problem. During the attribute listing
activity, the team decided to focus on one problem. Mary began, “I like the projector [problem].
What about you guys?” Earlier, the team had identified the challenge with projector screens that
fail to stay down, requiring some users to attach an alligator clip to a whiteboard metal ledge or
tray to hold the screen down. John answered, “I like [the] magazine stand [problem]. That
problem [is something] that can easily be fixed.” Mike preferred the computer screen glare
problem. Then Mary asked the team, “Which one looks more plausible?” Everyone agreed that
the projector screen problem had the most plausible solution. Later, it became apparent that
plausibility or the ease of a solution was the most important criteria for this team in making
decisions. They discussed other more innovative solutions but abandoned these because they
thought they were too complex and expensive.
50
Next, the team worked on the SCAMPER activity, discussing simple solutions such as
designing a specialized screen clip that can be attached to the metal tray, using a magnet to keep
the projector screen down or simply using a wall to project a computer screen. They also
discussed more complex solutions such as distributing lectures through video screen eyeglasses
or tablet PCs. Frequent critiques remained common in this team. For instance, the team decided
that using a magnet might not be an ideal solution because they worried that a magnet might
damage a credit card in an instructor’s wallet. They also decided that tablet PCs were too
expensive to distribute to students and video screen eyeglasses were too unrealistic.
During the random association activity, the team revisited the possibility of distributing
lecture information through a computer since pilots use computer screens to obtain information.
However, Steve and John mentioned again that they were too expensive. In the direct
association activity, Steve shared a new idea about using e-ink to share information with
students. At first, no one understood what he meant by e-ink until he showed his KindleTM. The
instructor saw the KindleTM and told the team that he liked the idea of using a portable display
device and that the iPodTM could also be used to display lecture information. However, Mary did
not like this idea, saying, “Well, the only problem with [Kindle or iPod] is that that’s for personal
use. When a person wants to display information to everyone at the same time, I [don’t think
people want to use those small devices].” Steve tried to defend the idea of portable display
devices, but she insisted that most teachers would like to use a bigger display screen. In
addition, Mary said, “I thought our issue is [with display screens not] staying down,” implying
that they should stick to their previously chosen project even though other ideas could have led
them to more creative solutions.
51
When starting the prototype activity, John said, “Let’s think of [or design] something that
we can make.” As the design discussion started, John said, “I think probably the easiest and
cheapest solution for our problem is going to be to make a clip, like that one [we saw in a
classroom earlier], that is permanent. They can just attach it to . . . a metal [tray], and just hook it
underneath the whiteboard, and it will be done.” No one objected to his idea and they started to
draw several prototype designs on the whiteboard. During this discussion, the TA asked why
they chose to work on the simplest solution. Steve explained, “We could change [the design] of
the whiteboard, but you have to deal with . . . installing it to every classroom, and it, just cost-
wise, it won’t be accepted. But something like this, it’s easy, it’s cheap . . . but it would work.”
As they continued to discuss their design, John proposed that they should place projector screen
holder clips on different heights of a whiteboard, and teachers could attach the screen via a string
at the different heights. Mary and Steve disliked the idea. Steve said having a string and
multiple clips on the whiteboard “will be an annoyance for a lot of professors if they don’t want
to use the projector.” John then suggested that they could attach a magnet at the end of the
screen’s string, and the magnet could be used to change the height of the projector screen. Steve
critiqued this idea by saying, “[The magnet] would stick in [a horizontal] way, but it won’t stick
[in a vertical] way . . . The magnet will slide up.” Steve, Mary, and John continued a somewhat
heated discussion about this idea. In the end, Mary looked frustrated and told the team that the
original problem they decided to solve was keeping a project screen down, not helping a teacher
put the screen at different heights. Sensing frustration among the team members, Mike said,
“Okay, so the original problem is this. Overhead projector [screens] don’t stay down. So, we can
forget about a string, we just go with this metal hook.” No one objected to his idea. The final
52
product they built was a metal clip that was very similar to the alligator clip that the group
observed during the original observation and problem identification activity.
Overall, Group D shared diverse ideas and they could have elaborated on those ideas and
designed a creative solution. However, they were overly concerned with the ease and
affordability of their product, resulting in a final product that did not differ much from the
alligator clip they observed. Also, critiques were frequent and sometimes given as constructive
feedback, but the majority of the team members were assertive and their discussions more like
debates than friendly discussions. This eventually made each team member defensive and their
group collaborations less effective.
Group E
Group E (James, Jose from South America, and Stephen) was characterized by a lack of
motivation among the team members and few shared ideas. Therefore, the team had many silent
moments where no one was speaking or where they talked off-topic. During the compensatory
behavior categorization activity, James was the only person categorizing the compensatory
behavior pictures. Since James was deciding everything by himself, the team completed the
activity a lot earlier than other teams. Toward the end of the activity, Jose received a phone call
from his wife and told the team how his wife refuses to put gasoline in the car even though the
gas tank is empty. Since the team had nothing else to do, they spent the rest of the categorization
activity talking about their experiences with running out of gas.
When the problem statement activity started, Jose said, “Let’s say we each choose one
problem [that we would like to work on].” James agreed and said, “Yeah, and narrow from
there.” As they all indicated their favorite compensatory behaviors, James realized a pattern in
their chosen problems, and said, “So, actually it seems like . . . we all kind of have come to a
53
general idea that maybe there’s not enough of the right kind of seating at the right areas [in the
library].” The team agreed to this observation and James rephrased their problem statement.
The team thought that this concluded their problem statement activity, but the instructor told
them that their statement was too specific and did not inform the root of the problem. He
encouraged them to think deeper about why students were sitting on the library floors. James did
not look happy after receiving this feedback.
At the beginning of the attribute listing activity, James asked, “Do we need to refine [our
problem statement] a little bit better?” Stephen replied, “It would appear so.” However, the
instructor came by and instead started to help the team with attribute listing. Shortly after the
instructor left the group, the TA stopped by and challenged the team to think about why students
were sitting on the library floor. James pointed out that the main reason was because the floor
provided a convenient and private space. Jose said that students might not know that they could
reserve a study room. As they discussed more reasons for this compensatory behavior, the
instructor came back and helped the team conduct the attribute listing activity again. After the
instructor left, Jose said, “Do we fully understand what we are supposed to do?” He was
confused because the TA told the team to discuss the reasons for the compensatory behavior, but
the instructor asked them to list the physical attributes. The team tried to list a few attributes.
However, they quickly ran out of things to say. James said, “I don’t know what else to do.” The
team was quiet until the instructor started the next activity.
The SCAMPER activity helped the team receive an idea for their final solution. In this
activity, the team started discussing how the floor was substituting as a chair. The TA heard this
conversation and told them that there is a restaurant that intentionally lets customers sit on the
floor with a cushion. After hearing this input, Stephen said, “Maybe a conference room is too
54
formal [for students].” James responded, “They just like a more relaxed environment? That’s
more important to them [than studying in a formal conference room]? So, how do we bring a
more relaxed environment to a conference room?” The team discussed how they could place
pillows, a water fountain, refrigerator, and other materials in a study room. The instructor heard
the discussion and told them that he liked the idea of an informal study room. Jose excitedly
said, “See, something is coming out!” One of the interesting findings from Group E was that this
relaxed study room was the only solution idea that the team produced for their chosen problem.
They did not discuss any other ways to potentially solve their problem, limiting themselves to
one potential solution.
After the SCAMPER activity, the team was asked to do random association, but they had
a difficult time generating ideas. After a long initial pause, James said “Any ideas?” Stephen
responded by saying, “It’s difficult.” James mentioned that mechanics want to have their tools
organized and easily accessible. He also mentioned that in a typical garage, people often place
hooks on the ceiling for hanging their tools. He said that they could place similar hooks in a
study room. Stephen mentioned that placing things close to students is a great idea. Stephen
then told the team that a table in a study room could be a whiteboard. He said that the
whiteboard table eliminates the need for a student to stand up in order to use a whiteboard.
James said that the table could also be a surface PC. Those were the only three ideas that the
team generated during this activity. There were many silent moments, and Stephen and James
talked about other classes for the last two minutes of the activity.
The team also struggled in the direct association activity. At the beginning, they
discussed places where people gather such as the living room and classroom, but they quickly
ran out of things to discuss. As a result, there were, once again, many silent moments where
55
nobody spoke to each other. When the prototype activity started, the team members left the table
to gather materials. When then returned, they did not have any formal discussion about their
design. Their solution was simple and straightforward and everyone knew that all they needed to
make was something representing a room, table, pillow, sofa, and other materials they had
discussed previously. During the activity, Stephen worked the least, but was also the most
critical. For example, Jose decided to use one material to make the legs of a table, but Stephen
said, “Let’s see, I’m not sure if we want to make [table] legs out of that. I don’t think it’s
sturdy.” Later, Stephen told the team that they should make a table surface look like the
whiteboard. He said, “Should we use a marker to [write something on the table] to show that
you can actually write on [the table surface]?” James said this was a good idea, but told Stephen
to make the table surface look like a surface PC. However, Stephen never initiated the work.
James asked him again to do the task. Stephen responded by saying, “I can’t draw. I’m not that
good.” James printed out an image of a surface PC off the Internet and pasted it on the model of
the table. James seemed somewhat frustrated. Despite this lack of effort, Stephen was proud of
what the team made and said, “This is . . . one of the coolest conference rooms ever.” By
observing the faces of other team members, the whole team looked proud of their work.
One of the interesting findings about this team was that their focus was to quickly finish
their tasks. For almost all of the IBC activities, they first needed help from the instructors or TA
to understand what they were supposed to do, but once they knew what they needed to do, they
completed the tasks very quickly without much discussion. Another interesting finding about
this team was how they only generated one unique solution for their chosen problem. They
added details to their solution, but they never talked about alternative solutions. If they had
explored different solutions, they might have designed something more creative.
56
Group F
At the beginning of the afternoon session of the IBC, most members of the Group F
(Meg, Justin, Tim, and Seth) seemed tired. When Tim gave a big yawn, Meg asked, “Are we all
tired?” Meg was the only team member who looked motivated to do the IBC activities at this
point. When the problem statement activity started, the instructor told everyone they should look
for the real root of the problem, not just a problem with something they could see on the surface.
Tim responded, “Let’s first pull off [problems that we] definitely [don’t want to] work with.”
While Tim was taking off pictures, Meg asked the others, “What’s up [on the whiteboard] that
intrigues you the most?” Seth mentioned that the fire alarm problem (where a construction
worker covered a fire alarm in the library to prevent dust or particles from going into the alarm)
is the one he liked. They examined other problems, but the team considered them not unique.
Meg led the discussion and Tim was sitting by the board, so Meg asked Tim to be a
scribe. However, Tim had a hard time understanding what was being discussed, so Justin took
over this role eventually. The instructor stopped by, and after hearing what they had been
discussing, he said that the problem is not just related to a fire alarm, but how construction and
study areas could co-exist together. The team seemed to like this suggestion. Since they had
been asked to pick three favorite problems, Meg tried to expand their problem selection with a
few others. However, Justin said, “I think we pretty much have [our problem]. You don’t have
to [pick] three [problems], we can [just] do one.” Meg seemed unhappy about this, and she said,
“What about . . . maybe, we talk about some other problems, like a backpack [problem], and
[find out] what the deeper issue is?” The team found the backpack problem in the library. In
one situation, a student was sitting on the floor and using computer by placing it on his or her
lap. To be comfortable with typing, the student placed a backpack between his or her lap and the
57
computer so that the computer could be placed higher. In another situation, a backpack was used
as a pillow by a student.
The team discussed these problems until the instructor stopped by again and asked them
to begin random association. Meg seemed to understand random association when others in her
group did not, so she asked, “How do you think a doctor would solve this problem?” The team
found it difficult to answer her question. Justin said, “A doctor would solve this problem by . . .
I don’t know . . .” The instructor had to help them see how what a doctor does so they could see
their problem from a unique perspective. However, the team still struggled with this activity
after the instructor left.
In contrast, the SCAMPER activity seemed to help the team most. In this activity,
various solutions were discussed—not all related to the fire alarm filter problem, but also about
how to improve construction inside buildings. Justin suggested a plastic cover protecting the
carpet could be replaced with a mat, and the mat could be washed and used multiple times. Meg
suggested that they design something that cleans construction workers’ shoes. However, Tim
produced the most ideas in this activity. He proposed that they could design a more efficient
transportation system to carry dirt out of the building or an alarm that would not produce noise
when detecting smoke, but instead call the fire station. He also suggested that they could make
an alarm with a shutter so construction workers could close the alarm using the shutter. Seth was
quiet in this activity as well, so Meg asked, “Any ideas, Seth? Anything coming to you?” All
Seth said was, “I’m just thinking about how freezing this room is.”
As the discussion progressed, the team talked about how they could eliminate the library
and its construction problems by implementing eBooks. Justin mentioned that construction
could also be done at night. Despite the various solutions they generated, at the end of the
58
SCAMPER activity, the team again discussed the alarm as what they thought was the real
problem. They specifically discussed installing a fire alarm that could differentiate dust and
smoke participles. In general, the team seemed to be the most active in the SCAMPER activity.
As the prototype activity started, they all left their table to gather materials but did not
take the time to discuss their design, so Justin, Tim, and Meg started making objects that
represented a ceiling, fire alarm and filter after they came back to the table. They also did not
discuss how the filter would detect dust and particles. Seth was again not doing anything, so
Meg assigned him a task. After Seth finished his task, he said, “Dude, we are born to prototype,
I don’t think our group was really synergized up until this point. There is a certain level of
greatness in here.” Although this comment seemed to show his increased motivation, once he
completed his task, he did not do anything else. Since what the team decided to prototype was
rather simple, it only took 15 minutes for them to complete their prototype. However,
approximately 30 minutes was assigned for the prototype activity, so Meg decided to make the
model look more professional. For example, a plastic cup that they used for the fire alarm was
yellow, and she wanted to use black electric tape to make it black. After she taped the cup, she
wanted to cut the cup in half so it was not so long. Justin and Seth seemed annoyed by Meg’s
continuous improvements. As Meg explained what kinds of improvements she wanted to make,
Seth said, “It’s just a prototype . . . I think it’s fine [as it is].” Meg responded by saying, “I want
our prototype to look good. It’s the industrial designer in me. It’s like, ‘Ahhhh! I can’t handle
ugly things!’” On another occasion, Seth said to Meg, “You are never done, are you?” in a
slightly sarcastic manner. Meg somewhat defensively responded, “No. Never done.”
In Group F, Meg was the only person who was always motivated to do well in the IBC.
Although other team members expressed some interest in different IBC activities (e.g., the
59
SCAMPER, prototyping, etc.), they generally wanted to do the minimum amount of work. They
discussed several solution ideas, but it seemed that they chose to work on the easiest solution. At
the end of the prototype activity, Justin said, “It was a lot easier than designing a backpack!” It
seems that they could have been more creative if they were more motivated and less focused on
choosing the easiest path.
60
Chapter 5: Cross-case Comparisons
Although it is impossible to describe all the differences and similarities between the
groups in this study, I will describe six themes that emerged from the cross-case analysis. These
themes help us understand major differences between the improved and non-improved groups.
These themes are (1) idea and information exchange, (2) critique, (3) idea improvement, (4)
prototype design, (5) challenging solution, and (6) engagement level. In this chapter, I will
explain each theme using descriptive statistics and sample accounts of actual team interactions.
In the next chapter, I will discuss how these themes were used to generate theories regarding
how team interactions can affect individual creativity.
Idea and Information Exchange
The first difference between the improved and non-improved groups was the amount of
ideas and information shared. In this study, three different codes indicated ideas and information
shared within the team. They were (1) shared ideas, (2) shared input and (3) idea-related
discussion. Shared ideas were coded when a team member shared a product or solution idea.
Shared input indicated that a team member shared a perspective, knowledge or personal
preference regarding a problem, solution or activity that the team was asked to complete during
the IBC. Idea-related discussion was coded when the team discussed an idea or information for
more than 30 seconds. By looking at how many shared ideas, shared input, and idea-related
discussions were coded in the improved groups and two of the non-improved groups (Group E
and F), I found a clear difference in how many ideas and inputs were shared among the team
members. One of the non-improved groups (Group D) was an exception to this finding. I will
explain why in the critique and idea improvement section of this chapter.
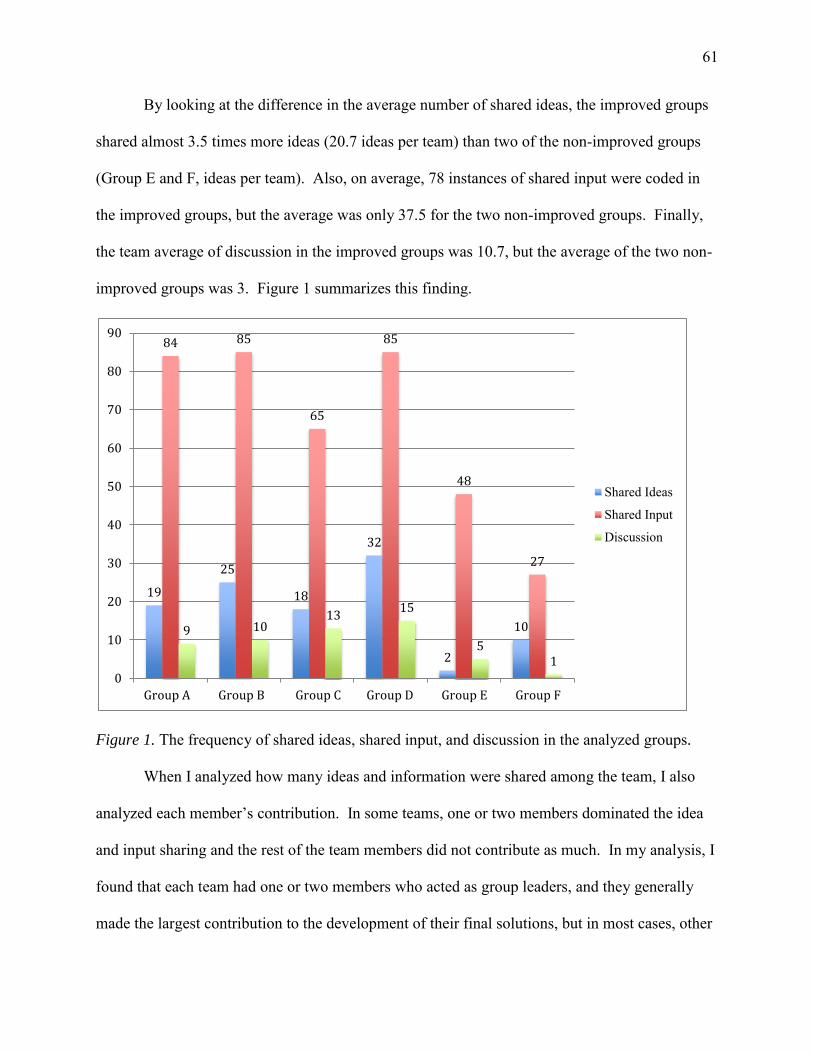
61
By looking at the difference in the average number of shared ideas, the improved groups
shared almost 3.5 times more ideas (20.7 ideas per team) than two of the non-improved groups
(Group E and F, ideas per team). Also, on average, 78 instances of shared input were coded in
the improved groups, but the average was only 37.5 for the two non-improved groups. Finally,
the team average of discussion in the improved groups was 10.7, but the average of the two non-
improved groups was 3. Figure 1 summarizes this finding.
Figure 1. The frequency of shared ideas, shared input, and discussion in the analyzed groups.
When I analyzed how many ideas and information were shared among the team, I also
analyzed each member’s contribution. In some teams, one or two members dominated the idea
and input sharing and the rest of the team members did not contribute as much. In my analysis, I
found that each team had one or two members who acted as group leaders, and they generally
made the largest contribution to the development of their final solutions, but in most cases, other
19
25
18
32
2
10
84 85
65
85
48
27
9 10 13
15
5 1
0
10
20
30
40
50
60
70
80
90
Group A...........Group B............Group C..........Group D...........Group E...........Group F
Shared Ideas
Shared Input
Discussion
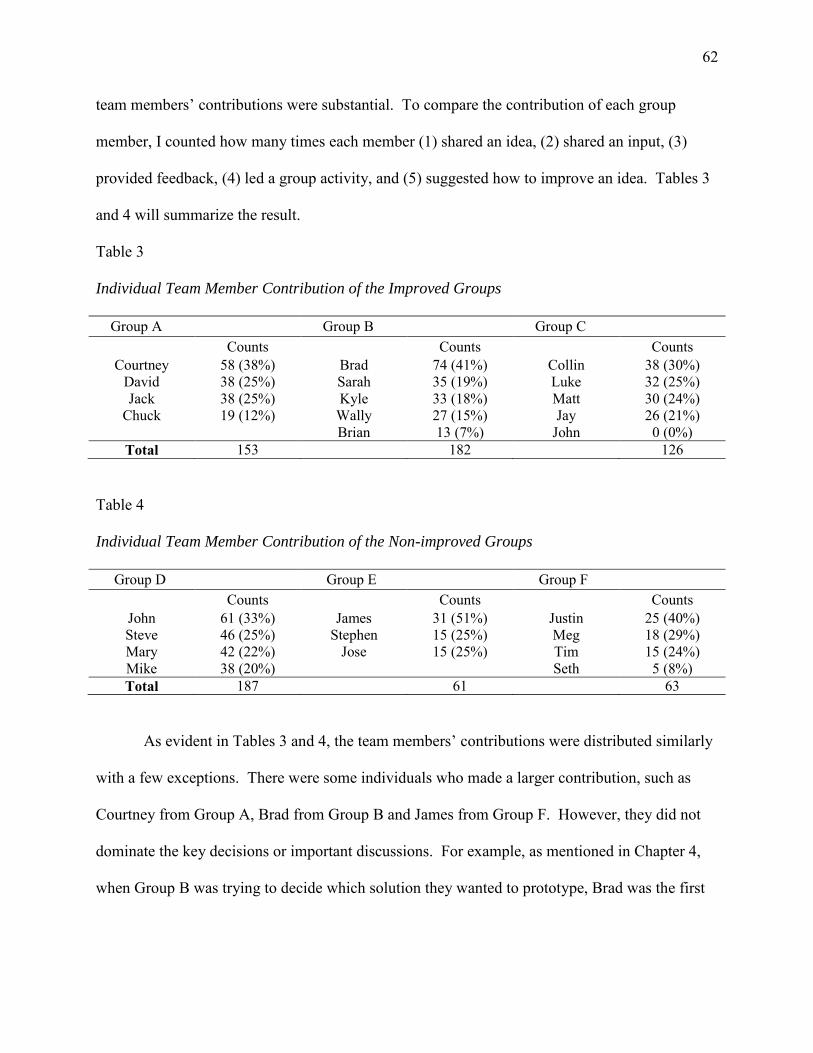
62
team members’ contributions were substantial. To compare the contribution of each group
member, I counted how many times each member (1) shared an idea, (2) shared an input, (3)
provided feedback, (4) led a group activity, and (5) suggested how to improve an idea. Tables 3
and 4 will summarize the result.
Table 3 Individual Team Member Contribution of the Improved Groups
Group A Group B Group C Counts Counts Counts
Courtney 58 (38%) Brad 74 (41%) Collin 38 (30%) David 38 (25%) Sarah 35 (19%) Luke 32 (25%) Jack 38 (25%) Kyle 33 (18%) Matt 30 (24%)
Chuck 19 (12%) Wally 27 (15%) Jay 26 (21%) Brian 13 (7%) John 0 (0%)
Total 153 182 126
Table 4 Individual Team Member Contribution of the Non-improved Groups
Group D Group E Group F
Counts Counts Counts John 61 (33%) James 31 (51%) Justin 25 (40%) Steve 46 (25%) Stephen 15 (25%) Meg 18 (29%) Mary 42 (22%) Jose 15 (25%) Tim 15 (24%) Mike 38 (20%) Seth 5 (8%) Total 187 61 63
As evident in Tables 3 and 4, the team members’ contributions were distributed similarly
with a few exceptions. There were some individuals who made a larger contribution, such as
Courtney from Group A, Brad from Group B and James from Group F. However, they did not
dominate the key decisions or important discussions. For example, as mentioned in Chapter 4,
when Group B was trying to decide which solution they wanted to prototype, Brad was the first
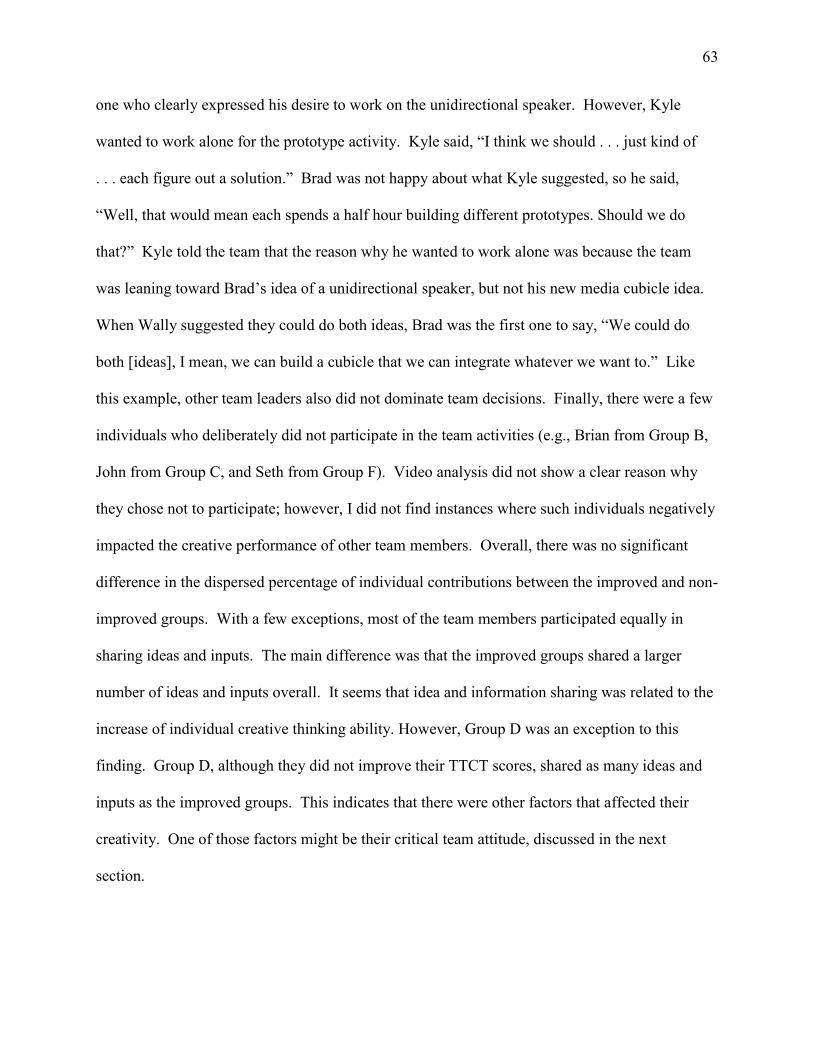
63
one who clearly expressed his desire to work on the unidirectional speaker. However, Kyle
wanted to work alone for the prototype activity. Kyle said, “I think we should . . . just kind of
. . . each figure out a solution.” Brad was not happy about what Kyle suggested, so he said,
“Well, that would mean each spends a half hour building different prototypes. Should we do
that?” Kyle told the team that the reason why he wanted to work alone was because the team
was leaning toward Brad’s idea of a unidirectional speaker, but not his new media cubicle idea.
When Wally suggested they could do both ideas, Brad was the first one to say, “We could do
both [ideas], I mean, we can build a cubicle that we can integrate whatever we want to.” Like
this example, other team leaders also did not dominate team decisions. Finally, there were a few
individuals who deliberately did not participate in the team activities (e.g., Brian from Group B,
John from Group C, and Seth from Group F). Video analysis did not show a clear reason why
they chose not to participate; however, I did not find instances where such individuals negatively
impacted the creative performance of other team members. Overall, there was no significant
difference in the dispersed percentage of individual contributions between the improved and non-
improved groups. With a few exceptions, most of the team members participated equally in
sharing ideas and inputs. The main difference was that the improved groups shared a larger
number of ideas and inputs overall. It seems that idea and information sharing was related to the
increase of individual creative thinking ability. However, Group D was an exception to this
finding. Group D, although they did not improve their TTCT scores, shared as many ideas and
inputs as the improved groups. This indicates that there were other factors that affected their
creativity. One of those factors might be their critical team attitude, discussed in the next
section.
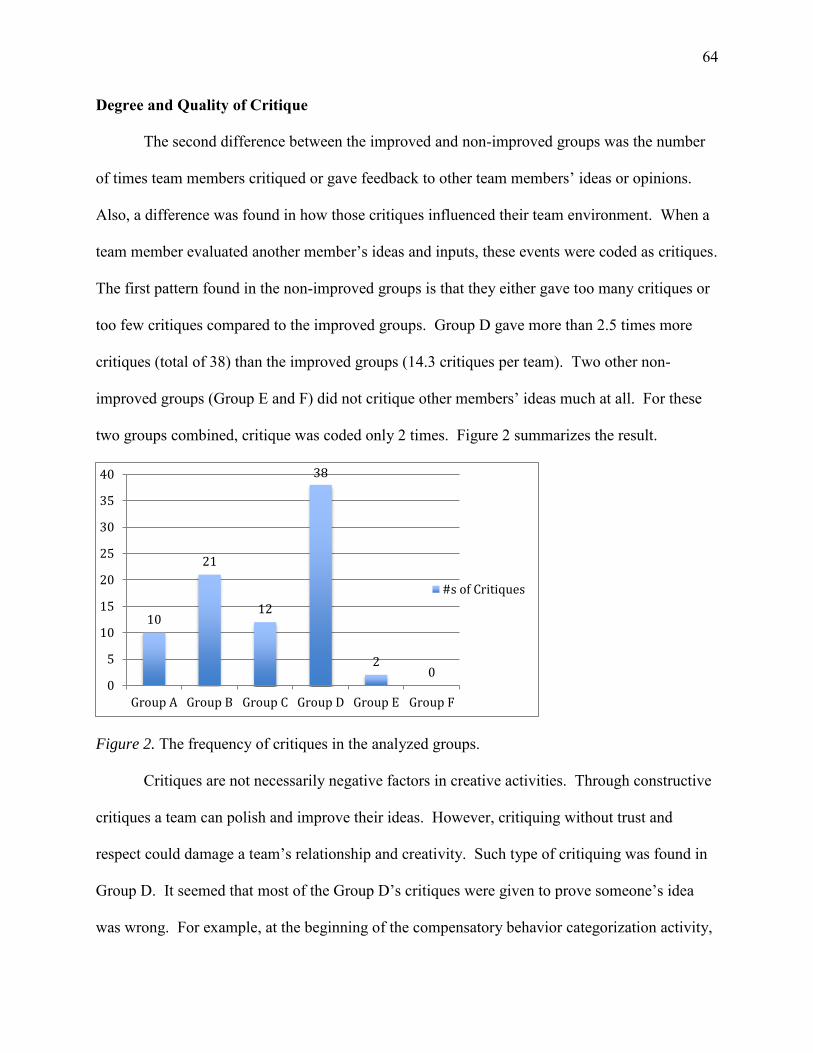
64
Degree and Quality of Critique
The second difference between the improved and non-improved groups was the number
of times team members critiqued or gave feedback to other team members’ ideas or opinions.
Also, a difference was found in how those critiques influenced their team environment. When a
team member evaluated another member’s ideas and inputs, these events were coded as critiques.
The first pattern found in the non-improved groups is that they either gave too many critiques or
too few critiques compared to the improved groups. Group D gave more than 2.5 times more
critiques (total of 38) than the improved groups (14.3 critiques per team). Two other non-
improved groups (Group E and F) did not critique other members’ ideas much at all. For these
two groups combined, critique was coded only 2 times. Figure 2 summarizes the result.
Figure 2. The frequency of critiques in the analyzed groups.
Critiques are not necessarily negative factors in creative activities. Through constructive
critiques a team can polish and improve their ideas. However, critiquing without trust and
respect could damage a team’s relationship and creativity. Such type of critiquing was found in
Group D. It seemed that most of the Group D’s critiques were given to prove someone’s idea
was wrong. For example, at the beginning of the compensatory behavior categorization activity,
10
21
12
38
2 0
0
5
10
15
20
25
30
35
40
Group A Group B Group C Group D Group E Group F
#s of Critiques
65
Mike suggested they could categorize the behavior by determining if an observed behavior was
“something that we can invent or something that we can’t invent.” Mary disliked the category
and pointed out the behaviors that did not fit Mike’s category. Later Mike proposed another
category. He said, “What about electronics versus non-electronics?” Mary, once again,
critiqued this category by asking, “How many electronics do we actually have?” Since there
were not many compensatory behaviors that related to electronics, Mary implicitly but clearly
pointed out that the electronics versus non-electronics category did not work. After a few more
of his ideas were rejected by his team members in a similar way, Mike withdrew from the group
activities and did not fully participate in the IBC activities until the prototype activity.
Another example of Group D’s critical team attitude was illustrated in their prototype
activity. During the prototype activity, John thought it would be nice if an instructor held a
project screen at different heights so he or she could use the whiteboard and screen at the same
time. John suggested that they design their clip so it could be placed at different heights of the
wall. Mary and Steve disliked the idea. Steve said having multiple clips on the whiteboard “will
be annoyance for a lot of professors if they don’t want to use the projector.” John thought his
idea made their product better, so he kept explaining why the team should implement his idea.
He even proposed a different way of controlling a screen height using a magnet, but Steve
explained a technical problem with using a magnet to control the height of a projector screen.
However, John still tried to find other ways to implement his idea. Mary seemed frustrated and
told the team that the original problem they decided to solve was keeping a screen to stay down,
and it was not helping a teacher put the screen at different heights. John’s idea was rejected.
Compared to Group D, all the improved groups had more cooperative team attitudes.
Those improved groups still critiqued each others’ ideas and had a few disagreements; the teams
66
also maintained an environment of psychological safety where members could share their ideas
and opinions without being defensive. For example, Kyle from Group B was very excited about
a new media center cubicle idea for the library. Kyle said, “[The library could have] cubicles
and [they could put] all the equipment right there. So we could combine [unidirectional]
speakers with videos and everything they need in one cubicle, and have multiple units.” Sarah
and Brad questioned how Kyle’s new media center idea could be considered a creative solution.
After Kyle’s comment, Brad asked with a concerned face, “What are we combining?” Kyle re-
explained his idea, but Sarah said, “[The library] already does [have similar computer cubicles],
right?” Kyle explained his idea again and told the team that his idea was different from the
current computer cubicles. Brad still looked concerned, but Brad and Sarah stopped questioning
Kyle’s idea. Later they even allowed his idea to be incorporated into their prototype. Therefore,
Group B’s attitude was clearly different from Group D’s. When John brought up his new idea,
some members of Group D did not like the idea and eventually rejected his proposal. However,
in Group B, although there were some members who did not see the exact value of Kyle’s
product idea, they still decided to work on his idea as a team because it was important for Kyle.
Group C also demonstrated a good example of having a cooperative team attitude.
During the prototype activity, Collin suggested one way to seal a microwavable waffle container,
but Luke pointed out the technical flaw of his design and Collin acknowledged that Luke’s
feedback was a legitimate concern. However, Luke and Jay spent two minutes thinking about
how they could make Collin’s design work instead of completely rejecting the idea. Eventually
the team found a better way to seal a microwavable waffle container. This incident shows the
respectful and open attitude of Group C. A similar attitude was also found in Group A. In one
of the boot camp activities, one group member shared an idea to make a bicycle like the
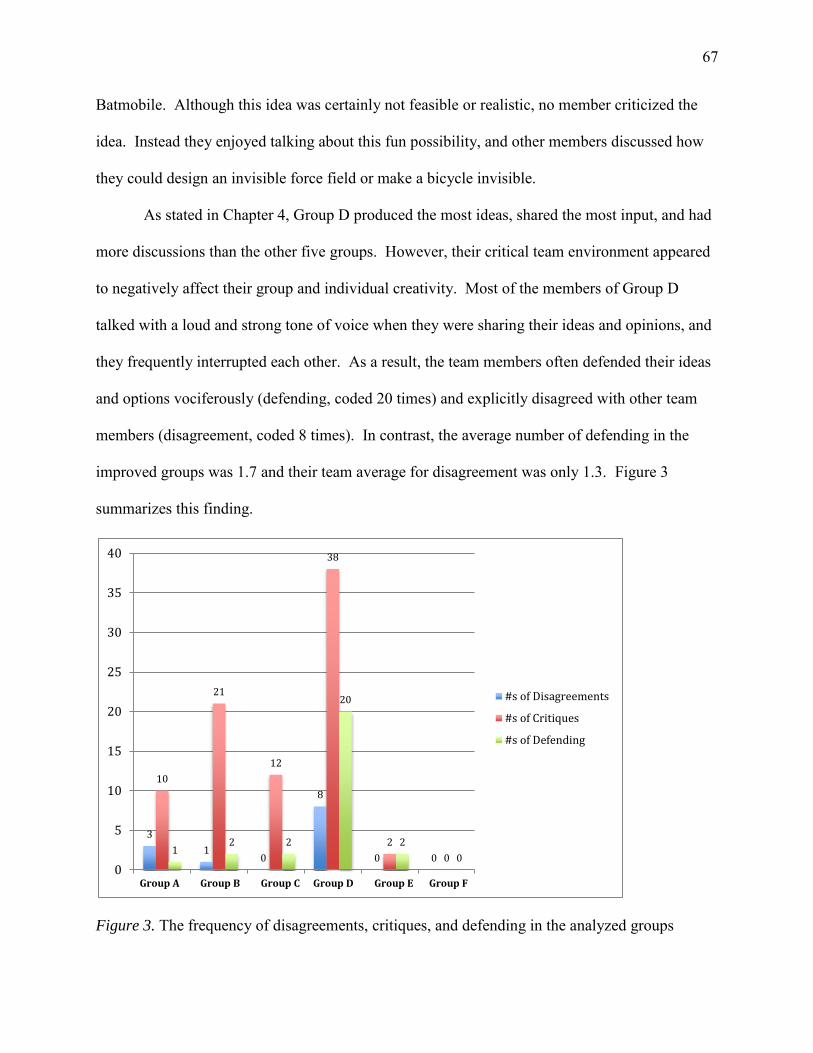
67
Batmobile. Although this idea was certainly not feasible or realistic, no member criticized the
idea. Instead they enjoyed talking about this fun possibility, and other members discussed how
they could design an invisible force field or make a bicycle invisible.
As stated in Chapter 4, Group D produced the most ideas, shared the most input, and had
more discussions than the other five groups. However, their critical team environment appeared
to negatively affect their group and individual creativity. Most of the members of Group D
talked with a loud and strong tone of voice when they were sharing their ideas and opinions, and
they frequently interrupted each other. As a result, the team members often defended their ideas
and options vociferously (defending, coded 20 times) and explicitly disagreed with other team
members (disagreement, coded 8 times). In contrast, the average number of defending in the
improved groups was 1.7 and their team average for disagreement was only 1.3. Figure 3
summarizes this finding.
Figure 3. The frequency of disagreements, critiques, and defending in the analyzed groups
3
1 0
8
0 0
10
21
12
38
2
0 1
2 2
20
2
0 0
5
10
15
20
25
30
35
40
Group A.........Group B.........Group C......Group D.........Group E.......Group F
#s of Disagreements
#s of Critiques
#s of Defending
68
The improved groups critiqued other team members’ ideas. Therefore, critique cannot be
always associated with damaging creativity. In fact, the lack of critique was characteristic of two
of the non-improved groups (Group E and F). However, when team members became defensive
and disagreeable as a result of the lack of trust and respect within the group, it negatively
affected creativity.
Idea Improvement
The third difference between the improved and non-improved groups is the frequency of
a team member listening to another member’s ideas and suggestions for how to modify and
improve the original idea. Such events were coded as idea improvement. For example,
Courtney from Group A had an idea to design a mechanism to modify bicycle handlebars so the
handlebars could be used to lock a bicycle, but she did not have a clear design of an actual
product. After listening to Courtney’s idea, David suggested designing handlebars with a built-
in wire bike lock. The team liked David’s idea and each team member proposed different ways
to store a wire bike lock inside the handlebars. This collaborative idea improvement allowed
Group A to design a product that the team members were excited about. During the prototype
activity, Jack said, “I would say we just got a billion dollar idea. We should do business
together.”
In Group B, Kyle suggested, “What [the library] could do is [let students] have a little
portable [media] player, and . . . whatever media [they] want to listen to or watch, [they] could
pull out an iPod or something and listen or watch it in the library.” Wally liked this idea and
said, “I like [Kyle’s] idea . . . You can digitize [media files] . . . and make it . . . like . . . iTunes.
When you rent a movie in iTunes, once you start watching it, you have 24 hours to watch it
before they wipe it from your account.” Wally suggested that the library could do a similar thing
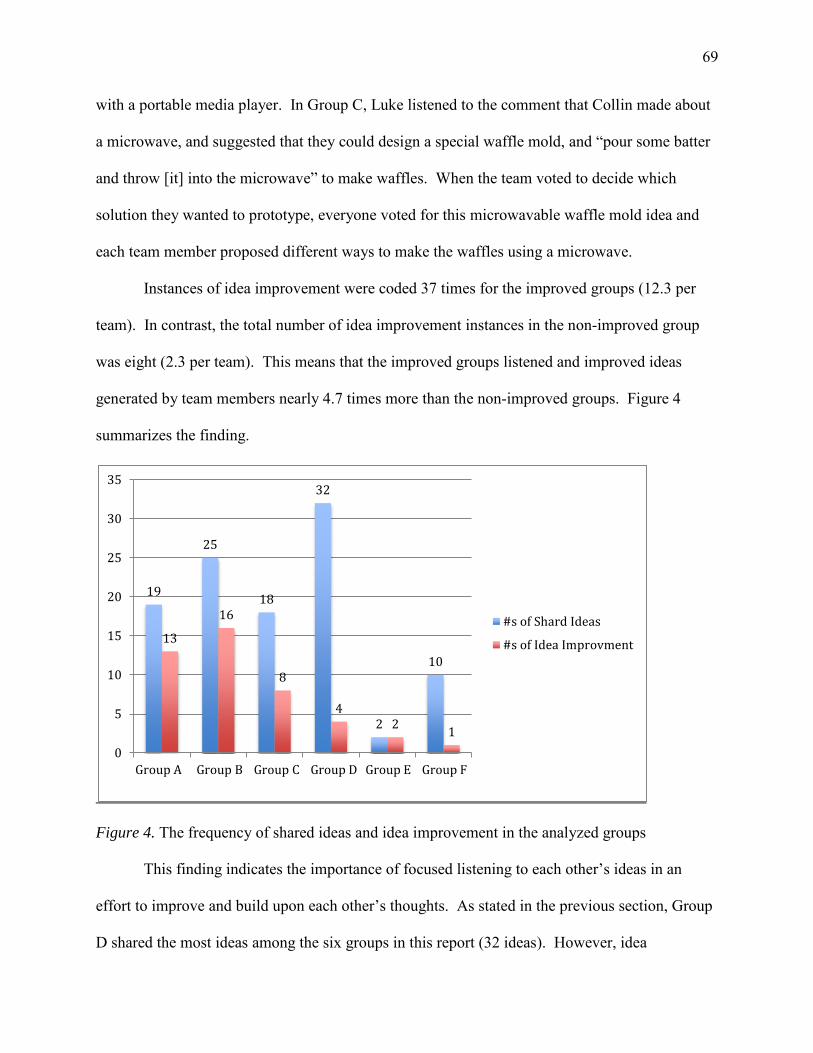
69
with a portable media player. In Group C, Luke listened to the comment that Collin made about
a microwave, and suggested that they could design a special waffle mold, and “pour some batter
and throw [it] into the microwave” to make waffles. When the team voted to decide which
solution they wanted to prototype, everyone voted for this microwavable waffle mold idea and
each team member proposed different ways to make the waffles using a microwave.
Instances of idea improvement were coded 37 times for the improved groups (12.3 per
team). In contrast, the total number of idea improvement instances in the non-improved group
was eight (2.3 per team). This means that the improved groups listened and improved ideas
generated by team members nearly 4.7 times more than the non-improved groups. Figure 4
summarizes the finding.
Figure 4. The frequency of shared ideas and idea improvement in the analyzed groups
This finding indicates the importance of focused listening to each other’s ideas in an
effort to improve and build upon each other’s thoughts. As stated in the previous section, Group
D shared the most ideas among the six groups in this report (32 ideas). However, idea
19
25
18
32
2
10
13
16
8
4 2
1
0
5
10
15
20
25
30
35
Group A .....Group B....Group C....Group.D...Group.E....Group.F
#s of Shard Ideas
#s of Idea Improvment
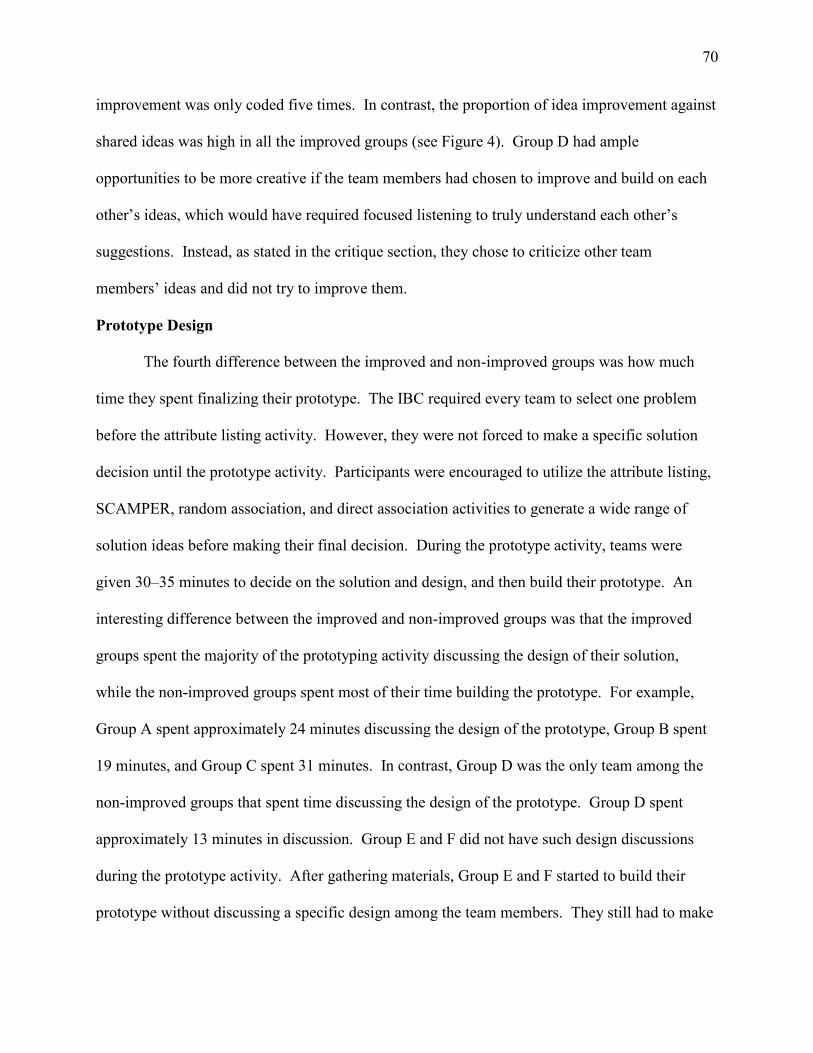
70
improvement was only coded five times. In contrast, the proportion of idea improvement against
shared ideas was high in all the improved groups (see Figure 4). Group D had ample
opportunities to be more creative if the team members had chosen to improve and build on each
other’s ideas, which would have required focused listening to truly understand each other’s
suggestions. Instead, as stated in the critique section, they chose to criticize other team
members’ ideas and did not try to improve them.
Prototype Design
The fourth difference between the improved and non-improved groups was how much
time they spent finalizing their prototype. The IBC required every team to select one problem
before the attribute listing activity. However, they were not forced to make a specific solution
decision until the prototype activity. Participants were encouraged to utilize the attribute listing,
SCAMPER, random association, and direct association activities to generate a wide range of
solution ideas before making their final decision. During the prototype activity, teams were
given 30–35 minutes to decide on the solution and design, and then build their prototype. An
interesting difference between the improved and non-improved groups was that the improved
groups spent the majority of the prototyping activity discussing the design of their solution,
while the non-improved groups spent most of their time building the prototype. For example,
Group A spent approximately 24 minutes discussing the design of the prototype, Group B spent
19 minutes, and Group C spent 31 minutes. In contrast, Group D was the only team among the
non-improved groups that spent time discussing the design of the prototype. Group D spent
approximately 13 minutes in discussion. Group E and F did not have such design discussions
during the prototype activity. After gathering materials, Group E and F started to build their
prototype without discussing a specific design among the team members. They still had to make
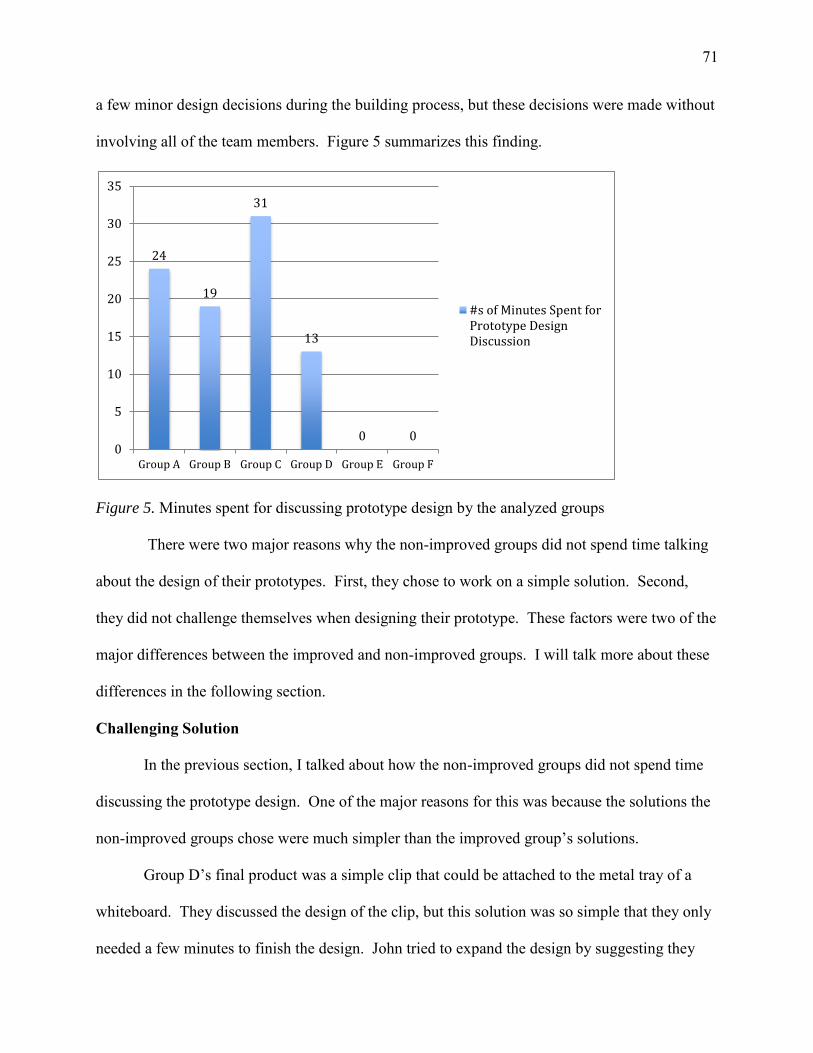
71
a few minor design decisions during the building process, but these decisions were made without
involving all of the team members. Figure 5 summarizes this finding.
Figure 5. Minutes spent for discussing prototype design by the analyzed groups
There were two major reasons why the non-improved groups did not spend time talking
about the design of their prototypes. First, they chose to work on a simple solution. Second,
they did not challenge themselves when designing their prototype. These factors were two of the
major differences between the improved and non-improved groups. I will talk more about these
differences in the following section.
Challenging Solution
In the previous section, I talked about how the non-improved groups did not spend time
discussing the prototype design. One of the major reasons for this was because the solutions the
non-improved groups chose were much simpler than the improved group’s solutions.
Group D’s final product was a simple clip that could be attached to the metal tray of a
whiteboard. They discussed the design of the clip, but this solution was so simple that they only
needed a few minutes to finish the design. John tried to expand the design by suggesting they
24
19
31
13
0 0 0
5
10
15
20
25
30
35
Group A Group B Group C Group D Group E Group F
#s of Minutes Spent forPrototype DesignDiscussion
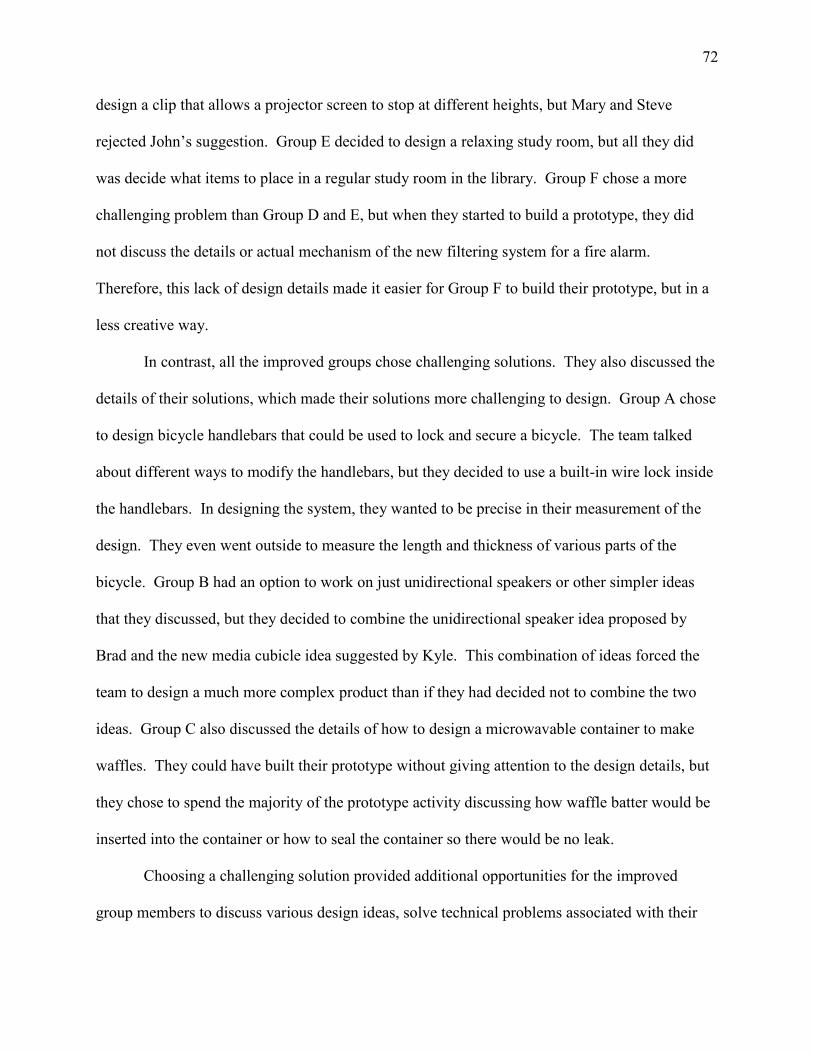
72
design a clip that allows a projector screen to stop at different heights, but Mary and Steve
rejected John’s suggestion. Group E decided to design a relaxing study room, but all they did
was decide what items to place in a regular study room in the library. Group F chose a more
challenging problem than Group D and E, but when they started to build a prototype, they did
not discuss the details or actual mechanism of the new filtering system for a fire alarm.
Therefore, this lack of design details made it easier for Group F to build their prototype, but in a
less creative way.
In contrast, all the improved groups chose challenging solutions. They also discussed the
details of their solutions, which made their solutions more challenging to design. Group A chose
to design bicycle handlebars that could be used to lock and secure a bicycle. The team talked
about different ways to modify the handlebars, but they decided to use a built-in wire lock inside
the handlebars. In designing the system, they wanted to be precise in their measurement of the
design. They even went outside to measure the length and thickness of various parts of the
bicycle. Group B had an option to work on just unidirectional speakers or other simpler ideas
that they discussed, but they decided to combine the unidirectional speaker idea proposed by
Brad and the new media cubicle idea suggested by Kyle. This combination of ideas forced the
team to design a much more complex product than if they had decided not to combine the two
ideas. Group C also discussed the details of how to design a microwavable container to make
waffles. They could have built their prototype without giving attention to the design details, but
they chose to spend the majority of the prototype activity discussing how waffle batter would be
inserted into the container or how to seal the container so there would be no leak.
Choosing a challenging solution provided additional opportunities for the improved
group members to discuss various design ideas, solve technical problems associated with their
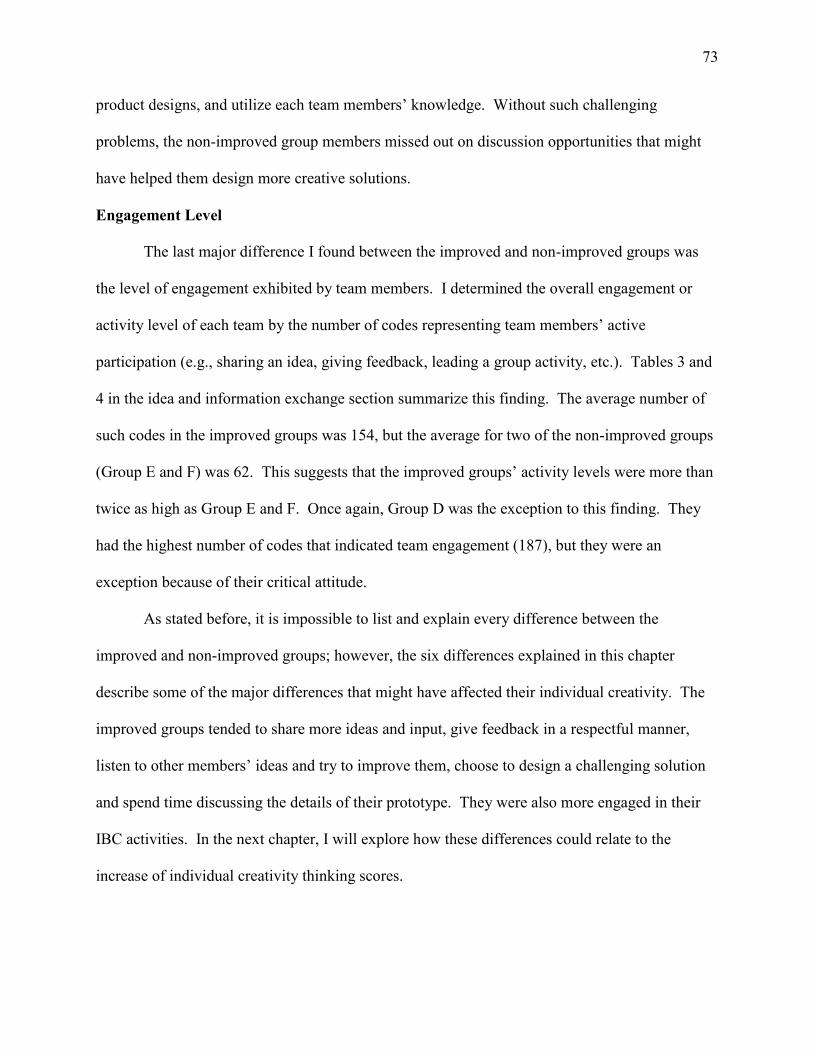
73
product designs, and utilize each team members’ knowledge. Without such challenging
problems, the non-improved group members missed out on discussion opportunities that might
have helped them design more creative solutions.
Engagement Level
The last major difference I found between the improved and non-improved groups was
the level of engagement exhibited by team members. I determined the overall engagement or
activity level of each team by the number of codes representing team members’ active
participation (e.g., sharing an idea, giving feedback, leading a group activity, etc.). Tables 3 and
4 in the idea and information exchange section summarize this finding. The average number of
such codes in the improved groups was 154, but the average for two of the non-improved groups
(Group E and F) was 62. This suggests that the improved groups’ activity levels were more than
twice as high as Group E and F. Once again, Group D was the exception to this finding. They
had the highest number of codes that indicated team engagement (187), but they were an
exception because of their critical attitude.
As stated before, it is impossible to list and explain every difference between the
improved and non-improved groups; however, the six differences explained in this chapter
describe some of the major differences that might have affected their individual creativity. The
improved groups tended to share more ideas and input, give feedback in a respectful manner,
listen to other members’ ideas and try to improve them, choose to design a challenging solution
and spend time discussing the details of their prototype. They were also more engaged in their
IBC activities. In the next chapter, I will explore how these differences could relate to the
increase of individual creativity thinking scores.
74
Chapter 6: Discussion
This study explored the affect of group interaction on enhancing individual creative
thinking ability. As stated in Chapter 2, previous studies have indicated that group diversity
(e.g., Austin, 1997; Milliken, Bartel, & Kurtzberg, 2003) and training creative problem solving
skills (e.g., Fontenot, 1993; Rose and Lin, 1984) were linked to increased individual creative
performance, although clear explanations of why and how these two factors improved individual
creativity were not yet established. From the quantitative investigation of the previous study
described in this report, I found that the IBC (designed to provide both group diversity and
creative problem solving training) improved creativity test scores for some groups, but not
others. This finding indicates that teaching creative problem solving skills did not have a
universal impact on increasing individual creativity, since every participant received the same
instruction from the same instructor. Therefore, in this study, I analyzed group interactions in six
groups that participated in the IBC. The members of three groups significantly increased their
average individual creative thinking ability test scores after participating in the IBC (the
improved groups) and three other groups did not (the non-improved groups). Through a
qualitative analysis of their team interactions, I found six major differences between the
improved and non-improved groups: (1) the quantity of idea and information exchanges, (2) the
amount and type of critiques given to each others’ ideas, (3) the amount of effort made to build
on and improve each others’ ideas, (4) the amount of design thinking used in the prototyping
stage, (5) the selection of a challenging problem to tackle, and (6) the level of engagement of all
group members. In this chapter, I will present a possible theory to explain why the creativity
scores of the improved groups increased, but not the other groups. I will then discuss various
limitations for our study. Finally, I will discuss the implications for future research.
75
Emerged Theory: Cognitive Diversity
In the literature review chapter, I discussed the theoretical impact of stimulating
creativity through group diversity and social modeling of creative problem solving skills.
Although this study found less support for social molding of creative problem solving skills, I
believe the findings from this study are valuable in explaining how group diversity could
improve individual creativity.
In previous studies, group diversity was linked to the superior creative performance of a
group (Milliken, Bartel, & Kurtzberg, 2003). The types of group diversity included cultural
(Watson, et al., 1993), racial (McLeod, Lobel, Cox, 1996), and occupational diversity (Bantel
and Jackson, 1989). These studies did not clearly explain how group diversity improved creative
performance of heterogeneous groups. Based on the findings discussed in the previous chapter, I
argue that the improvement of creative performance through group diversity was mainly
attributed to diverse ideas, perspectives, knowledge, and values that were exchanged or
communicated within the groups. People raised and educated in different environments acquire
different types of knowledge, cognitive processes, and value systems. Therefore, it is highly
likely that those heterogeneous team members in the past studies had been exposed to such
cognitive diversity (i.e., diverse ideas, perspectives, knowledge, and values) than homogenous
groups. One could form a racially diverse team; however, if such cognitive diversity was not
found in the team because its team members came from a very similar educational background,
then I hypothesize that group diversity will not impact their individual creativity. I further
theorize that when individuals were exposed to a high degree of cognitive diversity via team
collaboration, the cognitive diversity provides opportunities for them to view and conceptualize a
problem from novel perspectives, make unique connections of concepts, and design creative
76
solutions. I also hypothesize that experiencing team interactions with a high degree of cognitive
diversity will improve one’s cognitive ability to generate novel and unique ideas. In fact, the
qualitative analysis of this study indicated that such high degree of cognitive diversity was one of
the main characteristics of the groups who significantly improved their creativity scores.
However, the study also indicated that how team members critique each other and whether or not
a team is willing to incorporate and improve other team members’ ideas influence the impact of
cognitive diversity on individual creativity. Finally, the analysis showed that choosing to work
on a challenging solution and designing a detailed prototype could provide opportunities for a
team to exchange diverse ideas, perspectives, and knowledge.
Degree of Cognitive Diversity. In this study, one of the evidence of cognitive diversity
was numbers of times team members exchanged ideas and inputs (i.e., perspectives, knowledge,
and values) and a number of times a team had team discussions. It is important to note that only
unique ideas, inputs, and discussions were coded in the analysis. Therefore, if a similar idea or
input was shared or a discussion was repeated on a similar topic, those events were not coded. I
did not keep track of different types of ideas or inputs exchanged among team members, but a
number of unique ideas, inputs, and discussions should indicate a degree of cognitive diversity in
a team.
When combined, the examples of shared ideas and shared inputs for the improved groups
was 98.7 per team, but the average for two non-improved groups (Group E and F) was only 43.4.
This means that the amount of unique ideas and input exchanged in Groups E and F were 66
percent less than the average of the improved groups. Also, on average each improved group
had three times more team discussions than Group E and F. Based on these facts, it is evident
that there were more unique ideas, perspectives, knowledge, and values exchanged in the
77
improved groups than two of the non-improved groups. As stated previously, my theory is that
individual creativity is more likely to increase when individuals are exposed to a large amount of
unique ideas, perspectives, knowledge, and values than when they are exposed to fewer ideas
and less information. These findings provided some empirical evidence that supports the theory.
However, one of the non-improved groups, Group D, exchanged a large amount of ideas
and information, but its team members did not improve their creativity test scores. It seems that
there are other factors that regulate the impact of cognitive diversity, including the critical nature
of the group and their attitude of listening, incorporating, and improving other team members’
ideas.
Degree and quality of critique. One crucial finding from Group D, one of the non-
improved groups, was the potential negative impact of criticism. Group D shared a large number
of ideas, input and discussions when compared to other groups but without improving their
creativity scores. One reason could be their critical team attitude. Among the six groups in this
study, Group D critiqued the most (coded 38 times), disagreed the most (coded 8 times), and
defended one’s opinions and ideas the most (coded 20 times). In contrast, the average number of
codes for critique, disagreement, and defending in the improved groups was 14.3, 1.3 and 1.7
respectively. This means that Group D critiqued someone else’s idea almost three times more
than the improved groups, explicitly disagreed eight times more, and defended their opinions ten
times more.
Qualitative observation indicated that when the improved groups critiqued an idea or
opinion, it was given to help other people improve their ideas. For example, in Group A, David
pointed out that handlebars in the built-in wire bike lock design that Courtney proposed might
not be long enough to store a wire lock. After thinking about the problem, Courtney drew
78
another design and David responded, “That might work.” On the other hand, Group D’s team
members gave critiques to challenge each other’s ideas and eliminated them if they were thought
undesirable. For example, when Steve shared his idea of using a Kindle-like device to distribute
lecture information, Mary responded, “Well, the only problem with the [Kindle] is that that’s for
personal use. When a person wants to display information to everyone at the same time, I [don’t
think people want to use those].” Mary said this comment in a determined tone, making Steve
appear defensive and he tried to explain how his idea could work. Similar exchanges often
occurred in Group D.
Osborne’s brainstorming training emphasized the importance of deferring judgment
(Amabile, 1996; Osborne, 1963). It taught that evaluation of ideas has a negative impact during
brainstorming. However, my findings showed that critique or idea evaluation did not have a
negative impact in the improved teams because it was given in a respectful manner. In fact,
avoiding and not giving critique was associated with the two of the non-improved groups (Group
E and F). From these facts, I theorize that critique helps individuals be more creative as long as
it is given in a non-threatening, constructive manner. Critique or feedback can be considered as
another type of cognitive diversity. However, when critique is given in a hostile or harsh way, I
theorize that it makes individuals defensive about their ideas, and as a result, they spent more
time thinking about how to defend their ideas, not allowing themselves to listen to other people
ideas and learn from them. Such closed mindset was found in the non-improved groups,
including Group D.
Idea improvement. Another striking difference between the improved and non-improved
groups was how much more the members of the improved groups listened to other team
members’ ideas and suggested improvements. Instances of a team members listening to other
79
people’s idea and improving the idea by adding his or her twist were coded as idea improvement.
Idea improvement was 37 times for the improved groups (12.3 per team). In contrast, the total
number of idea improvement instances in the non-improved group was eight (2.3 per team).
This means that the improved groups listened and improved ideas generated by team members
nearly 4.7 times more than the non-improved groups.
In the literature, idea improvement is also called improvisation or social emergence
(Sawyer, 2007), and it is one of the key characteristics of effective group creative performance.
Taggar (2002) suggested that the quality of group creativity depends on team members’ abilities
to utilize each other’s inputs and skills. He also listed a few factors correlated with successful
group creative performance. These factors included effective communication, utilization of
feedback, conflict management, and a high level of member participation (Taggar, 2002).
Certainly, idea improvement is facilitated by factors such as effective communication and
utilizing feedback. It is important for a team to share ideas, perspectives and information, but I
theorize that people need to be willing to listen to and learn from others in order for cognitive
diversity to have a positive impact on individual creativity. This theory explains another reason
why Group D’s creativity test scores did not improve. Group D shared a large number of ideas
(32 unique ideas), but the idea improvement was only coded 4 times. This means that only 12.5
percent of ideas generated by Group D was elaborated by the team, whereas on average 60
percent of ideas generated by the improved groups was elaborated by the group members. This
fact shows that Group D’s general attitude of not listening to each other’s ideas or attempting to
see how each idea could improve their product. Once again I theorize that Group D’s critical
attitude might have been the main reason for their closed attitude toward other team members’
ideas.
80
Challenging solution and motivation. As already discussed in chapter 5, the improved
groups chose to work on more challenging and complex solutions to their identified problems
than the non-improved groups. Due to its complex nature, I believe selecting challenging
solutions helped the improved groups discuss more ideas and share more knowledge,
perspectives, and values than the non-improved groups. Also, in some instances selecting a
challenging solution made team members more motivated. For example, Group A did not
demonstrate a high level of motivation until the prototype activity. During the prototype activity,
they found an interesting solution for their selected problem. This discovery seemed to increase
team engagement. One of the group members, Jack, was so excited that he said they had found a
billion dollar idea and should start business together. Also, Wally from Group B was not
actively participating to the group activities until he thought of a solution for a problem the team
was working on. Having the idea energized Wally and he started to participate more fully in the
IBC activities. Amabile’s componential model of creativity states that one of the major
components of creativity is motivation, and her research showed that motivated individuals were
more likely to produce creative ideas (Amabile, 1983; Amabile, 1996). Based on the findings
from the study, I theorize that asking team members to work on a challenging problem will
encourage them to discuss more ideas and motivate them to be creative.
Prototype design. One of this study’s findings was that the improved groups spent
considerably more time discussing and deciding the design of their prototypes. In fact, two of
the non-improved groups (Group E and F) did not formally discuss the design of their
prototypes. Prototyping is one of the techniques used in designing an innovative product (Kelley
& Littman, 2001). Effective prototyping is an iterative process. It starts with low-fidelity
prototypes such as sketches, then attempts to think of ways to improve their prototype through
81
building something more high fidelity. This process forces team members to think of possible
challenges to their prototype, along with solutions. For example, only after Group C started to
design their product did they realize that they needed to figure out how to insert waffle batter
into a new microwavable mold, how to seal the mold and how to make a unique waffle shape
using the new mold. In fact, this kind of discussion about the details of their prototype design
was the characteristic of all of the improved groups. The improved groups spent nearly 70
percent of their prototype time proposing, evaluating and designing the design of their final
product. In contrast, two of the non-improved groups did not spend time in such design
discussions at all, and the third group (Group D) only spent approximately 40 percent of their
prototyping time in design discussions. Based on these findings, I theorize that iterative
prototyping with strong preliminary design discussions encourages creativity by providing
opportunities to share more ideas in solving design problems.
Study Limitations
Although the findings from this study provided valuable information regarding the
impact of group interaction on individual creativity, there are limitations to the interpretations
and potential alternative explanations.
Theoretical construct limitations. Any study of creativity has to deal with its complex
and elusive definition (Neumann, 2007), and one must generate an operational definition. In this
study, creativity or creative thinking ability was defined and measured by the TTCT, which
mostly assesses divergent thinking. Divergent thinking is the ability to generate diverse and
unique ideas from one stimulus by expanding and combining it with other concepts. Since this
study used the TTCT, creativity beyond divergent thinking was not measured.
82
The majority of contemporary creativity researchers define creativity as the ability to
create novel, appropriate and useful products, systems or procedures (Amabile, 1996; Shalley,
Zhou, & Oldham, 2004). Also, “creativity” is often interchangeable with the word innovation.
While creativity emphasizes the generation of creative (i.e., novel, unique and useful) ideas,
innovation gives more attention to the successful development and implementation of creative
products, procedures, theories and strategies (Mumford & Gustafson, 1988; West & Farr, 1990).
There is no standardized method for measuring an individual’s ability to design an innovative or
creative product; if this study could have measured this aspect of creativity, the results might
have been different. However, a longitudinal study of TTCT results demonstrated the TTCT’s
ability to predict real-life creative performance of individuals (Kim, 2006; Plucker, 1999;
Yamada & Tam, 1996), indicating this concern may not be very significant.
Methodological limitations. In addition, there were a few methodological limitations in
this study. First, the generalizability of the quantitative findings is limited since the study only
conducted one statistical analysis. Although data were collected from multiple IBC sessions
over eight months, the data represent a single homogeneous population from one university.
Second, the majority of the qualitative coding was done by the author of this report. Qualitative
data analysis is inherently subjective. To avoid personal biases, the researcher kept track of a list
of assumptions (see Appendix C). Also, nearly all of the video recordings were watched three
times to make sure that coding was justified. Finally, 15 percent of the codes were reviewed by
two other graduate researchers who agreed that 97 percent of codes in the selected portion were
correct.
Finally, not all of the IBC group interactions were analyzed in this study. The IBC was
designed to be a one-week program. Since not all of the team meetings were recorded, only the
83
recordings from the first day were analyzed. It is possible that there could have been significant
events that occurred off-camera that caused changes in post-TTCT scores.
Alternative explanations. This study was an exploratory qualitative study to identify
possible group factors associated with an increase in individual creativity. However, there are
other possible reasons for the increase other than the impacts of the groups on individual
members. In this section, I will discuss two alternative explanations.
Participants’ Attention to the IBC. The increase in the creativity test scores in this study
could be attributed to the fact that the improved groups paid more attention to the IBC instruction
than the non-improved groups. From this perspective, the improved groups learned more from
the IBC and were able to utilize the principles and techniques taught. However, looking at how
many ideas were shared during the four specific IBC activities (SCAMPER, attribute listing,
random association, and direct association), I did not detect a significant difference between the
improved and non-improved groups in their understanding of the IBC process. For example, the
attribute listing and random association activities did not seem to help either the improved or
non-improved groups produce ideas. During these activities, most groups produced only one or
two ideas. In the direct association activity, the improved groups produced 2.3 ideas on average,
and in the non-improved groups, Group D produced five ideas while the two other teams
produced no ideas. Only the SCAMPER activity helped all teams produce ideas, but there was
no quantitative difference between the improved and non-improved groups. All groups produced
eight to ten ideas.
In addition, there was no correlation between how much help a team received from the
instructor and TA and their increase of TTCT scores. In fact, one of the improved groups
84
(Group B) received the least help from the instructor and TA (coded 2 times) and one of the non-
improved groups (Group D) received the most help (coded 21 times).
Also, one of my initial hypotheses was that one or a few team members might understand
the IBC techniques and then effectively demonstrate these techniques to other team members.
This would have been evidence for social modeling of creative problem solving. However, I did
not see such social modeling. The instructor and TA often demonstrated and gave examples of
different techniques, but I did not see a significant difference in the impact of the demonstration
between the improved and non-improved groups. Both the improved and non-improved teams
had difficulty understanding what they were supposed to do in the IBC activities. For example,
after they were taught the SCAMPER, the instructor stopped by Group A and asked, “Are you
going through substitute, combine, and that kind of stuff?” Michael hesitantly said, “Yeah . . . I
think . . . sort of . . .” Because Group A did not understand SCAMPER and how to use the
technique to produce creative ideas, the instructor had to help them again. Group E struggled to
understand how to use the IBC techniques. For example, after the SCAMPER activity, the team
was asked to do the random association, but they had a difficult time generating ideas using
random association. After a long initial pause, James said “Any ideas?” Stephen responded by
saying, “It’s difficult.” Contrary to previous findings (Nickerson, 1999; Rose & Lin, 1984),
teaching creative problem solving techniques did not appear to be associated with creativity test
score improvement in this study.
Motivation. Past research has shown the important role of motivation in creativity
(Amabile, 1993). It could be that the group members in this study who improved their scores
had a more positive experience in the IBC and were more motivated to do well in their post-
creativity test. Therefore, group interactions might only have increased their motivation level,
85
not their actual creative thinking ability. Additional research is needed to investigate the
potential impact of group interactions on individual motivation.
Implications for Future Research
This study investigated the possible impact of group interactions on individual creative
thinking abilities and identified several potential contributing factors. The theories developed in
this study do not imply causation but do support a possible correlation between group
interactions and individual creativity. Future research could seek to verify these claims in
additional settings and populations. I will now discuss possible research opportunities related to
the different findings that related to group diversity in this study.
Cognitive diversity. Previous studies confirmed the findings of this study that group
diversity (or cognitive diversity) can positively affect group creative performance (McLeod,
Lobel, Cox, 1996; Milliken, Bartel and Kurtzberg, 2003; Watson, et al., 1993). To further
understand this connection, future research must identify what types of cognitive diversity
positively affect individual creativity. For example, in this study different types of cognitive
diversity exchanged within a group included technical information about a solution, various
ways to conceptualize a problem, different solution preferences, a new product idea, and product
design ideas. Through video analysis, future researchers could investigate whether one type of
cognitive diversity affects individual creativity more and how much cognitive diversity needs to
be shared to generate an impact.
Degree and quality of critique. One of the non-improved groups in this study (Group D)
demonstrated the negative impact of critiques without a foundation of team trust and
psychological safety. However, with a strong cooperative team climate, a moderate amount of
respectful critiques was associated with improved creativity. Future research could investigate
86
the different factors involved in positive group idea evaluation through experimental methods,
including effective ways to give critiques and the appropriate amount of critique for improving
idea development before it becomes counterproductive.
Idea improvement. Idea and information exchange and the ability of group members to
listen to and build on each others’ ideas were important factors differentiating the improved and
non-improved groups in this study. Future researchers might investigate how to assess the
ability to listen and incorporate ideas and feedback from others, and then correlate this ability
with creativity output.
Prototype Design. In this study, the groups who improved their creativity scores spent
more time designing their final solution. Future researchers might investigate with experimental
methods if this connection between prototype design and creativity test score improvement is
truly correlated, perhaps by varying how much instruction a group receives on designing
methods, approaches, and importance, while encouraging comparison groups to begin
prototyping immediately without first designing their solution.
Conclusions
This study investigated the impact of group collaboration on individual creative thinking
ability. The study compared three groups that significantly increased their creativity test scores
(the improved groups) and three groups that did not (the non-improved groups). I found that the
improved groups tended to share more ideas, perspectives, knowledge, and values than the non-
improved groups. Second, the improved groups gave critiques or feedback in a respectful
manner that developed a positive team climate. Third, the improved groups attentively listened
to each other’s ideas and tried to think of ways to improve others’ ideas. Fourth, compared to the
non-improved groups, the improved groups chose to work on more challenging solutions and
87
they spent more time discussing the designs of their prototypes. Finally, the improved group
members were more active participants in the project than the non-improved groups. Also, there
were several instances where receiving an idea motivated members of the improved groups.
As more organizations require their employees to work in groups to solve problems and
design creative products, the theories derived from these findings could help organizations train
their employees to become better group collaborators. Based on these findings, employees need
to understand the importance of sharing ideas and how to utilize other team members’ unique
perspectives in producing creative solutions. As an employee realizes the weakness of an idea
produced by another, he or she should give feedback in a constructive way. Each team member
should be aware of the potential negative impact of overly critical feedback and learn how to
really listen to each other’s ideas with a mind to improving those ideas. Breakthrough
innovation is often the result of combining ideas and perspectives from multiple people. As a
team selects a problem or solution, they should not avoid challenging projects that might be more
motivating, complex, and creative. Following these guidelines should improve the potential for a
group to not only develop more innovative solutions to group projects, but also positively impact
the individual creativity of the group members.
88
References
Amabile, T. M. (1996). Creativity in context. Boulder, CO: Westview.
Amabile, T. M. (1983). The social psychology of creativity. New York, NY: Springer-Verlag.
Amabile, T. M., & Tighe, H. (1993). Questions of Creativity. In J. Brockman (Ed.), Creativity
(pp. 7-27). New York: Simon & Schuster.
Austin, J. R. (1997). A cognitive framework for understanding demographic influences in
groups. International Journal of Organizational Analysis, 5(4), 342-359.
Baer, J., & Kaufman, J. C. (2006). Creativity research in English-speaking countries. In J. C.
Kaufman & R. J. Sternberg (Eds.), The international handbook of creativity (pp. 10-38).
New York, NY: Cambridge University Press.
Baer, J. (1993). Creativity and divergent thinking: A task-specific approach. Hillsdale, NJ:
Erlbaum.
Bandura, A. (1977). Social learning theory. Englewood Cliffs, NJ: Prentice-Hall.
Bandura, A. (1986). Social foundations of thought and action: A social cognitive theory.
Englewood Cliffs, NJ: Prentice-Hall.
Bandura, A., Ross, D., & Ross, S. A. (1961). Transmission of aggression through imitation of
aggressive models. Journal of Abnormal and Social Psychology, 63(3), 575-582.
Bantel, K. A., & Jackson, S. E. (1989). Top management and innovations in banking: Does the
composition of the top team make a difference? Strategic Management Journal,
10(Summer), 107-124.
Barron, F. (1955). The disposition toward originality. Journal of Abnormal and Social
Psychology, 51(3), 478-485.
89
Bastos, L. D. (1974). An evaluation of the Torrance tests of creative thinking. Dissertation
Abstracts International, 34, 3976-3977.
Becker, M. (1995). Nineteenth-century foundations of creativity research. Creativity Research
Journal, 8(3), 219-229
Belcher, T. L. (1975). Modeling original divergent responses: An initial investigation. Journal of
Educational Psychology, 67(3), 351-358.
Besemer, S. P., & O'Quin. K. (1987). Creative product analysis Testing a model by developing a
judging instrument In S. G. Isaksen (Ed.), Frontiers of creativity research beyond the
basics (pp 367-389) Buffalo, NY: Bearly.
Bloom, B. S., & Sosniak, L. A. (1981). Talent development vs. schooling. Educational
Leadership, 39(2), 86-94.
Burns, M. (1988). Music as a tool for enhancing creativity. Journal of Creative Behavior, 22(1),
62-69.
Charmaz, K. (2002). Qualitative interviewing and grounded theory analysis. In J. Gubrium & J.
A. Holstein (Eds.), Handbook of interview research (pp. 675-694). Thousand Oaks, CA:
Sage Publications.
Conti, R., Coon, H., & Amabile, T. M. (1996). Evidence to support the componential model of
creativity: Secondary analyses of three studies. Creativity Research Journal, 9(4), 385-
389.
Covington, M. V., Crutchfield, R. S., Davies, L. & Olton, R. M. (1974). The productive thinking
program: A course in learning to think. Columbus, OH: Merrill.
Cropley, A. J. (2000). Defining and measuring creativity: Are creativity tests worth using?
Roeper Review, 23(2), 72-80.
90
Dey, I. (1993). Qualitative data analysis. London: Routledge.
Dey, I. (1999). Grounding grounded theory: Guidelines for qualitative inquiry. San Diego, CA:
Academic Press.
Diehl, M., & Stroebe, W. (1987). Productivity loss in brainstorming groups: Toward the solution
of a riddle. Journal of Personality and Social Psychology, 53(3), 497-509.
Gondola, J. (1986). The enhancement of creativity through long and short term exercise
programs. Journal of Social Behavior and Personality, 1(1), 77-82.
Feldhusen, J. F., & Treffinger, D. J. (1986). Creative thinking and problem solving in gifted
education. Dubuque, IO: Kendall/Hunt.
Feldhusen, J. F., & Treffinger, D. J., & Bahlke, S. J. (1970). Developing creative thinking: The
Purdue Creativity Program. Journal of Creative Behavior, 4(2), 85-90.
Fontenot, N. A. (1993). Effects of training in creativity and creative problem finding upon
business people. Journal of Social Psychology, 133(1), 11-22.
Ford, D. Y., & Harris III, J. J. (1992). The elusive definition of creativity. The Journal of
Creative Behavior, 26(3), 186-198.
Gary, A. L., & Glover, J. (1975). Eye color and sex: Their relationship to modeled learning.
Psychotherapy: Theory, Research & Practice, 12(4), 425-428.
Glaser, B. (1978). Theoretical sensitivity: Advances in the methodology of grounded theory. Mill
Valley, CA: Sociology Press.
Glaser, B., & Strauss, A. L. (1967). The Discovery of grounded theory: Strategies for qualitative
research. Chicago, IL: Aldine De Gruyter.
Gonzales, M. A., & Campos, A. (1997). Mental imagery and creative thinking. Journal of
Psychology, 131(4), 357-364
91
Gordon, W. J. (1961). Synectics. New York, NY: Harper.
Gruenfeld, D. H. (1995). Status, ideology, and integrative complexity on the U.S. Supreme
Court: Rethinking the politics of political decision making. Journal of Personality and
Social Psychology, 68(1), 5-20.
Guilford, J. P. (1950). Creativity. American Psychologist, 5(9), 444-454.
Guilford, J. P. (1956). The structure of intellect. Psychological Bulletin, 53(4), 267-293.
Guilford, J. P. (1964). Creative thinking and problem solving. Education Digest, 29, 21-31.
Guilford, J. P. (1967). The nature of human intelligence. New York, NY: McGraw-Hill.
Guilford, J. P. (1976). Creativity Tests for Children. Orange, CA: Sheridan Psychological
Services.
Guilford, J. P., & Hoepfner (1971). The analysis of intelligence. New York, NY: McGraw-Hill.
Guzzo, R. A., & Dickson, M. W. (1996). Teams in organizations: Recent research on
performance and effectiveness. Annual Review of Psychology, 47, 307–338.
Harris, M. B., & Evans, R. C. (1973). Models and creativity. Psychological Reports, 33, 763-
769.
Henry, J. (2004). Creative collaboration in organizational settings. In D. Miell & K. Littleton
(Eds.), Collaborative creativity: Contemporary perspectives (pp. 158–174). London: Free
Association Books.
Hinsz, V. B., Tindale, R. S., & Vollrath, D. A. (1997). The emerging conceptualization of groups
as information processes. Psychological Bulletin, 121(1), 43-64.
Hirst, G., Knippenberg, D. V., & Zhou, J. (2009). A cross-level perspective on employee
creativity: goal orientation, team learning behavior, and individual creativity. Academy of
Management Journal, 52(2), 280–293.
92
Hoffman, L. R., & Maiser, N. R. F. (1961). Quality and acceptance of problem solutions by
members of homogeneous and heterogeneous groups. Journal of Abnormal and Social
Psychology, 62(2), 401-407.
Holland, J. L. (1968). Test reviews. Journal of Counseling Psychology, 15(3), 297-298.
Jablin, F. M. (1981). Cultivating imagination: Factors that enhance and inhibit creativity in
brainstorming groups. Human Communication Research, 7(3), 245-258.
Jackson, P. & Messick, S. (1965). The person, the product and the response: Conceptual
problems in the assessment of creativity. Journal of Personality, 33(3), 309-329.
Jackson, S. E., May K. E., Whitney K. (1995). Understanding the dynamics of diversity in
decision-making teams. In R. A. Guzzo & E. Salas (Eds.), Team effectiveness and
decision making in organizations (pp. 204–226). San Francisco, CA: Jossey-Bass.
Jehn, K. A., Chadwick, C., & Thatcher, S. M. (1993). To agree or not to agree: The effects of
value congruence, individual demographic dissimilarity, and conflict on workgroup
outcomes. International Journal of Conflict Management, 8(4), 287-305.
John-Steiner, V. (2000). Creative Collaboration. New York, NY: Oxford University Press.
Jordan, L. A. (1975). Use of canonical analysis in Cropley’s “A five-year longitudinal study of
the validity of creative tests.” Developmental Psychology, 11(1), 1-3.
Kelley, T., & Littman, J. (2001). The art of innovation: lessons in creativity from IDEO,
America’s leading design firm. New York, NY: Currency Book
Kim, K. H. (2006). Can we trust creativity tests? A teview of the Torrance Tests of Creative
Thinking (TTCT). Creativity Research Journal, 18(1), 3-14.
Koestler, A. (1964). The art of creation. New York, NY: Dell.
93
Linder, J.C., Jarvenpaa, S. and Davenport, T.H. (2003) Toward an Innovation Sourcing Strategy.
MIT Sloan Management Review, 44(4) 43–49.
McCoy, J. M., & Evans, G. W. (2002). The potential role of the physical environment in
fostering creativity. Creativity Research Journal, 14(3), 409-426.
McLeod, P. L., Lobel, S. A., & Cox, T. H. (1996). Ethnic diversity and creativity in small
groups. Small Group Research, 27(2), 248-264.
Merriam, S. B. (1998). Qualitative Research and Case Study Applications in Education. San
Francisco, CA: Jossey-Bass.
Merton, R. K. (1957). Social theory and social structure. New York, NY: The Tree Press.
Milliken, F. J., Bartel, C. A., & Kurtzberg, T. R. (2003). Diversity and creativity in work groups:
A dynamic perspective on the affective and cognitive processes that link diversity and
performance. In P. B. Paulus & B. A. Nijstad (Eds.), Group creativity: Innovation
through collaboration (pp. 32-62). New York, NY: Oxford University Press.
Milton, G. A. (1965). Enthusiasm vs. effectiveness in group and individual problem-solving.
Psychological Reports. 16(3), 1197-1202.
Montuori, A., & Purser, R. E. (1999). Social creativity: Introduction. In A. Montuori & R. E.
Purser (Eds.), Social creativity (Vol. 1, pp. 1–45). Cresskill, NJ: Hampton Press.
Mueller, L. K. (1978). Beneficial and detrimental modeling effects on creative response
production. Journal of Psychology, 98, 253-260.
Mullen, B., Johnson, C , & Salas, E. (1991). Productivity loss in brainstorming groups: A meta-
analytic integration. Basic and Applied Journal Social Psychology, 12(1), 3-24.
Mumford, M. D. (2003). Where have we been, where are we going? Taking stock in creativity
research. Creativity Research Journal, 15(2&3), 107-120.
94
Mumford, M. D., & Gustafson, S. B. (1988). Creativity syndrome: Integration, application, and
innovation. Psychological Bulletin, 103(1), 27–43.
Mumford, M. D., Connelly, M. S., Baughman, W. A., & Marks, M. A. (1994). Creativity and
problem solving: Cognition, adaptability, and wisdom. Roeper Review, 16(4), 241-246.
Neumann, C. J., (2007). Fostering creativity. a model for developing a culture of collective
creativity in science. European Molecular Biology Organization Reports, 8(3), 202-206.
Newell, A., Shaw, J., & Simon, H. (1962). The processes of creative thinking. In H. Gruber, G.
Terrell & M. Wertheimer (Eds.), Contemporary approaches to creative thinking (pp. 63-
119). New York, NY: Atherton Press.
Nickerson, R. S. (1999). Enhancing creativity. In R. J. Sternberg (Ed.), Handbook of creativity
(pp. 392–430). Cambridge: Cambridge University Press.
Oldham, G. R. (2003). Stimulating and supporting creativity in organizations. In S. E. Jackson,
M. A. Hitt, & A. S. DeNisi (Eds.), Managing knowledge for sustained competitive
advantages (pp. 243-273). San Francisco: Jossey-Bass.
Offner, A. K., Kramer, T. J., & Winter, J. P. (1996). The effect of facilitation, recording, and
pauses on group brainstorming. Small Group Research, 27(2), 283-298.
Osborn, A. F. (1963). Applied imagination: Principles and procedures of creative problem
solving (3rd
). Buffalo, NY: Creative Education Foundation Press.
Oxley, N. L., Dzindolet, M. T., & Paulus, P. B. (1996). The effects of facilitators on the
performance on brainstorming groups. Journal of Social Behavior and Personality, 11(4),
633-646.
95
Paulus, P. B., Larey, T. S., & Ortega, A. H. (1995). Performance and perceptions of
brainstormers in an organizational setting. Basic and Applied Social Psychology,
17(1&2), 249-265.
Paulus, P. B., & Nijstad, B. A. (2003). Group creativity: An introduction. In P. B. Paulus & B.
A. Nijstad (Eds.), Group creativity: Innovation through collaboration (pp. 3-11). New
York, NY: Oxford University Press.
Pirola-Merlo, A., & Mann, L. (2004). The relationship between individual creativity and team
creativity: Aggregating across people and time. Journal of Organizational Behavior,
25(2), 235-257.
Plucker, J. A. (1999). Is the proof in the pudding? Reanalyses of Torrance’s (1958 to present)
longitudinal data. Creativity Research Journal, 12(2), 103-114.
Raikov, V. (1992). Hypnosis as an active creative act and post-hypnotic development of
improved creativity. Journal f Creative Behavior, 26(3), 148-155.
Ramocki, S. P. (1994). It is time to teach creativity throughout the Marketing Curriculum.
Journal of Marketing Education, 16(2), 15-25.
Reese, H. W., Parnes, S. J., Treffinger, D. J., & Kaltsounis, G. (1976). Effects of a creative
studies program on structure-of-intellect factors. Journal of Educational Psychology,
68(4), 401-410.
Rose, L., & Lin, H. (1984). A meta-analysis of long-term creativity training programs. Journal of
Creative Behavior, 18(1), 11-22.
Ruscio, J., Whitney, D. M., & Amabile, T. M. (1998). Looking inside the fishbowl of creativity:
Verbal and behavioral predictors of creative performance. Creativity Research Journal
11(3), 243-263.
96
Samuelson, P. A. (1972). Economics in a golden age: A personal memoir. In G. Holton (Ed.),
The twentieth century sciences: Studies in the biography of ideas. New York, NY:
Norton.
Sawyer, K. (2007). Group genius. New York, NY: Basic Books.
Shalley, C. E., Zhou, J., & Oldham, G. R. (2004). The effects of personal and contextual
characteristics on creativity: Where should we go from here? Journal of Management,
30(6), 933-958.
Simonton, D. K. (1975). Sociocultural context of individual creativity: A transhistorical time-
series analysis. Journal of Personality and Social Psychology, 32(6), 1119-1133.
Scott, G., Leritz, L. E., & Mumford, M. D. (2004). The Effectiveness of Creativity Training: A
Quantitative Review. Creativity Research Journal, 16(4), 361–388.
Standage, T. (1998). The Victorian internet: The remarkable story of the telegraph and the
nineteenth century’s online pioneers. New York, NY: Walker and Company.
Stefik, M., & Stefik, B. (2004). Breakthrough: Stories and strategies of Radical Innovation.
Cambridge, MA: MIT Press.
Stein, M. I. (1974). Stimulating creativity (Vol. 1). New York, NY: Academic Press.
Stroebe, W. (1994). Why groups are less effective than their members: On productivity losses in
idea-generating groups. European Review of Social Psychology, 5, 271-303.
Strauss, A., & Corbin, J. (1990). Basics of qualitative research: Grounded theory procedures
and techniques. Newbury Park, CA: Sage Publications.
Strauss, A., & Corbin, J. (1997). Grounded theory in practice. Thousand Oaks, CA: Sage
Publications.
97
Sternberg, R. J., & Lubart, T. I. (1996). Investing in creativity. American Psychologist, 51(7),
677-688.
Street, W .R. (1974). Brainstorming by individuals, coacting and interacting groups. Journal of
Applied Psychology, 59(4), 433-436.
Taggar, S. (2002). Individual creativity and group ability to utilize individual creative resources:
A multilevel model. The Academy of Management Journal, 45(2), 315-330.
Taylor, A. (1975). An emerging view of creative actions. In I. A. Tylor, & J. W. Getzels (Eds.),
Perspectives in creativity (pp 297-325). Chicago: Aldine.
Taylor, D. W., Berry, P. C., & Block, C. H. (1958). Does group participation when using
brainstorming facilitate or inhibit creative thinking? Administrative Science Quarterly,
3(1), 23-47.
Torrance, E. P. (1970). Influence of dyadic interaction on creative functioning. Psychological
Reports, 26(2), 391-394.
Torrance, E. P. (1972). Predictive validity of the Torrance Tests of Creative Thinking. Journal of
Creative Behavior, 6(4), 236–252.
Torrance, E. P. (1974). The Torrance Tests of Creative Thinking: Norms-technical manual
research edition. Princeton, NJ: Personnel Press.
Torrance, E. P. (1981). Predicting the creativity of elementary school children (1958–80) and the
teacher who “made a difference.” Gifted Child Quarterly, 25(2), 55–62.
Torrance, E. P., & Presbury, J. (1984). The criteria of success used in 242 recent experimental
studies of creativity. Creative Child & Adult Quarterly, 9(4), 238-243.
Torrance, E. P. (1998). The Torrance Tests of Creative Thinking Norms-Technical Manual
Figural (Streamlined) Forms A & B. Bensenville, IL: Scholastic Testing Service.
98
Torrance, E. P. (2002). The manifesto: A guide to developing a creative career. West Westport,
CT: Ablex.
Treffinger, D. J. (1985). Review of the Torrance Tests of Creative Thinking. In J. V. Mitchell Jr.
(Ed.), The ninth mental measurements yearbook (pp. 1632–1634). Lincoln: University of
Nebraska, Buros Institute of Mental Measurements.
Trentham, L. L. (1975). The effect of distractions on sixth-grade students in a testing situation.
Journal of Educational Measurement, 12(1), 13-17.
Vroom, V. H., Grant, L. D., & Cotton, T. W. (1969). The consequences of social interaction in
group problem-solving. Organizational Behavior and Human Performance, 4(1), 77-95.
Vygotsky, L. S. (1978). Mind in society: The development of higher psychological processes.
Cambridge: Harvard University Press.
Wallach, M. A., & Kogan, N. (1965). Modes of thinking in young children. New York: Holt,
Rinehart and Winston.
Watson, J. (1928). Behaviorism. London: K. Paul.
Watson, W. E., Kumar, K., & Michaelsen, L. K. (1993). Cultural diversity’s impact on
interaction process and performance: Comparing homogeneous and diverse task groups.
Academy of Management Journal, 36(3), 590–602.
Warren, B. & Biederman, P. W. (1997). Organizing genius: The secrets of creative
collaboration. Reading, MA: Addison-Wesley Publishing.
Wertheimer, M. (1945). Productive thinking. New York, NY: Harper & Row.
West, R. E. (2009). What is shared? A framework for understanding shared innovation within
communities. Educational Technology Research and Development, 57(3), 315-332.
99
West, M. A., & Farr, J. L. (1990). Innovation at work. In M. West & J. Farr (Eds.), Innovation
and creativity at work: Psychological and organizational strategies (pp. 3–13).
Chichester, England: Wiley.
Yamada, H., & Tam, A. Y. (1996). Prediction study of adult creative achievement: Torrance’s
longitudinal study of creativity revisited. Journal of Creative Behavior, 30(2), 144-149.
Zhou, J. (2003). When the presence of creative coworkers is related to creativity: Role of
supervisor close monitoring, developmental feedback, and creative personality. Journal
of Applied Psychology, 88(3), 413– 422.
Ziv, A. (1976). Facilitating effects of humor on creativity. Journal of Educational Psychology,
68(3), 318-322.
Zuckerman, H. (1977). Scientific elite: Nobel laureates in the U.S. New York, NY: The Free
Press.
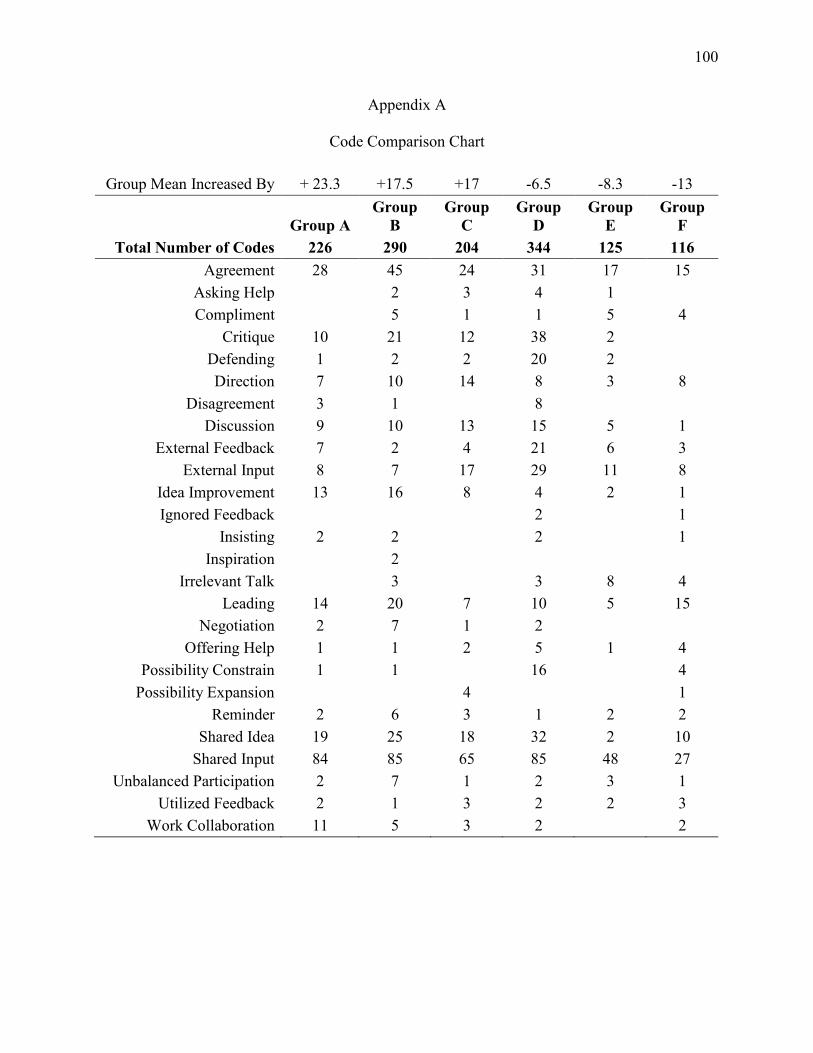
100
Appendix A
Code Comparison Chart
Group Mean Increased By + 23.3 +17.5 +17 -6.5 -8.3 -13
Group A Group
B Group
C Group
D Group
E Group
F Total Number of Codes 226 290 204 344 125 116
Agreement 28 45 24 31 17 15 Asking Help 2 3 4 1 Compliment 5 1 1 5 4
Critique 10 21 12 38 2 Defending 1 2 2 20 2 Direction 7 10 14 8 3 8
Disagreement 3 1 8 Discussion 9 10 13 15 5 1
External Feedback 7 2 4 21 6 3 External Input 8 7 17 29 11 8
Idea Improvement 13 16 8 4 2 1 Ignored Feedback 2 1
Insisting 2 2 2 1 Inspiration 2
Irrelevant Talk 3 3 8 4 Leading 14 20 7 10 5 15
Negotiation 2 7 1 2 Offering Help 1 1 2 5 1 4
Possibility Constrain 1 1 16 4 Possibility Expansion 4 1
Reminder 2 6 3 1 2 2 Shared Idea 19 25 18 32 2 10
Shared Input 84 85 65 85 48 27 Unbalanced Participation 2 7 1 2 3 1
Utilized Feedback 2 1 3 2 2 3 Work Collaboration 11 5 3 2 2
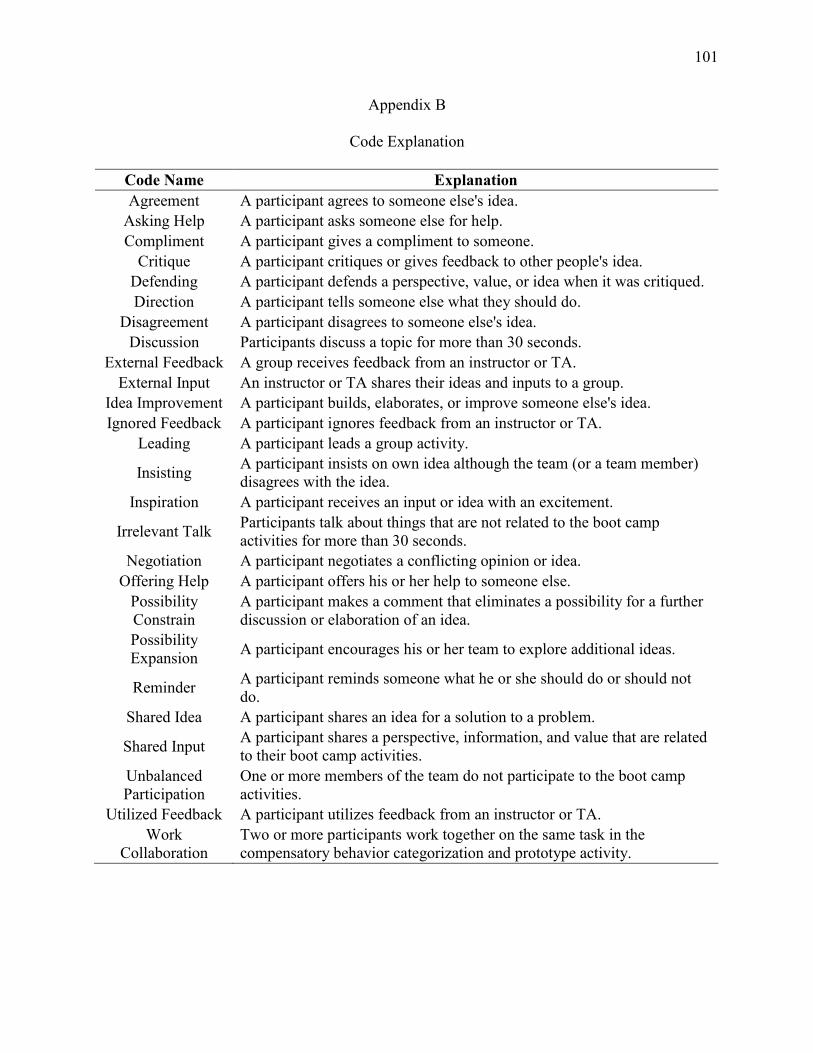
101
Appendix B
Code Explanation
Code Name Explanation Agreement A participant agrees to someone else's idea.
Asking Help A participant asks someone else for help. Compliment A participant gives a compliment to someone.
Critique A participant critiques or gives feedback to other people's idea. Defending A participant defends a perspective, value, or idea when it was critiqued. Direction A participant tells someone else what they should do.
Disagreement A participant disagrees to someone else's idea. Discussion Participants discuss a topic for more than 30 seconds.
External Feedback A group receives feedback from an instructor or TA. External Input An instructor or TA shares their ideas and inputs to a group.
Idea Improvement A participant builds, elaborates, or improve someone else's idea. Ignored Feedback A participant ignores feedback from an instructor or TA.
Leading A participant leads a group activity.
Insisting A participant insists on own idea although the team (or a team member) disagrees with the idea.
Inspiration A participant receives an input or idea with an excitement.
Irrelevant Talk Participants talk about things that are not related to the boot camp activities for more than 30 seconds.
Negotiation A participant negotiates a conflicting opinion or idea. Offering Help A participant offers his or her help to someone else.
Possibility Constrain
A participant makes a comment that eliminates a possibility for a further discussion or elaboration of an idea.
Possibility Expansion A participant encourages his or her team to explore additional ideas.
Reminder A participant reminds someone what he or she should do or should not do.
Shared Idea A participant shares an idea for a solution to a problem.
Shared Input A participant shares a perspective, information, and value that are related to their boot camp activities.
Unbalanced Participation
One or more members of the team do not participate to the boot camp activities.
Utilized Feedback A participant utilizes feedback from an instructor or TA. Work
Collaboration Two or more participants work together on the same task in the compensatory behavior categorization and prototype activity.
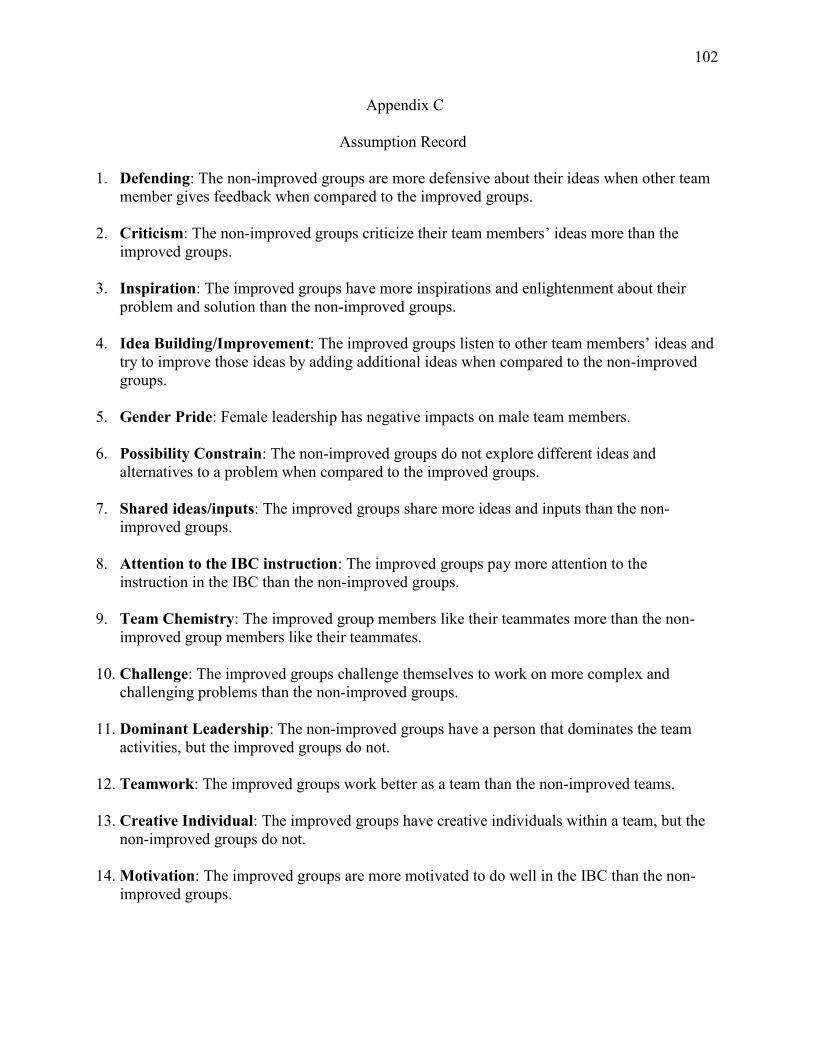
102
Appendix C
Assumption Record
1. Defending: The non-improved groups are more defensive about their ideas when other team member gives feedback when compared to the improved groups.
2. Criticism: The non-improved groups criticize their team members’ ideas more than the
improved groups. 3. Inspiration: The improved groups have more inspirations and enlightenment about their
problem and solution than the non-improved groups. 4. Idea Building/Improvement: The improved groups listen to other team members’ ideas and
try to improve those ideas by adding additional ideas when compared to the non-improved groups.
5. Gender Pride: Female leadership has negative impacts on male team members. 6. Possibility Constrain: The non-improved groups do not explore different ideas and
alternatives to a problem when compared to the improved groups. 7. Shared ideas/inputs: The improved groups share more ideas and inputs than the non-
improved groups. 8. Attention to the IBC instruction: The improved groups pay more attention to the
instruction in the IBC than the non-improved groups. 9. Team Chemistry: The improved group members like their teammates more than the non-
improved group members like their teammates. 10. Challenge: The improved groups challenge themselves to work on more complex and
challenging problems than the non-improved groups. 11. Dominant Leadership: The non-improved groups have a person that dominates the team
activities, but the improved groups do not. 12. Teamwork: The improved groups work better as a team than the non-improved teams. 13. Creative Individual: The improved groups have creative individuals within a team, but the
non-improved groups do not. 14. Motivation: The improved groups are more motivated to do well in the IBC than the non-
improved groups.